scale invariant characteristics of the storegga slide …s personal copy scale invariant...
TRANSCRIPT

Author's personal copy
Scale invariant characteristics of the Storegga Slide and implicationsfor large-scale submarine mass movements
Aaron Micallef ⁎,1, Christian Berndt, Douglas G. Masson, Dorrik A.V. Stow
National Oceanography Centre, University of Southampton, European Way, Southampton, SO14 3ZH, UK
Received 19 April 2007; received in revised form 9 August 2007; accepted 23 August 2007
Abstract
This study documents the fractal characteristics of submarine mass movement statistics and morphology within the StoreggaSlide. Geomorphometric mapping is used to identify one hundred and fifteen mass movements from within the Storegga Slide scarand to extract morphological information about their headwalls. Analyses of this morphological information reveal the occurrenceof spatial scale invariance within the Storegga Slide. Non-cumulative frequency-area distribution of mass movements within theStoregga Slide satisfies an inverse power law with an exponent of 1.52. The headwalls exhibit geometric similarity at a wide rangeof scales and the lengths of headwalls scale with mass movement areas. Composite headwalls are self-similar.
One of the explanations of the observed spatial scale invariance is that the Storegga Slide is a geomorphological system thatmay exhibit self-organized criticality. In such a system, the input of sediment is in the form of hemipelagic sedimentation andglacial sediment deposition, and the output is represented by mass movements that are spatially scale invariant. In comparison tosubaerial mass movements, the aggregate behavior of the Storegga Slide mass movements is more comparable to that of thetheoretical ‘sandpile’ model. The origin of spatial scale invariance may also be linked to the retrogressive nature of the StoreggaSlide. The geometric similarity in headwall morphology implies that the slope failure processes are active on a range of scales, andthat modeling of slope failures and geohazard assessment can extrapolate the properties of small landslides to those of largerlandslides, within the limits of power law behavior. The results also have implications for the morphological classification ofsubmarine mass movements, because headwall shape can be used as a proxy for the type of mass movement, which can otherwiseonly be detected with very high resolution acoustic data that are not commonly available.© 2007 Elsevier B.V. All rights reserved.
Keywords: Storegga Slide; scale invariance; power law; self-organized criticality; ‘sandpile’ model; retrogressive cascade
1. Introduction
Submarine landslides are common phenomena oncontinental margins. Large landslides are the dominant
geomorphic agents that transfer sediment across thecontinental slope (Masson et al., 2006), and they play amajor role in the evolution of submarine landscapes. TheStoregga Slide, located 120 km offshore Norway, is thelargest known submarine landslide (Fig. 1). Dated at8100±250 cal yrs BP (Haflidason et al., 2005), theStoregga Slide is the last in a series of slope failures thathave characterized the mid-Norwegian Margin duringthe past 2.6 Ma (Solheim et al., 2005). The Storegga
Marine Geology 247 (2008) 46–60www.elsevier.com/locate/margeo
⁎ Corresponding author. Tel.: +44 23 80 596563; fax: +44 2380596554.
E-mail address: [email protected] (A. Micallef).1 Present address: 16, Triq l-Ghakkies, Naxxar, NXR 05, Malta.
0025-3227/$ - see front matter © 2007 Elsevier B.V. All rights reserved.doi:10.1016/j.margeo.2007.08.003

Author's personal copy
Slide consisted of sixty-three quasi-simultaneous massmovements, which span an area of 95000 km2 and haveevacuated 2400–3200 km3 of sediment (Haflidasonet al., 2004). These mass movements formed an amphi-theatrical depression that contains numerous headwallsand scarps, the largest of which being the 320 km longmain headwall located at the shelf break. The scar alsoencloses morphological features recognized as spreads,debris flows, turbidity flow channels and compressionalridges, which occur across a depth range of ∼2700 m.The sedimentological framework of the Storegga Slidearea is characterized by the alternation of glacialdiamictons and ice-proximal sediments, depositedduring glacial maxima, and fine-grained glacimarine,hemipelagic and contouritic sediments, deposited duringinterglacials (Berg et al., 2005). Because of itscomplexity and size, we consider the Storegga Slide asa macro-scale geomorphological system (102–106 km2
in area, according to Summerfield (1991)).
Concepts associated with non-linear dynamic sys-tems, such as fractals, chaos and self-organization, havegained considerable attention in many aspects of thegeosciences. The fractal model, for instance, capturesaspects of topography that other morphometric measuresdo not (Klinkenberg, 1992), and it provides a powerfulapproach to the representation of geoscientific data. Thegrowing use of digital elevation models and theincreasing resolution of topographic data sets haveenabled geomorphologists to identify fractal structuresand scale invariance in numerous subaerial environ-ments (e.g. Pelletier, 1999; Southgate andMöller, 2000).The statistical characteristics of large populations oflandslides, for example, have become a recent focus ofstudy in geology and geomorphology (e.g. Guzzettiet al., 2002; Hergarten, 2003; Turcotte et al., 2006).Submarine mass movements, however, are still generallystudied as isolated slope failure events using anengineering approach (e.g. Kvalstad et al., 2005; Sultan
Fig. 1. Bathymetric map of the Storegga Slide. Bathymetric contours at 250 m intervals are shown as grey lines, whereas the extracted headwalls arerepresented by solid black lines. The dashed black line indicates the boundaries of the Storegga Slide. The location of the slide is shown in the inset.
47A. Micallef et al. / Marine Geology 247 (2008) 46–60

Author's personal copy
et al., 2004). As the exploration and exploitation of theocean floor move into the deeper continental slope, thereis an increasing demand for the quantification of riskassociated with submarine slope failures. Probabilistichazard assessments, for example, depend on the extrap-olation of mass movement inventories. In order toperform such assessments, the frequency–magnituderelations of mass movements and their scaling behaviormust be identified and understood (Wolman and Miller,1960).
The available statistics of submarine mass movementdata are generally poorly characterized when comparedto those of subaerial mass movements. The StoreggaSlide scar, on the other hand, has been thoroughly sur-veyed using state-of-the-art acoustic imaging techni-ques. This provides us with the opportunity toinvestigate this geomorphological system at a large-scale and carry out a statistical and fractal analysis of theconstituent mass movements. The purpose of the studyis to: (a) Assess whether the Storegga Slide exhibitsscale invariance in terms of the statistics and morphol-ogy of its constituent mass movements; (b) Identify theorigin of the scale invariance in terms of systemdynamics and geological processes, and understand itsimplications.
2. Conceptual framework
A fractal is a term coined to define a set/function forwhich the Hausdorff–Besicovitch dimension exceedsthe topological dimension (Mandelbrot, 1977). Fractalgeometry includes shapes characterized by irregularitiesthat conform to non-Euclidean structures. The best wayto describe a fractal is through its attributes. The mostimportant characteristic of a fractal geometric object isself-similarity at a variety of scales, whereby the objectcontains scaled copies of itself. Another attributes of afractal object are infinite length and complexity. Knownas the Steinhaus paradox (Steinhaus, 1960), the degreeof detail of a fractal object increases infinitely asthe scale decreases. A fundamental property of fractalobjects is their fractal or similarity dimension (D). Thisis a single, non-integer value representing the scalingrelationship between the apparent length and measuringscale. The fractal dimension also gives a useful measureof the complexity or roughness of a spatial pattern. Thefractal dimension of linear features, for example, canvary between 1 for a straight line, and 2 for a feature soirregular that it fills an entire two-dimensional space(Mandelbrot, 1983). Unlike mathematical fractals,natural objects are not strictly self-similar, but ratherstatistically self-similar. In a statistically self-similar
object, measurable statistical parameters are repeated atall scales. The object does not comprise exact copiesof itself at all scales, but the object will contain nogeometric indication of its scale (Goodchild and Mark,1987).
The self-similar properties of data inventories, on theother hand, are investigated using frequency–magni-tude relationships. A power law distribution impliesthat when we compare the number of events of size Aor greater, with the number of events of size ηA orgreater (where η is an arbitrary factor), the numberalways differs by the same factor of η−β, regardless ofthe absolute size of the events. It has also been shownthat the power law distribution can be replaced withother measures of the size of the event (Hergarten,2003). This means that a power law distribution is freeof a characteristic scale and is thus fractal (Mandelbrot,1983).
3. Materials and methods
3.1. Data sets
Our investigation of the Storegga Slide is mainlybased on a high resolution multibeam bathymetry dataset that covers the slide scar from the main headwalldown to a water depth of ca. 2700 m (Fig. 1). The gridgenerated from these multibeam data has a horizontalresolution of 25 m or better. Two other acoustic data setscomplement our analyses. The first comprises Towed-Ocean-Bottom-Instrument (TOBI) sidescan sonar im-agery that covers 20000 km2 of the slide area with anominal horizontal resolution of 6 m. The secondconsists of high resolution 2D seismic lines, locatedacross the main headwall and northern sidewall, and2000 km2 of industry-type 3D seismic data locatedacross the northern sidewall.
3.2. Extraction of headwalls and estimation of the areaof mass movements
We define a mass movement as a single episode ofslope failure where sediment moves downslope underthe influence of gravity. Spreads and debris flows are themost common mass movements within the StoreggaSlide (Micallef et al., 2007). We define a spread as theextensional downslope displacement of a surficial massof sediment on gently sloping ground, and a debris flowas moving laminar flows of agglomerated particles heldtogether by a cohesive sediment matrix. The depositsassociated with these mass movements are characterizedby either a repetitive pattern of parallel ridges and
48 A. Micallef et al. / Marine Geology 247 (2008) 46–60
Author's personal copy
troughs (for spreads, Micallef et al. (2007)) or a blockytexture (for debris flows).
Mass movement area is a suitable proxy for themagnitude of mass movement events (Guzzetti et al.,2005). Area, volume and thickness of mass movementswere shown to be strongly correlated with each other,and a distribution can be converted between thesevariables (e.g. Hergarten, 2003; Hovius et al., 1997;Pelletier et al., 1997). Measurements of area tend to bemore reliable than those of volume or energy (Canalset al., 2004). The delineation of the boundaries of massmovements in a complex retrogressive landslide like theStoregga Slide is, however, difficult. This is because thedistal parts of some mass movements have collapsedover a headwall and evolved into different types of massmovements (Micallef et al., 2007). The mass movementswithin the Storegga Slide occurred quasi-simultaneously(Haflidason et al., 2005), and the deposits of some massmovements have intersected or overlapped other depos-its. TOBI sidescan sonar imagery is not available for theentire slide scar, which makes the differentiationbetween seafloor textures and the boundaries of adjacentmass movements more problematic. All of these factorslead to a degree of inaccuracy when estimating the areasof submarine mass movements within the StoreggaSlide. In comparison to mass movement boundaries,headwalls constitute prominent morphological featuresthat are both easily identifiable and large compared tonoise in the data. The terminations of a headwall aredefined by the zone where sediment movement hasoccurred perpendicularly to the headwall (in contrast toparallel, which defines the sidewall).
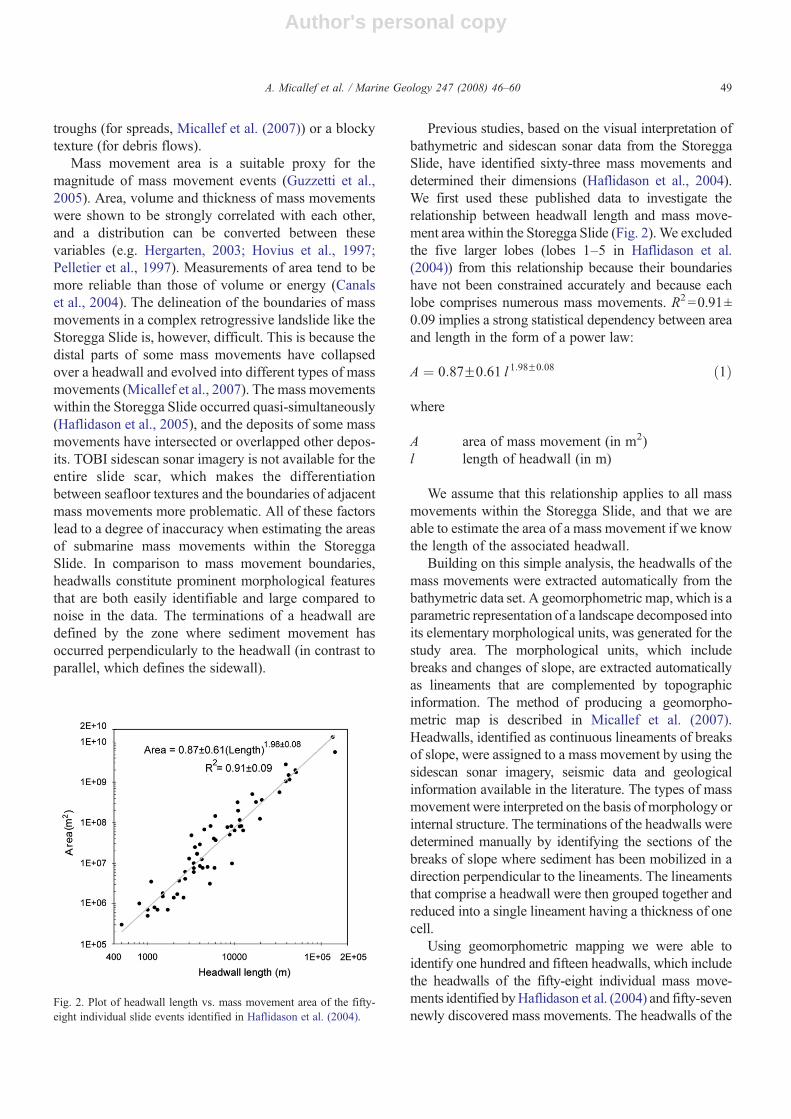
Previous studies, based on the visual interpretation ofbathymetric and sidescan sonar data from the StoreggaSlide, have identified sixty-three mass movements anddetermined their dimensions (Haflidason et al., 2004).We first used these published data to investigate therelationship between headwall length and mass move-ment area within the Storegga Slide (Fig. 2). We excludedthe five larger lobes (lobes 1–5 in Haflidason et al.(2004)) from this relationship because their boundarieshave not been constrained accurately and because eachlobe comprises numerous mass movements. R2=0.91±0.09 implies a strong statistical dependency between areaand length in the form of a power law:
A ¼ 0:87F0:61 l 1:98F0:08 ð1Þ
where
A area of mass movement (in m2)l length of headwall (in m)
We assume that this relationship applies to all massmovements within the Storegga Slide, and that we areable to estimate the area of a mass movement if we knowthe length of the associated headwall.
Building on this simple analysis, the headwalls of themass movements were extracted automatically from thebathymetric data set. A geomorphometric map, which is aparametric representation of a landscape decomposed intoits elementary morphological units, was generated for thestudy area. The morphological units, which includebreaks and changes of slope, are extracted automaticallyas lineaments that are complemented by topographicinformation. The method of producing a geomorpho-metric map is described in Micallef et al. (2007).Headwalls, identified as continuous lineaments of breaksof slope, were assigned to a mass movement by using thesidescan sonar imagery, seismic data and geologicalinformation available in the literature. The types of massmovement were interpreted on the basis ofmorphology orinternal structure. The terminations of the headwalls weredetermined manually by identifying the sections of thebreaks of slope where sediment has been mobilized in adirection perpendicular to the lineaments. The lineamentsthat comprise a headwall were then grouped together andreduced into a single lineament having a thickness of onecell.
Using geomorphometric mapping we were able toidentify one hundred and fifteen headwalls, which includethe headwalls of the fifty-eight individual mass move-ments identified byHaflidason et al. (2004) and fifty-sevennewly discovered mass movements. The headwalls of the
Fig. 2. Plot of headwall length vs. mass movement area of the fifty-eight individual slide events identified in Haflidason et al. (2004).
49A. Micallef et al. / Marine Geology 247 (2008) 46–60

Author's personal copy
latter comprised forty-seven escarpments created by single(termed individual headwalls) and ten multiple (termedcomposite headwalls) mass movement events (Fig. 1; seealso supplementary material). The co-ordinates of eachvertex point in all of the one hundred and fifteen headwalllineaments were extracted, and the length of each headwallwas calculated from these. The area associated with eachheadwall of the forty-seven newly discovered individualmass movements was estimated using Eq. (1). Acumulative frequency-area graph was plotted for all theone hundred and five individual mass movements, fromwhich a non-cumulative distribution was derived.
3.3. Determining the fractal dimension D of headwalls
Numerous methods have been proposed to determinethe fractal dimension of topography (Klinkenberg andGoodchild, 1992; Mandelbrot, 1983). Only a few of theseare suitable for calculating the fractal dimension of 2Dfeatures (Klinkenberg, 1994). We used a standardtechnique known as the divider method. The basis forthis vector-based technique is that the statistical variationbetween samples is a function of the distance betweenthem. A divider is “walked” along the headwall lineamentusing a set width step (τ) and the number of steps requiredto cover the entire line is recorded. This number is thenused to calculate the length of the lineament (L). τ is thenincreased by a fixed increment and the stepping process is
repeated. The relation between length of the steps andcalculated length of the lineament is:
L a s1�D ð2ÞThe fractal dimension D can thus be determined byplotting log L against log τ and estimating the slope usinga least squares linear regression.
D ¼ 1� limsY0 dlogL=� dlogs ð3ÞThe reliability of the technique was ensured by followingthe procedures proposed by Klinkenberg (1994). Exam-ples of the use of this technique in geosciences includeGoodchild and Mark (1987) and Aviles et al. (1987).Compared to other methods, the divider method is lesscomputationally expensive, easier to use and givesequally good results (Angeles et al., 2004).
3.4. Determining the geometric similarity of headwalls
We based the determination of geometric similarityon the homothetic transformation concept. For each ofthe one hundred and fifteen headwalls, the followingmethod was used. The extracted headwall was rotated sothat its initial and final vertices were aligned horizon-tally from west to east (Fig. 3a). The curved part ofthe headwall was always on the top. The mid-pointbetween the initial and final vertex of each headwall was
Fig. 3. (a) Illustration of themethod used to determine geometric similarity. The distance of point ZA on headwall Awas calculated fromO using the x- andy-coordinates. The samewas repeated for the corresponding point on headwall B. This was carried out for all the points on the headwalls. The two sequencesof data were then compared using linear regression. (b) Shapes used for the sensitivity analysis of the method for the calculation of the similarity coefficient.
50 A. Micallef et al. / Marine Geology 247 (2008) 46–60
Author's personal copy
determined, and the mid-points for all headwalls weremoved to a common position, O (Fig. 3a).
For each pair of headwalls, it was first ensured thatboth headwalls had the same number of co-ordinates.This involved using simple linear interpolation for theshorter headwalls to estimate the position of intermedi-ate points between the extracted co-ordinates. Then, foreach headwall, the distance of each co-ordinate from Owas calculated (in m) (Fig. 3a). The same was repeatedfor the second headwall. At this point we had twosequences of data. We used regression analysis tounderstand how similar these sequences were. Thedistance of each point from the first headwall wasplotted against the distance of the corresponding pointfrom the second headwall. A linear trend line startingfrom the origin was fitted to the plot using least squareslinear regression, and the R2 value was determined. Thisvalue represents how similar the sequences of data, andtherefore the two headwalls, are (with 1 indicatingperfect similarity, and 0 showing no similarity). Thisvalue is termed the similarity coefficient. This procedurewas carried out for all pairs of headwalls in Storegga (atotal of N13000 pairs).
3.4.1. Sensitivity analysisThe above technique was tested using the basic
shapes shown in Fig. 3b. The calculated similaritycoefficients for pairs of shapes are shown in Table 1.The highest similarity is observed between shapes 1 and2, and the lowest between shapes 2 and 4. A visualcomparison of the shapes supports the results (Fig. 3b).
4. Results
4.1. Frequency–magnitude relationship
The areas of the individual mass movements iden-tified within the Storegga Slide ranged between0.27 km2 and 1972 km2, with a mean of 42.92 km2
and a median of 7.19 km2. These compare to a mean of233.68 km2 and a median of 20.75 km2 for the fifty-eight mass movements identified by Haflidason et al.
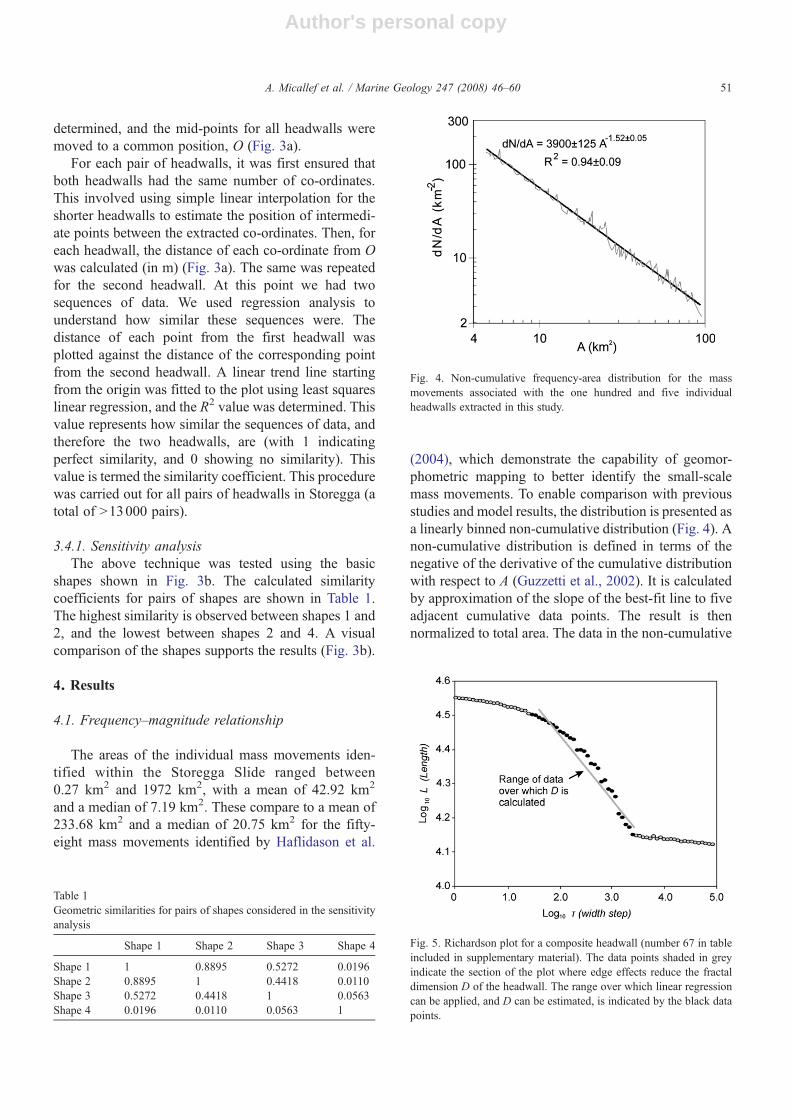
(2004), which demonstrate the capability of geomor-phometric mapping to better identify the small-scalemass movements. To enable comparison with previousstudies and model results, the distribution is presented asa linearly binned non-cumulative distribution (Fig. 4). Anon-cumulative distribution is defined in terms of thenegative of the derivative of the cumulative distributionwith respect to A (Guzzetti et al., 2002). It is calculatedby approximation of the slope of the best-fit line to fiveadjacent cumulative data points. The result is thennormalized to total area. The data in the non-cumulative
Fig. 5. Richardson plot for a composite headwall (number 67 in tableincluded in supplementary material). The data points shaded in greyindicate the section of the plot where edge effects reduce the fractaldimension D of the headwall. The range over which linear regressioncan be applied, and D can be estimated, is indicated by the black datapoints.
Fig. 4. Non-cumulative frequency-area distribution for the massmovements associated with the one hundred and five individualheadwalls extracted in this study.
Table 1Geometric similarities for pairs of shapes considered in the sensitivityanalysis
Shape 1 Shape 2 Shape 3 Shape 4
Shape 1 1 0.8895 0.5272 0.0196Shape 2 0.8895 1 0.4418 0.0110Shape 3 0.5272 0.4418 1 0.0563Shape 4 0.0196 0.0110 0.0563 1
51A. Micallef et al. / Marine Geology 247 (2008) 46–60

Author's personal copy
distribution can be best correlated with a negative powerfunction:
dN=A ¼ 3900F125A�1:52F0:05 ð4Þwhere
N cumulative number of mass movements with anarea NA
This distribution implies that the low magnitude(small area) mass movements are more frequent than thehigher magnitude (large area) mass movements, and thatthe change in frequency is to the power of 1.52. Therange of area over which this relationship is valid is 0.3–100 km2.
4.2. Fractal analysis
The logs of L and τ (both in m) were plotted for eachheadwall on a Richardson plot (Fig. 5). For mostheadwalls, the right hand side of the Richardson plot ischaracterized by a null slope because the highestmagnitudes of τ cannot discriminate the large-scaleroughness elements of the headwall trace. This is anedge effect in the measurement that tends to reduce theapparent fractal dimension of the headwalls. The datapoints on the right hand side of the plot were thus nottaken into consideration when calculating the fractal
dimension D. Additionally, on the left hand side of theRichardson plot, as τ decreases and approaches the limitof data resolution, L is also asymptotic (Fig. 5). Thevalues influenced by this effect were also excluded fromthe calculations. A least squares line was fitted to theremaining data (Fig. 5). The R2 value obtained for eachheadwall was generally higher than 0.95. To test howwell the assumption of linear regression for the datapoints is satisfied we analyzed the residual structure ofthe least squares linear regression for each headwall(Andrle, 1992; Klinkenberg and Goodchild, 1992). Thestandardized residuals were plotted from the best fittingline and the data distribution was analyzed. In all thecases, the distribution of the residuals showed noobvious pattern, the data points were evenly distributedbetween positive and negative values and they laybetween ±2 standard deviations. This shows that thelinear regression model is appropriate for our data set.Therefore the gradient of each line of fit was determinedfrom the Richardson plot and the fractal dimension wascalculated accordingly.
Table 2Mean similarity coefficients (and associated standard deviations) forthe two identified classes of individual headwalls
Class 1 Class 2
Class 1 0.7666 (±0.0221) 0.6112 (±0.0895)Class 2 0.6112 (±0.0895) 0.7399 (±0.0210)
Fig. 6. Plot of the calculated fractal dimension D for all extracted headwalls. The standard deviation for each headwall is also shown.
52 A. Micallef et al. / Marine Geology 247 (2008) 46–60
Author's personal copy
The fractal dimensions D of the individual andcomposite headwalls are shown in Fig. 6. All the valuesof D are statistically significantly higher than 1, whichmeans that all headwalls have a detectable fractalcharacter. The values of D for the composite headwallsrange between 1.15 and 1.25, whereas the values ofD forthe individual headwalls are close to the Euclidean valueof 1. This means that composite headwalls are irregular,whereas individual headwalls are smoother features.Since composite headwalls are comprised of individualheadwalls, the scale over which the fractal character isobserved in the composite headwalls is not infinite, but itoccurs above the lengths of the constituent individualheadwalls. The values of D for both individual andcomposite headwalls do not correlate with size, massmovement type, sediment thickness or depth, whichindicates that D is generally homogeneous.
4.3. Geometric similarity
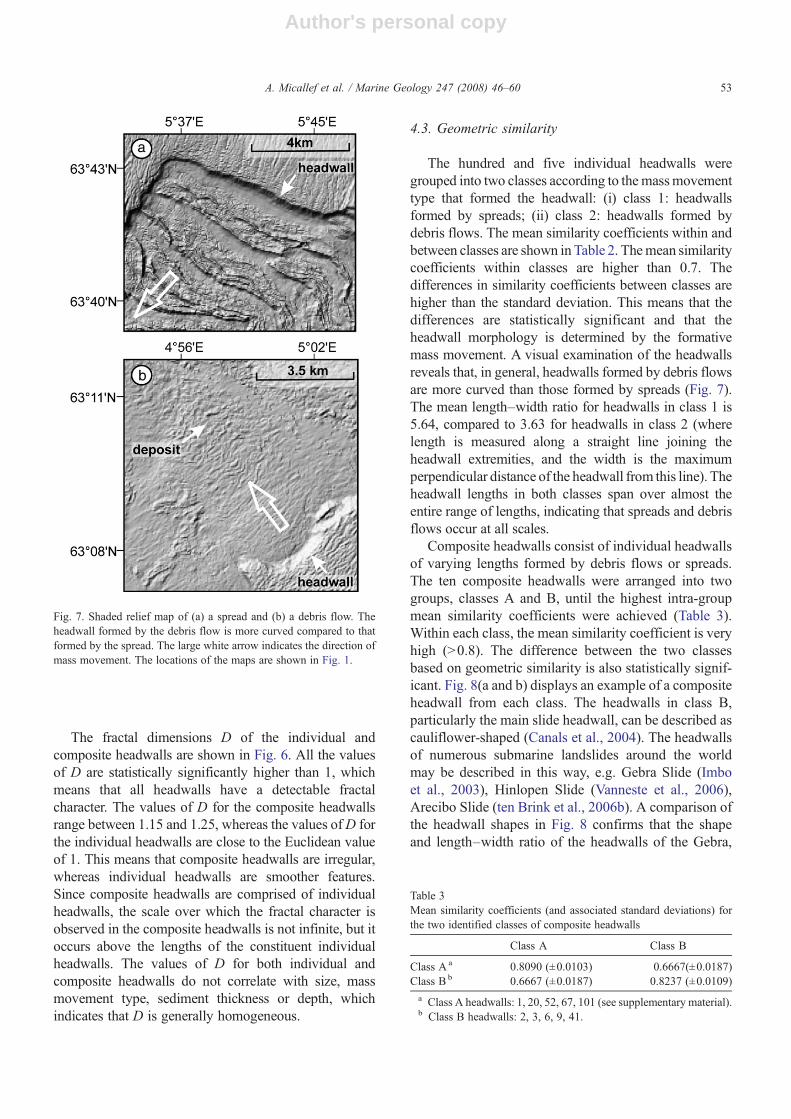
The hundred and five individual headwalls weregrouped into two classes according to themassmovementtype that formed the headwall: (i) class 1: headwallsformed by spreads; (ii) class 2: headwalls formed bydebris flows. The mean similarity coefficients within andbetween classes are shown inTable 2. Themean similaritycoefficients within classes are higher than 0.7. Thedifferences in similarity coefficients between classes arehigher than the standard deviation. This means that thedifferences are statistically significant and that theheadwall morphology is determined by the formativemass movement. A visual examination of the headwallsreveals that, in general, headwalls formed by debris flowsare more curved than those formed by spreads (Fig. 7).The mean length–width ratio for headwalls in class 1 is5.64, compared to 3.63 for headwalls in class 2 (wherelength is measured along a straight line joining theheadwall extremities, and the width is the maximumperpendicular distance of the headwall from this line). Theheadwall lengths in both classes span over almost theentire range of lengths, indicating that spreads and debrisflows occur at all scales.
Composite headwalls consist of individual headwallsof varying lengths formed by debris flows or spreads.The ten composite headwalls were arranged into twogroups, classes A and B, until the highest intra-groupmean similarity coefficients were achieved (Table 3).Within each class, the mean similarity coefficient is veryhigh (N0.8). The difference between the two classesbased on geometric similarity is also statistically signif-icant. Fig. 8(a and b) displays an example of a compositeheadwall from each class. The headwalls in class B,particularly the main slide headwall, can be described ascauliflower-shaped (Canals et al., 2004). The headwallsof numerous submarine landslides around the worldmay be described in this way, e.g. Gebra Slide (Imboet al., 2003), Hinlopen Slide (Vanneste et al., 2006),Arecibo Slide (ten Brink et al., 2006b). A comparison ofthe headwall shapes in Fig. 8 confirms that the shapeand length–width ratio of the headwalls of the Gebra,
Table 3Mean similarity coefficients (and associated standard deviations) forthe two identified classes of composite headwalls
Class A Class B
Class A a 0.8090 (±0.0103) 0.6667(±0.0187)Class B b 0.6667 (±0.0187) 0.8237 (±0.0109)a Class A headwalls: 1, 20, 52, 67, 101 (see supplementary material).b Class B headwalls: 2, 3, 6, 9, 41.
Fig. 7. Shaded relief map of (a) a spread and (b) a debris flow. Theheadwall formed by the debris flow is more curved compared to thatformed by the spread. The large white arrow indicates the direction ofmass movement. The locations of the maps are shown in Fig. 1.
53A. Micallef et al. / Marine Geology 247 (2008) 46–60

Author's personal copy
Hinlopen and Arecibo Slides are similar to the com-posite headwall in class B. The percentage of the totallength of composite headwalls formed by debris flowsto that formed by spreads is plotted in Fig. 9. This shows
that the majority of the headwalls in class A are formedby debris flows, whereas the majority of the headwalls inclass B are comprised of spreads. Thus, the shape of thecomposite headwalls is dependent on the formative mass
Fig. 9. Plot of the percentage length formed by either spreads or debris flows within each of the ten composite headwalls. The numbers on the graphdenote the headwall number (see supplementary material). The composite headwalls have been divided into classes A and B according to theestimated geometric similarity between them. The plot shows that the majority of the length of the composite headwalls in class A is formed by debrisflows, whereas the majority of the length of the composite headwalls in class B is formed by spreads.
Fig. 8. Comparison of examples of composite headwalls from classes A and B, with the main headwalls of the Hinlopen, Gebra and Arecibo Slides.The headwall in (b) is the Storegga main headwall. The (c) Hinlopen, (d) Gebra and (e) Arecibo slide headwalls were traced from Vanneste et al.(2006), Imbo et al. (2003) and ten Brink et al. (2006b), respectively. The length–width ratio (L–W ratio) refers to the quotient of the length of astraight line joining the headwall extremities, to the maximum perpendicular distance of the headwall from this line. The shape and L–W ratio of theHinlopen, Gebra and Arecibo Slides are more similar to the class B headwall.
54 A. Micallef et al. / Marine Geology 247 (2008) 46–60

Author's personal copy
movements. The headwalls of the Hinlopen, Arecibo andGebra Slides should mainly have been formed byspreads, because the shape and length–width ratio ofthese landslides is similar to that of the headwalls in classB (Fig. 8). This inference is partly confirmed by the fielddata. High-resolution swath bathymetry data from theHinlopen Slide show extensive areas of parallel ridgesand troughs close to the main headwall (Figs. 2 and 3 inVanneste et al., 2006). The resolution of the bathymetricdata from the Gebra and Arecibo Slides is not highenough to allow us to identify such ridge and troughmorphology (Imbo et al., 2003; ten Brink et al., 2006b).In the case of the Arecibo Slide, however, the failingmaterial consisted of either carbonate layers or oceaniccrust. Such material is more likely to fail as a coherentrather than an internally deformable mass (ten Brinket al., 2006b).
The mean similarities between the two classes ofcomposite headwalls and the two classes of individualheadwalls are shown in Table 4. Class A headwalls aremore similar to class 2 headwalls (formed by debrisflows), whereas class B headwalls are more similar toclass 1 headwalls (formed by spreads). This indicatesthat a composite headwall has a similar shape to themajority of the individual headwalls that form it, whichimplies self-similarity.
5. Discussion
5.1. Scale invariant characteristics of submarine massmovements: origin and significance
The results in Section 4 are evidence of spatial scaleinvariance within the Storegga Slide. The first type ofspatial scale invariance is observed in the distribution ofmass movement areas. The frequency of occurrence ofsubmarine mass movements within the Storegga Slide isa function of the mass movement area (or magnitude)according to an inverse power law, and can thus bedescribed as fractal. Similar power law distributionshave been identified in numerous inventories of sub-aerial mass movements of different types and sizes,occurring in a range of environmental settings and
triggered by a variety of mechanisms (e.g. Dai and Lee,2002; Dussauge et al., 2003; Guzzetti et al., 2002;Hovius et al., 1997; Ohmori and Hirano, 1988). Adifference between these studies of subaerial landslidepopulations and our study is that the former have takeninto consideration individual landslides whereas weinvestigated a single, large landslide complex. In thisstudy, the power law scaling of mass movement areawith frequency is restricted to the range 0.3–100 km2.The scaling is observed over ∼2.5 orders of magnitudeof the area (Fig. 4) (compared to ∼3 for data fromsubaerial mass movements (Hergarten and Neugebauer,1998)), and can be applied to the majority of the massmovements under consideration.
Explaining the origin of this first type of spatial scaleinvariance in geological terms is difficult. One explana-tion is that the fractal distribution is a manifestation ofself-organized criticality (SOC) (Bak et al., 1987; Baket al., 1988), a concept which has found wide applicationin physics, biology and economics (Bak, 1996). Self-organized criticality is a property of a complex systemrelated to principles of energy dissipation and the occur-rence of spatiotemporal chaos (Phillips, 1995). Self-organized criticality may explain the phenomenonwhereby, despite complexity and heterogeneity at thelevel of individual elements (e.g. grains of sediment), theaggregate behavior of the system at the larger scaleexhibits order in the form of a fractal distribution. In thiscomplex system, the “input” is nearly constant and the“output” is characterized by a series of events, thefrequency-size distribution of which follows a power lawin space and time. Emergence of this order occurs throughautogenic dynamics and internal feedbackmechanisms ofthe system (Phillips, 1995).
There are a number of necessary conditions for iden-tifying self-organized criticality in a system (Bak et al.,1987): (a) the distribution of event sizes is scaleinvariant, (b) the system is in a quasi-stationary (critical)state and (c) the temporal behavior of the system is a 1/f(red) noise (Bak et al., 1987). Within the Storegga Slide,the distribution of mass movements has been shown tobe spatially scale invariant, but we cannot characterizethe temporal behavior due to a low temporal resolutionof submarine mass movement data. Landsliding is adissipative phenomenon because material is moveddownslope or removed from the slide scar. A continu-ous, long term driving force is thus required to keep thelandslide in a quasi-stationary state. In the Storeggaregion, this force is represented by the continuous andvariable deposition of glacially-derived material (duringglacial maxima) and hemipelagic sedimentation (duringinterglacials) that has been taking place along the mid-
Table 4Mean similarity coefficients (and associated standard deviations)between the classes of composite headwalls (A–B) and classes ofindividual headwalls (1–2)
Class 1 Class 2
Class A 0.6099±0.0139) 0.7847(±0.0107)Class B 0.8518±0.0023) 0.6018(±0.0072)
55A. Micallef et al. / Marine Geology 247 (2008) 46–60

Author's personal copy
Norwegian Margin during at least the last 3 Ma (Riseet al., 2005). These processes have resulted in a pro-gressive increase in sediment pore pressure, gravita-tionally-induced stress and surface slope gradient, all ofwhich promote slope instability. Another driving forcemay comprise seismic activity, because glacially-induced tectonic movements enable the Storegga Slidesystem to exceed thresholds and trigger slope instabil-ities (Evans et al., 2005). Such conditions are all typicalof a system in a critical state. In consideration ofthe above, we conclude that the Storegga Slide is ageomorphological system that may exhibit self-orga-nized criticality.
One of the most widespread models of self-organizedcriticality is the Bak–Tang–Wiesenfeld (BTW) model(Bak et al., 1988), also known as the ‘sandpile’ model.This simple cellular automata model consists of a latticewhere particles are dropped into a randomly selected gridat time steps. When the total number of particles in a gridexceeds a specific threshold, the site collapses and theparticles are redistributed into the adjacent grids. Theredistribution of particles can lead to an ‘avalanche’.Numerical studies have shown that, in a ‘sandpile’model, the non-cumulative number of ‘avalanches’ withthe ‘avalanche’ area satisfies a power law distribution,and that the value of the exponent of the power law is∼1(Kadanoff et al., 1989). The exponent associated with thespatial power law scaling of subaerial mass movementsis significantly higher than 1. The values range between2.2 and 3.3 for mass movements occurring in a variety ofenvironmental settings (Dai and Lee, 2002; Guzzetti etal., 2002; Hovius et al., 1997; Malamud et al., 2004; VanDen Eeckhaut et al., 2007). The value of the exponentobtained for submarine mass movements within theStoregga Slide is 1.52. This value is still higher than the‘sandpile’ model value of 1. This difference can beattributed to the simplicity of the 2D ‘sandpile’ model,which contrasts with the multitude of forces and controlsoperating on a variety of spatiotemporal scales in 3D inmass movements. For example, a higher exponent oflandslide frequency-size distribution has been obtainedwhen incorporating factors such as geological heteroge-neity (Sugai et al., 1994), soil moisture content (Pelletieret al., 1997) and slope stability considerations (Hergartenand Neugebauer, 1998) into landslide models. On theother hand, the value of the exponent for submarine massmovements is considerably lower than for subaerial massmovements, and closer to the ‘sandpile’model value. Thiscould imply that, in comparison to subaerial mass move-ments, submarine mass movement systems are less com-plex and that their dynamics are more analogous to thoseof the ‘sandpile’ model. The elements in the ‘sandpile’
model can be qualitatively related to the components ofthe Storegga Slide system. The dropping particles repre-sent sediment deposition, the avalanches are the individ-ual mass movements, and the thresholds are associatedwith changes in slope gradient, pore pressure andgravitationally-induced stress. In subaerial systems, onthe other hand, driving forces such as tectonic uplift andfluvial incision tend to interact with weathering forces,variable degrees of saturation, high geological heteroge-neity and topographic roughness, yielding a higherexponent for the power law distribution of mass move-ments. Since the sediments failing within the StoreggaSlide are mainly clays, cohesive forces may be anotherfactor explaining the low exponent associated with sub-marine mass movements. Since the exponent for theStoregga mass movements' distribution is b2 and lowerthan the values obtained for subaerial mass movements,we can also infer that the larger massmovements are moredominant in submarine environments.
The applicability of the ‘sandpile’ model to submarinemass movements is not without problems, however. First,aspects of inertia and cohesion are overlooked in the‘sandpile’model. Secondly, self-organized criticality is nota property unique to cellular automata models. Hergartenand Neugebauer (1998), for example, developed a modelof landsliding that exhibits self-organized criticality usingpartial differential equations only. For our study area,another explanation of the fractal distribution of the massmovements is the fact that the Storegga Slide was aretrogressive slope failure (Haflidason et al., 2005;Kvalstad et al., 2005). Instability did not occur across theentire slip surface simultaneously, but started as one or afew large mass movements located close to the Faroe–Shetland Escarpment (Haflidason et al., 2004). Failure inthis region destabilized the neighboring areas and theinstability propagated upslope via the progressive collapseof the headwall. The area of the mass movements withinthe Storegga Slide become smaller with distance upslope(Haflidason et al., 2004; Issler et al., 2005), whilst thenumber ofmassmovements increases (Fig. 10). Therefore,as the slope failure propagated upslope, each massmovement triggered an increasing number of smallermassmovements, in the style of a cascade. The continentalslope is characterized by extensive areas of uniform gentletopography (Shepard, 1963). In such a setting theboundary conditions are largely homogeneous and aretrogressive cascade would be allowed to developunobstructed. The Storegga retrogressive cascade contin-ued until the boundary conditions changed at the limits ofthe present Storegga Slide scar. These changes include thedecrease in the slope gradient of the seabed where thecontinental slope meets the continental shelf, and the
56 A. Micallef et al. / Marine Geology 247 (2008) 46–60

Author's personal copy
gradation into pronounced morphological barriers (theNorth Sea Fan in the south and the Vøring Plateau in thenorth). Another factor responsible for halting the retro-gressive cascade must have been the increase in theconsolidation of the sediments in the region of theStoregga Slide main headwall, due to glacial compactionduring theLast GlacialMaximum (Gauer et al., 2005). TheStoregga retrogressive cascade is qualitatively similar tothe activation of avalanches in the ‘sandpile’ model andmay explain the power law of the frequency-areadistribution of the submarine mass movements.
Self-organized criticality is, however, not the onlyexplanation of the observed spatial power law scaling insubmarine mass movements. Pre-defined geologicalstructures and natural variability may also result in aspatial power law distribution in mass movements,without the need of self-organized criticality (Hergarten,2003; Pelletier et al., 1997). Detailed information aboutthe spatial variability of geotechnical properties andgeological structures within the Storegga Slide is notavailable. Thus we are unable to confirm a potentialrelationship between the power law distribution of massmovements and geological structures.
A second type of spatial scale invariance within theStoregga Slide is identified in mass movement morphology.The plot of headwall length vs. mass movement area in Fig.2 shows strong power law scaling. The geometric similarityof headwalls at different scales (Table 2) and the self-similar
properties of the composite headwalls (Table 4; Fig. 6) arealso indicative of morphological scale invariance. Theseresults complement the observations made by Issler et al.(2005) for mass movements within the Storegga Slide,where the area of a longitudinal section across the massmovements was found to scale with the released volume.The geometric scaling behavior of landslides implies that theform and the geological processes associated with subma-rinemassmovements are the same at the investigated scales.In the absence of other factors, such as heterogeneities in thefailing material, this observation indicates that the inclusionof hydroplaning and shear wetting in physical models ofslope failures by Issler et al. (2005) can be extended to thedifferent scales investigated in this study.
5.2. Headwalls as morphological proxies
The two classes of composite headwalls are geomet-rically similar to the majority of their constituent head-walls. This observation, combined with the high values ofthe fractal dimensionD observed in composite headwalls,indicates that the composite headwalls formed bysubmarine mass movements are self-similar at scaleshigher than those of the constituent individual headwalls.This means that when headwalls from separate massmovements coalesce, the resulting headwall has a shapesimilar to its constituent headwalls, or to those whichoccupy the largest portion of the headwall (if formed by
Fig. 10. Frequency-depth distribution of the one hundred and five individual headwalls.
57A. Micallef et al. / Marine Geology 247 (2008) 46–60

Author's personal copy
different types of mass movement). The shape of in-dividual headwalls was shown to be indicative of itsprincipal formative geological processes. This also appliesto composite headwalls. Headwalls formed by spreadshave a length–width ratio higher than ∼4 and their shaperanges between cauliflower-shaped and linear. Headwallsformed by debris flows are more curvilinear and have alength–width ratio lower than ∼4. This observationprovides a basis for a morphological classification ofsubmarine landslides and allows the identification of massmovement type even when the resolution of thebathymetric data is low and only the shape of the headwallis discernible. The difference in shapemaybe explained bythe fact that a higher level of plastic deformation is requiredto evacuate a curvilinear headwall, in comparison to aquasi-linear headwall, where deformation entails brittledeformation of the sediment into coherent blocks. Thereasons for why some slope failures form spreads, whereasother transform into debris flows, may be various. Subtledifferences in the physical properties of the sediment couldinfluence the type of deformation. Boundary effects,presence of gas hydrates, variation in sediment facies (e.g.presence of contourites), and evolution of the landslide,may also be important. The fractal dimension of headwalls,on the other hand, can be used to revealwhether a headwallis formed by one or more mass movements. Thus,headwalls can be used as morphological proxies for theidentification of submarine mass movements.
5.3. Implications
There are several important implications that resultfrom the study of the fractal statistics and morphology ofthe Storegga Slide. The first relates to the design ofsystems to investigate and model submarine mass move-ments. Self-organized criticality is advocated as the mostlikely explanation of the observed power law in thefrequency-area distribution of submarine mass move-ments within the Storegga Slide. The Storegga Slide maythus be modelled as a large-scale geomorphic system in aquasi-stationary state, and power law relations may beincorporated in the evolution modelling of this landslide.Submarine mass movements are more comparable to thetheoretical ‘sandpile’ model than their subaerial counter-parts, and should therefore be simpler to model. Self-organized criticality is an emergent property that is notbuilt into the physical equations a priori (Gupta, 2004).The aggregate behavior of a large-scale geomorphicsystem such as the Storegga Slide may therefore beindependent of the smaller-scale components. Not allaspects of the submarine mass movement system can bereproduced by modeling the small-scale elements of the
system, as espoused by the engineering approach. Thisalso means, however, that limitations in data acquisitiontechniques that do not have the adequate resolution can becircumvented when considering emergent features. Thespatial scale invariant behavior of mass movementmorphology within the Storegga Slide contradicts thelong-standing geographic tradition that geomorphicprocesses operate at specific spatial scales (Schumm andLichty, 1965). Ifmassmovements are scale invariant, thenthe morphology and mechanisms of mass movements canbe extrapolated from the small-scale to the large-scale (orvice versa). The retrogressive cascade, based on loss ofsupport as the threshold exceeding mechanism in thisopen system, also explains the power law distribution ofmass movements. It fits the self-organized criticalbehavior well and emphasises the importance of consid-ering the interconnectivity of individual landslides. Theevolution of a retrogressive cascade on a continentalslope, where boundary conditions are generally homoge-neous, would explain the large size of the Storegga Slideand similar submarine landslides elsewhere.
The second important implication is that our resultsalso provide an explanation for the potential similarity inthe shape of headwalls of submarine mass movementsaround the world. Spreading is a retrogressive massmovement (Kvalstad et al., 2005; Micallef et al., 2007).Ridge and trough morphology, characteristic of spread-ing, can be observed in numerous submarine landslidesaround the world. In this study we observed that thecauliflower-shape of the Storegga Slide headwall ismainly associated with spreading, and that this shape isalso common in submarine mass movements, particularlyin formerly glaciated margins such as the NorwegianMargin. Analysis of landslides in the North Atlanticshows that mass movements mainly initiate in the mid-continental slope (Hühnerbach and Masson, 2004), andthat they develop progressively upslope (Kvalstad et al.,2005). If we combine these observations we can proposethat the majority of submarine mass movements developretrogressively, with spreading as the latest stage of theslide evolution that defines the main headwall. Sincespreading can be linked with the retrogressive cascade,self-organized critical behavior could potentially be anemergent feature of numerous submarine mass move-ments throughout the world.
The third implication relates to mass movements asnatural geohazards. Frequency-magnitude plots of massmovements can be re-cast as probability distributions,providing a measure of the hazard risk posed by suchslope failures (Guzzetti et al., 2002). By plotting thefrequency–magnitude distribution of the mass move-ments we can estimate the event magnitude, along with
58 A. Micallef et al. / Marine Geology 247 (2008) 46–60

Author's personal copy
the total number and volume of mass movements, andextrapolate incomplete inventories within the limits ofpower law behavior (in the case of the Storegga Slide, formass movements ranging between 0.3–100 km2 in area).These considerations are particularly useful in tsunamihazard assessment, where knowledge of probabilities ofthe causative mass movement size is required (ten Brinket al., 2006a). Within the Storegga Slide, the larger massmovements are more dominant than in subaerial settings.This means that it is sufficient to obtain an accurateinventory of the larger mass movements in order tounderstand the frequency–magnitude characteristics ofall the mass movements that comprise the StoreggaSlide. In our acoustic data sets, as in those of othersubmarine landslides, the larger mass movements aregenerally well-resolved.
6. Conclusions
In this study we presented evidence of the scale in-variant characteristics of the Storegga Slide. The frequen-cy-area distribution of mass movements within theStoregga Slide satisfies an inverse power law. Headwallsare geometrically similar at a wide range of scales, andheadwall lengths scale with mass movement areas. Com-posite headwalls are self-similar features. These charac-teristics of the Storegga Slide provide an important insightinto the physics of submarine slope failure, and support theconcepts of scale invariance and self-organized criticalityin submarine slide evolution theory and modeling. Theorigin of spatial scale invariance may also be associated tothe retrogressive nature of the Storegga Slide. Our resultsare important in terms of the morphological classificationof submarine mass movements, because headwall shapecan be used as a morphological proxy for the formativemass movements.
Acknowledgements
This research was supported by the HERMES project,EC contract no. GOCE-CT-2005-511234, funded by theEuropean Commission's Sixth Framework Programmeunder the priority ‘Sustainable Development, GlobalChange and Ecosystems’. We would like to thank NorskHydro ASA for providing the bathymetric data and 2Dseismic lines. BP Norway and the European NorthAtlantic Margin (ENAM) II Programme are acknowl-edged for making available the 3D seismic dataset andTOBI sidescan sonar imagery, respectively. We aregrateful to Dr. Robin S. Snow for sharing the FORTRANcode for the divider method. The insightful comments oftwo anonymous reviewers are greatly appreciated.
Appendix A. Supplementary data
Supplementary data associated with this article canbe found, in the online version, at doi:10.1016/j.margeo.2007.08.003.
References
Andrle, R., 1992. Estimating fractal dimension with the dividermethod in geomorphology. Geomorphology 5 (1–2), 131–141.
Angeles, G.R., Perillo, G.M.E., Piccolo, M.C., Pierini, J.O., 2004.Fractal analysis of tidal channels in the Bahía Blanca Estuary(Argentina). Geomorphology 57, 263–274.
Aviles, C.A., Scholz, C.H., Boatwright, J., 1987. Fractal analysis appliedto characteristic segments of the San Andrea Fault. J. Geophys. Res.92 (B1), 331–344.
Bak, P., 1996. How nature works: the science of self-organizedcriticality. Copernicus. Springer, New York.
Bak, P., Tang, C., Wiesenfield, K., 1987. Self-organized criticality: anexplanation of 1/f noise. Phys. Rev. Lett. 59, 381–384.
Bak, P., Tang, C., Wiesenfield, K., 1988. Self-organized criticality.Phys. Rev., A. 38, 364–374.
Berg, K., Solheim, A., Bryn, P., 2005. The Pleistocene to recentgeological development of the Ormen Lange area. Mar. Pet. Geol.22 (1–2), 45–56.
Canals, M., Lastras, G., Urgeles, R., Casamor, J.L., Mienert, J.,Cattaneo, A., De Batist, M., Haflidason, H., Imbo, Y., Laberg, J.S.,Locat, J., Long, D., Longva, O., Masson, D.G., Sultan, N.,Trincardi, F., Bryn, P., 2004. Slope failure dynamics and impactsfrom seafloor and shallow sub-seafloor geophysical data: casestudies from the COSTA project. Mar. Geol. 213 (1–4), 9–72.
Dai, F.C., Lee, C.F., 2002. Landslide characteristics and slopeinstability modeling using GIS, Lantau Island, Hong Kong.Geomorphology 42, 213–228.
Dussauge, C., Grasso, J.R., Helmstetter, A., 2003. Statistical analysisof rockfall volume distributions: implications for rockfall dynam-ics. J. Geophys. Res. 108 (B6), 2286.
Evans, D., Harrison, Z., Shannon, P.M., Laberg, J.S., Nielsen, T., Ayers,S., Holmes, R., Hoult, R.J., Lindberg, B., Haflidason, H., Long, D.,Kuijpers, A., Andersen, E.S., Bryn, P., 2005. Palaeoslides and othermass failures of Pliocene to Pleistocene age along the glaciatedEuropean margin. Mar. Pet. Geol. 22 (9–10), 1131–1148.
Gauer, P., Kvalstad, T.J., Forsberg, C.F., Bryn, P., Berg, K., 2005. Thelast phase of the Storegga Slide: simulation of retrogressive slidedynamics and comparison with slide-scar morphology. Mar. Pet.Geol. 22 (1–2), 171–178.
Goodchild, M.F., Mark, D.M., 1987. The fractal nature of geographicphenomena. Ann. Assoc. Am. Geogr. 77, 265–278.
Gupta, V.K., 2004. Emergence of statistical scaling in floods onchannel networks from complex runoff dynamics. Chaos, SolitonsFractals. 19, 357–365.
Guzzetti, F., Malamud, B.D., Turcotte, D.L., Reichenbach, P., 2002.Power-law correlations of landslide areas in central Italy. EarthPlanet. Sci. Lett. 195, 169–183.
Guzzetti, F., Reichenbach, P., Cardinali, M., Galli, M., Ardizzone, F.,2005. Probabilistic landslide hazard assessment at the basin scale.Geomorphology 72, 272–299.
Haflidason, H., Sejrup, H.P., Nygärd, A., Bryn, P., Lien, R., Forsberg,C.F., Berg, K., Masson, D.G., 2004. The Storegga Slide:architecture, geometry and slide-development. Mar. Geol. 231,201–234.
59A. Micallef et al. / Marine Geology 247 (2008) 46–60

Author's personal copy
Haflidason, H., Lien, R., Sejrup, H.P., Forsberg, C.F., Bryn, P., 2005.The dating and morphometry of the Storegga Slide. Mar. Pet. Geol.22 (1–2), 123–136.
Hergarten, S., 2003. Landslides, sandpiles and self-organisedcriticality. Nat. Hazards Earth Syst. Sci. 3, 505–514.
Hergarten, S., Neugebauer, H.J., 1998. Self-organized criticality in alandslide model. Geophys. Res. Lett. 25 (6), 801–804.
Hovius, N., Stark, C.P., Allen, P.A., 1997. Sediment flux from amountainbelt derived by landslide mapping. Geology 25 (3), 231–234.
Hühnerbach, V., Masson, D.G., 2004. Landslides in the North Atlanticand its adjacent seas: an analysis of their morphology, setting andbehaviour. Mar. Geol. 213, 343–362.
Imbo, Y., De Batist, M., Canals, M., Prieto, M.J., Baraza, J., 2003. TheGebra Slide: a submarine slide on the Trinity Peninsula Margin,Antarctica. Mar. Geol. 193, 235–252.
Issler, D., De Blasio, F.V., Elverhøi, A., Bryn, P., Lien, R., 2005.Scaling behaviour of clay-rich submarine debris flows. Mar. Pet.Geol. 22 (1–2), 187–194.
Kadanoff, L.P., Nagel, S.R., Wu, L., Zhou, S.M., 1989. Scaling anduniversality in avalanches. Phys. Rev., A. 39, 6524–6533.
Klinkenberg, B., 1992. Fractals and morphometric measures: is there arelationship? Geomorphology 5, 5–20.
Klinkenberg, B., 1994. A review of methods used to delineate thefractal dimensions of linear features. Math. Geol. 26 (1), 23–46.
Klinkenberg, B., Goodchild, M.F., 1992. The fractal properties oftopography: a comparison of methods. Earth Surf. Process. Landf.17, 217–234.
Kvalstad, T.J., Andersen, L., Forsberg, C.F., Berg, K., Bryn, P.,Wangen, M., 2005. The Storegga slide: evaluation of triggeringsources and slide mechanisms. Mar. Pet. Geol. 22 (1–2), 245–256.
Malamud, B.D., Turcotte, D.L., Guzzetti, F., Reichenbach, P., 2004.Landslides inventories and their statistical properties. Earth Surf.Process. Landf. 29, 687–711.
Mandelbrot, B., 1977. Fractals: Form, Chance and Dimension. WHFreeman, San Francisco.
Mandelbrot, B.B., 1983. The Fractal Geometry of Nature. W.H.Freeman, New York.
Masson, D.G., Harbitz, C.B., Wynn, R.B., Pedersen, G., Løvholt, F.,2006. Submarine landslides: processes, triggers and hazardprediction. Philos. Trans.-R. Soc. 364 (1845), 2009–2039.
Micallef, A., Berndt, C., Masson, D.G., Stow, D.A.V., 2007. A techniquefor the morphological characterization of submarine landscapes asexemplified by debris flows of the Storegga Slide. J. Geophys. Res.112, F02001.
Micallef, A., Masson, D.G., Berndt, C., Stow, D.A.V., 2007. Themorphology and mechanics of submarine spreading: a case studyfrom the Storegga Slide. J. Geophys. Res. 112, F03023.
Ohmori, H., Hirano, M., 1988. Magnitude, frequency and geomor-phological significance of rocky mud flows, landcreep and thecollapse of steep slopes. Z. Geomorphol. (Suppl. Bd.). 67, 55–65.
Pelletier, J.D., 1999. Self-organization and scaling relationships ofevolving river networks. J. Geophys. Res. 104 (B4), 7359–7375.
Pelletier, J.D., Malamud, B.D., Blodgett, T., Turcotte, D.L., 1997.Scale-invariance of soil moisture variability and its implicationsfor the frequency-size distribution of landslides. Eng. Geol. 48,255–268.
Phillips, J.D., 1995. Self-organization and landscape evolution. Prog.Phys. Geogr. 19, 309–321.
Rise, L., Ottensen, D., Berg, K., Lundin, E., 2005. Large-scaledevelopment of the mid-Norwegian Margin during the last 3million years. Mar. Pet. Geol. 22 (1–2), 33–44.
Schumm, S.A., Lichty, R.W., 1965. Time, space and causality ingeomorphology. Am. Journal Sci. 263, 110–119.
Shepard, F.P., 1963. Submarine Geology, 2nd edition. Harper andRow, London.
Solheim, A., Berg, K., Forsberg, C.F., Bryn, P., 2005. The StoreggaSlide complex: repetitive large scale sliding with similar cause anddevelopment. Mar. Pet. Geol. 22 (1–2), 97–107.
Southgate, H.N., Möller, N.K., 2000. Fractal properties of coastal pro-file evolution at Duck, North Carolina. J. Geophys. Res. 105 (C5),11489–11507.
Steinhaus, H., 1960. Mathematical Snapshots. Oxford UniversityPress, London.
Sugai, T., Ohmori, H., Hirano, M., 1994. Rock control on magnitude–frequency distribution of landslides. Transactions Jpn. Geomor-phol. Union. 15 (3), 233–251.
Sultan, N., Cochonat, P., Canals, M., Cattaneo, A., Dennielou, B.,Haflidason, H., Laberg, J.S., Long, D., Mienert, J., Trincardi, F.,Urgeles, R., Vorren, T.O., Wilson, C., 2004. Triggering mechanismsof slope instability processes and sediment failures on continentalmargins: a geotechnical approach. Mar. Geol. 213 (1–4), 291–321.
Summerfield, M., 1991. Global Geomorphology: An Introduction tothe Study of Landforms. Longman, London.
ten Brink, U.S., Geist, E.L., Andrews, B.D., 2006a. Size distribution ofsubmarine landslides and its implication to tsunami hazard inPuerto Rico. Geophys. Res. Lett. 33, L11307–L11311.
ten Brink, U.S., Geist, E.L., Lynett, P., Andrews, B., 2006b. Submarineslides north of Puerto Rico and their tsunami potential. In:Mercado, A., Liu, P.L.F. (Eds.), Caribbean Tsunami Hazard, WorldSci.
Turcotte, D.L., Malamud, B.D., Guzzetti, F., Reichenbach, P., 2006.Self-organization, the cascade model and natural hazards. Proc.Natl. Acad. Sci. U. S. Am. 99 (1), 2530–2537.
Van Den Eeckhaut, M., Poesen, J., Govers, G., Verstraeten, G.,Demoulin, A., 2007. Characteristics of the size distribution ofrecent and historical landslides in a populated hilly region. EarthPlanet. Sci. Lett., 256 (3–4), 588–603.
Vanneste, M., Mienert, J., Bünz, S., 2006. The Hinlopen Slide: a giant,submarine slope failure on the northern Svalbard Margin, ArcticOcean. Earth Planet. Sci. Lett. 245 (1–2), 373–388.
Wolman, M.G., Miller, J.P., 1960. Magnitude and frequency of forcesin geomorphic processes. J. Geol. 68, 54–74.
60 A. Micallef et al. / Marine Geology 247 (2008) 46–60