scaling, normalizing, and per ratio standards: an...
TRANSCRIPT
Scaling, normalizing, and per ratio standards: an allometric modeling approach
ALAN M. NEVILL AND ROGER L. HOLDER School of Sport and Exercise Sciences and School of Mathematics and Statistics, University of Birmirtgham, Birmingham B15 2TT, United Kingdom
Nevill, Alan M., and Roger L. Holder. Scaling, nor- malizing, and per ratio standards: an allometric modeling approach. J. AppZ. PhysioZ. 79(3): 1027- 1031, 1995.-The practice of scaling or normalizing physiological variables (Y) by dividing the variable by an appropriate body size variable (X) to produce what is known as a “per ratio standard” (Y/ X), has come under strong criticism from various authors. These authors propose an alternative regression standard based on the linear regression of (Y) on (X) as the predictor variable. However, if linear regression is to be used to adjust such physiological measurements (Y), the residual errors should have a constant variance and, in order to carry out parametric tests of significance, be normally distributed. Un- fortunately, since neither of these assumptions appear to be satisfied for many physiological variables, e.g., maximum ox- ygen uptake, peak and mean power, an alternative approach is proposed of using allometric modeling where the concept of a ratio is an integral part of the model form. These allometric models naturally help to overcome the heteroscedasticity and skewness observed with per ratio variables. Furthermore, if per ratio standards are to be incorporated in regression mod- els to predict other dependent variables, the allometric or log-linear model form is shown to be more appropriate than linear models. By using multiple regression, simply by taking logarithms of the dependent variable and entering the loga- rithmic transformed per ratio variables as separate indepen- dent variables, the resulting estimated log-linear multiple- regression model will automatically provide the most appro- priate per ratio standard to reflect the dependent variable, based on the proposed allometric model.
allometry; log-linear models; heteroscedasticity; multiple re- gression
TANNER (27), followed by various other authors (12- 15), including most recently Toth et al. (28), have writ- ten about the problems associated with using a particu- lar type of ratio, sometimes referred to as “per ratio standards,” when scaling or normalizing the results of selected measurements in physiology and clinical medi- cine. In these disciplines, it is common practice to ex- press various measurements (Y), such as oxygen con- sumption (VO,) and cardiac output, as per-weight or per-surface area ratios, since by dividing by an appro- priate body-size variable (X) it is assumed that differ- ences due to the subject’s body size will have been re- moved, i.e., the ratio standard (Y/X) is assumed to have scaled or normalized the variable (YJ to be independent of the body-size variable (X).
In addition, Tanner (27) and supporters (12-14) ub-
served that many of these per ratio standards fail to render the measurements independent of body size, e.g., when maximum oxygen uptake (VQ~~; Vmin) is re- corded per body weight (ml l kg-’ m min- ‘) and then cor- related with body weight, a significant negative correla- tion is invariably found. Furthermore, these authors ar- gue that, if the ratio standard (Y/X) were a true linear proportion, then when the physiological variable (y> was regressed against the predictor body-size variable (X), the resulting linear regression equation should have an intercept statistic close to zero. Because this assumption is rarely satisfied, Tanner (27), and later Katch (X2) proposed an alternative regression standard to repre- sent the subject’s body size-adjusted measurement. These regression standards are obtained by adding to the group mean the subject’s residual error, taken from the regression line. Clearly, the assumptions associated with the use of regression standards as proposed by Tanner and supporters are 1) that the relationship be- tween (Y) and (X) is linear, i.e., given by
Y=a+b*X+t (1)
and 2) that the error term E has constant variance throughout the range of observations.
Toth et a1.(28) also advocate the use of regression standards when normalizing or adjusting peak irO, data (Y) for differences in fat-free mass (FFM; X). The variable FFM was chosen in preference to other body composition variables (e.g., body mass or fat mass), since it was found to be the best single predictor of peak VO,. When the linear regression model (Eq. I) was fitted separately to the 322 males (aged 17-78 yr) and 201 females (aged 18-81 yr), the intercept statis- tics for both males (-1.018 * 0.33) and females (-1.078 2 0.31) were significantly different from zero. The authors argue that the existence of significant in- tercept parameters justifies the use of regression stan- dards in preference to ratio standards.
In a recent article, Kronmal (15) restates Tanner’s concerns with the use of ratio standards. In addition, he draws attention to the work of Pearson (24) and, later, Neyman (23), who originally observed that spuri- ously high correlations are found between indexes that have a common component. The author goes on to rec- ommend that a ratio standard (Y/X) should only be incorporated into regression analyses as part of a full linear model when the constituent parts that make up the ratio, i.e., (Y) and (X- I), are also included as main
0161-7567195 $3.00 Copyright 0 1995 the American Physiological Society 1027
1028 SCALING: AN ALLOMETRIC MODELING APPROACH
effects, stating “it is not good practice to include inter- 7
actions in an equation without first including the vari- 4 ables that comprise it as first-order terms in the model.” As with the regression standard models pro- posed by Tanner (27) and Katch (13, 14), Kronmal(15) assumes that the models discussed in his article are linear with additive components and have an error term that has constant variance throughout the range of observations.
When using multilevel modeling procedures to inves- tigate the development of aerobic power in young ath- letes, Baxter-Jones et al, (3) also assume that VOW,, has an additive model and error structure. However, since VO, max is known to be proportional to body size, an additive model is unlikely to satisfactorily normalize . vo 2 max for differences in the chosen body-size variables. By observing their Table 3, the groups’ mean scores for
l
vo zmaxt
whether recorded in the units of liters per mi- nute or milliliters per kilogram per minute, appear to be related and proportional to their SD values.
ALLOMETRIC MODELING
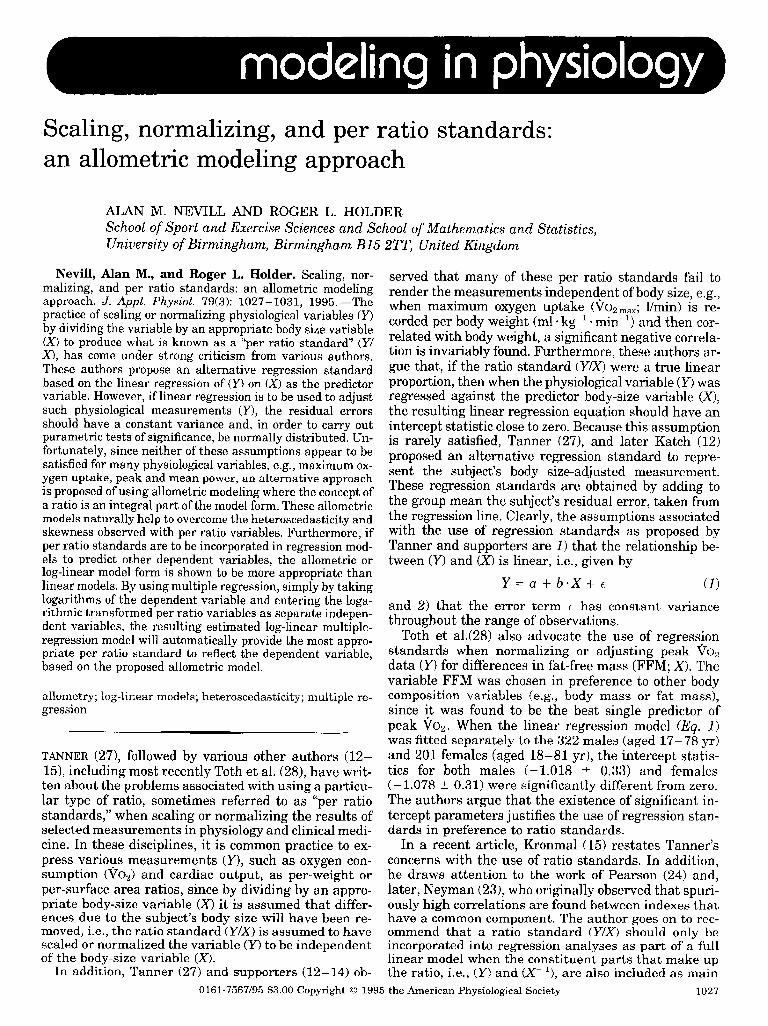
Caution should be exercised when using linear re- gression models to investigate the relationship between a ratio standard (Y/X) as the dependent variable and then incorporating a body-size variable (X) as an inde- pendent variable. These regression models will tend to produce biased results due to correlated random varia- tion in the dependent and independent variables and this is, in essence, the classic phenomenon of regression to the mean. Another possible cause for concern when using linear regression to model per ratio variables is that the variance of the error term may not be constant throughout the range of observations. This concern ap- pears to be justified when observing two of the exam- ples discussed above. In Fig. 1 in Toth et al. (28) and Table 3 in Baxter-Jones et al. (3), there is clear evidence of heteroscedasticity that contradicts an assumption of a constant error variance, i.e., in both these examples, the error variation appears to increase in proportion to
l
vo 2 max.
However, when considering such problems associ- ated with scaling and per ratio standards, a number of authors (e.g., see Refs. 5, 6, 9, 16, 17, 22, 25) have recognized the value of an important class of models, often referred to as LLallometric or power function mod- els.” For these models, the concept of a ratio is an inte- gral part of the model form, and the variables and er- rors are assumed to be proportional and multiplicative, respectively. Consequently, when a logarithmic trans- formation is applied, the model becomes a “log-linear
l
0 : I I I I I I i 1 I I
0 lo 20 30 40 50 60 70 80 90 100
Fat-Free Mass (kg)
FIG . 1. Maximum oxygen uptake (%2max) vs. fat-free 1,734 subjects from the Allied Dunbar National Fitness S
mass urvey.
for
Above all other reasons, a multiplicative model has a theoretical aptness in many scale- and size-related contexts. Indeed, as the dependent variable often cov- ers a theoretically unbounded order of magnitude and is, therefore, likely to produce a positively skewed dis- tribution, the logarithmic transformation will natu- rally provide both a linear model and a more symetri- tally distributed dependent variable.
With such a large age range, the heteroscedasticity observed in Fig. 1 of Tuth et al. (28) may have been partially caused by omitting the variable age. Indeed, when using the results from the Allied Dunbar National Fitness Survey (ADNFS; Ref. 26), Nevill and Holder (20) discovered that both body size and age were essential components in the vo2max regression models. When
l
vo 2max was plotted against estimated FFM for the ADNFS data (Fig* l), a similar pattern was observed to that of Toth et al. (28), suggesting that the two data sets are comparable. Estimated FFM was calculated from percentage body fat, the latter being derived by using the methods of Durnin and Womersley (8).
regression model.” In general, a log-linear (regression) model is a regression model in which the dependent ALLOMETRIC MODELS WITH PER RATIO STANDARD variable is log-transformed, and the independent vari- VARIABLES AS THE DEPENDENT VAFUABLES able terms are in a form that is linear in the unknown parameters. In its untransformed form, the model will Various authors have reported heteroscedasticity in be the product of the independent variable terms (e.g., their data (e.g., see Refs. 11,20-22) and have proposed power and exponential functions) and the error term. the allometric (or power function) model Standard regression methodology may be used to esti- mate the unknown parameters, provided the log of the
Y = a*Xb*c (2)
to explain such relationships explain the proportionality
Not on1 between
.y does the model the variables Y
error term is independent an tion with constant variance.
.d has a normal distribu-

SCALING: AN ALLUMETRIC MODELING APPROACH 1029
and X but the multiplicative error term is better able to describe the heteroscedasticity associated with such data. Support for the log-transformation of model (Q. 2) can be obtained by using transformation methods of Box and Cox (4). In the cases studied by Nevill and Holder (2Q, 21), when investigating the relationship between Vo2 max , body weight, lean body mass, and height, the logarithmic transformation was found to be the most successful at overcoming heteroscedasticity and providing normally distributed errors,
When scaling or normalizing various physiological measurements for individuals of different body size, Nevill et al. (22) proposed the power function ratio standard (Y/p), derived from the allometric model (Eq. 2) that would render the subject’s physiological perfor- mance variable (Y) independent of their body-size vari- able (X). The authors were able to confirm empirically [anticipated by Astrand and Rodahl (l)] that VO, MaX was proportional to body mass, &3, and hence should be scaled by recording Vo2 MaX in the units of (ml l kgAg3 . min-I) to be independent of body size. They were also able to demonstrate that both peak and mean power output (W) needed to be scaled by recording peak and mean power measured in (W l kg-‘j3) to be independent of body size.
Simply by taking logarithms of the power function ratio standard (Y/p), Nevill et al. (22) were able to show that further experimental design effects can be investigated using traditional analysis of variance methods. The same design effects can be obtained using the analysis of covariance, by analyzing log (Y) as the dependent variable, where the covariate log (X) would automatically adjust the numerator dependent vari- able to allow for their association. Further covariates can be easily incorporated in the allometric model, for example Nevill and Holder (20) incorporated the vari- able “age” as an exponential term that had the addi- tional operational advantages of providing a plausible asymptotic age decline in Vo2 max and, after a logarith- mic transformation, a linear model structure. The pro- posed model for Vogrnax was given by
l
VO 2 max = weightk l exp(c + d l age) l e (3)
that can be linearized with a log-transformation to pro- duce the following log-linear model
loge (vO2 max)
= k l log, (weight) + c + d 9 age + log, (c) (4)
When the log-linear model (Eq. 4) was fitted to the results of the ADNFS (26), by using standard linear regression methodology as implemented in MINITAB (18), the resulting solution explained R2 = 74.1% of the variation in 90, MaX. The fitted model retained just the single-exponent parameter for weight k = 0.66 (SE = 0.025) agreeing with the anticipated k = 2/3, based on theoretical and physiological grounds. The residual er- rors from fitting the log-linear model (Eq. 4) were also found to be acceptably normal when using the probabil- ity plot correlation test for normality (lo), also avail- able in MINITAB (18).
As mentioned above. the allometric model structure
can be easily extended to include further categorical and quantitative terms, For example, model in Eq. 3 can be developed to incorporate FFM in place of body weight and to include an additional age’ term, as follows
. vo 2 max = FFMk*exp(c + &age + e*age2). c (5)
After taking the log-transformation of model (Eq. 5), the log-linear model was then fitted to the results of the ADNFS (26) by using the methods of Nevill (19) that required a “developmental” component for body size. The resulting solution explained R2 = 75.3% of the variation in VoZmax. As before, the exponent for FFM was k = 0.66 (SE = 0.056), supporting the antici- pated parameter k = 2/3, based on theoretical and physi- ological grounds. The age’ term made a significant con- tribution to the model, and a subsequent examination of the fitted parameters indicated that iToZmax reached a peak in the subjects’ early 20s and subsequently de- clined thereafter. Once again, the residual errors from the lug-linear model (Eq. 5) were found to be acceptably normal when using the probability plot correlation test for normality.
When model in Eq. 5 was fitted to the ADNFS (26) data, omitting the age and age2 terms, the resulting solution explained R2 = 68.4% of the variation in . vo 2max3 with the exponent for the term FFM increasing implausibly to k = 1.06 (SE = 0.060). Indeed, when the model proposed by Toth et al. (28) was fitted to the male and female ADNFS subjects separately, by using the linear rather than allometric model, the resulting solution explained just R2 = 65.0% of the variation in . vo 2 max- Furthermore, the residuals from fitting this model were found to be nonnormal when the probabil- ity plot correlation test for normality was used, as de- scribed previously.
ALLOMETRIC MODELS INCORPORATING
PER UT10 STANDARD VARIABLES AS THE INDEPENDENT VARIABLES
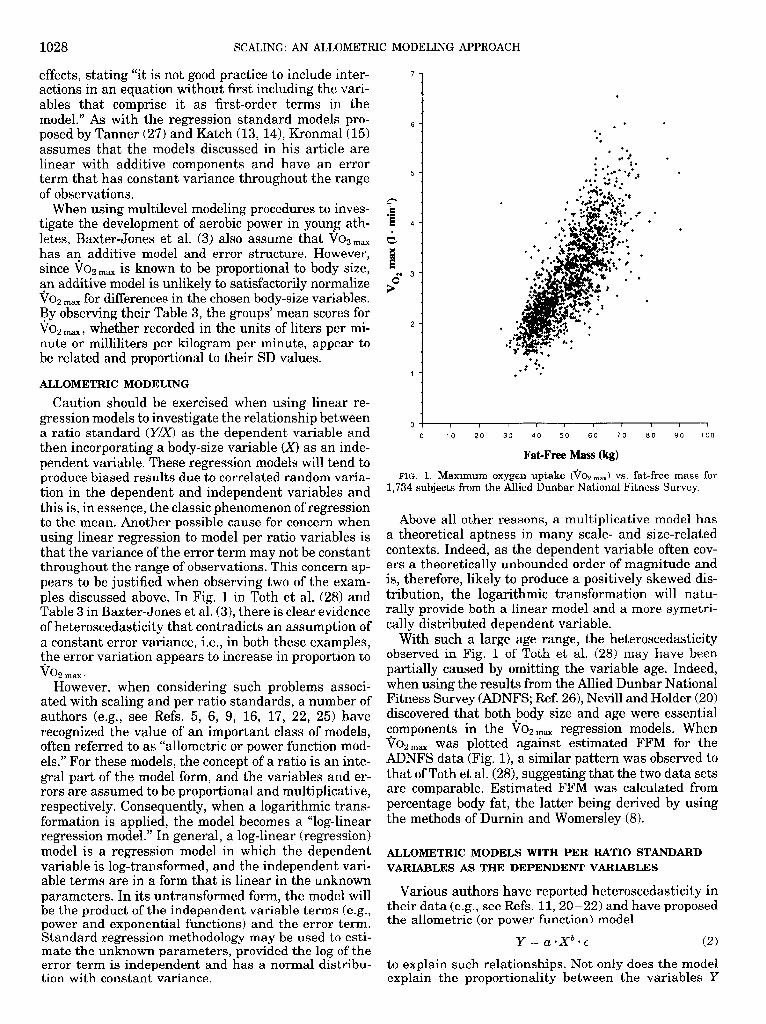
Because per ratio standard variables are known to be proportionally related, Nevill et al. (22) used the multiplicative allometric model (Eq. 6) to investigate the relationship between 5-km run speed (Z), Voamax (Y), and body weight (X) of 204 recreationally active subjects (n = 112 men; rz = 92 women)
2 (m/s) = a l Ybl* Xbz* c (6)
Support for the use of the multiplicative (allometric) model (Eq. 6) was obtained when running speed was plotted against iTo, max (Fig. 2), when heteroscedasticity was observed clearly for both the male and female sub- jects.
When we used Generalized Linear Interactive Model- ing (2) using multiple log-linear regression, we found no statistically significant differences between the male and female models for both the Vo2,, and the body mass a and b parameters. Hence, the common power function model relating 5-km running speed, 2 (~Js), to . vo 2max Y (l/min) and body mass X (kg) is given by
z (mfs) = 84.3 l yl-01,x-l-03 (7)

SCALING: AN ALLOMETRIC MODELING APPROACH 1030
6 -
5.5 -
5 -
3
.
I . 35-
k
3-
2.5 -
+ + + + + +
+ +
0 0 0
0
+
0
+ +
+ + + +
+ + 9
+t + + +
+ + + + +
+ male 0 female
1.5 2 2.5 3 3.5 4 4.5 5 5.5
vq max (1 l ms)
FIG. 2, Five-kilometer run speed (m/s> vs. VOW,,, for 204 recre- ationally active subjects (men: n = 112; women: IZ = 92).
The parsimonious solution given by Eq. 7 is both simple and meaningful. The fitted predictor of 5-km run times, when recorded as a rate of performance, i.e., mean running speed (m/s), is almost exactly propor- tional to the ratio standard V02max (l/min) divided by body mass (kg) or the well-known weight-related vo 2max (ml+kgpl* min-I). The alternative full linear model proposed by Kronmal (15) to describe the run- ning speed results 2 would be
Z = a + blgY + bz*X-l + b3qYaX-1 + e (8)
To compare the allometric log linear model (Eq. 6) with the equivalent full linear model (Eq. 8), the crite- rion of Cox (7) based on the difference between the two models’ maximized log-likelihoods was used. The maximized log-likelihood statistic for the allometric model (Eq. 6) was found to be -9.75 using just three parameters. In contrast, the maximized log-likelihood statistic for the full linear model (Eq. 8) was less at - 11.21 requiring four parameters, suggesting the su- periority of the allometric model (Eq. 6) over the linear model (Eq. 8). However, it is also important to note that, although model in Eq. 8 fits the data moderately well, it has no obvious physiological interpretation, un- like-the allometric model (Eq. 6).
DISCUSSION
The use of per ratio standards has come under strong criticism from a number of authors, most recently in articles by Toth et al. (28). These authors argue that rather than using a per ratio standard as the depen-
dent variable in a regression analysis, the numerator of the per ratio standard alone should be defined as the dependent variable, allowing the denominator (body size) variable to be incorporated as a covariate (inde- pendent variable) in the regression model. From the fitted regression model, a regression standard can be obtained.
If linear regression methods are to be adopted when scaling or normalizing physiological variables, an im- portant assumption associated with such methods is that the residual errors should have a constant vari- ance. Furthermore, in order to carry out parametric tests of significance, it is necessary that these errors should have a normal distribution. Unfortunately, nei- ther of these requirements appear to be satisfied for body-size-related variables such as i702 MBX. It would appear that allometric models are more appropriate for investigating such body-size-related variables. As well as their theoretical aptness, these types of models natu- rally overcome the heteroscedasticity associated with per ratio variables and produce normally distributed residual errors,
More generally, if per ratio standards are to be incor- porated in regression models as independent variables, the allometric model form, e.g., Eq. 6, should be consid- ered. This can be achieved simply by taking logarithms of the performance-dependent variable and entering the logarithmic transformed physiological and body- size variables as separate independent variables in a multiple log-linear regression. The logarithmic trans- formation appears to overcome the problems associated with linear regression, i.e., heteroscedasticity and non- normality, and the resulting log-linear multiple regres- sion model will automatically provide the most appro- priate fitted per ratio standard to reflect the dependent variable.
The authors thank The Sports Council and the Health Education Authority (United Kingdom) for access and permission to publish the results from the Allied Dunbar National Fitness Survey. We are also grateful to the editor and the three referees for their valuable suggestions in revising the manuscript.
Address for reprint requests: School of Sport and Exercise Sci- ences, Univ, of Birmingham, Edgbaston, Birmingham B15 ZTT, United Kingdom.
Received 25 July 1994; accepted in final form 4 May 1995.
REFERENCES
1.
2.
3.
4.
5.
6.
Astrand, P.-O., and K. Rodahl. Textbook of Work Physiology (3rd ed.). New York: McGraw-Hill, 1986. Baker, R. J., and J. A. Nelder. Generalized Linear Interactive Modelling, Release 3. Oxford, UK: Numerical Algorithms Group, 1978. Baxter-Jones, A, H- Goldstein, and P. Helms. The develop- ment of aerobic power in young athletes. J. Appl. Physiol. 75: 1160-1167, 1993. Box, G. E. P., and D. R. Cox. An analysis of transformations (with Discussion). J. R. Statist. Sot, B 26: 211-252, 1964. Butler, J. P., H. A. Feldman, and J. J. Fredberg. Dimension analysis does not determine a mass exponent for metabolic scal- ing. Am. J. Physiol. 245 (Regulatory Integrative Camp. Physiol. 14): R195-R199, 1987. Calder, W, A., III, Size, Function, artd Life History. Cambridge, MA: Harvard Univ. Press, 1984.

SCALING: AN ALLOMETRIC MODELING APPROACH 1031
7. Cox, D. R. Further results on tests of separate families of hy- otheses. J. R. Statist. Sot. B 24: 406-424, 1962.
8. Durnin, J. V., and J. Womersley. Body fat assessed from total body density and its estimation from skinfold thickness measure- ments on 481 men and women aged 16 to 72 years. Br. J. Nutr. 32: 77-85, 1974.
9. Feldman, H. A. On the allometric mass exponent, when it ex- ists. J. Theor. Biol. 172: 187-197, 1995.
10. Filliben, J. J. The probability plot correlation coefficient test for normality. Technometrics 17: 111-117, 1975.
‘Il. Jolicoeur, H., and A. A. Heusner. The allometry equation in the analysis of the standard oxygen consumption and body weight of the white rat. Biometrics 27: 841-855, 1971.
12. Katch, V. L. Correlation v ratio adjustment of body weight in exercise-oxygen studies. Ergonomics 15: 671-680, 1972.
13. Katch, V. L. Use ofthe oxygenfbody weight ratio in correlational analyses: spurious correlations and statistical considerations. Med. Sci. Sports Exercise 5: 253-257, 1973.
14. Katch, V. L., and F. I. Katch, Use of weight-adjusted oxygen uptake scores that avuid spurious correlations. Res. Q. 4: 447- 451, 1974.
15. Kronmal, R. A. Spurious correlation, and the fallacy of ratio standard revisited. J. R. Statist. Sot. A 156: 379-392, 1993.
16. McMahon, T. A, ilk&es, Reflexes, and Locomotion. Princeton, NJ: Princeton Univ. Press, 1984.
17. McMahon, T. A, and J. T. Bonner. On Size and Life. New York: Scientific American Books, 1983.
18, MINITAB, Inc. MINITAB Reference Manual. 1989.
19. Nevill, A. RI. The need to scale for differences in body size and mass: an explanation of Kleiber’s 0.75 mass exponent. J. A& Physiol. 77: 2870-2873, 1994.
20. Nevill, A. M., and R. L. Holder. Modelling maximum oxygen uptake: a case study in non-linear regression formulation and comparison. Appl. Statist. 43: 653-666, 1994.
21, Nevill, A, Mb, and R, L, Holder, Body mass index: a measure of fatness OL” leanness? Br. J. Nutr. 73: 507-516.
22. Nevill, A. M., R. Ramsbottom, and C. Williams. Scaling phys- iological measurements for individuals of different body size. Eur. J. Ap& Physiol. Occup. Physiol. 65: 110-117, 1992.
23. Neyman, J. Lectures and Conferences on MuthematicaZ Stutis- tics and ProbabiZity (2nd ed.). Washington, DC: US Department of Agriculture, 1952, p. 143-154.
24. Pearson, K. Mathematical contributions to the theory of evolu- tion-on a form of spurious correlation which may arise when indices are used in the measurement of organs. Proc. R. Sot. Lond. 60: 489-497, 1897.
25. Schmidt-Nielsen, K. Scaling: Why Is Animal Size so Im- purtant? Cambridge, UK: Cambridge Univ. Press, 1984.
26. Sports Council. AlLied Dunbar National Fitness Survey: Muin Findings. London: Sports Council, 1992.
27. Tanner, J. M. Fallacy of per-weight and per-surface area stan- dards and their relation to spurious correlations. J. A&. Phys- io2. 2: 1-15, 1949.
28. Toth, M. J., M. I. Goran, P. A. Ades, D. B, Howard, and E. T. Poehlman. Exapination of data normalization procedures for expressing peak VO* data. J. Appl. Physiol. 75: 2288-2292,1993.