scams in australia 2014 - uc home - university of canberra report__final.pdf · scams in australia...
TRANSCRIPT
Scams in Australia – 2014 (Jan – Oct) – The year in Review 1
Scams in Australia – 2014 A SNAP SHOT OF ACCC SCAM DATA DEMOGRAPHICS
Key Findings
• The total amount lost from reported scams in 2014 (January to October) was $64,526,285.00 This represents $5.20 for every Australian internet user.
• The most successful type of reported scam was Dating and Romance, with victims losing $20,621,435.00
• The second most successful type of reported scam was Jobs and Investment, with victims losing $19,247,914.00
• Victorian males were the highest representative group for reported scams, losing a combined $7,007,348.00.
• The highest losses occurred when the victim was approached via the internet, followed by phone and email.
Findings by Demographics and Federal Electorates
• Dating & Romance scams – Victorian females aged 45 – 54 suffered the highest reported losses. The Federal electorate with the highest number of this demographic is Calwell. This seat is represented by Ms Maria Vamvakinou MP.
• Jobs & Investment scams – Victorian males aged 45 – 54 suffered the highest reported losses. The Federal electorate with the highest number of this demographic is McEwen. This seat is represented by Mr Rob Mitchell MP.
• Buying, Selling or Donating scams – Victorian males aged 25 – 34 suffered the highest reported losses. The Federal electorate with the highest number of this demographic is Melbourne. This seat is represented by Mr Adam Bandt MP.
January 2015 – ISBN 978-1-922017-08-6

Scams in Australia – 2014 (Jan – Oct) – The year in review 2
• Unexpected Money scams – Victorian males aged 35 – 44 suffered the highest reported losses. The Federal electorate with the highest number of this demographic is Lalor. This seat is represented by Ms Joanne Ryan MP.
• Attempts to Gain Personal Information scams – West Australian males aged 35 – 44 suffered the highest reported losses. The Federal electorate with the highest number of this demographic is Fremantle. This seat is represented by The Hon Melissa Parke MP.
• Unexpected Prize scams – Victorian females aged 55 – 64 suffered the highest reported losses. The Federal electorate with the highest number in this demographic is Flinders. This seat is represented by The Hon Greg Hunt MP.
• Threats & Extortion scams – Queensland females aged 45 – 54 suffered the highest reported losses. The Federal electorate with the highest number in this demographic is Leichhardt. This seat is represented by The Hon Warren Entsch MP.
Overview The following graph lists the reported amounts lost (in blue) for all scam categories from each state and territory. The graph has the state/territory population (in red), giving an indication of per capita losses.
0
2,000,000
4,000,000
6,000,000
8,000,000
10,000,000
12,000,000
14,000,000
16,000,000
18,000,000
20,000,000
ACT NSW NT QLD SA TAS VIC WA
Amount lost
Population

Scams in Australia – 2014 (Jan – Oct) – The year in Review 3
The following graph lists the successful contact methods used by scammers. Whilst internet contact is the most successful, it is closely followed by phone and email contact.
The following graph lists the two highest amounts reported lost for each scam category, disected for age group.
Type of Scam Australian demographic suffering the highest reported losses Amount
Dating & Romance Females aged 45 – 54 $3,664,273.00
Males aged 45 – 54 $1,511,673.00
Jobs & Investments Males aged 45 - 54 $2,580,584.00
Males aged 55 - 64 $1,408,278.00
Buying, Selling or Donating Males aged 25 - 34 $1,090,481.00
Males aged 35 - 44 $993,344.00
Unexpected Money Males aged 35 – 44 $858,440.00
Males aged 65 and over $827,047.00
Attempts to Gain Personal Information Females aged 35 – 44 $191,821.00
Males aged 25 - 34 $153,393.00
Unexpected Prize Females aged 55 – 64 $199,280.00
Males aged 65 and over $58,338.00
Threats & Extortion Females aged 45 - 54 $379,594.00
Females aged 55 - 64 $128,671.00
internet
phone
social networking
other

Scams in Australia – 2014 (Jan – Oct) – The year in review 4
The following graph lists the two highest amounts reported lost for each scam category, disected for state/territory and age group. It provides a breakdown of significant losses for each scam against key demographics.
Type of Scam State/Territory demographic suffering the highest reported losses Amount
Dating & Romance Victorian females aged 45 – 54 $1,369,500.00
New South Wales males aged 45 – 54 $563,881.00
Jobs & Investments Victorian males aged 45 - 54 $852,124.00
Queensland males aged 55 - 64 $540,219.00
Buying, Selling or Donating Victorian males aged 25 - 34 $197,912.00
Victorian males aged 35 - 44 $250,365.00
Unexpected Money Victorian males aged 35 – 44 $194,674.00
Queensland males aged 65 and over $342,534.00
Attempts to Gain Personal Information West Australian females aged 35 – 44 $59,209.00
West Australian males aged 25 - 34 $70,543.00
Unexpected Prize Victorian females aged 55 – 64 $151,227.00
Victorian males aged 65 and over $31,341.00
Threats & Extortion Queensland females aged 45 - 54 $261,980.00
Queensland females aged 55 - 64 $94,177.00

Scams in Australia – 2014 (Jan – Oct) – The year in Review 5
Introduction
Technology and the internet have allowed people to enrich their lives, buy and sell commerce, and communicate globaly. But while the online environment has enhanced our lives, unfortunately criminals, including those who wish to ‘scam’ us, also frequent the same sites. The more people connect online, the greater the need to understand the implications of online security, safety, and privacy. A scam is a dishonest attempt to trap you into parting with your money. Scammers target people of all backgrounds, ages and income levels across Australia, and globally. A scam looks legitimate and appears to meet your need or desire.
As the figures in this report demonstrate, all demographics across Australia have reported losing money due to falling victim to a variety of scams. Some are more insidious that others, but all are successful to varying degrees.
Not having a safe and trustworthy online experience diminishes our desire to fully embrace all the benefits of the internet and associated technologies. E-commerce providers and social networking sites need to do much more to reduce the likelihood of their users falling prey to scammers
Methodology
This report uses data provided by the Australian Competition & Consumer Commission (ACCC). The data was provided in a disagregated form such that individual complainants could not be identified. Only data with
complete identified demographics was used in this analysis. The author is extremely grateful for this material. This report analyses nearly 80,000 self reported cases of scams (though the large majority of these reports indicated no monetary loss).
About the Author Nigel Phair is an influential analyst on the intersection of technology, crime and society. He has published two acclaimed books on the international impact of cybercrime, is a regular media commentator and provides executive advice on cyber security issues. In a 21 year career with the Australian Federal Police he achieved the rank of Detective Superintendent and headed up investigations at the Australian High Tech Crime Centre for four years.
About the Centre for Internet Safety
The Centre for Internet Safety at the University of Canberra was created to foster a safer, more trusted Internet by providing thought leadership and policy advice on the social, legal, political and economic impacts of cybercrime and threats to cyber security.
The Centre for Internet Safety is hosted within the Faculty of Law at the University of Canberra. The University of Canberra is Australia's capital university and focuses on preparing students for a successful and rewarding career.
www.canberra.edu.au/cis

Scams in Australia – 2014 (Jan – Oct) – The year in review 6
The results are divided into seven categories with statistics focusing on the actual amount reported lost due to a scam.
The figures are unable to be corroborated with any other sources and as they rely on self-reporting. It is difficult to determine if this is the true cost to Australian’s of scams, but it is likely this is a small amount of the actual amount lost.
The analysis breaks down age groups and gender, with each category listing dollar amount lost, the key demographic and state/territory of the highest losses.
Each category also lists the two most successful methods used by scammers to approach victims. The lowest representative demographic to be susceptible to scams was under 18’s, though this could be due to a lack of knowledge to self-report such incidents. Age group statistics are gathered from the Australian Bureau of Statistics, Australian Demographic Statistics, June quarter, 2014.
Background
Scams, in many shapes and sizes have been successfully used since the beginning of commerce. Over time some have been more successful than others, whilst some scams have morphed over time. What has changed the dynamic is the use of technology and the always-connected lifestyle which many now enjoy.
In 2012–13, 83% of persons were internet users. The 15 to 17 years age group had the highest proportion of internet users (at 97%) compared to the older persons age group (65 or over) with the lowest proportion of internet users (at 46%). Almost every
internet user (97%) accessed the internet from home during 2012–13.
The next most popular locations to go online (using supplied equipment) were work (49%) and neighbour's, friend's or relative's houses (41%).1
At June 2013, 10.81 million people went online more than once a day, a 72 per cent increase from June 2008. There were 31.09 million mobile services in operation and 14.24 million Australians had access to the internet in their home.
Internet users also performed more activities online, with 43 per cent undertaking five or more separate online activities.2
There were 12,483,000 internet subscribers in Australia at the end of June 2014, an increase of 1% from the end of June 2013. As at 30 June 2014, over 98% of internet connections were broadband.3
The following are breakdown results of each category where the ACCC collects data.
1 ABS. Personal Internet Use. http://www.abs.gov.au/ausstats/[email protected]/Lookup/8146.0Chapter32012-13 2 ACMA. Australia’s mobile digital economy – ACMA confirms usage, choice, mobility and intensity on the rise. http://www.acma.gov.au/theACMA/Library/Corporate-library/Corporate-publications/australia-mobile-digital-economy 3 ABS. Type of access connection. http://www.abs.gov.au/ausstats/[email protected]/mf/8153.0/

Scams in Australia – 2014 (Jan – Oct) – The year in Review 7
Dating & Romance
Dating and romance scams are particularly convincing because they appeal to a persons romantic or compassionate side. Scammers set up fake profiles on dating and social networking sites, often using the disguise of beautiful pictures and the story of being a successful business person working overseas. They play on emotional triggers to get people to provide money, gifts or personal details.
• The total amount reported lost in 2014 due to this type of scam was $20,621,435.00.
• The highest loss ($3,664,273.00, and nearly 17% of category losses) was by Females aged 45 – 54. This demographic represents 6.7% of the Australian population. Specifically, Victorian females aged 45 – 54 lost $1,369,500.00.
• The second highest loss ($1,511,673.00, and 7% of category losses) was Males aged 45 – 54. This age bracket represents 6.5% of the Australian population.
The highest losses ($4,131,160.00, and 20% of category losses) occurred when the victim was approached via social networking sites, with the second highest losses ($4,104,498.00, and nearly 20% of category losses) occurred when the victim was approached via email. The chart below represents all Australian reported losses per age group and gender.
0
500,000
1,000,000
1,500,000
2,000,000
2,500,000
3,000,000
3,500,000
4,000,000
M u18
F 18 -‐ 24
M 18 -‐ 24
F 25 -‐ 34
M 25 -‐ 34
F 35 -‐ 44
M 35 -‐ 44
F 45 -‐ 54
M 45 -‐ 54
F 55 -‐ 64
M 55 -‐ 64
F 65 +
M 65 +

Scams in Australia – 2014 (Jan – Oct) – The year in review 8
Jobs and Investment
This category includes investment schemes (for example use highly sophisticated websites to trick people into thinking investment offers are legitimate. Scammers claim that the investment will provide attractive returns and use high-pressure sales tactics); pyramid schemes (for example where you are asked to pay to join. The only way to ever recover any money is to convince other people to join up and to part with their money as well); employment scams (for example where you are promised an inflated income for little effort or scammers demand an upfront payment before the job is yours. These scams can involve people engaging in money laundering, which is a crime).
• The total amount reported lost in 2014 due to this type of scam was $19,247,914.00.
• The highest loss ($2,580,584.00, and 13% of category losses) was by Males aged 45 - 54. This age bracket represents 6.5% of the Australian population. Specifically, Victorian males aged 45 – 54 lost $852,124.00
• The second highest loss ($1,408,278.00, and 7% of category losses) was by Males aged 55 - 64. This age bracket represents 5.6% of the Australian population.
The highest losses ($9,138,810.00, and 47% of category losses) occurred when the victim was approached via phone, with the second highest losses ($1,917,906.00, and nearly 10% of category losses) occurring when the victim was approached via email. The chart below represents all Australian reported losses per age group and gender.
0
500000
1000000
1500000
2000000
2500000
3000000
F u18
M u18
F 18 -‐ 24
M 18 -‐ 24
F 25 -‐ 34
M 25 -‐ 34
F 35 -‐ 44
M 35 -‐ 44
F 45 -‐ 54
M 45 -‐ 54
F 55 -‐ 64
M 55 -‐ 64
F 65 +
M 65 +
Scams in Australia – 2014 (Jan – Oct) – The year in Review 9
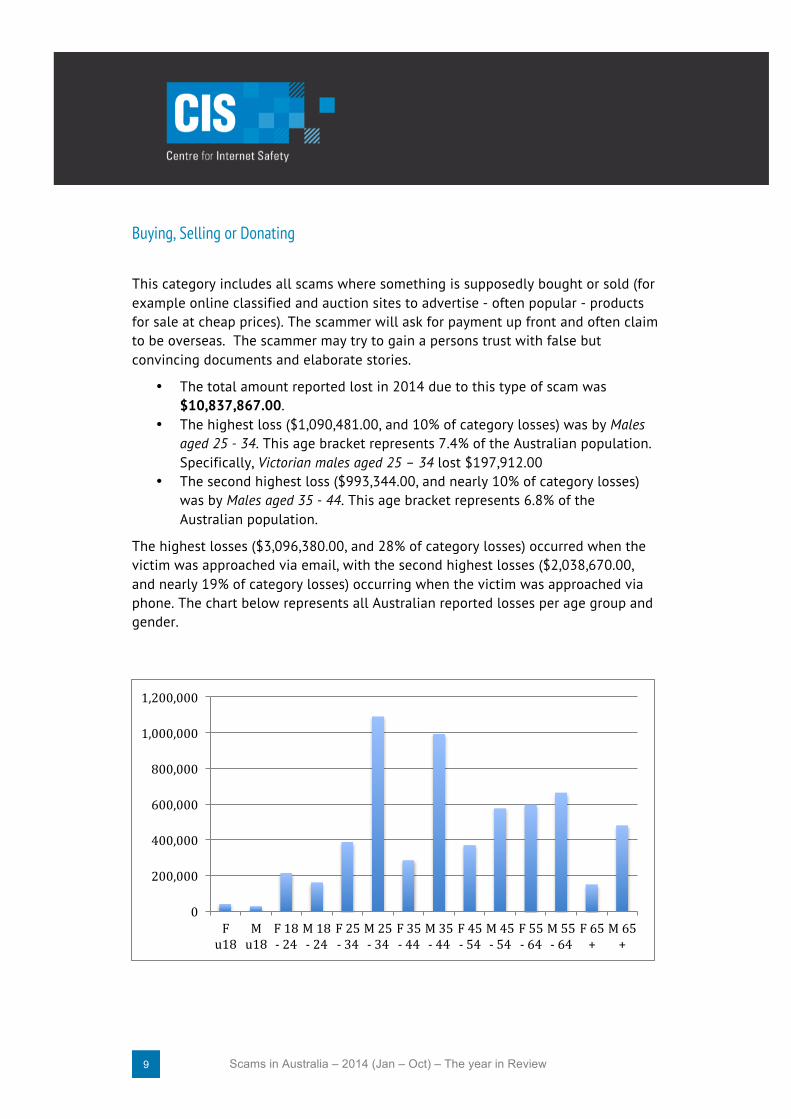
Buying, Selling or Donating
This category includes all scams where something is supposedly bought or sold (for example online classified and auction sites to advertise - often popular - products for sale at cheap prices). The scammer will ask for payment up front and often claim to be overseas. The scammer may try to gain a persons trust with false but convincing documents and elaborate stories.
• The total amount reported lost in 2014 due to this type of scam was $10,837,867.00.
• The highest loss ($1,090,481.00, and 10% of category losses) was by Males aged 25 - 34. This age bracket represents 7.4% of the Australian population. Specifically, Victorian males aged 25 – 34 lost $197,912.00
• The second highest loss ($993,344.00, and nearly 10% of category losses) was by Males aged 35 - 44. This age bracket represents 6.8% of the Australian population.
The highest losses ($3,096,380.00, and 28% of category losses) occurred when the victim was approached via email, with the second highest losses ($2,038,670.00, and nearly 19% of category losses) occurring when the victim was approached via phone. The chart below represents all Australian reported losses per age group and gender.
0
200,000
400,000
600,000
800,000
1,000,000
1,200,000
F u18
M u18
F 18 -‐ 24
M 18 -‐ 24
F 25 -‐ 34
M 25 -‐ 34
F 35 -‐ 44
M 35 -‐ 44
F 45 -‐ 54
M 45 -‐ 54
F 55 -‐ 64
M 55 -‐ 64
F 65 +
M 65 +

Scams in Australia – 2014 (Jan – Oct) – The year in review 10
Unexpected Money
This category includes Inheritance scams (for example when a scammer contacts a person unexpectedly to tell them they’ve been left, or are entitled to claim, a large inheritance from a distant relative or wealthy benefactor who has died overseas); Nigerian scams (for example upfront payment or money transfer scam. They are called Nigerian scams because the first wave appeared to emerge from Nigeria); Reclaim scams (for example when a scammer contacts a victim pretending to be from the government or a bank and ask for an upfront fee to reclaim money); and other upfront or advance fee frauds (for example where a scammer gets a victim to make an advance payment for promises that never materialise).
• The total amount reported lost in 2014 due to this type of scam was $8,958,547.00.
• The highest loss ($858,440.00, and nearly 10% of category losses) was by Males aged 35 – 44. This age bracket represents 6.8% of the Australian population. Specifically, Victorian males aged 35 – 44 lost $194,674.00
• The second highest loss ($827,047.00, and 9% of category losses) was by Males aged 65 and over. This age bracket represents 6.8% of the Australian population.
The highest losses ($3,414,276.00, and 38% of category losses) occurred when the victim was approached via email, with the second highest losses ($2,438,954.00, and 27% of category losses) occurring when the victim was approached via phone. The chart below represents all Australian reported losses per age group and gender.
0 100000 200000 300000 400000 500000 600000 700000 800000 900000 1000000
F u18
M u18
F 18 -‐ 24
M 18 -‐ 24
F 25 -‐ 34
M 25 -‐ 34
F 35 -‐ 44
M 35 -‐ 44
F 45 -‐ 54
M 45 -‐ 54
F 55 -‐ 64
M 55 -‐ 64
F 65 +
M 65 +
Scams in Australia – 2014 (Jan – Oct) – The year in Review 11
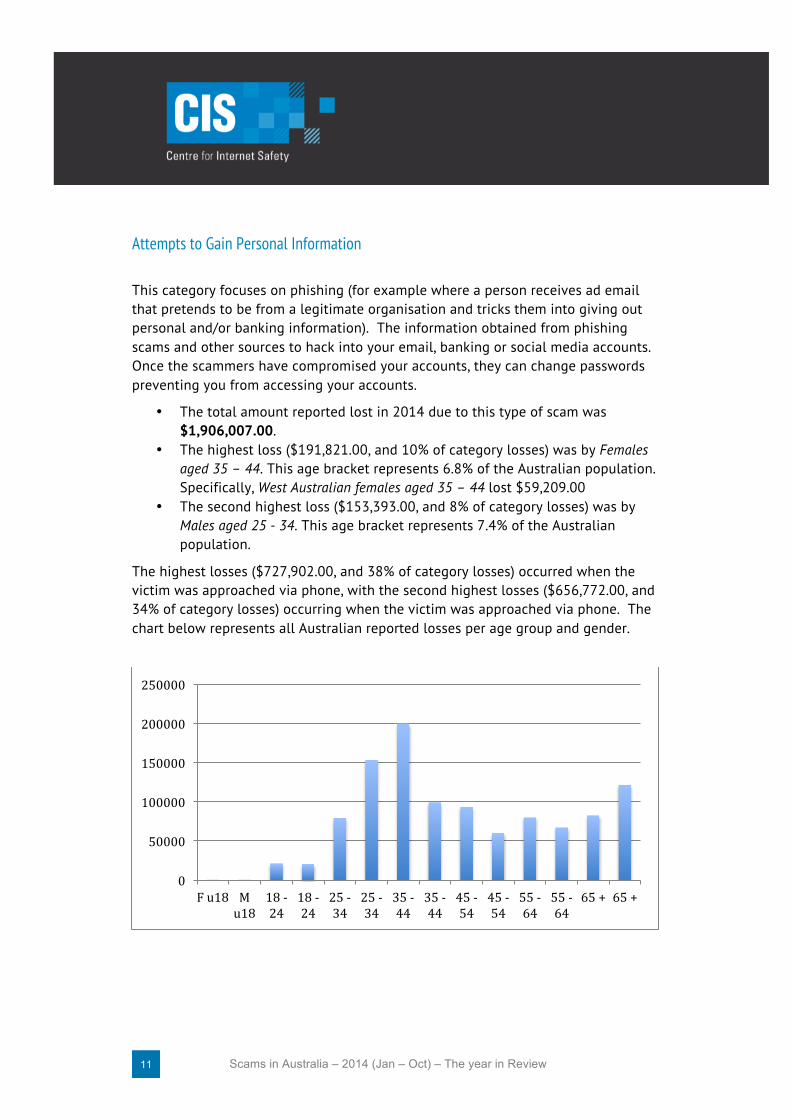
Attempts to Gain Personal Information
This category focuses on phishing (for example where a person receives ad email that pretends to be from a legitimate organisation and tricks them into giving out personal and/or banking information). The information obtained from phishing scams and other sources to hack into your email, banking or social media accounts. Once the scammers have compromised your accounts, they can change passwords preventing you from accessing your accounts.
• The total amount reported lost in 2014 due to this type of scam was $1,906,007.00.
• The highest loss ($191,821.00, and 10% of category losses) was by Females aged 35 – 44. This age bracket represents 6.8% of the Australian population. Specifically, West Australian females aged 35 – 44 lost $59,209.00
• The second highest loss ($153,393.00, and 8% of category losses) was by Males aged 25 - 34. This age bracket represents 7.4% of the Australian population.
The highest losses ($727,902.00, and 38% of category losses) occurred when the victim was approached via phone, with the second highest losses ($656,772.00, and 34% of category losses) occurring when the victim was approached via phone. The chart below represents all Australian reported losses per age group and gender.
0
50000
100000
150000
200000
250000
F u18 M u18
18 -‐ 24
18 -‐ 24
25 -‐ 34
25 -‐ 34
35 -‐ 44
35 -‐ 44
45 -‐ 54
45 -‐ 54
55 -‐ 64
55 -‐ 64
65 + 65 +
Scams in Australia – 2014 (Jan – Oct) – The year in review 12
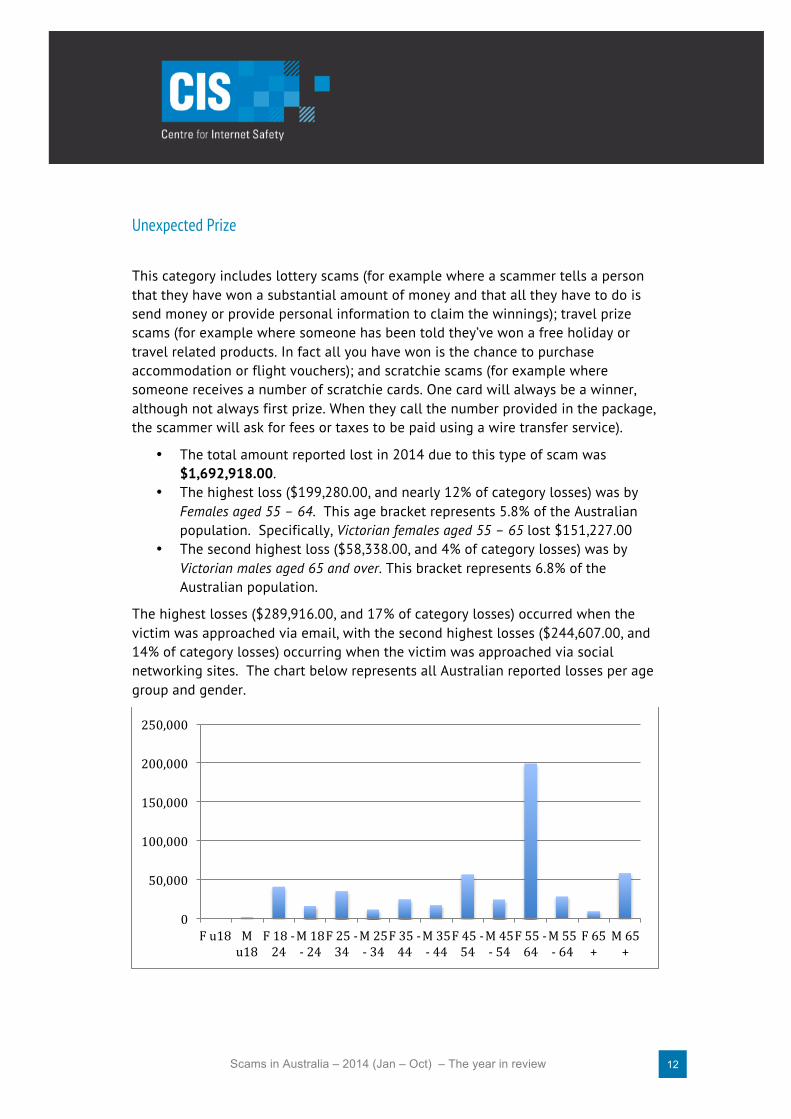
Unexpected Prize
This category includes lottery scams (for example where a scammer tells a person that they have won a substantial amount of money and that all they have to do is send money or provide personal information to claim the winnings); travel prize scams (for example where someone has been told they’ve won a free holiday or travel related products. In fact all you have won is the chance to purchase accommodation or flight vouchers); and scratchie scams (for example where someone receives a number of scratchie cards. One card will always be a winner, although not always first prize. When they call the number provided in the package, the scammer will ask for fees or taxes to be paid using a wire transfer service).
• The total amount reported lost in 2014 due to this type of scam was $1,692,918.00.
• The highest loss ($199,280.00, and nearly 12% of category losses) was by Females aged 55 – 64. This age bracket represents 5.8% of the Australian population. Specifically, Victorian females aged 55 – 65 lost $151,227.00
• The second highest loss ($58,338.00, and 4% of category losses) was by Victorian males aged 65 and over. This bracket represents 6.8% of the Australian population.
The highest losses ($289,916.00, and 17% of category losses) occurred when the victim was approached via email, with the second highest losses ($244,607.00, and 14% of category losses) occurring when the victim was approached via social networking sites. The chart below represents all Australian reported losses per age group and gender.
0
50,000
100,000
150,000
200,000
250,000
F u18 M u18
F 18 -‐ 24
M 18 -‐ 24
F 25 -‐ 34
M 25 -‐ 34
F 35 -‐ 44
M 35 -‐ 44
F 45 -‐ 54
M 45 -‐ 54
F 55 -‐ 64
M 55 -‐ 64
F 65 +
M 65 +

Scams in Australia – 2014 (Jan – Oct) – The year in Review 13
Threats and Extortion This category includes ransonware and malicious software (for example where a scammer places harmful software onto a persons computer). Malware can give scammers access to the users computer, collect personal information or just cause damage to the computer. Ransomware expands on this by offering to desist if the user pays a sum of money.
• The total amount reported lost in 2014 due to this type of scam was $1,228,282.00.
• The highest loss ($379,594.00, and 31% of category losses) was by Females aged 45 - 54. This age bracket represents 6.7% of the Australian population. Specifically, Queensland females aged 45 – 54 lost $261,980.00
• The second highest loss ($128,671.00, and 10% of category losses) was by Females aged 55 - 64. This age bracket represents 5.8% of the Australian population.
The highest losses ($455,695.00, and 37% of category losses) occurred when the victim was approached via email, with the second highest losses ($172,119.00, and 14% of category losses) occurring when the victim was approached via the internet. The chart below represents all Australian reported losses per age group and gender.
0
50000
100000
150000
200000
250000
300000
350000
400000
F u18 M u18
F 18 -‐ 24
M 18 -‐ 24
F 25 -‐ 34
M 25 -‐ 34
F 35 -‐ 44
M 35 -‐ 44
F 45 -‐ 54
M 45 -‐ 54
F 55 -‐ 64
M 55 -‐ 64
F 65 +
M 65 +

Scams in Australia – 2014 (Jan – Oct) – The year in review 14
Safety Tips
Getting educated and taking a few basic steps may well stop Australian internet users from becoming a victim of scams – and save a great deal of time and trouble. Citizens can also help to protect thier family and community by reporting suspicious activities to SCAMwatch via: https://www.scamwatch.gov.au/content/index.phtml/itemId/694011 The latest advice on scam tools and techniques can be found at SCAMwatch via: http://www.scamwatch.gov.au/content/index.phtml/itemId/693900 Some simple advice to avoid becoming a victim of scams:
• Use a spam blocker and don't reply to spam. • Don’t click on links. • Don't open any attachments you weren't expecting. • Keep your antivirus software updated. • Keep your computer's firewall on.