scan in rank-size graph mature urban systems – like us – nearly linear relationship primate...
TRANSCRIPT
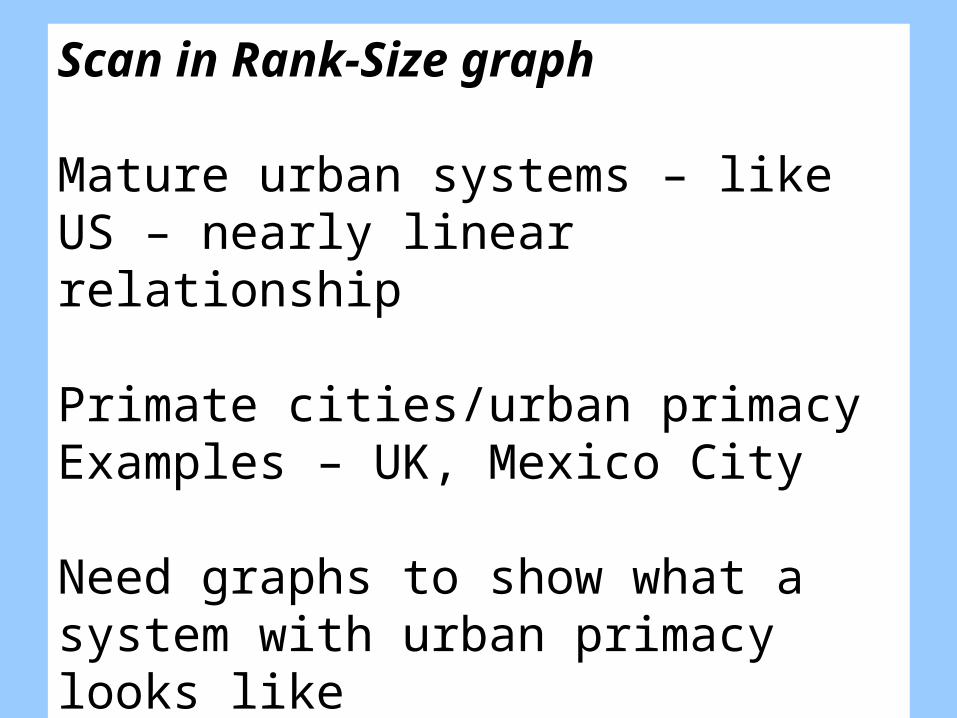
Scan in Rank-Size graph
Mature urban systems – like US – nearly linear relationship
Primate cities/urban primacyExamples – UK, Mexico City
Need graphs to show what a system with urban primacy looks like
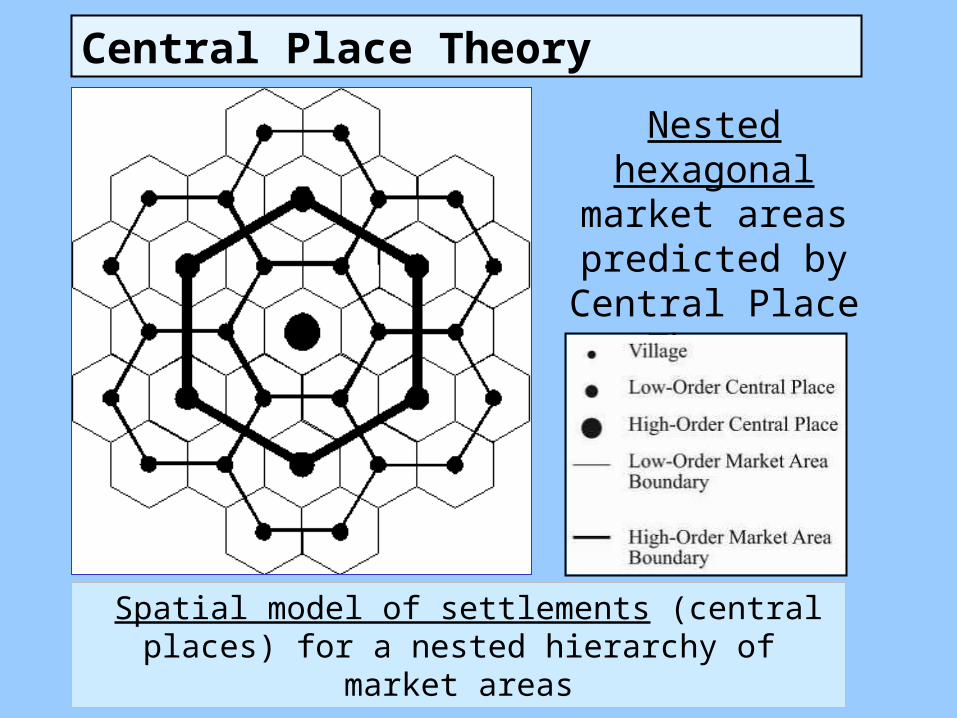
Nested hexagonal
market areaspredicted by Central Place
Theory
Central Place Theory
Spatial model of settlements (central places) for a nested hierarchy of market areas
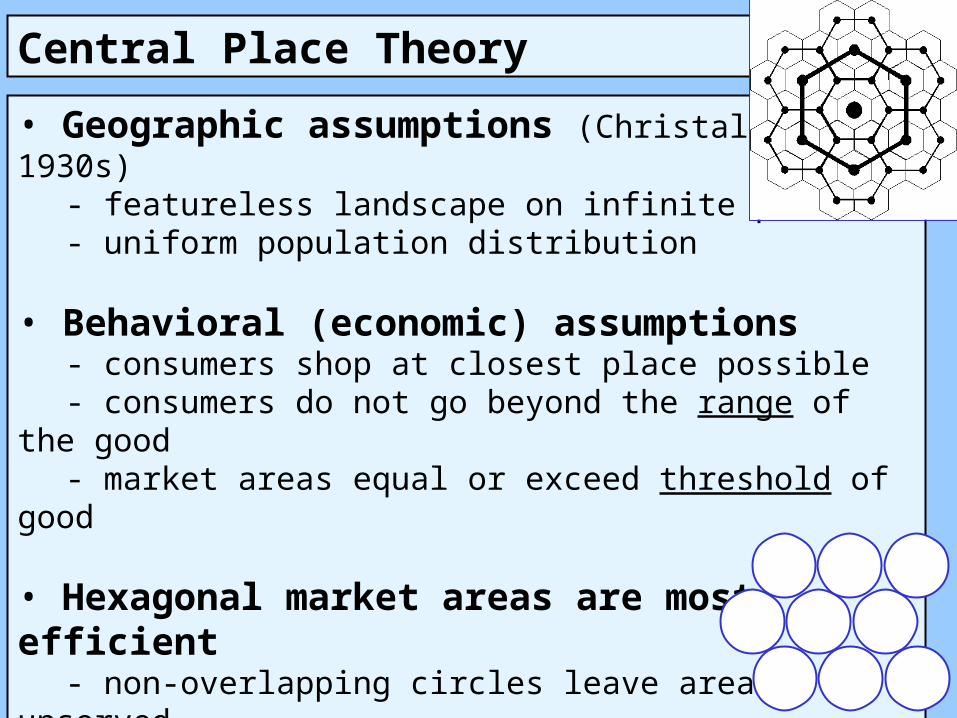
Central Place Theory
• Geographic assumptions (Christaller, 1930s)- featureless landscape on infinite plane- uniform population distribution
• Behavioral (economic) assumptions- consumers shop at closest place possible- consumers do not go beyond the range of the good- market areas equal or exceed threshold of good
• Hexagonal market areas are most efficient
- non-overlapping circles leave areas unserved- higher-order central places also provide lower-order functions
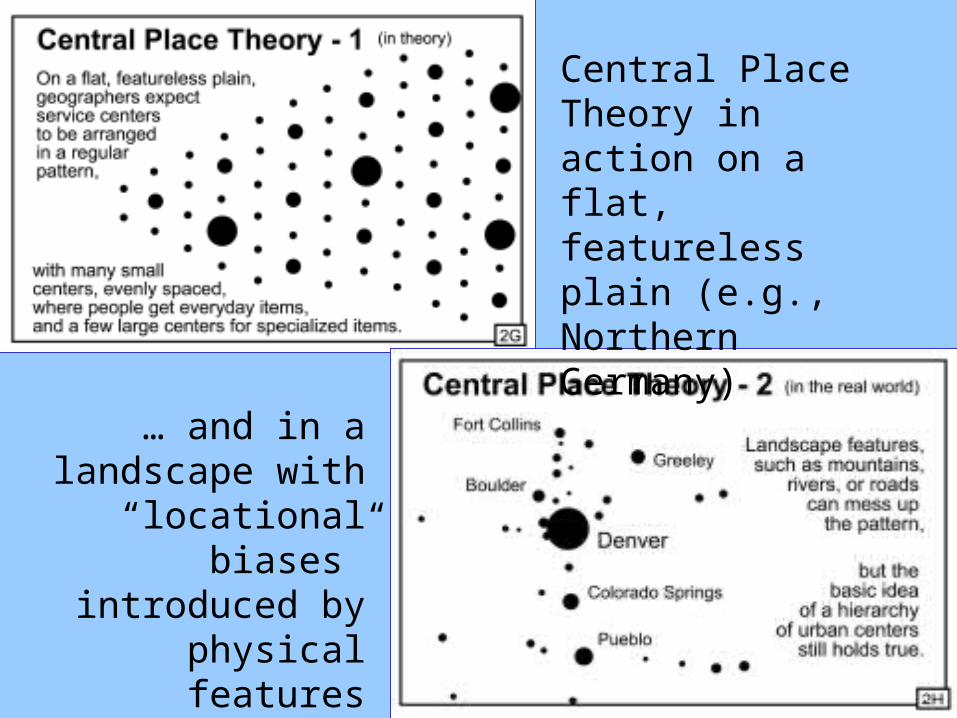
Central Place Theory in action on a flat, featureless plain (e.g., Northern Germany)
… and in a landscape with
“locational biases”
introduced by physical features
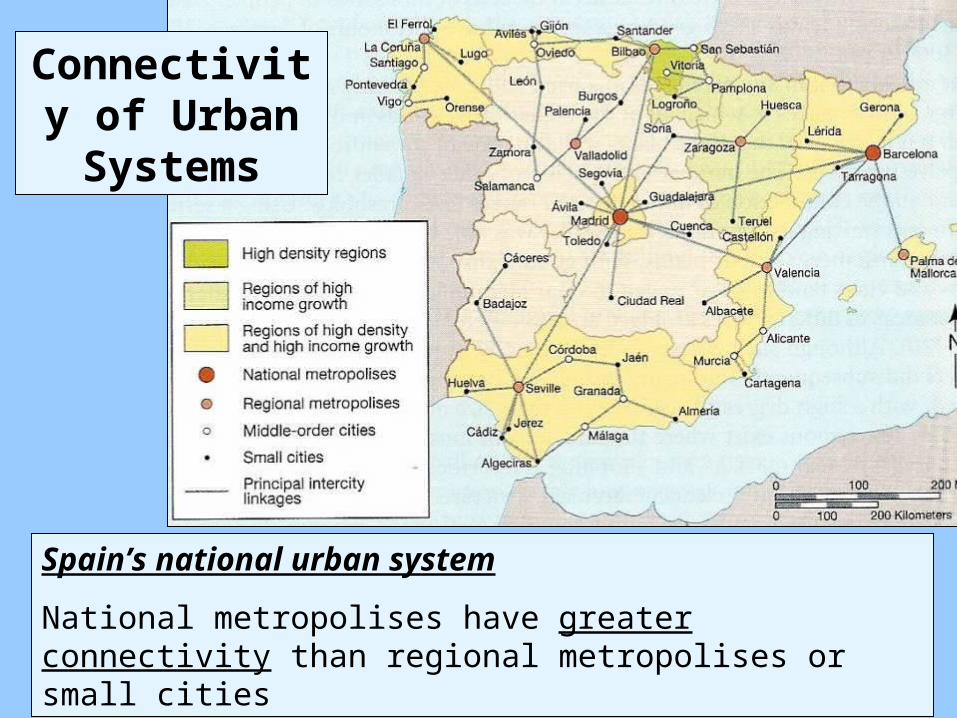
Connectivity of Urban Systems
Spain’s national urban system
National metropolises have greater connectivity than regional metropolises or small cities
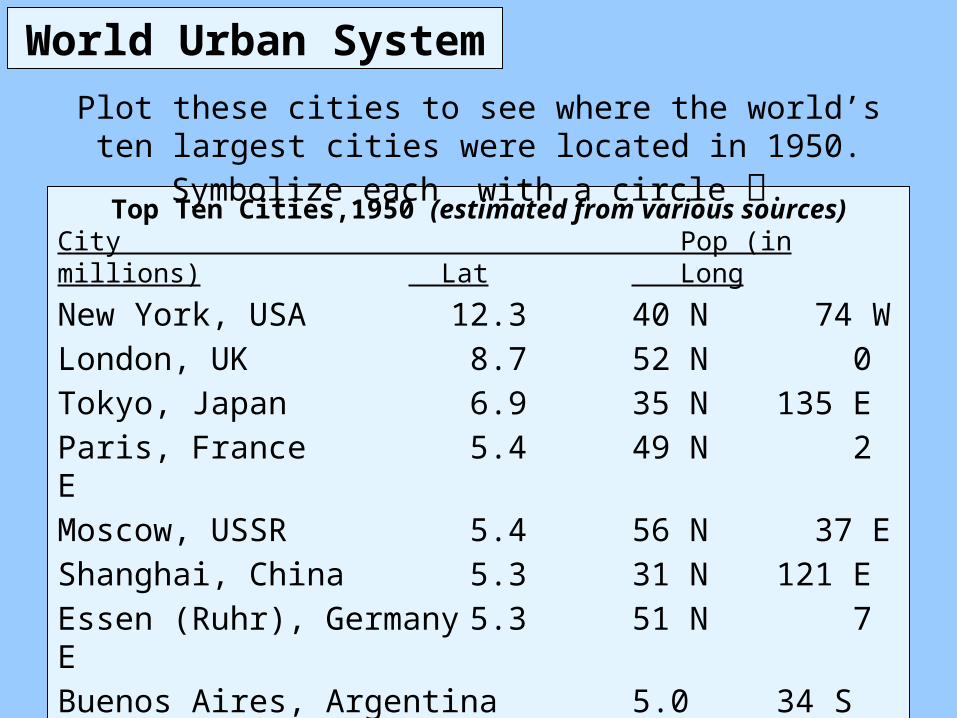
Top Ten Cities,1950 (estimated from various sources)City Pop (in millions) Lat Long
New York, USA 12.3 40 N 74 WLondon, UK 8.7 52 N 0Tokyo, Japan 6.9 35 N 135 EParis, France 5.4 49 N 2 EMoscow, USSR 5.4 56 N 37 EShanghai, China 5.3 31 N 121 EEssen (Ruhr), Germany 5.3 51 N 7 EBuenos Aires, Argentina 5.0 34 S 58 WChicago, USA 4.9 41 N 87 WCalcutta (Kolkata), India 4.4 22 N 88 E
Plot these cities to see where the world’s ten largest cities were located in 1950. Symbolize each with a
circle .
World Urban System
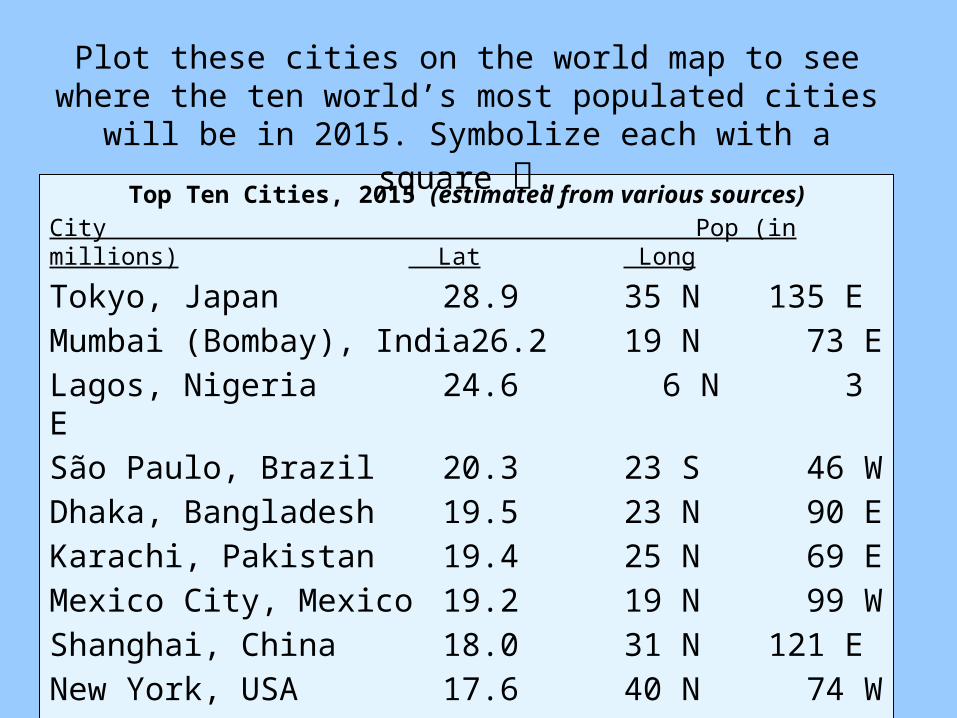
Top Ten Cities, 2015 (estimated from various sources)City Pop (in millions) Lat Long
Tokyo, Japan 28.9 35 N 135 EMumbai (Bombay), India26.2 19 N 73 ELagos, Nigeria 24.6 6 N 3 ESão Paulo, Brazil 20.3 23 S 46 WDhaka, Bangladesh 19.5 23 N 90 EKarachi, Pakistan 19.4 25 N 69 EMexico City, Mexico 19.2 19 N 99 WShanghai, China 18.0 31 N 121 ENew York, USA 17.6 40 N 74 WKolkata (Calcutta), India17.3 22 N 88 E
Plot these cities on the world map to see where the ten world’s most populated cities will be in 2015.
Symbolize each with a square .
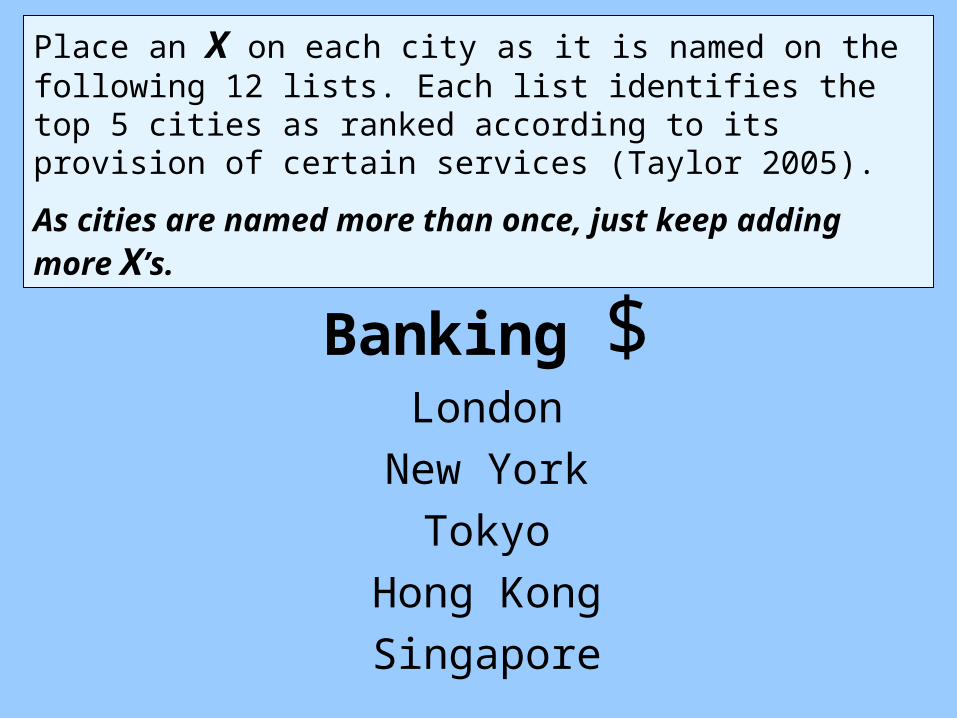
Place an X on each city as it is named on the following 12 lists. Each list identifies the top 5 cities as ranked according to its provision of certain services (Taylor 2005).
As cities are named more than once, just keep adding more X’s.
Banking $London
New YorkTokyo
Hong KongSingapore
Producer Services $London
New YorkHong Kong
ParisTokyo
Management New YorkLondonParis
MadridStockholm
Law London
New YorkFrankfurt
Hong KongWashington DC
Insurance London
New YorkHong KongLos Angeles
Paris
Advertising New YorkLondon
Hong KongTorontoSydney
Media ♫
LondonNew York
ParisLos Angeles
Milan
Architecture/Engineering
London
New YorkBeijing
SingaporeShanghai
United Nations
Agencies GenevaBrussels
Addis AbabaCairo
Bangkok
National Diplomatic
Missions
Washington DCNew YorkLondonTokyoParis
Humanitarian & Environmental NGOs
NairobiBrusselsBangkokLondon
New Delhi
Scientific Research London
Los AngelesSan Francisco
BostonBasel
GenevaNew York
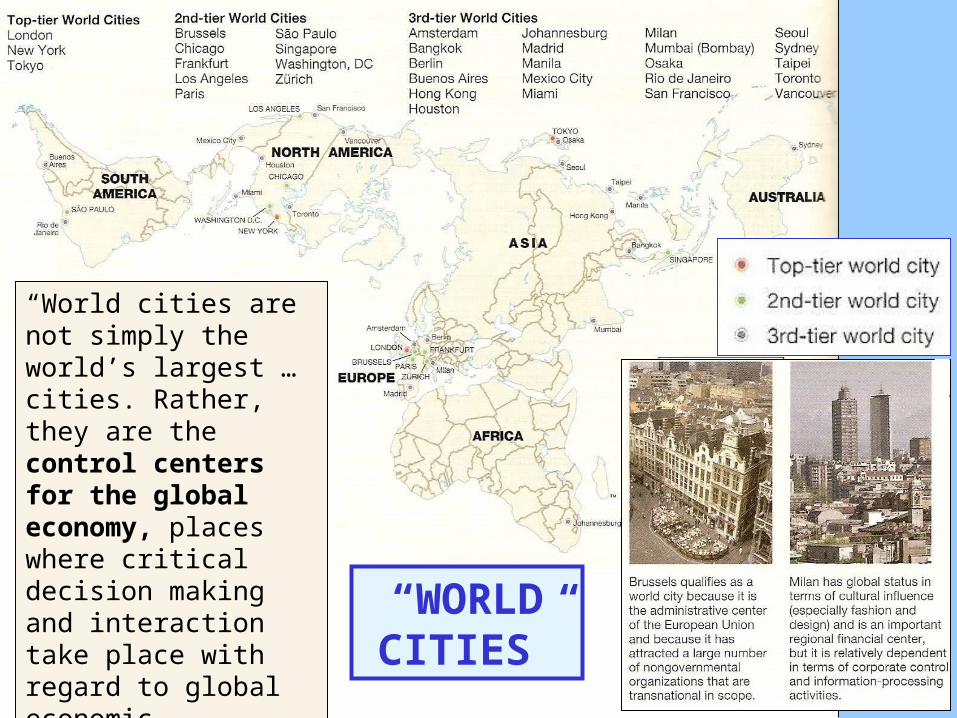
“World cities are not simply the world’s largest … cities. Rather, they are the control centers for the global economy, places where critical decision making and interaction take place with regard to global economic, cultural, and political issues” (Knox and Marston 2001, p. 426).
“WORLD CITIES”
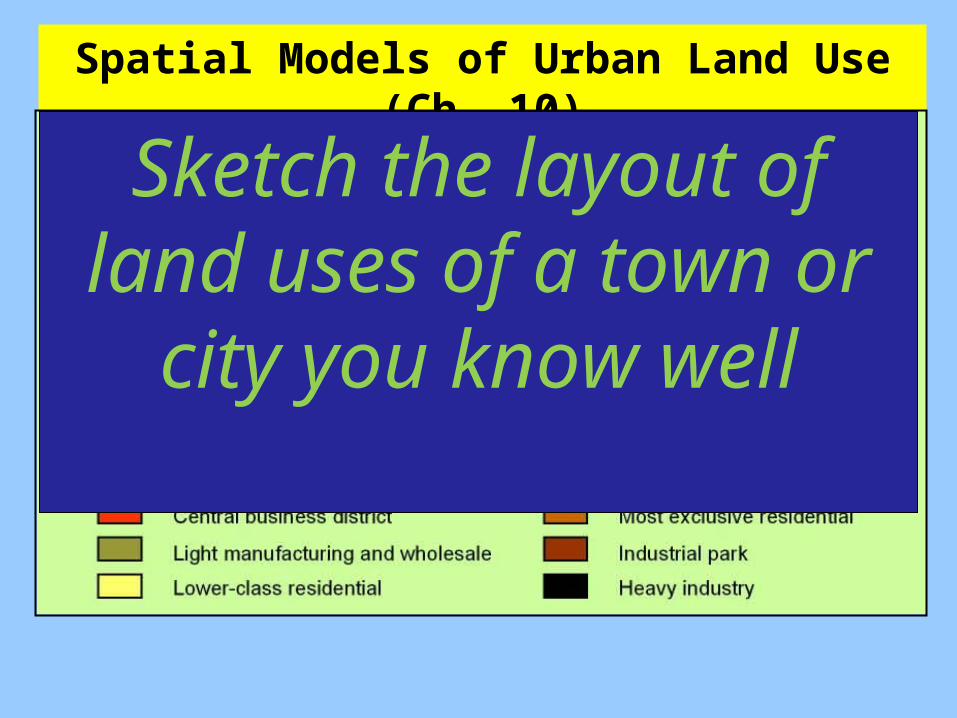
Spatial Models of Urban Land Use (Ch. 10)
Sketch the layout of land uses of a town
or city you know well
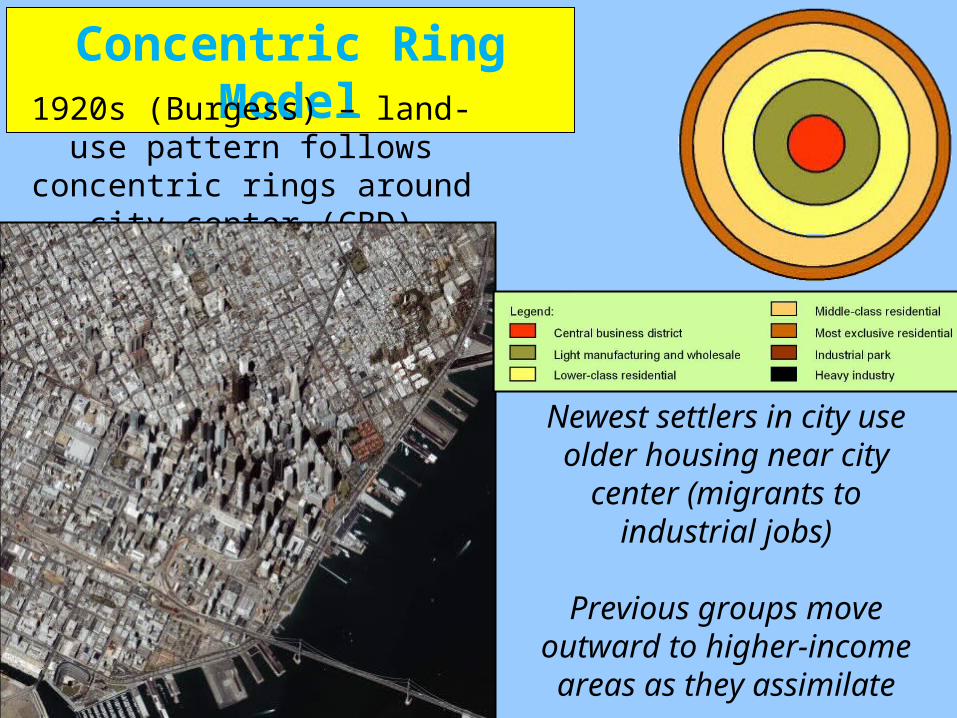
Newest settlers in city use older housing near city center (migrants to
industrial jobs)
Previous groups move outward to higher-
income areas as they assimilate
Concentric Ring Model1920s (Burgess) – land-use
pattern follows concentric rings around city center
(CBD)
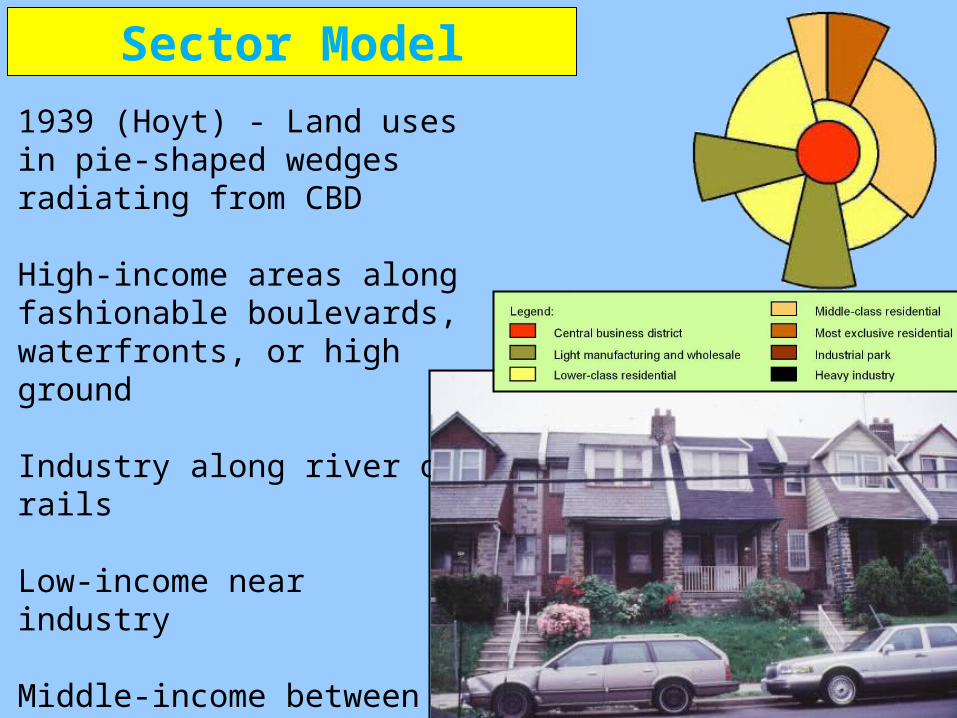
1939 (Hoyt) - Land uses in pie-shaped wedges radiating from CBD
High-income areas along fashionable boulevards, waterfronts, or high ground
Industry along river or rails
Low-income near industry
Middle-income between low and high sectors
Sector Model
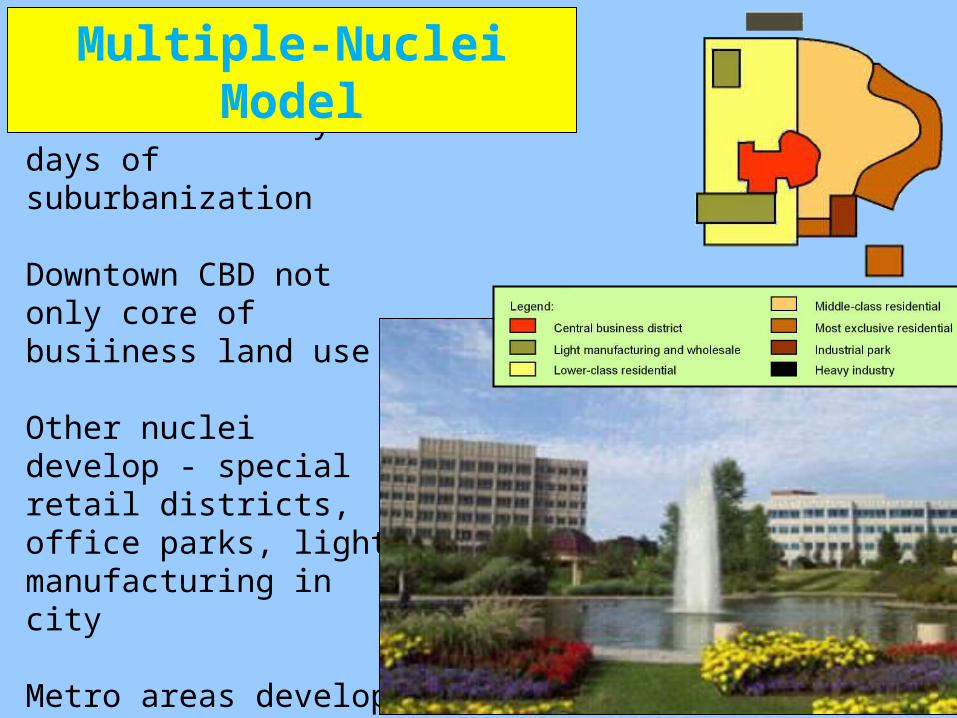
Post WW2 - Early days of suburbanization
Downtown CBD not only core of busiiness land use
Other nuclei develop - special retail districts, office parks, light manufacturing in city
Metro areas develop “suburban downtowns” (called “edge cities”)
Multiple-Nuclei Model
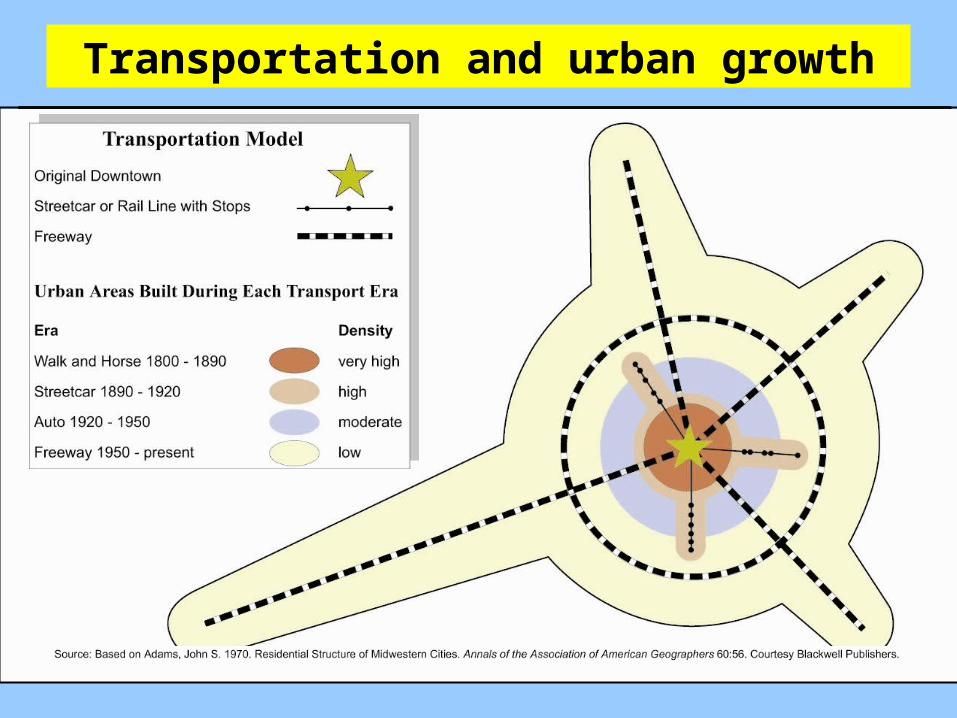
Transportation and urban growth
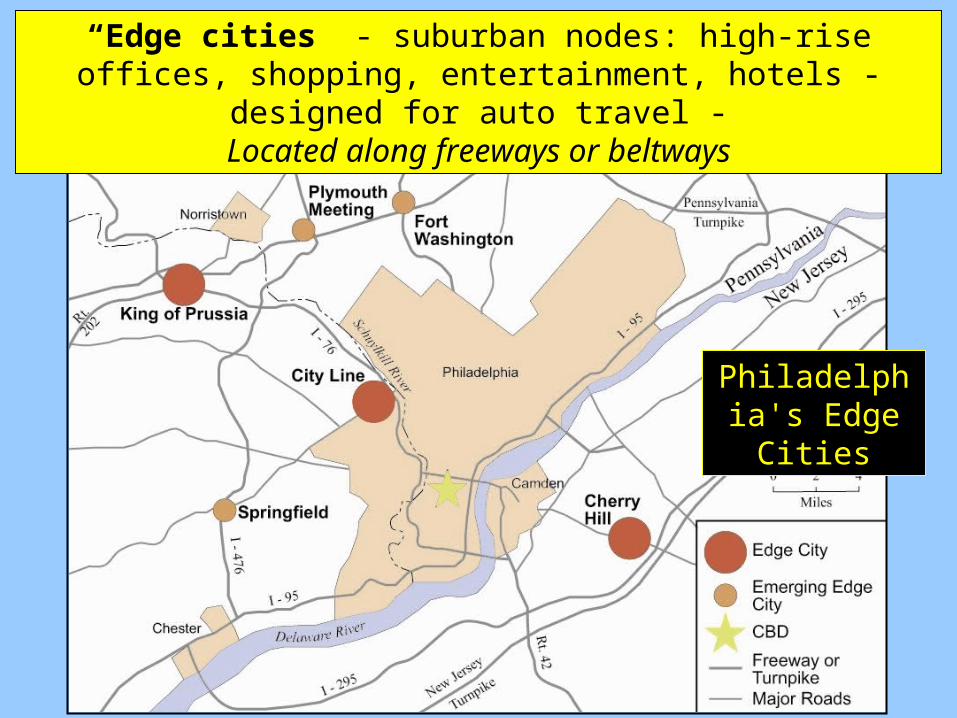
Philadelphia's Edge Cities
“Edge cities” - suburban nodes: high-rise offices, shopping, entertainment, hotels - designed for auto
travel -Located along freeways or beltways
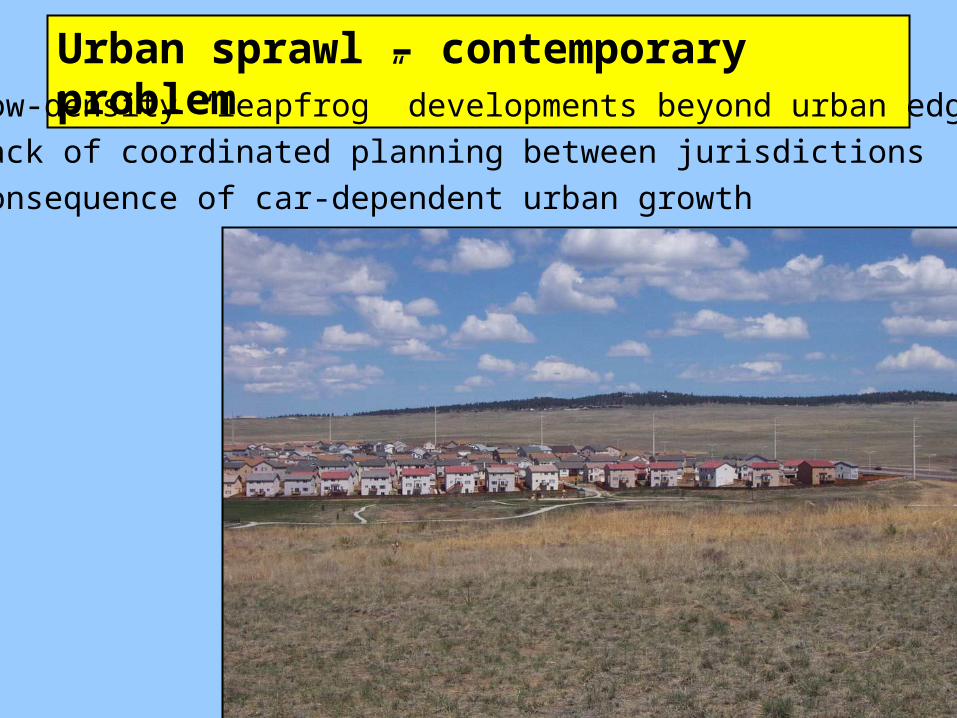
Urban sprawl – contemporary problemLow-density “leapfrog” developments beyond urban edge
Lack of coordinated planning between jurisdictionsConsequence of car-dependent urban growth
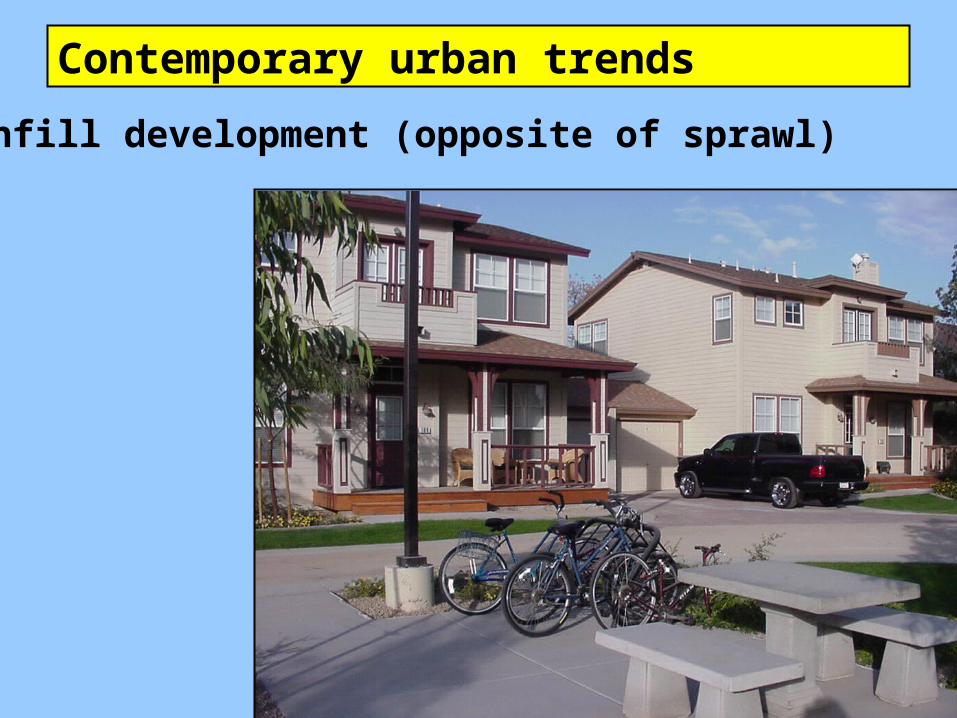
Contemporary urban trends
Infill development (opposite of sprawl)
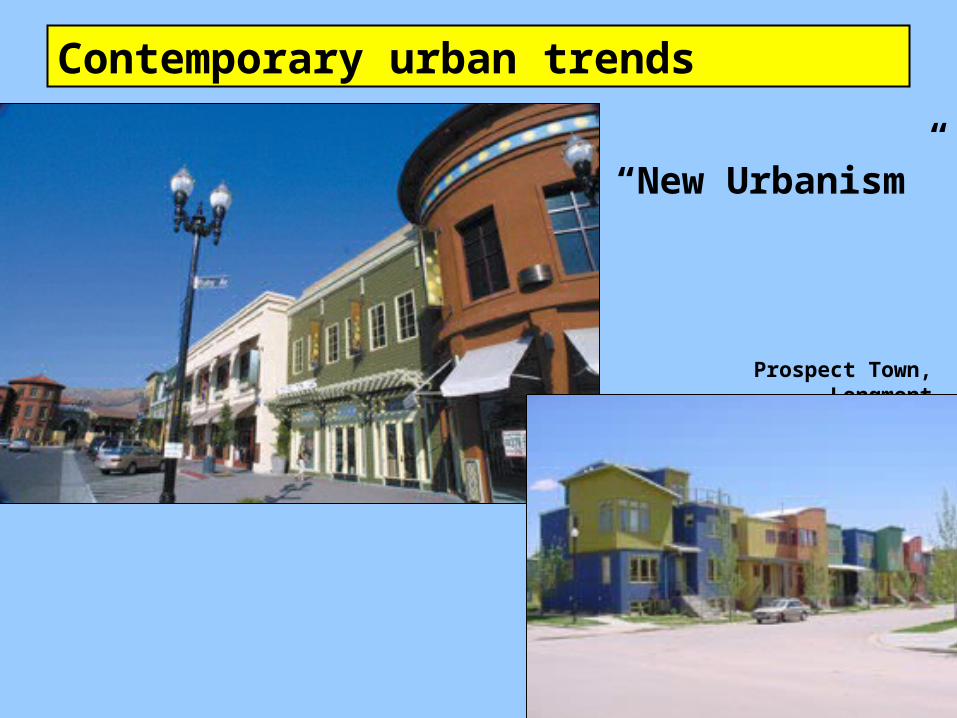
“New Urbanism”
Prospect Town, Longmont
Contemporary urban trends
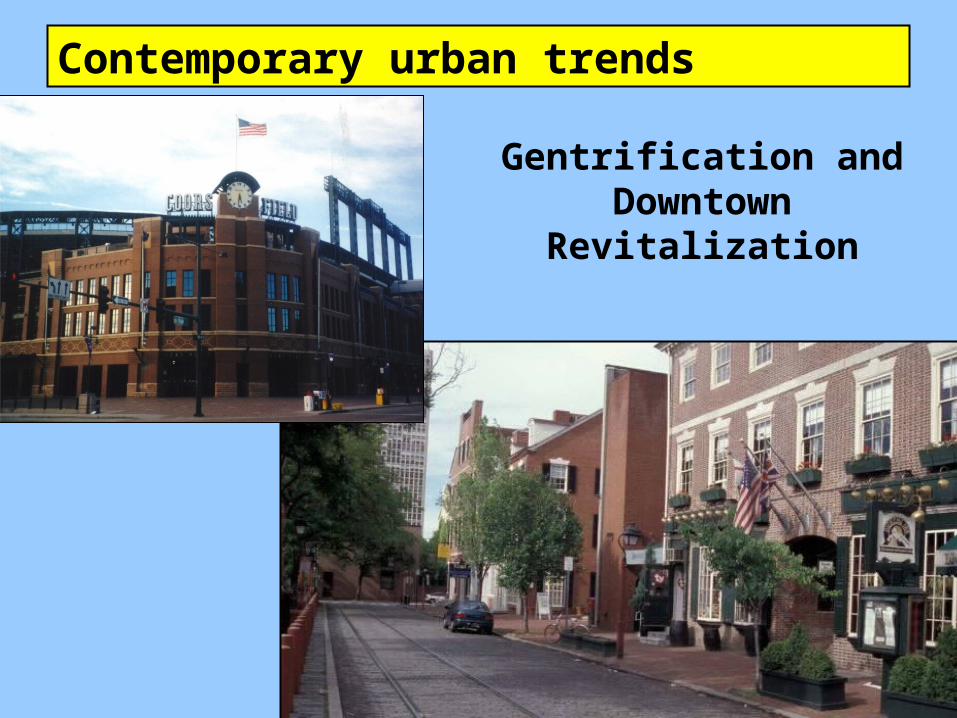
Gentrification and Downtown
Revitalization
Contemporary urban trends
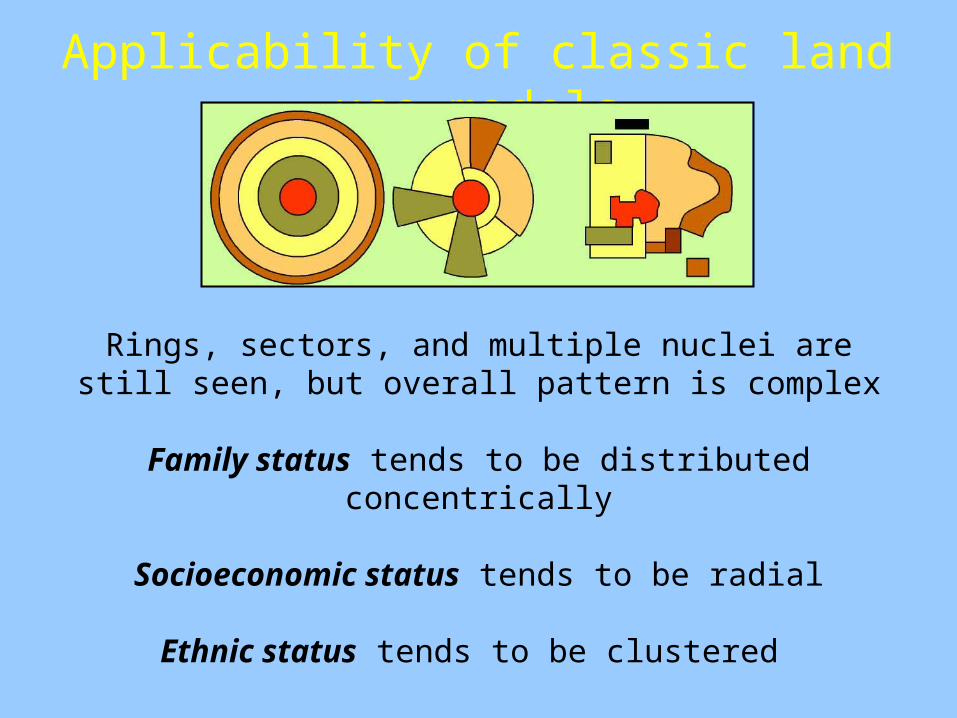
Applicability of classic land use models
Rings, sectors, and multiple nuclei are still seen, but overall pattern is complex
Family status tends to be distributed concentrically
Socioeconomic status tends to be radial
Ethnic status tends to be clustered
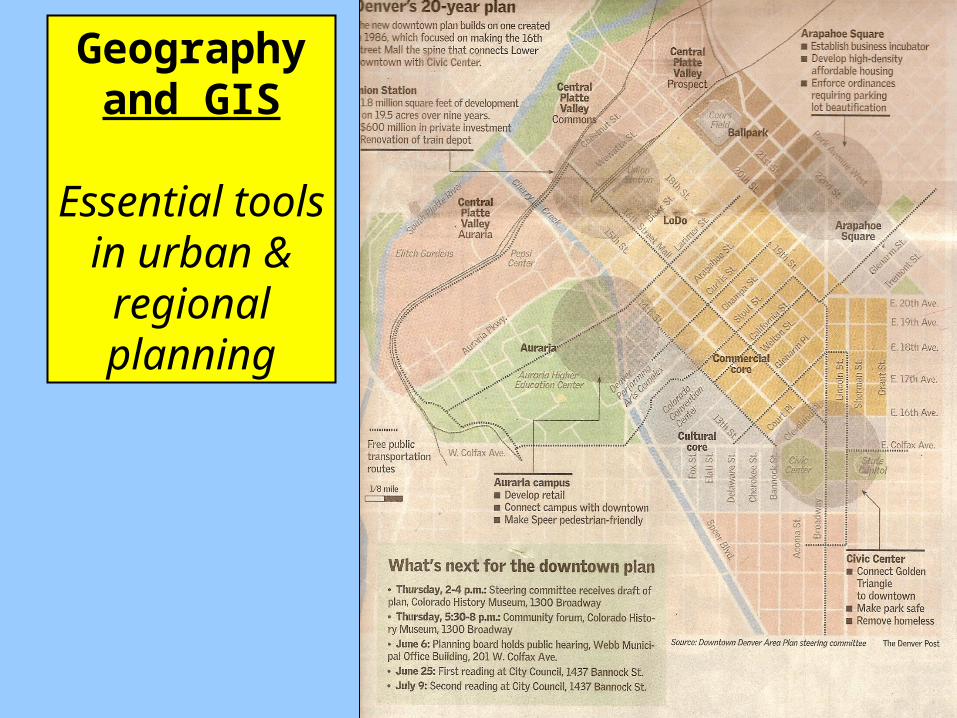
Geography and GIS
Essential tools in urban & regional planning
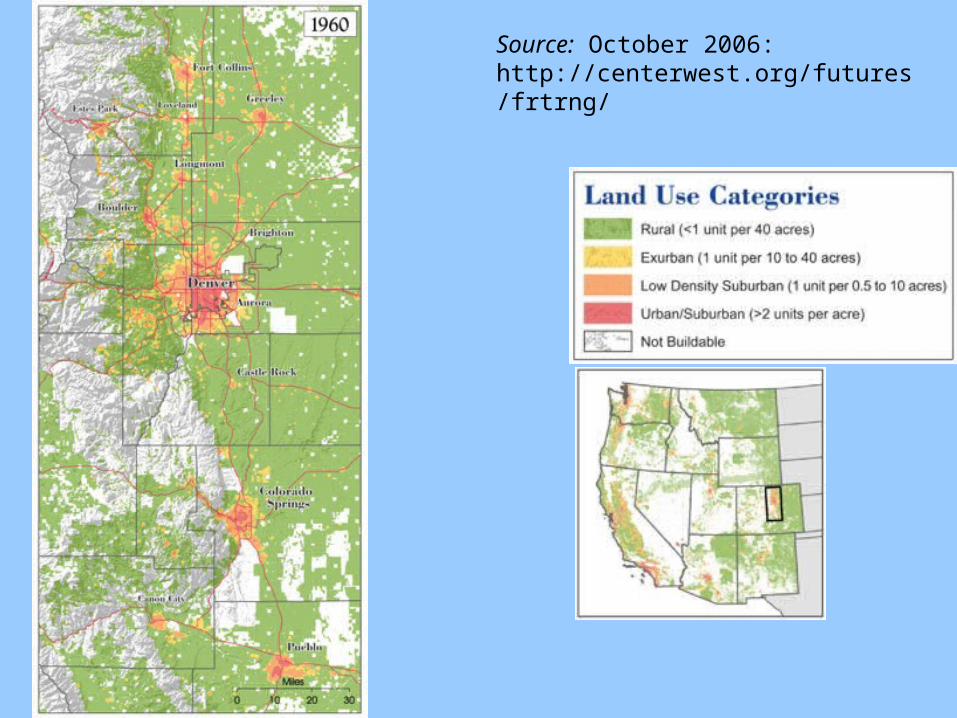
Source: October 2006: http://centerwest.org/futures/frtrng/
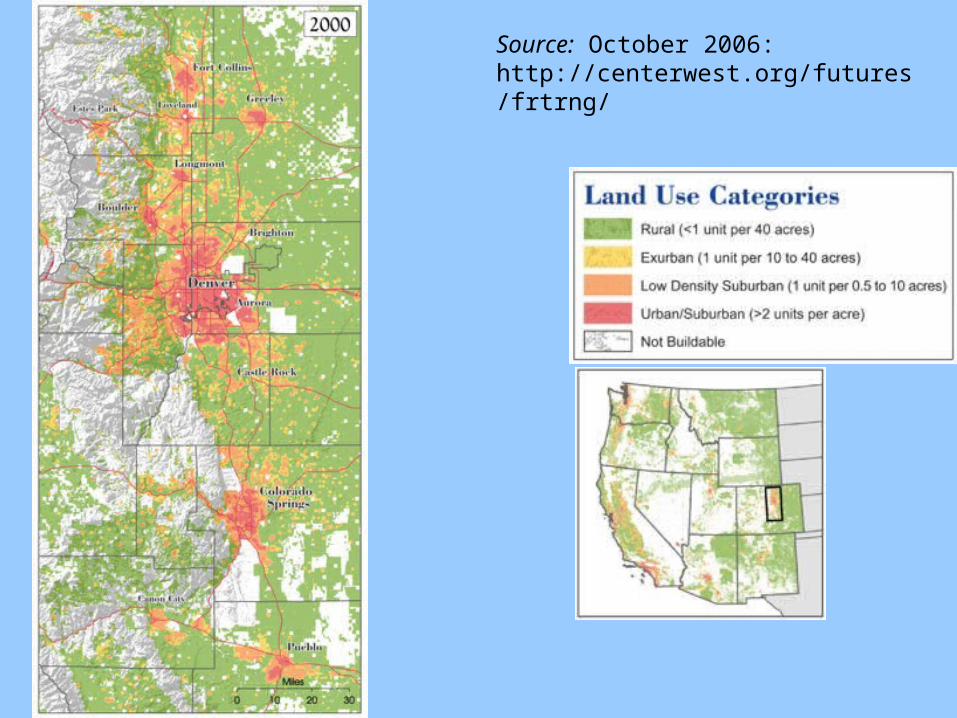
Source: October 2006: http://centerwest.org/futures/frtrng/
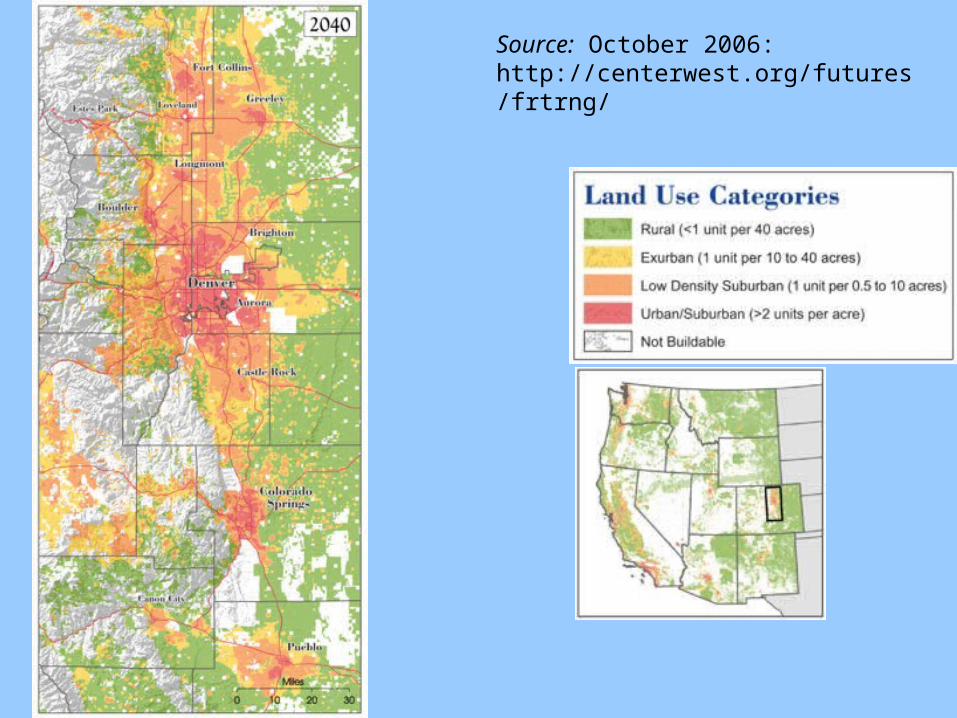
Source: October 2006: http://centerwest.org/futures/frtrng/