scan team report scan 08-04 best practices in work zone...
TRANSCRIPT

Best Practices In Work Zone Assessment, Data Collection, And Performance Evaluation
SCAN TEAM REPORT Scan 08-04
Supported by the
National Cooperative Highway Research Program
The information contained in this report was prepared as part of NCHRP Project 20 68A U.S. Domestic Scan,
National Cooperative Highway Research Program.
SPECIAL NOTE: This report IS NOT an official publication of the National Cooperative Highway Research
Program, Transportation Research Board, National Research Council, or The National Academies.


BEST PRACTICES IN WORK ZONE ASSESSMENT, DATA COLLECTION, AND PERFORMANCE EVALUATION
AcknowledgmentsThe work described in this document was conducted as part of NCHRP Project 20-68A, the U.S. Domestic Scan program. This program was requested by the American Association of State Highway and Transportation Officials (AASHTO), with funding provided through the National Cooperative Highway Research Program (NCHRP). The NCHRP is supported by annual voluntary contributions from the state departments of transportation. Additional support for selected scans is provided by the U.S. Federal Highway Administration and other agencies.
The purpose of each scan and of Project 20-68A as a whole is to accelerate beneficial innovation by facilitating information sharing and technology exchange among the states and other transportation agencies and identifying actionable items of common interest. Experience has shown that personal contact with new ideas and their application is a particularly valuable means for such sharing and exchange. A scan entails peer-to-peer discussions between practitioners who have implemented new practices and others who are able to disseminate knowledge of these new practices and their possible benefits to a broad audience of other users. Each scan addresses a single technical topic selected by AASHTO and the NCHRP 20-68A Project Panel. Further information on the NCHRP 20-68A U.S. Domestic Scan program is available at
http://144.171.11.40/cmsfeed/TRBNetProjectDisplay.asp?ProjectID=1570.
This report was prepared by the scan team for Scan 08-04, Best Practices in Work Zone Assessment, Data Collection, and Performance Evaluation, whose members are listed below. Scan planning and logistics are managed by Arora and Associates, P.C.; Harry Capers is the Principal Investigator. NCHRP Project 20-68A is guided by a technical project panel and managed by Andrew C. Lemer, Ph.D., NCHRP Senior Program Officer.
J. Stuart Bourne, P.E., North Carolina DOT, AASHTO Co-Chair
Chung Eng, Federal Highway Administration, FHWA Co-Chair
Gerald L. Ullman, Ph.D., P.E., Texas Transportation Institute, Subject Matter Exper
Diana Gomez, P.E., PMP, Caltrans
Brian Zimmerman, Michigan DOT
Tracy A. Scriba, Federal Highway Administration
Ronald D. Lipps, Maryland DOT
Denise L. Markow, P.E., New Hampshire DOT
K.C. Matthews, P.E., Colorado DOT
David L. Holstein, P.E., Ohio DOT
Reynaldo Stargell, Ohio DOT

DisclaimerThe information in this document was taken directly from the submission of the authors. The opinions and conclusions expressed or implied are those of the scan team and are not necessarily those of the Transportation Research Board, the National Research Council, or the program sponsors. This document has not been edited by the Transportation Research Board.
6BEST PRACTICES IN WORK ZONE ASSESSMENT, DATA COLLECTION, AND PERFORMANCE EVALUATION
Scan 08-04 Best Practices In Work Zone Assessment, Data Collection, And Performance Evaluation
P R E PA R E D BY
R E Q U E S T E D BY T H E
American Association of State Highway and Transportation Officials
J. Stuart Bourne, P.E., North Carolina DOT, AASHTO Co-Chair
Chung Eng, Federal Highway Administration, FHWA Co-Chairr
Gerald L. Ullman, Ph.D., P.E., Texas Transportation Institute, Subject Matter Expert
Diana Gomez, P.E., PMP, Caltrans
Brian Zimmerman, Michigan DOT
Tracy A. Scriba, Federal Highway Administration
Ronald D. Lipps, Maryland DOT
Denise L. Markow, P.E., New Hampshire DOT
K.C. Matthews, P.E., Colorado DOT
David L. Holstein, P.E., Ohio DOT
Reynaldo Stargell Ohio DOT
Arora and Associates, P.C.Lawrenceville, NJ
October 2010
S C A N M A N AG E M E N T
The information contained in this report was prepared as part of NCHRP Project 20 68A U.S. Domestic Scan,
National Cooperative Highway Research Program.
SPECIAL NOTE: This report IS NOT an official publication of the National Cooperative Highway Research
Program, Transportation Research Board, National Research Council, or The National Academies.

IBEST PRACTICES IN WORK ZONE ASSESSMENT, DATA COLLECTION, AND PERFORMANCE EVALUATION
Table of Contents
Abbreviations and Acronyms.....................................................................VIII
Executive Summary........................................................................................ ES-1
Overview.............................................................................................................. ES-1
Performance Measures Used to Assess Safety and Operational Performance in Work Zones...........................................................ES-2
Data Collected to Compute Work Zone Performance Measures....................... ES-2
Uses of Performance Measures and Data for Work Zone Safety and Mobility Improvement...................................................................... ES-3
Work Zone Impact Analysis and Performance Measures Used During the Project Development Process................................................. ES-3
1.0 Introduction................................................................................................. 1-1
Background....................................................................................................1-1
Purpose...........................................................................................................1-1
Methodology...................................................................................................1-2
Organization of the Report............................................................................1-3
2.0 Measures Used to Assess Safety and Operational Performance in Work Zones................................... 2-1
Measures Used to Assess Work Zone Safety Performance......................... 2-1
Measures Used to Assess Work Zone Mobility or Operational Performance.............................................................................. 2-7
Extent of Performance Measurement Use Across the Agency or Region.................................................................................... 2-10
Problems Encountered in Applying Performance Measures...................... 2-11
Lessons Learned Regarding the Use of Performance Measures................................................................................. 2-11
3.0 Data Collected to Compute Work Zone Performance Measures.......................................................................... 3-1
Sources of Work Zone Safety Data............................................................... 3-1
Sources of Work Zone Mobility/Operational Data.......................................3-6
Forms Used to Collect Data..........................................................................3-7
Data and Performance Measurement Requirements in Transportation Management Plans............................................................. 3-10 Use of Contractor and Agency Inspector Observations...............................3-10
The Role of Transportation Management Centers in Capturing Work Zone Performance Information.........................................3-10
Use of Customer Surveys and Complaints for Monitoring Work Zone Performance................................................................................3-13

II
TA B L E O F C O N T E N T S
Costs of Monitoring Work Zone Performance...............................................3-16
Sources of Funding for Work Zone Performance Monitoring..................... 3-16
Technologies Used for Work Zone Performance Monitoring...................... 3-16
Agency Challenges to Work Zone Performance Monitoring........................3-19
4.0 Uses of Performance Measures and Data for Work Zone Safety and Mobility Improvement.................. 4-1
Use of Data and Measures to Improve Agency Work Zone Policy and Procedures............................................................... 4-2
Use of Data and Measures to Identify Potential Problems During Work Zone Implementation.......................................................... 4-4
Use of Permitted Lane Closure Charts........................................................4-4
Use of Performance-Based Incentives Based on Work Zone Safety and Mobility Measures...................................................4-4
Use of Data Management Systems for Work Zone Data............................ 4-7
Methods of Incorporating Lessons Learned Regarding Work Zone Safety and Mobility into Future Projects................................. 4-15
Benefits and Innovations Resulting from Applying Performance Measures................................................................................. 4-18
5.0 Work Zone Impact Analysis and Performance Measures Used During the Project Development Process........................................................................ 5-1
Uses of Data and Performance Measures to Influence Project Scheduling and Budgets................................................................... 5-1
Effect of Increased Project Data Demands on Project Development Process Schedule.....................................................................5-1
Methods of Identifying Potential Traffic Problems During Project Development.........................................................................5-2
Parties Responsible for Assessing Work Zone Impacts During Project Development.........................................................................5-2
Project Development Stages Where Impacts Are Assessed........................ 5-2
Data Used to Assess Work Zone Impacts.....................................................5-2
Methods of Estimating and Incorporating Road User Costs in Agency Cost Analyses......................................................................5-3
Application of Safety or Mobility Performance Measures in Lane Rental or Other Incentive/Disincentive Contract Clauses.................5-4
Use of Work Zone Data to Influence Transportation Management Strategy Selection During Project Design.............................5-4
Work Zone Impact Considerations or Requirements in Contractor-Proposed Changes...................................................................... 5-5
Tools Used to Estimate Impacts at Different Stages of Project Development..................................................................................... 5-6
Methods of Selecting Analysis Tools............................................................ 5-6

IIIBEST PRACTICES IN WORK ZONE ASSESSMENT, DATA COLLECTION, AND PERFORMANCE EVALUATION
Role of Desired Performance Measures in Analysis Tool Selection.................................................................................................5-7
Effectiveness of Tools in Differentiating Between Different Transportation Management Strategies......................................................5-7
Calibration and Validation Efforts of Analysis Tools..................................5-8
Use of Consultants for Impact Analyses...................................................... 5-8
Agency Staff Knowledge of Tools Used by Consultants.............................. 5-9
Impacts Analysis Tools Training Being Provided...................................... 5-9
Major Agency Challenges to Assessing and Managing Work Zone Impacts..................................................................... 5-9
BenefitsReceivedfromAssessingandManagingImpacts........................5-9
6.0 Key Findings............................................................................................6-1
Measures Used to Assess Safety and Operational Performance in Work Zones................................................................................................ 6-1
Data Collected to Compute Work Zone Performance Measures................. 6-2
Uses of Performance Measures and Data for Work Zone Safety and Mobility Improvement............................................................... 6-3
Work Zone Impact Analysis and Performance Measures Used During the Project Development Process........................................... 6-4
7.0 Recommendations...............................................................................7-1
Measures Used to Assess Safety and Operational Performance in Work Zones......................................................................... 7-1
Data Collected to Compute Work Zone Performance Measures................. 7-2
Uses of Performance Measures and Data for Work Zone Safety and Mobility Improvement........................................................................... 7-2
Work Zone Impact Analysis and Performance Measures Used During the Project Development Process........................................... 7-2
8.0 Implementation Strategy.................................................................8-1

IVBEST PRACTICES IN WORK ZONE ASSESSMENT, DATA COLLECTION, AND PERFORMANCE EVALUATION
List of Appendices
Appendix A: Scan Team Contact Information................................ A-1 Appendix B: Scan Team Biographical Information.........................B-1 Appendix C: Amplifying Questions........................................................ C-1 Appendix D: Scan Itinerary......................................................................... D-1 Appendix E: Host Agency Contact Information.............................. E-1

V
List of Tables
Table 1.1 Domestic Scan 08-04 team members.....................................1-1
Table 2.1 Summary of work zone mobility/operational performance measurement thresholds................................2-9
Table 4.1 Example of feedback information retained on a project’s mobility impacts rom Michigan DOT........ 4-18

VIBEST PRACTICES IN WORK ZONE ASSESSMENT, DATA COLLECTION, AND PERFORMANCE EVALUATION
List of Figures
Figure 2.1 Work zone crash trends versus size of construction budget.......2-2
Figure 2.2 Work zone crash rate and cost analysis...................................... 2-3
Figure 2.3 Example of near real-time work zone safety performance measurement in Ohio..............................................2-4
Figure 2.4 Use of fire department and service patrol activity as safety performance measures in a New Hampshire work zone.......................................................................................2-5
Figure 2.5 Oregon DOT example of analysis of inspection scores by topic and region............................................................ 2-6
Figure 2.6 Differences in work zone mobility performance measures “meeting expectations for traffic flow” by rating group.............................................................................2-10
Figure 3.1 Example analysis of supplemental work zone crash data used by Florida DOT.............................................................3-3
Figure 3.2 Example analysis of supplemental work zone crash data used by New York State DOT..............................................3-3
Figure 3.3 Example work zone traffic control inspection form used by New York State DOT...................................................... 3-4
Figure 3.4 Work zone inspection form used by Illinois Tollway.................. 3-6
Figure 3.5 Manual collection form for work zone mobility and operational data used by Michigan DOT.................................... 3-8
Figure 3.6 Managing incident and work zone traffic impacts at the Maryland DOT TMC......................................................... 3-11
Figure 3.7 Examples of work zone volume, speed, and travel time impact analyses computed from TMC data in Detroit....................................................................................... 3-12
Figure 3.8 Illinois Tollway construction sign soliciting customer feedback........................................................................ 3-13
Figure 3.9 Customer survey responses during the California DOT I-15 Devore Rapid Rehabilitation Project.......................... 3-15

VII
Figure 3.10 Using customer surveys to evaluate work zone conditions by Missouri DOT.........................................................3-15
Figure 3.11 Example of tracking a Bluetooth-enabled device address over time in Indiana........................................................3-17
Figure 3.12 Demonstration of using Bluetooth wireless technology data to detect changes in work zone travel times in Indiana........................................................ 3-17
Figure 3.13 Portable work zone traffic data collection and communication technology................................................... 3-18
Figure 4.1 Construction access design detail sheet developed by Ohio DOT................................................................ 4-3
Figure 4.2 Example permitted lane closure chart used by the Illinois Tollway.................................................................. 4-5
Figure 4.3 Schematic data flows within PeMS............................................. 4-9
Figure 4.4 Lane requirements chart from PeMS.......................................... 4-10
Figure 4.5 PeMS spatial representation of lane requirements along a corridor..................................................... 4-11
Figure 4.6 PeMS delay estimation capabilities............................................ 4-12
Figure 4.7 PeMS lane closure status map.................................................... 4-14
Figure 4.8 PeMS trend analysis of late lane closure removals.................... 4-15
Figure 4.9 Example of how lessons learned are incorporated into Washington DOT processes.................................................. 4-17
L I S T O F F I G U R E S

VIIIBEST PRACTICES IN WORK ZONE ASSESSMENT, DATA COLLECTION, AND PERFORMANCE EVALUATION
Abbreviations and Acronyms
AASHTO American Association of State Highway and Transportation Officials
ADT Average Daily Traffic
DOT Department Of Transportation
FARS Fatality Analysis Reporting System
FHWA Federal Highway Administration
GPS Global Positioning Satellite
I/D Incentive/Disincentive
ITS Intelligent Transportation System
LCS Lane Closure System
LD Liquidated Damages
MVM Million-Vehicle-Miles
NCHRP National Cooperative Highway Research Program
NHTSA National Highway Traffic Safety Administration
PeMS Performance Management System
RUC Road User Cost
SME Subject Matter Expert
TMC Transportation Management Center
TMP Transportation Management Plan

E X E C U T I V E S U M M A R Y

ES-1BEST PRACTICES IN ADDRESSING NPDES AND OTHER WATER QUALITY ISSUES IN HIGHWAY SYSTEM MANAGEMENT
Executive Summary
Overview
Current federal regulations (23 CFR 630 Subpart J) encourage states to collect and analyze both safety and mobility data to support the initiation and enhancement of agency-level processes and procedures addressing work zone impacts. States should develop and implement systematic procedures to assess work zone impacts in project
development and manage safety and mobility during project implementation. Currently, many agencies have little experience in collecting, analyzing, and utilizing work zone performance data. Those agencies would benefit greatly by learning how other agencies approach these tasks. As a result, a domestic scan of practices pertaining to work zone assessment, data collection, and performance measurement was proposed and selected for funding under the NCHRP 20-68A Domestic Scan Program.
The purpose of the scan was to investigate best practices in work zone assessment, data collection, and performance measurement, and how these practices are being used to ensure safety and minimize congestion in work zones. The scan team identified four main topic area themes to target:
n How does your agency assess the safety and congestion/operational performance of your work zones? In other words, how do you know if your work zones are operating well (i.e., safely, smoothly, and efficiently)?
n How does your agency collect the data for these measures?
n How does your agency use/plan to use the data to make improvements in work zone performance and management?
n What processes, methods, and/or tools does your agency use to assess impacts during various stages of project development (i.e., planning, design, and construction)?
A scan team whose members were from agencies across the U.S. was convened. The team interviewed 15 agencies and developed key findings and recommendations under each of the four topic areas listed above. This report summarizes these findings and recommendations.
Performance Measures Used to Assess Safety and Operational Performance in Work ZonesThe scan team found that agencies that have clearly established performance measures tend to effectively track those measures and consider them throughout the project development process. Having clearly established goals and performance measures shows the agency’s level of commitment to them. Interestingly, many agencies are using work zone performance measures without realizing it. Most agencies have policies and procedures in place that are based indirectly

ES-2
E X E C U T I V E S U M M A R Y
on mobility and/or safety performance measures. Overall, work zone safety performance measures tend to be developed and examined mostly at the agency program level, whereas work zone mobility performance measures tend to be developed and examined mostly at the project level.
The scan team recommends that agencies establish specific and measureable work zone safety and mobility goals and objectives. Specific objectives represent the level of commitment an agency is willing to make towards the consideration and mitigation of work zone impacts. The agency’s performance measures should then relate to the goals and objectives that it has set for itself relative to mobility and safety impacts.
Of course, performance measures must be established and used rationally. Whereas work zone impacts on the traveling public are key considerations throughout the project development and construction process, they are not the only ones. An agency must also consider costs, productivity, environmental concerns, and other factors. Furthermore, it must be remembered that both the importance of certain measures and the availability of data drive which performance measures a given agency will use. The performance measures an agency most desires may not always be usable because the data needed to compute those measures are not reasonably available.
Data Collected to Compute Work Zone Performance MeasuresIn terms of data, the scan team found that agencies with good work zone safety and mobility data management systems tend to make better use of the data than those with less structured systems or no system at all. The existence of data management systems also indicated a commitment by the agency’s upper management to considering safety and mobility impacts throughout project development and delivery. Electronic crash data entry can significantly speed up the availability of safety data and make it feasible for its use in evaluating ongoing project impacts.
Similarly, the development and implementation of an electronic database system to track and approve current and future lane closures can be very useful to agencies. The database helps to simplify and formalize the notification of the proper individuals and groups within the agency about the closures, and ensures that the closures are performed during acceptable times. The database can also be useful for coordinating multiple lane closures on a given facility or route, can facilitate advance notification of the public, and can assist in targeting monitoring efforts of impacts during the closures. Certainly, Transportation Management Centers (TMCs) play a key role in managing lane closures throughout a region. A TMC has staff and other resources that make it the logical focal point of information collation and dissemination to the public. TMCs are also useful for providing real-time information to drivers when traffic queues develop at a project to encourage diversion and mitigate the magnitude of the queues.
Of course, many work zones occur in locations where TMCs do not exist. Fortunately, the increased availability of low-cost technologies and data sources are making the collection and use of mobility data in work zones more feasible for agencies. The development of highly portable devices further increases the feasibility of data collection in work zones. In addition, many

ES-3BEST PRACTICES IN WORK ZONE ASSESSMENT, DATA COLLECTION, AND PERFORMANCE EVALUATION
agencies are obtaining access to third-party mobility data on routes without agency surveillance and control equipment, which is also making work zone mobility data more readily available.
Based on these findings, the scan team recommends that agencies decide what data are required to measure performance; invest the necessary resources to obtain that data; and decide how the measures that are computed will be used to affect decisions or, in some cases, agency processes, for a given project. If a TMC is to play a key role in collecting mobility and safety data for a work zone, it is important that TMC staff be properly trained and procedures established on how work zone data collection, monitoring, and public information dissemination efforts are to occur.
Uses of Performance Measures and Data for Work Zone Safety and Mobility ImprovementThe scan team encountered several specific examples of agencies that have been successful in utilizing work zone safety and mobility data and measures to identify deficiencies or gaps in their approach to project delivery and make improvements. In addition, the team found that agency access to real-time safety or mobility data correlates to that agency’s ability to modify existing work zones in a timely manner to improve safety and mobility. A lack of timely data (e.g., delays of several months before data for crashes occurring at a project are available or the inability to constantly monitor and quantify the queues or delays occurring at each project) keeps most agencies from being more responsive in improving work zone conditions. Still, it was clear to the scan team that not all agencies have fully explored the availability and usefulness of data for improving work zone safety and mobility. Agencies often cited that a lack of resources (e.g., time, expertise, and other supporting data) was why they were not doing more with the available data.
Therefore, the scan team believes that agencies should strive to ensure that collected work zone safety and mobility data are fully analyzed and utilized to improve agency processes and procedures. This effort may involve bringing in additional data sources, such as work zone exposure data, to allow the performance measures to be normalized across projects, roadway types, work activities, and other project aspects.
Work Zone Impact Analysis and Performance Measures Used During the Project Development ProcessSome agencies have realized that the earlier in the project development process that work zone impacts are considered, the better the end product will be. Beginning this process early allows a wider range of options for accommodating work zone traffic to be considered.
Many agencies use capacity analyses, permitted lane closure charts based on capacity analyses, and/or other analytical tools to eliminate or minimize the mobility impacts of work zone projects. Some agencies have developed their own in-house tool that project designers can use to facilitate quick analysis. Agencies also tend to use more-complex modeling tools on high-impact projects in urban areas and are more likely to seek the help of an outside entity (e.g., a consultant or a Metropolitan Planning Organization) on these more-involved analyses.
ES-4
E X E C U T I V E S U M M A R Y
Therefore, the scan team recommends that agencies clearly define how and where work zone safety and mobility impact assessment fits into their project development process. Doing so increases the chances that these impacts will be better mitigated, the costs will be accounted for, and the project will go more smoothly.
The project development process many agencies follow is highly structured. At a minimum, it is critical to include impact assessment and mitigation as specific steps in the process. However, the most successful agencies will integrate the consideration of impacts throughout their processes, periodically revisiting early assumptions and making revisions and refinements as project development progresses. It is important to scale the level of the project’s transportation management plan (TMP) to the level of anticipated impacts.
Agency staff and time resources are extremely limited and continue to be strained further as budgets are regularly cut. As agencies look for ways to continue to streamline their operations and become more efficient, it will be critical that they have improved data from projects and locations that resulted in significant impacts. Agencies will thus be better able to predict which upcoming projects are most likely to cause significant impacts and to identify mitigation strategies that will have the best chance of alleviating those impacts.

C H A P T E R 1 : I N T R O D U C T I O N

1-1BEST PRACTICES IN WORK ZONE ASSESSMENT, DATA COLLECTION, AND PERFORMANCE EVALUATION
Background
On September 9, 2004, the Federal Highway Administration (FHWA) amended its regulation that governs traffic safety and mobility in highway and street work zones (23 CFR Part 630). One of the provisions of the rule is that states collect and analyze both safety and mobility data to support the initiation and enhancement of agency-level
processes and procedures addressing work zone impacts. Specifically, states should develop and implement systematic procedures to assess work zone impacts in project development and manage safety and mobility during project implementation.
Currently, many agencies have little experience in collecting, analyzing, and utilizing work zone performance data. Those agencies would benefit greatly by learning how other agencies approach this task. As a result, a domestic scan of practices pertaining to work zone assessment, data collection, and performance measurement was proposed and selected for funding under the NCHRP 20-68A Domestic Scan Program.
A 10-member team from state DOTs and the FHWA was recruited to conduct the scan (see Table 1.1).
Name Agency
J. Stuart Bourne North Carolina DOT (AASHTO co-chair)
Chung Eng FHWA co-chair
Diana Gomez California DOT
Dave Holstein / Reynaldo Stargella a
Ohio DOT
Ron Lipps Maryland DOT
Denise Markow New Hampshire DOT
K.C. Matthews Colorado DOT
Tracy Scriba FHWA
Brian Zimmerman Michigan DOT
a Dave Holstein participated in the scan during the first week, Reynaldo Stargell participated during the second week.
Table 1.1 Domestic Scan 08-04 team members
C H A P T E R 1
Introduction

1-2
C H A P T E R 1 : I N T R O D U C T I O N
Gerald Ullman served as the subject matter expert (SME) charged with preparing the reports and presentation documenting the scan efforts and findings. Contact information and biographical summaries of the scan team members are presented in Appendix A and Appendix B, respectively.
PurposeThe purpose of the scan was to investigate best practices in work zone assessment, data collection, and performance measurement, and how practices are being used to ensure safety and minimize congestion in work zones. The scan team identified four main topic area themes to target:
n How does your agency assess the safety and congestion/operational performance of your work zones? In other words, how do you know if your work zones are operating well (i.e., safely, smoothly, and efficiently)?
n How does your agency collect the data for these measures?
n How does your agency use/plan to use the data to make improvements in work zone performance and management?
n What processes, methods, and/or tools does your agency use to assess impacts during various stages of project development (i.e., planning, design, and construction)?
The scan team developed a comprehensive list of amplifying questions to investigate each of these topic area themes in detail (see Appendix C).
MethodologyA desk scan was performed in fall 2009 to identify agencies across the country that had implemented or were implementing procedures under one or more of the above topic area themes. Through this effort, the scan team identified agencies that might serve as examples to other agencies striving to improve their procedures in this area. Based on that effort, 15 agencies were identified for further investigation during the field scanning phase of the project:
A combination of on-site interviews, reverse scans (i.e., the agency travels to meet with the scan team at a location), and webinars/videoconferences were used to gather the desired data from these agencies. The field scanning effort was completed over two weeks in March 2010. Oregon
n California DOT
n Florida DOT
n Illinois Tollway
n Indiana DOT
n Maryland DOT
n Michigan DOT
n Missouri DOT
n New Hampshire DOT
n New Jersey DOT
n New York State DOT
n Ohio DOT
n Pennsylvania DOT
n Oregon DOT
n Washington State DOT
n Wisconsin DOT

1-3BEST PRACTICES IN WORK ZONE ASSESSMENT, DATA COLLECTION, AND PERFORMANCE EVALUATION
DOT was unable to participate in the scan, but did provide the team with pertinent documents regarding its processes relative to the topic area for consideration. The scan team’s full itinerary provided in Appendix D. Appendix E identifies each agency’s key contacts, who met with the scan team during the course of this project.
Organization of the ReportIn the chapters that follow, the information that the scan team learned regarding each of the four key topic area themes is presented in detail:
n Measures used to assess safety and operational performance in work zones
n Data collected to compute work zone performance measures
n Uses of performance measures and data for work zone safety and mobility improvement
n Work zone impact analyses and performance measures used during the project development process
These detailed chapters are followed by a summary of the scan’s key findings and recommendations and the scan team’s implementation strategy for national dissemination of this information to other transportation agencies.

C H A P T E R 2 : M E A S U R E S U S E D T O A S S E S S S A F E T Y A N D ` O P E R AT I O N A L P E R F O R M A N C E I N W O R K Z O N E S

2-1BEST PRACTICES IN WORK ZONE ASSESSMENT, DATA COLLECTION, AND PERFORMANCE EVALUATION
Measures Used to Assess Work Zone Safety Performance
By far, the scan team found that work zone crash measures were the most common type of performance measure used by agencies to assess and track safety in their work zones. In many cases, the measures were simple annual, quarterly, or monthly counts of work zone crashes throughout the agency’s jurisdiction. In addition, a few agencies monitor
specific crash severities (e.g., fatal or injury crashes) or specific crash types (e.g., crashes involving highway workers or work equipment).
Several agencies noted the inherent difficulties in using simple crash count numbers as a performance measure, as work zone exposure can significantly influence the frequency of crashes. Some agencies compare the percentages of certain types of crashes occurring outside of work zones with those occurring in the work zones. This relative comparison is often useful as an indicator of potential problem areas (e.g., a higher percentage of speed-involved crashes). However, it, too, suffers because of an inability to normalize the results to actual work zone exposure. For example, work zone crashes are often overrepresented in daylight, dry weather conditions. Intuitively, these particular factors are less likely to be actual safety issues and more likely to simply be conditions under which more work zones normally occur and when traffic volumes are higher.
C H A P T E R 2
Measures Used to Assess Safety and Operational Performance in Work Zones
Work Zone Safety Performance Measures Currently in Use
n Crash frequency (i.e., total, by different levels of severity)
n Percentages of crashes in various categories (e.g., severities, types of collisions, and contributing factors)
n Crash rates (i.e., per million-vehicle-miles)
n Crash costs
n Service patrol dispatch frequency
n Fire department dispatch frequency
n Speeds
n Speeding citation frequency
n Inspection scores
n Worker fatalities and injuries
n Work zone intrusion frequency

2-2
Ohio DOT compares its total annual work zone crash count numbers against the size of its annual construction budget. Although inflation and other factors that affect construction material prices over time can also bias this normalization effort, Ohio DOT has found it useful in tracking overall work zone safety trends. For example, Figure 2.1 illustrates that the downward trend in work zone crashes over the past 10 years is not simply a function of the state’s reduced construction spending. In fact, spending and crashes are trending in opposite directions, which is a very favorable pattern.
In addition to an overall assessment of the agency’s work zone safety trends, Ohio DOT also examines work zone crashes for a select number of significant projects as part of its historical work zone crash analyses. As depicted in Figure 2.2, the agency uses average daily traffic (ADT) values to estimate work zone crash rates before and during the project at each project site and examines the percentage change in crash rate per million-vehicle-miles (mvm). Unit crash costs are applied to the data as well to compare not only the crash rates, but also the societal costs of the crashes. A crash cost comparison accounts for potential changes in both crash frequency and severity.
Still another safety performance measure Ohio DOT uses is a near real-time comparison of crash frequency at certain ongoing projects with historical crash trends at the same locations prior to construction. The agency tracks and updates these comparisons on an ongoing basis to allow agency staff to identify any peculiar trends that may be developing. Ohio DOT also develops trends for the overall project over time and by location to help identify potential crash hotspots (see Figure 2.3). A team trained to identify underlying causes then investigates these hotspots further so that the agency can make improvements to the work zone.
Whereas crashes reportedly tend to be the most common measure of safety used by agencies to monitor work zone performance, they are not the only measure of interest. New Hampshire DOT,
C H A P T E R 2 : M E A S U R E S U S E D T O A S S E S S S A F E T Y A N D ` O P E R AT I O N A L P E R F O R M A N C E I N W O R K Z O N E S
Figure 2.1 Work zone crash trends versus size of construction budget

2-3BEST PRACTICES IN WORK ZONE ASSESSMENT, DATA COLLECTION, AND PERFORMANCE EVALUATION
Figure 2.2 Work zone crash rate and cost analysis

2-4
for example, also examines freeway service patrol and fire department dispatch calls by location throughout key work zones as one way to monitor safety performance in those work zones (see Figure 2.4). When compared against the normal rate of calls to a location, exceptionally high dispatch volume can be an indicator of a potential safety problem in the work zone that may need to be investigated more thoroughly. Likewise, the agency can monitor fire department and service patrol activity by time-of-day and day-of-week to assess trends associated with certain work periods.
Not all safety performance measures identified were related to crashes or incidents in work zones. A few agencies mentioned speeding citations as a surrogate indicator of work zone safety performance. In a few instances, these citations were monitored in conjunction with speed statistics gathered at a sample of work zones. The hypothesis was that higher levels of enforcement and citation issuance would result in slower speeds and fewer work zone crashes. However, no examples of this correlation were found during the scan. Furthermore, challenges will exist in establishing appropriate target levels for desired speed and citation issuance based on a safety improvement objective.
Several agencies cited work zone quality inspection scores as another safety performance measure category. Most agencies use this particular measure qualitatively, documenting potential problem areas observed in the implementation of the agency’s work zone traffic control and safety standards. However, both Oregon DOT and the New York State DOT utilized a quantitative approach, converting the inspections into formal rating scores of several specific topics and devices present in the work zone. This approach allows the agencies to evaluate particular topics as well as compare them across contractors or agency regions/districts. Figure 2.5 is an example of this type of evaluation.
C H A P T E R 2 : M E A S U R E S U S E D T O A S S E S S S A F E T Y A N D ` O P E R AT I O N A L P E R F O R M A N C E I N W O R K Z O N E S
Figure 2.3 Example of near real-time work zone safety performance measurement in Ohio

2-5BEST PRACTICES IN WORK ZONE ASSESSMENT, DATA COLLECTION, AND PERFORMANCE EVALUATION
Figure 2.4 Use of fire department and service patrol activity as safety performance measures in a New Hampshire work zone

2-6
C H A P T E R 2 : M E A S U R E S U S E D T O A S S E S S S A F E T Y A N D ` O P E R AT I O N A L P E R F O R M A N C E I N W O R K Z O N E S
Figure 2.5 Oregon DOT example of analysis of inspection scores by topic and region

2-7BEST PRACTICES IN WORK ZONE ASSESSMENT, DATA COLLECTION, AND PERFORMANCE EVALUATION
For each topic or device category, the New York State DOT inspection team provides a score between 0 (topic or device is missing entirely) to 5 (topic or devices are in excellent condition and are applied correctly) for that work zone. The goal is for all ratings to be a 4 or 5. The team then gives each work zone a letter grade based on how well it met the rating goal for all of the rated topics and devices:
n A = 95–100% of the topics rated in the work zone met the goal
n B = 85–94% of the topics rated in the work zone met the goal
n C = 75–84% of the topics rated in the work zone met the goal
n D = < 75% of the topics rated in the work zone met the goal
Projects receiving a grade of D are targeted for immediate remedial action to correct the deficiencies. The scores for each rated topic from each project are then entered into a spreadsheet for further analyses. The department then computes the percent of work zones inspected that met their stated goal of having all topics rated at a 4 or 5. This percentage has hovered at around 85 percent or so for the past four years. In addition, the average scores of each topic can be computed statewide, across regions, or in several other stratifications to help identify areas of additional training emphasis or other agency processes that should be improved during the following construction season. The process used by Oregon DOT is very similar in structure to the New York State DOT’s approach.
The Missouri DOT also relies on inspection scores as a safety performance measure in its work zones. Trained agency staff rate a sample of work zones on several indicators of visibility in the work zone (i.e., devices used to convey clear, positive guidance to the motorist). They then combine these ratings to determine whether the work zone meets the agency’s expectation regarding adequate visibility in the work zone. Missouri DOT tracks over time the percentage of inspected work zones meeting expectations regarding visibility.
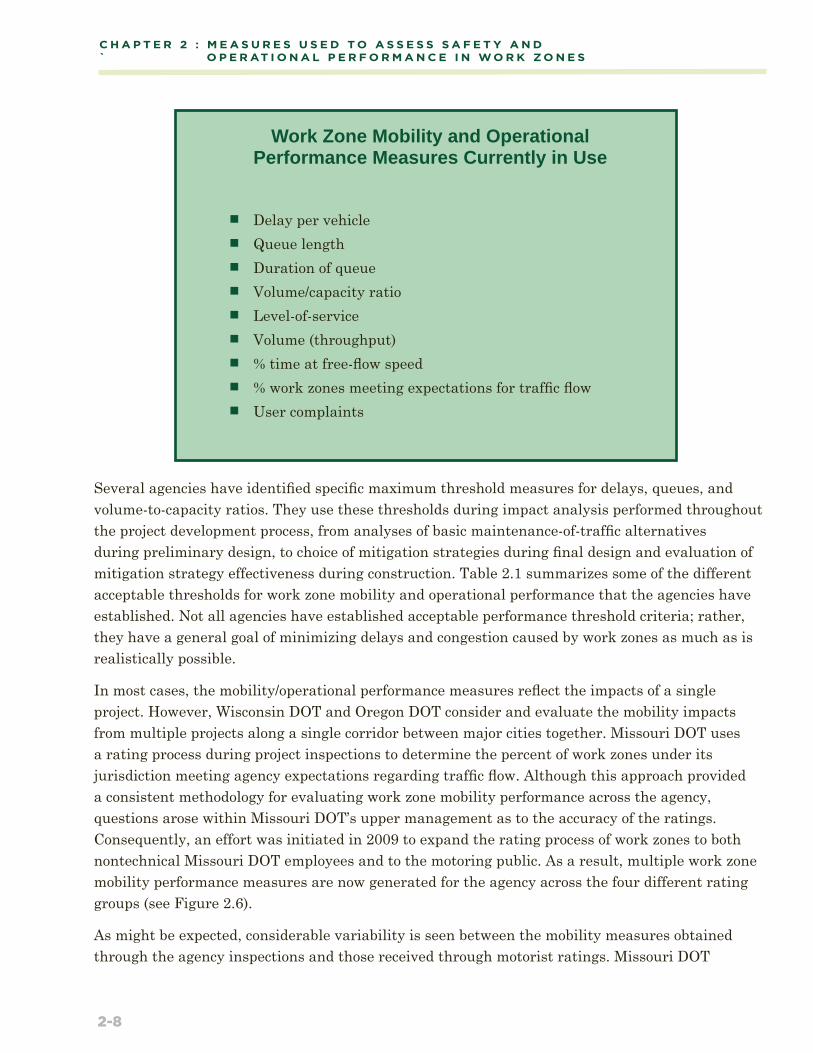
Measures Used to Assess Work Zone Mobility or Operational PerformanceThe scan team found that the most common measures of work zone mobility performance cited by the agencies were traffic delays per vehicle, queue lengths, and duration of queues. Other measures mentioned included the volume-to-capacity ratio, level-of-service, volume or throughput, percent of time operating at free-flow speeds, and percent of work zones meeting expectations for traffic flow. The agencies commonly cited user complaints about delays as a measure of work zone performance. Some agencies specify the use and consideration of different performance measures for different types of facilities on which work zones are located. The permitted lane closure charts and analysis methodologies used by several of the agencies are based on de facto performance measures of maximum acceptable delays and queues. In many cases, that threshold is zero (i.e., acceptable lane closure hours exist when it is anticipated that no queues or delays will be created).
2-8
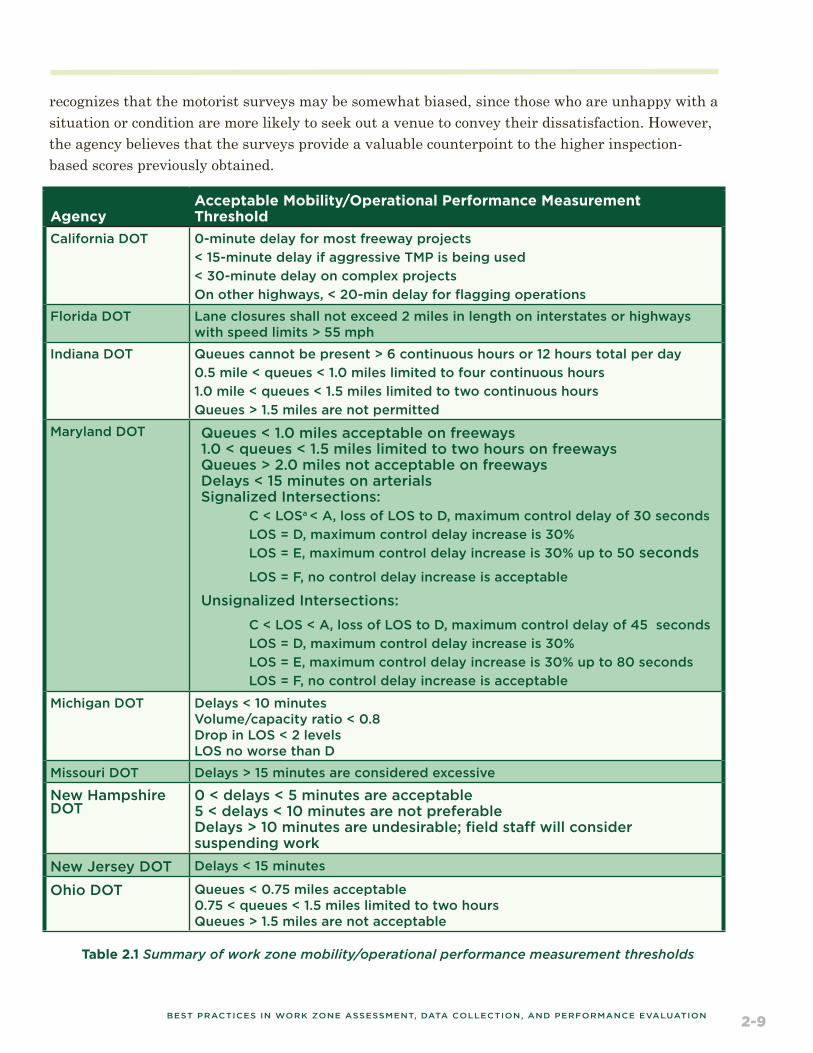
Several agencies have identified specific maximum threshold measures for delays, queues, and volume-to-capacity ratios. They use these thresholds during impact analysis performed throughout the project development process, from analyses of basic maintenance-of-traffic alternatives during preliminary design, to choice of mitigation strategies during final design and evaluation of mitigation strategy effectiveness during construction. Table 2.1 summarizes some of the different acceptable thresholds for work zone mobility and operational performance that the agencies have established. Not all agencies have established acceptable performance threshold criteria; rather, they have a general goal of minimizing delays and congestion caused by work zones as much as is realistically possible.
In most cases, the mobility/operational performance measures reflect the impacts of a single project. However, Wisconsin DOT and Oregon DOT consider and evaluate the mobility impacts from multiple projects along a single corridor between major cities together. Missouri DOT uses a rating process during project inspections to determine the percent of work zones under its jurisdiction meeting agency expectations regarding traffic flow. Although this approach provided a consistent methodology for evaluating work zone mobility performance across the agency, questions arose within Missouri DOT’s upper management as to the accuracy of the ratings. Consequently, an effort was initiated in 2009 to expand the rating process of work zones to both nontechnical Missouri DOT employees and to the motoring public. As a result, multiple work zone mobility performance measures are now generated for the agency across the four different rating groups (see Figure 2.6).
As might be expected, considerable variability is seen between the mobility measures obtained through the agency inspections and those received through motorist ratings. Missouri DOT
C H A P T E R 2 : M E A S U R E S U S E D T O A S S E S S S A F E T Y A N D ` O P E R AT I O N A L P E R F O R M A N C E I N W O R K Z O N E S
Work Zone Mobility and Operational Performance Measures Currently in Use
n Delay per vehicle
n Queue length
n Duration of queue
n Volume/capacity ratio
n Level-of-service
n Volume (throughput)
n % time at free-flow speed
n % work zones meeting expectations for traffic flow
n User complaints
2-9BEST PRACTICES IN WORK ZONE ASSESSMENT, DATA COLLECTION, AND PERFORMANCE EVALUATION
recognizes that the motorist surveys may be somewhat biased, since those who are unhappy with a situation or condition are more likely to seek out a venue to convey their dissatisfaction. However, the agency believes that the surveys provide a valuable counterpoint to the higher inspection-based scores previously obtained.
AgencyAcceptable Mobility/Operational Performance Measurement Threshold
California DOT 0-minute delay for most freeway projects
< 15-minute delay if aggressive TMP is being used
< 30-minute delay on complex projects
On other highways, < 20-min delay for flagging operations
Florida DOT Lane closures shall not exceed 2 miles in length on interstates or highways with speed limits > 55 mph
Indiana DOT Queues cannot be present > 6 continuous hours or 12 hours total per day
0.5 mile < queues < 1.0 miles limited to four continuous hours
1.0 mile < queues < 1.5 miles limited to two continuous hours
Queues > 1.5 miles are not permitted
Maryland DOT Queues < 1.0 miles acceptable on freeways 1.0 < queues < 1.5 miles limited to two hours on freeways Queues > 2.0 miles not acceptable on freeways Delays < 15 minutes on arterials Signalized Intersections: C < LOSa < A, loss of LOS to D, maximum control delay of 30 seconds
LOS = D, maximum control delay increase is 30%
LOS = E, maximum control delay increase is 30% up to 50 seconds
LOS = F, no control delay increase is acceptable
Unsignalized Intersections:
C < LOS < A, loss of LOS to D, maximum control delay of 45 seconds
LOS = D, maximum control delay increase is 30%
LOS = E, maximum control delay increase is 30% up to 80 seconds
LOS = F, no control delay increase is acceptable
Michigan DOT Delays < 10 minutes Volume/capacity ratio < 0.8 Drop in LOS < 2 levels LOS no worse than D
Missouri DOT Delays > 15 minutes are considered excessive
New Hampshire DOT
0 < delays < 5 minutes are acceptable 5 < delays < 10 minutes are not preferable Delays > 10 minutes are undesirable; field staff will consider suspending work
New Jersey DOT Delays < 15 minutes
Ohio DOT Queues < 0.75 miles acceptable 0.75 < queues < 1.5 miles limited to two hours Queues > 1.5 miles are not acceptable
Table 2.1 Summary of work zone mobility/operational performance measurement thresholds

2-10
AgencyAcceptable Mobility/Operational Performance Measurement Threshold
Pennsylvania DOT Delays < 15 minutes are acceptable 15 minutes < delays < 30 minutes limited to two consecutive hours
Oregon DOT Project delays < 10% of the peak travel times
Corridor delays (all projects combined) < 10% of peak travel times
Wisconsin DOT Maximum of 15 minutes of added delay between major city nodes (all potential projects along route combined)
aLevel of service
Extent of Performance Measurement Use Across the Agency or RegionOverall, the scan team found that the level of performance measurement application to work zones varied from agency to agency, by type of measure, by how the measure was being used, and by the extent to which data to generate that measure were available. The periodic review of work zone crashes generally encompasses all work zones occurring within a particular jurisdiction, and so is most often a process or program review activity. Meanwhile, the consideration of a project’s potential mobility impacts during planning and design can be considered a project-level
C H A P T E R 2 : M E A S U R E S U S E D T O A S S E S S S A F E T Y A N D ` O P E R AT I O N A L P E R F O R M A N C E I N W O R K Z O N E S
Table 2.1 Summary of work zone mobility/operational performance measurement thresholds (continued)
Figure 2.6 Differences in work zone mobility performance measures “meeting expectations for traffic flow” by rating group

2-11BEST PRACTICES IN WORK ZONE ASSESSMENT, DATA COLLECTION, AND PERFORMANCE EVALUATION
activity and is practiced by many agencies to some degree. In terms of monitoring during project implementation, though, the application of both safety and mobility performance measures is much more of a sampling activity at the project level, with emphasis placed on those work zones where impacts are expected to be most significant.
Problems Encountered in Applying Performance MeasuresThe scan team heard a number of common concerns and challenges associated with the development and use of work zone safety and mobility performance measures among the agencies. The first challenge was the difficulty of allocating enough staff time to allow the measures to be applied throughout the project cycle and obtaining consistent interpretation and application of work zone performance measurement policies and procedures throughout the agency. Agencies that were successful in this regard had the official support of upper management, which allocated the necessary resources and established performance measurement use as a priority for managing the system.
The second challenge, which was cited by a few agencies, was the costs associated with obtaining high quality and consistent mobility data from the field. Some agencies also mentioned that a lack of timely work zone crash data was a key impediment to being able to identify potential safety problems while a work zone was in place so that corrective actions could be taken.
Another concern was data accuracy. For example, a few agencies noted that they regularly encountered disparities between the number of work zone fatalities and work zone fatal crashes the agency believed had occurred in a given year and the numbers reported by the Fatal Analysis Reporting System (FARS), a national database maintained by the National Highway Traffic Safety Administration (NHTSA).
Lessons Learned Regarding the Use of Performance MeasuresThe agencies shared with the scan team a number of tips and lessons learned about the development and use of work zone safety and mobility performance measures. One of the most important points several agencies made was that the availability of data is what actually drives the performance measures that are used, even if those measures are not necessarily what the agency would use if access to (and cost of) data were not a consideration. For example, several agencies indicated that it would be preferable to track work zone fatality rates over time on a ve-hicle-miles-traveled basis, as that measure could be compared both across projects and over time. Unfortunately, most agencies do not have the work zone vehicle mileage exposure numbers that are needed to compute a crash rate, and so they can only monitor actual crash numbers over time.
Agencies also indicated that it was important to have a plan for how the measures will be used to influence agency processes and procedures. For example, several agencies used the results of division- or statewide performance inspections or reviews to determine the topics that would be emphasized for improvement during the next year’s training. The timing of data availability may be an important consideration in this feedback process.

2-12
Although agencies indicated that work zone performance measures were useful as a means of improving their operations, they noted that the measures must be applied rationally. Depending on the situation, the measures may apply to all projects or only to a sample of them (i.e., those expected to significantly affect mobility). Agencies also need to remember that motorists do not know the difference between federal-aid roads and others as it relates to the need for mobility and safety considerations. To the motorist or other traveler, what defines the level of significance is the magnitude of the impacts created and the amount of travel impacted.
Finally, agencies acknowledged that the use of performance measures needs to be institutional-ized within an agency’s structure and processes in order to be fully effective. This requires the support and buy-in of agency leadership. Such institutionalization will make it easier for agencies to obtain the resources necessary to gather and analyze data, to establish feedback communication loops, and to allow all involved personnel throughout the organization to be educated about the process and performance measurement outcomes being obtained.
C H A P T E R 2 : M E A S U R E S U S E D T O A S S E S S S A F E T Y A N D ` O P E R AT I O N A L P E R F O R M A N C E I N W O R K Z O N E S

2-13
C H A P T E R 3 : DATA C O L L E C T E D TO C O M P U T E WO R K ZO N E P E R F O R M A N C E M E A S U R E S

3-1BEST PRACTICES IN WORK ZONE ASSESSMENT, DATA COLLECTION, AND PERFORMANCE EVALUATION
Sources of Work Zone Safety Data
All of the agencies reported using police crash reports as one of their primary sources of data for work zone safety performance measurement. Also, agencies commonly track the injuries to their own employees on the job site. One of the key issues associated with the use of police crash report data for work zone safety performance assessment is
the lag time between the time of the crash and the time that the data are available to the highway agency for review and analysis. In some cases, this lag can be as much as one year. Obviously, such a lag limits the extent to which the agency can monitor safety at a current project and make corrections as needed.
Those states that have moved toward electronic crash report entry by police agencies have seen a dramatic reduction in this data lag time. For example, Indiana DOT estimates that 86 percent of crash report forms are now entered into the statewide database and accessible for analysis within five days of the incident.
If a region has not yet implemented an electronic crash reporting system, options are more limited in terms of obtaining crash data on a timely enough basis to monitor current work zones. Ohio DOT personnel gather hard copies of the police crash reports at major projects every two weeks and manually code that data into a database so that current crash statistics on those projects can be monitored, as illustrated in Figure 2.3.
In some instances, agency field personnel collect additional data for some of the work zone crashes that do occur. These forms supplement the police crash report form, providing additional details regarding the type of work zone traffic control that was in place at the time of the crash, the
C H A P T E R 3
Data Collected to Compute Work Zone Performance Measures
Sources of Work Zone Safety Datan Police crash reports
n DOT supplemental crash data collection
n Inspection reports
n Service patrol/fire department calls
n TMC incident reports
n Customer complaints

3-2
temporary pavement conditions created by the work zone, and other details not typically captured within the police crash report form. Some agencies informally review these supplemental reports periodically to look for trends, whereas other agencies enter them into a spreadsheet for more formal analyses. An example of a more formal analysis of supplemental crash data by Florida DOT is shown in Figure 3.1.
New York State DOT has probably the most formalized processes for collecting supplemental work zone crash and worker accident data. Project staff gather all types of work zone traffic crash and worker accident data and enter them into a database for various types of trend analyses (e.g., illustrated in Figure 3.2for intrusion crashes).
Other sources of work zone safety data include inspection reports prepared by project staff or agency quality assurance review teams. Agencies that assign scores or ratings to individual devices or configurations (as opposed to simply indicating that items are acceptable or unacceptable) can provide a finer level of detail and allow more to be done with the collected data, as was discussed in Chapter 2 for Oregon DOT and NYSDOT. Examples of inspection rating forms from New York State DOT and Illinois Tollway are provided in Figure 3.3 and Figure 3.4, respectively.
Service patrol and/or fire department dispatches to locations within the work zone, incident reports captured as part of TMC operations, and customer complaints can also serve as data for assessing work zone safety performance. In addition, traffic operational data from a TMC or portable work zone Intelligent Transportation System (ITS) deployment can also serve as surrogate safety measures. Speed measures (e.g., percent exceeding the posted speed limit, speed differentials, and speed variance) are common safety surrogates. Spot speed data can also be used to identify the onset and location of queues and congestion that may develop due to the work zone.
C H A P T E R 3 : DATA C O L L E C T E D TO C O M P U T E WO R K ZO N E P E R F O R M A N C E M E A S U R E S

3-3BEST PRACTICES IN WORK ZONE ASSESSMENT, DATA COLLECTION, AND PERFORMANCE EVALUATION
Figure 3.1 Example analysis of supplemental work zone crash data used by Florida DOT
Figure 3.2 Example analysis of supplemental work zone crash data used by New York State DOT

3-4
C H A P T E R 3 : DATA C O L L E C T E D TO C O M P U T E WO R K ZO N E P E R F O R M A N C E M E A S U R E S
Figure 3.3 Example work zone traffic control inspection form used by New York State DOT

3-5BEST PRACTICES IN WORK ZONE ASSESSMENT, DATA COLLECTION, AND PERFORMANCE EVALUATION
Figure 3.3 Example work zone traffic control inspection form used by New York State DOT (Continued)

3-6
Sources of Work Zone Mobility/Operational DataMost agencies use multiple data sources to gather mobility and operational performance data in work zones. From a mobility/operations performance measurement perspective, data can be gathered manually or electronically. Manual data collection methods typically involve staff recording travel times and queue lengths on a sampling basis at work zones identified as having potential mobility concerns. Project engineer and inspector visual monitoring of conditions can also be considered a type of data, although the extent to which such observations are consistently and thoroughly documented in project diaries or elsewhere varies from person to person. In some jurisdictions, data collection personnel gather a sample of operational data (typically travel times, speeds, and/or queue lengths) from those work zones where mobility impacts may occur. At some agencies, project staff perform monitoring and documentation; Michigan DOT hires student interns to do the travel time runs and document impacts at the various projects.
At least one agency, Pennsylvania DOT, has attempted to utilize law enforcement personnel to collect queue length data while providing overtime-duty enforcement services. However,
C H A P T E R 3 : DATA C O L L E C T E D TO C O M P U T E WO R K ZO N E P E R F O R M A N C E M E A S U R E S
Figure 3.4 Work zone inspection form used by Illinois Tollway

3-7BEST PRACTICES IN WORK ZONE ASSESSMENT, DATA COLLECTION, AND PERFORMANCE EVALUATION
the amount and quality of this type of data collection by enforcement personnel has varied dramatically from project to project, making it difficult for the agency to rely on this data source. For work zones that have deployed portable ITS devices or are within the limits of a permanent transportation management system, electronic sensors can continuously provide detailed volume, speed, and occupancy data.
Electronic data collection, on the other hand, provides a continuous source of operational data, but typically at a significant cost if the data are obtained strictly for work zone monitoring purposes. A few agencies (e.g., New Hampshire DOT) have deployed work zone ITS with spot sensors to monitor volumes and speeds before and throughout the work zone. User complaints and survey results can serve as qualitative data sources, alerting the agency to potential operational problems in specific work zones that warrant additional investigation.
Forms Used to Collect DataAll of the agencies that are gathering supplemental work zone crash data utilize a specific form to ensure data consistency and collection quality. The agencies that rely on manual sampling methods to gather work zone mobility data also typically develop and utilize a specific data collection form and instructions on how to collect the data (see Figure 3.5 for an example of such a form used by Michigan DOT). This form is used to sample traffic conditions during the peak period. If impacts were noted, additional sampling would occur that day and on subsequent days. If no delays or queues were detected, the work zone might not receive further monitoring or might only be monitored infrequently.
Sources of Work Zone Safety Datan Manual or electronic (i.e., camera) visual inspection of
acceptable travel conditions
n Manual sampling of travel times, speeds, and queue lengths
n Electronic monitoring of speeds, volumes, and lane occupancies
n Electronic monitoring of elapsed travel times via Bluetooth or other technology
n User complaints

3-8
C H A P T E R 3 : DATA C O L L E C T E D TO C O M P U T E WO R K ZO N E P E R F O R M A N C E M E A S U R E S
Figure 3.5 Manual collection form for work zone mobility and operational data used by Michigan DOT

3-9BEST PRACTICES IN WORK ZONE ASSESSMENT, DATA COLLECTION, AND PERFORMANCE EVALUATION
Figure 3.5 Manual collection form for work zone mobility and operational data used by Michigan DOT (Continued)

3-10
C H A P T E R 3 : DATA C O L L E C T E D TO C O M P U T E WO R K ZO N E P E R F O R M A N C E M E A S U R E S
Most agencies also develop specific forms for performing visual inspections of each work zone. Some forms are relatively basic, identifying categories of traffic control devices (e.g., signs, channelizing devices, and markings) and indicating if they are in the proper location and functional. Other agencies have developed much more extensive inspection forms and have established a more stringent evaluation protocol (see Figure 2.5 for an example from New York State DOT).
Data and Performance Measurement Requirements in Trans-portation Management PlansMost agencies rely on project staff to monitor work zone safety and mobility impacts. Consequently, not all agencies explicitly address or require data and performance measurement monitoring as part of the TMP. A few agencies currently or soon will require that work zone monitoring be included in TMPs. Several agencies indicated that the need for extensive monitoring was limited to a few key projects each year, with the rest requiring only limited monitoring to verify that no significant impacts were occurring.
As illustrated in Figure 3.5, Michigan DOT has a formalized monitoring approach that it incorporates into its TMPs. Specifically, Michigan DOT requires regular and ongoing monitoring of significant projects to ensure that mobility thresholds are not being exceeded. For non-significant projects, project personnel only initially verify that adverse impacts are not being generated by the work zone. However, follow-up monitoring may occur depending on the project’s characteristics and the monitoring needs at other projects.
Use of Contractor and Agency Inspector ObservationsOverall, the scan team found that most agencies relied on their inspectors’ observations and on other safety or operational characteristics (e.g., frequent crashes at a location and queues developing) as “alarms” that something at a work zone is wrong and may require attention. Concerns or issues raised regarding a particular project would most often be documented in project diaries and relayed to the appropriate person(s) within the agency.
The Role of Transportation Management Centers in Capturing Work Zone Performance InformationMost agencies that have operational TMCs rely on them for monitoring and managing work zone impacts on routes within TMC coverage. Some agencies (e.g., California DOT, Maryland DOT, and Illinois Tollway) require that the TMC be notified when a lane closure is installed and again when it is removed. These notifications are compared against the lane closure schedule list.
Typically, a work zone is treated as a type of incident within the TMC. TMC staff is responsible for using the available ITS devices and information sources (e.g., dynamic message signs, highway advisory radio, 511 hotline updates, traveler information Web site updates, service patrol dispatch, and coordination with emergency response) to mitigate the impacts of the work zone on the motoring public (Figure 3.6).

3-11BEST PRACTICES IN WORK ZONE ASSESSMENT, DATA COLLECTION, AND PERFORMANCE EVALUATION
Furthermore, TMC staff may also be responsible for managing the use of portable changeable message signs, temporary cameras, or other work zone-related ITS devices at a particular project. In a few cases, the work zone TMP has included specific guidance on the TMC resources to be used during the project to mitigate mobility and safety impacts.
In most cases, TMCs offer a wealth of archived operational data regarding the impacts of a work zone upon the motoring public. With the right expertise and resources, TMC data can be used to continually estimate delays for comparison to a facility’s historical averages, to track changes in and operating speeds along a route to identify congestion hotspots, and to evaluate the impacts of lane and full road closures upon traffic demands and conditions on other routes in the network. Examples of some of these types of analyses are illustrated in Figure 3.7, a Michigan DOT evaluation of the impact on volumes, speeds, and travel times of the full closure of a portion of I-75 in Detroit on a section of the interstate adjacent to the closure.
Figure 3.6 Managing incident and work zone traffic impacts at the Maryland DOT TMC

3-12
C H A P T E R 3 : DATA C O L L E C T E D TO C O M P U T E WO R K ZO N E P E R F O R M A N C E M E A S U R E S
Figure 3.7 Examples of work zone volume, speed, and travel time impact analyses computed from TMC data in Detroit
3-13BEST PRACTICES IN WORK ZONE ASSESSMENT, DATA COLLECTION, AND PERFORMANCE EVALUATION
Use of Customer Surveys and Complaints for Monitoring Work Zone PerformanceRegardless of the other types of monitoring that may be occurring, agencies still rely heavily on the public’s complaints as a key information source for work zone problems that need attention. Whereas such complaints might have been received by mail or telephone in the past, they are now as likely to be received via e-mail or even by newer social networking technologies, such as Facebook or Twitter.
In addition to examining and addressing customer complaints, several agencies also reported conducting or commissioning customer surveys to gain feedback regarding work zone safety and mobility performance. Examples were provided of both project-specific surveys designed to evaluate the motorist’s perceptions of impacts and mitigation effectiveness and agency-wide assessments in which the agency’s attention to work zones was but one part of the survey. Agencies also noted that they had established simple methods of contacting the department to enable customer feedback through its Web site as well as through any project-specific Web sites that may have been established.
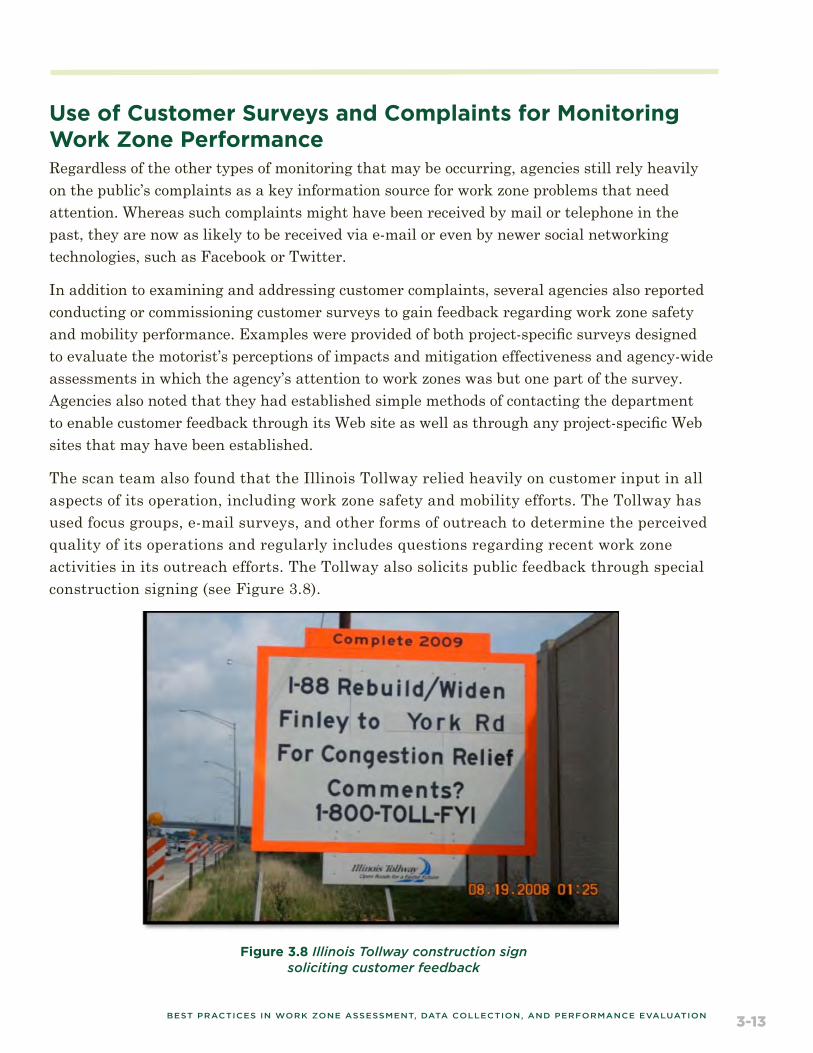
The scan team also found that the Illinois Tollway relied heavily on customer input in all aspects of its operation, including work zone safety and mobility efforts. The Tollway has used focus groups, e-mail surveys, and other forms of outreach to determine the perceived quality of its operations and regularly includes questions regarding recent work zone activities in its outreach efforts. The Tollway also solicits public feedback through special construction signing (see Figure 3.8).
Figure 3.8 Illinois Tollway construction sign soliciting customer feedback

3-14
C H A P T E R 3 : DATA C O L L E C T E D TO C O M P U T E WO R K ZO N E P E R F O R M A N C E M E A S U R E S
As mentioned previously, Missouri DOT makes the most extensive use of customer surveys as input into agency work zone safety and mobility performance. The agency has established a specific role for regular customer feedback as part of its ongoing monitoring of work zone safety and mobility. The agency invites motorists to go to the Missouri DOT Web site (http://www.modot.mo.gov) and rate the work zone they recently drove through, using the following nine questions (a hard copy of these questions can also be obtained at visitor centers and other locations):
1. Did you have enough warning before entering this work zone?
2. Were the signs and/or traffic signals easy to see?
3. Did the signs provide clear instructions?
4. Did you understand the flagger’s directions?
5. Did the cones, barrels, or striping guide you through the work zone?
6. Was the posted speed limit appropriate for the work zone activity?
7. Did you make it through the work zone in a timely manner? If “No,” please provide the reason for the rating.
8. Did the work zone look neat, clean, and organized?
9. Were you able to travel safely in the work zone? If “No,” please provide the reason for the rating.
These data are entered directly into a reporting database for immediate access by agency personnel.
In addition to the general public, nontechnical Missouri DOT employees are requested to comment on work zones they drive through as well. Their responses are kept separate from those of the general public due to the possibility of loyalty bias. This separation seems appropriate, given the sometimes dissimilar ratings for each question given to work zones by non-Missouri DOT employees and Missouri DOT employees (see Figure 3.10). It is interesting to note that both inspectors and the nontechnical Missouri DOT employees rate work zones, on average, fairly similarly, whereas the non-Missouri DOT customer responses are consistently lower.
3-15BEST PRACTICES IN WORK ZONE ASSESSMENT, DATA COLLECTION, AND PERFORMANCE EVALUATION
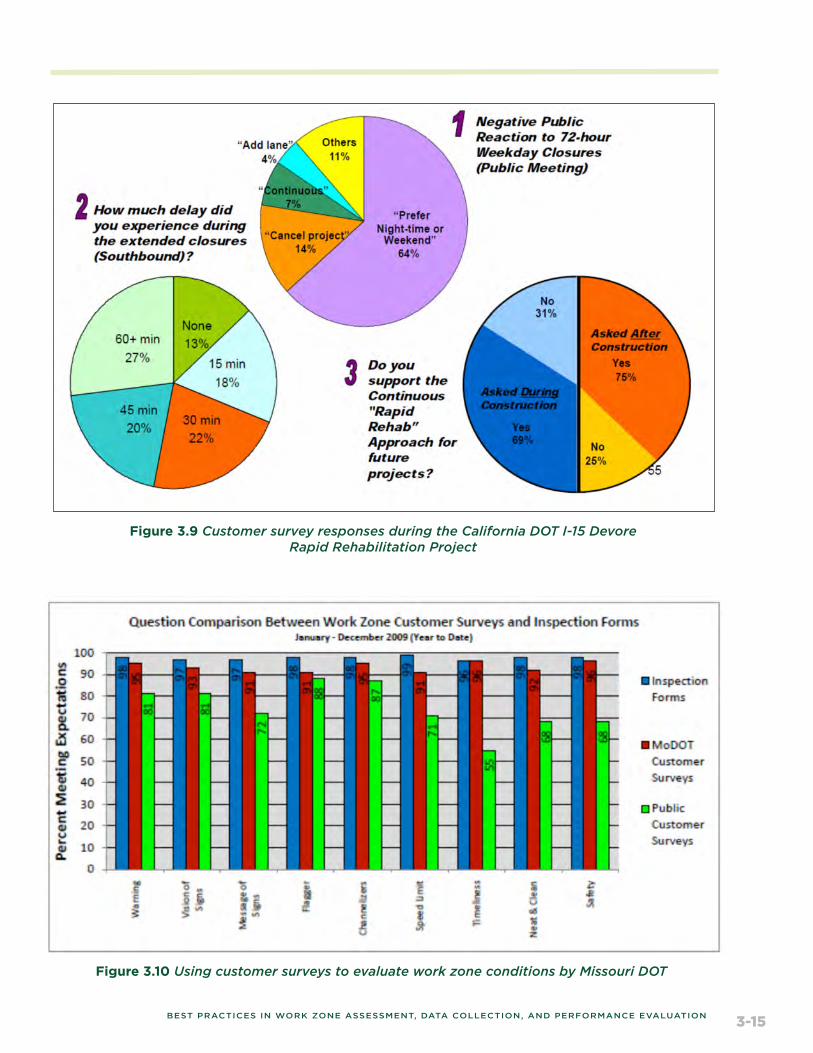
Figure 3.9 Customer survey responses during the California DOT I-15 Devore Rapid Rehabilitation Project
Figure 3.10 Using customer surveys to evaluate work zone conditions by Missouri DOT

3-16
C H A P T E R 3 : DATA C O L L E C T E D TO C O M P U T E WO R K ZO N E P E R F O R M A N C E M E A S U R E S
Costs of Monitoring Work Zone PerformanceThe cost of monitoring work zone performance can vary significantly, depending on the type of monitoring performed, the size of the project, and the anticipated magnitude of impacts. New Hampshire DOT reported that a recent work zone ITS deployment in its jurisdiction cost 1.2 percent of the total project budget. This deployment allows the agency to actively manage traffic and provide real-time information to the motorist, and so has much more value than if it were used just for monitoring. The scan obtained very little additional information on the costs of work zone monitoring.
Sources of Funding for Work Zone Performance MonitoringAgencies reported using multiple funding sources for work zone performance monitoring. In some instances, monitoring technology for a specific project (i.e., a work zone ITS) was funded as part of the overall project budget. In other cases, project funding was used to pay for manual data collectors. In still other instances, data collection was funded as part of normal agency operations and performed by full-time staff, who are also responsible for reducing and analyzing the data once it is brought back to the office. Agencies that make work zone safety and mobility performance a high priority generally allocate a greater amount of staff time and other resources to these efforts.
Technologies Used for Work Zone Performance MonitoringA number of the agencies have tried limited work zone ITS deployments, with mixed perceived benefits. A few states indicated that fully packaged work zone ITS deployments were too expensive. Other agencies (e.g., New Hampshire DOT), are finding value in work zone ITS deployments and are tracking a number of mobility-related measures. The availability of work zone ITS data is allowing the agency to better determine hourly and daily fluctuations in traffic volumes and how typical traffic delays that normally occur within the project are or are not being increased by the work zone.
Some agencies have started looking at more flexible, lower-cost monitoring options, such as positioning temporary cameras or nonintrusive sensors along a roadway section. They would feed data back to a TMC to provide the capability of monitoring the work zone without the potentially large expense of a fully self-contained work zone ITS. Other agencies were looking at using third-party, private-sector travel time sources based on probe vehicles to monitor work zone performance.
Several agencies reported interest in the use of Bluetooth1 wireless technology as a simple, easy way to track elapsed travel times through work zones. Sensors located on the roadside detect an activated Bluetooth-enabled device (e.g., smartphone, hands-free calling features, and GPS navigational aid) in a vehicle and attempt to match the signature downstream at another sensor station. The time between matching signatures at two stations is the elapsed travel time between those stations (see Figure 3.11). Currently, between 5 and 12.5 percent of vehicles have some type of Bluetooth-enabled device that can be tracked by these sensors. The overall cost of this technology is relatively low.
1 Bluetooth is a registered trademark of Bluetooth SIG, Inc.

3-17BEST PRACTICES IN WORK ZONE ASSESSMENT, DATA COLLECTION, AND PERFORMANCE EVALUATION
Indiana DOT has experimented with this technology in two work zone applications, with promising results. The system is able to correlate changes in estimated travel times with various lane-blocking events within the work zone that significantly increase delays (see Error! Reference source not found.). These tests also showed the potential for tracking delays by diverting to an alternative route. While additional research is needed to better understand the accuracy and precision of the technology, these tests indicate that this technology has promise for aiding in work zone delay monitoring in the future.
Figure 3.11 Example of tracking a Bluetooth-enabled device address over time in Indiana
Figure 3.12 Example of tracking a Bluetooth-enabled device address over time in Indiana

3-18
Whereas elapsed travel time data collection methodologies provide the most direct method of monitoring delays due to work zones, speed and volume data at a point location can also be important. Such data is needed to detect and monitor the onset, length, and duration of queues; vehicle throughput past the work zone; speed differentials and variance; and other measures. Traditionally, these data were only available in urban areas, where a transportation management system that relied on point sensors had been installed. In recent years, emphasis on the development of a portable work zone ITS has yielded portable spot sensor devices that can be quickly brought to a location and removed after the work is completed.
In most cases, portability is achieved by attaching the sensor to a trailer in conjunction with solar panels, batteries, and cellular or other data communication capabilities. However, one vendor has extended work zone traffic data collection portability even further by incorporating batteries, a global positioning satellite (GPS) antenna, radar, and satellite and cellular communication modems into a traditional plastic channelizing drum (see Figure 3.13). The drum can be easily carried out to the job site and positioned where data collection is desired. The device captures speed or volume data that is then uploaded to the vendor’s Web site for automatic processing. Next, the data is sent back out via a Web site for the agency to use or share with the public, or directly to field devices or to a TMC to display current travel times, delays, or queue lengths on dynamic message signs or the agency’s Web site. When the work is completed or the data is no longer needed, the device can be picked up and returned to the field office for charging, then be taken to different locations as needed. Test deployments of this type of technology have shown promising results.
In addition to their interest in using emerging data collection technologies, a few agencies are also interested in obtaining real-time travel time probe data from third-party vendors. Pennsylvania DOT, in particular, has expressed interest in purchasing access to probe travel time data for interstates, freeways, and major corridors where no traffic surveillance instrumentation currently exists. The data would be fed into the state 511 system and would also be used as an indication
C H A P T E R 3 : DATA C O L L E C T E D TO C O M P U T E WO R K ZO N E P E R F O R M A N C E M E A S U R E S
Figure 3.13 Portable work zone traffic data collection and communication technology

3-19BEST PRACTICES IN WORK ZONE ASSESSMENT, DATA COLLECTION, AND PERFORMANCE EVALUATION
of possible traffic disruptions along the route, including those caused by work zones. At the time of this scan, it was estimated that this type of data would cost approximately $750 per centerline mile per year.
Agency Challenges to Work Zone Performance MonitoringThrough the scan effort, the team identified several key challenges that agencies mentioned with respect to work zone safety and mobility performance monitoring. It should be noted here that most agencies are still “finding their way” with work zone performance monitoring. The scan team frequently heard agencies indicate that they had not fully explored the data sources or data management capabilities that are available to them for monitoring purposes, but had plans to do so in the future.
One of the more common challenges the agencies noted was convincing upper management of the value of monitoring and efforts to mitigate work zone safety and mobility impacts. As staff at one agency put it, it is sometimes difficult to justify the use of limited agency project funds to obtain societal (road-user-cost) benefits. It is not easy to calculate the tradeoffs between reducing impacts from projects performed and losing benefits from projects not performed due to a lack of funds.
Another challenge that many agencies face is trying to ascertain the appropriate level of monitoring and analysis of work zone safety and mobility impacts. In the words of one agency, not all work zones require a full-blown continuous monitoring or analysis effort; many projects can be accommodated adequately with a more moderate approach. However, for most agencies, deciding when and where to use different levels of effort is currently more of an art than a science.
Finally, it can be very challenging for agency work zone and traffic personnel to get buy-in and cooperation from agency field staff for work zone monitoring and analysis purposes, especially if they will be required to expend some level of additional effort. Field staff already have a large number of pressures placed upon them (in addition to ensuring that work zone safety and mobility goals are being met), and so they may resist requests and possibly even mandates regarding increased work zone monitoring and data collection.

3-20
C H A P T E R 4 : U S E S O F P E R F O R M A N C E M E A S U R E S A N D DATA F O R W O R K Z O N E S A F E T Y A N D M O B I L I T Y I M P R O V E M E N T

4-1BEST PRACTICES IN WORK ZONE ASSESSMENT, DATA COLLECTION, AND PERFORMANCE EVALUATION
Use of Data and Measures to Improve Agency Work Zone Policy and Procedures
Overall, the scan team observed a wide range of responses about agency use of data and performance measurement. From a safety performance perspective, most agencies indicated that they modified their training priorities and emphasis areas each year based on their reviews of crash types and project reviews/inspections. Beyond this,
some agencies have solid feedback processes in place to identify policy and procedure improve-ments based on the data and performance measures, whereas other agencies were more limited in this regard. It should be noted that not all agencies have gone through a full policy and process review cycle as required in the work zone safety and mobility final rule, and so have not yet had to address this issue completely.
As one example of the use of work zone data and performance measures, California DOT recently modified several of its maintenance activities policies and traffic safety systems decisions because of multiple California DOT maintenance worker fatalities. The agency is in the process of replacing all metal beam guardrail median barrier with concrete median barrier, even though it is more costly, because it will reduce maintenance worker exposure relative to the continued repair cycle of the existing guardrail. The agency also updated its maintenance manual to:
n Place increased emphasis on safety while working in freeway gore areas
n Advocate the use of safe chemical herbicides that reduce the need for on-foot vegetation control efforts in the roadway right-of-way be expanded
n Urge that more full roadway closures be used to conduct “extreme maintenance” operations be considered to reduce overall maintenance worker exposure risk to traffic (The extreme maintenance approach utilizes multiple work crews to complete a series of maintenance activities on a roadway segment as quickly as possible while the road is closed.)
With California DOT’s support, a new “Move Over Law” has recently been enacted for highway workers.
As another example of how work zone data and performance measurement are being used to modify agency policies, PennDOT is currently considering simplifyingits delay threshold criteria of
C H A P T E R 4
Uses of Performance Measures and Data for Work Zone Safety and Mobility Improvement

4-2
acceptable and unacceptable impacts to identify significant projects. The existing policy is complex, identifying different maximum delay thresholds for different acceptable durations. The agency has encountered significant confusion in the field about implementing this policy. Consequently, Pennsylvania DOT is proposing that delays greater than 20 minutes for two consecutive hours be the criteria identifying whether or not a project is significant.
Although its basic work zone policy has remained relatively unchanged in recent years, Ohio DOT does make regular changes to its design standards, specifications, and other documents as needed based on the annual review of work zone crash data trends. For instance, a relatively large number of crashes occurring at ramps where adequate decision-sight distance was not being provided led to the establishment of ramp cross-section minimums (i.e., 11 foot lanes, 1 foot offset to barrier, 2 foot offset to edge of pavement) in the work zone design standards.
As another example, Ohio DOT personnel observed a large number of rear-end crashes occurring upstream of construction access points. It was determined that these crashes were occurring because when construction vehicles slowed down, often in the fast lane, to make the turn into the construction area, they were being hit by vehicles not expecting a slow-moving vehicle traveling in that lane. The agency ultimately developed a specific design detail sheet on acceptable construction access point design (see Figure 4.1).
In Florida, agency staff analysis of work zone crash data helped the agency realize that a high percentage of “failure to stop” crashes were occurring on rural roads, where flaggers were being used to control alternating one-way operations. The agency subsequently established standards for temporary rumble strip installation and for Automated Flagger-Assistance Device deployment to improve motorist and worker safety at these types of operations. Agency staff also established improved criteria regarding the analysis of rolling roadblock operations and the proper deployment of those operations in the field.
Use of Data and Measures to Identify Potential Problems During Work Zone ImplementationNew Jersey DOT indicated that the ability to maintain staff continuity from year to year was probably its greatest mechanism for ensuring that what is learned one year regarding work zone safety and mobility performance is applied to projects the following year. Although this approach to using data and measures to identify potential problems is highly informal, it does appear to serve the agency well.
For the most part, agencies do perform ongoing monitoring of the safety and mobility performance of their work zones, at least informally. They also reported that they will change the traffic control plan, phasing, and mitigation strategies (if used) if they deem it is necessary. In some instances, the project engineer and inspectors are responsible for monitoring; in other instances, the agency has established dedicated monitoring staff to sample work zones and either verify that they are operating acceptably or gather additional data and determine the cause and extent of the mobility problem.
C H A P T E R 4 : U S E S O F P E R F O R M A N C E M E A S U R E S A N D DATA F O R W O R K Z O N E S A F E T Y A N D M O B I L I T Y I M P R O V E M E N T

4-3BEST PRACTICES IN WORK ZONE ASSESSMENT, DATA COLLECTION, AND PERFORMANCE EVALUATION
Figure 4.1 Construction access design detail sheet developed by Ohio DOT

4-4
C H A P T E R 4 : U S E S O F P E R F O R M A N C E M E A S U R E S A N D DATA F O R W O R K Z O N E S A F E T Y A N D M O B I L I T Y I M P R O V E M E N T
Ongoing monitoring of project safety performance is fairly challenging. Although project staff will likely be aware of crashes that occur in and around the work zone during working hours, those occurring when the work zone is inactive may be unknown to project staff until police crash report data becomes available to agency personnel. Extremely unusual crash frequencies at a specific location or a rash of serious injury or fatal crashes at a work zone will likely be alarming enough to grab the attention of project staff and lead to work zone changes. Unfortunately, less dramatic safety problems will be harder for agency personnel to detect in time to implement improvements.
One way of improving work zone safety performance is reducing the time delay between when crashes occur and when the highway agency is made aware of them. Nationally, it does appear that more enforcement agencies are moving towards electronic coding and submission of crash report records. This ongoing trend is likely to improve agency abilities to track crashes in current work zones fast enough to detect possible safety problems that exist during a particular construction phase and take remedial corrective action. Rather than waiting months for access to police crash report data, the highway agency will only have to wait a few days.
Another method of reducing the lag time between when a crash occurs and when the agency can obtain information about it by having agency field staff complete its own investigation when a crash occurs in a work zone. The Maryland, New Hampshire, and New York agencies have established their own crash report forms that are to be completed when a crash occurs in a work zone. These forms may record some of the same type of information that is included in the state police crash report form; however, they include additional details, such as the work zone traffic control setup and the work activity underway. This allows the agency to better assess the work zone characteristics that may be contributing to the crashes and come up with possible ways to reduce their occurrence.
Use of Permitted Lane Closure ChartsOne of the most common ways agencies utilized their work zone mobility performance measures was in establishing acceptable times of the day when one or more travel lanes could be closed for work activities on the various roadways under its jurisdiction. A number of agencies, such as Florida DOT, have basic policies in place to maintain the same number of lanes during construction as existed before construction during peak travel periods, and to limit any lane closures to off-peak periods. Permitted lane closure charts define when lane closures can occur and when they are restricted from occurring. In most cases, any exceptions to these permitted hours (e.g., for emergency repairs) would require special agency approval. An example of an Illinois Tollway permitted lane closure chart is provided in Figure 4.2.
Some agencies performed simple volume-to-capacity computations to determine predicted queue lengths and/or individual user delays hour by hour if lanes were closed, and established acceptable closure hours when the computations yielded delays or queues that were below the agency’s threshold values. Other agencies did not opt to link their acceptable hours to their mobility performance measures; rather, they established per-lane volume thresholds above which lane closures would not be permitted. A broad range of per-lane work zone capacity values was used in developing these acceptable lane closure hours, which presumably reflects the extent of each agency’s aversion to creating even short periods of congestion and delay by a lane closure, as well as differences in local driving habits and typical roadway terrain.

4-5BEST PRACTICES IN WORK ZONE ASSESSMENT, DATA COLLECTION, AND PERFORMANCE EVALUATION
Figure 4.2 Example permitted lane closure chart used by the Illinois Tollway

4-6
Use of Performance-Based Incentives Based on Work Zone Safety and Mobility MeasuresAs noted previously, the use of work zone safety and mobility data in performance-based incentive specifications is very limited. However, most agencies do employ various types of accelerated contract provisions, which are typically associated with predicted work zone mobility impacts converted to a road user cost value. It is important to remember that efforts to accelerate construction to minimize impacts on traveler mobility can also positively effect work zone safety by reducing project duration and thus vehicle exposure to the work zone.
Most of the agencies interviewed have become fairly adept at the use of incentives, invoking them when the benefit of faster work zone completion is believed to offset the additional costs of the incentives. In fact, agencies often incentivize only certain phases or milestone segments of a project based on estimates of when the project’s impacts upon the public are expected to be severe. None of the agencies examined in this scan, however, attempt to re-examine their incentive decisions to determine if the actual impacts incurred did justify the incentives paid.
Michigan DOT staff briefed the scan team on one of its projects that set safety performance thresholds as incentives in the contract language. The FHWA Highways for Life program2 selected this innovative project for funding support. Specific performance criteria were established in the contract for the following:
n Date open to traffic
n Construction and cleanup completion
n Pavement performance
n Worker safety during construction
n Work zone crashes
n Motorist delay
With respect to the last three criteria, the contract specified that in the project, the worker injury rate had to be less than the industry standard of 4.0 injuries per 200,000 worker-hours and that work zone crashes had to average fewer than 1.0 per month. The contract provided a sliding scale of incentives and disincentives (I/D) for motorist delays recorded via travel times through the project on a regular sampling schedule:
C H A P T E R 4 : U S E S O F P E R F O R M A N C E M E A S U R E S A N D DATA F O R W O R K Z O N E S A F E T Y A N D M O B I L I T Y I M P R O V E M E N T
2 Rao, S., J. Mallella, and G. Hoffman, Michigan Demonstration Project: Performance Contracting for Construction on
M-115 in Clare County, MI. Final Report prepared for the FHWA Highways for Life program, Washington, DC. September 2009. Available at http://www.fhwa.dot.gov/hfl/summary/pdfs/mi_090209.pdf

4-7BEST PRACTICES IN WORK ZONE ASSESSMENT, DATA COLLECTION, AND PERFORMANCE EVALUATION
Measured Delay (min.) I/D
0–5 +$1,000
6 +$800
7 +$600
8 +$400
9 +$200
10 0
11 –$200
12 –$400
13 –$600
14 –$800
15–20 –$1,000
+20 –$5,000*
At the project’s conclusion, the contractor received the established incentive funds for meeting both the worker safety and work zone crash performance measure objectives. However, since the goals for mobility were not met, the contractor did not receive any incentive funds based on that measure.
Use of Data Management Systems for Work Zone DataThe scan team learned about several different types of data management systems that the agencies have developed to help them track, compute, and archive their work zone data and performance measures. These included:
n Lane closure databases that track dates, times, locations, and specific lanes that will be or are currently closed because of roadwork
n Crash analysis databases
n Traffic performance databases
The complexities and capabilities of each type of data management system varied from agency to agency. Such variation is to be expected, as agencies have different needs regarding the level of sophistication required of each data management system.
Maryland DOT, California DOT, WisconsinDOT, Illinois Tollway, and several other agencies utilize lane closure data management systems. These types of systems have two main purposes:
1. Allow proper analysis by agency staff to ensure that a closure will not unduly impact travelers, either by itself or in combination with other planned lane closures
2. Facilitate the advance warning of travelers about the closure
* Contractor’s operation may be shut down.

4-8
As a result, agencies generally require contractors or field staff to submit future lane closure plans to the database a few weeks in advance. The closure is analyzed to verify that it will satisfy agency mobility requirements, then it is posted on the agency Web sites and elsewhere as advance notification to travelers. The agency uses the database on the closure date to verify that it begins when approved and is completed by the approved completion time.
As an example, the California DOT lane closure system (LCS) allows the agency to review the details of each lane closure request, check for potential conflicts, approve or require modification of the request, ensure that the closure is consistent with any corridor TMPs enacted, and monitor closure activity throughout the state. Between March 2009 and March 2010, the LCS processed more than 400,000 lane closure requests.
The entry and management of lane closures into the LCS is straightforward. First, resident engineers submit requests for lane closures for approval at least one week in advance of the planned event. After approval, the resident engineer notifies the appropriate TMC on the day of the event once the closure has begun and again when the closure has ended. In this way, very detailed information regarding lane closure times, locations, and capacity reductions are tracked and archived. Since both planned and current (i.e., active) lane closures are managed through the LCS, data are accessed by a variety of users (e.g., TMC operators, media, and police). The Maryland DOT lane closure system functions very similarly, transferring the status of a planned lane closure to an actual lane closure once field staff notifies the TMC.
Although the LCS serves a valuable coordination and monitoring purpose, agency database system managers continually struggle with the large number of lane closures that are requested but that ultimately never occur (i.e., “phantom” lane closures). Recent estimates indicate that up to 80 percent of the planned lane closures in the system are phantom lane closures. Because these events are communicated in advance to motorists via the Web site, news outlets, and other avenues, these phantom closures can have a significantly negative effect on the credibility of whatever the agency uses to disseminate this information.
The second category of data management systems observed during the scan was those developed for crash data. In terms of work zone crash data management systems, the Florida, Ohio, and New York State DOTs have all developed in-house specialized analysis tools and databases to aid them in their monitoring and evaluation efforts. Both the Ohio and Florida data come primarily from police crash report forms. (Ohio manually retrieves and enters the data into the database.) The New York data is actually supplemental data that the agency project staff obtains.
In Indiana, DOT staff access to crash data is greatly facilitated by its Automated Reporting Information Exchange System, an online system whose development and operation was outsourced to the private sector for the Indiana State Police. Indiana DOT, local and county municipalities, and the state’s metropolitan planning organizations all have full access to the crash data in the system. As noted previously, the use of an Internet-based system significantly facilitates enforcement agency submission of crash data into the system, which in turns gives DOT staff much quicker access to the data.
C H A P T E R 4 : U S E S O F P E R F O R M A N C E M E A S U R E S A N D DATA F O R W O R K Z O N E S A F E T Y A N D M O B I L I T Y I M P R O V E M E N T

4-9BEST PRACTICES IN WORK ZONE ASSESSMENT, DATA COLLECTION, AND PERFORMANCE EVALUATION
The connectivity PeMS establishes between the LCS and traffic data sources, both current and archived, gives PeMS potential value for work zone impact assessment, data collection, and performance measurement. The system can allow users to perform a series of pre- and post-closure evaluations, provide dashboard statistics on current and historical lane closures, and provide trend analyses of the closures to identify key problems (e.g., excessive phantom lane closure requests). For example, Figure 4.4 illustrates a lane requirements analysis report of the minimum number of lanes to remain open at various times of the day that can be generated using recent archived traffic data at the anticipated closure location. Previously, such analysis had to be performed completely by hand or by manually entering data into a computer.
Figure 4.3 Schematic data flows within PeMS
Regarding a traffic performance database, the freeway performance management system (PeMS) developed at the University of California-Berkeley for California DOT provided the scan team a view of what can be possible with work zone performance measurement. PeMS is a real-time archive data management system that links a number of data sources together and provides the user several options for data fusion, analysis, and reporting. PeMS receives data from various types of roadway sensors and, via the LCS, data about incidents and planned work zone lane closures. A variety of analysis and output functions make PeMS useful to a variety of end users in

4-10
In addition to spot location analyses, PeMS can also provide an overall spatial representation of lane requirements along an entire segment of highway (see Figure 4.5). This type of view can be useful in assessing the length of the lane closure that can be implemented given the potential location of temporary bottlenecks or periods of high demand along a corridor.
C H A P T E R 4 : U S E S O F P E R F O R M A N C E M E A S U R E S A N D DATA F O R W O R K Z O N E S A F E T Y A N D M O B I L I T Y I M P R O V E M E N T
Figure 4.4 Lane requirements chart from PeMS

4-11BEST PRACTICES IN WORK ZONE ASSESSMENT, DATA COLLECTION, AND PERFORMANCE EVALUATION
PeMS can also estimate the amount of delay that would be caused by lane closures implemented at a given location for a particular time period (illustrated in Figure 4.6). This analysis is useful to Caltrans staff during preparation of contract language in terms of providing delay cost estimates for use in setting liquidated damages and I/D rates for a project.
Figure 4.5 PeMS spatial representation of lane requirements along a corridor

4-12
C H A P T E R 4 : U S E S O F P E R F O R M A N C E M E A S U R E S A N D DATA F O R W O R K Z O N E S A F E T Y A N D M O B I L I T Y I M P R O V E M E N T
Figure 4.6 PeMS delay estimation capabilities

4-13BEST PRACTICES IN WORK ZONE ASSESSMENT, DATA COLLECTION, AND PERFORMANCE EVALUATION
In terms of dashboard statistics, PeMS can illustrate the status of all lane closures entered into the LCS in both tabular and graphical formats, as shown in Figure 4.7. Each closure location is marked with an icon; clicking on the icon brings up additional information about the project, key contacts, and other details.

4-14
Finally, PeMS provides several trend analysis options to assess various facets of lane closure activity over time. As an example, Figure 4.8 presents a trend of the frequency of lane closures that were removed from the roadway later than initially requested and so were designated as “late” closures. If desired, these trends could be examined in greater detail by district, route, the amount of time they were late in picking up, and other factors.
Figure 4.7 PeMS lane closure status map
C H A P T E R 4 : U S E S O F P E R F O R M A N C E M E A S U R E S A N D DATA F O R W O R K Z O N E S A F E T Y A N D M O B I L I T Y I M P R O V E M E N T

4-15BEST PRACTICES IN WORK ZONE ASSESSMENT, DATA COLLECTION, AND PERFORMANCE EVALUATION
Methods of Incorporating Lessons Learned Regarding Work Zone Safety and Mobility into Future ProjectsThe scan team found that all of the agencies interviewed had some mechanisms in place for incorporating lessons learned and other knowledge gained from ensuring and improving work zone safety and mobility into their processes and procedures. One of the most common examples the agencies provided was to take the year’s audit and team-review results and identify the key deficiencies commonly observed in work zones throughout the state or region. The agency then targeted these deficiencies for improvement through increased emphasis during meetings, in training, and via other mechanisms. For example, Washington DOT periodically issues special safety bulletins about a particular issue, such as proper consideration of flagger escape routes (see
Figure 4.8 PeMS trend analysis of late lane closure removals

4-16
Figure 4.9). Other agencies issue operations advisories and similar types of guidance based on lessons learned.
Michigan DOT has pilot tested a more formalized approach to incorporating lessons learned from one project to the next. In 2007, it established a pilot project with characteristics similar to a 2006 project to determine if certain treatments on the project would reduce work zone crashes. Based on an analysis of the types of crashes that had occurred at the 2006 project, Michigan DOT staff made several key changes to the 2007 project, including:
n Widening the travel path to include a temporary 3-foot paved shoulder
n Applying object markers at fixed object locations within 8 feet of the travel path
n Increasing the lateral offsets to fixed object locations
An analysis of the crashes that ultimately occurred at the 2007 project suggested that the crash frequency expected, based on the 2006 project’s experiences, was reduced by 57 percent. Because of the pilot test’s success, Michigan DOT anticipates doing more of these types of comparative assessments for upcoming projects.
In comparison to the feedback efforts by agencies regarding safety concerns, efforts to apply a similar approach to mobility considerations are typically less fruitful. This lack of success may be because mobility impacts tend to be highly site-centric, making it more difficult to glean useful lessons from one project to apply to future projects. Most agencies tend to adjust the capacity values used for queue and delay analyses over time based on experiences, and refine expectations of the amount of diversion behavior likely to occur at future projects, but not much else.
Michigan DOT does track the results of its lane closures fairly closely and records instances where predicted impacts and actual impacts did not correspond very well. The agency examines these instances to determine why the estimates varied from reality, then codes the reasons into the database. In this way, agency staff will be able to go back to the database, review these experiences, and modify their predictions (and any mitigation strategies needed) for the next project done on that facility. Table 4.1 provides a sample of this type of database entry.
C H A P T E R 4 : U S E S O F P E R F O R M A N C E M E A S U R E S A N D DATA F O R W O R K Z O N E S A F E T Y A N D M O B I L I T Y I M P R O V E M E N T

4-17BEST PRACTICES IN WORK ZONE ASSESSMENT, DATA COLLECTION, AND PERFORMANCE EVALUATION
Figure 4.9 Example of how lessons learned are incorporated into Washington DOT processes

4-18
Benefits and Innovations Resulting from Applying Performance MeasuresOverall, the agencies that the scan team interviewed described several types of benefits experienced through the application of performance measures to their work zone processes. Improved customer satisfaction (either through improved survey scores or reduced complaints) was a commonly cited benefit, as was the ability to target key problem areas for enhanced field training or design specification improvements.
C H A P T E R 4 : U S E S O F P E R F O R M A N C E M E A S U R E S A N D DATA F O R W O R K Z O N E S A F E T Y A N D M O B I L I T Y I M P R O V E M E N T
Table 4.1 Example of feedback information retained on a project’s mobility impacts from Michigan DOT

4-19
C H A P T E R 5 : W O R K Z O N E I M PA C T A N A LY S I S A N D P E R F O R M A N C E M E A S U R E S U S E D D U R I N G T H E P R O J E C T D E V E L O P M E N T P R O C E S S

5-1BEST PRACTICES IN WORK ZONE ASSESSMENT, DATA COLLECTION, AND PERFORMANCE EVALUATION
Uses of Data and Performance Measures to Influence Project Scheduling and Budgets
The scan team found that agencies were striving to consider work zone safety and mobility impacts sooner in the project development process. One of the main reasons identified for doing so is the need to identify if extra funds are going to be needed beyond what has already been allocated in order to address special impact mitigation needs or implement
a particular maintenance-of-traffic solution that best meets the needs of both the project and the road users. One agency specifically identified the potential need for temporary bridge widening or use of temporary pavement as a critical cost factor that must be identified early in the development process.
Effect of Increased Project Data Demands on Project Development Process ScheduleIn general, the agencies that the scan team interviewed did not think that the increased demands for data and analyses relevant to safety and mobility performance at a project had significantly altered the process schedule. The consensus was that most agencies have made the necessary adjustments and factored the analyses into the development process in a way that does not significantly affect the critical path of that development process. Some of the efforts agencies have undertaken to streamline their processes (e.g., development of simple lane closure analysis tools and permitted lane closure charts) have helped to offset the increased data demands that are being placed on them.
Methods of Identifying Potential Traffic Problems During Project DevelopmentBoth Maryland and Ohio DOTs have incorporated a formal maintenance-of-traffic-alternatives analysis early into their project development process. The primary purpose of this step is early identification of any traffic problems that are going to exist that cannot be accommodated through traditional maintenance-of-traffic means. Those projects with the potential for creating traffic problems can then be targeted for additional, more detailed analysis and treatment with appropriate mitigation strategies.
On a related note, Ohio DOT also considers constructability issues throughout the project development process. It hires retired experts from the highway construction industry to consult
C H A P T E R 5
Work Zone Impact Analysis and Performance Measures Used During the Project Development Process

5-2
on major projects, providing counsel regarding constructability concerns. According to the agency, these experts have been instrumental in the successful completion of a number of large, high-profile projects throughout the state.
Parties Responsible for Assessing Work Zone Impacts During Project DevelopmentIn some regions, the traffic engineering or traffic mobility group has primary responsibility for assessing work zone impacts during project development. In other regions, work zone design and construction staff has this responsibility. In the latter case, traffic engineering/operations has typically established detailed procedures on using specific items and methodologies for assessing impacts that those without a traffic engineering background can follow fairly easily.
For projects on heavily traveled roadways in metropolitan areas, it was sometimes necessary for the traffic engineering or mobility group to seek out assistance from the transportation planning group in applying a network travel demand model to help estimate the potential for traffic diversion to occur and the likely routes such diversion may gravitate towards. In Michigan, a detailed simulation model of the downtown Detroit region was coded and used to evaluate a variety of scenarios and alternatives during freeway reconstruction activities.
Project Development Stages Where Impacts Are AssessedSeveral of the agencies interviewed have started evaluating potential impacts very early in the project development process. They then re-evaluate and modify those evaluations as needed at additional points in the process. The purpose of early consideration of possible impacts is to ensure that there is adequate budgeting for construction and for impact mitigation strategies and that the agency considers work impact decisions as part of the alternative–selection process.
Several agencies also noted that the impact assessment process is continuous. They initially consider potential impacts (at a very broad level) early in project development, and then revisit and refine the impact estimates and mitigation strategies as the project moves through planning, preliminary and final design, and even into construction.
Data Used to Assess Work Zone Impacts Agencies consistently used two types of data during the impact assessment process. The first was traffic demand volumes anticipated for the work zone location. Agencies can obtain those volumes from historical traffic counts, from planning division estimates, or from actual temporary data collection devices placed in the field. These volumes (usually hourly volumes) are then compared to the estimated work zone’s traffic-carrying capacity. Most agencies had their own methods for estimating what the capacity of the work zone would be, and many used only a portion of that maximum value to reduce the likelihood that debilitating queues and congestion would develop.
If a more detailed impact assessment for a project is deemed necessary (e.g., to evaluate complex vehicle interactions or the effects of traffic signal timing changes), then an agency would obviously
C H A P T E R 5 : W O R K Z O N E I M PA C T A N A LY S I S A N D P E R F O R M A N C E M E A S U R E S U S E D D U R I N G T H E P R O J E C T D E V E L O P M E N T P R O C E S S

5-3BEST PRACTICES IN WORK ZONE ASSESSMENT, DATA COLLECTION, AND PERFORMANCE EVALUATION
need more detailed data to develop and calibrate the simulation model. These data include such things as lane widths, distances between intersections, length of turn bays, and turning volumes.
Methods of Estimating and Incorporating Road User Costs in Agency Cost AnalysesAlthough many of the agencies indicated that they do consider road user costs (RUCs) in project decisions, most do not combine them with other project costs in the evaluation, but treat them separately. Agencies utilize a variety of methods for estimating RUCs in their analyses. Several agencies have developed simple spreadsheet tools to estimate RUCs, whereas others reported using software such as QUEWZ-983 and QuickZone4 for simple freeway sections, and more sophisticated simulation software (e.g., Synchro5 or TSIS-Corsim6 ) for other roadway types or for more complicated sections. Some agencies, such as Maryland DOT, refer to RUC analyses in terms of “loss of public benefit” calculations.
The New Jersey DOT also places significant emphasis on RUC estimation and uses it during project planning, design, and construction and in its public information efforts. As it stated in the scan interviews, New Jersey DOT’s philosophy is for each project to be “invisible” to the public in terms of the adverse impacts it creates. New Jersey DOT has developed its own RUC manual to guide its staff in the proper estimation and use of RUCs. New Jersey DOT uses RUC levels to decide which projects will utilize A+B bidding and/or increased production rate requirements, as well as when lane closure hours will be allowable. RUCs are also used to set I/D values, typically setting them at one-fourth of the user cost values.
Similarly, Wisconsin DOT is developing a process for selecting impact mitigation based on a comparison of RUC benefits to strategy costs (6:1 to 10:1). It is likely that RUC savings in Wisconsin will need to be between six and 10 times the cost of the mitigation strategy for it to be considered for implementation.
Ultimately, an agency’s development and use of the permitted lane closure charts is indirectly driven by RUC concerns. Although actual hours of delay are not being computed, the approach most agencies take is to limit lane closure times to hours in which the expected volumes will not significantly exceed the expected work zone capacity and thus not create any queues or delays. One could argue that such restrictions actually place such a high value on additional RUCs that they are the primary factor considered regarding work hour decisions.
3 QUEWZ (Queue and User Cost Evaluation of Work Zones) is a mainframe program developed for TxDOT to simulate traffic flows through freeway segments (both with and without a work zone lane closure) and estimate changes in traffic flow characteristics and added costs due to closures. Source: http://tti.tamu.edu/publications/researcher/newsletter.htm?vol=36&issue=2&article=6 4 QuickZone is work zone delay estimation software available from the Center for Microcomputers in Transportation (McTrans). Source: http://mctrans.ce.ufl.edu/featured/qzone/ 5 Synchro is a product of Trafficware Ltd. Source: http://www.trafficware.com/synchro7.html 6 TSIS-CORSIM (Traffic Software Integrated System–Corridor Simulation) is a microscopic traffic simulation software package available from the Center for Microcomputers in Transportation (McTrans). Source: http://mctrans.ce.ufl.edu/featured/TSIS/

5-4
Application of Safety or Mobility Performance Measures in Lane Rental or Other Incentive/Disincentive Contract ClausesThe scan team found that most agencies utilize mobility measures to some extent in determining the use and value of I/D clauses in contract language, liquidated damages (LD), or lane rental rates. Overall, the trend was more towards the use of I/D and LD clauses and less towards the use of lane rental provisions, as many agencies were uneasy about allowing contractors to opt into using a lane during peak travel periods, even if an excessively high rental value was in effect. The preferred approach taken by most agencies was to restrict hours of lane closures and enforce those hours with heavy LD values in the contract.
Use of Work Zone Data to Influence Transportation Manage-ment Strategy Selection During Project DesignIn general, the primary work zone data used to influence transportation management strategy selection during project design are hourly traffic volumes and the estimated capacity through the work zone. The volume-to-capacity ratio affects decisions about whether long-term capacity reductions can be used or whether lane closures are to be limited to nighttime hours or weekends. When used to estimate queues and delays expected to occur for a given work zone alternative, these data also influence decisions whether to use travel demand management strategies in the work zone (i.e., ramp closures, diversion recommendations, and priority treatments for transit and high-occupancy vehicles) or traffic operations improvements on alternative routes. Then, some comparison typically is made between the strategy’s possible benefits and the costs of its implementation. Currently, it is somewhat difficult to accurately predict the expected effect of certain mitigation strategies, especially those that result in behavioral changes by travelers. This lack of accuracy does make it challenging for agencies to select among the various available implementation strategies at a project.
Although volumes and estimated work zone capacities were the most common data utilized by agencies to influence transportation management strategy selection, the scan team did find a few examples of agency attempts to apply other types of data. As one example, the Indiana DOT recently developed a process to prioritize those projects where law enforcement would be targeted to improve work zone safety. The process involved the consideration of a number of factors, each one assigned a specific importance weighting as shown below:
C H A P T E R 5 : W O R K Z O N E I M PA C T A N A LY S I S A N D P E R F O R M A N C E M E A S U R E S U S E D D U R I N G T H E P R O J E C T D E V E L O P M E N T P R O C E S S

5-5BEST PRACTICES IN WORK ZONE ASSESSMENT, DATA COLLECTION, AND PERFORMANCE EVALUATION
Factor Weight
AADT 10%
Project length (lane miles) 10%
Construction cost 5%
District priority 20%
Crashes 10%
Injuries 5%
Fatalities 5%
Percentage of trucks 10%
Work zone speed 2%
Degree curvature 3%
Grade 1%
Change in lane width 3%
Exits open 2%
Work zone lane width 3%
Work zone shoulder width 3%
Lanes shifted 2%
Feet shifted 2%
Positive protection 2%
Work zone safety preference factor 2%
The agency would rate each factor on a scale from 1 to 5 in terms of its perceived influence on the need to provide enforcement in the work zone. The ratings were multiplied by the weights and summed for each project. The total score was used to rate each project’s relative need for enforcement presence.
Work Zone Impact Considerations or Requirements in Con-tractor-Proposed ChangesMost of the agencies that the scan team contacted indicated that they entertain contractor proposals to change how a project will be accomplished, especially if the proposal can result in significant savings in agency costs or project duration. However, the implications to traffic are always included in the agency’s deliberations. Some agencies require the contractor to perform an analysis to illustrate that traffic will be adequately accommodated by the proposed alternative, whereas other agencies would perform the analysis themselves before ruling on whether it was acceptable for the contractor to proceed as proposed.
Depending on the agency, some additional impact to traffic may or may not be accepted for the proposed change. Washington DOT noted that, even if a value engineering proposal were submitted by a contractor, the agency would still require that certain requirements that significantly impact traffic (e.g., the hours of lane closure restrictions) be met.

5-6
It should be noted that even in cases where the contractor performs its traffic analysis, the agency will likely check the results and/or will run the analysis itself to verify the contractor’s stated results. According to some agencies, application of performance measures to the contracting process has led to significant contractor innovations, resulting in projects being completed in record time without adversely affecting motorist safety or mobility.
Tools Used to Estimate Impacts at Different Stages of Project DevelopmentAlthough the scan team found within the various agencies a wide range of analytical tools being used for estimating traffic impacts, the most common were simple spreadsheet-based queue analysis tools that compared expected volumes and capacity through the work zone. Interestingly, most agencies had their own internally developed analysis tools for this purpose. In a few instances (i.e., Wisconsin, California, and Oregon), the analysis tool was linked directly to available agency traffic count data so that the analysis was always performed on the most current information available. The scan team viewed this ability to evaluate current data as particularly important, as traffic volume data can become outdated after only two or three years and ultimately lead to less-than-optimum analyses and decisions.
In addition to queue analysis tools, microscopic traffic simulation models, network planning models, and combined traffic analysis construction cost tools (e.g., CA4PRS [Construction Analysis for Pavement Rehabilitation Strategies] in California and Michigan’s CO3 [Construction Congestion Costs]) were also mentioned as being utilized when needed for evaluating a project’s particular characteristics. If agencies hired consultants to perform the traffic analyses, the range of tools used might be somewhat greater than if the analyses were done in-house.
Methods of Selecting Analysis ToolsFrom a mobility impact perspective, agencies reported that analysis tool selection did not cause them a lot of problems or concerns. Most agencies had a range of tools they commonly used or allowed consultants to use, and based selection of a particular analysis tool on project needs and complexity as well as the tool’s user friendliness. Typically, analyses began fairly simply, sometimes as basic as a graphical comparison of expected volumes to the anticipated available capacity over time. Agencies tend to focus on volume-to-capacity analyses initially, recognizing that this is the simplest way to identify the potential for queuing and delay problems to develop at the project. Then, as information needs increase, additional tools or more advanced features of a given tool may be used to provide a more detailed examination of the project or one of its particular aspects. Often, the additional analysis also requires that the agency or its consultant gather additional data, which increases costs. Consequently, it makes sense for agencies to keep the analysis process simple at first, keeping the degree of sophistication comparable to the amount and quality of data readily available. Then, if project needs dictate a more detailed assessment, the extra costs and efforts of obtaining the additional data will have been worthwhile.
C H A P T E R 5 : W O R K Z O N E I M PA C T A N A LY S I S A N D P E R F O R M A N C E M E A S U R E S U S E D D U R I N G T H E P R O J E C T D E V E L O P M E N T P R O C E S S

5-7BEST PRACTICES IN WORK ZONE ASSESSMENT, DATA COLLECTION, AND PERFORMANCE EVALUATION
A few agencies noted the difficulties associated with predicting diversion as part of the impact assessment process. Available tools, such as network-based travel demand models and mesoscopic simulation models, can assist agencies in estimating changes in route choice behavior; however, these have intense data demands (which, as previously noted, increases agency costs to use them). The scan team found that Wisconsin DOT sometimes utilizes the Quadro 47 model, a European sketch planning analysis tool, for analyses when diversion is anticipated. In addition to estimating how much diversion may occur, the tool also computes the additional delay and traffic crash RUCs anticipated at the work zone and on the diversion route. Note that Wisconsin DOT has not formally measured diversion at projects to compare to what Quadro had predicted; however, it believes that the output is reasonable in most cases.
In a few instances, agencies have started with a specific analysis model early in a project’s planning process and used the same tool for a variety of evaluations as the project was developed. In other cases, different tools were applied at different points of the project development process in order to evaluate various aspects of an alternative (or to evaluate the alternatives themselves). For the most part, it is the characteristics of the project and the alternatives being considered that determine the number and types of analysis tools that are or will be utilized.
Role of Desired Performance Measures in Analysis Tool SelectionAs might be expected, there was good agreement between the analysis tool(s) an agency chose and used for impact assessment and the performance measures of interest. In other words, the key measures used to determine whether the impacts of a project were acceptable were the measures being estimated and output by the particular analysis tools being used. What was not clear in all instances was whether it was the desired measures that drove the selection of the impact assessment tool(s), or whether the agency’s preference for a particular tool or tools defined what performance measures were available and used for decision-making. Certainly, the main underlying theme in most instances is the determination of whether or not volumes will exceed capacity (and, if so, by how much, for how long, and the amount of queuing or delays that will likely result).
Effectiveness of Tools in Differentiating Between Different Transportation Management StrategiesFor the most part, agencies did not indicate that they relied heavily on assessment tools when making decisions regarding which specific transportation management strategies to select and implement for mitigating work zone impacts. One of the obvious reasons for this is that there is not a significant amount of published data or guidance on how much specific strategies influence behavior and the mobility or safety impacts that result from that behavior. Agencies tended to learn over time which strategies worked best and what the impacts of those strategies were. They then utilized those lessons learned as they developed future projects. In fact, the New Jersey DOT
7 Quadro is a registered trademark of NVIDIA Corporation.

5-8
cited the continuity of key staff involved in work zone safety and mobility assessment from year to year as the main method of improving work zone designs from year to year.
Although agencies did not utilize analysis tool results in making selections among alternative transportation management strategies, some agencies did perform sensitivity analyses with assessment tools in some situations to develop an understanding of how much of a change in traffic behavior would be needed to achieve the desired reduction in impacts. The agencies could then decide whether it would be reasonable for the management strategy or strategies being considered to have that level of impact.
Calibration and Validation Efforts of Analysis ToolsThe level of analysis tool calibration and validation varies by the type of tool being used, according to most agencies interviewed. There was general consensus that some tools (e.g., traffic simulation) require calibration to known conditions, but that other tools (e.g., capacity analysis or input-output queuing analysis tools) simply rely on best-guess estimates of what traffic volumes and work zone capacities will be once they are implemented. Overall, estimates of work zone capacity were the factors that agencies most often checked and adjusted. A work zone typically modifies several roadway characteristics, and the agencies cited this as a reason why calibration of other model parameters may be of limited value in many work zone analyses.
With respect to validation, a few agencies noted that they do look at travel time or queue lengths that occur in the field and compare them to estimates obtained from their analysis tools. The extent of validation depends on the type of information provided. For example, PeMS in California provides a quick and easy way to check whether the impact estimates matched actual conditions.
If a tool repeatedly fails to provide impact estimates comparable to what occurred in the field, some agencies said they would be likely to simply quit using that tool and search for a different tool to use. An example of this approach was found in Maryland, where Maryland DOT has moved away from using the Maryland QuickZone tool in preference to its own Lane Closure Analysis Program.
A final point the scan team gleaned was the importance of having current and accurate estimates of demand volumes for impact assessment. Some agencies spend considerable time developing estimates of hourly traffic volumes based on the season or the month and day of the week for their analysts to use. The longer the time between updates of the estimated volumes, the less likely the estimated impacts will reflect what actually occurs in the field.
Use of Consultants for Impact AnalysesThe use of consultants is fairly common for most agencies. The scan team found that if a consultant was designing a project, he or she was also responsible for the performing the impact analysis. Some agencies do require the consultant to use a specific tool or to choose from a specific list of approved tools, whereas other agencies leave it up to the consultant to choose the most appropriate tool to use.
C H A P T E R 5 : W O R K Z O N E I M PA C T A N A LY S I S A N D P E R F O R M A N C E M E A S U R E S U S E D D U R I N G T H E P R O J E C T D E V E L O P M E N T P R O C E S S

5-9BEST PRACTICES IN WORK ZONE ASSESSMENT, DATA COLLECTION, AND PERFORMANCE EVALUATION
Agency Staff Knowledge of Tools Used by ConsultantsMost agencies that relied on consultant impact analyses were quite comfortable with the results they obtained. Agencies noted that, in most cases, the consultant would use a tool that agency staff was familiar with and so could easily interpret the provided output results. A few agencies did acknowledge that they would ask for the actual input and output code used for a tool with which they were unfamiliar to check whether the analysis was valid. Other agencies indicated that either they would need to have someone on staff who could adequately evaluate the results provided by a consultant or they would specify the tool to use or output to provide.
Impacts Analysis Tools Training Being ProvidedMost of the agencies did not discuss impact analysis tool training, although most undoubtedly offered or had sources of such training available to its staff or to the consultant community. The Florida DOT noted that it required its consultants to be preapproved for performing project design work and that the ability to perform impact analyses was a criterion that it would consider. This requirement meant that the consultants would have to show expertise or sufficient training in performing impact analyses.
A few states that had their own analysis tool (e.g., Michigan DOT’s CO3 tool) did provide specific training on its use. At the other end of the spectrum, Caltrans has developed several “academies” that include exposure to its LCS, PeMS, and the use of CA4PRS and other analysis tools.
Major Agency Challenges to Assessing and Managing Work Zone ImpactsThis report has already addressed many of the issues and challenges raised. Some agencies did express an occasional lack of confidence in a decision on traffic approaches and mitigation strategies to implement because it was not clear whether the selected approach or mitigation strategy would yield the types of impacts (or reduction in impacts) that the decision was based upon.
Benefits Received from Assessing and Managing ImpactsThe types of benefits mentioned most frequently in response to this question included:
n Less litigation
n Better revenue (tollway)
n Less negative publicity
n Elimination of surprises
n Enhanced agency and road user cost savings
n More realistic budgets for traffic mitigation efforts

5-10
n Good customer acceptance and public relations
n Greater facilitation and support of innovation in mitigation strategy implementation
n Greater facilitation of continuous improvement
n Reduced work zone impacts
Overall, the impact assessment process does allow agencies to better understand when, where, and how impacts may develop at a project, which in turn allows agencies to make more effective decisions about what mitigation strategies to implement. Ultimately, this helps control the costs of impact mitigation and can have an indirect benefit on construction productivity and costs as well.
C H A P T E R 5 : W O R K Z O N E I M PA C T A N A LY S I S A N D P E R F O R M A N C E M E A S U R E S U S E D D U R I N G T H E P R O J E C T D E V E L O P M E N T P R O C E S S

5-11
C H A P T E R 6 : K E Y F I N D I N G S

6-1BEST PRACTICES IN WORK ZONE ASSESSMENT, DATA COLLECTION, AND PERFORMANCE EVALUATION
The scan team identified a wealth of insights, challenges, and opportunities available to agencies in the areas of work zone impact assessment, data collection, and performance measurement. The following are the key findings gleaned from the scan effort.
Measures Used to Assess Safety and Operational Performance in Work ZonesAgencies that have clearly established performance measures tend to effectively track those measures and consider them throughout the project development process. Consistent with previous findings already stated in this report, having clearly established goals and performance measures shows the agency’s level of commitment.
Many agencies are using work zone performance measures without realizing it. Most agencies have policies and procedures in place that are based on mobility and/or safety performance measures. For example, values used in I/D clauses and decisions on permitted lane closure times are typically based on assessments of delays or queues.
To date, agencies have tended to emphasize either safety measures/analyses or mobility measures/analyses, but not both. In some cases, this focus on one type of impact over the other is a function of limitations in available agency resources to devote to work zone performance measurement and the extent to which data are available. In other instances, specific events (e.g., an unusual number of work zone fatalities in a given year) prompted the additional emphasis on a particular set of measures.
Currently, work zone safety performance measures tend to be developed and examined mostly at the agency program level. The scan team did observe a few instances where efforts were being made to use safety data and performance measures at the project level (either in monitoring impacts of ongoing projects or in considering the potential safety concerns of upcoming projects); however, these tended to be the exception rather than the rule. Of course, even when crash data entry is timely, crashes in a particular work zone are often not frequent enough to be of use in identifying problems or measuring safety performance.
Conversely, work zone mobility performance measures tend to be developed and examined mostly at the project level. Agencies tend to have tools and methodologies in place to evaluate the potential mobility impacts of individual projects during work zone design. In addition, methods and technologies in work zone monitoring are becoming more widely available, which will allow mobility performance measures to be computed fairly easily. However, these computations and monitoring efforts tend to be sampling activities (e.g., estimating the worst-case condition or noting the existence of unacceptable impacts during inspection), which do not lend themselves easily to consolidation across multiple projects into program-level mobility performance measures.
C H A P T E R 6
Key Findings

6-2
C H A P T E R 6 : K E Y F I N D I N G S
Most agencies are moving away from lane rental provisions in project contracts. A major reason for this reduction in lane rental consideration is concern that contractors will go ahead and pay excessive fees to close lanes and create significant mobility impacts. Many agencies are simply not willing to tolerate such impacts, and so prefer to use permitted lane closure times and liquidated damages for violations of those times.
Data Collected to Compute Work Zone Performance Measures Agencies that have good work zone safety and mobility data management systems tend to make better use of the data than those with less structured systems or no system at all. The existence of data management systems also indicates that an agency’s upper management is committed to considering safety and mobility impacts throughout project development and delivery. This commitment is important, as data gathering, processing, and preparation of desired performance measures does require an outlay of resources. In several states, the work zone safety data assessment systems and processes were more evolved than mobility data assessment systems, due in large part to the availability of statewide crash report data that could allow the extraction of work zone crash data for periodic assessment.
Electronic crash data entry can significantly speed up the availability of safety data and make it feasible for use in evaluating ongoing project impacts. For ongoing evaluation of current work zones to occur, the DOT must have prompt access to the crash database. States without electronic crash data entry must rely on staff to manually gather and analyze crash reports in order to accomplish the same monitoring activity. This manual effort is a time-consuming activity and one that agencies do not commonly engage in. Waiting for crash reports to be entered into a statewide database often involves a delay of several months before they can be accessed. By that time, the work zone has often already been removed or has changed significantly, limiting the crash data’s usefulness for identifying safety problems and taking remedial actions.
Many agencies have found the development and implementation of an electronic database system to track and approve future and current lane closures very useful. The database institutionalizes the notification process of proper individuals and groups within the agency and ensures that closures will be performed during acceptable times during the day. The database can also be useful for coordinating multiple lane closures on a given facility or route, can facilitate their advance notice to the public, and can assist in targeting monitoring efforts of impacts during the closures. However, only a few agencies use their databases in this manner at this time.
For many agencies, the TMCs play a key role in managing lane closures throughout the region and informing the public about them. TMCs have staff and other resources that make it the logical focal point of information collation and dissemination to the public. TMCs are also useful for providing real-time project traffic queue information to drivers as a way to encourage diversion and mitigate the queues’ magnitude. Unfortunately, TMC coverage in most regions is limited to urbanized high-volume, high-speed facilities only.

6-3BEST PRACTICES IN WORK ZONE ASSESSMENT, DATA COLLECTION, AND PERFORMANCE EVALUATION
The increased availability of low-cost technologies and data sources is making the collection of mobility data in work zones more feasible for agencies. Although full work zone ITS deployments have traditionally been expensive to implement, the expansion of permanent ITS resources and the increased availability of low-cost portable devices to monitor work zones is making the collection of mobility data in work zones more accessible to agencies. In addition, many agencies are obtaining access to third-party mobility data on routes without agency surveillance and control equipment, which is also making work zone mobility data more readily available.
Both the importance of certain measures and the availability of data drive what performance measures are used by a given agency. However, the performance measures most desired by an agency may not always be usable because the data needed to compute those measures are not reasonably available.
Uses of Performance Measures and Data for Work Zone Safety and Mobility ImprovementHaving established measures of performance and collecting or having access to data from which to compute the measures allow agencies to monitor and modify their policies, processes, and standard operating procedures and improve work zone safety and mobility. The scan team encountered several specific examples of agencies that have been successful in utilizing work zone safety and mobility data and measures to effectively identify deficiencies or gaps in their approach to project delivery. Additionally, these agencies have made changes based on these assessments that were verified as being beneficial to future projects. For instance, one agency modified its entrance ramp design criteria because it found that crashes were disproportionately higher in work zones where entrance ramp acceleration lanes were temporarily removed or reduced dramatically in length.
The team observed a correlation between an agency’s access to real-time data (i.e., safety or mobility) and that agency’s ability to modify existing work zones to improve safety and mobility. The desire to monitor each work zone and ensure that it is operating safely and with minimal mobility impacts was a common theme among all the agencies. However, a lack of timely data, be it delays of several months in accessing crash data occurring at a project or the inability to constantly monitor and quantify the queues or delays occurring at each project, kept most agencies from being able to meet those desires.
Not all agencies have fully explored the availability and usefulness of data for use in work zone safety and mobility improvement. In many instances, agencies that use work zone safety and/or mobility data recognize that additional analyses of the available data could be performed, which would further improve the agencies’ processes. However, a lack of resources (e.g., time, expertise, other supporting data) was often cited as a reason why more was not done with the available data.

6-4
Work Zone Impact Analysis and Performance Measures Used During the Project Development ProcessAgencies have found that the earlier in the project development process that work zone impacts are considered, the better the end product that is obtained. Several agencies noted the importance of identifying a project’s potential for major impacts as early in the process as possible (e.g., during project scoping). In this way, for example, major bridge structures can be designed wide enough and the costs for mitigation efforts can be adequately budgeted into the project scope. In addition, agencies noted that beginning this process early allows for a wider range of options in accommodating work zone traffic, using available mitigation strategies, and other steps. For example, early acknowledgement of potential impacts by some agencies has resulted in changes to the environmental document or to the right-of-way acquisition process. In other instances, early recognition of the need to reduce traffic demand through the work zone has influenced work zone design decisions (and the need to involve local officials in the decision process) as to when and where to implement ramp closures or other demand mitigation strategies. In general, earlier consideration of possible impacts greatly increases an agency’s flexibility in designing and implementing a work zone that minimizes public impacts.
Many agencies use capacity analyses and permitted lane closure charts based on capacity analyses and/or other analytical tools to eliminate or minimize the mobility impacts of work zone projects. Some agencies have developed their own in-house tool to facilitate quick analysis by project designers. Agencies also tended to use more complex modeling tools on high-impact projects in urban areas and were more likely to have an outside entity (e.g., a consultant or a Metropolitan Planning Organization) help on these more-involved analyses.
A lack of continuous monitoring capabilities in work zones currently limits agencies’ ability to move towards work zone safety and/or mobility performance-based specifications in project contracts. Even agencies that have fairly sophisticated and institu-tionalized processes to analyze work zone impacts continue to use method or design specifications rather than performance specifications to manage safety and mobility impacts in work zones during construction.
C H A P T E R 6 : K E Y F I N D I N G S

6-5
C H A P T E R 7 : R E C O M M E N D T I O N S

7-1BEST PRACTICES IN WORK ZONE ASSESSMENT, DATA COLLECTION, AND PERFORMANCE EVALUATION
The scan team identified several key recommendations relative to work zone impact assessment, data collection, and performance measurement. These recommendations are summarized below.
Measures Used to Assess Safety and Operational Performance in Work ZonesAgencies should establish specific and measureable work zone safety and mobility goals and objectives. Specific objectives represent the level of commitment an agency is willing to make towards the consideration and mitigation of work zone impacts. Most of the agencies the scan team examined had very specific numerical safety and/or mobility objectives for their work zones.
The performance measures an agency uses should relate to the goals and objectives that the agency has set for itself relative to mobility and safety impacts. The scan team uncovered a number of different work zone safety and performance goals specified in agency policies and procedures (i.e., maximum tolerable delays, maximum queue lengths and durations, and no increase in the crash rate of a roadway section during construction). The performance measures tracked and monitored during the project should relate to those goals and objectives.
Work zone performance measures must be used rationally. Whereas work zone impacts on the traveling public are key considerations throughout the project development and construction process, they are not the only ones an agency must consider. The agency must consider costs, productivity, environmental concerns, and other factors. Work zone performance measures are important tools for agencies to use; however, they must be applied appropriately within the overall goal of accomplishing the required road work activities.
n If you define a measure, it is important that you be able to get the data, analyze it, and know what you want to do with it.
n Likewise, it is important to make sure you know how the measure will be used to feed back into processes. The timing of data availability may be an important consideration in this feedback process.
n Measures need to be used rationally. Depending on the situation, they may apply to all projects or only to a sample of them (i.e., those expected to significantly affect mobility).
n Agencies need to remember that motorists do not know the difference between federal-aid roads and others as it relates to the need for mobility and safety considerations.
C H A P T E R 7
Recommendations

7-2
C H A P T E R 7 : R E C O M M E N D T I O N S
n The use of performance measures needs to be institutionalized within an agency in order to get resources allocated in some fashion, to get feedback communication loops established, to allow education of all involved personnel throughout the organization, and to get support and buy-in of agency leadership.
Data Collected to Compute Work Zone Performance Measures An agency must collect quality data in order to engage in effective work zone performance measurement. Specifically, agencies must decide what data are required to measure performance, invest the necessary resources to obtain that data, and decide how the measures that are computed will be used to affect decisions for a given project or, in some cases, in agency processes. Ultimately, methods must be established to ensure that data are collected in enough detail, frequently enough, and quickly enough to allow them to be useful to staff.
TMCs can play a key role in collecting mobility and safety data, identifying issues that arise, and providing information to the public regarding current work zones within its surveillance zone. However, it is important that TMC staff be properly trained and procedures established on how data collection, monitoring, and public information dissemination efforts are to occur. Any temporary losses of permanent surveillance should be offset to the extent possible through the use of temporary surveillance devices and/or third-party data sources. In addition, information on work zone activities that are impacting safety or mobility (e.g., temporary lane closures) should be meshed with the TMC data to maintain the connection between work zone project decisions and the resulting impacts upon the public.
Uses of Performance Measures and Data for Work Zone Safety and Mobility ImprovementAgencies should strive to improve how work zone safety and mobility data that are collected is fully analyzed and utilized to continuously improve agency processes and procedures. This effort to improve may involve bringing in additional data sources (e.g., work zone exposure information) to allow the data to be normalized across, for example, projects, roadway types, and work activities.
Work Zone Impact Analysis and Performance Measures Used During the Project Development ProcessClearly defining how and where work zone safety and mobility impact assessment fit into the project development process increases the chances that impacts will be better mitigated, costs will be accounted for, and the project will go more smoothly. Many agencies follow a highly structured project development process. At a minimum, it is critical to include impact assessment and mitigation as specific steps in the process in order to ensure that the appropriate personnel consider them at appropriate points. However, the most successful agencies appear to have integrated the consideration of impacts throughout their processes,

7-3BEST PRACTICES IN WORK ZONE ASSESSMENT, DATA COLLECTION, AND PERFORMANCE EVALUATION
periodically revisiting early assumptions and making revisions and refinements as project development progresses.
It is important to scale a project’s level of transportation management planning effort to the level of the anticipated impacts. As has been alluded to several times in this report, agency staff and time resources are extremely limited and continue to be strained even further as budgets are regularly cut. As agencies look for ways to continue to streamline their operations and become more efficient, having improved data as to which projects, locations, and measures have resulted in significant impacts in the past will help agencies better predict which projects are most likely to cause significant impacts and to identify mitigation strategies that have the best chance of alleviating those impacts.

C H A P T E R 8 : I M P L E M E N TAT I O N S T R AT E G Y
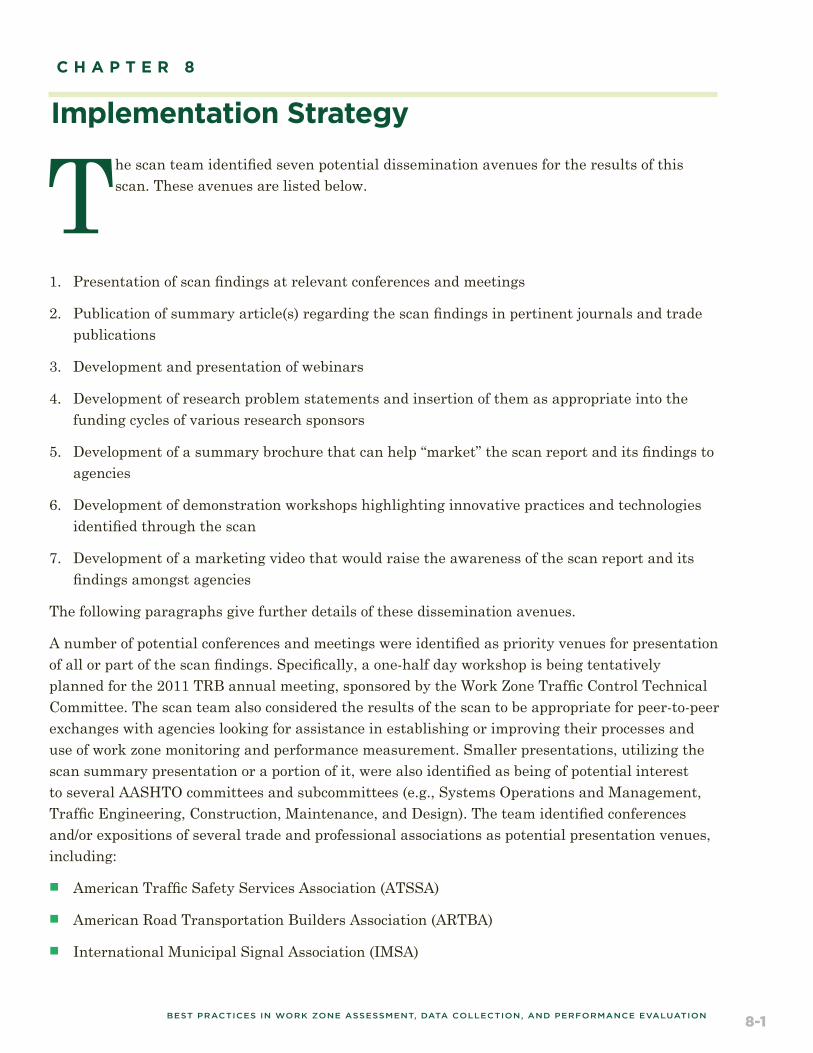
8-1BEST PRACTICES IN WORK ZONE ASSESSMENT, DATA COLLECTION, AND PERFORMANCE EVALUATION
The scan team identified seven potential dissemination avenues for the results of this scan. These avenues are listed below.
1. Presentation of scan findings at relevant conferences and meetings
2. Publication of summary article(s) regarding the scan findings in pertinent journals and trade publications
3. Development and presentation of webinars
4. Development of research problem statements and insertion of them as appropriate into the funding cycles of various research sponsors
5. Development of a summary brochure that can help “market” the scan report and its findings to agencies
6. Development of demonstration workshops highlighting innovative practices and technologies identified through the scan
7. Development of a marketing video that would raise the awareness of the scan report and its findings amongst agencies
The following paragraphs give further details of these dissemination avenues.
A number of potential conferences and meetings were identified as priority venues for presentation of all or part of the scan findings. Specifically, a one-half day workshop is being tentatively planned for the 2011 TRB annual meeting, sponsored by the Work Zone Traffic Control Technical Committee. The scan team also considered the results of the scan to be appropriate for peer-to-peer exchanges with agencies looking for assistance in establishing or improving their processes and use of work zone monitoring and performance measurement. Smaller presentations, utilizing the scan summary presentation or a portion of it, were also identified as being of potential interest to several AASHTO committees and subcommittees (e.g., Systems Operations and Management, Traffic Engineering, Construction, Maintenance, and Design). The team identified conferences and/or expositions of several trade and professional associations as potential presentation venues, including:
n American Traffic Safety Services Association (ATSSA)
n American Road Transportation Builders Association (ARTBA)
n International Municipal Signal Association (IMSA)
C H A P T E R 8
Implementation Strategy
8-2
C H A P T E R 8 : I M P L E M E N TAT I O N S T R AT E G Y
n Institute of Transportation Engineers (ITE)
n Intelligent Transportation Society (ITS) America
Other possible presentation venues the scan team identified included a meeting of the I-95 Corridor Coalition, local Transportation Assistance Program meetings, Associated General Contractors meetings, and possibly one or more of the Training Academies. Team members Tracy Scriba and Denise Markow agreed to take the lead in coordinating and emphasizing efforts of all the scan team members in this implementation strategy.
The scan team viewed the preparation and submission of one or more articles to journals and trade publications as another key implementation activity. Publications initially identified for targeting include the ITE Journal, Roads and Bridges, FHWA Focus, and Public Roads. The team also recommended the preparation and submission of a short article to TRB’s TR News. Gerald Ullman and Diana Gomez agreed to coordinate these efforts.
The scan team also agreed that one or more webinars would be appropriate for disseminating the scan’s results. As a minimum, the team envisioned a TRB-sponsored webinar of the scan results. Additional webinars to disseminate the some of the scanned agencies’ processes and procedures as examples of best practices were also suggested. These additional webinars could be conducted as part of outreach funding already in place for the FHWA Highways for LIFE effort or as a single topic presented through the National Work Zone Safety Information Clearinghouse (the latter of which has had more than 600 registrations for previous webinar offerings). Chung Eng and K.C. Mathews agreed to take on the leadership role for organizing and coordinating such webinar offerings.
At the conclusion of the scan effort, it was clear to the team that many questions remain as to the best ways and means of work zone monitoring and performance measurement. A number of specific problem statement ideas were generated, including:
n Determination of the best method to mesh the various sources of data for work zone performance measurement
n Development of guidelines or best practices on the use of TMCs for work zone monitoring and performance measurement
n Development of guidelines on how to best utilize work zone performance measures and data
n Assessment of the benefits of electronic crash reporting for work zone safety performance monitoring and measurement
n Evaluation of the effectiveness of contract incentives for improving work zone traffic impacts
Gerald Ullman and Stuart Bourne agreed to take the lead in developing one or more of these ideas into formal problem statements and in identifying appropriate funding sources to which they will submit the statements.
The team discussed the possibility of developing a brief overview of the scan activity and key
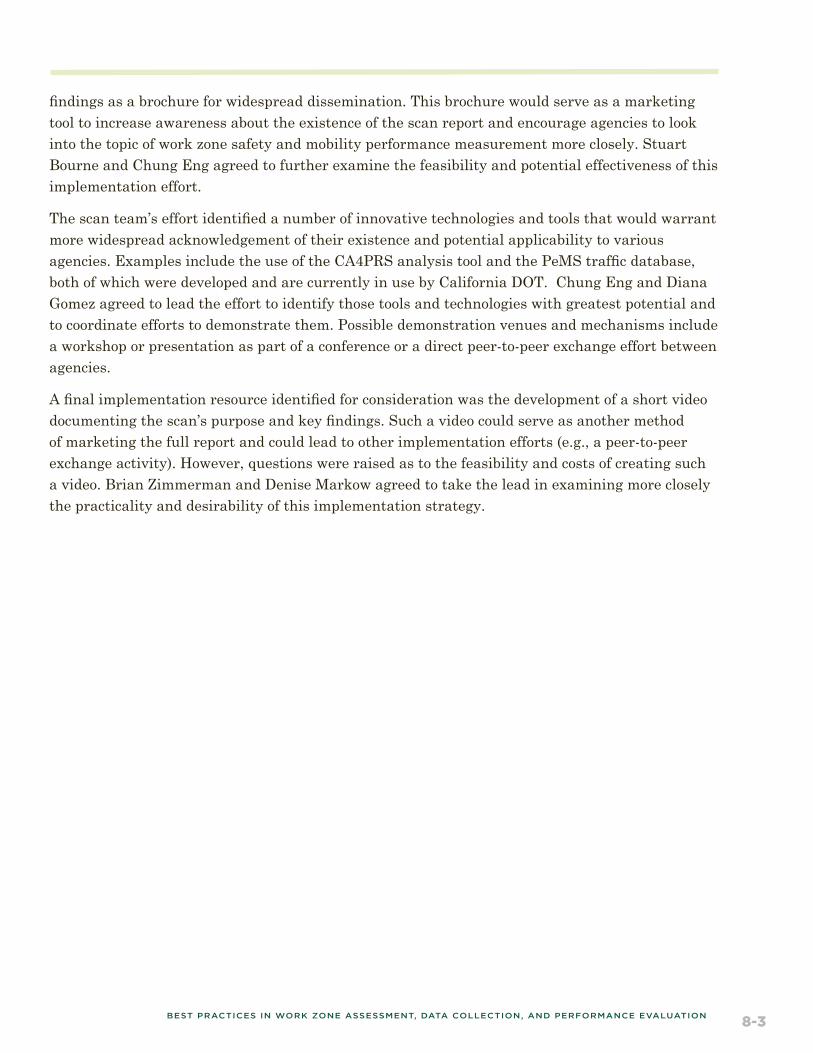
8-3BEST PRACTICES IN WORK ZONE ASSESSMENT, DATA COLLECTION, AND PERFORMANCE EVALUATION
findings as a brochure for widespread dissemination. This brochure would serve as a marketing tool to increase awareness about the existence of the scan report and encourage agencies to look into the topic of work zone safety and mobility performance measurement more closely. Stuart Bourne and Chung Eng agreed to further examine the feasibility and potential effectiveness of this implementation effort.
The scan team’s effort identified a number of innovative technologies and tools that would warrant more widespread acknowledgement of their existence and potential applicability to various agencies. Examples include the use of the CA4PRS analysis tool and the PeMS traffic database, both of which were developed and are currently in use by California DOT. Chung Eng and Diana Gomez agreed to lead the effort to identify those tools and technologies with greatest potential and to coordinate efforts to demonstrate them. Possible demonstration venues and mechanisms include a workshop or presentation as part of a conference or a direct peer-to-peer exchange effort between agencies.
A final implementation resource identified for consideration was the development of a short video documenting the scan’s purpose and key findings. Such a video could serve as another method of marketing the full report and could lead to other implementation efforts (e.g., a peer-to-peer exchange activity). However, questions were raised as to the feasibility and costs of creating such a video. Brian Zimmerman and Denise Markow agreed to take the lead in examining more closely the practicality and desirability of this implementation strategy.

A P P E N D I X A : S C A N T E A M C O N TA C T I N F O R M AT I O N

A-1BEST PRACTICES IN WORK ZONE ASSESSMENT, DATA COLLECTION, AND PERFORMANCE EVALUATION
A p p e n d i x A :
Scan Team Contact Information

A-2
A P P E N D I X A : S C A N T E A M C O N TA C T I N F O R M AT I O N
J. Stuart Bourne, P.E. – AASHTO Co-Chair State Work Zone Traffic Engineer North Carolina Department of Transportation 1592 Mail Service Center Raleigh, NC 27699-1592 Phone: (919) 250-4159, Ext.203 Fax: 919-250-4195 E-mail: [email protected]
Chung Eng – FHWA Co-Chair Work Zone Operations Team Leader Office of Transportation Operations Federal Highway Administration 1200 New Jersey Ave. S.E. Washington, DC 20590 Phone: (202) 366-8043 Fax: (202) 366-8712 E-mail: [email protected]
Gerald L. Ullman, Ph.D., P.E. – SME Senior Research Engineer, Program Manager Work Zone and DMS Program - CE/TTI, Room 410A Texas Transportation Institute The Texas A&M University System 3135 TAMU College Station, TX 77843-3135 Phone: (979) 845-9908 Fax: (979) 845-6006 E-mail: [email protected]
Diana Gomez, P.E., PMP Chief, Office of System Management Caltrans Headquarters 1120 N St. Sacramento, CA 95814 Phone: (916) 651-1255 E-mail: [email protected]

A-3BEST PRACTICES IN WORK ZONE ASSESSMENT, DATA COLLECTION, AND PERFORMANCE EVALUATION
Brian Zimmerman Work Zone Technical Administrator Michigan Department of Transportation 6333 Lansing Rd. Lansing Michigan 48917 Phone: (517) 242-7366 E-mail: [email protected]
Tracy A. Scriba Work Zone Technical Program Manager Office of Transportation Operations Federal Highway Administration 1200 New Jersey Ave. S.E. Washington, DC 20590 Phone: (202) 366-0855 Fax: (202) 366-3225 E-mail: [email protected]
Ronald D. Lipps Assistant Director of Traffic & Safety Maryland Department of Transportation SHA/Office of Traffic and Safety 7491 Connelley Dr. Hanover, MD 21076 Phone: (410) 787-4017, (301) 624-8242 Fax: 410-787-5823 E-mail: [email protected]
Denise L. Markow, P.E. Director of Transportation Management Center New Hampshire Department of Transportation Bureau of Traffic – TMC PO Box 483, Route 106 Concord, NH 03302-0483 Phone: (603) 271-6862 E-mail: [email protected]

A P P E N D I X A : S C A N T E A M C O N TA C T I N F O R M AT I O N
K.C. Matthews, P.E. HQ Safety and Traffic Engineering Traffic Specs & Standards Engineer Colorado Department of Transportation 4201 E. Arkansas Ave., 3rd Floor Denver, CO 80222 Phone: (303) 757-9543 Fax: (303) 757-9219 E-mail: [email protected]
David L. Holstein, P.E. State Traffic Engineer Ohio Department of Transportation Administrator, Office of Traffic Engineering 1980 West Broad St., 3rd Floor Columbus, OH 43223 Office: (614) 644-8137 Fax: (614) 644-8199 E-mail: [email protected]
Reynaldo Stargell Transportation Engineer Ohio Department of Transportation Office of Traffic Engineering 1980 W. Broad Street Columbus, OH 43223 Office: 614-644-8177 E-mail: [email protected]

A-5
A P P E N D I X B : S C A N T E A M B I O G R A P H I C A L I N F O R M AT I O N

B-1BEST PRACTICES IN WORK ZONE ASSESSMENT, DATA COLLECTION, AND PERFORMANCE EVALUATION
A p p e n d i x B :
Scan Team Biographical Information

B-2
J. STUART BOURNE (AASHTO Co-Chair) is currently the State Traffic Management Engineer with North Carolina Department of Transportation (NCDOT) and has worked for the agency for 22 years. He led the development and implementation of NCDOT’s Work Zone Safety and Mobility Policy and Guidelines. Most recently, he established the NCDOT Policy and Guidelines for Pedestrian Access and ADA Issues in Work Zones. Bourne is currently working on the Department’s Work Zone Qualification and Training Program. He works closely with the National Transportation Product Evaluation Program (NTPEP), the American Traffic Safety Services Association (ATSSA), and the Transportation Research Board (TRB). Bourne has also served on several of the National Academies’ Synthesis Panels and participates in the Federal Highway Administration’s (FHWA’s) Peer-to-Peer Program. Bourne graduated from North Carolina State University with a bachelor of science degree in Civil Engineering and has been a Registered Professional Engineer in North Carolina since 1994.
CHUNG ENG (FHWA Co-Chair) is the Work Zone Team Leader in the Office of Transportation Operations within the Federal Highway Administration (FHWA). Eng graduated from the George Washington University with a bachelor of science degree in Civil Engineering in 1982 and, after joining the Federal Highway Administration the same year, has continued his career with the same organization for 27 years. He has held various positions, including Project Development Engineer, Eastern Federal Lands Highway Division; Area Engineer, Illinois Division Office; Program Manager, Construction and Maintenance Division, FHWA Headquarters; Transportation Specialist, Office of Traffic Management and ITS Applications, FHWA Headquarters; and Transportation Specialist, Office of Transportation Management, FHWA Headquarters. He is currently Work Zone Team Leader, Office of Transportation Operations, FHWA Headquarters, with responsibility for managing the National Work Zone Program, including both work zone safety and mobility.
GERALD L. ULLMAN (Subject Matter Expert) is a Senior Research Engineer and Manager of the Work Zone and DMS Program for the Texas Transportation Institute. Ullman has more than 24 years of research experience and has led more than 50 studies of work zone safety and operations, traffic control device performance, transportation management for incidents and major emergencies, freeway corridor management, and transportation management and analysis of major freeway reconstruction projects. Currently, Ullman is conducting a pilot test of work zone mobility and safety performance measure data collection and analysis methodologies for the FHWA, using construction projects in North Carolina, Pennsylvania, Nevada, and Washington. He also has research underway on the use of law enforcement in work zones, the development of guidelines for using positive protection in work zones, and other methods for reducing motorist intrusion accident potential in work zones. Since 1997, he has led the TTI team that designed and operates the National Work Zone Safety Information Clearinghouse for the American Road and Transportation Builders Association (ARTBA). Ullman received both his bachelor and master of science degrees in Civil Engineering from the University of Nebraska, and a Ph.D. degree in Civil Engineering from Texas A&M University. He is the Texas A&M University Representative for TRB and is Chairman of the TRB Work Zone Traffic Control Technical Committee. Ullman is a member of ITE and is a registered Professional Engineer in Texas.
A P P E N D I X B : S C A N T E A M B I O G R A P H I C A L I N F O R M AT I O N

B-3BEST PRACTICES IN WORK ZONE ASSESSMENT, DATA COLLECTION, AND PERFORMANCE EVALUATION
DIANA L. GOMEZ is the Chief of the Office of Traffic Management with the California Department of Transportation (Caltrans) and has worked for the agency for 20 years. She has worked in Electrical Design, Contract Oversight, Construction, TMC Support, District Traffic Management, Census and Traffic Management. In 2008, Gomez became a Supervising Transportation Electrical Engineer, serving as Chief for the Office of System Management Operations in Caltrans Headquarters. Currently, she oversees the following programs at the statewide level: Ramp Metering, Transportation Management Centers, Transportation Management Teams, District 6 Traffic Managers, Traveler Information, and Incident Management. Gomez graduated in 1988 with a bachelor of science degree in Electrical Engineering from California State University at Fresno and has been a Registered Electrical Engineer since 1997; she obtained her Project Management Professional (PMP) certification in 2005. She has been recognized with two Caltrans Superior Accomplishment Awards: Caltrans Excellence in Transportation – Operation Fog and Remote Visibility Sensors Project and Caltrans Excellence in Transportation Award – Yosemite Area Travelers Information Project.
DAVID L. HOLSTEIN is the State Traffic Engineer of the Ohio Department of Transportation (ODOT) and is responsible for the state’s Work Zone Program. He is personally involved in the planning and/or approval of most every major work zone in Ohio (mega-type projects or projects with potential to have multiple impacts). Holstein is the original author of ODOT’’s major work zone processes and is routinely involved in major project planning. Holstein received a bachelor of science degree in Electrical Engineering from Ohio University and is a Registered Professional Engineer in the state of Ohio.
RONALD D. LIPPS is the Assistant Director of Traffic and Safety for the Maryland State Highway Administration. The Office of Traffic and Safety is responsible for Maryland’s infrastructural and behavioral safety programs. Lipps has been with the Maryland Department of Transportation for more than 30 years and at various times has served as Maryland’s Highway Safety Coordinator. He has been active in various national organizations, including as a member of the AASHTO Standing Committee on Highway Traffic Safety and the Safety Management Subcommittee, on various TRB/NCHRP Project Panels, on various committees and the Executive Board of the Governors Highway Safety Association, on numerous ITE committees and as an ITE District officer, and on numerous committees and the Executive Board of the National Committee on Uniform Traffic Control Devices. Lipps is an engineering graduate from the University of Notre Dame and Yale University. His work has included a stint in traffic engineering in Montgomery County, Maryland, the analyses of weapons and defense systems, and staff positions with the Automotive Safety Foundation and the Highway Users Federation.
DENISE L. MARKOW is the Program Manager for the New Hampshire Department of Transpor-tation’’s Transportation Management Center (TMC). Under her direction, the TMC is responsible for the NHDOT’s Statewide Communications Network and Statewide Maintenance Dispatch Operations. She manages the DOT Intelligent Transportation System (ITS) program, the Work Zone ITS program, and the statewide enterprise video management system. Prior to managing the TMC, Markow spent 13 years in the Highway Design Bureau, where she was responsible for

A P P E N D I X B : S C A N T E A M B I O G R A P H I C A L I N F O R M AT I O N
standards review of consultant design plans. She holds master’ and bachelor’ of science degrees in Civil Engineering from the University of New Hampshire, as well as a bachelor’ of arts degree in International Relations from the University of Wisconsin at Madison. She is a Licensed Professional Engineer in New Hampshire.
K.C. MATTHEWS is the Traffic Standards and Specifications Engineer for the Colorado Department of Transportation (CDOT). His responsibilities include managing a team of engineers who provide traffic-engineering support to CDOT’s western slope offices, and overseeing the development and implementation of CDOT’s traffic specifications and standards, and overseeing the signing program, statewide. He has spent the last 13 of his 24 years with CDOT in various positions within the Safety & Traffic Engineering Branch and has served as CDOT’s representative on the AASHTO Standing Committee on Highway Traffic Safety, the Subcommittee on Traffic Engineering, and the National Council on Uniform Traffic Control Devices. Matthews also served as the CDOT Chair of the Work Zone Safety & Mobility Task Forces for Compliance with 23 CFR 630 Subpart J and 23 CFR 630 Subpart K. He holds both bachelor and master of science degrees in Mechanical Engineering from the University of Colorado and is certified as a Licensed Professional Engineer in the state of Colorado.
TRACY SCRIBA is a Program Manager with the FHWA Headquarters Work Zone Mobility and Safety Team in Washington, DC. She leads FHWA’s efforts for implementation of the Work Zone Safety and Mobility Rule and is responsible for FHWA program areas related to work zone data and performance measures, work zone best practices, and ITS in work zones, among others. Prior to her work at FHWA, she was a consultant on both transportation and environmental issues for more than 10 years. She holds a Systems Engineering degree from the University of Virginia. She is an active member of the TRB Work Zone Traffic Control Committee (AHB55), the ATSSA ITS Council, and ITE, and serves as the FHWA Liaison to the AASHTO SCOTE Work Zone Workgroup and AASHTO SSOM Reliability Task Force.
REYNALDO STARGELL works as a Traffic Engineer in the Ohio Department of Transporta-tion’s Office of Traffic Engineering. He has been closely involved in planning the maintenance of traffic for several of Ohio’s largest and most complex projects. He chairs Ohio’s District Work Zone Traffic Managers Committee, which comprises some of Ohio’s foremost work zone traffic specialists. He also organizes ODOT’’s Work Zone Crash Tracking Program, a process used to obtain “real-time” traffic data on Ohio’’s biggest construction projects. Stargell is ODOT’s Coordinator for the Permitted Lane Closure Schedule, a key component of ODOT’s work zone policy. He holds a bachelor of science degree in Civil Engineering from the University of Dayton.
BRIAN ZIMMERMAN is the Statewide Work Zone Administrator for the Michigan Department of Transportation (MDOT) in Lansing. While serving the department for more than 33 years, he has more than 26 years of experience in design, implementation, and operations of work zone traffic control. His office is responsible for the development and oversight of statewide policy, rules and regulations and training for the agency’s’ Construction Work Zone Program, which also includes maintenance and permitted activities. He is also involved in the continued development and deployment of the agency’s’ Work Zone Safety and Mobility Policy. He serves as

B-5BEST PRACTICES IN WORK ZONE ASSESSMENT, DATA COLLECTION, AND PERFORMANCE EVALUATION
the MDOT Chair of the Work Zone Safety and Mobility Statewide Peer Review Team, Chairs the State/Industry Construction Zone Partnering Committee, Chairs the MDOT Strategic Highway Safety Plan to reduce crashes in work zones, and serves as a member of the Governors Traffic Safety Advisory Council. He is a graduate of Lansing Community College with a degree in Civil Engineering Technology.

B-6
A P P E N D I X C : A M P L I F Y I N G Q U E S T I O N S

C-1BEST PRACTICES IN WORK ZONE ASSESSMENT, DATA COLLECTION, AND PERFORMANCE EVALUATION
A p p e n d i x C :
Amplifying Questions

C-2
A P P E N D I X C : A M P L I F Y I N G Q U E S T I O N S
1. How does your agency assess the safety and congestion/operational performance of your work zones? In other words, how do you know if your work zones are operating well (safely/smoothly/efficiently)?
n What measures are you using to assess safety performance?
l Are the measures quantitative or qualitative or both?
l What are the units for these measures?
l What are your performance goals/targets for these measures?
t Who makes this determination?
t Who is responsible and what are the consequences if targets are not met?
l How have these measures been trending over time?
l Is cost being used to assess work zones?
l How did your agency decide that these would be the appropriate measures to use?
l Who in your agency was responsible for establishing these performance measures?
l Does your agency have a policy regarding when and how to use the measures?
l Are the measures communicated to the public?
l How are the measures distributed to other offices or other organizations/stakeholders (e.g., contractors, utility companies)?
l How long has your agency been using these measures?
l What has been your agency’s experience in applying these measures?
l Do measures for maintenance work zones differ from those for construction work zones?
n What measures are you using to assess delay/operational performance?
l Are the measures quantitative or qualitative or both?
l What are the units for these measures?
l What are your performance goals/targets for these measures?
t Who makes this determination?
t Who is responsible and what are the consequences if targets are not met?
l How have these measures been trending over time?
l Is cost being used to assess work zones?
l How did your agency decide that these would be the appropriate measures to use?

C-3BEST PRACTICES IN WORK ZONE ASSESSMENT, DATA COLLECTION, AND PERFORMANCE EVALUATION
l Who in your agency was responsible for establishing these performance measures?
l Does your agency have a policy regarding when and how to use the measures?
l Are the measures communicated to the public?
l How are the measures distributed to other offices or other organizations?
l How long has your agency been using these measures?
l What has been your agency’s experience in applying these measures?
n Does your agency have permitted lane closure charts showing allowable times for closing lanes on various roads? (Note that this is a form of performance measure; the basis is the measure and the threshold is the goal/target.)
l How were the times determined?
l What was the basis for determining when it was OK or not OK to close a lane (e.g., delay or queue length)?
l What thresholds were used?
n Does your agency use lane rental or performance-based incentives/disincentives with regard to work zone safety and mobility in your contracts? (Note that this is a form of performance measure.)
l How are the lane rental and I/D amounts determined?
l Based on delay? What is considered to be an acceptable delay?
t Travel time?
t Crashes?
t User cost?
l How do you determine when to use these contract elements?
n Do you assess the performance of your work zones based on data/information from a sample of work zones or on all projects?
l If a sample, what is the process for determining which projects to apply the measures to?
n What problems, if any, have your agency encountered in applying performance measures?
n What benefits have your agency realized from applying performance measures?
n What would your agency do differently if it had the opportunity to start over?
n Have any changes been made to the measures since your agency began using them?
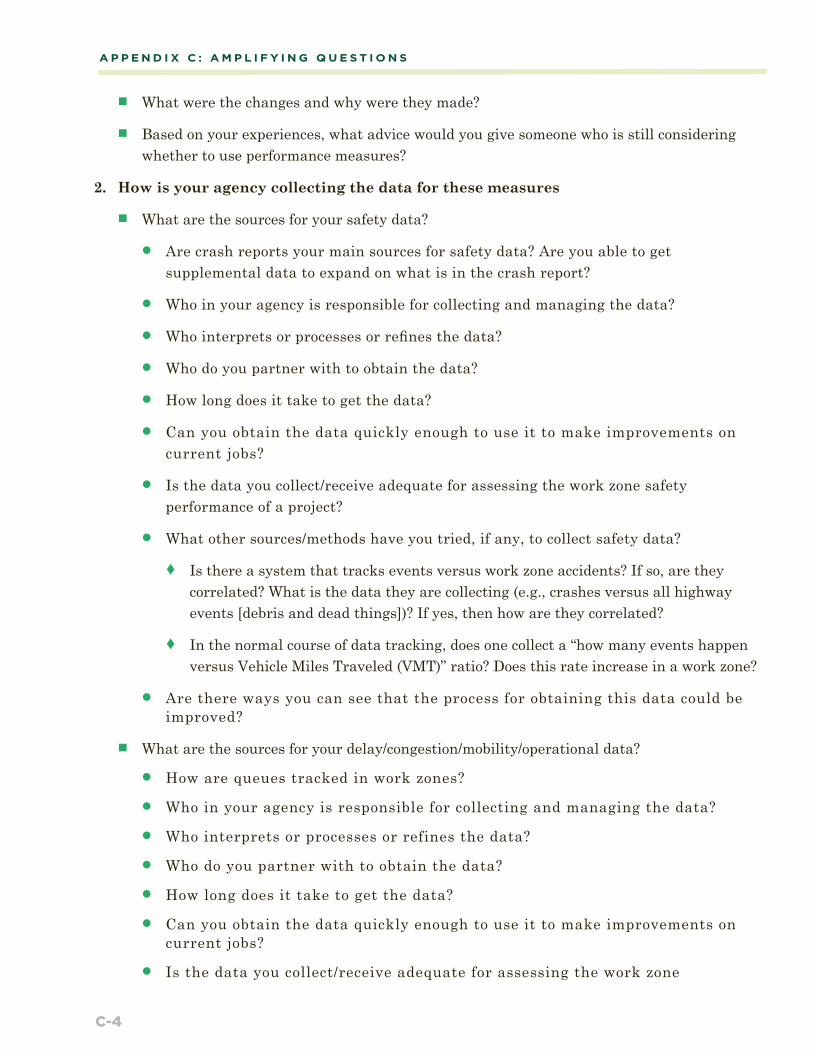
C-4
A P P E N D I X C : A M P L I F Y I N G Q U E S T I O N S
n What were the changes and why were they made?
n Based on your experiences, what advice would you give someone who is still considering whether to use performance measures?
2. How is your agency collecting the data for these measures
n What are the sources for your safety data?
l Are crash reports your main sources for safety data? Are you able to get supplemental data to expand on what is in the crash report?
l Who in your agency is responsible for collecting and managing the data?
l Who interprets or processes or refines the data?
l Who do you partner with to obtain the data?
l How long does it take to get the data?
l Can you obtain the data quickly enough to use it to make improvements on current jobs?
l Is the data you collect/receive adequate for assessing the work zone safety performance of a project?
l What other sources/methods have you tried, if any, to collect safety data?
t Is there a system that tracks events versus work zone accidents? If so, are they correlated? What is the data they are collecting (e.g., crashes versus all highway events [debris and dead things])? If yes, then how are they correlated?
t In the normal course of data tracking, does one collect a “how many events happen versus Vehicle Miles Traveled (VMT)” ratio? Does this rate increase in a work zone?
l Are there ways you can see that the process for obtaining this data could be improved?
n What are the sources for your delay/congestion/mobility/operational data?
l How are queues tracked in work zones?
l Who in your agency is responsible for collecting and managing the data?
l Who interprets or processes or refines the data?
l Who do you partner with to obtain the data?
l How long does it take to get the data?
l Can you obtain the data quickly enough to use it to make improvements on current jobs?
l Is the data you collect/receive adequate for assessing the work zone

C-5BEST PRACTICES IN WORK ZONE ASSESSMENT, DATA COLLECTION, AND PERFORMANCE EVALUATION
congestion/mobility/operational performance of a project?
l What other sources/methods have you tried, if any, to collect congestion/mobility/operational data?
l Are there ways you can see that the process for obtaining this data could be improved?
n Are monitoring/data forms (paper or electronic) used to collect data?
l What fields do these forms contain?
l Is use of the forms required?
l Are they completed for every project?
l What is the frequency they are completed (e.g., hourly, daily, weekly, or after every phase change)?
l Who fills them out?
l What is the success rate in getting them filled out by the responsible personnel?
l Can you provide copies of the forms?
n Do your TMPs contain monitoring requirements regarding work zone data/performance?
l What is included in the requirements?
l Who carries out the monitoring (e.g., contractor, agency, or a third party)?
l Do the requirements vary from project to project? If so, how?
l Can you provide copies of some sample requirements?
n How are observations by construction or inspection personnel captured?
n What role do the responsible persons, designated by the contractor and the agency for implementing the TMP and other safety and mobility aspects of the project, play in capturing work zone performance information?
n What is the role of TMCs?
n Is technology used to monitor work zone performance and gather work zone performance data?
l Is ITS used to gather work zone performance data? If so, how?
n Does your agency perform periodic customer satisfaction surveys?
l Are the surveys done for individual projects or are they more general DOT-wide surveys that touch on some work zone aspects?
l How often are the surveys done?

C-6
A P P E N D I X C : A M P L I F Y I N G Q U E S T I O N S
l Do you have copies you can share?
n What is the estimated cost for your agency to collect and manage the data necessary to support these measures?
n How did your agency pay for the equipment, software, and/or manpower for collecting the data?
n Is your agency aware of or considering any emerging technologies or data sources that can simplify your current data collection efforts or provide the possibility to consider using new measures?
n What has been your agency’s biggest challenge in collecting data to support these measures? How did your agency overcome it?
3. How is your agency using or planning to use the data to make improvements in work zone performance and management?
n How is the data being evaluated to determine if changes to the work zone policy may be necessary?
l How frequently is this done?
l Can you provide an example of one such change?
n Do your contracts and/or TMPs contain performance-based incentives with regard to work zone safety and mobility?
l How are the incentives structured?
l How is “compliance” with the incentives measured?
l Who is responsible for assessing whether the incentive targets have been met?
n Do you have a data management system for work zone data?
l Who has access to it?
l What capabilities does it have?
l How does your agency address quality control for the data?
l Is it just for work zones?
l Who is responsible for updating it?
t How frequently is new data added to the system?
l How many years of data are kept in it?
l Does it work well for your needs?
l How is the system configured to accommodate access to the data and ease of use for various users?

C-7BEST PRACTICES IN WORK ZONE ASSESSMENT, DATA COLLECTION, AND PERFORMANCE EVALUATION
n What kind of feedback loop do you have to ensure that what is learned on this year’s jobs (both good and bad, including any innovative practices) will help with future projects?
l Do you use the data during work zone process reviews?
l Do you look at the data during annual field/TTC inspections?
4. What processes, methods, and/or tools are states using to assess impacts during various stages of project development (i.e., planning, design, and construction)?
n How are the performance measures/data being used in the various sections of your agency (i.e., planning, design, and construction) to improve work zone management and performance?
n How are the data being used to influence project scheduling and budgets during the planning stage?
n Do increased data demands in planning cause slowdowns in project development (i.e., the return of requested data)?
n What is your agency doing to identify potential traffic problems during project development, before work implementation?
l Do you have a checklist, flowchart, or similar tool to identify red flags that might “flag” concerns about work zone impacts of a project under development?
l Are lane closure charts or simple HCM tables used?
l How often are analysis tools used?
n Who is responsible for assessing work zone impacts during project development?
n At what stage(s) during project development are work zone impacts assessed?
l Is this early enough? Too early?
l Are impacts reassessed as more is known about the project later in development?
n What data are used to assess work zone impacts?
n Are the impacts converted to road user costs for consideration in cost analyses? If so, how is this done?
n How are the data being used to influence the selection of transportation management strategies during design? How many scenarios/strategies are typically analyzed?
n Do you require the contractor to reassess impacts if it proposes changes at the preconstruction meeting through value engineering or otherwise?

C-8
A P P E N D I X C : A M P L I F Y I N G Q U E S T I O N S
l How much additional impact would be allowed in such a case?
n Are different analysis tools used by your agency during different stages of project development? Why?
l What “tools” are being used to help determine levels of TC devices (i.e., tools for creating TC device estimates or tools for determining when to use one device over another [e.g., flaggers versus police])?
l Are any states using a Quick Zone type of software to assess in the design phase what queues and delays may result during construction?
n How did your agency determine what would be the most appropriate analysis tools to use?
n Are analysis tools used by your agency chosen with consideration of the performance measures being used? How well are the tools able to represent the measures?
n How well can the tools differentiate between different transportation management strategies?
n How is output from the analysis tools validated? Have the analysis tools been calibrated to local conditions? Were HCM default values used?
l Is data collected during construction to help validate or refine the traffic model used in the planning and design stages?
n What aspects of impact analysis are handled in-house versus using consultants?
n If consultants are used, how knowledgeable is agency staff with the analysis tools being used by the consultant?
n What training on the use of these tools has your agency provided to key staff? Who are the “key staff” in your agency (i.e., positions)?
n What are the major challenges encountered by your agency in assessing and managing work zone impacts?
n What benefits have your agency realized from its approach to assessing and managing work zone impacts?

A P P E N D I X D : S C A N I T I N E R A R Y

D-1BEST PRACTICES IN WORK ZONE ASSESSMENT, DATA COLLECTION, AND PERFORMANCE EVALUATION
A p p e n d i x D :
Scan Itinerary

D-2
A P P E N D I X D : S C A N I T I N E R A R Y

D-3BEST PRACTICES IN WORK ZONE ASSESSMENT, DATA COLLECTION, AND PERFORMANCE EVALUATION

A P P E N D I X E : H O S T A G E N C Y C O N TA C T I N F O R M AT I O N

E-1BEST PRACTICES IN WORK ZONE ASSESSMENT, DATA COLLECTION, AND PERFORMANCE EVALUATION
A p p e n d i x E :
Host Agency Contact Information

E-2
New Hampshire DOT
William Janelle Asst. Director of Project Development New Hampshire DOT PO Box 483, Route 106 Concord, NH 03302-0483 Phone: (603) 271-1486 Fax: (603) 271-3914 E-mail: [email protected]
New York State DOT
Charles E. Riedel Acting Director, Safety Programs and Technical Operations Bureau Office of Traffic Safety & Mobility New York State Department of Transportation 50 Wolf Rd. Albany, NY 12232 Phone: (518) 457-2185 Alt. Phone: (518) 457-3537 Fax: (518) 457-1780 E-mail: [email protected]
New Jersey DOT
Dennis Motiani Director, Division of Traffic Operations New Jersey DOT 1035 Parkway Ave Trenton, NJ 08625 Phone: (609)530-4690 E-mail: [email protected]
A P P E N D I X E : H O S T A G E N C Y C O N TA C T I N F O R M AT I O N

E-3BEST PRACTICES IN WORK ZONE ASSESSMENT, DATA COLLECTION, AND PERFORMANCE EVALUATION
New Jersey Turnpike
Sean Hill Operation Director Traffic Management & Technology Center NJ Turnpike PO Box 5042 Woodbridge, NJ 07095-5042 Phone: (732) 442-8600, Ext. 2901 E-mail: [email protected]
TransCom
Robert Glantzberg TRANSCOM Newport Financial Center 111 Town Square Place - 6th Floor Jersey City, NJ 07310 Phone: (201) 963-4033 E-mail: [email protected]
Delaware Valley Region Planning Commission (DVRPC)
Stan Platt DVRPC 190 North Independence Mall W Philadelphia, PA 19106 Phone: (215) 238-2853 E-mail: [email protected]
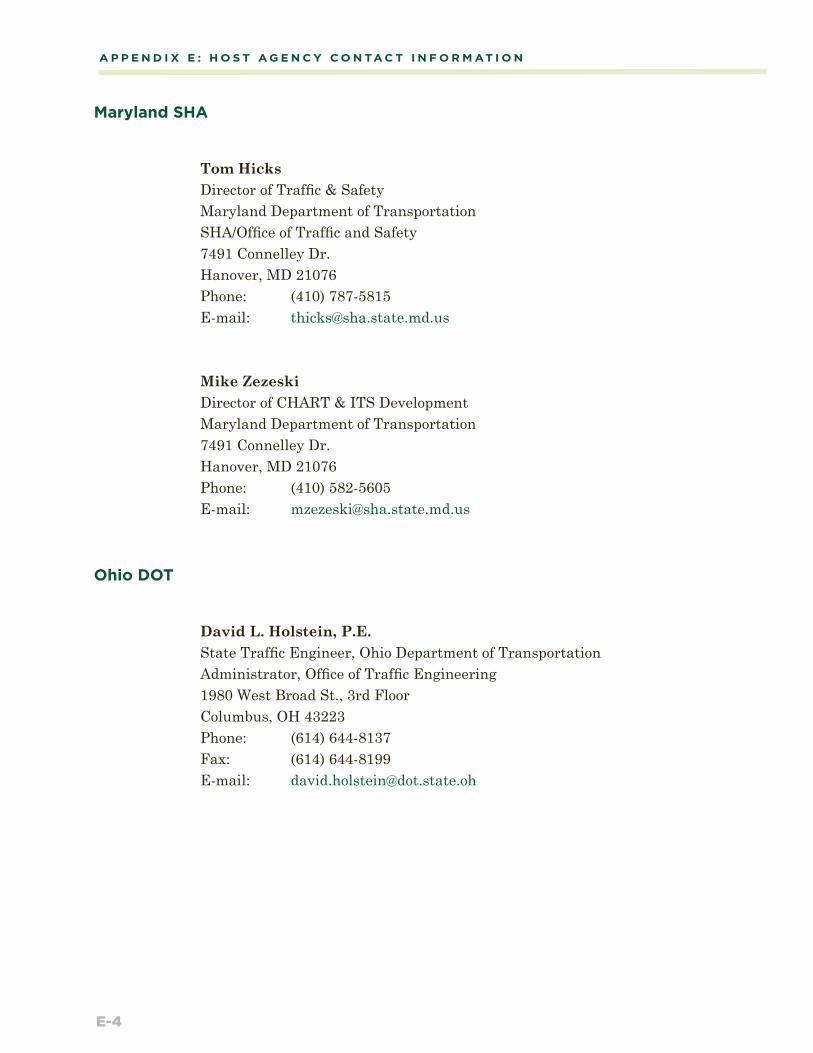
E-4
A P P E N D I X E : H O S T A G E N C Y C O N TA C T I N F O R M AT I O N
Maryland SHA
Tom Hicks Director of Traffic & Safety Maryland Department of Transportation SHA/Office of Traffic and Safety 7491 Connelley Dr. Hanover, MD 21076 Phone: (410) 787-5815 E-mail: [email protected]
Mike Zezeski Director of CHART & ITS Development Maryland Department of Transportation 7491 Connelley Dr. Hanover, MD 21076 Phone: (410) 582-5605 E-mail: [email protected]
Ohio DOT
David L. Holstein, P.E. State Traffic Engineer, Ohio Department of Transportation Administrator, Office of Traffic Engineering 1980 West Broad St., 3rd Floor Columbus, OH 43223 Phone: (614) 644-8137 Fax: (614) 644-8199 E-mail: [email protected]

E-5BEST PRACTICES IN WORK ZONE ASSESSMENT, DATA COLLECTION, AND PERFORMANCE EVALUATION
Florida DOT
Cheryl Adams Florida Department of Transportation Roadway Design Office - MS 32 Criteria and Standards Section 605 Suwannee St. Tallahassee, FL 32399-0450 Phone: (850) 414-4327 E-mail: [email protected]
Illinois Tollway
Pete Foernssler, Deputy Chief Engineer Illinois Tollway Authority 2700 Ogden Ave. Downers Grove, IL 60515 Phone: (630) 241-6800 E-mail: [email protected]
John L. Benda General Manager of Maintenance & Traffic Illinois Tollway Authority 2700 Ogden Ave Downers Grove, IL 60515 Phone: (630) 241-6800, Ext. 3903 E-mail: [email protected]
Michigan DOT

E-6
A P P E N D I X E : H O S T A G E N C Y C O N TA C T I N F O R M AT I O N
Brian Zimmerman Work Zone Technical Administrator Michigan Department of Transportation 6333 Lansing Rd. Lansing, MI 48917 Phone: (517) 242-7366 E-mail: [email protected]
Indiana DOT
John P. (Pat) McCarty Supervisor of the Work Zone Safety Section Division of Highway Operations, Office of Technical Services Indiana Department of Transportation 100 N. Senate Ave. Indianapolis, IN 46204 Phone: (317) 234-5114 Fax: (317) 232-5551 E-mail: [email protected]
Pennsylvania DOT
James Tenaglia Division Chief, Risk Management/Administrative Services Division Bureau of Highway Safety and Traffic Engineering Pennsylvania DOT Keystone Building 400 North St. Harrisburg, PA 17120 Phone: (717) 705-1442 E-mail: [email protected].
Missouri DOT

E-7BEST PRACTICES IN WORK ZONE ASSESSMENT, DATA COLLECTION, AND PERFORMANCE EVALUATION
Daniel J. Smith, P.E. Traffic Management and Operations Engineer Missouri DOT – Traffic Division 2211 St. Mary’s Blvd., PO Box 270 Jefferson City, MO 65102 Phone: (573) 526-4329 Fax: (573) 526-4868 E-mail: [email protected]
Wisconsin DOT
Tom Notbohm Wisconsin DOT Bureau of Hwy. Operations 4802 Sheboygan Ave., Room 501 PO Box 7986 Madison, WI 53707-7986 Phone: (608) 266-0982 E-mail: [email protected]
Washington State DOT
Frank Newboles Wisconsin DOT HQ Traffic Office Work Zone Manager 310 Maple Park Ave, S.E. Olympia, WA 98501 Phone: (360) 705-7392 E-mail: [email protected]
California DOT
Diana Gomez, P.E., PMP

E-8
A P P E N D I X E : H O S T A G E N C Y C O N TA C T I N F O R M AT I O N
Chief, Office of System Management Caltrans Headquarters 1120 N St. Sacramento, CA 95814 Phone: (916) 651-1255 E-mail: [email protected]

E-9BEST PRACTICES IN WORK ZONE ASSESSMENT, DATA COLLECTION, AND PERFORMANCE EVALUATION

E-10BEST PRACTICES IN WORK ZONE ASSESSMENT, DATA COLLECTION, AND PERFORMANCE EVALUATION