scangroup annual report 2012 · companies act and to authorize the directors to set their...
TRANSCRIPT


1
SCANGROUP ANNUAL REPORT 2012
PAGES
Notice to annual general meeting 2013 2
Board of directors 3 - 4
Letter to shareholders 5 - 8
Corporate governance 9 - 10
Shareholding 11 - 12
Five year’s financial performance 13
Corporate information 14 - 15
Report of the directors 16
Statement of directors’ responsibilities 17
Independent auditors’ report 18
Financial Statements
Consolidated statement of comprehensive income 19
Consolidated statement of financial position 20
Company statement of financial position 21
Consolidated statement of changes in equity 22
Company statement of changes in equity 23
Consolidated statement of cash flows 24
Notes to the financial statements 25-55
CONTENTS

2
SCANGROUP ANNUAL REPORT 2012
NOTICE OF THE ANNUAL GENERAL MEETING 2013
Notice is hereby given that the 2013 Annual General Meeting of Scangroup Limited will be held at the Bomas of Kenya, Nairobi, Kenya on Thursday 27 June 2013 at 11.00 a.m. to transact the following business:
ORDINARY BUSINESS
1. To read the Notice convening the meeting.
2. To receive, consider and adopt the Balance Sheet and Accounts for the year ended 31 December 2012 together with the Directors’ and Auditors report thereon.
3. To consider and approve a first and final dividend totalling Sh 170,873,477 being Sh 0.60 per share for the year ended 31 December 2012 payable on or about 30 July 2013 to Shareholders on the Register of Members at the close of business on 27 June 2013.
4. To approve the remuneration of the Directors as provided in the Accounts for the year ended 31 December 2012.
5. To re-elect Director: In accordance with Article 93 of the Company’s Articles of Association, Mr Muchiri Wahome retires by rotation and, being eligible, offers himself for re-election.
6. To note that Deloitte & Touche continue in office as Auditors of the Company in accordance with the provisions of Sec. 159(2) of the Companies Act and to authorize the Directors to set their remuneration for the ensuing financial year.
By Order of the Board Margaret M. Kipchumba Company Secretary 27th February 2013 Nairobi
Notes:
1. A Member entitled to attend and vote at the Annual General Meeting is entitled to appoint a proxy to attend and vote on his or her behalf. A proxy need not be a member of the Company. A Proxy Form may be downloaded from the Company’s website, www.scangroup.biz, or obtained from the Registrar, Comp-rite Kenya Limited, The Crescent, Off Parklands Road, Crescent Business Centre, 2nd Floor Nairobi – P.O. Box 63428-00619 Nairobi. To be valid, a Proxy Form must be duly completed by a Member and must either be lodged with the Registrar at the above given address or posted so as to reach the Registrar not later than 11.00 a.m. on Tuesday 25 June 2013.
2. Registration of Members and proxies attending the Annual General Meeting will commence at 8 a.m. on 27 June 2013 and will close at the conclusion of the meeting. Members and proxies will be required to produce a national identity card, a passport or other acceptable means of identification. CDS account numbers or Member numbers will also be required for ease of the registration process.
3. Courtesy transport will be provided for Members on the day of the meeting between 7.30 a.m. to 10.15 a.m. from town (pick-up and drop-off points: behind Kencom House - Moi Avenue, Nairobi) to the venue of the meeting and back to town at the conclusion of the meeting.

3
SCANGROUP ANNUAL REPORT 2012
BOARD OF DIRECTORS
David HutchisonChairman and Independent Non-Executive DirectorDavid, age 68, is a Certified Public Accountant and formerly Senior Partner of Ernst & Young Eastern Africa. He has many years experience in related aspects of audit, tax advice and financial management, reconstruction and consulting covering many sectors, in a diversity ofAfrican countries. David is a non-executive Director of the ICEA Lion General and Life companies, East Africa Reinsurance Company Limited, East African Packaging Industries Limited (Chairman), Prime Bank Limited, Synresins Limited, and Chairman of a number of companies within The Banda educational and property groups.
Bharat ThakrarChief Executive OfficerBharat, age 61, is the founder shareholder of Scangroup and a Director of all Scangroup subsidiaries and has over 39 years working experience in the Advertising and Communications industry. He holds a Diploma in Advertising and Marketing from the Communications and Marketing Foundation - UK. He is a former Chairman of the Advertising Practitioners Association (APA). He has undergone various Executive Management Courses including one at the Harvard Business School.
Richard Omwela, OGWIndependent Non-Executive DirectorRichard, age 57, holds a Bachelor of Honours Degree in Law (LLB) Upper Class Division from the University of Nairobi, a diploma in Law from the Kenya School of Law and is an advocate of the High Court of Kenya. Richard is the Managing Partner of Hamilton Harrison and Mathews Advocates. He is a Member of the Law Society of Kenya and the Institute of Certified Public Secretaries of Kenya. He is the Chairman of Nairobi Airport Services Limited (NAS), and is a member of the Board of Directors of ABC Bank Limited, Solio East Africa, The Monarch Insurance Company Limited, Genesis Kenya Investments Limited and Octagon Pension Services Limited.
Muchiri WahomeIndependent Non-Executive DirectorMuchiri, age 50, has over 22 years of retail experience and is currently the Chief Executive Officer of Deacons Group of Companies. He is also a Non Executive Director of Tea Brokers E.A and Kiko Romeo Limited.He is also the Chairman of the Board of Governors of Moi Equator Girls Secondary School and a member of the Federation of Kenya Employers (FKE) management board. In 2005 he was awarded the Head of State commendation medal for implementing performance contracts with public bodies. Muchiri is fellow of the Aspen Leadership Center.
Andrew Grant Balfour ScottNon-Executive DirectorAndrew, age 44, is Chief Operating Officer for WPP in Europe and is also WPP’s Director of Corporate Development leading the Group’s global Mergers and Acquisition activity. Prior to joining WPP Andrew was a strategy consultant at LEK Consulting. He holds an MBA with distinction from INSEAD.
Laurence MellmanNon-Executive DirectorLaurence, age 47, is a Director of Special Projects at WPP. He has worked at WPP since 1996 and has undertaken a number of roles in both the parent company and in the operating companies. Currently Laurence is also Chief Operating Officer at the United Network, an advertising agency network within WPP with agencies in Europe and the United States. Prior to joining WPP, Laurence trained as a Charted Accountant with Pricewaterhousecooper London and Manchester, qualifying in 1991. Laurence holds a degree in Commerce and Accounting from the University of Birmingham in the UK.

4
SCANGROUP ANNUAL REPORT 2012
Manish ShahFinance DirectorManish, age 39, is a member of the Institute of Certified Public Accountants of Kenya and The Institute of Chartered Accountants of India. He holds a Bachelor of Commerce Degree from the University of Bombay and a Diploma in Information & System Management from APTECH Computer Education. He has a wealth of experience spanning 14 years in the advertising and marketing industry having worked with the French advertising group Publicis in India prior to joining Scangroup in 2003.
Margaret Muhuni-KipchumbaCompany SecretaryMargaret, age 39, joined Scangroup as Head of Legal and Company Secretary in 2009 and also serves on the Boards of the Kenyan subsidiaries in this capacity. She is an advocate of the High Court of Kenya and a Certified Public Secretary. She is a Member of the Law Society of Kenya, the Institute of Certified Public Secretaries of Kenya and the Institute of Directors - Kenya.
BOARD OF DIRECTORS (Contd.)

5
SCANGROUP ANNUAL REPORT 2012
LETTER TO THE SHAREHOLDERS
Dear Shareholder,
We are pleased to present the annual report for Scangroup Limited for the year ended 31 December 2012.
ECONOMYThe Kenyan economy is estimated to have grown by 4.7% in 2012 which fell short of the 5.1% growth estimated at the beginning of the year. This was mainly attributed to a slowdown of economic activity in the months leading to the general elections. Despite the slowdown, the expected growth in 2012 was better than the previous year, when the economy grew by 4.1% with the high inflation of 14%. The increasing share of the ‘Services Industry’ as a percentage of total GDP of the country, which in 2012 was 61%, is a positive indicator of new opportunities in the country. The high unemployment rate remains a concern, but at the same time underscores the growth potential were the country able to better utilise its available work force.
The neighbouring countries where the Company has operations are also expected to have experienced positive economic growth in 2012. The GDP of Uganda, Tanzania and Rwanda is estimated to have grown by 4.2%, 6.5% and 7.7% respectively. The service industry in these countries also accounted for nearly 50% of the their total respective economics.
In Ghana, where the Company launched operations in October 2011, has attracted global attention for its relatively sound management, a competitive business environment, and sustained reductions in poverty levels. In 2012, the country’s economy grew by 7.9%.
Although high inflation has historically been a concern for Kenya and its neighbours, recent fiscal measures and buoyant growth have helped most countries better manage their inflation. At the beginning of 2012 the inflation rate in Kenya was at 19%. Since then, inflation has eased substantially. Recent data suggests that in 2013 monthly inflation has remained in the region of 4.5%.
Source: Kenya National Bureau of Statistics; CIA.com; FT.com and World Bank Reports
2013 OUTLOOKThe recently concluded general elections in Kenya have paved the way for a more devolved government under the new constitution which has given the Kenyan economy a great amount of upsurge in investor confidence. Recent performance of the Nairobi Securities Exchange indicates that the private sector has started to attract more foreign investment after a sluggish few months prior to the polls. The NSE 20 Share Index grew by 4.1% in the last quarter of 2012 but has registered an impressive 23.4% growth in the first quarter of this year. By the end of March 2013, foreign inflows were at USD 126.3 million compared to the full year inflows of USD 268.81 million in 2012. These figures are testimony of the improving economic climate.
Kenya’s economy is expected to grow by 5% and inflation is also expected to remain at 5% in 2013. Foreign exchange reserves are also expected to rise as the country plans to issue USD 1 billion worth of Eurobonds this year.
Overall, the year 2013 is expected to usher a sustained period of economic growth riding on the back of the development promises made by the new government and the policies that have been implemented to achieve the same.
Source: Kenya National Bureau of Statistics and Standard Investment Bank research
INDUSTRY PERFORMANCEThe Advertising industry in Sub-Saharan Africa is on a growth trajectory fuelled by an ever increasing number of global clients wishing to either enter Sub-Saharan Africa or to increase their marketing investments. Increasing disposable income of consumers especially in the middle-income group is adding to the importance of the continent to our clients. As marketing communication is necessary to reach consumers, investment in marketing services is likely to increase.
In Kenya, the advertising industry is estimated to have grown to Sh. 90 billion in 2012, a 38% increase from 2011. 50% of all ad-spend is directed to Radio. Industry experts believe that TV has potential in the region as it has the highest recall rate, making it the most effective medium of advertising. In the last four years TV’s share in total ad-spend increased from 10% to 39%. In 2012 TV accounted for 31% and 23% of total ad-spend in Tanzania and Uganda respectively. This reflects the increasing trend in those countries. Digital

6
SCANGROUP ANNUAL REPORT 2012
INDUSTRY PERFORMANCE (Contd.)advertising, though in nascent stages is already being reckoned as a game changer. In addition to Digital, demand for other marketing disciplines such as Public Relations and Speciality Communication continue to grow.
Clients’ increasing expectations of better return on media investment has continued to challenge the industry to improve its effectiveness. In a bid to achieve client expectations, agencies operating in this region continue to evolve and are becoming more innovative. Association of local or regional players with global agencies who are also looking to diversify into emerging and frontier markets reflects the growing demand for global practices. All these together have a bearing on scarce quality resources, which is increasingly becoming a concern for the industry.
The industry phenomenon in other markets where the Company has operations is similar to that of Kenya. As African economies start working as blocs, companies are increasingly starting to seek agencies that can operate across markets and across disciplines. Our long term objective is aligned to this expectation.
Source: Industry data from Ipsos
UPDATE ON INTRODUCTION OF NEW SERVICES AND MARKETSOur growth strategy is “Integrated Marketing Communication” (IMC) delivery to our clients across all disciplines across multiple markets. We believe that delivering global best practice across multiple markets to our clients will cement our relationships with them. In line with the above strategy, during the year, the Company launched a new division, ‘Savannah Strategies’ which specialises in Communication Planning. It also launched operations in Nigeria by setting up Scanad Nigeria and Millward Brown Nigeria to provide advertising, marketing and advertising research services, respectively.
Unfortunately, Scanad Nigeria encountered a legal challenge early in its operations regarding a dispute with an Ogilvy affiliate, over territorial rights. The matter is before the Courts in Nigeria and the management is hoping for a positive and timely resolution.
COMPANY’S FINANCIAL PERFORMANCEThe 2012 consolidated results include the full year results for Ogilvy Ghana Limited, Scanad Ghana Limited and Scanad Rwanda which started operating in the last quarter of 2011.
In 2012, the Group’s billings increased by 11% and revenues grew by 18%. In our business, billings do not necessarily have a correlation with revenues because more than 50% of our revenues are from retainer fees which are not directly related to the level of client spend on media advertising.
Kenya is still our primary market in terms of contribution. However, the dependence on Kenya continues to reduce. In 2012 Kenya as a market contributed 60% of the total revenues. This was mainly due to higher revenue contributions from Pan-African markets. On a Like For Like basis (excluding the results of entities and divisions started during 2011 and 2012) Advertising and Media contributed 79% of Group revenue and grew by 6% during 2012. Revenue from Public Relations and Advertising Research accounted for 7% each and increased by 43% and 40% respectively. Digital business, though contributing only 6% of the Group revenue compared to 4% in the previous year, grew by over 90%.
LETTER TO THE SHAREHOLDERS (Contd.)

7
SCANGROUP ANNUAL REPORT 2012
COMPANY’S FINANCIAL PERFORMANCE (Contd.)As would be reasonably expected, the setting up of new entities in Ghana and Nigeria had a significant impact on the Group’s overall cost base in 2012. Furthermore, profit before tax for 2011 included one-off/ exceptional investment income from gains on the sale of Government Infrastructure Bonds and exchange gains of Sh. 200 million. These factors contributed to 14% and 13% decline in 2012 profit before tax and Earnings Per Share (EPS) respectively over 2011, all in spite of an increase in interest income from Ksh 92 million to Ksh 166 million, which was due to an increase in the interest rate on bank deposits.
PROPOSED DIVIDENDYour Board has recommended for approval at the Annual General Meeting a payment of the first and final dividend of Sh. 0.60 per share amounting to Sh. 170,873,477 for the year ended 31 December 2012 (2011: Sh. 0.70 per share amounting to Sh. 199,352,390). In spite of a decline in a reported EPS of 13%, the Company has maintained the dividend pay-out ratio of over 27%. While recommending the dividend, the Board has considered the Group’s future cash flow requirements. It is also instructive to note that a significant sum of working capital remains tied up in VAT refund claims settlements from the Kenya Revenue Authority.
BOARDThe Directors who held office in 2012 to the date of this report are listed on page 3 and 4. There has been no change in the Board composition from the previous reporting period.
OUR PEOPLEOur people strategy for the year 2012 was Development and Retention of our human capital to ensure continued availability of talent to achieve the Group’s objectives. 2012 was specifically challenging as the Group had to make adjustments to its retention strategy to counter the influence of various new entrants in the market. Our vision is the empowering of our employees at all levels by offering them training and nurturing opportunities within the Group, both locally and internationally.
The Group partnered with the Advertising Practitioners Association of Kenya and WPP for training programs. Seventeen senior management staff went to Johannesburg for a training organized by WPP. The main objective of this training was to give senior leaders an opportunity to strengthen their business acumen, to accelerate the professional development of the next generation of leaders and to foster working relationships across the Group. This group was given the experience, exposure and knowledge to think beyond convention and equip them with the ability and confidence to engage responsively with the market and clients. The Group believes that such programs will enable our senior management employees to be at par with those of our clients.
The Advertising Practitioners Association of Kenya gave us an opportunity to train our Middle Management and Junior Account Management teams in the fundamentals of Advertising, Marketing, Media Planning, Research, Team Leadership and Financial acumen. Various renowned advertising professionals from both local and international markets participated in the training program. This program was focused to equip our staff with a better understanding of the business in order to help them deliver on their day to day functions as well as excel in their chosen segment.
Opportunity to participate in such training programs make the participants feel a sense of recognition. We have observed positive changes in their attitude, heightened zeal and more confidence to deliver. They are now looked upon as knowledge transfer ambassadors by their peers and beginners at the workplace, which further enhances their sense of recognition.
CORPORATE GOVERNANCEThe Board and its committees, the Audit & Risk Management Committee, the Board IT Oversight Committee, and the Nominating and Remuneration Committee continue to discharge their oversight mandates on the Company’s financial activities, internal controls, technology infrastructure, risk management practices, and human resource management. A statement on corporate governance is set out on page 9.
LETTER TO THE SHAREHOLDERS (Contd.)

8
SCANGROUP ANNUAL REPORT 2012
LETTER TO THE SHAREHOLDERS (Contd.)
CORPORATE SOCIAL RESPONSIBILITY
Nairobi Greenline
Scangroup continues in its support of the Nairobi Greenline; a joint project between the Kenya Wildlife Service and the Kenya Association of Manufacturers to protect the Nairobi National Park. With over 250,000 trees planted around the park, the Nairobi Greenline is near completion. Plans are underway to move the Greenline initiatives to other Parks across the country.
Bring Zack Back HomeThe Group is proud to have been associated with the ‘Bring Zack Back Home’ campaign launched by the Kenya Paraplegic organisation in partnership with Safaricom.
The face of this campaign Zackary Kimotho (Zack) was in early January 2004, shot in an attempted carjacking incident. This caused him to became paralyzed from the waist down. Zack’s goal was to travel to the nearest spinal injury rehabilitation centre in South Africa for treatment, on a wheel chair.
Scangroup helped to launch and drive the campaign with a target to raise Sh250 million for construction of a rehabilitation in Kenya centre for spinal cord injury patients. The social investment made by Scangroup was in the form of creative time, energy and resources spent to make this campaign a multimedia success. Bring Zack Back Home raised seed capital for a rehabilitation centre here in Kenya and drew worldwide media attention around the globe.
APPRECIATIONWe would like to thank our clients in all the countries we operate in for their continued patronage without which our vision to be the leading marketing services company would not be achievable. We would also like to thank our shareholders for the confidence demonstrated in the management and leadership of the Company and last but not least, our dedicated and committed staff for their pursuit of excellence in service delivery that has helped achieve these results.
David Hutchison Bharat ThakrarChairman CEO27 February 2013

9
SCANGROUP ANNUAL REPORT 2012
CORPORATE GOVERNANCE
CORPORATE GOVERANCE STATEMENTThe Board of Directors is committed to complying with legislation, regulation and best practice and has in particular adopted the Capital Markets Authority (CMA) guidelines on corporate governance practices by public listed companies in Kenya. The Board is also committed to the consideration and implementation of initiatives to improve corporate governance for the benefit of all shareholders.
BOARD AND COMMITTEESThe Company is led by an effective Board that provides strategic direction and is ultimately responsible for the functioning of the Company and Group. To assist the Board in the performance of its duties, the Board has constituted Committees which operate under written mandates that clearly define their composition, terms of reference, scope of authority, and procedures for reporting to the Board. The membership of the Committees during the year under review was as follows:
Audit & Risk Management Committee - David Hutchison (Chairman), Richard Omwela and Andrew Scott
Nominating & Remuneration Committee - David Hutchison (Chairman), Wahome Muchiri and Bharat Thakrar
Board IT Oversight Committee – David Hutchison and Wahome Muchiri
DIRECTORSThe Directors who held office during the year under review and to the date of this report are listed on page 3 - 4. Out of seven Directors three are independent and non-executive. These are David Hutchison, Richard Omwela and Wahome Muchiri. Bharat Thakrar (CEO) and Manish Shah (Finance Director) hold executive positions while Andrew Scott and Laurence Mellman are appointed by Cavendish Square Holding BV in accordance with the Company’s Articles of Association.
All the directors except the executive directors and the directors appointed by Cavendish Square Holding BV are required to retire at regular intervals and may offer themselves for re-election.
CHAIRMAN AND CHIEF EXECUTIVE OFFICEThe roles of the Chairman and CEO are separate and distinct.
DIRECTORS EMOLUMENTS AND LOANSThe aggregate amounts of emoluments paid to Directors during the year under review have been disclosed on page 38. Executive Director loans is disclosed on page 38. There were no non-executive Directors loans during the year. Directors’ interest in the shareholding of the Company is also given on page 12.
INTERNAL CONTROLSThe Group has defined procedure and financial controls to ensure the reporting of complete and accurate accounting information and has recently upgraded its management accounting system to provide financial and operational performance measurement indicators more timely and accurately. These cover systems for obtaining authority for major transactions and for ensuring compliance with laws and regulations. Procedures are also in place to ensure that assets have proper physical controls and that the organization remains structured to ensure appropriate segregation of duties. In reviewing the effectiveness of the systems of internal control, the Board takes into account the results of all the work carried out by the internal audit function, or any other audit, on the activities of the Group.
DEALING IN COMPANY’S SHARESThe Company complies with CMA’s rules on Insider Trading and has formulated a policy that governs the trading of Company’s shares by Directors and designated staff. Subject to compliance with the CMA rules on Insider Trading, Directors and designated staff are only permitted to deal in the Company’s shares within certain periods between 3 and 30 days after the announcement of half yearly and final results and from 3 days after release of the annual report until 30 days after the Annual General Meeting. In addition to the restrictions, permission of a sub-committee of the Board is required before trading in the Company’s shares.

10
SCANGROUP ANNUAL REPORT 2012
INVESTOR RELATIONSInformation on the Company’s shareholding is provided on page 11 - 12. The Company values its relationship with shareholders and the investment community and ensures regular and reliable communication through publication of its financial performance, publication of the Annual Report, holding of the Annual General Meeting, and other general meetings prescribed by law. Our primary communication channel remains the Nairobi Securities Exchange and media releases consistent with legal and regulatory requirements.
CORPORATE GOVERNANCE (Contd.)

11
SCANGROUP ANNUAL REPORT 2012
SHAREHOLDING BY CATEGORY
Number of Number of % of issued shareholders shares held share capital
Foreign Investors 330 170,729,454 59.95%
East Africa Individuals 25,215 68,903,698 24.19%
East Africa Institutions 1,290 45,155,976 15.86%
Total 26,835 284,789,128 100.00%
SHAREHOLDING RANGE Number of Number of % of issued shareholders shares held share captal
1 -500 19,702 6,995,131 2.46%
501 - 1,000 4,036 2,702,710 0.95%
1,001 - 5,000 2,340 4,625,061 1.62%
5,001 - 10,000 296 1,992,585 0.70%
10,001 - 50,000 292 5,816,659 2.04%
50,001 - 100,000 50 3,476,731 1.22%
100,001 - 500,000 77 16,767,255 5.89%
500,001 - 1,000,000 21 14,044,534 4.93%
Above 1,000,000 21 228,368,462 80.19%
Total 26,835 284,789,128 100.00%
TOP 10 SHARESHOLDERS AS AT 31 DECEMBER 2012 Number of % of issued Rank Name shares held share capital
1 Cavendish Square Holding BV 82,827,586 29.08%
2 Bharat Thakrar 51,811,360 18.19%
3 Standard Chartered Nominees , Non-Resident A/C 9300 37,375,400 13.12%
4 Ogilvy South Africa (Proprietary) Limited 12,907,856 4.53%
5 White, Andrew John Laird 12,206,000 4.29%
6 Standard Chartered Nominees , Non-Resident A/C 9296 4,872,000 1.71%
7 Standard Chartered Nominees , Non-Resident A/C KE11464 4,824,000 1.69%
8 Standard Chartered Nominees A/C 9230 3,419,800 1.20%
9 SCB A/C Pan African Unit Linked FD 2,618,028 0.92%
10 Chase Bank (Kenya) Limited 2,342,686 0.82%
Total 215,204,716 75.57%
SHAREHOLDING

12
SCANGROUP ANNUAL REPORT 2012
SHAREHOLDING (Contd.)
DIRECTORS’ INTEREST IN THE SHAREHOLDING AS AT 31 DECEMBER 2012
Name Number of % of issued shares held share capital
Bharat Thakrar 51,811,360 18.19%
Manish Shah 1,300 0.00%
David Hutchison 1,200 0.00%
Richard Omwela 500 0.00%
Total 51,814,360 18.19%
13
SCANGROUP ANNUAL REPORT 2012
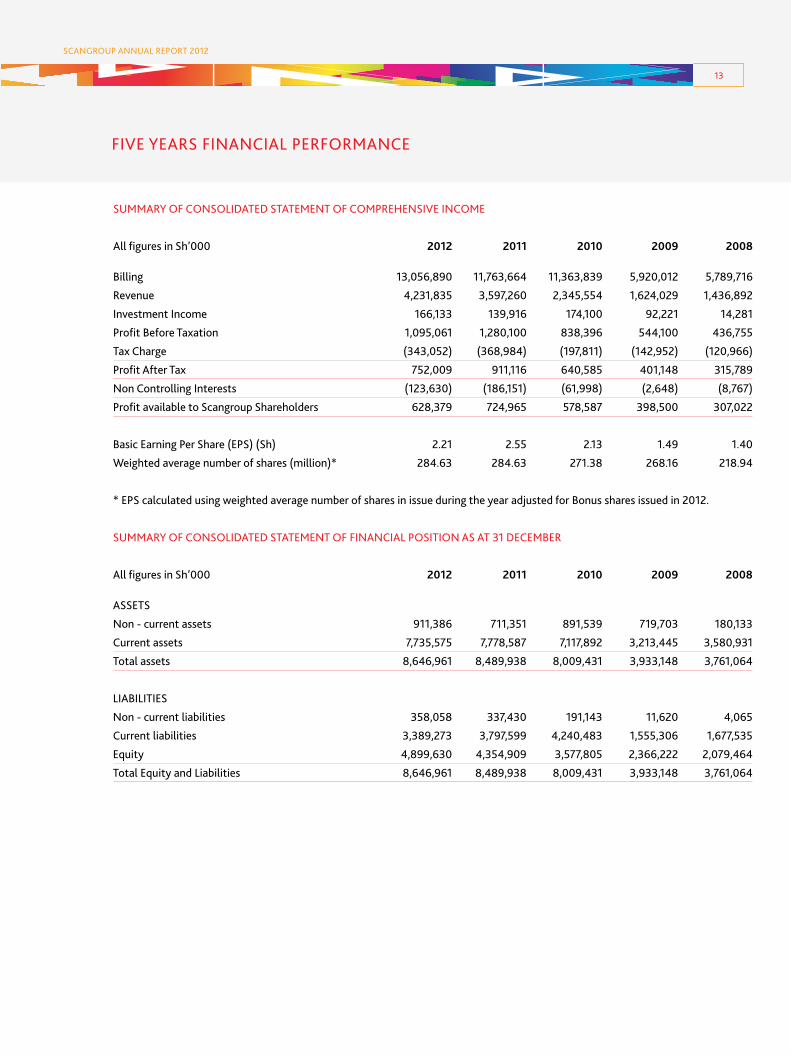
FIVE YEARS FINANCIAL PERFORMANCE
SUMMARY OF CONSOLIDATED STATEMENT OF COMPREHENSIVE INCOME
All figures in Sh’000 2012 2011 2010 2009 2008
Billing 13,056,890 11,763,664 11,363,839 5,920,012 5,789,716
Revenue 4,231,835 3,597,260 2,345,554 1,624,029 1,436,892
Investment Income 166,133 139,916 174,100 92,221 14,281
Profit Before Taxation 1,095,061 1,280,100 838,396 544,100 436,755
Tax Charge (343,052) (368,984) (197,811) (142,952) (120,966)
Profit After Tax 752,009 911,116 640,585 401,148 315,789
Non Controlling Interests (123,630) (186,151) (61,998) (2,648) (8,767)
Profit available to Scangroup Shareholders 628,379 724,965 578,587 398,500 307,022
Basic Earning Per Share (EPS) (Sh) 2.21 2.55 2.13 1.49 1.40
Weighted average number of shares (million)* 284.63 284.63 271.38 268.16 218.94
* EPS calculated using weighted average number of shares in issue during the year adjusted for Bonus shares issued in 2012.
SUMMARY OF CONSOLIDATED STATEMENT OF FINANCIAL POSITION AS AT 31 DECEMBER
All figures in Sh’000 2012 2011 2010 2009 2008
ASSETS
Non - current assets 911,386 711,351 891,539 719,703 180,133
Current assets 7,735,575 7,778,587 7,117,892 3,213,445 3,580,931
Total assets 8,646,961 8,489,938 8,009,431 3,933,148 3,761,064
LIABILITIES
Non - current liabilities 358,058 337,430 191,143 11,620 4,065
Current liabilities 3,389,273 3,797,599 4,240,483 1,555,306 1,677,535
Equity 4,899,630 4,354,909 3,577,805 2,366,222 2,079,464
Total Equity and Liabilities 8,646,961 8,489,938 8,009,431 3,933,148 3,761,064
14
SCANGROUP ANNUAL REPORT 2012
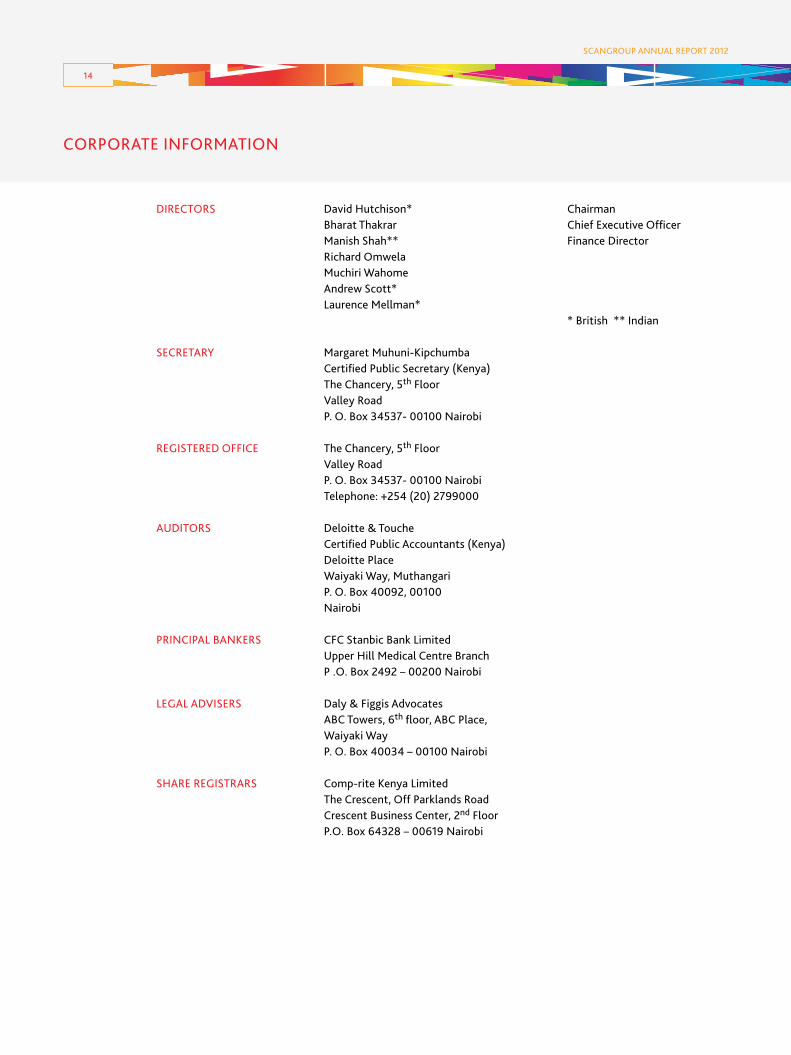
CORPORATE INFORMATION
DIRECTORS David Hutchison* Chairman Bharat Thakrar Chief Executive Officer Manish Shah** Finance Director Richard Omwela Muchiri Wahome Andrew Scott* Laurence Mellman* * British ** Indian
SECRETARY Margaret Muhuni-Kipchumba Certified Public Secretary (Kenya) The Chancery, 5th Floor Valley Road P. O. Box 34537- 00100 Nairobi
REGISTERED OFFICE The Chancery, 5th Floor Valley Road P. O. Box 34537- 00100 Nairobi Telephone: +254 (20) 2799000
AUDITORS Deloitte & Touche Certified Public Accountants (Kenya) Deloitte Place Waiyaki Way, Muthangari P. O. Box 40092, 00100 Nairobi
PRINCIPAL BANKERS CFC Stanbic Bank Limited Upper Hill Medical Centre Branch P .O. Box 2492 – 00200 Nairobi
LEGAL ADVISERS Daly & Figgis Advocates ABC Towers, 6th floor, ABC Place, Waiyaki Way P. O. Box 40034 – 00100 Nairobi
SHARE REGISTRARS Comp-rite Kenya Limited The Crescent, Off Parklands Road Crescent Business Center, 2nd Floor P.O. Box 64328 – 00619 Nairobi
15
SCANGROUP ANNUAL REPORT 2012
CORPORATE INFORMATION (Contd.)
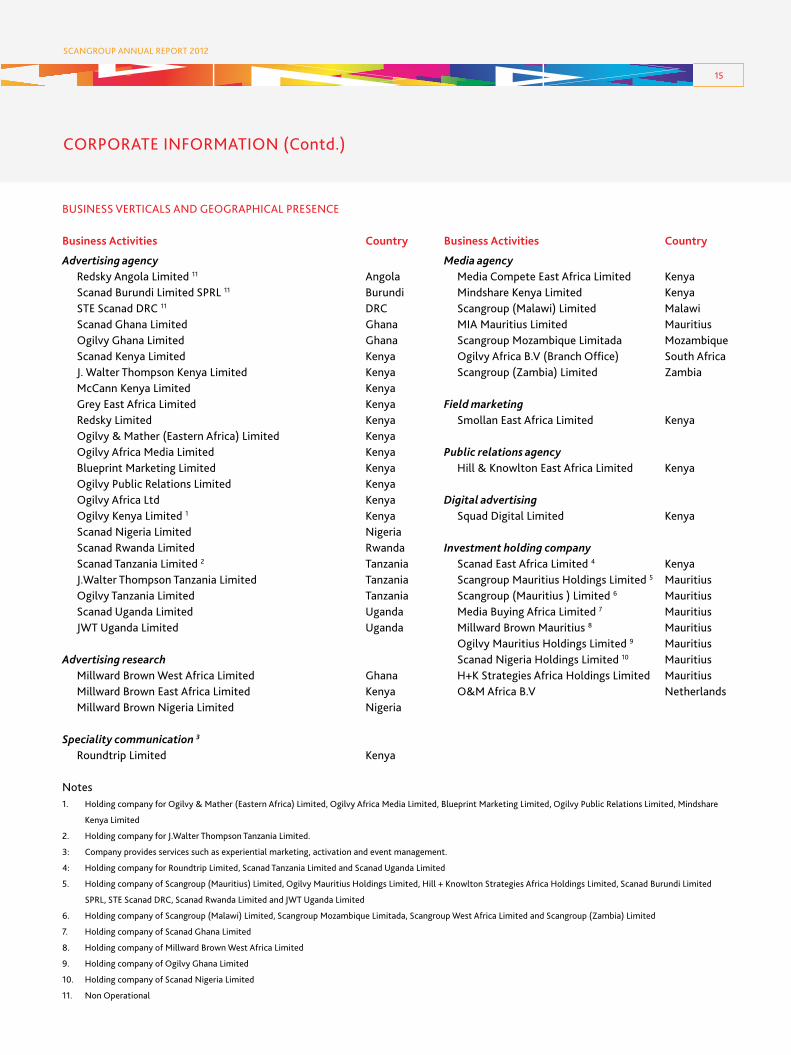
BUSINESS VERTICALS AND GEOGRAPHICAL PRESENCE
Business Activities Country Business Activities Country
Advertising agency Media agency Redsky Angola Limited 11 Angola Media Compete East Africa Limited Kenya Scanad Burundi Limited SPRL 11 Burundi Mindshare Kenya Limited Kenya STE Scanad DRC 11 DRC Scangroup (Malawi) Limited Malawi Scanad Ghana Limited Ghana MIA Mauritius Limited Mauritius Ogilvy Ghana Limited Ghana Scangroup Mozambique Limitada Mozambique Scanad Kenya Limited Kenya Ogilvy Africa B.V (Branch Office) South Africa J. Walter Thompson Kenya Limited Kenya Scangroup (Zambia) Limited Zambia McCann Kenya Limited Kenya Grey East Africa Limited Kenya Field marketing Redsky Limited Kenya Smollan East Africa Limited Kenya Ogilvy & Mather (Eastern Africa) Limited Kenya Ogilvy Africa Media Limited Kenya Public relations agency Blueprint Marketing Limited Kenya Hill & Knowlton East Africa Limited Kenya Ogilvy Public Relations Limited Kenya Ogilvy Africa Ltd Kenya Digital advertising Ogilvy Kenya Limited 1 Kenya Squad Digital Limited Kenya Scanad Nigeria Limited Nigeria Scanad Rwanda Limited Rwanda Investment holding company Scanad Tanzania Limited 2 Tanzania Scanad East Africa Limited 4 Kenya J.Walter Thompson Tanzania Limited Tanzania Scangroup Mauritius Holdings Limited 5 Mauritius Ogilvy Tanzania Limited Tanzania Scangroup (Mauritius ) Limited 6 Mauritius Scanad Uganda Limited Uganda Media Buying Africa Limited 7 Mauritius JWT Uganda Limited Uganda Millward Brown Mauritius 8 Mauritius Ogilvy Mauritius Holdings Limited 9 MauritiusAdvertising research Scanad Nigeria Holdings Limited 10 Mauritius Millward Brown West Africa Limited Ghana H+K Strategies Africa Holdings Limited Mauritius Millward Brown East Africa Limited Kenya O&M Africa B.V Netherlands Millward Brown Nigeria Limited Nigeria
Speciality communication 3
Roundtrip Limited Kenya
Notes1. Holding company for Ogilvy & Mather (Eastern Africa) Limited, Ogilvy Africa Media Limited, Blueprint Marketing Limited, Ogilvy Public Relations Limited, Mindshare
Kenya Limited
2. Holding company for J.Walter Thompson Tanzania Limited.
3: Company provides services such as experiential marketing, activation and event management.
4: Holding company for Roundtrip Limited, Scanad Tanzania Limited and Scanad Uganda Limited
5. Holding company of Scangroup (Mauritius) Limited, Ogilvy Mauritius Holdings Limited, Hill + Knowlton Strategies Africa Holdings Limited, Scanad Burundi Limited
SPRL, STE Scanad DRC, Scanad Rwanda Limited and JWT Uganda Limited
6. Holding company of Scangroup (Malawi) Limited, Scangroup Mozambique Limitada, Scangroup West Africa Limited and Scangroup (Zambia) Limited
7. Holding company of Scanad Ghana Limited
8. Holding company of Millward Brown West Africa Limited
9. Holding company of Ogilvy Ghana Limited
10. Holding company of Scanad Nigeria Limited
11. Non Operational

16
SCANGROUP ANNUAL REPORT 2012
REPORT OF THE DIRECTORS
The Directors present their report together with the Group’s audited financial statements for the year ended 31 December 2012, which discloses the state of affairs of the Company and its subsidiaries.
ACTIVITIESThe principal activities of the Group include developing communication strategies, creating advertisements for products and services, planning and buying media as well as providing marketing consultancy.
DEVELOPMENTS DURING THE YEARDuring the year, the Company extended its footprint in Nigeria by setting up Millward Brown Nigeria Limited in April 2012 and Scanad Nigeria Limited in August 2012.
RESULTS FOR THE YEAR ENDED 2012 Sh’000
Profit before taxation 1,095,061
Tax charge (343,052)
Profit for the year 752,009
Other comprehensive income (7,935)
Total comprehensive income for the year 744,074
DIVIDENDSThe Directors propose a first and final dividend of Sh 0.60 per share totalling Sh 170,873,477 based on 284,789,128 shares in issue (2011: Sh 199,352,390 being Sh 0.70 per share for 284,789,128 shares).
The payment of dividends is subject to approval by shareholders at the Annual General Meeting and has not been included as a liability in the financial statements. The proposed dividend is payable to all shareholders on the Register of Members on 27 June 2013. Dividend payment will be subject to withholding tax, where applicable.
DIRECTORSThe current members of the Board of Directors are as shown on page 3 - 4. Mr Muchiri Wahome retires by rotation under the provisions of Article 93 of the Articles of Association and being eligible, offers himself for re-election.
AUDITORSDeloitte & Touche have expressed their willingness to continue in office in accordance with section 159 (2) of the Companies Act.
By Order of the Board
Margaret Muhuni-KipchumbaSecretary27th February 2013Nairobi

17
SCANGROUP ANNUAL REPORT 2012
STATEMENT OF DIRECTORS’ RESPONSIBILITIES
The Kenyan Companies Act requires the directors to prepare financial statements for each financial year which give a true and fair view of the state of affairs of the company and its subsidiaries as at the end of the financial year and of their operating results for that year. It also requires the directors to ensure that the company and its subsidiaries keep proper accounting records which disclose with reasonable accuracy at any time the financial position of the company and its subsidiaries. They are also responsible for safeguarding the assets of the Group.
The directors are responsible for the preparation of financial statements that give a true and fair view in accordance with International Financial Reporting Standards and the requirements of the Kenyan Companies Act, and for such internal controls as the directors determine are necessary to enable the preparation of financial statements that are free from material misstatement, whether due to fraud or error.
The directors accept responsibility for the annual financial statements, which have been prepared using appropriate accounting policies supported by reasonable and prudent judgments and estimates, in conformity with International Financial Reporting Standards and in the manner required by the Kenyan Companies Act.
The directors are of the opinion that the financial statements give a true and fair view of the state of the financial affairs of the company and its subsidiaries and of their operating results. The directors further accept responsibility for the maintenance of accounting records which may be relied upon in the preparation of financial statements, as well as adequate systems of internal financial control.
Nothing has come to the attention of the directors to indicate that the company and its subsidiaries will not remain going concerns for at least the next twelve months from the date of this statement.
David Hutchison Bharat ThakrarDirector Director
27th February 2013
18
SCANGROUP ANNUAL REPORT 2012
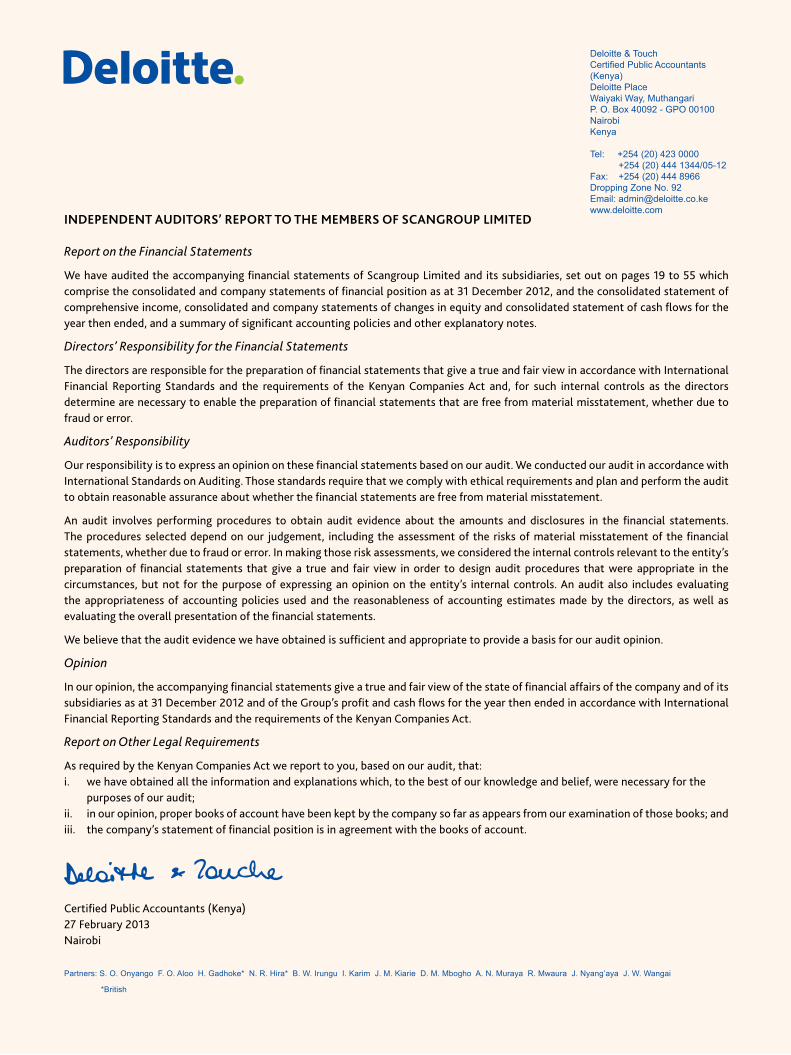
INDEPENDENT AUDITORS’ REPORT TO THE MEMBERS OF SCANGROUP LIMITED
Report on the Financial Statements
We have audited the accompanying financial statements of Scangroup Limited and its subsidiaries, set out on pages 19 to 55 which comprise the consolidated and company statements of financial position as at 31 December 2012, and the consolidated statement of comprehensive income, consolidated and company statements of changes in equity and consolidated statement of cash flows for the year then ended, and a summary of significant accounting policies and other explanatory notes.
Directors’ Responsibility for the Financial Statements
The directors are responsible for the preparation of financial statements that give a true and fair view in accordance with International Financial Reporting Standards and the requirements of the Kenyan Companies Act and, for such internal controls as the directors determine are necessary to enable the preparation of financial statements that are free from material misstatement, whether due to fraud or error.
Auditors’ Responsibility
Our responsibility is to express an opinion on these financial statements based on our audit. We conducted our audit in accordance with International Standards on Auditing. Those standards require that we comply with ethical requirements and plan and perform the audit to obtain reasonable assurance about whether the financial statements are free from material misstatement.
An audit involves performing procedures to obtain audit evidence about the amounts and disclosures in the financial statements. The procedures selected depend on our judgement, including the assessment of the risks of material misstatement of the financial statements, whether due to fraud or error. In making those risk assessments, we considered the internal controls relevant to the entity’s preparation of financial statements that give a true and fair view in order to design audit procedures that were appropriate in the circumstances, but not for the purpose of expressing an opinion on the entity’s internal controls. An audit also includes evaluating the appropriateness of accounting policies used and the reasonableness of accounting estimates made by the directors, as well as evaluating the overall presentation of the financial statements.
We believe that the audit evidence we have obtained is sufficient and appropriate to provide a basis for our audit opinion.
Opinion
In our opinion, the accompanying financial statements give a true and fair view of the state of financial affairs of the company and of its subsidiaries as at 31 December 2012 and of the Group’s profit and cash flows for the year then ended in accordance with International Financial Reporting Standards and the requirements of the Kenyan Companies Act.
Report on Other Legal Requirements
As required by the Kenyan Companies Act we report to you, based on our audit, that:i. we have obtained all the information and explanations which, to the best of our knowledge and belief, were necessary for the purposes of our audit;ii. in our opinion, proper books of account have been kept by the company so far as appears from our examination of those books; andiii. the company’s statement of financial position is in agreement with the books of account.
Certified Public Accountants (Kenya)27 February 2013Nairobi
Partners: S. O. Onyango F. O. Aloo H. Gadhoke* N. R. Hira* B. W. Irungu I. Karim J. M. Kiarie D. M. Mbogho A. N. Muraya R. Mwaura J. Nyang’aya J. W. Wangai
*British
Deloitte & TouchCertified Public Accountants (Kenya)Deloitte PlaceWaiyaki Way, MuthangariP. O. Box 40092 - GPO 00100NairobiKenya
Tel: +254 (20) 423 0000 +254 (20) 444 1344/05-12Fax: +254 (20) 444 8966Dropping Zone No. 92Email: [email protected]
19
SCANGROUP ANNUAL REPORT 2012
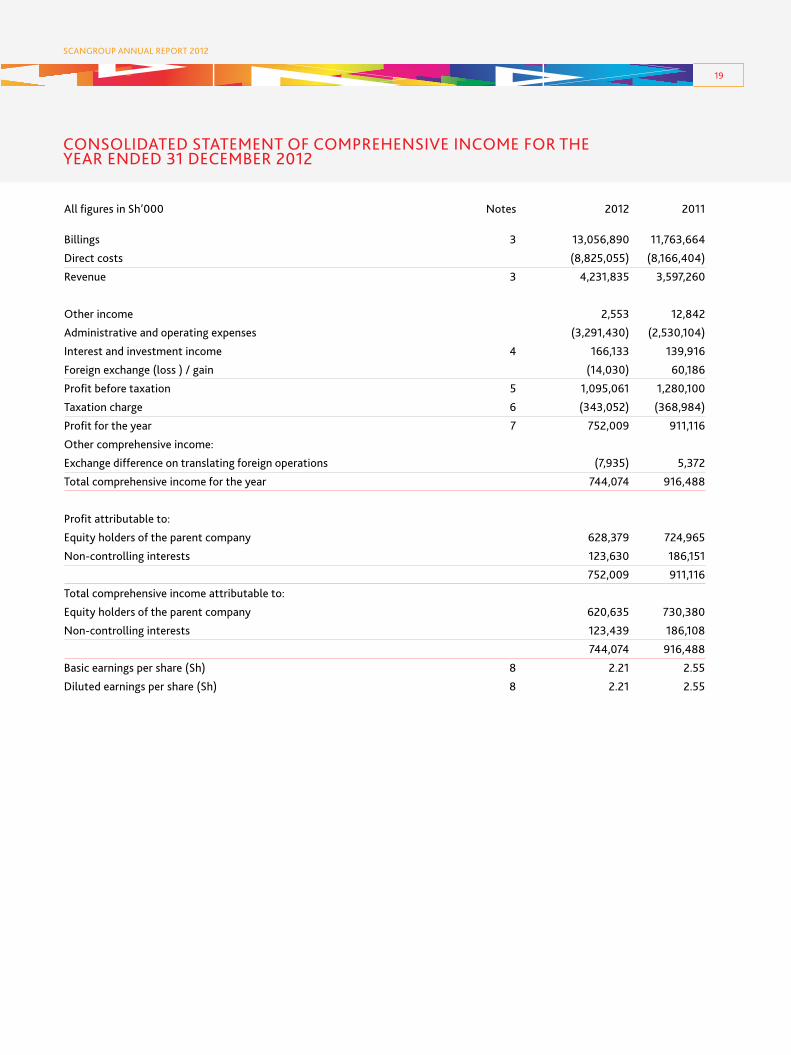
CONSOLIDATED STATEMENT OF COMPREHENSIVE INCOME FOR THE YEAR ENDED 31 DECEMBER 2012
All figures in Sh’000 Notes 2012 2011
Billings 3 13,056,890 11,763,664
Direct costs (8,825,055) (8,166,404)
Revenue 3 4,231,835 3,597,260
Other income 2,553 12,842
Administrative and operating expenses (3,291,430) (2,530,104)
Interest and investment income 4 166,133 139,916
Foreign exchange (loss ) / gain (14,030) 60,186
Profit before taxation 5 1,095,061 1,280,100
Taxation charge 6 (343,052) (368,984)
Profit for the year 7 752,009 911,116
Other comprehensive income:
Exchange difference on translating foreign operations (7,935) 5,372
Total comprehensive income for the year 744,074 916,488
Profit attributable to:
Equity holders of the parent company 628,379 724,965
Non-controlling interests 123,630 186,151
752,009 911,116
Total comprehensive income attributable to:
Equity holders of the parent company 620,635 730,380
Non-controlling interests 123,439 186,108
744,074 916,488
Basic earnings per share (Sh) 8 2.21 2.55
Diluted earnings per share (Sh) 8 2.21 2.55

20
SCANGROUP ANNUAL REPORT 2012
CONSOLIDATED STATEMENT OF FINANCIAL POSITIONAS AT 31 DECEMBER 2012
All figures in Sh’000 Notes 2012 2011
ASSETSNon-current assetsEquipment 9.1 452,783 294,593Intangible assets 10 14,228 25,060Other equity investments 11 5,528 5,664Deferred tax asset 12 120,138 76,027Receivable from related parties 13 3,038 -Goodwill 14 315,671 315,671 911,386 717,015
Current assets Trade and other receivables 15 5,663,316 4,951,237Loan recoverable from related parties 13 - 6,687Work-in-progress 16 8,276 32,072Tax recoverable 6.3 109,105 134,187Short-term bank deposits 17 970,903 1,971,143Cash and bank balances 983,975 677,597 7,735,575 7,772,923Total assets 8,646,961 8,489,938
EQUITY AND LIABILITIESCapital and reserves Share capital 18 284,789 284,789Share premium account 1,754,388 1,754,388Revenue reserve 2,236,625 1,807,599Translation reserve (6,551) 1,193Equity attributable to share holders of the holding company 4,269,251 3,847,969Non-controlling interests 630,379 506,940Total equity 4,899,630 4,354,909
Non-current liabilities Deferred tax liability 12 4,789 -Loan payable to related parties 13 353,269 337,430 358,058 337,430
Current liabilities Taxation payable 6.3 62,113 164,497Trade and other payables 19 3,313,136 3,623,330Dividends payable 20 14,024 9,772 3,389,273 3,797,599Total equity and liabilities 8,646,961 8,489,938
The financial statements on pages 19 to 55 were approved and authorised for issue by the Board of Directors on 27th February 2013 and were signed on its behalf by:
David Hutchison Bharat ThakrarDirector Director

21
SCANGROUP ANNUAL REPORT 2012
COMPANY STATEMENT OF FINANCIAL POSITION AS AT 31 DECEMBER 2012
All figures in Sh’000 Notes 2012 2011
ASSETS Non-current assets Equipment 9.2 108,392 95,555Investment in subsidiaries 21.1 1,147,995 817,212Investment in joint venture 21.2 6,129 6,129Long term loan to subsidiaries and joint ventures 13 50,020 120,589Deferred tax asset 12 24,114 22,140 1,336,650 1,061,625
Current assets Trade and other receivables 15 1,308,018 728,722Due from related parties 13 594,234 650,108Taxation recoverable 6.3 3,600 22,229Short-term deposits 17 554,487 983,726 2,460,339 2,384,785Total assets 3,796,989 3,446,410
EQUITY AND LIABILITIES Capital and reserves Share capital 18 284,789 284,789Share premium account 1,754,388 1,754,388Revenue reserve 475,624 469,972Total equity 2,514,801 2,509,149
Current liabilities Bank overdraft 22 312,736 -Trade and other payables 19 955,428 927,489Dividends payable 20 14,024 9,772 1,282,188 937,261Total equity and liabilities 3,796,989 3,446,410
The financial statements on pages 19 to 55 were approved and authorised for issue by the Board of Directors on 27th February 2013 and were signed on its behalf by:
David Hutchison Bharat ThakrarDirector Director

22
SCANGROUP ANNUAL REPORT 2012
CO
NSO
LID
ATED
STA
TEM
ENT
OF
CH
AN
GES
IN E
QU
ITY
FOR
THE
YEA
R EN
DED
31
DEC
EMBE
R 20
12
Equi
ty
Attr
ibut
able
sett
le
to s
hare
Shar
e
Inve
s tm
ents
Empl
oyee
ho
lder
s of
Non
-
pr
emiu
m
Reve
nue
reva
luat
ion
Tran
slat
ion
bene
fits
the
hold
ing
cont
rolli
ngA
ll am
ount
s in
Sh’
000
Shar
e ca
pita
l ac
coun
t re
serv
e re
serv
e re
serv
e*
rese
rve
com
pany
in
tere
sts
Tota
l
At 1
Janu
ary
2011
23
4,57
0 1,
680,
666
1,24
8,76
1 56
,573
(4
,222
) 40
,625
3,
256,
973
320,
832
3,57
7,805
Profi
t for
the
year
-
- 72
4,96
5 -
- -
724,
965
186,
151
911,1
16
Oth
er c
ompr
ehen
sive
inco
me
- -
- -
5,41
5 -
5,41
5 (4
3)
5,37
2
Div
iden
d de
clar
ed -
2010
-
- (1
66,12
7)
- -
- (1
66,12
7)
- (1
66,12
7)
Shar
es is
sued
**
2,75
4 12
1,187
-
- -
(40,
625)
83
,316
-
83,3
16
Issu
e of
bon
us s
hare
s 47
,465
(4
7,465
) -
- -
- -
- -
Disp
osal
of A
vaila
ble
for s
ale
inve
stm
ents
-
- -
(56,
573)
-
- (5
6,57
3)
- (5
6,57
3)
At 3
1 D
ecem
ber 2
011
284,
789
1,75
4,38
8 1,
807,5
99
- 1,1
93
- 3,
847,9
69
506,
940
4,35
4,90
9
At 1
Janu
ary
2012
28
4,78
9 1,
754,
388
1,80
7,599
-
1,193
-
3,84
7,969
50
6,94
0 4,
354,
909
Profi
t for
the
year
-
- 62
8,37
8 -
- -
628,
378
123,
630
752,
008
Oth
er c
ompr
ehen
sive
inco
me
- -
- -
(7,7
44)
- (7
,744
) (1
91)
(7,9
35)
Div
iden
d de
clar
ed -
2011
-
- (1
99,3
52)
- -
- (1
99,3
52)
- (1
99,3
52)
At 3
1 D
ecem
ber 2
012
284,
789
1,75
4,38
8 2,
236,
625
- (6
,551
) -
4,26
9,25
1 63
0,37
9 4,
899,
630
* Tr
ansl
atio
n re
serv
e re
late
s to
exch
ange
diff
eren
ces
aris
ing
on tr
ansl
atio
n of
Res
ults
and
Net
ass
ets o
f for
eign
ope
ratio
ns o
n co
nsol
idat
ion.
**Th
e co
mpa
ny is
sued
2,7
54,2
49 n
ew s
hare
s un
der t
he E
mpl
oyee
Sha
re O
wne
rshi
p pl
an a
t Sh
30.2
5 pe
r eac
h or
dina
ry s
hare
hav
ing
par v
alue
of S
h 1.
00 e
ach.

23
SCANGROUP ANNUAL REPORT 2012
CO
MPA
NY
STAT
EMEN
T O
F C
HA
NG
ES IN
EQ
UIT
YFO
R TH
E YE
AR
END
ED 3
1 D
ECEM
BER
2012
Equi
ty s
ettl
ed
Sh
are
In
vest
men
ts
Empl
oyee
pr
emiu
m
Reve
nue
reva
luat
ion
bene
fits
All
amou
nts
in S
h’00
0 Sh
are
capi
tal
acco
unt
rese
rve
rese
rve
rese
rve
Tota
l
At 1
Janu
ary
2011
23
4,57
0 1,
680,
666
476,
145
56,5
73
40,6
25
2,48
8,57
9
Profi
t for
the
year
-
- 15
9,95
4 -
- 15
9,95
4
Dis
posa
l of A
vaila
ble
for S
ale
inve
stm
ents
-
- -
(56,
573)
-
(56,
573)
Div
iden
d de
clar
ed
- -
(166
,127)
-
- (1
66,12
7)
Shar
es is
sued
1 2,
754
121,1
87
- -
(40,
625)
83
,316
Issu
e of
bon
us s
hare
s 47
,465
(4
7,465
) -
- -
-
At 3
1 D
ecem
ber 2
011
28
4,78
9 1,
754,
388
469,
972
- -
2,50
9,14
9
At 1
Janu
ary
2012
28
4,78
9
1,75
4,38
8 46
9,97
2 -
- 2,
509,
149
Profi
t for
the
year
-
-
205,
004
- -
20
5,00
4
Div
iden
d de
clar
ed
- -
(199
,352
) -
-
(199
,352
)
At 3
1 D
ecem
ber 2
012
284,
789
1,
754,
388
475,
624
-
- 2
,514
,801
Not
e:
1. T
he c
ompa
ny is
sued
2,7
54,2
49 n
ew s
hare
s un
der t
he E
mpl
oyee
Sha
re O
wne
rshi
p Pl
an a
t Sh
30.2
5 pe
r eac
h or
dina
ry s
hare
hav
ing
par v
alue
of S
h 1.
00 e
ach.

24
SCANGROUP ANNUAL REPORT 2012
CONSOLIDATED STATEMENT OF CASH FLOWS FOR THE YEAR ENDED 31 DECEMBER 2012
All figures in Sh’000 Note 2012 2011
CASH FLOWS FROM OPERATING ACTIVITIES
Cash generated from operations 24.1 55,783 588,598
Taxation paid 6.3 (461,141) (369,375)
Net cash (used in) / generated from operating activities (405,358) 219,223
CASH FLOWS FROM INVESTING ACTIVITIES
Purchase of equipment 9.1 (257,945) (145,473)
Purchase of intangible asset 10 - (27,338)
Proceeds on sale of equipment 8,840 250
Proceeds from sale of infrastructure bonds - 255,386
Investment income received 151,839 104,181
Net cash (used in) / generated from investing activities (97,266) 187,006
CASH FLOWS FROM FINANCING ACTIVITIES
Issue of new Shares (ESOP) - 83,316
Finance leases repaid - (2,906)
Dividends paid 20 (195,100) (162,351)
Loan and capital received from other shareholders 15,839 150,493
Net cash (used in) / generated from financing activities (179,261) 68,552
Net (decrease) / increase in cash and cash equivalents (681,885) 474,781
Movement in cash and cash equivalents
At the beginning of the year 2,648,740 2,178,652
(Decrease) / increase during the year (681,885) 474,781
Effect of fluctuations in exchange rates (11,977) (4,693)
Cash and cash equivalents at end of the year 24.2 1,954,878 2,648,740

25
SCANGROUP ANNUAL REPORT 2012
1. ACCOUNTING POLICIES
1.1 Statement of compliance The consolidated financial statements of Scangroup Limited and its Subsidiaries (the Group) for the year ended 31 December
2012 have been prepared in accordance with International Financial Reporting Standards (IFRS) as issued by the International Accounting Standards Board. For purposes of the Kenyan Companies Act, the Balance Sheet is represented by the statement of financial position and the profit and loss account is presented in the statement of comprehensive income.
1.2 Basis of preparation The financial statements have been prepared under the historical cost basis of accounting. The principal accounting policies adopted remain unchanged from the previous year and are set out below.
1.3 Basis of consolidation
1.3.1 Subsidiaries Subsidiary undertakings, being those companies in which the Group either directly or indirectly has an interest of more than
50% of the voting rights or otherwise has power to exercise control over the operations, have been consolidated. Subsidiaries are consolidated from the date on which effective control is transferred to the Group and are no longer consolidated as from the date of disposal.
All intra-group transactions, balances and unrealised surpluses and deficits on transactions with the subsidiary companies have been eliminated.
The results of subsidiaries acquired or disposed of during the year are included in the consolidated statement of comprehensive income from effective date of acquisition and up to the effective date of disposal.
Where necessary, adjustments are made to the financial statements of subsidiaries to bring their accounting policies in line with those used by other members of the Group.
Non-controlling interests in subsidiaries are identified separately from the Group’s equity therein. The interest of non-controlling shareholders may be initially measured at either fair value or at the non-controlling interests’ proportionate share of fair value of the acquiree’s identifiable net assets. The choice of measurement basis is made on acquisition-by-acquisition basis. Subsequent to acquisition, the carrying amount of non-controlling interest is the amount of those interests at initial recognition plus non-controlling interests’ share of subsequent changes in equity. Total comprehensive income is attributed to non-controlling interest even if this results in the non-controlling interest having a deficit balance. For the acquisitions occurring in the current period, the interest of non-controlling interest is the proportion of net assets of the companies acquired equal to the percentage ownership of the non-controlling interests.
Changes in the Group’s interests in subsidiaries that do not result in a loss of control are accounted for as equity transactions. The carrying amounts of the Group’s interests and the non-controlling interests are adjusted to reflect the changes in their relative interests in the subsidiaries. Any difference between the amount by which the non-controlling interests are adjusted and the fair value of the consideration paid or received is recognised directly in equity and attributed to owners of the Group.
Subsidiaries are carried on the company’s separate statement of financial position at cost less impairment losses. When the Group loses control of a subsidiary, the profit or loss on disposal is calculated as the difference between (i) the
aggregate of the fair value of the consideration received and the fair value of any retained interest and (ii) the previous carrying amount of the assets (including goodwill), and liabilities of the subsidiary and any non-controlling interests. Amounts previously recognised in other comprehensive income in relation to the subsidiary are accounted for (i.e. reclassified to profit or loss or transferred directly to revenue reserve) in the same manner as would be required if the relevant assets or liabilities were disposed
NOTES TO THE FINANCIAL STATEMENTS

26
SCANGROUP ANNUAL REPORT 2012
1. ACCOUNTING POLICIES (Contd.)
1.3 Basis of consolidation (Contd.)
1.3.1 Subsidiaries (Contd.) of. The fair value of any investment retained in the former subsidiary at the date when control is lost is regarded as the fair value on initial recognition for subsequent accounting under IAS 39 Financial Instruments: Recognition and Measurement or, when
applicable, the cost on initial recognition of an investment in an associate or jointly controlled entity.
1.3.2 Investments in Associates An associate is an entity over which the Group has significant influence and that is neither a subsidiary nor an interest in a joint
venture. Significant influence is the power to participate in the financial and operating policy decisions of the investee but is not control or joint control over those policies.
The results and assets and liabilities of associates are incorporated in the consolidated financial statements using the equity meth-od of accounting, except when the investment is classified as held for sale, in which case it is accounted for in accordance with IFRS 5. Under the equity method, an investment in an associate is initially recognised in the consolidated statement of financial position at cost and adjusted thereafter to recognise the Group’s share of the profit or loss and other comprehensive income of the associ-ate. When the Group’s share of losses of an associate exceeds the Group’s interest in that associate (which includes any long-term interests that, in substance, form part of the Group’s net investment in the associate), the Group discontinues recognising its share of further losses. Additional losses are recognised only to the extent that the Group has incurred legal or constructive obligations or made payments on behalf of the associate.
Any excess of the cost of acquisition over the Group’s share of the net fair value of the identifiable assets, liabilities and contin-gent liabilities of an associate recognised at the date of acquisition is recognised as goodwill, which is included within the carrying amount of the investment. Any excess of the Group’s share of the net fair value of the identifiable assets, liabilities and contingent liabilities over the cost of acquisition, after reassessment, is recognised immediately in profit or loss.
The requirements of IAS 39 are applied to determine whether it is necessary to recognise any impairment loss with respect to the Group’s investment in an associate. When necessary, the entire carrying amount of the investment (including goodwill) is tested for impairment in accordance with IAS 36 Impairment of Assets as a single asset by comparing its recoverable amount (higher of value in use and fair value less costs to sell) with its carrying amount. Any impairment loss recognised forms part of the carrying amount of the investment. Any reversal of that impairment loss is recognised in accordance with IAS 36 to the extent that the recoverable amount of the investment subsequently increases.
Upon disposal of an associate that results in the Group losing significant influence over that associate, any retained investment is measured at fair value at that date and the fair value is regarded as its fair value on initial recognition as a financial asset in accord-ance with IAS 39. The difference between the previous carrying amount of the associate attributable to the retained interest and its fair value is included in the determination of the gain or loss on disposal of the associate. In addition, the Group accounts for all amounts previously recognised in other comprehensive income in relation to that associate on the same basis as would be required if that associate had directly disposed of the related assets or liabilities. Therefore, if a gain or loss previously recognised in other comprehensive income by that associate would be reclassified to profit or loss on the disposal of the related assets or liabilities, the Group reclassifies the gain or loss from equity to profit or loss (as a reclassification adjustment) when it loses significant influence over that associate.
When a group entity transacts with its associate, profits and losses resulting from the transactions with the associate are recognised in the Group’ consolidated financial statements only to the extent of interests in the associate that are not related to the Group.
NOTES TO THE FINANCIAL STATEMENTS (Contd.)

27
SCANGROUP ANNUAL REPORT 2012
1. ACCOUNTING POLICIES (Contd.)
1.3 Basis of consolidation (Contd.)
1.3.3 Interests in Joint Ventures and Jointly Controlled Entities A joint venture is a contractual arrangement whereby the Group and other parties undertake an economic activity that is subject
to joint control (i.e. when the strategic financial and operating policy decisions relating to the activities of the joint venture require the unanimous consent of the parties sharing control).
When a Group entity undertakes its activities under joint venture arrangements directly, the Group’s share of jointly controlled assets and any liabilities incurred jointly with other venturers are recognised in the financial statements of the relevant entity and classified according to their nature. Liabilities and expenses incurred directly in respect of interests in jointly controlled assets are accounted for on an accrual basis. Income from the sale or use of the Group’s share of the output of jointly controlled assets, and its share of joint venture expenses, are recognised when it is probable that the economic benefits associated with the transactions will flow to/from the Group and their amount can be measured reliably.
Joint venture arrangements that involve the establishment of a separate entity in which each venturer has an interest are referred to as jointly controlled entities.
The Group reports its interests in jointly controlled entities using proportionate consolidation, except when the investment is classified as held for sale, in which case it is accounted for in accordance with IFRS 5. The Group’s share of the assets, liabilities, income and expenses of jointly controlled entities is combined with the equivalent items in the consolidated financial statements on a line-by-line basis.
Any goodwill arising on the acquisition of the Group’s interest in a jointly controlled entity is accounted for in accordance with the Group’s accounting policy for goodwill arising in a business combination.
When a Group entity transacts with its jointly controlled entity, profits and losses resulting from the transactions with the jointly controlled entity are recognised in the Group’ consolidated financial statements only to the extent of interests in the jointly controlled entity that are not related to the Group.
1.4 Business combinations Acquisitions of subsidiaries and businesses are accounted for using the acquisition method. The consideration for each acquisition
is measured at the aggregate of the fair values (at the date of exchange) of assets given, liabilities incurred or assumed, and equity instruments issued by the Group in exchange for control of the acquiree. Acquisition-related costs are recognised in profit or loss as incurred.
Where applicable, the consideration for the acquisition includes any asset or liability resulting from a contingent consideration arrangement, measured at its acquisition-date fair value. Subsequent changes in such fair values are adjusted against the cost of acquisition where they qualify as measurement period adjustments. All other subsequent changes in the fair value of contingent consideration classified as an asset or liability are accounted for in accordance with relevant IFRSs. Changes in the fair value of contingent consideration classified as equity are not recognised.
Where a business combination is achieved in stages, the Group’s previously held interests in the acquired entity are re-measured to fair value at the acquisition date (i.e. the date the Group attains control) and the resulting gain or loss, if any, is recognised in profit or loss. Amounts arising from interests in the acquiree prior to the acquisition date that have previously been recognised in other comprehensive income are reclassified to profit or loss, where such treatment would be appropriate if that interest were disposed of.
NOTES TO THE FINANCIAL STATEMENTS (Contd.)

28
SCANGROUP ANNUAL REPORT 2012
NOTES TO THE FINANCIAL STATEMENTS (Contd.)
1. ACCOUNTING POLICIES (Contd.)
1.4 Business combinations (Contd.)
The acquiree’s identifiable assets, liabilities and contingent liabilities that meet the conditions for recognition under IFRS 3(2010) are recognised at their fair value at the acquisition date, except that:
• deferredtaxassetsorliabilitiesandliabilitiesorassetsrelatedtoemployeebenefitarrangementsarerecognisedandmeasuredin accordance with IAS 12 Income Taxes and IAS 19 Employee Benefits respectively;
• liabilitiesorequityinstrumentsrelatedtothereplacementbytheGroupofanacquiree’sshare-basedpaymentawardsare
measured in accordance with IFRS 2 Share-based Payment; and
• assets(ordisposalgroups)thatareclassifiedasheldforsaleinaccordancewithIFRS5Non-currentAssetsHeldforSaleandDiscontinued Operations are measured in accordance with that Standard.
If the initial accounting for a business combination is incomplete by the end of the reporting period in which the combination occurs, the Group reports provisional amounts for the items for which the accounting is incomplete. Those provisional amounts are adjusted during the measurement period (see below), or additional assets or liabilities are recognised, to reflect new information obtained about facts and circumstances that existed as of the acquisition date that, if known, would have affected the amounts recognised as of that date.
The measurement period is the period from the date of acquisition to the date the Group obtains complete information about facts and circumstances that existed as of the acquisition date and is subject to a maximum of one year.
1.5 Revenue recognition Revenue comprises commission, fees and rebates earned in respect of media placements and advertising services, measured at
the fair value of the consideration received or receivable. Revenue is reduced for estimated customer returns, rebates and other similar allowances. Revenue is stated exclusive of VAT, sales taxes.
1.5.1 Rendering of services Revenue from a contract to provide services is recognised by reference to the stage of completion of the service. The stage of
completion of the service is determined as follows:
• retainerfeesarerecognisedbyreferencetothestageofcompletionofthecontractperiod,determinedastheproportionof the total contract time that has elapsed at the end of the reporting period;
• serviceincomeisrecognisedintheperiodinwhichtheservicesarerenderedbyreferencetocompletionofthespecific transaction assessed on the basis of the actual service provided as a proportion of the total services to be provided.
1.5.2 Dividend and interest income Dividend income from investments is recognised when the Group’s right to receive payment as a shareholder has been established
(provided that it is probable that the economic benefits will flow to the Company and the amount of income can be measured reliably).
Interest income is accrued on a time basis, by reference to the principal outstanding and at the effective interest rate applicable.
1.6 Work-in-progress Work in progress is stated at the lower of cost or net realisable value and represents direct recoverable cost chargeable to
specific clients. Attributable profits are only recognised once a job is complete and billed out to client.

29
SCANGROUP ANNUAL REPORT 2012
1. ACCOUNTING POLICIES (Contd.)
1.7 Equipment Equipment are carried at cost less accumulated depreciation and any accumulated impairment losses. The Group assesses
the carrying value of its equipment to determine if any impairment has occurred. Where this indicates that an asset may be impaired, the Group applies the requirements of IAS 36 Impairment of Assets in assessing the carrying amount of the asset. This process includes comparing its recoverable amount with its carrying value. Depreciation is provided at rates calculated to write off the cost less estimated residual value of each asset on a reducing balance basis over its estimated useful life, as follows:
Computers and accessories 30% Motor vehicles 25% Furniture, fittings and equipment 12.5%
1.8 Intangible Asset Intangible asset represents customer contracts acquired. These are carried at cost less accumulated amortisation and any
accumulated impairment losses. Intangible assets are amortised over the life of the contracts.
1.9 Taxation The amount of tax payable is based on taxable profit for the year. Taxable profit differs from net profit as reported in the
consolidated income statement because it excludes items of income or expense that are taxable or deductible in other years and it further excludes items that are never taxable or deductible. The Group’s liability for current tax is calculated using tax rates that have been enacted or substantively enacted at the year end.
Deferred tax is the tax expected to be payable or recoverable on differences between the carrying amounts of assets and liabilities in the financial statements and the corresponding tax bases used in the computation of taxable profit, and is accounted for using the liability method. Deferred tax liabilities are recognised for all taxable temporary differences unless specifically exempted by IAS 12 on Income Taxes. Deferred tax assets are recognised to the extent that it is probable that taxable profits will be available against which deductible temporary differences can be utilised.
The carrying amount of deferred tax assets is reviewed at each year end and reduced to the extent that it is no longer probable that sufficient taxable profits will be available to allow all or part of the asset to be recovered.
Deferred tax liabilities are recognised for taxable temporary differences arising on investments in subsidiaries and associates, and interests in joint ventures, except where the Group is able to control the reversal of the temporary difference and it is probable that the temporary difference will not reverse in the foreseeable future.
Deferred tax assets and liabilities are offset when there is a legally enforceable right to set off current tax assets against current tax liabilities and when they relate to income taxes levied by the same taxation authority and the Group intends to settle its current tax assets and liabilities on a net basis.
Deferred tax is calculated at the tax rates that are expected to apply in the period when the liability is settled or the asset is realised based on enacted or substantively enacted legislation. Deferred tax is charged or credited in the consolidated income statement, except when it relates to items charged or credited directly to equity, in which case the deferred tax is also dealt with in equity.
NOTES TO THE FINANCIAL STATEMENTS (Contd.)

30
SCANGROUP ANNUAL REPORT 2012
1. ACCOUNTING POLICIES (Contd.)
1.10 Leases The Group’s leases are classified as finance leases whenever the terms of the lease substantially transfer all risks and rewards of
ownership to the lessee. All other leases are classified as operating leases.
Assets held under finance leases are recognised as assets of the Group at the inception of the lease at the lower of their fair value and the present value of the minimum lease payments. Depreciation on leased assets is charged to the consolidated income statement on the same basis as owned assets. Leasing payments are treated as consisting of capital and interest elements and the interest is charged to the consolidated income statement as it is incurred.
Operating lease rentals are charged to the consolidated income statement on a straight-line basis over the lease term. Any premium or discount on the acquisition of a lease is spread over the life of the lease on a straight-line basis.
1.11 Foreign currencies Assets and liabilities at the reporting date which are expressed in foreign currencies are translated at the rates of exchange ruling
at year end. Transactions during the year which are denominated in foreign currency are translated at the rates of exchange ruling at the transaction dates. Gains and losses on exchange are dealt with in the profit or loss in the year in which they arise.
For the purpose of presenting consolidated financial statements, assets and liabilities of the Group’s foreign operations are expressed in Kenya Shillings using exchange rates prevailing at the end of the reporting period. Income and expense items are translated at the average exchange rates for the period, unless exchange rates fluctuated significantly during that period, in which case the exchange rates at the dates of the transactions are used. Exchange differences arising, if any, are recognised in other comprehensive income and accumulated in equity (attributed to non-controlling interests as appropriate) under the currency translation reserve.
1.12 Financial instruments Financial assets and liabilities are recognised in the Group’s statement of financial position when the Group has become a party
to the contractual provisions of the instrument.
1.12.1 Trade receivables Trade receivables are carried at anticipated realisable value. An estimate is made for doubtful receivables based on the review
of all outstanding amounts at the year end. Bad debts are written off when all reasonable steps to recover them have failed. Objective evidence of impairment for a portfolio of receivables could include the Group’s past experience of collecting payments, an increase in number of delayed payments in the portfolio, past average credit period as well as observable changes in national or economic conditions that correlate with default on receivables.
1.12.2 Cash and cash equivalents Cash and cash equivalents include cash in hand, fixed deposits and deposits held at call with banks which are highly liquid
investments with original maturities of three months or less. Cash and cash equivalents are measured at realisable value.
1.13 Goodwill Goodwill arising on an acquisition of a business is carried at cost as established at the date of acquisition of the business less
accumulated impairment losses, if any.
For the purposes of impairment testing, goodwill is allocated to each of the Group’s cash-generating units (or groups of cash-generating units) that is expected to benefit from the synergies of the combination.
A cash-generating unit to which goodwill has been allocated is tested for impairment annually, or more frequently when there is indication that the unit may be impaired. If the recoverable amount of the cash generating unit is less than its carrying
NOTES TO THE FINANCIAL STATEMENTS (Contd.)

31
SCANGROUP ANNUAL REPORT 2012
1. ACCOUNTING POLICIES (Contd.)
1.13 Goodwill (Contd.) amount, the impairment loss is allocated first to reduce the carrying amount of any goodwill allocated to the unit and then to the other assets of the unit pro rata based on the carrying amount of each asset in the unit. Any impairment loss for
goodwill is recognised directly in profit or loss. An impairment loss recognised for goodwill is not reversed in subsequent periods.
On disposal of the relevant cash-generating unit, the attributable amount of goodwill is included in the determination of the profit or loss on disposal.
1.14 Impairment At each year end, the Group reviews the carrying amounts of its financial assets, tangible and intangible assets to determine
whether there is any indication that those assets have suffered an impairment loss. If any such indication exists, the recoverable amounts of the asset are estimated and an impairment loss is recognised in the profit or loss whenever the carrying amount of the asset exceeds its recoverable amount.
1.15 Retirement benefits The Group has a defined contribution scheme in Kenya for its eligible employees. The assets of the scheme are held in a separate
trustee administered fund. The scheme is funded by contributions from both the employee and the company.
The Group also contributes to the statutory defined contribution pension schemes, the National Social Security Fund, in the three East African countries namely Kenya, Tanzania and Uganda. In Nigeria, Ghana and Rwanda the Group contributes to regional pension funds administered by equivalent government regulatory bodies. Employer’s contribution is determined by local statutes.
The Group’s obligations to retirement benefit schemes are recognised in the profit or loss as they fall due.
1.16 Share-based payment arrangements Equity-settled share-based payments to employees are measured at the fair value of the equity instruments at the grant date.
The fair value determined at the grant date of the equity-settled share-based payments is expensed on a straight- line basis over the vesting period, based on the Group’s estimate of equity instruments that will eventually vest, with a corresponding increase in equity. At the end of each reporting period, the Group revises its estimate of the number of equity instruments expected to vest. The impact of the revision of the original estimates, if any, is recognised in profit or loss such that the cumulative expense reflects the revised estimate, with a corresponding adjustment to the equity-settled employee benefits reserve.
1.17 Provisions for employee entitlements Employees’ entitlements to annual leave are recognised when they accrue to employees. The necessary provision is made in the
profit or loss based on the terms of the Group’s leave policy.
1.18 Comparatives Where necessary, comparative figures have been reclassified to conform to changes in presentation in the current year.
1.19 Segmental reporting An operating segment is a component of an entity that engages in business activities from which it may earn revenues and incur
expenses; whose operating results are regularly reviewed by the entity’s Chief Operating decision maker to make decisions about resources to be allocated to the segment and assess its performance and for which discrete financial information is available. The Group’s major reporting segment is Advertising and Media Investment Management. The requirements of IFRS 8 are not applicable to the Group.
NOTES TO THE FINANCIAL STATEMENTS (Contd.)

32
SCANGROUP ANNUAL REPORT 2012
1. ACCOUNTING POLICIES (Contd.)
1.20 New standards and amendments to published standards effective for the year ended 31 December 2012 The following new and revised standards were effective in the current year and had no material impact on the amounts reported
in the financial statements • AmendmentstoIFRS7–Disclosures–Transferoffinancialassets • IAS12–Deferredtax–Recoveryofunderlyingassets • AmendmentstoIFRS1–Severehyperinflation
The Group has not applied the following new and revised IFRSs that have been issued but are not yet effective:
Amendments to IAS 1 Presentation of items of Other comprehensive income 5
Amendments to IAS 1 Presentation of Financial Statements 5
(as part of the annual improvements to IFRS 2009 – 2011 cycle issued in May 2012) IFRS 9 Financial Instruments3
IFRS 10 Consolidated Financial Statements1
IFRS 11 Joint Arrangements1
IFRS 12 Disclosure of Interests in Other Entities1
IFRS 13 Fair Value Measurement1
Amendments to IFRS 7 Disclosures – Offsetting Financial Assets and Financial Liabilities1
Amendments to IFRS 9 and IFRS 7 Mandatory Effective Date of IFRS 9 and Transition Disclosures3
Amendments to IFRS 10, IFRS 11 and IFRS 12 Consolidated Financial Statements, Joint Arrangements and Disclosure of Interests in Other Entities: Transition Guidance1
IAS 19 (as revised in 2011) Employee Benefits1
IAS 27 (as revised in 2011) Separate Financial Statements1
IAS 28 (as revised in 2011) Investments in Associates and Joint Ventures1
Amendments to IAS 32 Offsetting Financial Assets and Financial Liabilities2
Amendments to IFRSs Annual Improvements to IFRSs 2009-2011 Cycle except for the amendment to IAS 11 (see note 2.1) Amendment to IAS 16 Property plant and Equipment 4
IFRIC 20 Stripping Costs in the Production Phase of a Surface Mine1
1 Effective for annual periods beginning on or after 1 January 2013.
2 Effective for annual periods beginning on or after 1 January 2014.
3 Effective for annual periods beginning on or after 1 January 2015.
4. Effective for annual periods beginning on or after 1 July 2013
5. Effective for annual period beginning 1 July 2013
Amendments to IAS 1 Presentation of Items of Other Comprehensive Income The amendments introduce new terminology for the statement of comprehensive income and income statement. Under
the amendments to IAS 1, the ‘statement of comprehensive income’ is renamed the ‘statement of profit or loss and other comprehensive income’ and the ‘income statement’ is renamed the ‘statement of profit or loss’. The amendments to IAS 1 retain the option to present profit or loss and other comprehensive income in either a single statement or in two separate but consecutive statements. However, the amendments to IAS 1 require items of other comprehensive income to be grouped into two categories in the other comprehensive income section: (a) items that will not be reclassified subsequently to profit or loss and (b) items that may be reclassified subsequently to profit or loss when specific conditions are met. Income tax on items of other comprehensive income is required to be allocated on the same basis – the amendments do not change the option to present items of other comprehensive income either before tax or net of tax. The amendments will be applied in the financial statements for year beginning 1 January 2013. Other than the presentation changes, the application of the amendments to IAS 1 will not result in any impact on profit or loss, other comprehensive income and total comprehensive income.
NOTES TO THE FINANCIAL STATEMENTS (Contd.)

33
SCANGROUP ANNUAL REPORT 2012
1. ACCOUNTING POLICIES (Contd.)
1.20 New standards and amendments to published standards effective for the year ended 31 December 2012 (Contd.)
Amendments to IAS 1 Presentation of Financial Statements (as part of the Annual Improvements to IFRSs 2009-2011 Cycle issued in May 2012)
IAS 1 requires an entity that changes accounting policies retrospectively, or makes a retrospective restatement or reclassification to present a statement of financial position as at the beginning of the preceding period (third statement of financial position). The amendments to IAS 1 clarify that an entity is required to present a third statement of financial position only when the retrospective application, restatement or reclassification has a material effect on the information in the third statement of financial position and that related notes are not required to accompany the third statement of financial position.
The Group will apply the amendments in the financial period beginning 1 January 2013. This will affect any future restatement or reclassifications.
IFRS 9 Financial Instruments IFRS 9, issued in November 2009, introduced new requirements for the classification and measurement of financial assets. IFRS
9 was amended in October 2010 to include requirements for the classification and measurement of financial liabilities and for de-recognition.
Key requirements of IFRS 9 All recognised financial assets that are within the scope of IAS 39 Financial Instruments: Recognition and Measurement to be
subsequently measured at amortised cost or fair value. Specifically, debt investments that are held within a business model whose objective is to collect the contractual cash flows, and that have contractual cash flows that are solely payments of principal and interest on the principal outstanding are generally measured at amortised cost at the end of subsequent accounting periods. All other debt investments and equity investments are measured at their fair value at the end of subsequent accounting periods. In addition, under IFRS 9, entities may make an irrevocable election to present subsequent changes in the fair value of an equity investment (that is not held for trading) in other comprehensive income, with only dividend income generally recognised in profit or loss.
With regard to the measurement of financial liabilities designated as at fair value through profit or loss, IFRS 9 requires that the amount of change in the fair value of the financial liability, that is attributable to changes in the credit risk of that liability, is presented in other comprehensive income, unless the recognition of the effects of changes in the liability’s credit risk in other comprehensive income would create or enlarge an accounting mismatch in profit or loss. Changes in fair value attributable to a financial liability’s credit risk are not subsequently reclassified to profit or loss. Previously, under IAS 39, the entire amount of the change in the fair value of the financial liability designated as fair value through profit or loss was presented in profit or loss.
The directors anticipate that the application of IFRS 9 in the future will not have a significant impact on amounts reported in respect of the Group’s financial assets and financial liabilities. The company has very few financial instruments, principally accounts receivable, short term deposits and payables whose measurement will not be affected by the adoption of IFRS 9.
NOTES TO THE FINANCIAL STATEMENTS (Contd.)

34
SCANGROUP ANNUAL REPORT 2012
NOTES TO THE FINANCIAL STATEMENTS (Contd.)
1 ACCOUNTING POLICIES (Contd.)
1.20 New standards and amendments to published standards effective for the year ended 31 December 2012 (Contd.)
New and revised Standards on consolidation, joint arrangements, associates and disclosures
In May 2011, a package of five Standards on consolidation, joint arrangements, associates and disclosures was issued, including IFRS 10, IFRS 11, IFRS 12, IAS 27 (as revised in 2011) and IAS 28 (as revised in 2011).
Key requirements of these five Standards are described below IFRS 10 replaces the parts of IAS 27 Consolidated and Separate Financial Statements that deal with consolidated financial
statements. SIC-12 Consolidation – Special Purpose Entities will be withdrawn upon the effective date of IFRS 10. Under IFRS 10, there is only one basis for consolidation, that is, control. In addition, IFRS 10 includes a new definition of control that contains three elements: (a) power over an investee, (b) exposure, or rights, to variable returns from its involvement with the investee, and (c) the ability to use its power over the investee to affect the amount of the investor’s returns. Extensive guidance has been added in IFRS 10 to deal with complex scenarios. IAS 27 (new) deals with Separate financial Statements only.
IFRS 11 replaces IAS 31 Interests in Joint Ventures. IFRS 11 deals with how a joint arrangement of which two or more parties have joint control should be classified. SIC-13 Jointly Controlled Entities – Non-monetary Contributions by Venturers will be withdrawn upon the effective date of IFRS 11. Under IFRS 11, joint arrangements are classified as joint operations or joint ventures, depending on the rights and obligations of the parties to the arrangements. In contrast, under IAS 31, there are three types of joint arrangements: jointly controlled entities, jointly controlled assets and jointly controlled operations. In addition, joint ventures under IFRS 11 are required to be accounted for using the equity method of accounting, whereas jointly controlled entities under IAS 31 can be accounted for using the equity method of accounting or proportional consolidation.
IFRS 12 is a disclosure standard and is applicable to entities that have interests in subsidiaries, joint arrangements, associates and/or unconsolidated structured entities. In general, the disclosure requirements in IFRS 12 are more extensive than those in the current standards.
In June 2012, the amendments to IFRS 10, IFRS 11 and IFRS 12 were issued to clarify certain transitional guidance on the application of these IFRSs for the first time.
These five standards together with the amendments regarding the transition guidance are effective for annual periods beginning on or after 1 January 2013, with earlier application permitted provided all of these standards are applied at the same time. The directors anticipate that the application of IFRS 10 (revised), IAS 21 and IAS 28 will not have a significant impact on amounts reported in the consolidated financial statements.
The application of IFRS 11 will change the classification and subsequent accounting of the Group’s investment in Millward Brown East Africa Limited, Millward Brown West Africa Limited and Millward Brown Nigeria Limited (MB Entities) which are classified as joint venture entities under IAS 31 and have been accounted for using the proportionate consolidation method. Under IFRS 11, MB Entities will be accounted for using the equity method, resulting in the aggregation of the Group’s proportionate share of MB Entities net assets and items of profit or loss and other comprehensive income into a single line item which will be presented in the consolidated statement of financial position and in the consolidated statement of profit or loss and other comprehensive income as ‘investment in joint venture’ and ‘share of profits (loss) of joint venture’ respectively.
The Groups share of net assets in the Joint Ventures recognised in the statement of financial position amounting to Sh 110,978,000 will be derecognised and the Group recognises only its investment in the subsidiary at cost plus its share of profit or loss. This will be Sh 31,057,000. The Group will also recognise only its share of results in the Joint Venture as one line item as opposed to the proportionate consolidation of all items of income /expenditure. This will not lead to any changes on the Group
profit or loss for the year.
Besides the investment in MB Entities the Group does not have any other interests in joint venture or jointly controlled entities.

35
SCANGROUP ANNUAL REPORT 2012
1. ACCOUNTING POLICIES (Contd.) 1.20 New standards and amendments to published standards effective for the year ended 31 December 2012 (Contd.)
IFRS 13 Fair Value Measurement
IFRS 13 establishes a single source of guidance for fair value measurements and disclosures about fair value measurements. The Standard defines fair value, establishes a framework for measuring fair value, and requires disclosures about fair value measurements. The scope of IFRS 13 is broad; it applies to both financial instrument items and non-financial instrument items for which other IFRSs require or permit fair value measurements and disclosures about fair value measurements, except in specified circumstances. In general, the disclosure requirements in IFRS 13 are more extensive than those required in the current standards. For example, quantitative and qualitative disclosures based on the three-level fair value hierarchy currently required for financial instruments only under IFRS 7 Financial Instruments: Disclosures will be extended by IFRS 13 to cover all assets and liabilities within its scope.
IFRS 13 is effective for annual periods beginning on or after 1 January 2013, with earlier application permitted. The directors anticipate that the application of the new Standard may affect certain amounts reported in the financial statements
and result in more extensive disclosures in the financial statements should the Group acquire financial instruments that are subject to fair value measurement.
Amendments to IFRS 7 and IAS 32 Offsetting Financial Assets and Financial Liabilities and the related disclosures.
The amendments to IAS 32 clarify existing application issues relating to the offset of financial assets and financial liabilities requirements. Specifically, the amendments clarify the meaning of ‘currently has a legally enforceable right of set-off’ and ‘simultaneous realisation and settlement’.
The amendments to IFRS 7 require entities to disclose information about rights of offset and related arrangements (such as collateral posting requirements) for financial instruments under an enforceable master netting agreement or similar arrangement.
The amendments to IFRS 7 are effective for annual periods beginning on or after 1 January 2013 and interim periods within those annual periods. The disclosures should be provided retrospectively for all comparative periods. However, the amendments to IAS 32 are not effective until annual periods beginning on or after 1 January 2014, with retrospective application required.
The directors anticipate that the application of these amendments to IAS 32 and IFRS 7 may result in more disclosures being made with regard to offsetting financial assets and financial liabilities in the future.
Annual Improvements to IFRSs 2009 – 2011 Cycle issued in May 2012 The Annual Improvements to IFRSs 2009 – 2011 Cycle include a number of amendments to various IFRSs. The amendments are
effective for annual periods beginning on or after 1 January 2013. Amendments to IFRSs include:
•amendmentstoIAS16Property,PlantandEquipment;and •amendmentstoIAS32FinancialInstruments:Presentation. Amendments to IAS 16
The amendments to IAS 16 clarify that spare parts, stand-by equipment and servicing equipment should be classified as property, plant and equipment when they meet the definition of property, plant and equipment in IAS 16 and as inventory otherwise. The directors do not anticipate that the amendments to IAS 16 will have a significant effect on the Group’s consolidated financial statements.
NOTES TO THE FINANCIAL STATEMENTS (Contd.)

36
SCANGROUP ANNUAL REPORT 2012
1. ACCOUNTING POLICIES (Contd.)
1.20 New standards and amendments to published standards effective for the year ended 31 December 2012 (Contd.)
Amendments to IAS 32
The amendments to IAS 32 clarify that income tax relating to distributions to holders of an equity instrument and to transaction costs of an equity transaction should be accounted for in accordance with IAS 12 Income Taxes. The directors anticipate that the amendments to IAS 32 will have no effect on the Group’s consolidated financial statements as the Group does not have equity instruments that would be affected by this standard.
2. SIGNIFICANT ACCOUNTING JUDGMENTS AND KEY SOURCES OF ESTIMATION UNCERTAINTY In the process of applying the entity’s accounting policies, the directors have made estimates and assumptions that affect the
reported amounts of assets and liabilities within the next financial year. Estimates and judgments are continually evaluated and are based on historical experience and other factors, including expectations of future events that are believed to be reasonable under the circumstances.
The key areas of judgment in applying the Group’s accounting policies are dealt with below:
2.1. Critical judgements in applying accounting policies
2.1.1. Equipment Critical estimates are made by the directors, in determining depreciation rates for equipment.
2.1.2. Impairment losses At each year end, the Group reviews the carrying amounts of its tangible and intangible assets to determine whether there is
any indication that those assets have suffered an impairment loss. If any such indication exists, the recoverable amount of the asset is estimated in order to determine the extent of the impairment loss. Where it is not possible to estimate the recoverable amount of an individual asset, the Group estimates the recoverable amount of the cash generating unit to which the asset belongs.
2.2. Key sources of estimation uncertainty The following are the key assumptions concerning the future, and other key sources of estimation uncertainty at the end of
reporting period that have a significant risk of causing a material adjustment to the carrying amounts of assets and liabilities within the next financial year.
2.2.1. Useful lives of equipment As described above, the Group reviews the estimated useful lives of equipment at the end of each annual reporting period.
2.2.2. Impairment of goodwill Determining whether goodwill is impaired requires an estimation of the value in use of the cash generating units to which
goodwill has been allocated. The value in use calculation requires the directors to estimate the future cash flows expected to arise from the cash generating unit and suitable discount rate in order to calculate present value.
NOTES TO THE FINANCIAL STATEMENTS (Contd.)
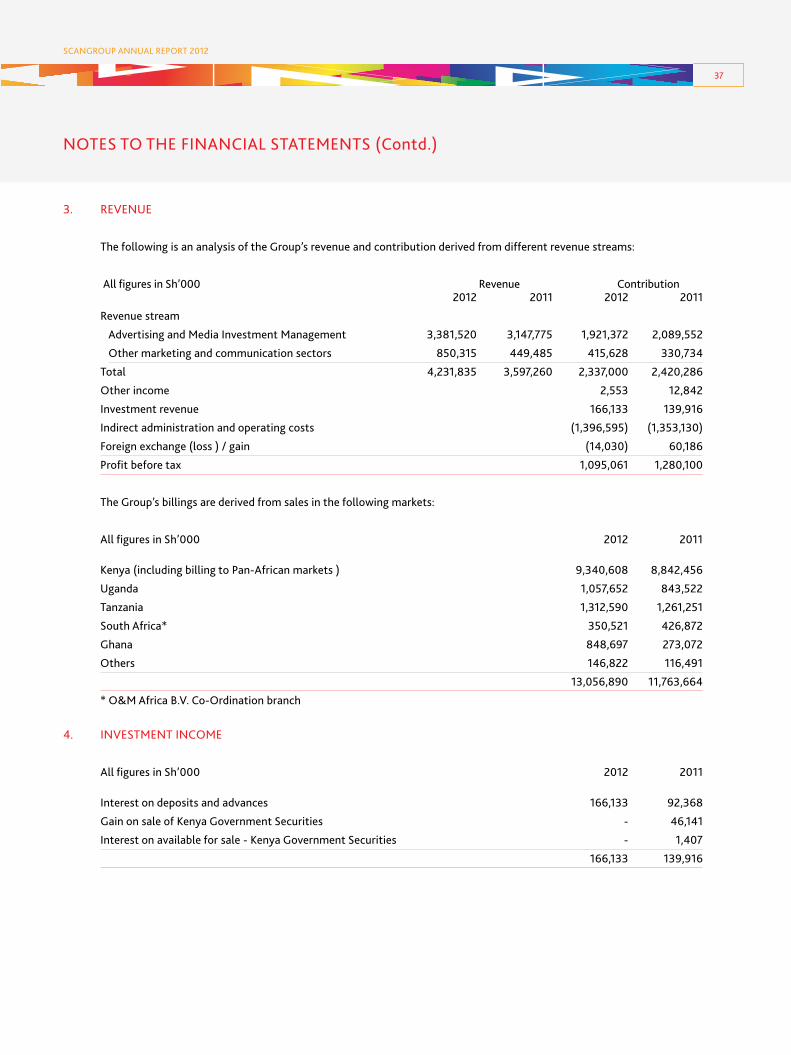
37
SCANGROUP ANNUAL REPORT 2012
NOTES TO THE FINANCIAL STATEMENTS (Contd.)
3. REVENUE
The following is an analysis of the Group’s revenue and contribution derived from different revenue streams:
All figures in Sh’000 Revenue Contribution 2012 2011 2012 2011
Revenue stream
Advertising and Media Investment Management 3,381,520 3,147,775 1,921,372 2,089,552
Other marketing and communication sectors 850,315 449,485 415,628 330,734
Total 4,231,835 3,597,260 2,337,000 2,420,286
Other income 2,553 12,842
Investment revenue 166,133 139,916
Indirect administration and operating costs (1,396,595) (1,353,130)
Foreign exchange (loss ) / gain (14,030) 60,186
Profit before tax 1,095,061 1,280,100
The Group’s billings are derived from sales in the following markets:
All figures in Sh’000 2012 2011
Kenya (including billing to Pan-African markets ) 9,340,608 8,842,456
Uganda 1,057,652 843,522
Tanzania 1,312,590 1,261,251
South Africa* 350,521 426,872
Ghana 848,697 273,072
Others 146,822 116,491
13,056,890 11,763,664
* O&M Africa B.V. Co-Ordination branch
4. INVESTMENT INCOME
All figures in Sh’000 2012 2011
Interest on deposits and advances 166,133 92,368
Gain on sale of Kenya Government Securities - 46,141
Interest on available for sale - Kenya Government Securities - 1,407
166,133 139,916

38
SCANGROUP ANNUAL REPORT 2012
NOTES TO THE FINANCIAL STATEMENTS (Contd.)
5. PROFIT BEFORE TAXATION
The profit before taxation is arrived at after charging:
All figures in Sh’000 2012 2011
Staff costs (note 5.1) 2,433,335 1,831,385 Auditors’ remuneration 19,957 16,064 Operating lease rentals 165,998 104,903 Depreciation 99,329 70,937 Amortisation of intangible assets 8,373 2,526 Bad debts provision 3,934 19,291 Loss /(gain) on disposal of equipment (313) 1,013 Directors’ remuneration non - executive directors’ fee 2,000 2,000 non - executive directors’ emoluments 1,040 840 executive directors’ emoluments 80,027 83,827
5.1. STAFF COSTS
All figures in Sh’000 2012 2011 Salaries 2,149,060 1,618,153 Social security costs (NSSF) 49,305 37,261 Contribution to provident fund scheme 40,131 31,780 Provision for staff leave pay 2,200 10,749 Others 192,639 133,442 2,433,335 1,831,385
6. TAXATION 6.1. Tax expense
All figures in Sh’000 2012 2011
Current taxation bas ed on the adjusted profit For company at 20% (2011: 20%) - 41,751 For companies at 30% (2011:30%) 363,382 302,699 Tax impact of companies charged at different rates 20,317 14,475 Prior year under provision 139 1,220 383,839 360,145 Deferred taxation (credit) / charge (note 12) - current year (credit) / charge (49,729) 8,233 - prior year under provision 8,942 606 (40,787) 8,839 343,052 368,984

39
SCANGROUP ANNUAL REPORT 2012
NOTES TO THE FINANCIAL STATEMENTS (Contd.)
6. TAXATION (Contd.)
6.2. Reconciliation of expected tax based on accounting profit to tax expense
All figures in Sh’000 2012 2011
Accounting profit before taxation 1,095,061 1,280,100 Tax at the applicable rate of 30% (2011:30%) 328,518 384,030 Tax effect of expenses not deductible for tax purposes 9,360 7,864 Tax effect of holding company being charged at 20% in 2011 - (20,207) Tax impact of companies charged at different rates (2,324) (2,476) Tax effect of income not subject to tax (1,584) (2,053) Prior year under provision - deferred tax 8,942 606 Prior year under provision - current tax 139 1,220 343,052 368,984
6.3. Movement in net of tax recoverable and tax payable
All figures in Sh’000 GROUP COMPANY 2012 2011 2012 2011 At beginning of year (30,310) (39,121) 22,229 (11,726) Taxation paid 461,141 369,375 63,001 75,706 Charge for the year (383,839) (360,145) (81,630) (41,751) Translation difference - (419) - - At the end of the year 46,992 (30,310) 3,600 22,229
Breakup of tax recoverable / (tax payable) Tax recoverable 109,105 134,187 3,600 22,229 Tax payable (62,113) (164,497) - - 46,992 (30,310) 3,600 22,229
7. PROFIT FOR THE YEAR The profit after taxation of Sh 205,004,426 (2011: Sh 159,953,951) has been dealt with in the separate financial statements of
Scangroup Limited.
8. EARNINGS PER SHARE
8.1. Basic earnings per share Basic earnings per share is calculated based on the profit attributable to shareholders divided by the weighted average number
of ordinary shares in issue in each period as follows: 2012 2011 Profit attributable to share holders of the holding company (Sh’000) 628,379 724,965 Weighted average number of shares (in thousands ) 284,789 284,638 Basic earnings per share (Sh) 2.21 2.55

40
SCANGROUP ANNUAL REPORT 2012
NOTES TO THE FINANCIAL STATEMENTS (Contd.)
8. EARNINGS PER SHARE (Contd.)
8.2. Diluted earnings per share Diluted earnings per share is calculated by adjusting the weighted average number of ordinary shares outstanding to
assume conversion of all dilutive potential ordinary shares. As at 31 December 2012 and 31 December 2011 no such instruments were outstanding.
2012 2011
Profit used in calculation of basic and diluted earnings per Share(Sh’000) 628,379 724,965 Weighted average number of shares used in the calculation of basic earnings per share (in thousands ) 284,789 284,638 Weighted average number of shares used in calculation of diluted earnings per share (in thousands ) 284,789 284,638 Diluted earnings per share (Sh) 2.21 2.55

41
SCANGROUP ANNUAL REPORT 2012
NOTES TO THE FINANCIAL STATEMENTS (Contd.)
9. EQUIPMENT
9.1 Equipment – Group
Furniture, Computers and Motor fittings and All figures in Sh’000 accessories vehicles equipemnt Total
COST At 1 January 2011 210,434 77,814 178,137 466,385 Added on acquisition of subsidiary 7,109 8,527 8,665 24,301 Other additions 69,709 12,772 38,691 121,172 Disposals (4,748) (1,868) (341) (6,957) Exchange rate adjustment (862) 45 (936) (1,753) At 31 December 2011 281,642 97,290 224,216 603,148
At 1 January 2012 281,642 97,290 224,216 603,148 Additions 98,808 25,407 133,730 257,945 Disposals (3,745) (15,455) (9,372) (28,572) Exchange rate adjustment 2,002 2,368 6,486 10,856 At 31 December 2012 378,707 109,610 355,060 843,377
DEPRECIATION At 1 January 2011 122,661 39,206 83,027 244,894 Charge for the year 39,546 11,492 19,899 70,937 Elimination on disposal (3,944) (1,533) (217) (5,694) Exchange rate adjustment (939) 176 (819) (1,582) At 31 December 2011 157,324 49,341 101,890 308,555
At 1 January 2012 157,324 49,341 101,890 308,555 Charge for the year 56,321 13,874 29,135 99,329 Elimination on disposal (2,957) (11,397) (5,691) (20,045) Exchange rate adjustment 873 401 1,480 2,754 At 31 December 2012 211,561 52,219 126,814 390,594
NET BOOK VALUE At 31 December 2012 167,146 57,391 228,246 452,783 At 31 December 2011 124,318 47,949 122,326 294,593

42
SCANGROUP ANNUAL REPORT 2012
NOTES TO THE FINANCIAL STATEMENTS (Contd.)
9. EQUIPMENT (Contd.)
9.2. Equipment – Company
COST Furniture, Computers and Motor fittings and All figures in Sh’000 accessories vehicles equipemnts Total
At 1 January 2011 82,078 30,079 10,096 122,253
Additions 45,871 4,313 796 50,980
Disposals (420) - - (420)
At 31 December 2011 127,529 34,392 10,892 172,813
At 1 January 2012 127,529 34,392 10,892 172,813
Additions 48,238 - 1,212 49,450
Disposals (103) - (750) (854)
At 31 December 2012 175,663 34,392 11,354 221,409
DEPRECIATION
At 1 January 2011 33,968 11,583 3,912 49,463
Charge for the year 22,618 4,714 802 28,134
Elimination on disposal (339) - - (339)
At 31 December 2011 56,247 16,297 4,714 77,258
At 1 January 2012 56,247 16,297 4,714 77,258
Charge for the year 30,926 4,524 885 36,335
Elimination on disposal (43) - (533) (576)
At 31 December 2012 87,130 20,821 5,067 113,017
NET BOOK VALUE
At 31 December 2012 88,533 13,571 6,287 108,392
At 31 December 2011 71,282 18,095 6,178 95,555

43
SCANGROUP ANNUAL REPORT 2012
NOTES TO THE FINANCIAL STATEMENTS (Contd.)
10. INTANGIBLE ASSETS- GROUP
All figures in Sh’000 2012 2011
COST At 1 January 27,338 - Additions - 27,338 At 31 December 27,338 27,338
AMORTISATION At 1 January 2,278 - Charge for the year 8,373 2,526 Exchange rate adjustment 2,459 (248) At 31 December 13,110 2,278
Net Book Value 14,228 25,060
The intangible assets represent client contracts acquired through acquisition of Media Majique & Research Systems Limited (MMRS) and Ogilvy Ghana Limited.
11. OTHER EQUITY INVESTMENTS
O&M Africa B.V, in which Scangroup Limited own 51% shares, owns investments in affiliates as follows: % shares Ogilvy & Mather Advertising Namibia (Proprietary) Limited 30.0% Prima Garnet Communications Limited 12.6% Ogilvy Zimbabwe (Private) Limited 25.0% Ocean Ogilvy Gabon 25.0% Ocean Central Africa 25.0% Ocean Burkina Faso 25.0% Ocean Afrique Occidentale 25.0% Ocean Conseil 25.0%

44
SCANGROUP ANNUAL REPORT 2012
NOTES TO THE FINANCIAL STATEMENTS (Contd.)
12. DEFERRED TAX
Deferred income taxes are calculated on all temporary differences under the liability method using the currently enacted tax rates applicable for the various entities in the Group ranging from 20% to 30%. The net deferred tax asset is attributable to the following items:
GROUP COMPANY All figures in Sh’000 2012 2011 2012 2011
Accelerated (depreciation)/capital allowances 463 (311) 6,187 1,842
Unrealised exchange losses /(gains ) 1,332 (665) (2,456) 3,490
Tax losses carried forward 56,571 7,604 - -
Provisions 56,983 69,399 20,383 16,808
115,349 76,027 24,114 22,140
Movement in deferred tax account is as follows
At beginning of period – asset 76,027 84,865 22,140 22,508
Credit / (charge) for the year – (note 6.1) 49,729 (8,233) - (368)
Prior year (under) / over provision (8,942) (606) 1,974 -
Effect of exchange rates (1,465) 1 - -
At end of period – asset 115,349 76,027 24,114 22,140
Breakup of deferred tax asset and liability
Deferred tax asset 120,138 76,027 24,114 22,140
Deferred tax liability (4,789) - - -
115,349 76,027 24,114 22,140

45
SCANGROUP ANNUAL REPORT 2012
NOTES TO THE FINANCIAL STATEMENTS (Contd.)
13. RELATED PARTIES Parties are considered to be related if one party has the ability to control the other party or exercise significant influence over
the other party in making financial or operational decisions.
Transactions between the company and its subsidiaries which are related parties have been eliminated on consolidation. GROUP COMPANY All figures in Sh’000 2012 2011 2012 2011
Balances recoverable from related parties Due after one year Due from directors 2,477 - - - Due from affiliates of Joint Venture 561 - - - 3,038 - - -
Due within one year Due from subsidiaries - - 594,234 650,108 Due from affiliates of Joint Venture 6,687 - - - 6,687 594,234 650,108
Loan payable to related parties Russell Square Holding B.V. 353,269 337,430 - -
Loan recoverable from related parties Loan due from various subsidiaries and Joint Ventures - - 50,020 120,589
Transactions with related parties Sale of services - Joint Venture - - 2,991 24,886 Purchase of services - - - - Remuneration of directors and key management compensation - - 478,025 418,850 Directors‘ remuneration - Executive directors‘ emoluments (included in key management compensation above) 80,027 83,827 80,027 83,827
14. GOODWILL
Goodwill represents consideration paid in excess of net assets acquired in case of Redsky Limited and Ogilvy entities. Balance as at 31 December 2011 and 31 December 2012 was Sh 315,671,000. The directors have assessed the goodwill for impairment. Based on the present value of the expected cash inflows from Redsky Limited and the Ogilvy entities, the directors are of the opinion the goodwill is not impaired.
15. TRADE AND OTHER RECEIVABLES
All figures in Sh’000 GROUP COMPANY 2012 2011 2012 2011 Trade receivables 4,555,729 3,986,206 1,121,310 521,810 VAT recoverable 527,687 717,192 88,666 162,565 Staff recoverable 109,942 57,199 31,589 29,177 Other receivables and pre-payments 469,958 190,640 66,453 15,170 5,663,316 4,951,237 1,308,018 728,722
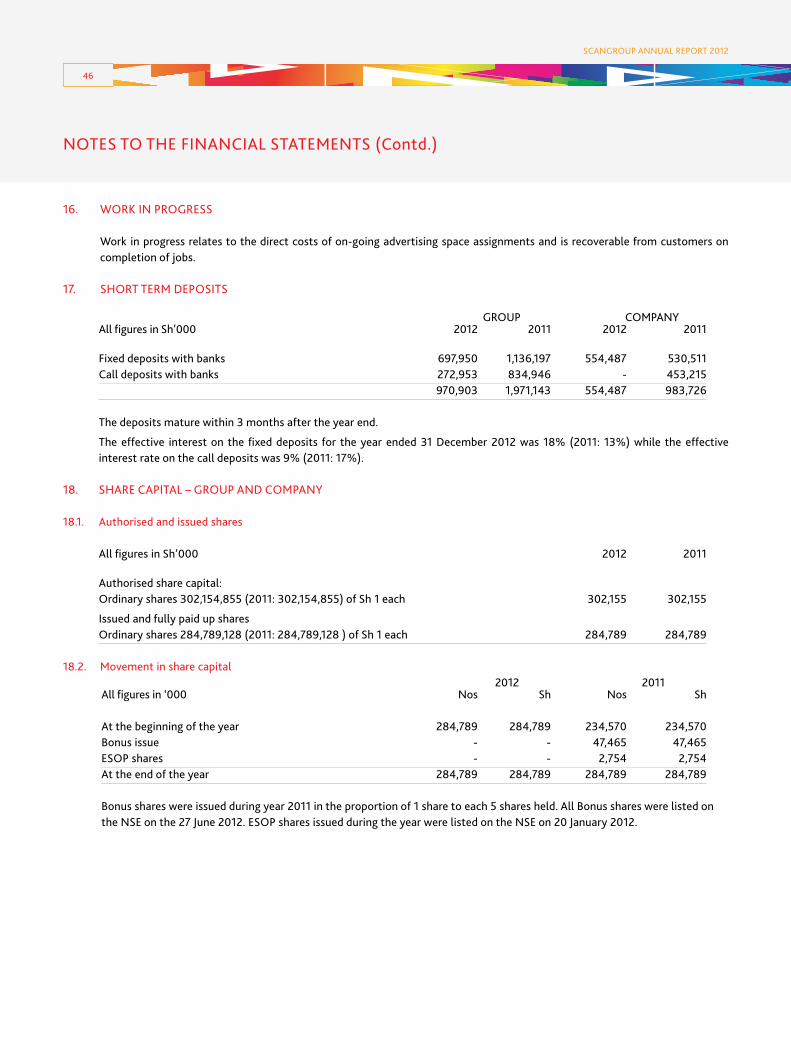
46
SCANGROUP ANNUAL REPORT 2012
NOTES TO THE FINANCIAL STATEMENTS (Contd.)
16. WORK IN PROGRESS
Work in progress relates to the direct costs of on-going advertising space assignments and is recoverable from customers on completion of jobs.
17. SHORT TERM DEPOSITS
GROUP COMPANY All figures in Sh’000 2012 2011 2012 2011
Fixed deposits with banks 697,950 1,136,197 554,487 530,511 Call deposits with banks 272,953 834,946 - 453,215 970,903 1,971,143 554,487 983,726
The deposits mature within 3 months after the year end.
The effective interest on the fixed deposits for the year ended 31 December 2012 was 18% (2011: 13%) while the effective interest rate on the call deposits was 9% (2011: 17%).
18. SHARE CAPITAL – GROUP AND COMPANY
18.1. Authorised and issued shares
All figures in Sh’000 2012 2011
Authorised share capital: Ordinary shares 302,154,855 (2011: 302,154,855) of Sh 1 each 302,155 302,155
Issued and fully paid up shares Ordinary shares 284,789,128 (2011: 284,789,128 ) of Sh 1 each 284,789 284,789
18.2. Movement in share capital 2012 2011 All figures in ‘000 Nos Sh Nos Sh
At the beginning of the year 284,789 284,789 234,570 234,570 Bonus issue - - 47,465 47,465 ESOP shares - - 2,754 2,754 At the end of the year 284,789 284,789 284,789 284,789 Bonus shares were issued during year 2011 in the proportion of 1 share to each 5 shares held. All Bonus shares were listed on the NSE on the 27 June 2012. ESOP shares issued during the year were listed on the NSE on 20 January 2012.

47
SCANGROUP ANNUAL REPORT 2012
NOTES TO THE FINANCIAL STATEMENTS (Contd.)
18. SHARE CAPITAL – GROUP AND COMPANY (Contd.)
18.3. Equity settled employee benefit reserve
All figures in Sh’000 2012 2011
Balance at the beginning of the year - 40,625 Shares issued during the year - (40,625) At the end of the year - -
All the share options outstanding at beginning of year 2011 (in respect of 2,754,259 ordinary shares) were exercised. In year 2012 no shares were granted and exercised under ESOP.
19. TRADE AND OTHER PAYABLES
All figures in Sh’000 GROUP COMPANY 2012 2011 2012 2011
Trade payables 2,993,899 3,239,826 945,915 894,659 Other payables 256,261 325,922 5,672 18,651 Leave pay provision 29,447 27,921 3,841 5,128 VAT payable 33,529 29,661 - 9,051 3,313,136 3,623,330 955,428 927,489
20. DIVIDENDS PAYABLE – GROUP AND COMPANY All figures in Sh’000 2012 2011
At 1 January 9,772 5,996 Dividends declared (refer note 23) 199,352 166,127 Dividends paid (195,100) (162,351) At 31 December 14,024 9,772

48
SCANGROUP ANNUAL REPORT 2012
NOTES TO THE FINANCIAL STATEMENTS (Contd.)
21. INVESTMENT
21.1. Investment in subsidiaries at cost
All figures in Sh’000 Shareholding % 2012 2011
Media Buying Africa Limited 100% 124,024 111,177 Scanad Nigeria Holdings Limited 100% 153,041 - Scangroup Mauritius Holdings Limited 100% 155,033 144 Redsky Limited 100% 84,542 84,542 Scanad Kenya Limited 100% 40,000 40,000 Scanad East Africa Limited 100% 31,500 31,500 McCann Kenya Limited 100% 15,000 15,000 MIA Mauritius 100% 10,006 - Media Compete East Africa Limited 100% 40 40 Grey East Africa Limited 100% 40 40 J. Walter Thompson Kenya Limited 90% 18,000 18,000 O&M Africa B.V.** 51% 185,167 185,167 Ogilvy Africa Limited** 51% 61,200 61,200 Ogilvy Tanzania Limited** 51% 25,500 25,500 Hill & Knowlton East Africa Limited* 51% 5,207 5,207 Ogilvy Mauritius Holdings Limited ** 51% 434 434 Squad Digital Limited 51% 408 408 Ogilvy Kenya Limited*** 50% 238,353 238,353 Smollan E. A. Limited 50% 500 500 1,147,995 817,212
*Scangroup has given an option to the other shareholder to purchase 2% of the issued share capital at any time after 31 December 2011 at fair value calculated on multiple of earnings.
** Scangroup has granted call options to the other shareholder to purchase 2% of the issued share capital at any time after 31 December 2014 at fair value calculated on multiple of earnings.
*** Scangroup has granted call options to the other shareholder to purchase 1% of the of the issued share capital at any time after 31 December 2014 at fair value calculated on multiple of earnings.
Scangroup Limited is the ultimate holding company of the following companies which are subsidiaries of Scanad East Africa Limited, a wholly owned subsidiary of Scangroup Limited:
Shareholding % Scanad Uganda Limited 100% Roundtrip Limited 100% Scanad Tanzania Limited 82% J. Walter Thompson Tanzania Limited (subsidiary of Scanad Tanzania Limited) 82%

49
SCANGROUP ANNUAL REPORT 2012
NOTES TO THE FINANCIAL STATEMENTS (Contd.)
21. INVESTMENT (Contd.)
21.1. Investment in subsidiaries at cost (Contd.)
Scangroup Mauritius Holdings Limited is the holding company of other subsidiaries incorporated outside East Africa as follows:
Shareholding % STE Scanad DRC 100% Scanad Burundi Limited SPRL 100% Scanad Rwanda Limited 100% JWT Uganda Limited 100% Scangroup (Mauritius) Limited 100% Ogilvy Mauritius Holdings Limited** 51% Hill + Knowlton Strategies Africa Holdings Limited 51%
** Scangroup has granted call options to the other shareholder to purchase 2% of the issued share capital at any time after 31 December 2014 at fair value calculated on multiple of earnings.
Scangroup (Mauritius) Limited, (a wholly owned subsidiary of Scangroup Mauritius Holdings Limited) is the holding company of other subsidiaries incorporated outside East Africa as follows:
Shareholding % Scangroup (Malawi) Limited 100% Scangroup (Zambia) Limited 100% Scangroup Mozambique Limitada 100% Scangroup West Africa Limited 100%
21.2. Investment in Joint Ventures
21.2.1 The Group has the following investment and interest in joint venture, Millward Brown East Africa Limited, Millward Brown West Africa, Millward Brown Nigeria and Millward Brown Mauritius Limited, which are jointly controlled with the other shareholder Russell Square Holding B.V.
The company’s investment at cost in the joint venture comprises:
All figures in Sh’000 2012 2011
Millward Brown East Africa Limited 6,125 6,125 Millward Brown Mauritius Limited 4 4 6,129 6,129
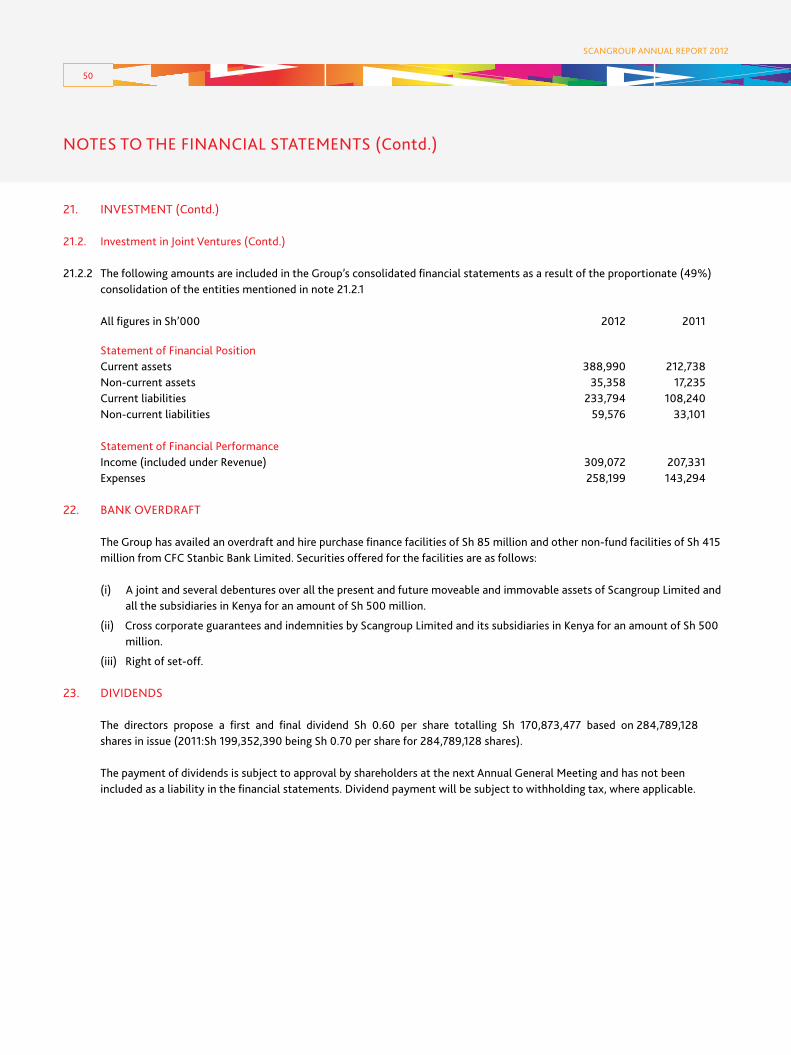
50
SCANGROUP ANNUAL REPORT 2012
NOTES TO THE FINANCIAL STATEMENTS (Contd.)
21. INVESTMENT (Contd.)
21.2. Investment in Joint Ventures (Contd.)
21.2.2 The following amounts are included in the Group’s consolidated financial statements as a result of the proportionate (49%) consolidation of the entities mentioned in note 21.2.1
All figures in Sh’000 2012 2011
Statement of Financial Position Current assets 388,990 212,738 Non-current assets 35,358 17,235 Current liabilities 233,794 108,240 Non-current liabilities 59,576 33,101
Statement of Financial Performance Income (included under Revenue) 309,072 207,331 Expenses 258,199 143,294
22. BANK OVERDRAFT
The Group has availed an overdraft and hire purchase finance facilities of Sh 85 million and other non-fund facilities of Sh 415 million from CFC Stanbic Bank Limited. Securities offered for the facilities are as follows:
(i) A joint and several debentures over all the present and future moveable and immovable assets of Scangroup Limited and all the subsidiaries in Kenya for an amount of Sh 500 million.
(ii) Cross corporate guarantees and indemnities by Scangroup Limited and its subsidiaries in Kenya for an amount of Sh 500 million.
(iii) Right of set-off.
23. DIVIDENDS
The directors propose a first and final dividend Sh 0.60 per share totalling Sh 170,873,477 based on 284,789,128 shares in issue (2011:Sh 199,352,390 being Sh 0.70 per share for 284,789,128 shares).
The payment of dividends is subject to approval by shareholders at the next Annual General Meeting and has not been included as a liability in the financial statements. Dividend payment will be subject to withholding tax, where applicable.

51
SCANGROUP ANNUAL REPORT 2012
NOTES TO THE FINANCIAL STATEMENTS (Contd.)
24. NOTES TO THE STATEMENT OF CASH FLOWS
24.1. Cash generated from operations
All figures in Sh’000 2012 2011 Profit before tax 1,095,061 1,280,100 Depreciation on equipment (note 9.1) 99,329 70,937 Amortisation of intangible assets 8,373 2,526 (Gain) / loss on disposal of equipment (313) 1,013 Investment income (166,133) (139,916) Cash generated from operating activities before working capital changes 1,036,317 1,214,660 (Increase) in trade and other receivables (697,784) (142,707) Decrease in work-in-progress 23,796 29,600 (Decrease) in trade and other payables (310,194) (517,202) Movement in related party balances 3,649 4,247 (980,534) (626,062) Cash generated from operating activities 55,783 588,598
24.2. Balances of cash and cash equivalents All figures in Sh’000 2012 2011
Cash in hand 5,921 1,650 Bank balance 978,054 675,947 Short term deposits (note 17) 970,903 1,971,143 1,954,878 2,648,740
25. CAPITAL COMMITMENTS
All figures in Sh’000 2012 2011
Authorised but not contracted 50,000 77,764 Authorised and contracted 23,974 79,619 73,974 157,383
26. OPERATING LEASE COMMITMENTS The total future minimum lease payments due to third parties under non-cancellable operating leases for premises are as follows:
All figures in Sh’000 2012 2011
Within 1 year 212,119 117,186 Within 2 to 3 years 445,450 253,221 657,569 370,407

52
SCANGROUP ANNUAL REPORT 2012
27. CONTINGENT LIABILITIES
All figures in Sh’000 2012 2011
Pending claims 43,014 45,167 Guarantees 4,000 4,000 47,014 49,167
These relate to claims against the Group by various parties. The likely outcome of these claims cannot be determined as at the date of signing these financial statements. The directors’ estimate of the maximum liability arising from these pending claims is set out above. However, the directors’ do not expect any significant liability to arise from these pending matters.
28. RISK MANAGEMENT POLICIES
The Group’s financial risk management objectives and policies are detailed below:
28.1. Capital risk management
The Group manages its capital with an aim to: • retainfinancialflexibilitybymaintainingstrongliquidityandaccesstoarangeofcapitalmarkets; • allocatecapitalefficientlytosupportgrowth • safeguardcompany’sabilitytocontinueasagoingconcernsothatitcancontinuetoprovidereturnsforshareholdersand
benefits for other stakeholders, and • provideanadequatereturntoshareholdersbypricingadvertisingservicescommensuratelywiththelevelofrisk.
An important aspect of the Group’s overall capital management process is the setting of a target risk- adjusted rate of return which is aligned to performance objectives and ensures that the Group is focused on the creation of value for shareholders.
The Group has a number of sources of capital available to it and seeks to optimise its equity/debt structure in order to ensure that it can consistently maximize returns to shareholder. As at the year-end the Group’s borrowing are not in excess of its cash and cash equivalents. Table below sets out the calculation of gearing ratio.
All figures in Sh’000 2012 2011
Share capital 284,789 284,789 Share premium 1,754,388 1,754,388 Revenue reserves 2,236,625 1,807,599 Translation reserve (6,551) 1,193 4,269,251 3,847,969 Non controlling interests 630,379 506,940 Total Equity 4,899,630 4,354,909
Loan payable to a related party 353,269 337,430 Less : Cash and cash equivalents 1,954,878 2,648,740 Excess of Cash and cash equivalents over borrowings (1,601,609) (2,311,310)
Gearing ratio N/A N/A
NOTES TO THE FINANCIAL STATEMENTS (Contd.)

53
SCANGROUP ANNUAL REPORT 2012
NOTES TO THE FINANCIAL STATEMENTS (Contd.)
28. RISK MANAGEMENT POLICIES (Contd.)
28.2. Financial risk management objectives
The Group’s activities expose it to a variety of financial risks including credit and liquidity risks, effects of changes in foreign currency and interest rates. The Group’s overall risk management programme focuses on unpredictability of changes in the business environment and seeks to minimise the potential adverse effect of such risks on its performance by setting acceptable levels of risk. The Group does not hedge any risks and has in place policies to ensure that credit is extended to customers with an established credit history.
28.3. Credit risk
The Group’s credit risk is primarily attributable to its trade receivables, bank balance and short term deposits. The amounts presented in the statement of financial position are net of allowances for doubtful receivables, estimated by the Group’s management based on prior experience and assessment of the prevailing economic environment.
The management assesses the creditworthiness of all clients by reviewing available financial information. Payment history of the client is used to review the maximum credit limits.
Exposure to client is also managed through other mechanisms such as the right to offset where a client is also a vendor of the company.
Credit risk on trade receivables is low because the majority of the Group’s clients are multinational companies with high credit ratings.
Credit risk on liquid funds with financial institutions is also low, because funds are held by banks with good credit-standing.
Amount that best represents the Group’s maximum exposure to credit as at 31 December 2012 is made up as follows:
All figures in Sh’000 Fully performing Past due Total At 31 December 2012 Bank balance 978,054 - 978,054 Trade receivables 3,664,675 891,054 4,555,729 Short term deposits 970,903 - 970,903 5,613,632 891,054 6,504,686
At 31 December 2011 Bank balance 675,947 - 675,947 Trade receivables 3,473,421 512,785 3,986,206 Short term deposits 1,971,143 - 1,971,143 6,120,511 512,785 6,633,296
The customers under the fully performing category settle their balance in the normal course of trade. Trade receivable that are past due are not doubtful. Out of the total past due amount of Sh 891,054,000 (2011: Sh 512,785,000) a sum of Sh 476,352,000 (2011: Sh 306,742,000) has been settled subsequent to the year-end. (Non-payment within the stipulated period under the contract in some cases will result in agreed discounts not being refunded to the respective clients). The credit control department actively follows the debts that are past due. The Group does not hold any collateral or other securities to cover client credit risk, except for occasional advance amounts received from some clients.
Bank balances and short term deposits are fully performing. Those amounts are held in reputable banks, which have a high credit rating.

54
SCANGROUP ANNUAL REPORT 2012
NOTES TO THE FINANCIAL STATEMENTS (Contd.)
28. RISK MANAGEMENT POLICIES (Contd.)
28.3. Credit risk (Contd.)
28.3.1. Liquidity risk management
Liquidity risk is the risk that cash may not be available to settle obligations when due, at a reasonable cost. The primary liquidity risk of the Group is its obligation to pay vendors as they fall due. Management has built an appropriate liquidity risk management framework for the Group’s short, medium and long-term needs. The Group manages liquidity risk by monitoring forecast and actual cash flows and by maintaining credit facilities from banks. Refer note 22 for details of the bank credit facilities the Group has.
The table below analyses the Group’s financial liabilities that will be settled on a net basis into relevant maturity groupings based on the remaining period at the end of reporting period to the contractual maturity date. The amounts disclosed in the table below are the contractual undiscounted cash flows.
All figures in Sh’000 Less than Between Over 1 month 1 -3 months 3 months Total
At 31 December 2012 Related party loan - - 353,269 353,269 Trade payables 423,081 2,314,330 256,488 2,993,899 423,081 2,314,330 609,757 3,347,168
At 31 December 2011 Related party loan - - 337,430 337,430 Trade payables 1,106,857 1,149,839 983,130 3,239,826 1,106,857 1,149,839 1,320,560 3,577,256
28.3.2. Interest rate risk
Interest rate risk arises primarily from investment in fixed interest securities and bank borrowings. The Group has adequate cash for working capital purposes and exposure to interest rate risk as a result of borrowings will arise if in future the Group does not have adequate cash to meet short term contingencies and is required to use external sources of funds. The potential impact of 1% increase or decrease in interest rate on profitability of the company would have been an increase or decrease of Sh 9,709,030 (2011: Sh 19,711,000)
28.3.3. Foreign currency risk
The Group’s operations are predominantly in Kenya where the currency has been fluctuating against the major convertible currencies. A portion of the Group’s purchases and sales are denominated in foreign currencies principally in US dollars. The Group does not hedge its foreign currency risk. This risk is insignificant.
There has been no change to the Group’s exposure to market risks or the manner in which it manages and measures the risk.
At 31 December 2012, if the average exchange rate for the year was 5% higher or lower, the profit before taxation would have increased or decreased by approximately Sh 32,324,500 (2011: Sh 30,547,000).

55
SCANGROUP ANNUAL REPORT 2012
NOTES TO THE FINANCIAL STATEMENTS (Contd.)
29. SEGMENTAL REPORTING
The disclosure requirements of IFRS 8 Operating Segments are not applicable to the Group. IFRS 8 requires operating segments to be identified on the basis of internal reports about components of the Group that are regularly reviewed by the Chief Operating Decision Maker (CODM) in order to allocate resources to the segments and to assess performance. Thus, under IFRS 8, the major reporting segment is Advertising and Media Investment Management. This is the information which has been reported in these financial statements. Refer note 3.
30. INCORPORATION
The company is domiciled and incorporated in Kenya as a limited company under the Companies Act.
31. CURRENCY
These financial statements are prepared in Kenya Shillings in thousands (Sh’000).

56
SCANGROUP ANNUAL REPORT 2012
NOTES

www.scangroup.biz