scanning electrochemical microscopy. 14. scanning...
TRANSCRIPT
J. Phys. Chem. 1992, 96, 5035-5045 5035
(29) Novakovi, J.; Kubelkovi, L.; Dolejkk, Z. J . Mol. Card. 1988, 45,
(30) Salvador, P.; Kladings, W. J . Chem. SOC., Faraday Trans. 1 1977,
(31) Derouane, E. G. Zeolites 1982, 2, 42. (32) Bronnimann, C. E.; Maciel, G. E. J . Am. Chem. Soc. 1986,108,7154. (33) Kazansky, V. B.; Senchenya, I. N . J . Caial. 1989, 119, 108. (34) Thomas, C. L. Ind. Eng. Chem. 1949,41,2564 and referen- therein, (35) Anderson, M. W.; Barrie, P. J.; Klinowski, J. J . Phys. Chem. 1991,
(20) Ho&var, S.; Drzaj, B. J . Card. 1982, 73, 205. (21) Ghosh, A. K.; Curthoys, G. J. Caral. 1984, 86, 454. (22) Chang, C. D.; Chu, C. T.-W.; Socha, R. F. J . Coral. 1984,86,289. (23) Beaumont, R.; Barthomeuf, D. J. Cafal. 1972.26, 218. (24) van den Berg, J. P. Ph.D. Thesis, Eindhoven, 1981. (25) Nwak&, J.; Kubelkovi, L.; D0lejk.k Jini, P. Collect. Czech. Chem.
(26) Dass, D. V.; Martin, R. W.; Odell, A. L. J . Cafal. 1987, 108, 153. (27) Rakoczy, J.; Sulikowski, B. React. Kinel. Caral. Lett. 1988,36,241. (28) Novakovi, J.; Kubelkovi, L.; DolejSek, J . Card. 1987, 108, 208.
365.
73, 1153.
Commun. 1979, 44, 3341.
95, 235.
Scanning Electrochemical Microscopy. 14. Scanning Electrochemical Microscope Induced Desorption: A New Technique for the Measurement of Adsorption/Desorption Kinetics and Surface Diffusion Rates at the Solid/Liquid Interface
Patrick R. Unwint and Allen J. Bard* Department of Chemistry and Biochemistry, The University of Texas at Austin, Austin, Texas 78712 (Received: November 6, 1991; In Final Form: March 2, 1992)
Scanning electrochemical microscope induced desorption (SECMID) is introduced as a new technique for the measurement of adsorption/desorption kinetics and surface diffusion rates at the solid/liquid interface, which is generally applicable to the study of reversible processes involving electroactive adsorbates. The method utilizes the ultramicroelectrode (UME) probe of a scanning electrochemical microscope, located close to the sample surface, to perturb the equilibrium of the solid/liquid interfacial adsorption/desorption process under investigation and to measure the resulting flux of adsorbate desorbing from the surface. This is achieved through the application of a potential step to the UME such that the solution component of the adsorbate is electrolyzed at a diffusion-limited rate. The resulting UME current is a measure of the rate of diffusion through solution, the adsorption/desorption kinetics, and the rate of surface diffusion. A theoretical treatment of the chronoamperometric (current-time) response of SECMID is developed, and experimental strategies for obtaining both a&rption/desorption kinetics and surface diffusion rates are delineated. Particular emphasii is given to the a&rption/desorption of H+ on hydrous metal oxides. The applicability of the technique is illustrated with experiments on the adsorption/dwrption of H+ on rutile (001) and aluminosilicate, albite (NaA1Si308), (010) surfaces.
Iatroduction Adsorption/desorption processes and surface diffusion are key
steps in the general scheme of reactions at the solid/liquid in- terface,' and thus dynamic measurements of their rates are of fundamental importance in understanding a variety of interfacial reactions in the physical2 and biological3 sciences. Although a number of techniques are available for measuring adsorption/ desorption kinetics at the electrode/electrolyte interface? kinetic measurements of the elementary steps involved in such processes on insulating materials in contact with liquids are more difficult, and comparatively few studies in this area have therefore been rep~rted.~g' Notable exceptions include the use of relaxation methods,2b-6 employing either pressure jump or electric field pulses, and the stopped-flow technique' for kinetic measurements on suspensions of powdered material. Additionally, total internal reflection fluorescent methods have been used to study adsorp- tion/desorption kinetics and surface diffusion rates of fluores- cent-labeled molecules at the solid/liquid
Relaxation methods have provided useful insights into the mechanisms of a number of rapid adsorption/desorption pro- cesse~.~~-~ However, since, in general, this approach can only be applied to adsorbents in the form of suspensions, which comprise various crystal faces (and amorphous material), the measured characteristics represent an average of the behavior of individual faces, possibly with very different adsorptive characteristics. This is in marked contrast to surface studies a t both the electrode/ electrolyte9 and gas/solidIo interfaces, where well-defined surfaces (e&, single crystals) are often used. The aim of this paper is to introduce a new technique, scanning
electrochemical microscope induced desorption (SECMID), which
Present address: Department of Chemistry, University of Warwick, Coventry CV4 7AL, U.K.
0022-365419212096-5035$03.00/0
permits dynamic measurements of rapid adsorption/desorption processes involving an electroactive species at the solid/liquid interface and, in principle, adsorbate surface diffusion rates. The technique complements a recently proposed strategy for equilib- rium adsorption measurements involving ultramicroelectrode voltammetry in small volumes of solution deposited on macroscopic ads0rbents.I I
The principles of SECMID are outlined, and a theoretical treatment of the method is developed. Particular emphasis is given to H+ adsorption/desorption on hydrous metal oxides, since surface acidity is a significant field in solid/liquid interfacial adsorption.I2 Studies of H+ adsorption/desorption on both the (001) surface of rutile (Ti02) and the (010) surface of the mineral albite (NaAlSi308) serve to illustrate the applicability of the technique. The generalization of the following treatment for other chemical systems should be straightforward.
Principles of SECMID The scanning electrochemical microscope13 (SECM) is a
scanning probe instrument, employing an ultramicroelectrode tip (UME; a disk with a diameter typically in the range 1-25 pm), which can provide local (micron or sub-micron resolution) in- formation about the reactivity and topography of a variety sample substrate^.'^
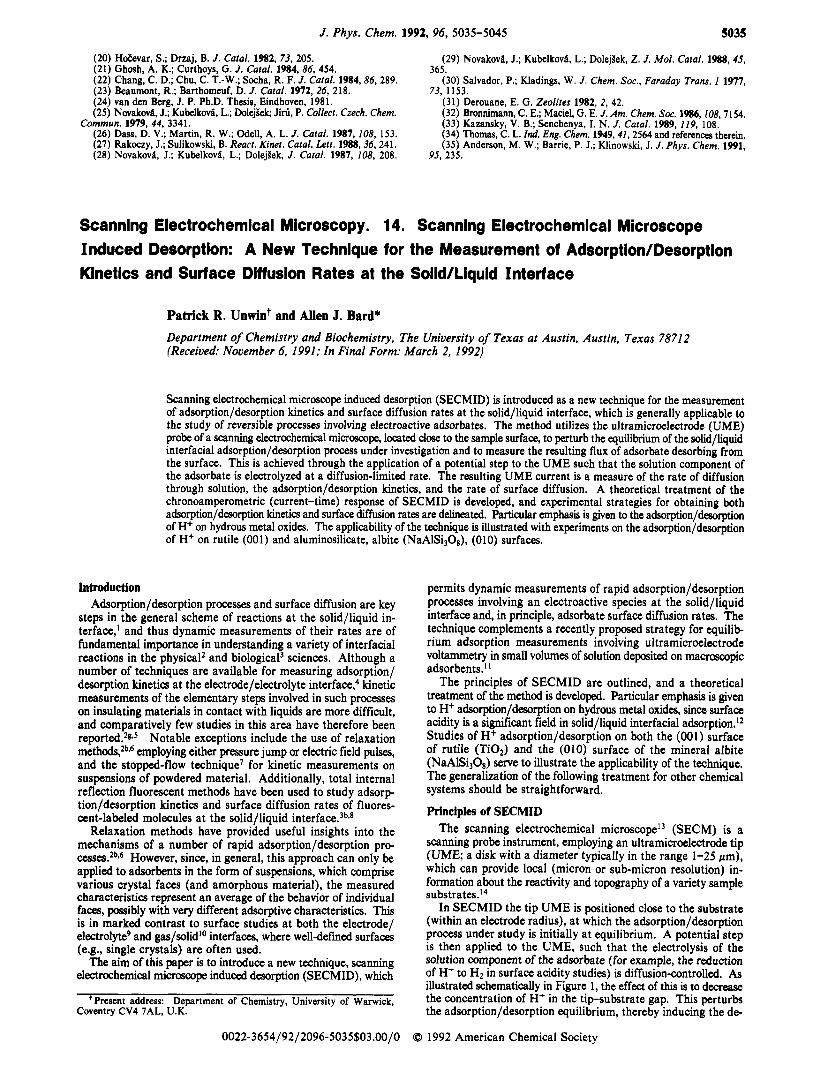
In SECMID the tip UME is positioned close to the substrate (within an electrode radius), at which the adsorption/desorption process under study is initially a t equilibrium. A potential step is then applied to the UME, such that the electrolysis of the solution component of the adsorbate (for example, the reduction of H+ to H2 in surface acidity studies) is diffusion-controlled. As illustrated schematically in Figure 1, the effect of this is to decrease the concentration of H+ in the tipsubstrate gap. This perturbs the adsorption/desorption equilibrium, thereby inducing the de-
0 1992 American Chemical Society
5036 The Journal of Physical Chemistry, Vol. 96, No. 12, I992 Unwin and Bard
The latter condition is a good approximation for r,/a 1 10.’6J7 The boundary condition at the substrate depends upon the
nature of the adsorption/desorption process and whether or not adsorbate surface diffusion needs to be considered. A number of models have been proposed for acid-base reactions at hydrous metal oxides.I2J8 The most common of these represents the surface in terms of diprotic acid groups which undergo the fol- lowing reactions:
(7)
SMOH e SMO- + H+ (8) We adopt this model since: (i) it has been widely appliedI2 and (ii) under the conditions of the experiments reported in this paper, only the first process (eq 7) is important. This has the merit of minimizing the number of variables involved in modeling SEC- MID experimental data (see below). Several variants of a onepK model have also recently been proposed,18 the most comprehensive of which involves multisite adsorption.’8c-d For the conditions (interfacial pH) of our experiments on rutile protonation, this model would require two adsorption sites to be considered, and thus a greater number of variables would be involved in modeling the experimental data. Although a simple onepK model has been demonstrated to describe equilibrium adsorption data for rutile,lsb it has not been widely adopted and does not appear to offer any advantages over the diprotic model under the conditions of the experiments reported here. It is also possible to consider the formation of surface complexes involving the supporting electrolyte
However, this is not necessary with the (diffuse layer) model of the metal oxide/solution interface which we adopt (see below) I
The acidity constants (written in terms of concentration, rather than activity, since the work reported here is at constant ionic strength) for eqs 8 and 9 are given by
SMOH + H+ * ,MOH2+
1 z
Z=O
- 1
I I I Ht
adsorption / 11 11 j desorption I surface I
H+ diffusion H+
Metal oxide single crystal substrate I r ! z=d
Figure 1. Principles of SECMID: schematic of the transport processes in the tip-substrate domain, for a reversible adsorption/desorption pro- cess at the substrate, following the application of a potential step at the tip UME to a region where the reduction of H+ is transport-controlled. The notation used to define the tip-substrate geometry is indicated.
sorption of H+ from the sample surface, and it promotes the diffusion of H+ from the surrounding solution into the gap region. Additionally, since the desorption process depletes the concen- tration of adsorbed H+ on the substrate directly under the UME, a radial concentration gradient in adsorbate develops across the substrate surface and thus surface diffusion can also provide a path for the transport of H+ into the gap domain.
In a sense, SECMID can be considered as the solid/liquid interface analogue of laser-induced desorption,ls widely used to measure desorption and surface diffusion rates at the gas/solid interface. In SECMID, the flux of H+ at the tip UME, and hence the current-time behavior, following the potential step is a measure of the rates of desorption, adsorption, solution diffusion, and surface diffusion and, as will be demonstrated below, can be used to obtain information about the individual rates of each of these processes.
Theory Formulation of the SECMID hoblem. To calculate the tip
current response, the SECM diffusion equation (in cylindrical coordinates) requiring solution is of the form
where rand z are, respectively, the coordinates in the directions radial and normal to the electrode surface, starting at its center, and t is time; D,,, and c are the diffusion coefficient and con- centration of the species of interest in solution (in this case H+), respectively. Since the UME reaction product, dissolved H2, is inert, this species can be ignored. Prior to the potential step, the concentration of adsorbate in solution is at the bulk solution value, c*, over all space, and so the initial condition is
(2) t = 0, all r, all z: c = c*
Following the potential step ( t > 0) the boundary conditions at the tip surface are
z = O , O I r I a : c = O (3)
(4)
where a denotes the electrode radius and r, the radial distance from the center of the disk to the edge of the insulating sheath surrounding the electrode. Additional conditions define zero radial flux at the axis of symmetry and the recovery of the bulk con- centration of the species beyond the radial edge of the tipsubstrate domain:
( 5 )
r > r , , O < z < d c = c * ( 6 )
z = 0, a I r I r,: DSol(ac/az) = 0
r = 0, 0 < z < d Dm,(ac/ar) = 0
and
KalaW and Ka2aPP are apparent acidity constants which, in general, depend upon the degree of surface ionization, i.e., the resulting surface charge density and corraponding surface potential. These constants can be written in terms of intrinsic constants, Kali and KaZi, which are independent of the degree of ionization, and an exponential term, which accounts for the effect of potential, as in eqs 10 and 12. In these latter equations, rl, denotes the potential at the plane of adsorption, F is the Faraday constant, R is the gas constant, and T i s temperature.
The theoretical treatment here considers the situation where surface charge effects are important and also conditions under which they can be neglected. In the former case it is necessary to adopt a model for the electrical nature of the interface. Several models have previously been proposed for the metal oxide/aquaus interface, and their respective suitabilities have been a matter of considerable debate.I2 Here we consider the diffuse layer model (DLM)I2v2O for which the surface charge density-potential rela- tionship is analogous to the Gouy-Chapman model (GCM) of the electrode4ectrolyte interface:l but the fmed number of sites implicit in the protonation/deprotonation (adsorption/desorption) reaction limits the surface charge density which can build up on the oxide surface and is not a part of the GCM. The effect of this is to restrict ion concentrations in the diffuse layer near the oxide surface, even at moderate to high ionic strengths.I2j Thus, although the model is generally applied to low ionic strength media, it can be used at supporting electrolyte concentrations up to 0.1 M,IZd as in the studies reported in this paper.
The main reason for selecting the DLM, as opposed to the altematives,I2 is that with this model the oxide/solution interface
Scanning Electrochemical Microscopy
is described by a unique set of (a few) parameters,lU all derivable from equilibrium surface acidity measurements,’2j without the need for the arbitrary assignment of parameters as in the other mod- e1s.12dJ8a Moreover, the DLM generally simulates equilibrium data for the surface acidity of hydrous metal oxides as well as other models12bJ and has beem shown to be particularly applicable to Ti02 over a wide range of solution ionic strengths.’2d
For a 1: 1 electrolyte, the charge density-potential relationship for the GCM (DLM) is21
(13)
where a, is the charge density, c is the dielectric constant, eo is the permittivity of free space, and I is the ionic strength of the solution.
For the systems of interest, and experimental conditions utilized in this paper, only the first ionization process is important, i.e.
u, = (8~e&TI)l /~ sinh (F$,/2RT)
Ka1”P[H+] >> Ka2”p/[H+] (14)
and thus the surface charge density depends upon the surface concentration of H+ only, Le., [MOH2+]
U, = F[MOH2+] (15)
= FBN (16)
where 0 is the fractional surface coverage of H+ and N is the maximum density of adsorption sites.
For the adsorption/desorption process, eq 7, the form of the substrate boundary condition (assuming Langmuirian charac- teristics) is
z = d, 0 < r < r,: D(dc/dz) = -kdaPP@ + k/ppC(1 - 0) (17)
and the time dependence of 0 is
z = d, 0 < r < r,: N(d@/dt) = --kdaPPe + k,BPPC(l - e) (18)
where k/PP (cm s-I) and kdaPP (mol cm-2 s-I) are the apparent adsorption and desorption rate constants which, in terms of in- trinsic parameters, are written as
k,BPP = k,’ exp(-F$,/2RT) (19)
kd”PP = kdi exp(F*0/2RT) (20)
Prior to the potential step, eq 7 is at equilibrium, and thus the corresponding initial substrate condition is t = 0: substrate (0 < r < r,): 8 =
KaIaPPC*/(l + KalaPP~*) (21)
When surface diffusion of the adsorbate operates in addition to adsorption/desorption, the following transport equation applies to the substrate, rather than eq 18 z = d, 0 < r < r,: N(ae/at) = NDsUr[a2O/a9 + (1 /r)(ae/ar)] - kdaPPe + k,appC(i - e) (22)
where D,,, is the surface diffusion coefficient of the adsorbate. Equation 22 has the following associated conditions:
substrate: r = 0: ae/ar = 0 (23)
substrate: r > r,: 0 = KaIapPc*/(l + KalaPPc*) (24)
In writing the surface diffusion process as in eq 22, we assume that D,,, is direction-independent. The flux of material from the surface for this case is again given by eq 17.
The quantity to be determined from the calculations is the UME current
i = nFD,,~a2~r(ac/a~) , , , dr (25)
as a function of time, where n is the number of electrons involved in the electrolysis of the analyte (n = 1 for H+ reduction).
The Journal of Physical Chemistry, Vol. 96, No. 12, 1992 5037
Method of Solution. To obtain general solutions to the problems outlined above, a dimensionless formulation was achieved through the introduction of the following normalized variables:
7 = tD,,/a2 (26) c = c/c*
R = r/a
Z = z / a (29)
KCPP = k,BPPa / Dsol (30)
KdaPP = kdaPPU/D,lC* (31)
y = N/c*a (32)
DR = Dsur/Dsol (33) Thus eqs 1, 18, 21, 22, and 24 become, respectively,
(34)
0 < R < R,: y(d0/d7) = -KdaPPe + K/PPCz=L(l - e) (35)
7 = 0: substrate: 0 < R < R,: 0 = [1 + (K/PP/K,jaPP)]-’ (36)
o < R < R,: y(ae/a7) = DRy[a28/aR2 + (1 /R)(ae/aR)] - KdaPPo + KzPPCzl~( 1 - e)
substrate: R > R,: 0 = [ l + (K,BPP/KdaPP)]-’ (38)
where R, = r, /a and L = d/a. The forms of the remaining boundary and initial conditions should be evident. The UME current, eq 25, is conveniently normalized by the steady-state current at a simple micrcdisk electrode22
(37)
iT,- = 4nFDSolac* (39)
to give 1
i/iT,- = (T/2)J (ac/aR),=, dR (40)
Numerical solutions to the problems were achieved via the alternating direction implicit (ADI) finite difference method.23 It is beyond the scope of this paper to provide a detailed description of the method as applied to the particular problems under con- sideration; general details on the solution of SECM problems with the AD1 method are given e l~ewhere . ’~ ,~~ For the adsorption/ desorption process, the modifications to the general AD1 algor- ithmI7 are relatively straightforward. The addition of substrate surface diffusion to the problem was handled by adopting an implicit treatment of this process, coupled with the general AD1 approach.
Theoretical Results The normalized current-time response in SECMID depends
upon the dimensionless tip-substrate distance, L = d/a , and the parameters K/PP, KdaPP, y, and DR. The aim here is to illustrate the general effects of these terms on the current response and hence identify the most suitable approach for the experimental deter- mination of adsorption/desorption kinetics and surface diffusion rates via SECMID. To simplify matters, substrate surface po- tential effects are neglected in this section, i.e., $o = 0; kaaPP = ki; kdaPP = k i in eqs 30 and 31.
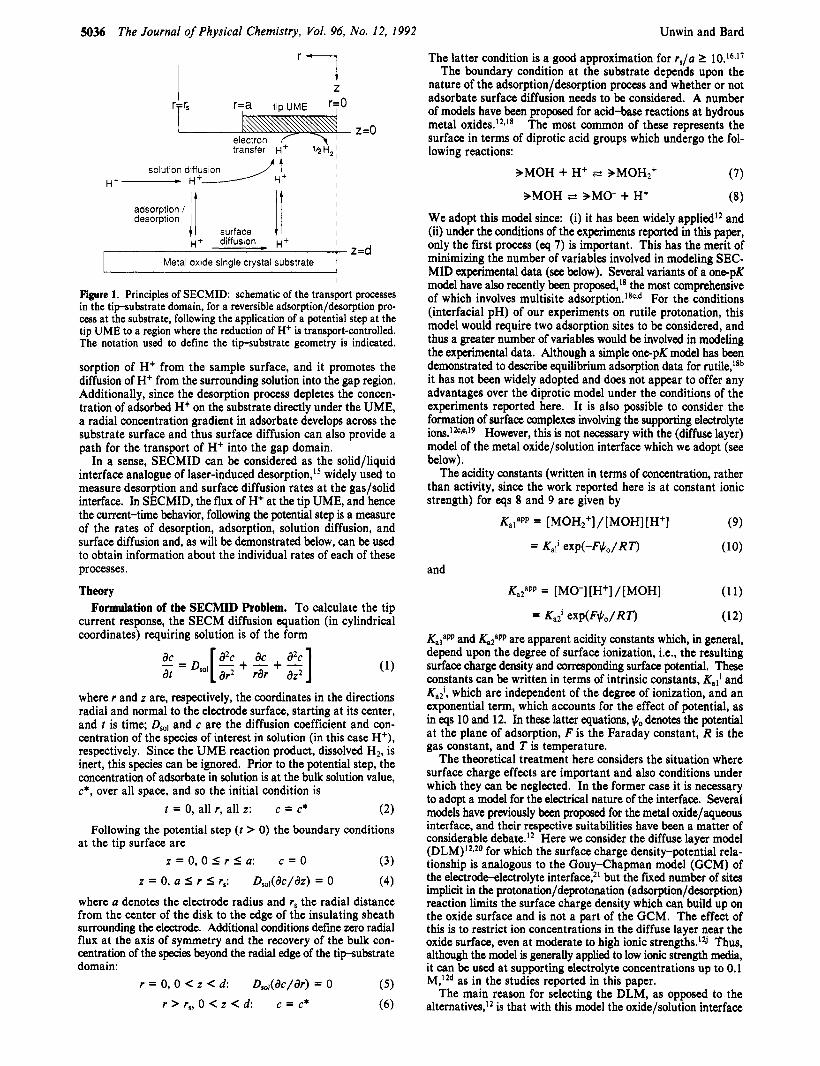
SECMID Current-Time Characteristics in the Absence of Surface JMbii The current-time behavior (presented as i/iT,.. versus both 7 and d2 to emphasize, respectively, the long- and short-time time behavior) for typical parameter values of log (15) = -0.5, R, = 10, y = 8 (e.g., N/c* = 0.01 cm for a = 12.5 pm), 4 = 0, and KaaPP/KdaPP = 1 (i.e., initially half of the surface sites are occupied), with KaaPP = 0.1, 1.0, 10, 100, 1000, are shown in
5038 The Journal of Physical Chemistry, Vol. 96, No. 12, 1992 Unwin and Bard
2.0
1Og(KiPp I = 3 , 2, 1, 0, -1
0.0 ~ I I I I I I 0 . 1 0 . 2 0 . 30. 40. 5 0 . 60
T - tDSol/a2
4.0 * ' O 1 (b)
0.0 j I I I I I 0 . 2. 4. 6 . 8. 10.
(T - tDSol/a2 ) - ' I 2
Figure 2. Theoretical dimensionless chronoampcrometric characteristics, displayed as a function of (a) 7 and (b) d2, for a substrate adsorp- tion/desorption process characterized by y = 8, K:W/KJm = 1, with various values of K," (solid lines). The behavior for an inert substrate is indicated by the dashed lines. SECM parameters: log (L) = -0.5; R, = 10.
Figures 2a and 2b along with the corresponding behavior for an inert substrate. At the shortest times (i.e., largest shown, the current response is identical for both the inert substrate and the various kinetic cases considered. This is a general effect in chronoamperometric SECM'7,25 and arises because the tip does not begin to sense the presence of the substrate (nor any of the processes occuring at its surface) until the size of the UME diffusion field is of the order of the dimension of the gap. Thereafter, the chronoamperometric behavior is sensitive to the magnitude of KdaPP and KaaPP, as illustrated in Figure 2.
For small KdaPP and K/PP (K/PP = KdaPP = 0.1 in Figures 2a and 2b), the adsorption/desorption kinetics are slow compared to the rate of diffusional mass transport; the response of the adsorption/desorption process to the perturbation (depletion) in the concentration of the solution component of the adsorbate adjacent to the substrate/solution interface is sluggish, and thus the current-time behavior is close to that predicted for an inert substrate. For faster adsorption/desorption processes the response to the perturbation in the interfacial equilibrium is more rapid, the resulting desorption process provides an additional source of H+ for electrolysis, and thus the current in the short-time regime is larger than for an inert substrate. For a given value of y, the faster the adsorption/desorption kinetics, the larger is the current at short times, up to the limit where the kinetics are sufficiently fast that the adsorption/desorption process is essentially always at equilibrium on the time scale of the SECM measurements. For the case in Figures 2a and 2b, this l i t is reached at around KtPP = KdSPP = 1ol)O.
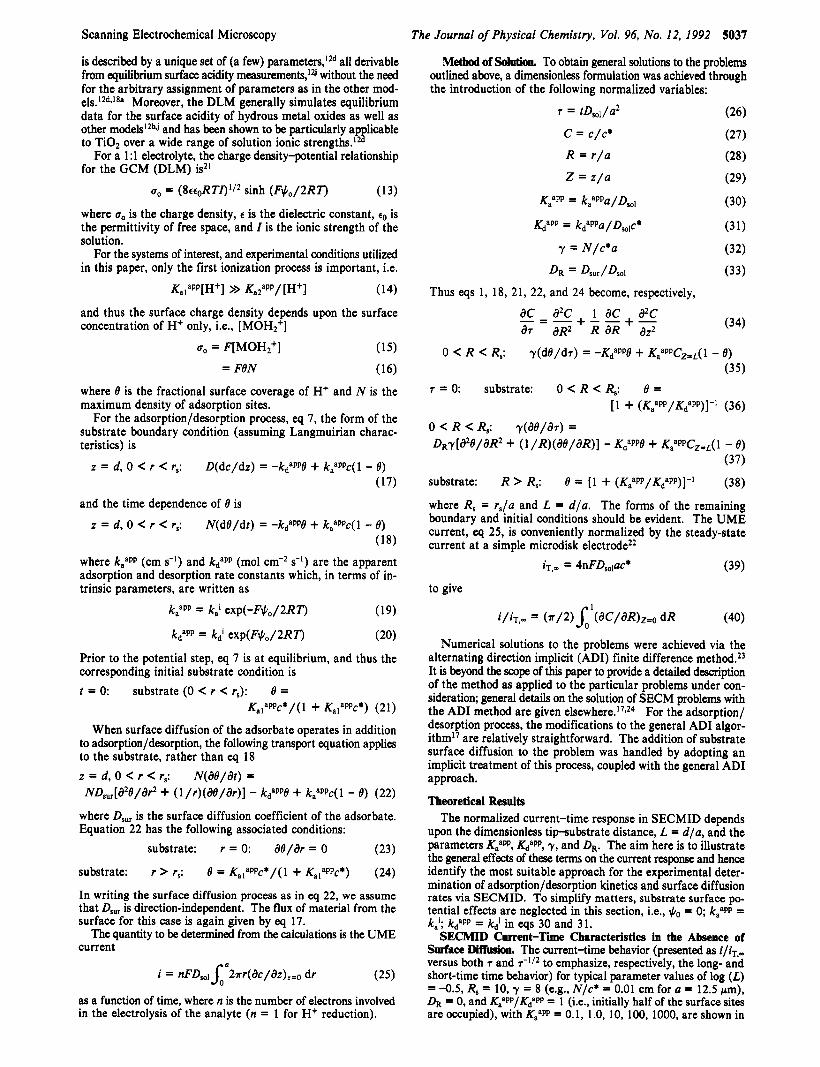
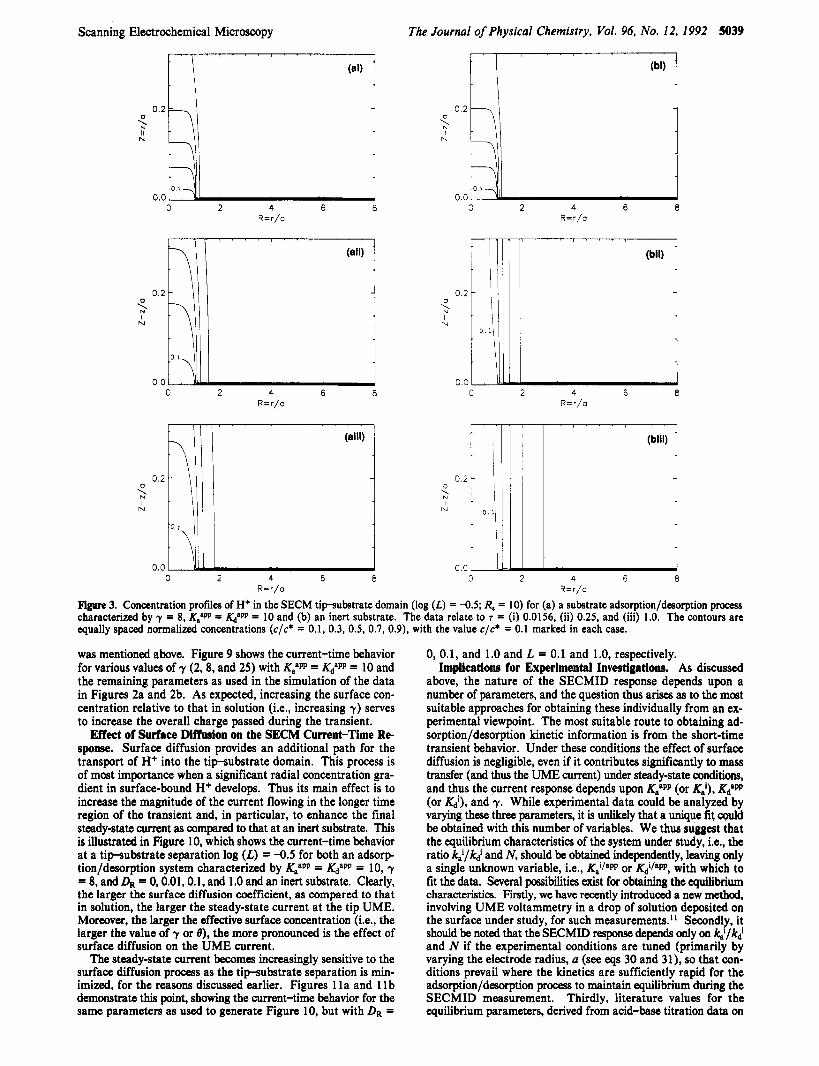
The effect of the desorption process, in increasing the flux of material to the UME, is clearly observed in Figure 3, which shows the concentration profiles near the tip in the tipubstrate domain, at various times following the potential step, for both an inert
insulator and a substrate at which the adsorption/desorption system defined above occurs, with KanPP = = 10. At times less than, or on the order of, the tipsubstrate diffusion time, the concentration profiles for the two cases are almost identical for the reason discussed above. This is clearly illustrated in Figures 3ai and 3bi for the case of T = 0.0156 ( r d 2 = 8). At this time the concentration at the substrate/solution interface is close to the initial bulk value, and so there is little perturbation of the adsorption/desorption equilibrium. At longer times, when the concentration of adsorbate in solution is drastically depleted, the contribution to the flux (and hence current) at the UME from interfacial desorption becomes significant; compare Figures 3aii and 3aiii with Figures 3bii and 3biii, respectively, which show the profiles for the two defined cases at T = 0.25 and 1 (?-'I2 = 2 and 1).
Note that although fast desorption kinetia produce the largest UME current at relatively short times, processes characterized by slower kinetics can produce larger currents in the longer time regime. This is illustrated in Figure 2a where, for example, the current for KaaW = 0.1 is lower than for the other kinetic cases at short times, but higher at longer times. This behavior is ex- plained by the fact that fast desorption leads to the rapid removal of adsorbate from the sample, while for slower processes a sig- nificant amount of material remains available for desorption at long times. Figures 4a and 4b illustrate this point, showing the spatiotemporal dependence of adsorbate surface coverage (e) for KaaPP
At times sufficiently long for a true steady-state to prevail (typically T > 200), the UME currents for all kinetic cases attain the value for an inert insulating substrate; the adsorption/de- sorption process reaches a new equilibrium (governed by the local solution concentration of H+ adjacent to the substrate/solution interface) and the tip current depends only on the rate of diffusion of H+ through solution.
Processes involving much lower surface coverages than con- sidered above can also be studied with SECMID (if the kinetics are sufficiently fast). The normalized current-time characteristics for K:PP/KdaPP = 0.1 (Le., BTpo = 0.091) with KaaPP = 0.1, 1.0, 10, and 100, and the other parameters as defmed above, are shown in Figure 5 . In this case the lower initial surface coverage leads to currents for the various kinetic cases approaching the value for an inert substrate more rapidly. However, the various kinetic cases can be distinguished in the short-time region. Figure 6 shows the simulated i/iT,w - r-I/* behavior for an adsorptionldesorption system characterized by K,8PP/haW = 0.01 (i.e., eT4 < 0.01), with the other parameter values as previously defined. Even with such a low initial surface concentration, the various kinetic cases give different responses, although resolving these experimentally re- quires measurements of high precision. As expected, the UME current response becomes increasingly
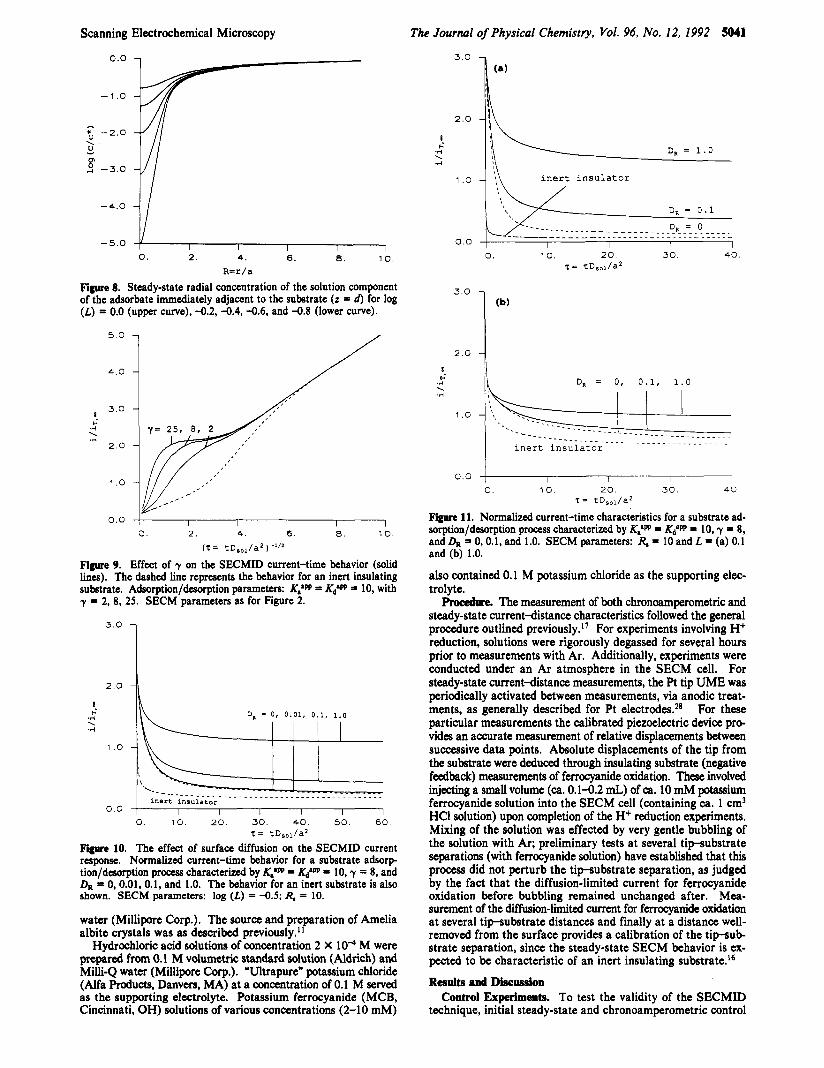
sensitive to the surface processes as the tipsubstrate separation is minimized, since the effect of this is both to hinder solution diffusion into the gap and maximize the ratio of effective substrate surface area to solution volume probed by the technique. Figures 7a and 7b illustrate this point, showing the i/iT,w - 7-II2 behavior for an adsorption/desorption system defined by K/PP/KdaPP = 1, y = 8, and DR = 0 with various values of KaaPP at log (d /a ) -- -1 and 0, respectively. In general, the closer the tip is located to the substrate, the greater is the depletion of the solution com- ponent of the adsorbate adjacent to the substrate, and thus the larger is the overall perturbation to the adsorption/desorption equilibrium (and thus the quantity of material desorbed). This point is well-illustrated by Figure 8, which shows the steady-state radial concentration profile of adsorbate in solution, adjacent to the substrate, at various tipsubstrate separations. If close tip substrate separations can be achieved (e.g., log (L) = -0.8), the local solution concentration adjacent to the substrate surface can change by over 5 orders of magnitude, in certain regions, as compared to the (initial) bulk value.
The effective surface concentration depends on both the density of adsorption sites (Le., the value of 7 ) and their occupancy (8). The influence of the initial value of 8 on the current-time response
= 0.1 and 10, respectively.
Scanning Electrochemical Microscopy
I ' / ' ' I ' ' ' I ' ' ' , ' ' ' I
The Journal of Physical Chemistry, Vol. 96, No. 12, 1992 5039
I
0 2 4 6 0 R=r/o
0 2 4 6 8 R=r/o
l ' l 1 1 " " ' " " " ' " i
0 2 4 6 8 R=r/a
0 2 4 6 8 R=r/a
0
5 N
0
R=r/a R=r/a
Figure 3. Concentration profiles of H+ in the SECM tipubstrate domain (log (L) = -0.5; & = 10) for (a) a substrate adsorption/desorption process characterized by y = 8, KCW = KdaPP = 10 and (b) an inert substrate. The data relate to 7 = (i) 0.0156, (ii) 0.25, and (iii) 1.0. The contours are equally spaced normalized concentrations (c/c* = 0.1, 0.3, 0.5, 0.7, 0.9), with the value c/c* = 0.1 marked in each case.
was mentioned above. Figure 9 shows the current-time behavior for various values of y (2,8, and 25) with KtPP = KJPP = 10 and the remaining parameters as used in the simulation of the data in Figures 2a and 2b. As expected, increasing the surface con- centration relative to that in solution (Le., increasing y) serves to increase the overall charge passed during the transient.
Effect of Surface Diffusion on the SECM Current-Time Re- sponse. Surface diffusion provides an additional path for the transport of H+ into the tipsubstrate domain. This process is of most importance when a significant radial concentration gra- dient in surface-bound H+ develops. Thus its main effect is to increase the magnitude of the current flowing in the longer time region of the transient and, in particular, to enhance the final steady-state current as compared to that at an inert substrate. This is illustrated in Figure 10, which shows the current-time behavior at a tipsubstrate separation log (L) = -0.5 for both an adsorp- tion/desorption system characterized by KtPP = Kd"PP = 10, y = 8, and & = 0,0.01,0.1, and 1.0 and an inert substrate. Clearly, the larger the surface diffusion coefficient, as compared to that in solution, the larger the steady-state current at the tip UME. Moreover, the larger the effective surface concentration (i.e., the larger the value of y or e), the more pronounced is the effect of surface diffusion on the UME current.
The steady-state current becomes increasingly sensitive to the surface diffusion process as the t ipubstrate separation is min- imized, for the reasons discussed earlier. Figures 1 l a and 1 lb demonstrate this point, showing the current-time behavior for the same parameters as used to generate Figure 10, but with DR =
0, 0.1, and 1.0 and L = 0.1 and 1.0, respectively. Implications for Experimental Investigations. As discussed
above, the nature of the SECMID response depends upon a number of parameters, and the question thus arises as to the most suitable approaches for obtaining these individually from an ex- perimental viewpoint. The most suitable route to obtaining ad- sorption/desorption kinetic information is from the short-time transient behavior. Under these conditions the effect of surface diffusion is negligible, even if it contributes significantly to mass transfer (and thus the UME current) under steady-state conditions, and thus the current response depends upon KtPP (or K:), KdaP (or K i ) , and y. While experimental data could be analyzed by varying these three parameters, it is unlikely that a unique fit could be obtained with this number of variables. We thus suggest that the equilibrium characteristics of the system under study, Le., the ratio C/&i and N, should be obtained independently, leaving only a single unknown variable, Le., KilpPP or KilaPP, with which to fit the data. Several possibilities exist for obtaining the equilibrium characteristics. Firstly, we have recently introduced a new method, involving UME voltammetry in a drop of solution deposited on the surface under study, for such measurements." Secondly, it should be noted that the SECMID response depends only on &/hi and N if the experimental conditions are tuned (primarily by varying the electrode radius, a (see eqs 30 and 31), so that con- ditions prevail where the kinetics are sufficiently rapid for the adsorption/dmrption process to maintain equilibrium during the SECMID measurement. Thirdly, literature values for the equilibrium parameters, derived from acid-base titration data on

5040 The Journal of Physical Chemistry, Vol. 96, No. 12, 1992 Unwin and Bard
Figure 4. Spatiotemporal dependence of adsorbate surface coverage (e) for a substrate adsorption/desorption process characterized by the equilibrium and SECM parameters defined for Figure 2 and K, = (a) 0.1; (b) 10. In both cases the shortest time data is for 7 = 1.0.
5.0
4.0
3.0 <
4 \
-ti 2.0
1 .o
0.0
0 . 2. 4. 6. 8. 1 0 .
('5 = t D s o l / a 2 ) -'I2
Figure 5. Theoretical dimensionless current-time characteristics for a substrate adsorption/desorption process characterized by y = 8 and K,"pp./&'pp = 0.1, with various values of KcPP (solid lines). The dashed line is the behavior for an inert insulating substrate. The SECM pa- rameters are as for Figure 2.
powders, can serve as a useful guide, particularly for reasonably well-characterized adsorbents.
Under steady-state conditions, the adsorption/desorption process is at equilibrium, and thus the UME current depends on the solution and surface diffusion rates. Such measurements clearly provide a means of assessing the importance of surface diffusion in the system under study, if the tip-substrate separation can be determined independently.
Experimental Section Apparatus. The scanning electrochemical microscope, elec-
trochemical cell, Pt disk UME, and associated instrumentation for transient and steady-state measurements were as previously de~cribed.'~ The UME surface was polished to a finish of 0.05 pm with alumina (Buehler Ltd., Lakebluff, IL) and then fashioned into a cone by subsequent polishing to yield a tip with an R, value of either 10 or 20. A two-electrode arrangement was employed
5.0
/
0.0 I 1 I I I 0 . 2. 4 . 6. a. 10.
(7 = t D s , , / a 2 ) - ' I2
Figure 6. Theoretical dimensionless SECMID characteristics with pa- rameters and notation as defined for Figure 5 , except KaaW = &am = 0.01. The behavior for an inert insulating substrate is indicated by the dashed line.
15.0
12.0
9.0 8.
-4 \ -4
6.0
3.0
0.0
3.0
2.0
8 r' -4 \
-4
1 .o
0.0
I 1 1 I I I 0. 5. 1 0 . 15. 20. 25. 30.
('5 = t D s o l / a 2 ) - ' I2
0.0 1 . 0 2 .0 3.0 4.0 5.0 6.0
('5 = t D S o l / a 2 ) - ' I2
Figure 7. The effect of t i p u b s t r a t e separation on the SECMID re- sponse, showing the behavior for L = (a) 0.1 and (b) 1.0, with the eouilibrium substrate adsomtion Idworntion narameters and notation as aerinea ror rigure L. I ne oenavior ror an inert insulating suostrate is indicated by the dashed line.
for all measurements, with a Pt wire serving as a quasi-reference electrode (QRE).
Materials. A rutile single crystal disk of about 5-mm diameter [(Ool) orientation] was obtained from T. E. Mallouk. This was polished to a mirror finish (0.25 pm) with a series of diamond lapping compounds (Buehler Ltd., Lakebluff, IL), a procedure which produces a relatively flat surface.26 The crystal was then cleaned in 0.1 M NaOH in an ultrasonic bath, etched in con- centrated sulfuric acid27 (150 "C for 10-15 min), rinsed in 0.1 M NaOH, and finally vigorously washed with Milli-Q reagent
Scanning
0.0
- 1 ,o
- 5 -2.0 \
P 2 -3.0 -
-4.0
-5.0
Electrochemical Microscopy
i l 0 . 2. 4. 6 . 8 . 10.
R = K / ~
Figure 8. Steady-state radial concentration of the solution component of the adsorbate immediately adjacent to the substrate (z = d) for log (L) = 0.0 (upper curve), -0.2, -0.4, -0.6, and -0.8 (lower curve).
5.0
4.0
3.0
i .-I \ .-I
2.0
1 .o
0.0 I I I I I I
0 . 2. 4. 6. 8 . 10.
(T = tD,,,/a' )
Figure 9. Effect of y on the SECMID current-time behavior (solid lines). The dashed line represents the behavior for an inert insulating substrate. Adsorption/dmrption parameters: K,'W = = 10, with y = 2, 8, 25. SECM parameters as for Figure 2.
3.0
2 . 0
8 i .d \ .-I
1 .o
0.0
Figure 10, response.
I I I I I I I I 0 . 1 0 . 20. 30. 40. 50. 60.
T = tDSol/a2
The effect of surface diffusion on the SECMID current Normalized current-time behavior for a substrate a d s o m
tion/dmrption procegs characterized by K,'W = u" = 10, y = 8, a i d & = 0, 0.01, 0.1, and 1.0. The behavior for an inert substrate is also shown. SECM parameters: log (L) = -0.5; R, = 10.
water (Millipore Corp.). The source and preparation of Amelia albite crystals was as described previously."
Hydrochloric acid solutions of concentration 2 X 10⁻⁴ M were prepared from 0.1 M volumetric standard solution (Aldrich) and Milli-Q water (Millipore Corp.). "Ultrapure" potassium chloride (Alfa Products, Danvers, MA) at a concentration of 0.1 M served as the supporting electrolyte. Potassium ferrocyanide (MCB, Cincinnati, OH) solutions of various concentrations (2-10 mM)
The Journal
3.0
2.0
I i -4 \ .-I
1 .o
0.0
3.0
2.0
I
.-I \
.-I
i
1 .o
0.0
Figure 11.
of Physical Chemistry, Vol. 96, No. 12, 1992 5041
1 '1 i n e r t i n s u l a t o r
0 . 10. 2 0 . T = \tDSol/a2
0.1 ,
30. 40.
1.0 I ;\ I
---------....._...._..____.._ I i n e r t i n s u l a t o r
1
0 . 10. 2 0 . 30. 40. I I I I
7 - tDSol/a2
Normalized current-time characteristics for a substrate ad- so;ption/dtsorption process characterized by K,'W = KdaW = lo, y = 8, and & = 0, 0.1, and 1.0. SECM parameters: R, = 10 and L = (a) 0.1 and (b) 1.0.
also contained 0.1 M potassium chloride as the supporting elec- trolyte. procechw. The measurement of both chronoamperometric and
steady-state current-distance characteristics followed the general procedure outlined previously." For experiments involving H+ reduction, solutions were rigorously degassed for several hours prior to measurements with Ar. Additionally, experiments were conducted under an Ar atmosphere in the SECM cell. For steady-state current-distance measurements, the Pt tip UME was periodically activated between measurements, via anodic treat- ments, as generally described for Pt electrodes.28 For these particular measurements the calibrated piezoelectric device pro- vides an accurate measurement of relative displacements between successive data points. Absolute displacements of the tip from the substrate were deduced through insulating substrate (negative feedback) measurements of ferrocyanide oxidation. These involved injecting a small volume (ca. 0.1-0.2 mL) of ca. 10 mM potassium ferrocyanide solution into the SECM cell (containing ca. 1 cm3 HC1 solution) upon completion of the H+ reduction experiments. Mixing of the solution was effected by very gentle bubbling of the solution with Ar; preliminary tests at several tip-substrate separations (with ferrocyanide solution) have established that this process did not perturb the tip-substrate separation, as judged by the fact that the diffusion-limited current for ferrocyanide oxidation before bubbling remained unchanged after. Mea- surement of the diffusion-limited current for ferrocyanide oxidation at several tipsubstrate distances and finally at a distance well- removed from the surface provides a calibration of the tip-sub- strate separation, since the steady-state SECM behavior is ex- pected to be characteristic of an inert insulating substrate.I6
Results and Mscussion Control Experiments. To test the validity of the SECMID
technique, initial steady-state and chronoamperometric control
5042 The Journal of Physical Chemistry, Vol. 96, No. 12, 1992
1.01
Unwin and Bard
0.4t 4 I' I
0.0 ' i 0 20 40 60 80
dipn
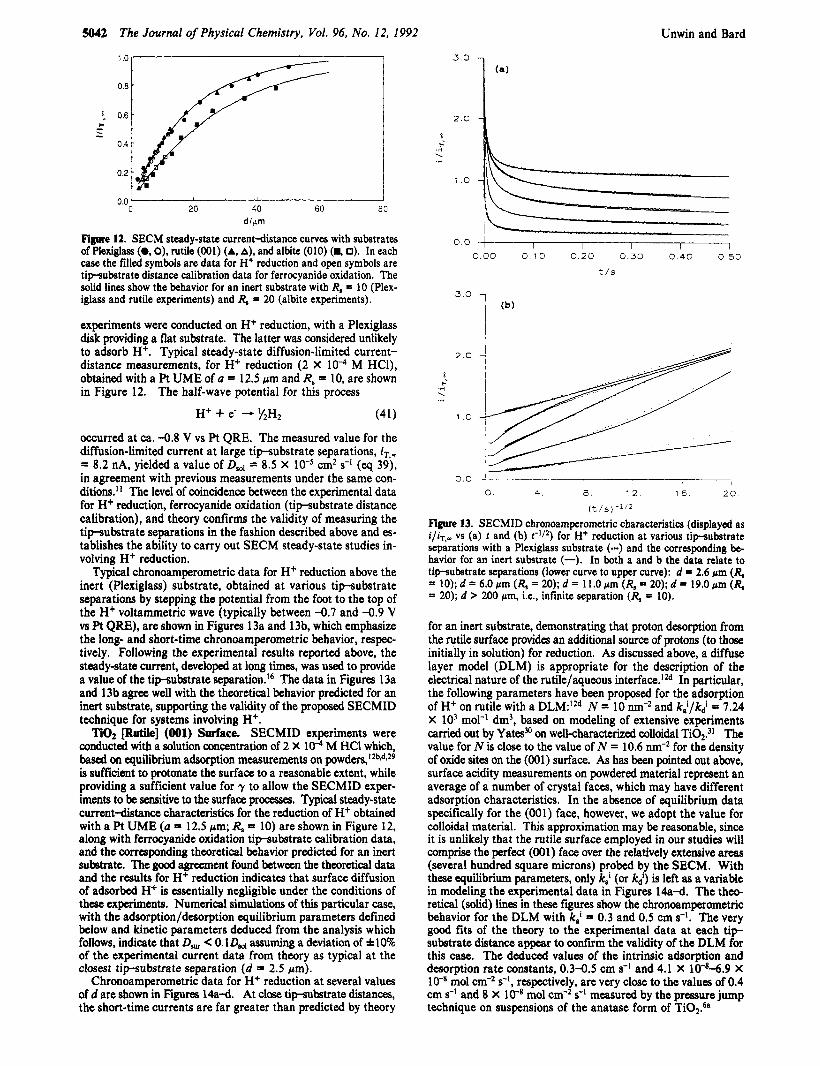
Figure 12. SECM steady-state current-distance curves with substrates of Plexiglas (0, 0), rutile (001) (A, A), and albite (010) (H, 0). In each case the filled symbols are data for H+ reduction and open symbols are tipsubstrate distance calibration data for ferrocyanide oxidation. The solid lines show the behavior for an inert substrate with R, = 10 (Plex- iglass and rutile experiments) and R, = 20 (albite experiments).
experiments were conducted on H+ reduction, with a Plexiglass disk providing a flat substrate. The latter was considered unlikely to adsorb H+. Typical steady-state diffusion-limited current- distance measurements, for H+ reduction (2 X M HCl), obtained with a Pt UME of a = 12.5 Fm and R, = 10, are shown in Figure 12. The half-wave potential for this process
H+ + e- - 1/2H2 (41)
occurred at ca. -0.8 V vs Pt QRE. The measured value for the diffusion-limited current at large tip-substrate separations, iT,- = 8.2 nA, yielded a value of D,, = 8.5 X cm2 S-I (eq 39), in agreement with previous measurements under the same con- ditions." The level of coincidence between the experimental data for H+ reduction, ferrocyanide oxidation (tip-substrate distance calibration), and theory confirms the validity of measuring the tipsubstrate separations in the fashion described above and es- tablishes the ability to carry out SECM steady-state studies in- volving H+ reduction.
Typical chronoamperometric data for H+ reduction above the inert (Plexiglass) substrate, obtained at various tip-substrate separations by stepping the potential from the foot to the top of the H+ voltammetric wave (typically between -0.7 and -0.9 V vs Pt QRE), are shown in Figures 13a and 13b, which emphasize the long- and short-time chronoamperometric behavior, respec- tively. Following the experimental results reported above, the steady-state current, developed at long times, was used to provide a value of the tipsubstrate separation.I6 The data in Figures 13a and 13b agree well with the theoretical behavior predicted for an inert substrate, supporting the validity of the proposed SECMID technique for systems involving H+.
Ti02 [Rutile] (001) Surface. SECMID experiments were conducted with a solution concentration of 2 X lo4 M HC1 which, based on equilibrium adsorption measurements on powder^,'^^*^,^^ is sufficient to protonate the surface to a reasonable extent, while providing a sufficient value for y to allow the SECMID exper- iments to be sensitive to the surface processes. Typical steady-state current-distance characteristics for the reduction of H+ obtained with a Pt UME (a = 12.5 pm; & = 10) are shown in Figure 12, along with ferrocyanide oxidation tipsubstrate calibration data, and the corresponding theoretical behavior predicted for an inert substrate. The good agreement found between the theoretical data and the results for H+ reduction indicates that surface diffusion of adsorbed H+ is essentially negligible under the conditions of these experiments. Numerical simulations of this particular case, with the adsorption/desorption equilibrium parameters defined below and kinetic parameters deduced from the analysis which follows, indicate that D, < O.lDd assuming a deviation of *lo% of the experimental current data from theory as typical at the closest tip-substrate separation (d = 2.5 pm).
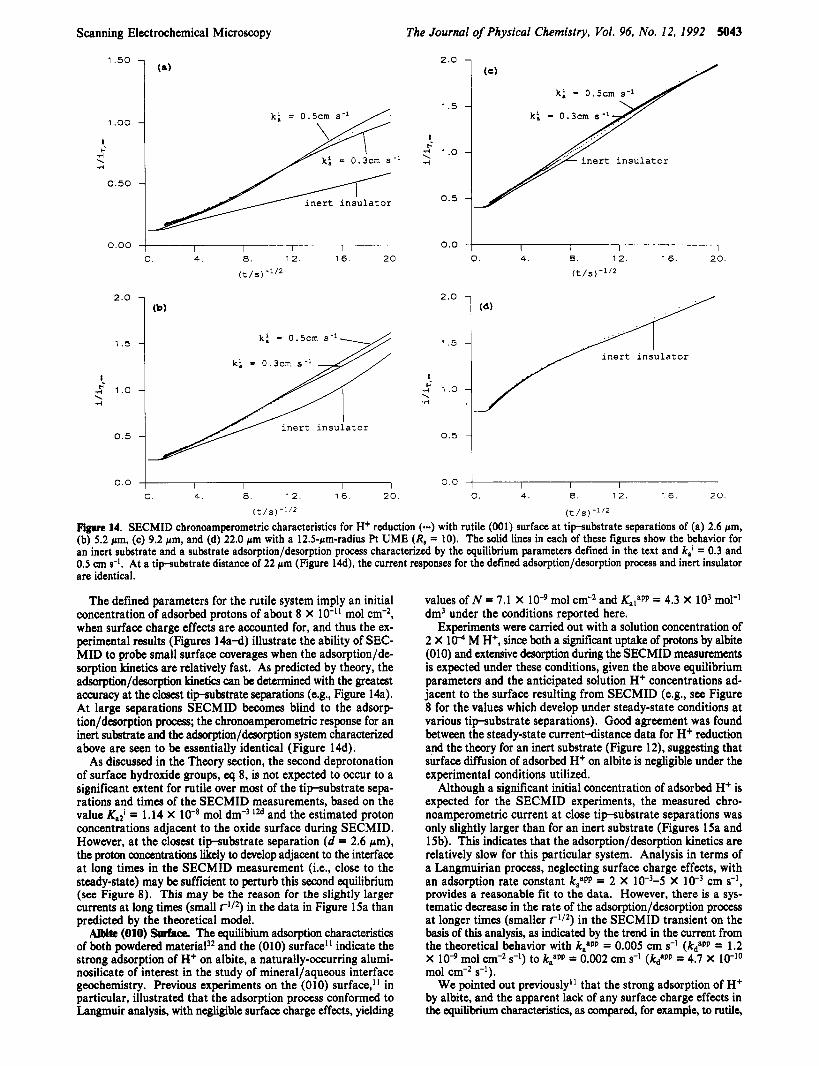
Chronoamperometric data for H+ reduction at several values of d are shown in Figures 14a-d. At close tipubstrate distance, the short-time currents are far greater than predicted by theory
I 1 I I I 000 0 10 0 2 0 0 3 0 0 4 0 0 5 0
t/s
3.0
2 . 0
8 c'
.d .. .ri
1 .0
0.0
Figure 13.
I I I 1 I 1
0 4 8 1 2 1 6 2 0
(t/S) - 1 ' 2
SECMID chronoamperometric characteristics (disdaved as i/&,- vs (a) t and (b) t-Il2) fo; H+ reduction at various 6&udstrate separations with a Plexiglass substrate (-) and the corresponding be- havior for an inert substrate (-). In both a and b the data relate to tipsubstrate separations (lower curve to upper curve): d = 2.6 pm (R, = 10); d = 6.0 pm (R, = 20); d = 11.0 pm (R, = 20); d = 19.0 pm (R, = 20); d > 200 pm, i.e., infinite separation (R, = 10).
for an inert substrate, demonstrating that proton desorption from the rutile surface provides an additional source of protons (to those initially in solution) for reduction. As discussed above, a diffuse layer model (DLM) is appropriate for the description of the electrical nature of the rutile/aqueous interface.lU In particular, the following parameters have been proposed for the adsorption of H+ on rutile with a DLM:'2d N = 10 nm-2 and k,'/kdi = 7.24 X lo3 mol-' dm3, based on modeling of extensive experiments carried out by YatesM on wellcharacterized colloidal Ti02.31 The value for N is close to the value of N = 10.6 nm-2 for the density of oxide sites on the (001) surface. As has been pointed out above, surface acidity measurements on powdered material represent an average of a number of crystal faces, which may have different adsorption characteristics. In the absence of equilibrium data specifically for the (001) face, however, we adopt the value for colloidal material. This approximation may be reasonable, since it is unlikely that the rutile surface employed in our studies will comprise the perfact (001) face over the relatively extensive arcas (several hundred square microns) probed by the SECM. With these equilibrium parameters, only k,' (or k t ) is left as a variable in modeling the experimental data in Figures 14a-d. The theo- retical (solid) lines in these figures show the chronoamperometric behavior for the DLM with k,' = 0.3 and 0.5 cm s-l. The very good fits of the theory to the experimental data at each t i p substrate distance appear to confirm the validity of the DLM for this case. The deduced values of the intrinsic adsorption and desorption rate constants, 0.3-0.5 cm s-l and 4.1 X 10⁻⁸-6.9 X
respectively, are very close to the values of 0.4 cm s-' and 8 X mol cm-2 s-' measured by the pressure jump technique on suspensions of the anatase form of Ti02.6s
mol cm-*
Scanning Electrochemical Microscopy The Journal of Physical Chemistry, Vol. 96, No. 12, 1992 5043
1'50 1 0
0.00 1 I I I I I 0. 4. 8. 12. 16. 20.
2.0
1.5
1. .:' 1 .o \ .rl
0.5
0.0
0 . 4. 8. 12. 16. 20.
(t /S) -1'2
2.0 7
0.0 I I I I I 1 0. 4. 8. 12. 16. 20
2.0
1.5
P .: 1 .o \ .r(
0.5
0 . 0
0 . 4. 8 . 12. 16. 2 0
(t /S) Figure 14. SECMID chronoamperometric characteristics for H+ reduction (-) with rutile (001) surface at tip-substrate separations of (a) 2.6 pm, (b) 5.2 pm, (c) 9.2 pm, and (d) 22.0 pm with a 12.5-pm-radius Pt UME (R, = 10). The solid lines in each of these figures show the behavior for an inert substrate and a substrate adsorption/desorption process characterized by the equilibrium parameters defined in the text and k,' = 0.3 and 0.5 cm s-l. At a tipubstrate distance of 22 pm (Figure 14d), the current responses for the defined adsorption/desorption process and inert insulator are identical.
The defined parameters for the rutile system imply an initial concentration of adsorbed protons of about 8 X lo-" mol cm-2, when surface charge effects are accounted for, and thus the ex- perimental results (Figures 14a-d) illustrate the ability of SEC- MID to probe small surface coverages when the adsorption/de- sorption kinetics are relatively fast. As predicted by theory, the adsorption/demrption kinetics can be determined with the greatest accuracy at the closest tipsubstrate separations (e.g., Figure 14a). At large separations SECMID becomes blind to the adsorp- tion/demrption process; the chronoamperometric response for an inert substrate and the adsorption/dewrption system characterized above are seen to be essentially identical (Figure 14d).
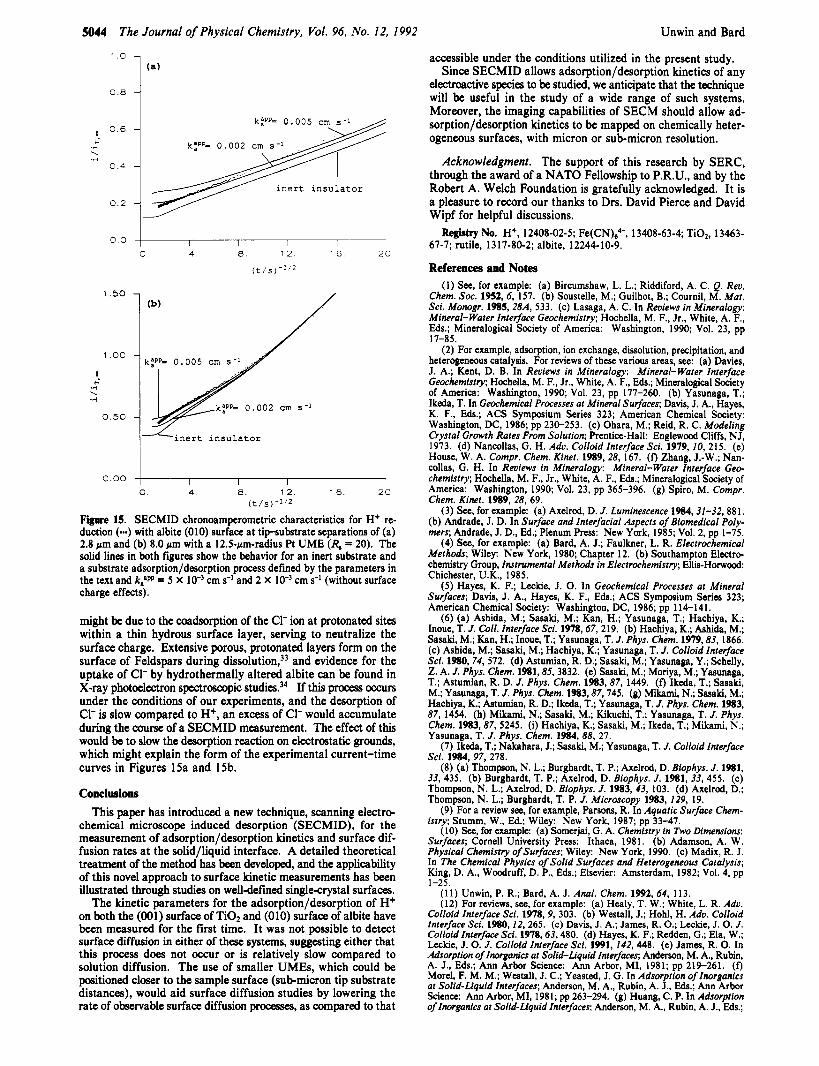
As discussed in the Theory section, the second deprotonation of surface hydroxide groups, eq 8, is not expected to occur to a significant extent for rutile over most of the tip-substrate sepa- rations and times of the SECMID measurements, based on the value Kali = 1.14 X lo-* mol dm-3 12d and the estimated proton concentrations adjacent to the oxide surface during SECMID. However, at the closest tip-substrate separation (d = 2.6 pm), the proton concentrations likely to develop adjacent to the interface at long times in the SECMID measurement (Le., close to the steady-state) may be sufficient to perturb this second equilibrium (see Figure 8). This may be the reason for the slightly larger currents at long times (small t-'I2) in the data in Figure 1 Sa than predicted by the theoretical model. Albite (010) Surf- The equilibium adsorption characteristics
of both powdered material32 and the (010) surface" indicate the strong adsorption of H+ on albite, a naturally-occurring alumi- nosilicate of interest in the study of mineral/aqueous interface geochemistry. Revious experiments on the (010) surface," in particular, illustrated that the adsorption process conformed to Langmuir analysis, with negligible surface charge effects, yielding
values of N = 7.1 X lo4 mol cm-2 and KalaPP = 4.3 X lo3 mol-' dm3 under the conditions reported here.
Experiments were carried out with a solution concentration of 2 X 10⁻⁴ M H+, since both a significant uptake of protons by albite (010) and extensive desorption during the SECMID measurements is expected under these conditions, given the above equilibrium parameters and the anticipated solution H+ concentrations ad- jacent to the surface resulting from SECMID (e.g., see Figure 8 for the values which develop under steady-state conditions at various tip-substrate separations). Good agreement was found between the steady-state current-distance data for H+ reduction and the theory for an inert substrate (Figure 12), suggesting that surface diffusion of adsorbed H+ on albite is negligible under the experimental conditions utilized.
Although a significant initial concentration of adsorbed H+ is expected for the SECMID experiments, the measured chro- noamperometric current at close tip-substrate separations was only slightly larger than for an inert substrate (Figures 1Sa and 15b). This indicates that the adsorption/desorption kinetics are relatively slow for this particular system. Analysis in terms of a Langmuirian process, neglecting surface charge effects, with an adsorption rate constant k:PP = 2 X 10-'-5 X cm s-I, provides a reasonable fit to the data. However, there is a sys- tematic decrease in the rate of the adsorption/desorption process at longer times (smaller r1I2) in the SECMID transient on the basis of this analysis, as indicated by the trend in the current from the theoretical behavior with kaaPP = 0.005 cm s-' (kdapp = 1.2 x IO4 mol cm-l s-l) to k:PP = 0.002 cm mol cm-l s-l).
We pointed out previously" that the strong adsorption of H+ by albite, and the apparent lack of any surface charge effects in the equilibrium characteristics, as compared, for example, to rutile,
(kdaPP = 4.7 x
5044 The Journal of Physical Chemistry, Vol. 96, No. 12, 1992 Unwin and Bard
0.8 4
I-
0.0 ~ I I I I I 0. 4 . 8 . 12. 16. 2 0 .
( t / s ) - l ' 2
1.50 7 /
/
-inert insulator
0.00 fi 0 . 4 . 8 . 1 2 . 16. 20
(t /s) -1'2
Figure 15. SECMID chronoamperometric characteristics for H+ re- duction (-) with albite (010) surface a t tip-substrate separations of (a) 2.8 pm and (b) 8.0 pm with a 12.5-pm-radius Pt U M E (R, = 20). The solid lines in both figures show the behavior for an inert substrate and a substrate adsorption/desorption process defined by the parameters in the text and k;" = 5 X lo-) cm s-' and 2 X lo-' cm s-I (without surface charge effects).
might be due to the coadsorption of the C1- ion at protonated sites within a thin hydrous surface layer, serving to neutralize the surface charge. Extensive porous, protonated layers form on the surface of Feldspars during diss~lution,~~ and evidence for the uptake of C1- by hydrothermally altered albite can be found in X-ray photoelectron spectroscopic studies.34 If this process occurs under the conditions of our experiments, and the desorption of C1- is slow compared to H+, an excess of C1- would accumulate during the course of a SECMID measurement. The effect of this would be to slow the desorption reaction on electrostatic grounds, which might explain the form of the experimental current-time curves in Figures 15a and 15b.
Conclusions This paper has introduced a new technique, scanning electro-
chemical microscope induced desorption (SECMID), for the measurement of adsorption/desorption kinetics and surface dif- fusion rates at the solid/liquid interface. A detailed theoretical treatment of the method has been developed, and the applicability of this novel approach to surface kinetic measurements has been illustrated through studies on well-defined singlecrystal surfaces.
The kinetic parameters for the adsorption/desorption of H+ on both the (001) surface of TiOz and (010) surface of albite have been measured for the first time. It was not possible to detect surface diffusion in either of these systems, suggesting either that this process does not occur or is relatively slow compared to solution diffusion. The use of smaller UMEs, which could be positioned closer to the sample surface (sub-micron tip substrate distances), would aid surface diffusion studies by lowering the rate of observable surface diffusion processes, as compared to that
accessible under the conditions utilized in the present study. Since SECMID allows adsorption/desorption kinetics of any
electroactive species to be studied, we anticipate that the technique will be useful in the study of a wide range of such systems. Moreover, the imaging capabilities of SECM should allow ad- sorption/desorption kinetics to be mapped on chemically heter- ogeneous surfaces, with micron or sub-micron resolution.
Acknowledgment. The support of this research by SERC, through the award of a NATO Fellowship to P.R.U., and by the Robert A. Welch Foundation is gratefully acknowledged. It is a pleasure to record our thanks to Drs. David Pierce and David Wipf for helpful discussions. Registry No. H+, 12408-02-5; Fe(CN)6e, 13408-63-4; Ti02, 13463-
67-7; rutile, 1317-80-2; albite, 12244-10-9.
References and Notes (1) See, for example: (a) Bircumshaw, L. L.; Riddiford, A. C. Q. Rev.
Chem. Soc. 1952, 6, 157. (b) Soustelle, M.; Guilhot, B.; Cournil, M. Mar. Sci. Monogr. 1985,28A, 533. (c) Lasaga, A. C. In Reviews in Mineralogy: Mineral-Water Interface Geochemistry; Hochella, M. F., Jr., White, A. F., Eds.; Mineralogical Society of America: Washington, 1990; Vol. 23, pp
(2) For example, adsorption, ion exchange, dissolution, precipitation, and heterogeneous catalysis. For reviews of these various areas, see: (a) Davies, J. A.; Kent, D. B. In Reviews in Mineralogy: Mineral-Water Interface Geochemistry; Hochella, M . F., Jr., White, A. F., as.; Mineralogical Society of America: Washington, 1990; Vol. 23, pp 177-260. (b) Yasunaga, T.; Ikeda, T. In Geochemical Processes at Mineral Surfaces; Davis, J. A., Hayes, K. F., Eds.; ACS Symposium Series 323; American Chemical Society: Washington, DC, 1986; pp 230-253. (c) Ohara, M.; Reid, R. C. Modeling Crystal Growth Rates From Solution; Prenticc-Hall: Englewood Cliffs, NJ, 1973. (d) Nancollas, G. H. Adv. Colloid InterfaceSci. 1979, 10, 215. (e) House, W. A. Compr. Chem. Kiner. 1989,28, 167. (f) Zhang, J.-W.; Nan- collas, G. H. In Reviews in Mineralogy: Mineral-Water Interfoce Geo- chemistry; Hochella, M. F., Jr., White, A. F., Eds.; Mineralogical Society of America: Washington, 1990; Vol. 23, pp 365-396. (g) Spiro, M. Compr. Chem. Kinet. 1989, 28, 69.
(3) See, for example: (a) Axelrod, D. J. Luminescence 1984,31-32,881. (b) Andrade, J. D. In Surface and Interfacial Aspects of Biomedical Poly- mers; Andrade, J. D., Ed.; Plenum Press: New York, 1985; Vol. 2, pp 1-75.
(4) See, for example: (a) Bard, A. J.; Faulkner, L. R. Electrochemical Methods; Wiley: New York, 1980; Chapter 12. (b) Southampton Electro- chemistry Group, Instrumental Methods in Electrochemistry; Ellis-Horwood: Chichester, U.K., 1985.
(5) Hayes, K. F.; Leckie, J. 0. In Geochemical Processes at Mineral Surfaces; Davis, J. A,, Hayes, K. F., Eds.; ACS Symposium Series 323; American Chemical Society: Washington, DC, 1986; pp 114-141.
(6) (a) Ashida, M.; Sasaki, M.; Kan, H.; Yasunaga, T.; Hachiya, K.; Inoue, T. J. Coll. Interface Sci. 1978,67, 219. (b) Hachiya, K.; Ashida, M.; Sasaki, M.; Kan, H.; Inoue, T.; Yasunaga, T. J . Phys. Chem. 1979,83,1866. (c) Ashida, M.; Sasaki, M.; Hachiya, K.; Yasunaga, T. J . Colloid Interface Sci. 1980.74,572. (d) Astumian, R. D.; Sasaki, M.; Yasunaga, Y.; Schelly, Z. A. J. Phys. Chem. 1981,85,3832. (e) Sasaki, M.; Moriya, M.; Yasunaga, T.; Astumian, R. D. J. Phys. Chem. 1983,87, 1449. (f) Ikeda, T.; Sasaki, M.; Yasunaga, T. J. Phys. Chem. 1983,87,745. (g) Mikami, N.; Sasaki, M.; Hachiya, K.; Astumian, R. D.; Ikeda, T.; Yasunaga, T. J . Phys. Chem. 1983, 87, 1454. (h) Mikami, N.; Sasaki, M.; Kikuchi, T.; Yasunaga, T. J. Phys. Chem. 1983,87, 5245. (i) Hachiya, K.; Sasaki, M.; Ikeda, T.; Mikami, N.; Yasunaga, T. J. Phys. Chem. 1984,88, 27.
(7) Ikeda, T.; Nakahara, J.; Sasaki, M.; Yasunaga, T. J. Colloid Interface Sci. 1984, 97, 278.
(8) (a) Thompson, N. L.; Burghardt, T. P.; Axelrod, D. Biophys. J . 1981, 33, 435. (b) Burghardt, T. P.; Axelrod, D. Biophys. J . 1981, 33, 455. (c) Thompson, N. L.; Axelrod, D. Biophys. J. 1983,43, 103. (d) Axelrod, D.; Thompson, N. L.; Burghardt, T. P. J . Microscopy 1983, 129, 19.
(9) For a review see, for example, Parsons, R. In Aquatic Surface Chem- istry; Stumm, W., Ed.; Wiley: New York, 1987; pp 33-47.
(10) See, for example: (a) Somerjai, G. A. Chemistry in Two Dimensions: Surfaces; Cornell University Press: Ithaca, 1981. (b) Adamson, A. W. Physical Chemistry of Surfaces; Wiley: New York, 1990. (c) Madix, R. J . In The Chemicol Physics of Solid Surfaces and Heterogeneous Catalysis; King, D. A., Woodruff, D. P., Eds.; Elsevier: Amsterdam, 1982; Vol. 4, pp
(11) Unwin, P. R.; Bard, A. J . Anal. Chem. 1992, 64, 113. (12) For reviews, see, for example: (a) Healy, T. W.; White, L. R. Adv.
Colloid Interface Sci. 1978, 9, 303. (b) Westall, J.; Hohl, H. Adu. Colloid Interface Sci. 1980, 12, 265. (c) Davis, J. A.; James, R. 0.; Leckie, J. 0. J . Colloid Interface Sci. 1978,63,480. (d) Hayes, K. F.; Redden, G.; Ela, W.; Leckie, J. 0. J. Colloid Interface Sci. 1991, 142, 448. (e) James, R. 0. In Adsorption of Inorganics at Solid-Liquid Interfaces; Anderson, M . A., Rubin, A. J., Eds.; Ann Arbor Science: Ann Arbor, MI, 1981; pp 219-261. (f) Morel, F. M. M.; Westall, J. C.; Yeasted, J. G. In Adsorption of Inorganics at Solid-Liquid Interfaces; Anderson, M. A., Rubin, A. J., Eds.; Ann Arbor Science: Ann Arbor, MI, 1981; pp 263-294. (g) Huang, C. P. In Adsorption of Inorganics at Solid-Liquid Interfaces; Anderson, M. A., Rubin, A. J., Eds.;
17-85.
1-25.
J. Phys. Chem. 1992, 96, 5045-5048 5045
Ann Arbor Science: Ann Arbor, MI, 1981; pp 183-217. (h) Westall, J. C. In Geochemical Processes at Mineral Surfaces; Davis, J. A., Hayes, K. F., Eds.; ACS Symposium Series 323; American Chemical Society: Washington, DC, 1986; pp 54-78. (i) Schindler, P. W.; Stumm, W. In Aquatic Suqace Chemistry; Stumm, W., Ed.; Wiley: New York, 1987; pp 83-110. 6 ) Dzombak, D. A.; Morel, F. M. M. Surface Complexation Modeling, Wiley: New York, 1990.
(13) Bard, A. J.; Fan, F.-R. F.; Kwak, J.; Lev, 0. Anal. Chem. 1989,61, 132. (14) For reviews see: (a) Bard, A. J.; Fan, F.-R. F.; Pierce, D. T.; Unwin,
P. R.; Wipf, D. 0.; Zhou, F. Science 1991,254,68. (b) Bard, A. J.; Denault, G.; Lee, C.; Mandler, D.; Wipf, D. 0. Acc. Chem. Res. 1990, 23, 357.
(15) See, for example: (a) Visvanathan, R.; Burgess, D. R., Jr.; Stuir, P. C.; Weitz, E. J. Vac. Sci. Technol. 1982, 20, 605. (b) George, S . M.; De- Santolo, A. M.; Hall, R. B. Surf. Sci. 1985, L428, 1985.
(16) Kwak, J.; Bard, A. J. Anal. Chem. 1989, 61, 1221. (17) Unwin, P. R.; Bard, A. J. J. Phys. Chem. 1991, 95, 7814. (18) See, for example, ref 12h and (a) Westall, J. C. In Aquatic Surface
Chemistry; Stumm, W., Ed.; Wiley: New York, 1987; pp 3-32. (b) van Riemsdjik, W. H.; Bolt, G. H.; Koopal, L. K.; Blaakmeer, J. J. Colloid Interface Sci. 1986, 109, 219. (c) Hiemstra, T.; van Riemsdjik, W. H.; Bolt, G. H. J. Colloid Interface Sci. 1989, 133, 91. (d) Hiemstra, T.; de Wit, J. C. M.; van Riemsdjik, W. H. J. Colloid Interface Sci. 1989, 133, 105.
(19) Yates, D. E.; Levine, S.; Healy, T. W. J. Chem. Soc., Faraday Trans. 1 1974, 70, 1807.
(20) Huang, C. P.; Stumm, W. J. Colloid Interface Sci. 1973, 43, 409. (21) Bard, A. J.; Faulkner, L. R. Electrochemical Methods; Wiley: New
York, 1980; p 507.
(22) Saito, Y. Rev. Polarogr. Jpn. 1968, 15, 177. (23) Peaceman, D. W.; Rachford, H. H. J. Soc. Indust. Appl. Math. 1955,
3, 28. (24) Bard, A. J.; Mirkin, M. V.; Unwin, P. R.; Wipf, D. 0. J. Phys. Chem.
1992, 96, 1861. (25) Bard, A. J.; Denault, G.; Friesner, R. A.; Dornblaser, B. C.; Tuck-
erman, L. S. Anal. Chem. 1991, 63, 1282. (26) Gilbert, S. E.; Kennedy, J. H. J. Electrochem. Soc. 1988,135,2385. (27) (a) Fmklea, H. 0. J. Electrochem. Soc. 1982,129,2003. (b) Cooper,
G.; Turner, J. A.; Nozik, A. J. J. Electrochem. SOC. 1982, 129, 1973. (28) Compton, R. G.; Unwin, P. R. Phil. Trans. R . SOC. London 1990,
A330, 1, and references therein. (29) (a) Berube, Y. G.; de Bruyn, P. L. J. Colloid Interface Sci. 1968,27,
305; 1968,28,92. (b) Ahmed, S. M.; Maksimov, D. J. Colloid Interface Sci. 1969.29.97. (c) Yates. D. E.: Healv. T. W. J. Chem. Soc.. Faradav Trans. 1 1g0, 76, 9. '(d) Fokknk, L. G. J:;'De Keizer, A.; Lyklema, J. J.'Colloid Interface Sci. 1989, 127, 116.
(30) Yates, D. E. Ph.D. Thesis, University of Melbourne, Australia, 1975. (31) Yates. D. E.: James. R. 0.: Healv. T. W. J. Chem. Soc.. Faradav . ..
Trans.' I 1980, 76, 1; (32) Blum, A.; Lasaga, A. Nature (London) 1988, 331, 431. (33) (a) Petit, J. C.; Mea, G. D.; Dran, J. C.; Schott, J.; Berner, R. A.
Nature (London) 1987,325,705. (b) Scott, J.; Petit, J. C. In Aquatic Surface Chemistry; Stumm, W., Ed.; Wiley: New York, 1987; pp 293-315. (c) Casey, W. H.; Westrich, H. R.; Arnold, G. W. Geochim. Cosmochim. Acta 1988,52, 2795. (34) Hellmann, R.; Eggleston, C. M.; Hochella, M. F.; Crerar, D. A.
Geochim. Cosmochim. Acta 1990, 54, 1267.
Platinum-Proton Coupling in the NMR Spectrum of Benzene on an Alumina-Supported Platinum Catalyst
Charles F. Tirendi>*t C. Alex MiUs,s Cecil Dybowski,*.* Department of Chemistry and Biochemistry, Department of Chemical Engineering, and Center for Catalytic Science and Technology, University of Delaware, Newark, Delaware 1971 6
and Ciinther Neue Physical Chemistry, University of Dortmund, Dortmund, Germany (Received: December 3, 1991; In Final Form: January 31, 1992)
The homonuclear decoupled proton NMR spectrum of benzene associatively chemisorbed on a 5.0% wt/wt Pt/A1203 catalyst is reported. The structure of the resonance is attributable to heteronuclear dipolar or pseudodipolar couplings to platinum-195 nuclei in the surface of the particle. Comparison of simulated spectra for benzene molecules in various sites coupled by the heteronuclear dipolar interaction to an array of platinum atoms indicates that only benzene in the "on top" geometry is consistent with the observed spectrum. If the coupling is attributed solely to direct dipolar couplings, the predicted Pt-benzene distance is 1.56 f 0.02 A. Considering both dipolar and pseudodipolar couplings leads to the conclusion that this value is a minimum for the Pt-benzene distance.
Introduction Benzene chemisorbed on a Pt/A1203 catalyst ?r bonds to surface
platinum atom.'" In this state, the benzene molecule may be in the 'on-top", "three-fold-hollow", or "bridge" site, as shown in Figure 1. In the on-top site, the molecule's centroid lies above a single platinum atom, whereas it lies above the hole formed by three platinum atoms in the three-fold-hollow geometry. In the bridge site the centroid lies over the midpoint of the vector con- necting two adjacent platinum atom. Lehwald et a1.6 have shown that the HREELS spectrum of benzene on singlecrystal Pt( 11 1) is consistent with a *-bonded complex having the plane of the benzene ring parallel to the plane of the platinum surface. Sim- ilarly, Jobic and Renouprez' found that neutron inelastic scattering from benzene adsorbed on Raney platinum indicates the benzene is bound to one metal atom.
To whom correspondence should be addressed.
*Department of Chemistry and Biochemistry. 8 Department of Chemical Engineering.
Present address: AKZO Chemical Company, Livingstone Ave., Dobbs Ferry, NY 10522.
In other preparations, a variety of geometries may be adopted. When CO is wadsorbed with benzene on Pt( 11 l), LEED studies indicate that an ordered structure is formed, in which the benzene molecule is distorted to C2, symmetry.8 Dissociatively chemi- sorbed u-bonded benzene complexes have also been reported to form on catalysts containing carbon residues.' LEED investi- gations of this material suggest that the plane of the u-bonded benzene is inclined relative to the plane of the Pt( 1 1 1) surface?Jo Trace desorption experiments on materials containing both *- and u-bonded benzene indicate that some adsorbed benzene exchanges when put in contact with labeled benzene, but a portion can only be removed by reaction with hydrogen." Thermal desorption- FTIR studies indicate that both the *- and a-bonded benzenes exchange hydrogen with surface hydroxyl groups of the alumina support, exchange from the a-bonded benzene being much more facile than from the *-bonded material.'
In this paper, we examine the solid-state nuclear magnetic resonance (NMR) spectrum of protons of benzene chemisorbed on a Pt/A1203 catalyst as the T complex. Conventional single- pulse. solid-state NMR spectroscopy has previously been reported to give a featureless resonance dominated by proton-proton dipolar
0022-3654/92/2096-5045$03.00/0 0 1992 American Chemical Society