scattering investigation of multiscale organization in … · scattering investigation of...
TRANSCRIPT

Scattering Investigation of Multiscale Organization in Aqueous
Solutions of Native Xanthan
Aristeidis Papagiannopoulos1,*, Konstantinos Sotiropoulos1 and Aurel
Radulescu2
1Theoretical and Physical Chemistry Institute, National Hellenic Research
Foundation, 48 Vassileos Constantinou Avenue, 116 35 Athens, Greece.
2Jülich Centre for Neutron Science JCNS Forschungszentrum Jülich GmbH,
Outstation at Heinz Maier-Leibnitz Zentrum (MLZ), 1 Lichtenbergstraße, 85747
Garching, Germany.
Corresponding Author
E-mail address: [email protected] (A. Papagiannopoulos)
Abstract
The hierarchical morphology of xanthan solutions is analyzed by light scattering and
small angle neutron scattering experiments in a broad range of concentrations. Static
light scattering well inside the semi-dilute regime is dominated by the form factor of
individual xanthan chains while at higher concentrations chain interconnections
appear to modify the low wave vector scattering. Dynamic light scattering on the
other hand reveals the self-similar nature of the solutions caused by interchain
associations. Concequently intensity autocorrelation functions present power-law
behaviour with exponents that decrease as a function of concentration. Small angle
neutron scattering profiles are dominated by the fractal scattering from the formed
network at intermediate length scales. At small length scales the data is consistent

with the rigid helical structure of xanthan molecules and hence the molecular weight
per unit length is extracted. Measurments at shear rates up to 1000 rad/s caused no
detectable conformational or morphological alterations to the scattering profiles
revealing that the shear thinning behaviour of xanthan is related to the disruption of
chain-chain associations. This study illustrates the use of scattering methods for
analysing structure in complex fluids of interest in food and pharmaceutical industry.
Keywords: light scattering, small angle neutron scattering, xanthan, polysaccharide,
fractal, helix.
1. Introduction
Xanthan is an anionic polysaccharide originated by the bacteria species Xanthomonas
and produced commercially mainly by Xanthomonas campestris via fermentation
process1. It consists of a cellulose backbone and trisaccharide side chains that include
glucuronic acid groups, mannose units and pyruvate residues that provide its anionic
charge2. In salt containing aqueous solutions the trisaccharide charged side chains of
xanthan create stable helices along its backbone3.Among its most interesting features
some are the high viscosity even at low concentrations solutions, the stability in a
wide range of temperatures, pH and salts, the ability to form hydrogels and the shear
thinning behaviour. One of xanthan gum’s main uses is that of viscosity
stabilizer/modifier in the food industry in a wide variety of products. Other
applications include pharmaceutical products (dental treatment gels, external
analgesics, etc.), personal care (shampoos, sunscreens, etc.), drug delivery systems,
especially in the form of complexes combined with the cationic polyelectrolyte
chitosan4 and oil recovery agents5.
In our recent publication6 we demonstrated the power-law viscoelasticity of xanthan
solution at concentrations relevant to industrial applications. The connection of the
linear rheology (obtained by particle tracking microrheology) with the shear-thinning
behaviour (meassured by viscometry) was established. Xanthan has been studied in
the past by static light scattering in dilute solution in terms of its wormlike
conformation7, 8. Its persistence length, molecular mass and molecular mass per unit
length have been quantified. Dynamic light scattering studies have been performed
performed to elucidate the diffusion coefficient as a function of concentration9 at
several salt conditions10. In these studies the apparent diffusion of xanthan molecules
was found to depend on the effects of interchain interactions and cooperative motion
above the overlap concentration.
Self-similarity in dynamic properties are intuitevely connected to self-similarity in
spatial morphology6, 11. The well documented power-law viscoelasticity of xanthan
solutions should be expected to reflect on its underlying structure. Both the dynamic
and static scattering data would consequently contain the signature of self-similarity.
In this study we use static and dynamic light scattering to elucidate the size and
relaxation spectrum of xanthan molecules in semidilute solutions. We also probe the
structure in a wide range of length scales by small angle neutron scattering and test
the morphology under shear flow. This work extends the knowledge of xanthan
morpholgy in semidilute solutions, sets a unifying framework for their description and
can be generalized to complex fluids consisting of other biopolymers.
2. Materials and Methods
Materials
Xanthan gum was purchased from CP Kelco and was used without further treatment.
The powder was dissolved in water under stirring in the desired concentration and

stored overnight at 4 ºC. Distilled H2O was used for the light scattering experiments
and D2O for SANS experiments. Salt content was adjusted by adding small amounts
of concentrated salt solutions (NaCl) up to the desired volume and the samples were
again stored at 4º C overnight. The salt content was set at 0.03 M so that xanthan is in
its ordered helical conformation12, 13. All measurements were performed at room
temperature.
Light Scattering
Light scattering (LS) was performed on an ALV/CGS-3 compact goniometer system
(ALVGmbH, Germany) equipped with an ALV-5000/EPP multi tau digital correlator
and a He-Ne laser operating at the wavelength of 632.8 nm. In static light scattering
(SLS) the Rayleigh ratio 𝑅𝑅(𝑞𝑞) was obtained at a series of angles in the range 30-120°.
The scattering wave vector is given by 𝑞𝑞 = 4𝜋𝜋𝑛𝑛0𝜆𝜆
𝑠𝑠𝑠𝑠𝑠𝑠 𝜃𝜃2 where 𝑠𝑠0 is the solvent’s
refractive index. SLS data were treated14 by equation 1.
𝐾𝐾𝐾𝐾𝑅𝑅(𝑞𝑞,𝐾𝐾) = 1
𝑀𝑀𝑤𝑤𝑃𝑃(𝑞𝑞) (1)
where 𝑀𝑀𝑤𝑤 is the weight-averaged molar mass and 𝑐𝑐 is the particle concentration in
solution. In the Guinier approximation the single particle’s form factor is given by
𝑃𝑃(𝑞𝑞) = 𝑒𝑒−13𝑞𝑞
2𝑅𝑅𝑔𝑔2 , where 𝑅𝑅𝑔𝑔is the radius of gyration obtained by SLS. 𝐾𝐾 is the contrast
factor for LS given by 𝐾𝐾 = 4𝜋𝜋2𝑛𝑛02
𝑁𝑁𝐴𝐴𝜆𝜆4(𝜕𝜕𝑠𝑠/𝜕𝜕𝑐𝑐)2, where 𝜕𝜕𝑠𝑠/𝜕𝜕𝑐𝑐 is the refractive index
increment of the scattering particles in the solvent. In dynamic light scattering (DLS)
the intensity autocorrelation functions 𝑔𝑔(2)(𝑡𝑡) were collected15 at the same scattering
angles as in SLS. The intensity autocorrelation function 𝑔𝑔(2)(𝜏𝜏) is connected to the
field autocorrelation function 𝑔𝑔(1)(𝜏𝜏) by the Sieget relation 𝑔𝑔(2)(𝜏𝜏) − 1 =
𝛽𝛽 ∙ �𝑔𝑔(1)(𝜏𝜏)�2 (where β is a normalization factor). CONTIN algorithm was used to
extact the spectrum of relaxation times of the 𝑔𝑔(1)(𝜏𝜏).

Small Angle Neutron Scattering
The KWS-2 high intensity/wide-q small angle neutron diffractometer at the research
reactor FRM II (Jülich Centre for Neutron Science) was used for the small angle
neutron scattering (SANS) experiments. The sample solutions were loaded in an
Anton Paar (MCR 501) rheometer in the Couette geometry. This way SANS
measurements under controled flow conditions (Rheo-SANS) were also possible.
Scattered intensity was collected only in the radial direction. In the tangential
geometry the requirement for narrow beam size compromised the incoming neutron
flux significantly. The scattering vector (q) range was from 0.0022 to 0.3 Å-1 and was
covered by three separate sample-detector-distance/neutron-wavelength
configurations i.e. 20m/0.5nm, 8m/0.5nm and 2m/0.5nm. Additionally the low q
range could be extended to 0.0012 Å-1 by measuring at 20m/1.0nm configuration.
In SANS the scattered intensity 𝐼𝐼(�⃗�𝑞) is collected by a 2-D detector and is afterwards
azimuthally integrated leading to the 1-D intensity 𝐼𝐼(𝑞𝑞). The 2-D raw data are
corrected for the scattering from the empty cell and the solvent and the electronic and
background noise. Intrumental resolution 𝛥𝛥𝑞𝑞(𝑞𝑞) is taken into account16 by equation 2.
The convoluted curves 𝐼𝐼𝐾𝐾𝑐𝑐𝑛𝑛𝑐𝑐(𝑞𝑞) are the ones fitted against the experimentally
obtained data 𝐼𝐼𝑒𝑒𝑒𝑒𝑒𝑒(𝑞𝑞).
𝐼𝐼𝐾𝐾𝑐𝑐𝑛𝑛𝑐𝑐(𝑞𝑞) = 1√2𝜋𝜋𝛥𝛥𝑞𝑞(𝑞𝑞) ∙ ∫ 𝑑𝑑𝑄𝑄 ∙ 𝑒𝑒𝑒𝑒𝑒𝑒 �− � 𝑄𝑄−𝑞𝑞
√2𝛥𝛥𝑞𝑞(𝑞𝑞)�2�+∞
−∞ ∙ 𝐼𝐼𝑡𝑡ℎ(𝑄𝑄) (2)
Data fitting was performed by minimizing the sum of the weighted square differences
𝜒𝜒2 = ∑ �𝐼𝐼𝑐𝑐𝑐𝑐𝑐𝑐𝑐𝑐(𝑞𝑞𝑖𝑖)−𝐼𝐼𝑒𝑒𝑒𝑒𝑒𝑒(𝑞𝑞𝑖𝑖)
𝛿𝛿𝐼𝐼𝑒𝑒𝑒𝑒𝑒𝑒(𝑞𝑞𝑖𝑖)�2
𝑁𝑁𝑖𝑖=1 between the 𝑁𝑁 theoretical and experimental data points
for a SANS profile. The nonlinear least square optimization was performed by the
Monte Carlo algorithm in a simulated annealing process17 by custom made code in
MATLAB.

3. Results and Discussion
Light scattering experiments covered a wide range of concentrations (0.03-1.4
mg/ml). In figure 1 we present the distribution of relaxation times from CONTIN
analysis at 90°. At low concentration (0.03 mg/ml) a single broad peak is observed.
This could be atributted to a single assumingly diffusive species with Rh about 80 nm
a value somewhat lower than previously reported10. A high degree of polydispersity
would explain the broad range of relaxation times. At intermediate concentrations (0.6
mg/ml) the distribution is apparently bimodal with the two main contributions being
separated by more than one order of magnitude in time. At high concentrations (1
mg/ml) the distribution is apparently multi-modal spanning in more than five orders
of magnitude in time. As we have recently shown6 the range of concentrations above
0.05 mg/ml is well within the semidilute range of xanthan solutions. Additionally
xanthan solutions have shown characteristics of self-similar structure as they resulted
to power-law behaviour in viscoelasticity. They could hence be described as soft
hydrogels on the critical point of gelation11 where clusters of infinite correlation
length are formed between xanthan molecules. Viscoelasticity in self-similar fluids is
more naturally described by power-laws than with superposition of multiple modes.
The power-law viscoelastic exponents of xanthan decreased systematically as a
function of concentration pointing to the enhancement of the elastic component.

Figure 1: CONTIN analysis of the field autocorrelation functions at θ=90° from
xanthan solutions of 0.03 (▬), 0.6 (▬) and 1.0 (▬) mg/ml (with 0.03M NaCl).
This picture explains the observation of additional slower relaxation modes as
concentration increases. Dynamic light scattering from complex fluids at the gel
point18 contains a power-law term for the long-time trend of the intensity auto-
correlation function. As clusters are formed there is a fast mode of local cooperative
fluctuations that is unperturbed by the connentivity divergence at long length scales.
The latter introduces long wavelength density fluctuations that are much slower than
the local cooperative diffusion. In figure 2 the double logarithmic plots reveal a
power-law at long times whose slope decreases as a function of concentration. The
DLS autocorrelation functions of this work was sufficiently fitted with the single
component power-law function 18, 19 (equation 3). We have to note that this simple
function fitted our 𝑔𝑔(1)(𝜏𝜏) data for all angles and concentrations.
𝑔𝑔(1)(𝜏𝜏) = (1 + 𝜏𝜏/𝜏𝜏𝑟𝑟𝑒𝑒𝑟𝑟)−𝑎𝑎 (3)

Figure 2: Intensity autocorrelation functions at θ=90° from xanthan solutions of 0.03
(○), 0.3 (○), 0.6 (□) and 1.4 (□) mg/ml (with 0.03M NaCl). Lines are fits with
equation (3).
The power-law exponents 𝑎𝑎 systematically decrease as concentration increases. The
enhancement of elasticity at higher concentrations is this way followed by DLS20.
Additionally we observe a q-dependence of 𝑎𝑎 (figure3). At very low concentrations
(up to 0.06 mg/ml) there is a low-q plateau and then a systematic increase as a
function of q. Possibly at low concentration the formed clusters have smaller size than
the largest length scale probed at low q and their dynamics as a whole are observed.
Above 0.1 mg/ml q-dependence is systematic for all concentrations. The increase of
relaxation exponent with q has been observed in gelling aqueous pluronic systems21.
Additionally a scaling relationship19 of the form 𝑎𝑎 = (𝜆𝜆 ∙ 𝑞𝑞)2 has been used to model
this kind of dependence in gelatin solutions and introduced a correlation length λ that
decreased with concentration. This picture is qualitatively similar to our work. The
power-law viscoelasticity in critical gels is connected to the power-law behaviour of
the DLS correlation function22. Conclusively our DLS data follow the increase of the
elasticity and hence are consistent with our previous work on xanthan microrheology6.

We have to note that interchain associations in xanthan result from helix-helix
associations1 whose number possibly increases as a function of concentration. The
clustering of molecules by helix-helix associations is weak and not permanent
leading to the well documented shear-thinning behaviour.
Figure 3: Characteristic relaxation exponent from xanthan solutions at 0.03 (□), 0.06
(■), 0.1 (○), 0.3 (●), 0.6 () and 1.4 (▲) mg/ml (with 0.03M added NaCl).
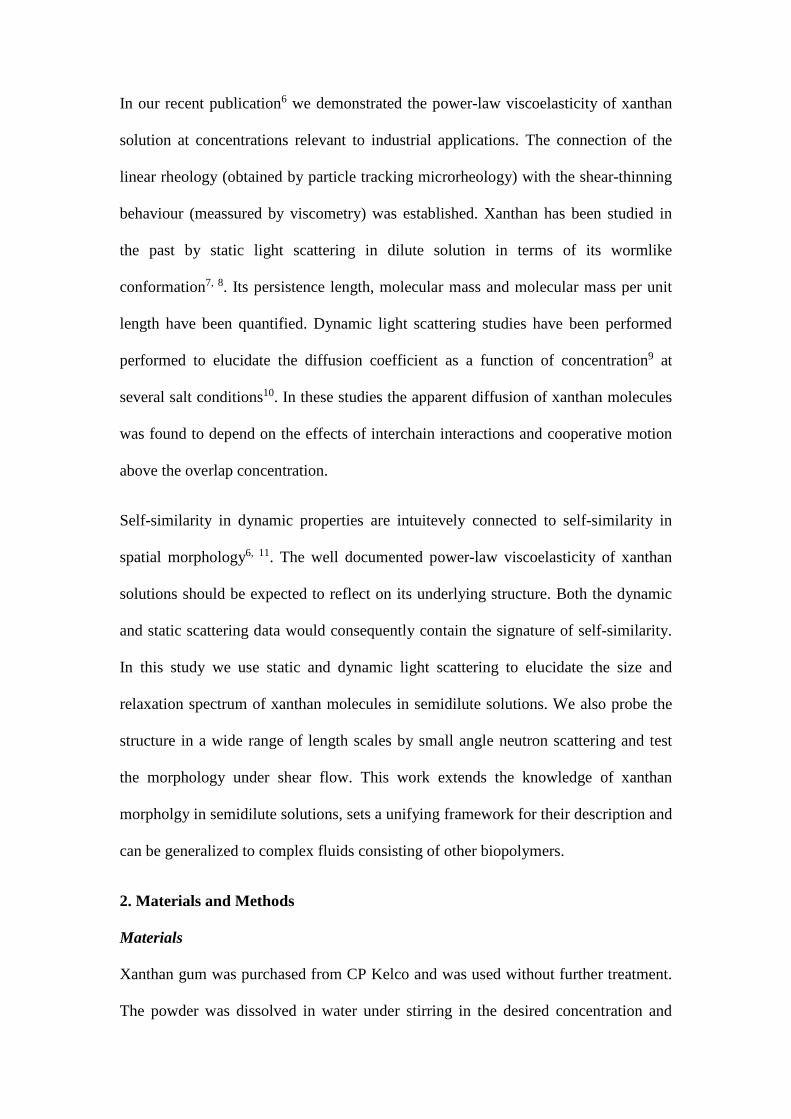
For sufficiently short times (𝜏𝜏/𝜏𝜏𝑟𝑟𝑒𝑒𝑟𝑟 ≪ 1) equation 3 is written as 𝑔𝑔1(𝜏𝜏) = 1 −
𝜏𝜏/(𝜏𝜏𝑟𝑟𝑒𝑒𝑟𝑟/𝛼𝛼) and the initial decay rate 𝛤𝛤 = 𝜏𝜏𝑟𝑟𝑒𝑒𝑟𝑟/𝛼𝛼 is extracted. It is obvious that the
apparent diffusion coefficient 𝛤𝛤/𝑞𝑞2 has a strong q dependence and no systematic
concentration dependence (figure 4). The 𝛤𝛤~𝑞𝑞3 is expected from clusters near the
critical point23 and also from Zimm model i.e. internal chain dynamics with
unscreened hydrodynamic interactions. The straight line in figure 4 is the Zimm
prediction24 𝛤𝛤 = 0.061 ∙ 𝑘𝑘𝑘𝑘𝜂𝜂𝑠𝑠𝑞𝑞3. Since xanthan solutions show self-similar properties in
rheology and power law behaviour in 𝑔𝑔(2)(𝜏𝜏) (DLS) we believe that this feature is
connected to the interchain associations and not to internal Zimm dynamics.
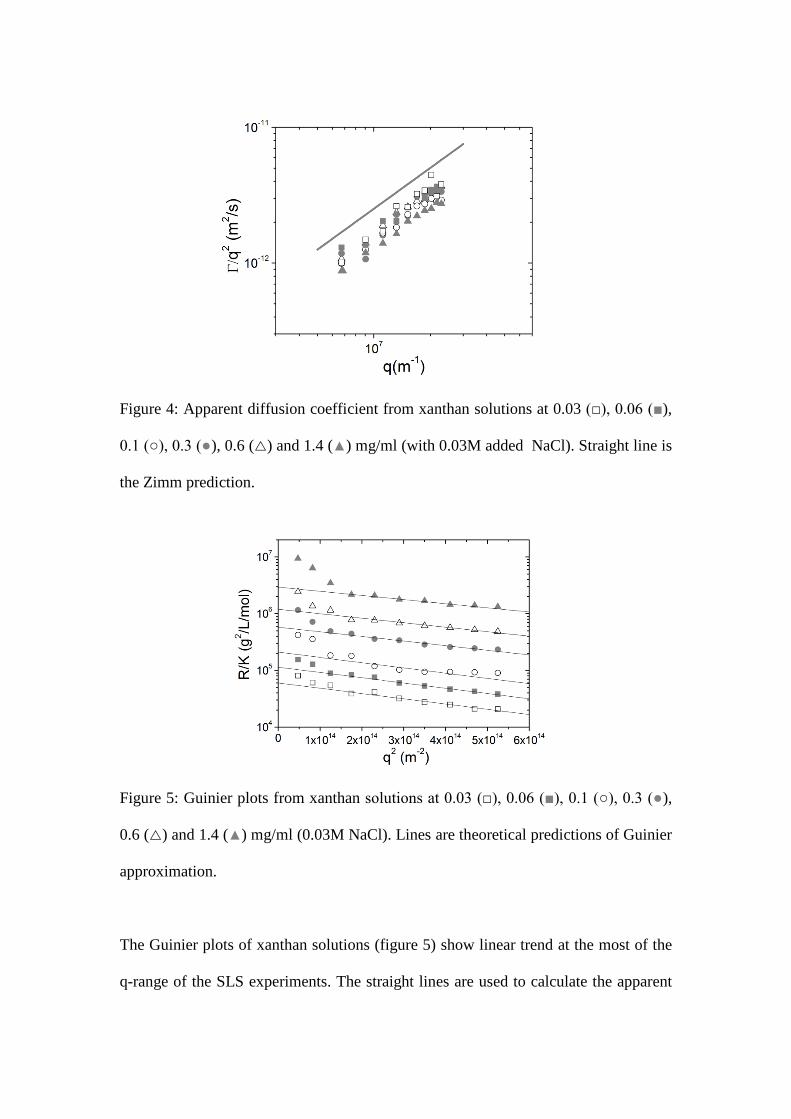
Figure 4: Apparent diffusion coefficient from xanthan solutions at 0.03 (□), 0.06 (■),
0.1 (○), 0.3 (●), 0.6 () and 1.4 (▲) mg/ml (with 0.03M added NaCl). Straight line is
the Zimm prediction.
Figure 5: Guinier plots from xanthan solutions at 0.03 (□), 0.06 (■), 0.1 (○), 0.3 (●),
0.6 () and 1.4 (▲) mg/ml (0.03M NaCl). Lines are theoretical predictions of Guinier
approximation.
The Guinier plots of xanthan solutions (figure 5) show linear trend at the most of the
q-range of the SLS experiments. The straight lines are used to calculate the apparent
radius of gyration and molecular weight from equation 4 which originates from
equation 1. As the extracted parameters do not present any systematic variation as
concentration increases their average values are presented i.e. 𝑅𝑅𝑔𝑔 = 77 ± 4 𝑠𝑠𝑛𝑛 and
𝑀𝑀 = (2.0 ± 0.1) ∙ 106 𝑔𝑔/𝑛𝑛𝑚𝑚𝑚𝑚. Xanthan in its native state prepared in unpurified
commercial form has high polydispersity with an average molecular weight about 1-
2∙106 g/mol. Previous works have used fractionated and purified samples at very low
concentrations to estimate the molecular weight distribution and the Rg dependence
on molecular weight 7, 8. This molecular weight of about 2∙106 g/mol (with PDI~2) has
been also reported in other works25, 26. The agreement with literature is remarkable
since we test unfractionated solutions in the semidilute regime. The low-q upturn of
the Guinier plots becomes more intense as concentration increases and reveal the
structural cause (chain interconnection) of the power-law dynamics in DLS i.e. the
restriction of chain dynamics at large length scales. It is in any case clear that the SLS
scattering profile is dominated by the single-chain form factor for the concentrations
studied by LS (up to 1.4 mg/ml).
𝑅𝑅𝐾𝐾
= 𝑀𝑀 ∙ 𝑐𝑐 ∙ 𝑒𝑒𝑒𝑒𝑒𝑒 �− 13𝑞𝑞2𝑅𝑅𝑔𝑔2� (4)

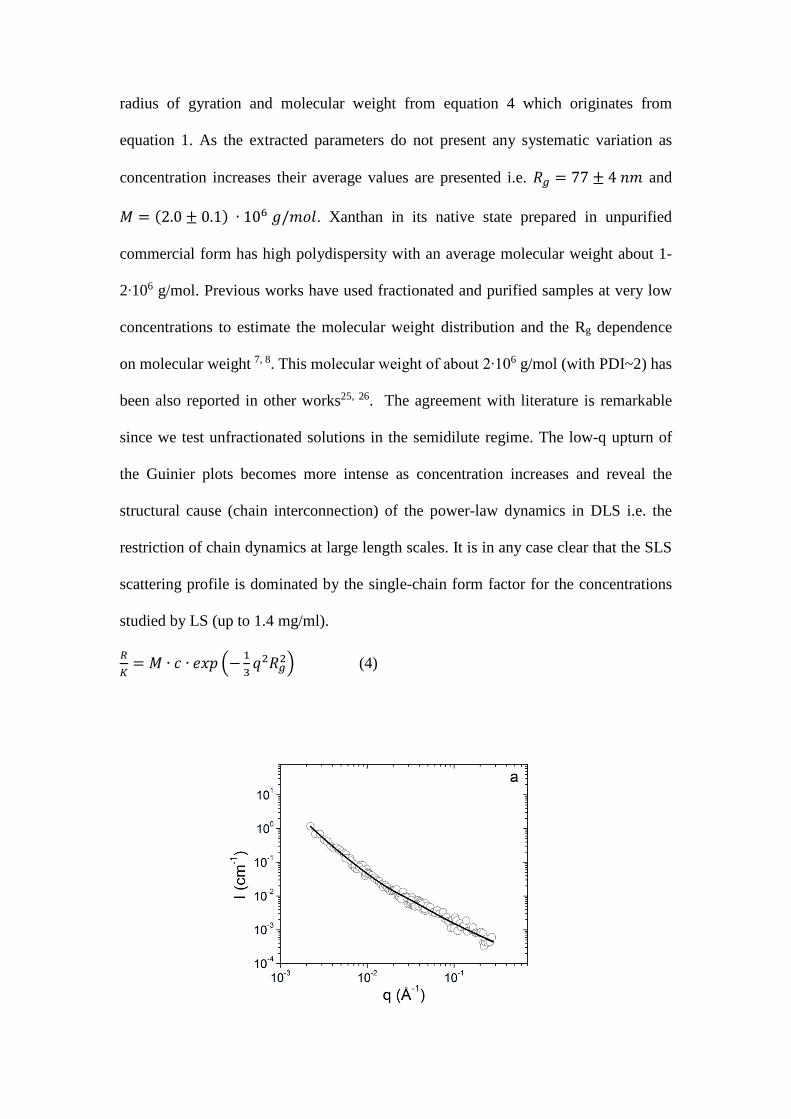
Figure 6: SANS profiles from xanthan solutions at (a) 1, (b) 3 mg/ml at 1000 rad/s
and (c) 10 mg/ml at 100 rad/s with 0.03M added NaCl. Lines are fits to the data as
explained in the text. In (c) the separate contributions at long (1) and short (2) length
scales are shown.
We tested four concentrations of xanthan with SANS with 1 mg/ml as the lowest
polymer content with adequate scattered intensity. The measurements were performed

at rest and under shear in Couette flow. Hence shear rates of 0, 10, 100 and 1000 rad/s
were tested. The steady shear viscosity was consistent with the documented shear-
thinning behaviour which confirmed the good shear flow conditions in our Rheo-
SANS experiments (data not shown). No systematic change caused by shear flow was
observed in the 𝐼𝐼(𝑞𝑞) profiles up to the highest attempted shear rate. Additionally no
anisotropy was found in the 2-D 𝐼𝐼(�⃗�𝑞) data. This brings two conclusions: (1) there is
no flow alignment of the xanthan molecules at the length scales probed by SANS and
(2) the shear-thinning properties possibly originate from the disuption of the soft
helix-helix associations. Borsali et al. performed Rheo-SANS in salt-free xanthan
solutions27 at the range 0.02 Å−1 < 𝑞𝑞 < 0.2 Å−1. They found a gradual increase of the
SANS intensity at the polyelectrolyte peak but no shift in peak position from 500 to
12000 s-1. Also anisotrpic profiles were observed under flow. Our experiments were
performed in helix stabilizing salt content and consequently stronger associations
would be expected in comparison to the polyelectrolyte coils in salt-free solutions.
Apparently the shear alignment observed by Borsali et al. is caused by the effect of
high shear rate on individual xanthan molecules.
The SANS profiles from xanthan solutions (figure 6) were insensitive to flow as
discussed above and hence are presented in randomly chosen shear rates. There are
two power-law regimes separated at intermediate q-range (0.02-0.03 Å-1). There is a
weak enhancement of scattering at the onset of the high-q power-law (0.04-0.05 Å-1)
mostly visible at 10 mg/ml. We have modelled the SANS data with a superposition of
terms from equation 5. For the data of figure 6 we have used 𝐼𝐼(𝑞𝑞) = 𝐼𝐼1(𝑞𝑞) + 𝐼𝐼2(𝑞𝑞).
The term 𝐼𝐼1(𝑞𝑞) is the unified Beaucage model28 where the Guinier term is bridged
with the power-law term by relating the prefactors29 𝐺𝐺1 and 𝐵𝐵1. The term 𝐼𝐼2(𝑞𝑞) is a
power-law term that is modified by an error-function in order to have negligible
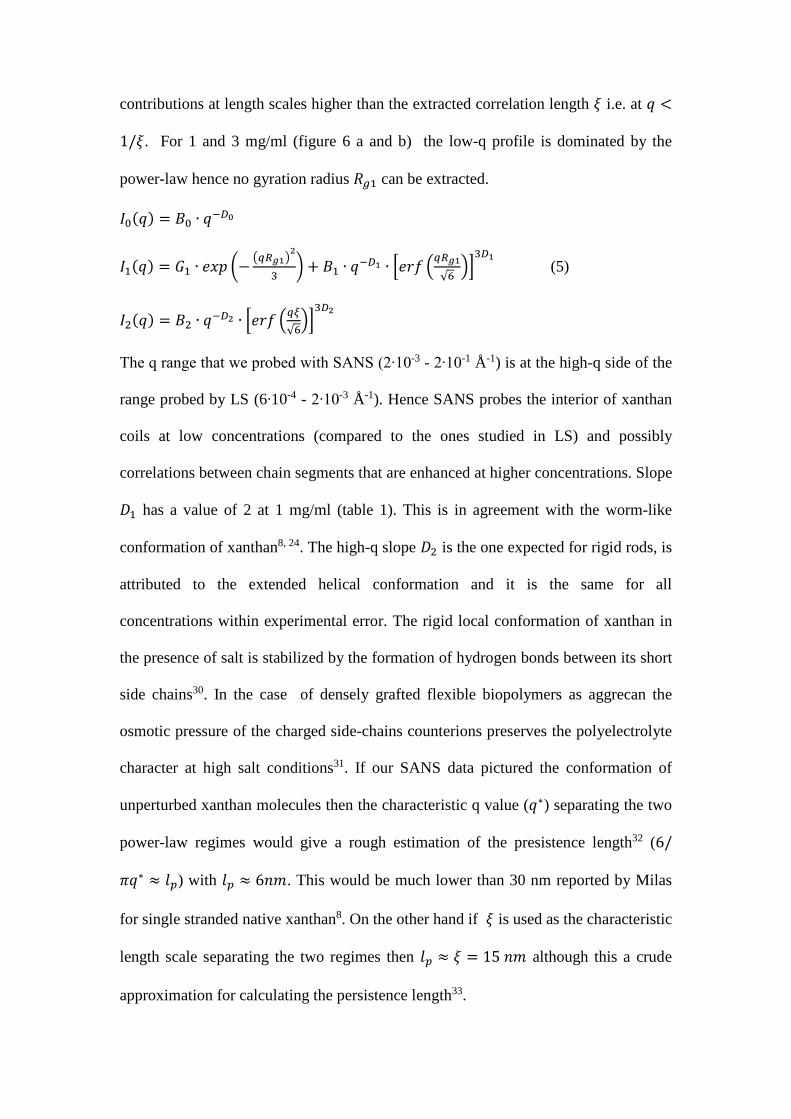
contributions at length scales higher than the extracted correlation length 𝜉𝜉 i.e. at 𝑞𝑞 <
1/𝜉𝜉. For 1 and 3 mg/ml (figure 6 a and b) the low-q profile is dominated by the
power-law hence no gyration radius 𝑅𝑅𝑔𝑔1 can be extracted.
𝐼𝐼0(𝑞𝑞) = 𝐵𝐵0 ∙ 𝑞𝑞−𝐷𝐷0
𝐼𝐼1(𝑞𝑞) = 𝐺𝐺1 ∙ 𝑒𝑒𝑒𝑒𝑒𝑒 �−�𝑞𝑞𝑅𝑅𝑔𝑔1�
2
3� + 𝐵𝐵1 ∙ 𝑞𝑞−𝐷𝐷1 ∙ �𝑒𝑒𝑒𝑒𝑒𝑒 �
𝑞𝑞𝑅𝑅𝑔𝑔1√6
��3𝐷𝐷1
(5)
𝐼𝐼2(𝑞𝑞) = 𝐵𝐵2 ∙ 𝑞𝑞−𝐷𝐷2 ∙ �𝑒𝑒𝑒𝑒𝑒𝑒 �𝑞𝑞𝑞𝑞√6��3𝐷𝐷2
The q range that we probed with SANS (2∙10-3 - 2∙10-1 Å-1) is at the high-q side of the
range probed by LS (6∙10-4 - 2∙10-3 Å-1). Hence SANS probes the interior of xanthan
coils at low concentrations (compared to the ones studied in LS) and possibly
correlations between chain segments that are enhanced at higher concentrations. Slope
𝐷𝐷1 has a value of 2 at 1 mg/ml (table 1). This is in agreement with the worm-like
conformation of xanthan8, 24. The high-q slope 𝐷𝐷2 is the one expected for rigid rods, is
attributed to the extended helical conformation and it is the same for all
concentrations within experimental error. The rigid local conformation of xanthan in
the presence of salt is stabilized by the formation of hydrogen bonds between its short
side chains30. In the case of densely grafted flexible biopolymers as aggrecan the
osmotic pressure of the charged side-chains counterions preserves the polyelectrolyte
character at high salt conditions31. If our SANS data pictured the conformation of
unperturbed xanthan molecules then the characteristic q value (𝑞𝑞∗) separating the two
power-law regimes would give a rough estimation of the presistence length32 (6/
𝜋𝜋𝑞𝑞∗ ≈ 𝑚𝑚𝑒𝑒) with 𝑚𝑚𝑒𝑒 ≈ 6𝑠𝑠𝑛𝑛. This would be much lower than 30 nm reported by Milas
for single stranded native xanthan8. On the other hand if 𝜉𝜉 is used as the characteristic
length scale separating the two regimes then 𝑚𝑚𝑒𝑒 ≈ 𝜉𝜉 = 15 𝑠𝑠𝑛𝑛 although this a crude
approximation for calculating the persistence length33.

Table 1: Extracted parameters from SANS experiments on xanthan solutions at
several concentrations (with 0.03 M NaCl).
𝑐𝑐
�𝑛𝑛𝑔𝑔𝑛𝑛𝑚𝑚 �
𝐷𝐷0
𝐼𝐼�0.008Å−1�
(𝑐𝑐𝑛𝑛−1)
𝑅𝑅𝑔𝑔,1
(𝑠𝑠𝑛𝑛) 𝐷𝐷1
𝐵𝐵2
�10−5𝑐𝑐𝑛𝑛−1Å−𝑑𝑑𝑙𝑙�
𝜉𝜉
(𝑠𝑠𝑛𝑛) 𝐷𝐷2
1 - 0.06±0.01 - 2.0±0.1 11±1 15±3 1.00±0.01
3 - 0.31±0.02 - 2.63±0.05 41±7 13±2 0.99±0.01
8 3.3±0.2 0.49±0.01 80±3 2.76±0.05 82±4 11±1 0.99±0.01
10 3.9±0.1 0.35±0.01 57±1 2.59±0.06 107±2 9±1 1.03±0.02
The high polydispersity of xanthan solutions results from the clustering between
chains. At 1 mg/ml as revealed by DLS large clusters have been already formed. At
length scales higher than 𝜉𝜉 the self-similar nature of xanthan solutions is revealed. It
is a loose mass fractal at low concentrations (𝐷𝐷1 = 2) while at higher concentrations
more contacts between chains form (𝐷𝐷1 ≈ 2.6) as presented in table 1. This is
complementary to the dynamic view from DLS. The decreasing dynamic scaling
exponent (figure 3) that highlights the formation of large interconnected clusters is
accompanied by the increase in the fractal exponents in the smaller length scales
observed by SANS. The scaling exponents 𝐷𝐷1 are different and hence it is not
informative to compare the prefactors 𝐵𝐵1. To compare between scattered intensity at
different concentrations we present the low-q SANS intensity at a certain q i.e. 0.008
Å-1 (table 1). It is clear the SANS intensity at this range is not proportional to
concentration (as in SLS) which is related to the change in fractal morphology and
chain interconnectivity as concentration increases.
The correlation length shows a weak decrease as a function of concentration. This is a
remarkable feature of the non-trivial interchain interactions. In this complex system

there must exist both overlaping and isolated chain segments at length scales up to 𝜉𝜉.
In other words there are parts of the solution where a semidilute polyelectrolyte
solution is formed and others where the chain segments are dilute. This should be the
reason why xanthan solutions have shown signature of flexible linear/comb
polyelectrolyte rheology6 with simultaneous presence of self-similar complex fluid
viscoelasticity. In a semidilute solution of linear or comb flexible polyelectrolytes34, 35
the correlation length decreases as a function of concentration as 𝜉𝜉 ≈ �𝐵𝐵𝑏𝑏�1/2
∙ 𝑐𝑐−1/2.
Where 𝑏𝑏 is the monomer length and 𝐵𝐵 the extension parameter i.e. the contour length
to chain length ratio in dilute solution. 𝐵𝐵 can be defined locally as 𝜉𝜉~𝑔𝑔 where 𝑔𝑔 is the
number of monomers within one electrostatic blob36. In xanthan one can definitely
use 𝐵𝐵 = 1 as will be discussed in the next paragraph. Using 𝑏𝑏 = 1 𝑠𝑠𝑛𝑛 for its
monomer length8 the scaling prediction is presented next to the experimentally
observed 𝜉𝜉 in figure 7a. The predicted values are near the observed ones but the
experimental concentration dependence is weaker because of the complications
introduced by the helix-helix associations. At even higher concentrations where most
of the chain segments would be overlaping we would expect the ½ scaling to be
recovered. The concentration dependence in figure 7a is better described as 𝜉𝜉~𝑐𝑐−1/4.
Borsali et al.37 have indeed observed 𝜉𝜉~𝑐𝑐−1/2 at higher polymer concentrations.
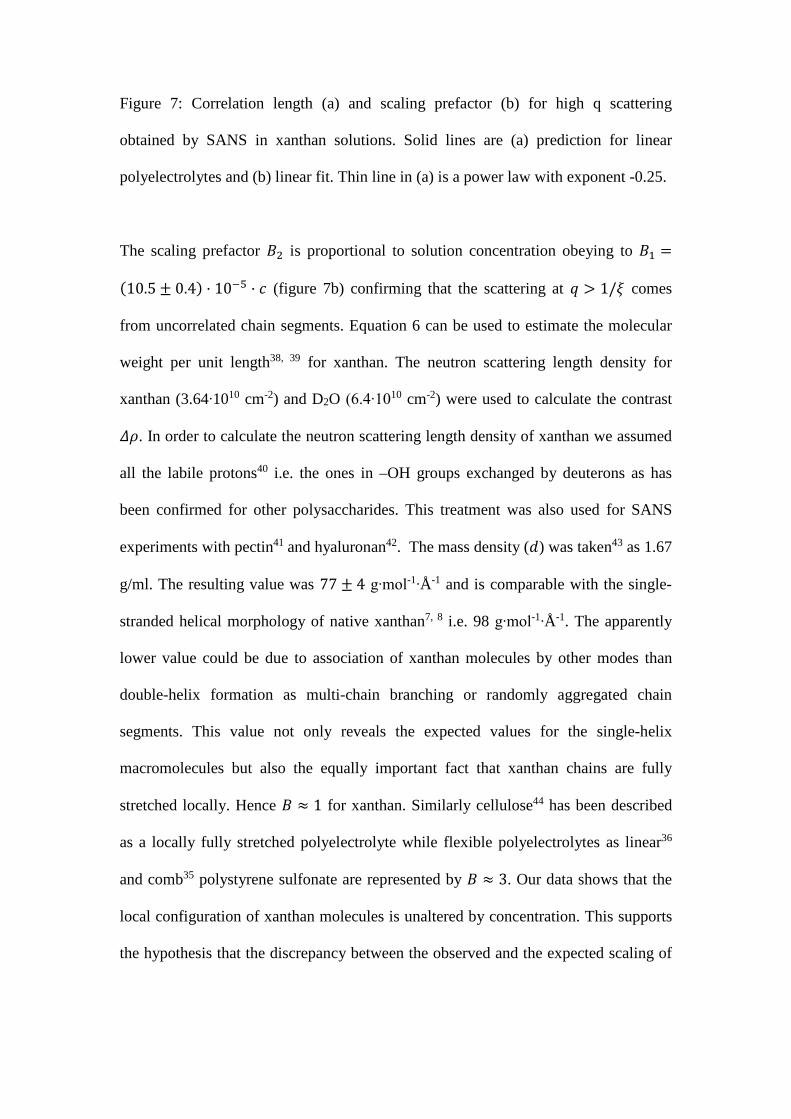
Figure 7: Correlation length (a) and scaling prefactor (b) for high q scattering
obtained by SANS in xanthan solutions. Solid lines are (a) prediction for linear
polyelectrolytes and (b) linear fit. Thin line in (a) is a power law with exponent -0.25.
The scaling prefactor 𝐵𝐵2 is proportional to solution concentration obeying to 𝐵𝐵1 =
(10.5 ± 0.4) · 10−5 · 𝑐𝑐 (figure 7b) confirming that the scattering at 𝑞𝑞 > 1/𝜉𝜉 comes
from uncorrelated chain segments. Equation 6 can be used to estimate the molecular
weight per unit length38, 39 for xanthan. The neutron scattering length density for
xanthan (3.64∙1010 cm-2) and D2O (6.4∙1010 cm-2) were used to calculate the contrast
𝛥𝛥𝜌𝜌. In order to calculate the neutron scattering length density of xanthan we assumed
all the labile protons40 i.e. the ones in –OH groups exchanged by deuterons as has
been confirmed for other polysaccharides. This treatment was also used for SANS
experiments with pectin41 and hyaluronan42. The mass density (𝑑𝑑) was taken43 as 1.67
g/ml. The resulting value was 77 ± 4 g∙mol-1∙Å-1 and is comparable with the single-
stranded helical morphology of native xanthan7, 8 i.e. 98 g∙mol-1∙Å-1. The apparently
lower value could be due to association of xanthan molecules by other modes than
double-helix formation as multi-chain branching or randomly aggregated chain
segments. This value not only reveals the expected values for the single-helix
macromolecules but also the equally important fact that xanthan chains are fully
stretched locally. Hence 𝐵𝐵 ≈ 1 for xanthan. Similarly cellulose44 has been described
as a locally fully stretched polyelectrolyte while flexible polyelectrolytes as linear36
and comb35 polystyrene sulfonate are represented by 𝐵𝐵 ≈ 3. Our data shows that the
local configuration of xanthan molecules is unaltered by concentration. This supports
the hypothesis that the discrepancy between the observed and the expected scaling of
the correlation lentgh is indeed connected with the complex network formation as
discussed above and not with any order-disorder transition.
𝑀𝑀𝐿𝐿
= 𝐵𝐵1𝛮𝛮𝛢𝛢𝑑𝑑2
𝜋𝜋𝐾𝐾𝛥𝛥𝛥𝛥2 (6)
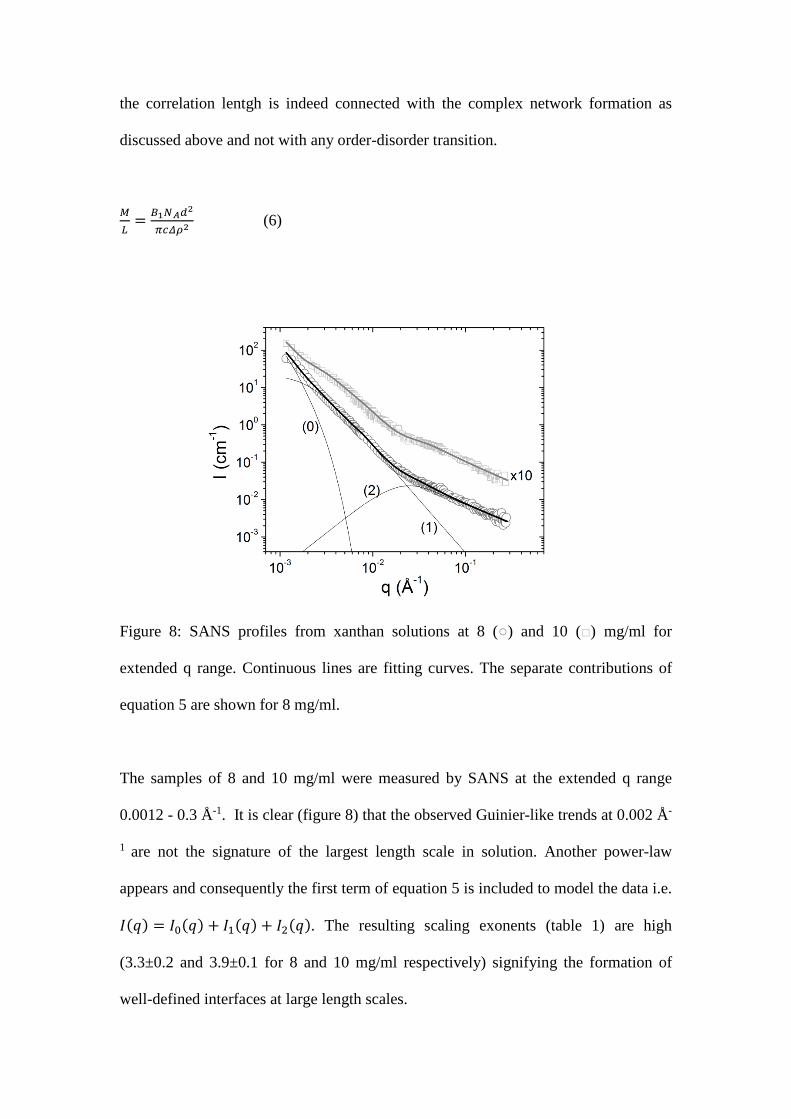
Figure 8: SANS profiles from xanthan solutions at 8 (○) and 10 (□) mg/ml for
extended q range. Continuous lines are fitting curves. The separate contributions of
equation 5 are shown for 8 mg/ml.
The samples of 8 and 10 mg/ml were measured by SANS at the extended q range
0.0012 - 0.3 Å-1. It is clear (figure 8) that the observed Guinier-like trends at 0.002 Å-
1 are not the signature of the largest length scale in solution. Another power-law
appears and consequently the first term of equation 5 is included to model the data i.e.
𝐼𝐼(𝑞𝑞) = 𝐼𝐼0(𝑞𝑞) + 𝐼𝐼1(𝑞𝑞) + 𝐼𝐼2(𝑞𝑞). The resulting scaling exonents (table 1) are high
(3.3±0.2 and 3.9±0.1 for 8 and 10 mg/ml respectively) signifying the formation of
well-defined interfaces at large length scales.

4. Conclusions
The structural properties of native xanthan solutions in the semidilute regime were
investigated by small angle neutron scattering and light scattering. At relatively low
concentrations the static light scattering profiles were compatible with the expected
molecular weight and gyration radius of xanthan. As concentration increased a low-q
upturn highlighted the formation of helix-helix associations between separate xanthan
molecules. These associations create fractal networks that are responsible for the self-
similar dynamic nature of this biopolymer. The effect was observed in dynamic light
scattering where the intensity autocorrelation functions showed power-law behaviour
with exponents that depended on both length scale and concentration. Additionally the
initial relaxation rate was not diffusive, obeyed Zimm scaling and was independent of
concentration. Small angle neutron scattering probed the molecular arrangements at
intermediate and short length scales. Fractal-like correlations were observed above the
correlation length while the rod-like scattering at shorter length scales was used to
quantify the molecular mass per unit length in xanthan. Structural arrangements and
correlations did not seem to be affected by shear flow up to 1000 rad/s in the length
scales probed by SANS. Consequently xanthan’s shear-thinning behaviour is
connected to the breaking and re-formation of chain-chain associations and not to
molecular flow alignment. This work describes the morphology and dynamics of
xanthan solutions in an attempt to explain their viscoelastic properties and can be
generalized to other polysaccharides.
5. Acknowledgements
Small angle neutron scattering experiments have been supported by the European
Commission under the 7th Framework Programme through the 'Research
Infrastructures' action of the 'Capacities' Programme, NMI3-II Grant number 283883.

References
1. G. Sworn, in Food Stabilisers, Thickeners and Gelling Agents, Wiley-Blackwell, 2009, DOI: 10.1002/9781444314724.ch17, pp. 325-342.
2. S. A. Frangou, E. R. Morris, D. A. Rees, R. K. Richardson and S. B. Ross-Murphy, Journal of Polymer Science: Polymer Letters Edition, 1982, 20, 531-538.
3. G. Muller, M. Aurhourrache, J. Lecourtier and G. Chauveteau, International Journal of Biological Macromolecules, 1986, 8, 167-172.
4. Y. Luo and Q. Wang, International Journal of Biological Macromolecules, 2014, 64, 353-367.
5. B. Katzbauer, Polymer Degradation and Stability, 1998, 59, 81-84. 6. A. Papagiannopoulos, K. Sotiropoulos and S. Pispas, Food Hydrocolloids, 2016, 61,
201-210. 7. Y. Matsuda, Y. Biyajima and T. Sato, Polym. J, 2009, 41, 526-532. 8. M. Milas, W. F. Reed and S. Printz, International Journal of Biological
Macromolecules, 1996, 18, 211-221. 9. P. D. Oliveira, R. C. Michel, A. J. A. McBride, A. S. Moreira, R. F. T. Lomba and C. T.
Vendruscolo, PLoS ONE, 2013, 8, e62713. 10. A. B. Rodd, D. E. Dunstan and D. V. Boger, Carbohydrate Polymers, 2000, 42, 159-
174. 11. T. A. Vilgis and H. H. Winter, Colloid and Polymer Science, 266, 494-500. 12. C.-E. Brunchi, S. Morariu and M. Bercea, Colloids and Surfaces B: Biointerfaces, 2014,
122, 512-519. 13. I. T. Norton, D. M. Goodall, S. A. Frangou, E. R. Morris and D. A. Rees, Journal of
Molecular Biology, 1984, 175, 371-394. 14. A. Papagiannopoulos, M. Karayianni, G. Mountrichas, S. Pispas and A. Radulescu,
Polymer, 2015, 63, 134-143. 15. B. J. Berne and R. Pecora, Dynamic Light Scattering, With Applications to Chemistry,
Biology, and Physics, Dover, Toronto, 2000. 16. J. G. Barker and J. S. Pedersen, J. Appl. Crystallogr., 1995, 28, 105-114. 17. D. Vanderbilt and S. G. Louie, Journal of Computational Physics, 1984, 56, 259-271. 18. J. E. Martin, J. Wilcoxon and J. Odinek, Physical Review A, 1991, 43, 858-872. 19. S. Z. Ren, W. F. Shi, W. B. Zhang and C. M. Sorensen, Physical Review A, 1992, 45,
2416-2422. 20. T. Norisuye, M. Inoue, M. Shibayama, R. Tamaki and Y. Chujo, Macromolecules,
2000, 33, 900-905. 21. B. Nystrom, H. Walderhaug and F. K. Hansen, Faraday Discussions, 1995, 101, 335-
344. 22. T. Coviello, W. Burchard, E. Geissler and D. Maier, Macromolecules, 1997, 30, 2008-
2015. 23. H. C. Burstyn and J. V. Sengers, Physical Review Letters, 1980, 45, 259-262. 24. W. Burchard, in Soft Matter Characterization, eds. R. Borsali and R. Pecora, Springer
Netherlands, Dordrecht, 2008, DOI: 10.1007/978-1-4020-4465-6_9, pp. 463-603. 25. E. Pelletier, C. Viebke, J. Meadows and P. A. Williams, Biopolymers, 2001, 59, 339-
346. 26. N. B. Wyatt and M. W. Liberatore, Soft Matter, 2010, 6, 3346-3352. 27. M. Milas, P. Lindner, M. Rinaudo and R. Borsali, Macromolecules, 1996, 29, 473-474. 28. A. Papagiannopoulos, J. Zhao, G. Zhang, S. Pispas and A. Radulescu, Polymer, 2013,
54, 6373-6380. 29. B. Hammouda, Journal of Applied Crystallography, 2010, 43, 1474-1478. 30. W. E. Rochefort and S. Middleman, Journal of Rheology, 1987, 31, 337-369.

31. A. Papagiannopoulos, T. A. Waigh, T. Hardingham and M. Heinrich, Biomacromolecules, 2006, 7, 2162-2172.
32. O. Kratky, Small-Angle X-ray Scattering, Academic Press: New York, 1982. 33. G. Beaucage, S. Rane, S. Sukumaran, M. M. Satkowski, L. A. Schechtman and Y. Doi,
Macromolecules, 1997, 30, 4158-4162. 34. A. Papagiannopoulos, C. M. Fernyhough and T. A. Waigh, The Journal of Chemical
Physics, 2005, 123, 214904. 35. A. Papagiannopoulos, C. M. Fernyhough, T. A. Waigh and A. Radulescu,
Macromolecular Chemistry and Physics, 2008, 209, 2475–2486. 36. A. V. Dobrynin, R. H. Colby and M. Rubinstein, Macromolecules, 1995, 28, 1859-
1871. 37. M. Milas, M. Rinaudo, R. Duplessix, R. Borsali and P. Lindner, Macromolecules, 1995,
28, 3119-3124. 38. Christopher B. Stanley, T. Perevozchikova and V. Berthelier, Biophysical Journal,
2011, 100, 2504-2512. 39. J. S. Pedersen, Advances in Colloid and Interface Science, 1997, 70, 171-210. 40. M. Gawronski, H. Conrad and T. Springer, Macromolecules, 1998, 31, 2549-2551. 41. I. Schmidt, F. Cousin, C. Huchon, F. Boué and M. A. V. Axelos, Biomacromolecules,
2009, 10, 1346-1357. 42. I. Morfin, E. Buhler, F. Cousin, I. Grillo and F. Boué, Biomacromolecules, 2011, 12,
859-870. 43. T. Sato, T. Norisuye and H. Fujita, Macromolecules, 1984, 17, 2696-2700. 44. C. G. Lopez, S. E. Rogers, R. H. Colby, P. Graham and J. T. Cabral, Journal of Polymer
Science Part B: Polymer Physics, 2015, 53, 492-501.