scatterplots tuesday & wednesday february 19 & 20
TRANSCRIPT

Scatterplots
Tuesday & Wednesday
February 19 & 20

Discovery Activity
Knotty ProblemWith your group, follow the directions printed on your paper using the string that your group has been given. Plot the points (without connecting the dots)Describe the relationship you see from your data and your graph. Be prepared to present your graph and compare your graph to the graphs that the other groups create.

What is a scatter plot?
A graph that is used to analyze the relationship between two quantities

Correlation


You are the manager of the high school soccer team. You are working on the team’s program guide and have recorded the height and weight of the eleven starting players in the given table.
a) Make a scatterplot of the data. Put height on the horizontal axis and weight on the vertical axis
b) Use the scatterplot to estimate the weight of a player who is 69 inches tall and of one who is 71 inches tall.
c) In general, how does weight change as height changes?
d) What would you expect a player who is 74 inches tall to weigh?
Height (in)
72 70
71 70
69 70 69
73 66
70
76
Weight (lb)
190
170
180
175
160
160
150
180
150
150
200

OnCore Sections 6.1 & 6.2
Bivariate Data
Thursday & Friday
February 21 & 22

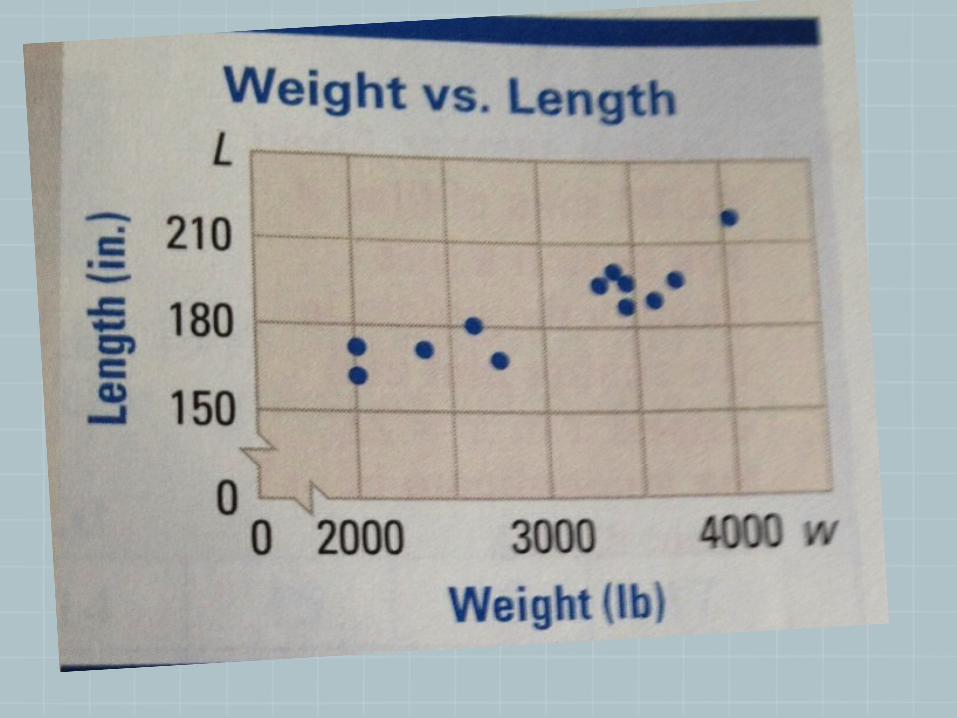
The amount (in millions of dollars) spent in the United States on snowmobiles and ski equipment is shown in the table.
a) Draw a scatter plot of each set of data in the same coordinate plane
b) Describe the pattern of the amount spent on snowmobiles
c) Describe the pattern of the amount spent on ski equipment.
Year 1990
1991
1992
1993
1994
1995
1996
Snowmobiles 322 362 391 515 715 924 970
Ski Equipment
606 577 627 611 652 607 644

The table shows the wing length in millimeters and the wing-beat rate in beats per second.
a) Draw a scatter plot of each set of data in the same coordinate plane
b) What is the slowest wing-beat rate shown on the scatter plot? What is the fastest? Where are these located on your scatter plot?
c) Describe the relationship between wing length and the wing-beat rate.
Bird Flamingo
Shellduck
Velvet
Scoter
Fulmar
Great
Egret
Wing Length 400 375 281 321 437
Wing-beat Rate
2.4 3.0 4.3 3.6 2.1