scgc04 pierre&dore
TRANSCRIPT

Pierre, Doré et Prophète
Characterization of tire impact on the pavement behaviour
Authors : Pascale PIERRE Research Associate Civil engineering department Laval University Québec, G1K 7P4 Canada Tel. : (418) 656-2131#4678 Fax: (418) 656-2928 [email protected] Guy DORÉ Professor Civil engineering department Laval University Québec, Canada Fritz PROPHÈTE Roadwork Service Québec Ministry of Transportation Québec, Canada

Pierre, Doré et Prophète
RÉSUMÉ L’article présente une recherche qui a fait suite à une étude menée par le Service des chaussées du Ministère des Transports du Québec sur les effets des largeurs de pneus. L’étude portait sur l’impact du pneu sur le revêtement de la chaussée et sur le comportement de la chaussée à la suite de cet impact. Les déformations à 25 mm de profondeur dans le revêtement, à la base du revêtement et au sommet du sol d’infrastructure ont été mesurées. Les mesures ont été effectuées durant deux saisons représentatives des conditions québécoises, soit au printemps et à l’été, en faisant varier trois paramètres, le type de pneu, la pression de gonflage du pneu et enfin la charge. L’amplitude des dommages produits par le passage du véhicule a ensuite été quantifiée afin d’évaluer et de comparer l’impact global des différents types de pneus sur la chaussée selon les diverses configurations.
Mots-clés: chaussée, revêtement, pneu, interface, déformation. ABSTRACT The paper presents research conducted following an investigation carried out by the Québec Ministry of Transportation’s Roadwork Service on the effects of tire width. The study consisted in the impact of tires on the surface layer of pavement and in the pavement behaviour as a result of this impact. The strains at a depth of 25 mm in the pavement, at the base of the pavement and at the top of the subgrade, were measured. Measures were taken over two seasons representative of conditions prevailing in Québec, in spring and in summer while varying three parameters, the type of tire, the inflation pressure of the tire and finally the load. Amplitude of damage produced by the circulation of a vehicle was then quantified in order to evaluate and compare the overall impact of various types of tires on pavement according to the various configurations.
Keywords: pavement, surface layer, tire, interface, strain.

Pierre, Doré et Prophète
1. INTRODUCTION 1.1. Presentation of the project The action exerted by a vehicle on pavement occurs through contact between rib-pavement at the tire-pavement interface. Contact pressures develop at this point and influence the response of the pavement to loads to which it is submitted. The study conducted included an evaluation of factors that characterize pavement surface load conditions for tires normally used on special vehicles. These factors are then determined for manufacturer-recommended inflation pressures and for the various loads applied. The research presented was carried out as part of a revision to special driving permits related to maximum admissible axle loads for special vehicles. The goal was to evaluate the aggressivity of various types of tires as well as the damage they can cause to pavement. Indeed, presently, within regulations pertaining to special driving permits used by the Québec Ministry of Transport, admissible axle loads for unconventional vehicles on the road network are specified in relation to axle spread and tire width. The goal of these specifications is to protect the pavement from excessively high localized loads. Recent studies have shown that at the rib-pavement point of contact, important pressures cause damage to pavement in the order of 80 to 200% higher than those evaluated with the existing method which supposes that tire capacity should be at most 10 kg/mm of tire width (Prophète, 1999). A model was therefore developed to determine tire-pavement contact pressure in relation to tire type (tires with 5 or 6 surface ribs), inflation pressure, and carrying load. Thus, according to load conditions and tire type, it is possible to evaluate the aggressivity of the tire as it travels over the pavement. The complexity of the tire-pavement interface was taken into account by including within the model tire stiffness, contact surface and contact pressure. In the context of model validation, the experiments conducted should allow the optimization of specifications related to heavy vehicles. 1.2. Objectives The main goal of this research was to provide a tool to evaluate the impact of tires on pavement that would make it possible to establish maximum admissible axle loads that will be specified in the revised regulations on special driving permits. The research should allow to validate the existing model through experimental data collected during the study. Indeed, the investigation described allowed to measure the response and evaluate the behaviour of a pavement in relation to tire type, load conditions, and inflation pressure. Deflections and strains, both vertical and horizontal, were measured on the pavement submitted to various loads, in order to validate the theoretical calculations carried out by the Québec Ministry of Transportation’s Roadwork Service. The specific objectives of this study were the following : • instrument the section reserved for analysis of the aggressivity of heavy vehicles (AHV) at
the Site expérimental routier de l’Université Laval (SERUL) in order to measure the response of pavement under various loads;

Pierre, Doré et Prophète
• carry out deflection and strain measures at various critical levels of the pavement; • measure the strains induced in the surface layer by the circulation of heavy vehicles in order
to evaluate the behaviour of the pavement at the tire-pavement interface; 2. INSTRUMENTATION OF THE PAVEMENT The objective of this study’s experimental program was to obtain data relative to the circulation of a vehicle on a pavement, both from the point of view of tire impact on the pavement and pavement behaviour following this impact. The instruments installed on the section at the SERUL enabled to measure strains at various critical levels of the roadway. The AVH section is equipped with fibre optic strain gauges to measure tensile strains at the base of the surface layer, as well as with multi-level deflectometres to measure vertical strains at various levels of the pavement. Moreover, fibre optic strain gauges installed within a plate placed inside the pavement made it possible to measure strains at a depth of 25 mm in the pavement. 3.1. Presentation of the experimental site The SERUL is situated in Montmorency forest, at kilometre 103 on route 175. The site is a new stretch of forest access route 33, specifically 3.3 km east of route 175. It is on the AVH section of this roadwork laboratory, measuring 100 metres in length, that tests for this project were carried out. The structure of the pavement at this location is as follows : • 100 mm of bituminous concrete pavement surface layer , • 200 mm of MG20, • 480 mm of MG 112, • 1370 mm of siltous till. This material makes up the pavement subgrade support and is the first
layer of natural soil under the infrastructure. • Following this 450 mm of wood and finally 270 mm of sandy silt were identified through test
drilling. 2.2. Instrumentation to measure deflections and strains in the roadway
On the AVH section at the SERUL, the following instrumentation was installed in the pavement in order to measure strains and deflections at various levels of the pavement: three strain gauges, as well as a multi-level deflectometer, arranged as indicated in Figure 1. Fibre optic strain gauges, numbered 5, 6, and 7 in Figure 1, were used to measure horizontal strains at the base of the surface layer. Gauges 6 and 7 allowed to measure longitudinal strains while gauge 5 was used to measure transversal strains. The multi-level deflectometre is composed of three rods whose extremeties are screwed to plates placed at the interface between the various layers of the pavement. Each rod is covered with a flexible tube which reduces rubbing between the rod and the surrounding soil. The plates were placed at depths of 300 mm, 800 mm, and 1100 mm from the surface, in a hole measuring 150 mm in diameter, drilled into the pavement (Figure 2). A fourth rod is anchored at 2500 mm to serve as reference, since it is considered that due to its depth, it does not experience any displacement. Thus, it is estimated that displacement of the transducer measured at the end of this
Pierre, Doré et Prophète
rod (deflectometer 1) corresponds to total deflection of the pavement, while the other transducers measure deflections related to various levels of the pavement. The multi-level deflectometre also includes a removable reading head made up of four fiber optic displacement transducers, supported by the rods, that is installed and removed each day measures are taken (Figure 3). 2.3. Instrumentation for measuring strains in the surface layer In order to quantify the impact of tires on pavement, strain measures were taken at a depth of 25 mm in the pavement, where shear stress is considered greatest. These measures were done using an instrumented plate. The design of this instrumented plate involved a choice of materials and subsequent laboratory testing to simulate the experiment which was carried out at the SERUL. Therefore, an epoxy/aggregate mixture was made in order to: • reproduce the heterogeneity of a bituminous concrete, that is aggregate coated by a matrix, so
that the response of the plate’s composite material may be as close as possible to that of a standard surface layer,
• move away from the phenomenom of creep of bituminous concrete during temperature increase, that is from the viscoelastic behaviour of betuminous concrete, as testing was done in summer under quasi-static condition.
The instrumented plate was made following the steps below : • first, a 75-mm thick coat of the epoxy/aggregate mixture was poured into the mold, • ribs were then made to place the thermistors, • the following step consisted in placing the remaining 25 mm to reach the total thickness of the
plate, • to place the vertical gauges, holes were drilled from the bottom of the mold so that the
extremity of the gauges is 75 mm from the base of the plate. The placing of the instrumented plate onto the support base (Figure 4) was done each day measures were taken. Therefore, the arrangement of gauges on the plate made it possible to measure strains at a depth of 25 mm, in a material whose behavior is close to that of a bituminous concrete. 3. MEASURES 3.1. Experimental protocol The goal of this study was to measure deflections and strains at various levels in the pavement for different load conditions. Pavement load conditions vary according to the periods of measure, in spring, a period of thawing, and in summer, a period during which no freezing of the structure of the pavement occurs. Configurations were obtained by varying tire type, tire load, as well as tire inflation pressure. Therefore, tests were carried out on fifteen configurations, using: • Four types of tires (Figure 5): two types of twin tires 11R22.5 (Bridgestone) and 12R22.5
(Michelin), and two types of single wide tires 385/65R22.5 (Michelin) and extra-wide 455/55R22.5 (Michelin).
• Five loads: 3000, 4000, 5000, 6000 and 7000 kg/half axle (two twin tires equivalent to one single tire). These loads were obtained through the installation, before the beginning of tests, of concrete blocks weighing 2200 kg each.

Pierre, Doré et Prophète
• Three inflation pressures: 560, 730, and 900 kPa. These inflation pressures were chosen to cover the range of commonly used pressures.
Spring and summer tests were carried out in the following manner for each load: • Strain and deflection measures after a run by the Benkelman, a reference vehicle equipped
with a rear single axle and twin tires inflated to 550 kPa and loaded to 8165 kg/axle. • Record temperatures at different depths of the pavement, using thermistors. • Fixing of concrete blocks to the trailer of the truck (Figure 6). • Verification of tire loads, using a mobile scale placed under each tire on both rear axles of the
truck (Figure 7). These measures were taken close to the instrumented zone in order to obtain the same loading conditions as during the run of the vehicle over the transducers.
• Strain and deflection measures for both valid runs of the truck, at 50 km/h. • Deflation of the tires to 730 kPa and then 560 kPa. The subsequent steps (taking of tire prints,
measures of tire height, and strains and deflections) were repeated for both other inflation pressures.
4. PRESENTATION AND ANALYSIS OF RESULTS 4.1. Pavement behaviour In order to evaluate the effect of tires on pavement behaviour, pavement response parameters were defined. Thus, a flexible pavement, such as found at the SERUL, undergoes two types of degradation: fatigue cracking and rutting (Sebaaly, 1992). Maximum loading at the base of the surface layer is responsible for fatigue cracking while structural rutting is caused by the accumulation of vertical loads at the top layer of subgrade (Figure 8). Therefore, fatigue cracking and rutting constitute the main pavement damage criteria in most studies undertaken on the topic (Owende et al., 2001).
For these reasons, the present investigation seeks to first evaluate these parameters using strain measures at the base of the surface layer and at the top of the subgrade in order to compare their influence for each tire type. Secondly, the investigation will look at creep rutting using strain measures at a depth of 25 mm in the surface layer. 4.2. Deflections and strains of the pavement The multi-level deflectometer’s displacement transducers and the strain strain gauges at the base of the pavement use fibre optic wires for signal propagation (Doré et Duplain, 2002). It was therefore surface layer to use a specific data acquisition system. This system is made up of an instrument that emits and receives a light signal (BUS instrument) and a laptop computer to collect measures using data acquisition software. The data was collected at a frequency of 500 Hz. Deflectometre data were collected in file format using a computer in which deflection measures are given over time. Typical signals obtained for the multi-level deflectometre are presented in Figure 9. The first three peaks represent the run of the truck’s single axle and twin axles, whereas the following two represent the truck’s rear twin axles. Each curve represents measures obtained for one of four deflectometer plates.

Pierre, Doré et Prophète
In this study, measures accounted for are those of the truck’s first exterior rear axle. This is why a reset was done before the fourth peak, to cancel the effects of other axles.
As was done previously for deflections, data from strain gauges at the base of the pavement were collected on a computer in file format giving strain measures over time. Strains were measured in two directions, longitudinally and transversally to the direction of the truck. According to certain authors, fatigue cracking originates from lateral (transversal) loads, while longitudinal loads are responsible for their extension and widening (Owende et al., 2001). Typical signals obtained for longitudinal and transversal strains are presented in Figures 10 and 11, respectively.
The curves present five strain peaks representing each axle of the truck. Since loads are directly proportional to strains, curves in Figure 10 show the beginning of small compressive loads (negative values) at the base of the pavement as the wheel gets closer and the development of tensile loads (positive values) after the wheel has passed. Each passage of a wheel is considered as independent as loads dissipate quickly. On the contrary, transversal loads (Figure 11) dissipate slowly, a phenomenon associated with the viscoelastic behaviour of the surface layer (Owende et al., 2001). 4.2.1. Strains at the top of the subgrade The goal of this part of the investigation is to evaluate the impact of different tires in terms of strains at the top of the subgrade. Measures taken using the multi-level deflectometre provide this information. Indeed, the multi-level deflectometre is made up of four plates situated at different depths in the roadway. Plates 2 and 3 are located at 1100 and 800 mm in depth, respectively. The layer between these two plates corresponds to the top 300 mm of the subgrade. The deflection of this layer is obtained by subtracting the values of the rod anchored at the top of the layer to that of the rod anchored at the base, that is "deflectometre 2 -deflectometre 3". The strain is then obtained by dividing the deflection of the layer by its thickness, that is 300 mm. To obtain strains at the top of the subgrade, the following relation was applied:
mmtredeflectomeofvaluespeaktredeflectomeofvaluespeak
stress300
32 −=
It should be noted that deflections, before being transformed into strains, were normalized in relation with the Benkelman vehicle, as to load, pressure, and tire type. Due to this normalization, deflections values were transformed in relation to the effect of external factors on the behaviour of the pavement itself, such as temperature. Theoretical deflection values for the Benkelman vehicle were also used to integrate variations in measures due in particular to differences in wheel position on the multi-level deflectometre’s sensor.
Both in spring and summer, overall results indicate little or no strains deep in the pavement. Moreover, these strains at the top of the subgrade seem to depend neither on tire type nor inflation pressure or load. 4.2.2. Strains at the base of the surface layer For both testing periods, spring and summer, only the greatest of the two strain values at the base of the surface layer, longitudinal or transversal, was used in the analysis of the most critical strain in terms of fatigue cracking. In the same way, the greatest strain value, both longitudinal and transversal, obtained at the base of the surface layer during passage of the Benkelman vehicle

Pierre, Doré et Prophète
was kept. It should be noted that maximum strains were normalized in relation to the Benkelman vehicle, in terms of load, pressure, and tire type. Maximum strain values normalized at the base of the surface layer were then transformed into the number of loads applied (N) using the Asphalt Institute’s fatigue model:
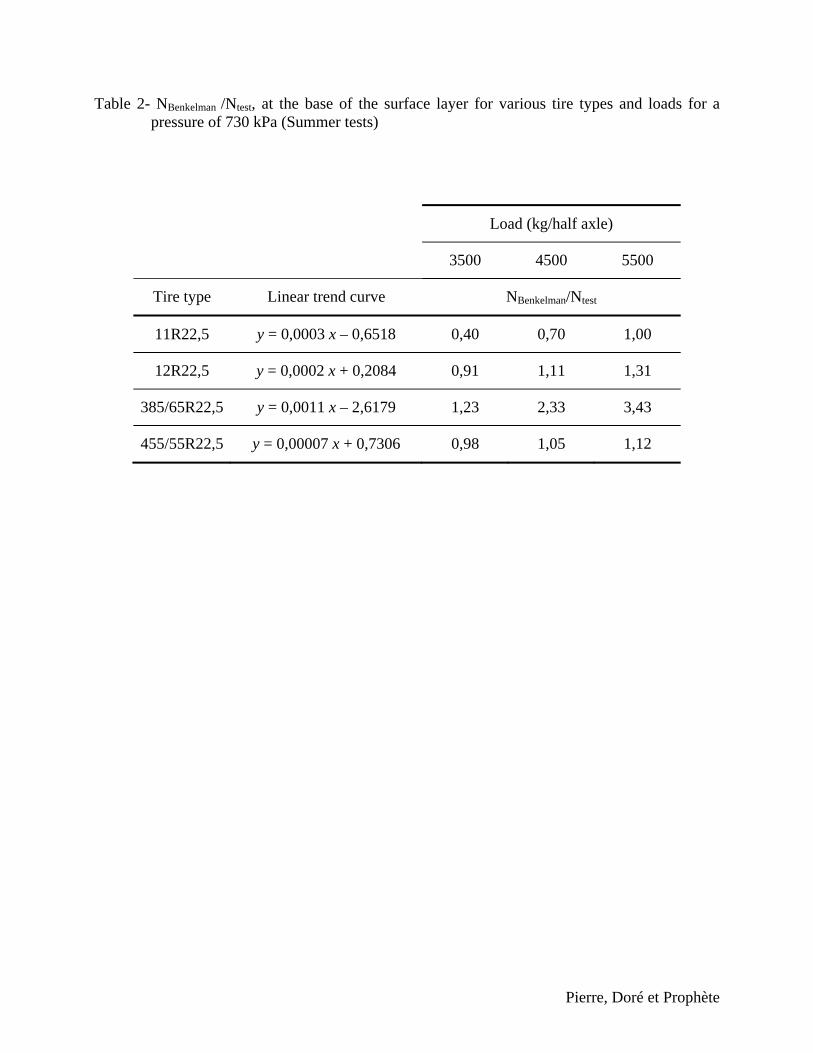
The NBenkelman /Ntest, indicating aggressivity in terms of cracking fatigue was then calculated for different tire types and loads. In order to analyze results more easily, only the inflation pressure of 730 kPa, the one most commonly used by carriers, was conserved for graph representation (Figures 12 and 13) of aggressivity values, the NBenkelman /Ntest, at the base of the surface layer for various tire types and loads. Moreover, linear trend curves were drawn and aggressivity values (Tables 1 and 2) were calculated, using the equations found, for permissible loads, that is 15 500 kg or 3875 kg/half axle in spring and 18 000 kg or 4500 kg/half axle in summer. In spring, both types of twin tires 11R22.5 and 12R22.5 cause less strain at the base of the surface layer than the two types of wide tires. Nevertheless, the extra-wide tire 455/55R22.5 causes less strain at the base of the surface layer than the wide tire 385/65R22.5. The slopes of the curves tend to be positive, meaning that strains generally increase with the load carried by the tires. Moreover, during summer, both types of twin tires and the extra-wide tire cause strains of the same order at the base of the surface layer.
In spring and summer, the twin tires are always less aggressive that the wide tire 385/65R22.5 which is always the most aggressive. This wide tire is very aggressive in spring and less so in summer. It is, however, much more aggressive, in terms of strains at the base of the surface layer, than the extra-wide tire 455/55R22.5. In fact, it is important to note that in spring, the extra-wide tire is much less aggressive than the ordinary wide tire, even though it is more aggressive than both types of twin tires, but that in summer, as Figure 13 clearly indicates, it is comparable, in terms of aggressivity to the pavement, to twin tires. It is unlikely that this result is caused by error in measures since the NBenkelman/Ntest are close to 1 for the twin tires.
From the point of view of fatigue cracking, wide tires cause less damage to the pavement than wide tires in spring, the extra-wide tire 455/55R22.5 being nevertheless less damaging than the wide tire 385/65R22.5. However, during summer, the twin tires and the extra-wide tire show the same level of aggressivity to the pavement while the wide tire remains very damaging to pavement.
4.3. Vertical strains in the surface layer Analysis of data corresponding to strain measures at a depth of 25 mm in the surface layer, began with the calculation of mean measures for each vertical gauge and for each test, that is for the eight tire positions and for the reference test. The values obtained for the reference test were then subtracted from mean strain values for each gauge submitted to load by the tires. Graphs resulting from these various calculations give strains in relation to distance, each curve representing a tire position. Two representative graphs are presented in this paper. The first figure (Figure 14) represents measures taken for tires 12R22.5 with a load of 3000 kg/half axle and an
29,324010
1
6==⎟
⎠
⎞⎜⎝
⎛=⎟⎠⎞
⎜⎝⎛ −
aandKwithNKa
Rε

Pierre, Doré et Prophète
inflation pressure of 560 kPa. The curves show that as the tire advances, compressive strains (negative values) become greater. It should be noted that when the location of the tire is before that of strain gauges, positive values appear which indicates that tensile loads form as the tire approaches. From the shape of the curves, the position of the tire on the plate is clearly visible. Indeed, we can see that approximately 70 mm from the edge of the plate, strains increase rapidly, then decrease near the middle of the tire only to increase again on the other side of tire. This characteristic image is due to the fact that for a low pressure, as with a low load, the loads are distributed preferentially on the sides of the tire through strain of the tire (Yap, 1989). The "M" shape at the center of the tire corresponds to load differences applied to tire ribs. It has been shown (Douglas et al., 2000) that for a low load and a low pressure, maximum loads are measured under the external ribs of the tire and much lower ones under center ribs, with however slightly greater compressive loads under the center rib. For high pressures (900 kPa in our case) the distribution of loads is not the same, as indicated in Figure 15. This graph indicates strains caused in the plate by the passing of tire 385/65R22.5 loaded to 3000 kg/half axle and inflated at a pressure of 900 kPa. The curves show a slightly different shape from those found in Figure 14. On the one hand, the tire print is wider due to the size of the tire and on the other hand, maximum strains are not found on the edge of the tire, as it was in the preceding case, but in the middle. A study by Douglas et al. (2000) also shows that maximum compressive loads under the tire’s middle rib for high inflation pressures, which correspond to measures taken with the plate. It therefore appears, from the shape of the curves, that the observations found in the study by Douglas et al. (2000) as to contact pressures between the tire and the pavement, also apply to loads developed at a depth of 25 mm in the pavement. Figure 15 shows that for the wide tire, much smaller strains can be observed on each side of the tire and outside of the tire/plate contact zone, this phenomenon indicates the rise of the material on both sides of the tire in reaction to the compression caused by the tire on the pavement. From the measures obtained from the strain gauges, the average of three maximum strain values was calculated for each configuration. These were used to prepare other graphs to compare the response of the plate under loads from the various tires tested. Figures 16 to 18 present maximum strains measured in the plate for different tire types in relation to load for all three inflation pressures. The figures indicate an increase in strain according to load applied whatever the inflation pressure may be. Moreover, for the two lowest tire pressures (560 and 730 kPa), the trend of the curves for different tire types are relatively close together and all maximum strain values are found below 200 x 10-6 mm/mm. For the highest pressure, that is 900 kPa, both wide tires 385 and 455 present the lowest strain values while the twin tire 11R22.5 displayed the greatest strains values. Moreover, from Figures 16 to 18, equations for linear trend curves were used to calculate maximum strains for the load permissible in summer, being 18 000 kg or 4500 kg/half axle. Considering the following equation (AASHTO 2002) :
for a given temperature (T) and a fixed number of loads applied (N), permanent strain is a direct function of the reversible strain measured. Thus, the calculated ratio between the strain of the tire and that of the twin tire used as reference, 11R22.5, are given in Table 3 and can be analyzed in
)log(02755.2)log(4262.074938.3log TNr
p ++−=⎟⎟⎠
⎞⎜⎜⎝
⎛
εε

Pierre, Doré et Prophète
terms of permanent strains causing creep rutting. The values calculated for the permissible load of 18 000 kg decrease in relation to inflation pressure for all tires. The two twin tires produced the greatest surface layer strains. The two wide tires, and in particular the extra-wide tire 455/55R22.5, produced the lowest surface layer strains. The processing of vertical strain data revealed that high inflation pressures (900 kPa) seem the most damaging from the point of view of vertical strains at a depth of 25 mm in the surface layer of pavement, because it is at this inflation pressure that the greatest strain values were measured. Pressures of 560 and 730 kPa appear to be those that produce the least strains. By comparing all the graphs, the extra-wide tire 455/55R22.5 causes the least surface layer strain, especially at high inflation pressure, followed by the wide tire 385/65R22.5 and the twin tires 12R22.5 which both show similar strains at inflation pressures of 560 and 730 kPa. As to the twin tires 11R22.5, they seem to cause the most damage to the surface layer for several configurations. 5. CONCLUSION The goal of this investigation was to obtain data relative to the passage of a vehicle on pavement, for several configurations and at different levels in the pavement. The new data obtained using the instrumented plate provided supplementary information on pavement behaviour with regards to measures usually taken at the base of surface layer and at the top of subgrade. The different configurations used for testing made it possible, first, to see the influence of tire load on pavement behaviour. Increase in loads produced a systematic increase in deflections at different levels in the pavement, but also in strains at the base of the surface layer and in the surface layer itself. Inflation pressure of tires was the second parameter examined during testing. Data relative to pavement deflections and strains at the base of the surface layer indicate that inflation pressure had little significant influence on these measures. As to surface layer strains, they seem to increase with tire inflation pressure. The last parameter that was varied during testing was tire type. Differences in pavement behaviour are especially evident between the twin (12R22.5 and 11R22.5) and the wide tires (385/65R22.5 and 455/55R22.5). At the level of total pavement deflections, the twin tires are less damaging to pavement as wide tires. Concerning strains at the base of the surface layer, in spring, the twin tires are less aggressive than wide tires, the extra-wide tire being less damaging that the ordinary tire. For measures taken in summer, the extra-wide tire 455/55R22.5 behaves in the same way as the twin tires as far as pavement aggressivity is concerned, in terms of fatigue cracking and strains at the base of surface layer, while the wide tire 385/65R22.5 remains very aggressive from this point of view. Measures obtained using the instrumented plate show that wide tires 385/65R22.5 and 455/55R22.5 cause less vertical strains in the surface layer at a depth of 25 mm than twin tires. To conclude, this investigation made it possible to study surface layer strains. It also revealed that each factor or load level associated with various damage to pavement (Figure 19) must now be weighted, that is to say: • vertical strain at a depth of 25 mm in the surface layer is related to creep rutting in the surface
layer, • strain at the base of the pavement is related to cracking fatigue of the pavement, • vertical strain at the top of the subgrade is related to structural rutting of the pavement.

Pierre, Doré et Prophète
This weighting of factors should make it possible to define the use of twin tires and wide tires on trucks in order to minimize damage to the pavement for load levels considered detrimental to the life cycle of pavement. 6. REFERENCES Doré, G, Duplain, G. 2002. Monitoring Pavement Response during Spring Thaw Using Fiber-
Optic Sensors, Proceedings of the 6th international conference on the bearing capacity of roads ans airfields, edited by A.G. Correia and F.E.F. Branco, Lisbon, Portugal, pp.15-24
Douglas, R.A., Woodward, W.D.H., and Woodside, A.R. 2000. Road contact stresses and forces
under tires with low inflation pressure, Canadian Journal of Civil Engineering, 27, pp. 1248-1258
Owende, P.M.O., Hartman, A.M., Ward, S.M., Gilchrist, M.D., and O’Mahony, M.J. 2001.
Minimizing Distress on Flexible Pavements Using Variable Tire Pressure, Journal of Transportation Engineering, p. 254-262
Prophète, F. 1999. Effet des largeurs de pneus, étude 255(31)99, Service des chaussées, Secteur
expertises en chaussées, Ministère des transports du Québec, 59 p. Sebaaly, P.E. 1992. Pavement Damage as Related to Tires Pressure, Axle Loads and
Configurations, Vehicle, Tire, Pavement Interface, ASTM STP 1164, J.J. Henry and J.C. Wambold, Eds., American Society for Testing and Materials, Philadelphia, pp. 69-96
7. ACKNOWLEDGEMENTS The authors would like to thank the Québec Ministry of Transportation for their financial support. They would also like to thank the Michelin company (Mr. Ralph Beaveridge) and Transport Robert (Mr. Denis Dubois) for providing, for the entire duration of tests, a truck and four sets of tires. Finally, this project could not have been completed without the collaboration of technical staff at the Ministry’s Roadwork Service, in particular Mr. Alain Dion, trainee-students and graduate students from the Masters in Roads Engineering program, and the Roads Engineering technician, Mr. Christian Juneau, from the Department of Civil Engineering at Université Laval.

Pierre, Doré et Prophète
Table 1- NBenkelman /Ntest, at the base of the surface layer for various tire types and loads for a pressure of 730 kPa (Spring tests)
Load (kg/half axle)
2875 3875 4875
Tire type Linear trend curve NBenkelman/Ntest
11R22,5 y = 0,0003 x + 0,1859 1,05 1,35 1,65
12R22,5 y = 0,0006 x - 1,6314 0,09 0,69 1,29
385/65R22,5 y = 0,002 x – 4,6566 1,09 3,09 5,09
455/55R22,5 y = 0,0006 x + 0,6972 2,42 3,02 3,62
Pierre, Doré et Prophète
Table 2- NBenkelman /Ntest, at the base of the surface layer for various tire types and loads for a pressure of 730 kPa (Summer tests)
Load (kg/half axle)
3500 4500 5500
Tire type Linear trend curve NBenkelman/Ntest
11R22,5 y = 0,0003 x – 0,6518 0,40 0,70 1,00
12R22,5 y = 0,0002 x + 0,2084 0,91 1,11 1,31
385/65R22,5 y = 0,0011 x – 2,6179 1,23 2,33 3,43
455/55R22,5 y = 0,00007 x + 0,7306 0,98 1,05 1,12

Pierre, Doré et Prophète
Table 3- Strain ratio (εtest/ε11R22.5) for a load of 4500 kg/half axle
Pressure
Tire type 560 kPa 730 kPa 900 kPa
11R22,5 1 1 1
12R22,5 0,83 0,68 0,67
385/65R22,5 0,78 0,76 0,30
455/55R22,5 0,70 0,60 0,15

Pierre, Doré et Prophète
Figure 1 – Instrumentation of the AVH section at the SERUL
Figure 2 – Depths of the strain gauges and the plates of the multi-level deflectometre
Figure 3 – Removable reading head of the multi-level deflectometre
Figure 4 – Instrumented plate
Figure 5 – Tire types
Figure 6 – Truck used for the tests
Figure 7 – Mobile scale used to verify tire loads
Figure 8 – Response of the pavement under a loaded wheel (Owende et al., 2001)
Figure 9 – Typical signals obtained for the multi-level deflectometre
Figure 10 – Typical signals obtained for longitudinal strain gauges
Figure 11 – Typical signals obtained for transversal strain gauges
Figure 12 – NBenkelman/Ntest ratios for strains at the base of the surface layer for an inflation
pressure of 730 kPa (Spring Tests)
Figure 13 – NBenkelman/Ntest ratios for strains at the base of the surface layer for an inflation
pressure of 730 kPa (Summer Tests)
Figure 14 – Vertical strains for a tire 12R22.5 with a load of 3000 kg/half axle and an inflation
pressure of 560 kPa
Figure 15 – Vertical strains for a tire 385/65R22.5 with a load of 3000 kg/half axle and an
inflation pressure of 900 kPa
Figure 16 – Maximum strains in relation to load for an inflation pressure of 560 kPa
Figure 17 – Maximum strains in relation to load for an inflation pressure of 730 kPa
Figure 18 – Maximum strains in relation to load for an inflation pressure of 900 kPa
Figure 19 – Critical impact levels in a pavement and associated damages

Pierre, Doré et Prophète
Figure 1 – Instrumentation of the AVH section at the SERUL
Thermistors
Epoxy/aggregates plate
7,60 m
Strain gauges 0,30 m
0,30 m
#7
#5
#6
Direction of displacement

Pierre, Doré et Prophète
Figure 2 – Depths of the strain gauges and the plates of the multi-level deflectometre
Multi-level deflectometre Strain gauges
300 mm
800 mm
1100 mm
2500 mm #1
#2
#3
#4
100 mm

Pierre, Doré et Prophète
Figure 3 – Removable reading head of the multi-level deflectometre

Pierre, Doré et Prophète
Figure 4 – Instrumented plate

Pierre, Doré et Prophète
Figure 5 – Tire types

Pierre, Doré et Prophète
Figure 6 – Truck used for the tests

Pierre, Doré et Prophète
Figure 7 – Mobile scale used to verify tire loads

Pierre, Doré et Prophète
Figure 8 – Response of the pavement under a loaded wheel (Owende et al., 2001)

Pierre, Doré et Prophète
-0,1
-0,05
0
0,05
0,1
0,15
0,2
0,25
0,3
0,35
0,4
0 0,5 1 1,5 2 2,5 3
Time (second)
Def
lect
ion
(mm
)Deflecto 1
Deflecto 2
Deflecto 3
Deflecto 4
Figure 9 – Typical signals obtained for the multi-level deflectometre

Pierre, Doré et Prophète
-50
0
50
100
150
200
250
300
350
0 0,5 1 1,5 2 2,5
Time (s)
Stra
in (1
0^-6
mm
/mm
)
Figure 10 – Typical signals obtained for longitudinal strain gauges

Pierre, Doré et Prophète
-20
0
20
40
60
80
100
120
140
160
0 0,5 1 1,5 2 2,5
Time (s)
Stra
in (1
0^-6
mm
/mm
)
Figure 11 – Typical signals obtained for transversal strain gauges

Pierre, Doré et Prophète
0,00
2,00
4,00
6,00
8,00
10,00
12,00
3000 4000 5000 6000 7000 8000
Load (kg/half axle)
11R22,512R22,5385/65R22,5455/55R22,5
Figure 12 – NBenkelman/Ntest ratios for strains at the base of the surface layer for an inflation
pressure of 730 kPa (Spring Tests)

Pierre, Doré et Prophète
0,00
1,00
2,00
3,00
4,00
5,00
6,00
3000 4000 5000 6000 7000 8000
Load (kg/half axle)
11R22,512R22,5385/65R22,5455/55R22,5
Figure 13 – NBenkelman/Ntest ratios for strains at the base of the surface layer for an inflation
pressure of 730 kPa (Summer Tests)

Pierre, Doré et Prophète
-350
-300
-250
-200
-150
-100
-50
0
50
100
0 100 200 300 400 500 600
Position on the instrumented plate (mm)
Stra
in (1
0-6 m
m/m
m)
050100150200250300350
Figure 14 – Vertical strains for a tire 12R22.5 with a load of 3000 kg/half axle and an inflation
pressure of 560 kPa

Pierre, Doré et Prophète
-500
-400
-300
-200
-100
0
100
200
0 100 200 300 400 500 600
Position on the instrumented plate (mm)
Stra
in (1
0-6 m
m/m
m)
050100150200250300350
Figure 15 – Vertical strains for a tire 385/65R22.5 with a load of 3000 kg/half axle and an
inflation pressure of 900 kPa

Pierre, Doré et Prophète
0
50
100
150
200
250
300
350
400
450
0 1000 2000 3000 4000 5000 6000 7000 8000
Load (kg/half axle)
Stra
in (x
10^
-6 m
m/m
m)
11R22,512R122,5385455
Figure 16 – Maximum strains in relation to load for an inflation pressure of 560 kPa

Pierre, Doré et Prophète
0
50
100
150
200
250
300
350
400
450
0 1000 2000 3000 4000 5000 6000 7000 8000
Load (kg/half axle)
Stra
in (x
10^
-6 m
m/m
m)
11R22,512R122,5385455
Figure 17 – Maximum strains in relation to load for an inflation pressure of 730 kPa

Pierre, Doré et Prophète
0
50
100
150
200
250
300
350
400
450
0 1000 2000 3000 4000 5000 6000 7000 8000
Load (kg/half axle)
Stra
in (
x 10
^-6
mm
/mm
)11R22,512R122,5385455
Figure 18 – Maximum strains in relation to load for an inflation pressure of 900 kPa

Pierre, Doré et Prophète
Figure 19 – Critical impact levels in a pavement and associated damages