schedule of events board of regents’ meeting november … · schedule of events board of...
TRANSCRIPT

SCHEDULE OF EVENTS Board of Regents’ Meeting
November 12-13, 2003 Odessa, Texas
U. T. Permian Basin, 4901 East University, Odessa, 432/552-2100 MCM Elegante Hotel, 5200 East University Boulevard, Odessa, 432/368-5885 American Airpower Heritage Museum, 9600 Wright Drive, Midland, 432/567-3009 Wednesday, November 12, 2003 (MCM Elegante Hotel, Caribbean Room) 10:00 a.m. Audit, Compliance, and Management Review Committee 11:00 a.m. Finance and Planning Committee 12:00 noon Board Open Session/Informal lunch with Employee Advisory Council Officers 1:00 p.m. Student, Faculty and Staff Campus Life Committee 2:00 p.m. Academic Affairs Committee 3:00 p.m. Health Affairs Committee 4:00 p.m. - Facilities Planning and Construction Committee 5:00 p.m. 6:00 p.m. Transportation from hotel to dinner at American Airpower Heritage Museum, Midland 6:30 p.m. Reception and dinner (Casual) 8:30 p.m. Transportation to hotel approximately Thursday, November 13, 2003 (The University of Texas of the Permian Basin) 8:00 a.m. Transportation from hotel to U. T. Permian Basin campus 8:30 a.m. Reconvene in Open Session and immediately recess to Executive Session Mesa Building, Room 207 (Executive Session Room) 10:00 a.m. Reconvene in Open Session for full Board Meeting Mesa Building, Room 220 (Meeting Room) 12:00 p.m. Adjourn approximately 12:00 noon Lunch Mesa Building, Room 220 1:00 p.m. - Groundbreaking Ceremony for Student Housing Project 1:30 p.m. Note: Board for Lease Meeting scheduled for 12:00 noon on the U. T. Permian Basin campus.

i
TABLE OF CONTENTS
FOR MEETING OF THE BOARD
Board Meeting: 11/12/2003 MCM Elegante Hotel
Board Meeting: 11/13/2003 U. T. Permian Basin
Board
Meeting Page
November 12 A. CALL TO ORDER 12:00 noon
Chairman Miller
B. U. T. System: Discussion with the Employee Advisory Council Officers
12:00-1:00 p.m. Discussion Ms. Zwinggi
1
C. RECESS FOR COMMITTEE MEETINGS
November 13 D. RECONVENE IN OPEN SESSION 8:30 a.m.
Chairman Miller
E. RECESS TO EXECUTIVE SESSION 8:30-10:00 a.m.
1. Personnel Matters Relating to Appointment, Employment, Evaluation, Assignment, Duties, Discipline, or Dismissal of Officers or Employees – Texas Government Code Section 551.074
a. U. T. Medical Branch - Galveston: Consideration of recommendation of Hearing Tribunal regarding termination of Faculty Member
8:30 a.m. Action Mr. Godfrey
2
b. U. T. Arlington: Consideration and appropriate action regarding personnel matters relating to presidential search
9:15 a.m. Dr. Sullivan
2
c. U. T. System: Consideration of personnel matters relating to appointment, employment, evaluation, assignment, and duties of officers or employees
2
d. U. T. System: Consideration of personnel matters relating to evaluation of presidents, U. T. System Executive Officers, and employees
. 2
2. Consultation with Attorney Regarding Legal Matters or Pending and/or Contemplated Litigation or Settlement Offers – Texas Government Code Section 551.071
U. T. Board of Regents: Legal issues regarding performance of Investment Management Services Agreement with UTIMCO
9:20 a.m. Mr. Godfrey
2

ii
Board Meeting
Page
F. RECONVENE IN OPEN SESSION TO CONSIDER ACTION ON EXECUTIVE SESSION ITEM(S)
10:00 a.m. 2
G. APPROVAL OF MINUTES 10:05 a.m. Action
3
H. SPECIAL ITEM
U. T. Board of Regents: Discussion and appropriate action concerning amendment to the Permanent University Fund, General Endowment Fund, Permanent Health Fund, and Long Term Fund Investment Policy Statements (including asset allocation policy); compensation and performance issues related to UTIMCO; and Liquidity Policy
10:10 a.m. Action Chairman Miller
3
I. REPORT
U. T. System: Quarterly report on gift acceptance 11:25 a.m. Report
4
J. RECESS FOR MEETINGS OF STANDING COMMITTEES
5
K. OTHER MATTERS
1. U. T. Pan American: Appointment of Presidential Search Advisory Committee
11:46 a.m. Report
78
2. U. T. Board of Regents: Presentation of certificates of appreciation
11:47 a.m. Action Chairman Miller Chancellor Yudof
79
L. ADJOURN 12:00 noon
1
WEDNESDAY, NOVEMBER 12 A. CALL TO ORDER B. U. T. System: Discussion with the Employee Advisory Council
Officers
PURPOSE Officers of The University of Texas System Employee Advisory Council will meet with the Board in small groups over lunch to discuss goals and plans for the future.
BACKGROUND INFORMATION The mission of the Employee Advisory Council (EAC) is to provide a forum for communicating ideas and information between employees, the Executive Officers of U. T. System, and the Board of Regents. Election of new officers was held in July 2003 and 16 new members will join the EAC in October. In the past, the annual presentation to the Board of Regents by the EAC was held in February. Due to recent changes in the calendar of meetings, the EAC will make their presentation at the annual November meeting. Participants scheduled to attend: a. Chair: Ms. Shirley Zwinggi, U. T. Southwestern Medical Center -
Dallas b. Vice-Chair: Ms. Sherill Boline, U. T. System Administration c. Secretary: Ms. Paula Berkley, U. T. Pan American d. Historian: Ms. Terri Reynolds, U. T. San Antonio C. RECESS FOR COMMITTEE MEETINGS
2
THURSDAY, NOVEMBER 13 D. RECONVENE IN OPEN SESSION E. RECESS TO EXECUTIVE SESSION
1. Personnel Matters Relating to Appointment, Employment,
Evaluation, Assignment, Duties, Discipline, or Dismissal of Officers or Employees – Texas Government Code Section 551.074
a. U. T. Medical Branch - Galveston: Consideration of
recommendation of Hearing Tribunal regarding termination of Faculty Member
b. U. T. Arlington: Consideration and appropriate action
regarding personnel matters relating to presidential search
c. U. T. System: Consideration of personnel matters
relating to appointment, employment, evaluation, assignment, and duties of officers or employees
d. U. T. System: Consideration of personnel matters
relating to evaluation of presidents, U. T. System Executive Officers, and employees
2. Consultation with Attorney Regarding Legal Matters or Pending
and/or Contemplated Litigation or Settlement Offers – Texas Government Code Section 551.071
U. T. Board of Regents: Legal issues regarding performance of Investment Management Services Agreement with UTIMCO
F. RECONVENE IN OPEN SESSION TO CONSIDER ACTION ON
EXECUTIVE SESSION ITEM(S)
3
G. APPROVAL OF MINUTES OF REGULAR MEETING HELD AUGUST 6-7, 2003, AND SPECIAL MEETINGS HELD SEPTEMBER 8 AND OCTOBER 15, 2003 (Available on-line at http://www.utsystem.edu/bor/meetings/minuteslistinghomepage.htm)
H. SPECIAL ITEM
U. T. Board of Regents: Discussion and appropriate action
concerning amendment to the Permanent University Fund, General Endowment Fund, Permanent Health Fund, and Long Term Fund Investment Policy Statements (including asset allocation policy); compensation and performance issues related to UTIMCO; and Liquidity Policy
RECOMMENDATION Chairman Miller will lead a discussion concerning the Investment Policy Statements for the Permanent University Fund, General Endowment Fund, Permanent Health Fund, and Long Term Fund (including asset allocation policy); compensation and performance issues related to UTIMCO; and the Liquidity Policy.

4
I. REPORT U. T. System: Quarterly report on gift acceptance
REPORT The Summary of Gift Acceptance for U. T. System for the period June 1, 2003 through August 31, 2003, is set forth below. The report includes 133 items conforming to Board policy including the acceptance of $23,607,131 in gifts and other transfers of previously accepted funds and Board-held matching funds totaling $8,956,751.71. The report includes only those funds that relate to endowments, estates and other funds managed by the U. T. System Office of External Relations.
# ALL ITEMS
COMPONENT INSTITUTION
TOTAL VALUE
3 U. T. System Administration $ --- 7 U. T. Arlington 70,000 39 U. T. Austin 10,785,847 * 1 U. T. Brownsville 10,000 2 U. T. Dallas --- 5 U. T. El Paso 51,511 4 U. T. Pan American 226,000 --- U. T. Permian Basin --- 6 U. T. San Antonio 221,442 * 1 U. T. Tyler 25,000 6 U. T. Southwestern Medical Center - Dallas 295,351 * 26 U. T. Medical Branch - Galveston 2,595,204 * 7 U. T. Health Science Center - Houston 4,488,505 5 U. T. Health Science Center - San Antonio 1,002,464 21 U. T. M. D. Anderson Cancer Center 3,835,808 *
--- U. T. Health Center – Tyler ---
133 TOTAL $ 23,607,131 * Not included in total: U. T. Austin: $491,138.93 transfers of previously accepted funds; U. T. San Antonio: $87,545.64 transfers of previously accepted funds; U. T. Southwestern Medical Center – Dallas: $8,250,000 of Board-held matching funds; U. T. Medical Branch – Galveston: $100,000 transfer of previously accepted funds; and U. T. M. D. Anderson Cancer Center: $28,067.14 transfer of previously accepted funds.
5
J. RECESS FOR MEETINGS OF THE STANDING COMMITTEES AND COMMITTEE REPORTS TO THE BOARD The Standing Committees of the Board of Regents of The University of Texas System will meet as set forth below to consider recommendations on those matters on the agenda for each Committee listed in the Agenda Book. At the conclusion of each Standing Committee meeting, the report of that Committee will be formally presented to the Board for consideration and action. Executive Committee: Chairman Miller No items
Audit, Compliance, and Management Review Committee: Chairman Estrada Agenda Book Page 6
Finance and Planning Committee: Chairman Hunt Agenda Book Page 14 Academic Affairs Committee: Chairman Krier Agenda Book Page 30 Health Affairs Committee: Chairman Clements Agenda Book Page 49 Facilities Planning and Construction Committee: Chairman Huffines Agenda Book Page 61

TABLE OF CONTENTS
FOR AUDIT, COMPLIANCE, AND MANAGEMENT
REVIEW COMMITTEE
Committee Meeting: 11/12/2003 MCM Elegante Hotel
(Executive Session in Waterfront Room Open Session in Caribbean Ballroom)
Board Meeting: 11/13/2003 U. T. Permian Basin
Robert A. Estrada, Chairman Rita C. Clements Judith L. Craven, M.D. Woody L. Hunt Cyndi Taylor Krier Committee
Meeting Board Meeting
Page
A. CONVENE 10:00 a.m. Chairman Estrada
B. 1. 2.
RECESS TO EXECUTIVE SESSION Consultation with Attorney Regarding Legal Matters or Pending and/or Contemplated Litigation or Settlement Offers – Texas Government Code Section 551.071 Personnel Matters Relating to Appointment, Employment, Evaluation, Assignment, Duties, Discipline, or Dismissal of Officers or Employees – Texas Government Code Section 551.074
U. T. System: Evaluation and duties of System and component employees involved in Audit and Compliance functions
Mr. Godfrey Mr. Chaffin
Not on Agenda Not on Agenda
6 6
C. RECONVENE IN OPEN SESSION
1. U. T. System: Approval of U. T. System Internal Audit Plan for Fiscal Year 2004
Not on Agenda
Action
6
2. U. T. System: Approval of the Audit, Compliance, and Management Review Committee Charter
10:10 a.m. Action Chairman Estrada
Action
7
3. U. T. System: Amendment to the Regents' Rules and Regulations related to duties of the Audit, Compliance, and Management Review Committee (Part One, Chapter I, Section 7; Chapter II, Section 3)
10:13 a.m. Action Mr. Chaffin
Action 8
i

Committee
Meeting Board Meeting
Page
4. U. T. System: Approval of the Sarbanes-Oxley Action Plan for U. T. System
10:15 a.m. Action Mr. Wallace Mr. Chaffin
Not on Agenda
10
5. U. T. System: Annual Report on System-wide Institutional Compliance Program
10:25 a.m. Report Mr. Chaffin Mr. Greg Lee, UTIMCO
Not on Agenda
11
6. U. T. System: Report on System-wide Audit Activity (red, yellow, green project)
10:40 a.m. Report Mr. Chaffin
Not on Agenda
12
7. U. T. System: Report on the Results of the UTIMCO Audit 10:45 a.m. Report Mr. Ricky Richter, Ernst & Young LLP
Not on Agenda
13
Adjourn
ii
A. CONVENE
B. RECESS TO EXECUTIVE SESSION
1. Consultation with Attorney Regarding Legal Matters or Pending and/or Contemplated Litigation or Settlement Offers - Texas Government Code Section 551.071
2. Personnel Matters Relating to Appointment, Employment, Evaluation,
Assignment, Duties, Discipline, or Dismissal of Officers or Employees - Texas Government Code Section 551.074 U. T. System: Evaluation and duties of System
and component employees involved in Audit and Compliance functions
C. RECONVENE IN OPEN SESSION 1. U. T. System: Approval of U. T. System Internal Audit Plan for Fiscal
Year 2004
RECOMMENDATION The Audit, Compliance, and Management Review Committee recommends that the U. T. Board of Regents approve the proposed U. T. System-wide Internal Audit Plan for Fiscal Year 2004. A summary of the auditable areas is set forth on Page 6.1. Development of the Internal Audit Plan is based on risk assessments performed at each component institution. Implementation of the Plan will be coordinated with the institutional auditors.
BACKGROUND INFORMATION Institutional Audit Plans, compiled by the internal audit departments after input and guidance from the System Audit Office and the institution's management and Internal Audit Committee, were submitted to all Internal Audit Committees and institutional presidents for review and comments. The Chief Audit Executive provided feedback by conducting audit hearings with each component institution. After the review process, each Internal Audit Committee formally approved its institution's Plan. The Audit, Compliance, and Management Review Committee approved the Audit Plan on September 30, 2003.
6

THE UNIVERSITY OF TEXAS SYSTEM
2004 SYSTEM-WIDE INTERNAL AUDIT PLAN SUMMARY
Prepared by: U. T. System Internal Audit Program
Audit % ofArea Hours Total Hours
Key Financial and Operating Information 34,692 25%Institutional Compliance Audits 12,085 9%Information Technology Audits 26,205 19%Core Business Processes 29,206 22%Change in Management 5,905 4%Follow-up 4,712 4%Projects 23,629 17%
Total 136,434 100%
Consolidated by: U. T. System Audit Office Date: September 4, 2003
6.1

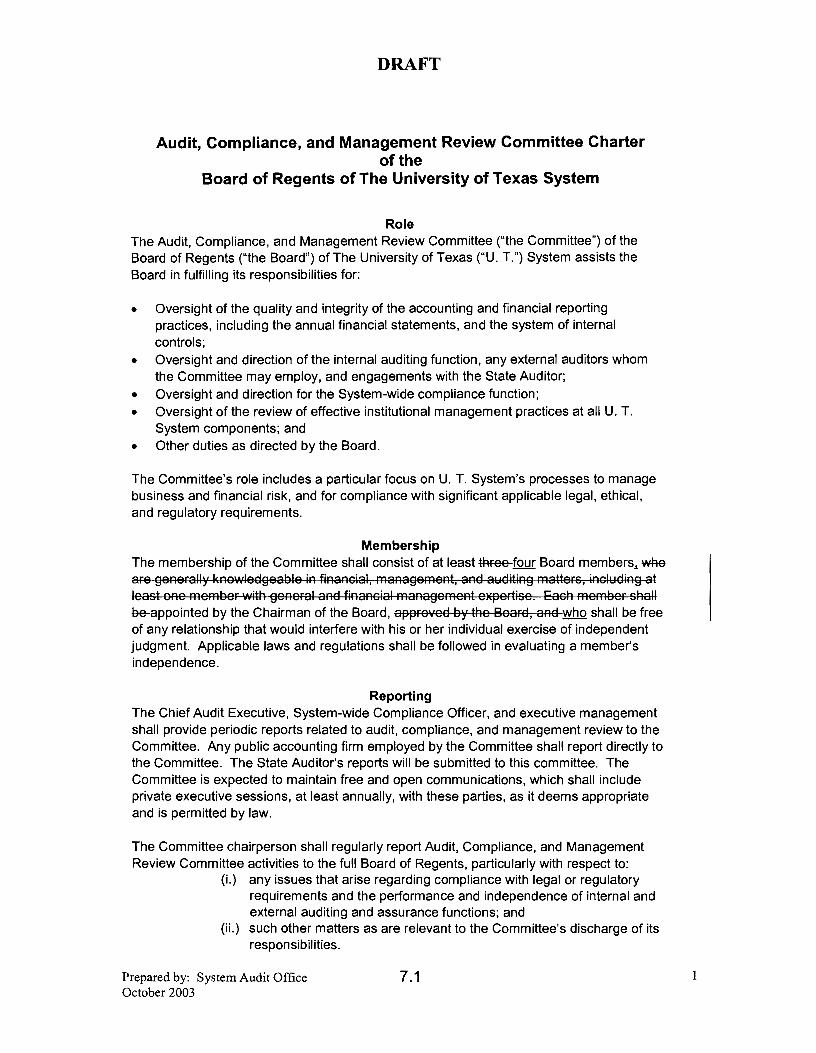
2. U. T. System: Approval of the Audit, Compliance, and Management Review Committee Charter
RECOMMENDATION The Chancellor and the Chief Audit Executive and System-wide Compliance Officer recommend the proposed Charter for the Audit, Compliance, and Management Review Committee be approved as set forth on Pages 7.1 - 7.5.
BACKGROUND INFORMATION The Audit, Compliance, and Management Review Committee is a standing committee of the Board of Regents. The proposed Charter identifies responsibilities of the committee and is broken into six categories: role, membership, reporting, education, authority, and responsibilities. A draft of the Charter was presented to the committee in August 2003. Subsequent to the meeting, two changes were made to the Responsibilities Checklist: the Chief Operating Officer is no longer included in checklist number 15, and the language that indicated the committee would approve the annual audit plan in November was deleted from number 18. The revised draft of the Charter was presented to the committee in September 2003 and has been reviewed by Vice Chancellor and General Counsel Godfrey. The two changes described above were approved, and the committee approved further changes to make the Charter consistent with the existing Regents' Rules and RegulationsIt is expected that the Charter will need to be reviewed quarterly as the Sarbanes-Oxley Act guidance and the audit environment continue to change.
7

DRAFT
Education
U. T. System executive management is responsible for providing the Committee with educational resources related to accounting principles and procedures, risk management, and other information that may be requested by the Committee. U. T. System executive management shall assist the Committee in maintaining appropriate financial and compliance literacy.
Authority
The Committee, in discharging its oversight role, is empowered to study or investigate any matter related to audit, compliance, and management of interest or concern that the Committee, in its sole discretion, deems appropriate for study or investigation by the Committee. The Committee shall be given full access to all U. T. System employees and operations as necessary to carry out this authority.
Responsibilities
The Committee’s specific responsibilities in carrying out its oversight role are delineated in the Audit, Compliance, and Management Review Committee Responsibilities Checklist. The responsibilities checklist will be updated annually by the Committee to reflect changes in regulatory requirements, authoritative guidance, and evolving oversight practices. As the compendium of Committee responsibilities, the most recently updated responsibilities checklist will be considered to be an addendum to this charter.
The Committee relies on the expertise and knowledge of management, the internal auditors, the State Auditor, and any public accounting firm they may employ in carrying out its oversight responsibilities. U. T. System executive management is responsible for preparing complete and accurate financial statements and for monitoring internal controls and compliance with all applicable laws, regulations, and internal policies and procedures. Any public accounting firm hired by the Committee is responsible for performing the services specified in the hiring contract.
Prepared by: System Audit Office October 2003
2
7.2
DRAFT
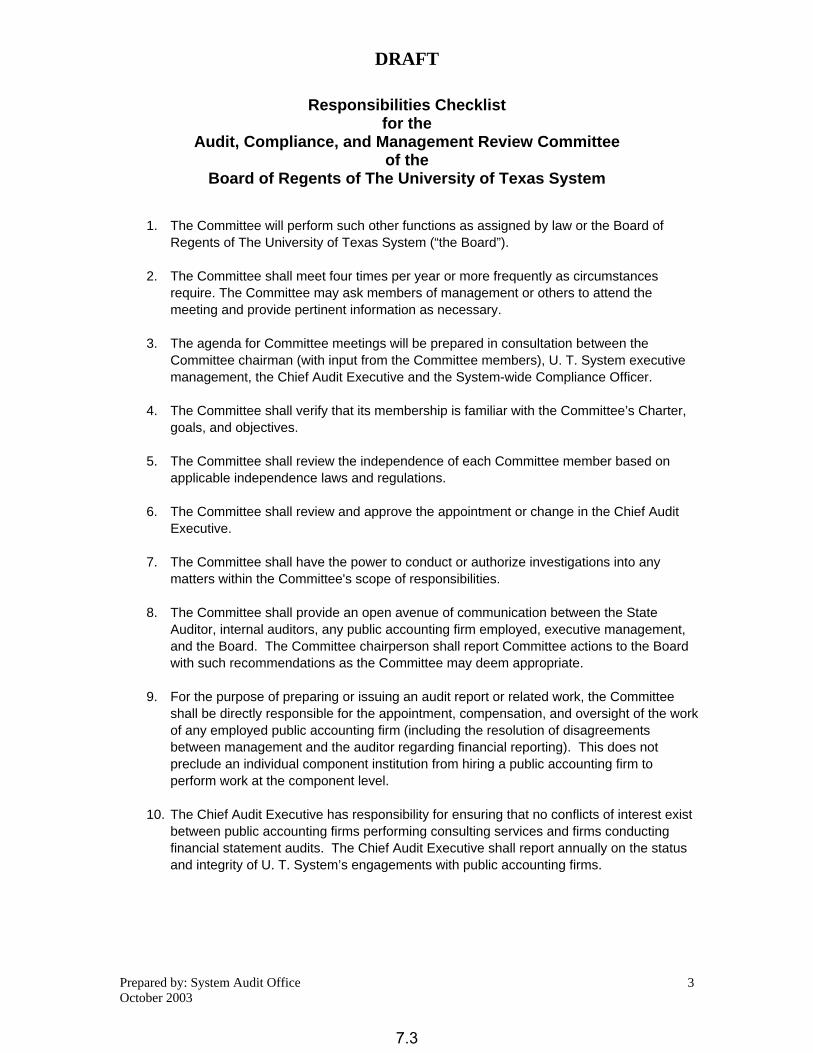
Responsibilities Checklist for the
Audit, Compliance, and Management Review Committee of the
Board of Regents of The University of Texas System
1. The Committee will perform such other functions as assigned by law or the Board of Regents of The University of Texas System (“the Board”).
2. The Committee shall meet four times per year or more frequently as circumstances
require. The Committee may ask members of management or others to attend the meeting and provide pertinent information as necessary.
3. The agenda for Committee meetings will be prepared in consultation between the
Committee chairman (with input from the Committee members), U. T. System executive management, the Chief Audit Executive and the System-wide Compliance Officer.
4. The Committee shall verify that its membership is familiar with the Committee’s Charter,
goals, and objectives.
5. The Committee shall review the independence of each Committee member based on applicable independence laws and regulations.
6. The Committee shall review and approve the appointment or change in the Chief Audit
Executive.
7. The Committee shall have the power to conduct or authorize investigations into any matters within the Committee's scope of responsibilities.
8. The Committee shall provide an open avenue of communication between the State
Auditor, internal auditors, any public accounting firm employed, executive management, and the Board. The Committee chairperson shall report Committee actions to the Board with such recommendations as the Committee may deem appropriate.
9. For the purpose of preparing or issuing an audit report or related work, the Committee
shall be directly responsible for the appointment, compensation, and oversight of the work of any employed public accounting firm (including the resolution of disagreements between management and the auditor regarding financial reporting). This does not preclude an individual component institution from hiring a public accounting firm to perform work at the component level.
10. The Chief Audit Executive has responsibility for ensuring that no conflicts of interest exist
between public accounting firms performing consulting services and firms conducting financial statement audits. The Chief Audit Executive shall report annually on the status and integrity of U. T. System’s engagements with public accounting firms.
Prepared by: System Audit Office October 2003
3
7.3

DRAFT
11. The Committee shall review with executive management, the Chief Audit Executive and the System-wide Compliance Officer, the State Auditor, and any employed public accounting firm the coordination of efforts to assure completeness of coverage, reduction of redundant efforts, and the effective use of resources.
12. The Committee shall inquire of executive management, the Chief Audit Executive and the
System-wide Compliance Officer, and any employed public accounting firm about significant risks or exposures and assess the steps management has taken to minimize such risk to U. T. System.
13. The Committee shall consider and review with the Chief Audit Executive and the System-
wide Compliance Officer, the State Auditor, and any employed public accounting firm:
a. The adequacy of U. T. System’s internal controls including computerized information system controls and security;
b. The adequacy and efficiency of senior-level management with respect to fiscal operations and compliance functions at all component institutions;
c. Any related significant findings and recommendations of the State Auditor, independent public accountants, and internal audit together with management’s responses thereto.
14. Regarding the U. T. System’s financial statements, the Committee shall review with
executive management and/or the Chief Audit Executive:
a. U. T. System’s annual financial statements and related footnotes; b. Any audit and assurance work performed on components of the annual
financial statements; c. Any significant changes to the financial statements requested by the State
Auditor, internal audit, or any independent public accountants; d. Any serious difficulties or disputes with management encountered during
assurance work on components of the financial statements; e. Other matters related to the conduct of assurance services that are to be
communicated to the Committee under generally accepted government auditing standards.
15. The Committee shall require the U. T. System Chief Financial Officer certify the annual
financial statements for the U. T. System as a whole, and that each component Chief Financial Officer certify the annual financial statements for their respective component institution.
16. The Committee shall review legal and regulatory matters that may have a material impact
on the financial statements, internal auditing and/or compliance activities.
17. The Committee shall review with executive management and the Chief Audit Executive at least annually U. T. System’s critical accounting policies, including any significant changes to Generally Accepted Accounting Procedures (GAAP), Regents’ Rules and Regulations, and/or operating policies or standards.
18. On an annual basis, the Committee shall review, recommend, and approve the annual
audit plan, including the allocation of audit hours.
Prepared by: System Audit Office October 2003
4
7.4
DRAFT
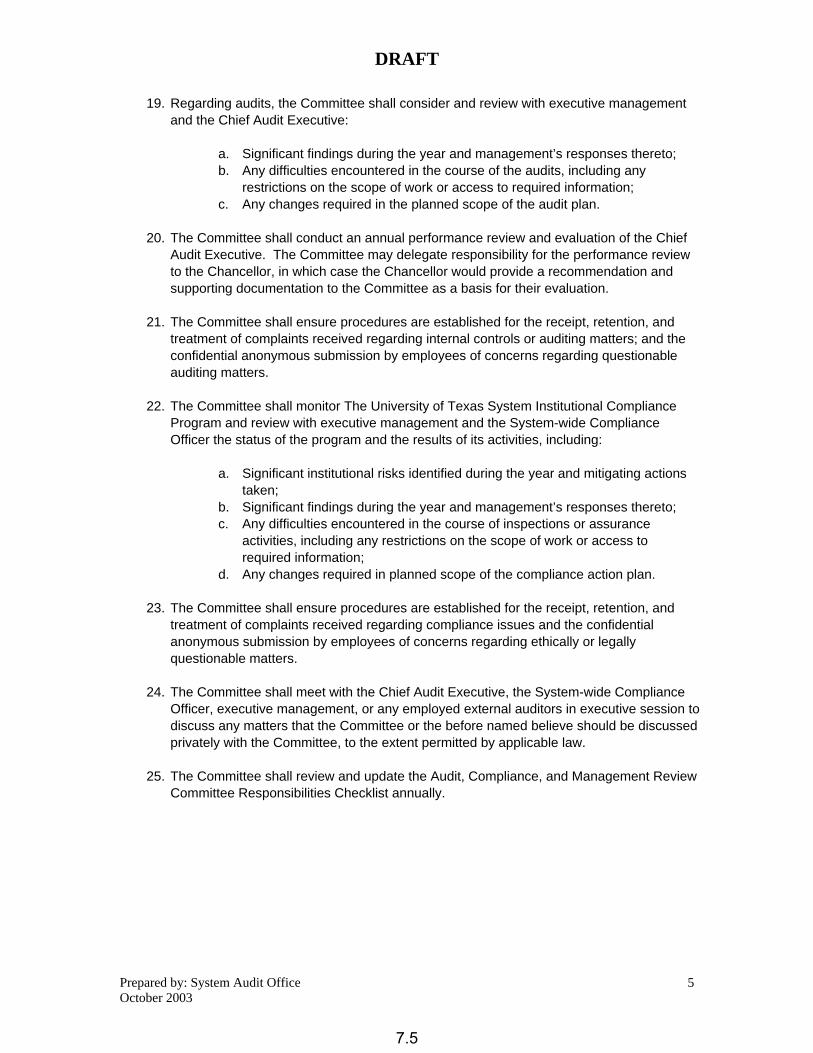
19. Regarding audits, the Committee shall consider and review with executive management and the Chief Audit Executive:
a. Significant findings during the year and management’s responses thereto; b. Any difficulties encountered in the course of the audits, including any
restrictions on the scope of work or access to required information; c. Any changes required in the planned scope of the audit plan.
20. The Committee shall conduct an annual performance review and evaluation of the Chief
Audit Executive. The Committee may delegate responsibility for the performance review to the Chancellor, in which case the Chancellor would provide a recommendation and supporting documentation to the Committee as a basis for their evaluation.
21. The Committee shall ensure procedures are established for the receipt, retention, and
treatment of complaints received regarding internal controls or auditing matters; and the confidential anonymous submission by employees of concerns regarding questionable auditing matters.
22. The Committee shall monitor The University of Texas System Institutional Compliance
Program and review with executive management and the System-wide Compliance Officer the status of the program and the results of its activities, including:
a. Significant institutional risks identified during the year and mitigating actions
taken; b. Significant findings during the year and management’s responses thereto; c. Any difficulties encountered in the course of inspections or assurance
activities, including any restrictions on the scope of work or access to required information;
d. Any changes required in planned scope of the compliance action plan.
23. The Committee shall ensure procedures are established for the receipt, retention, and treatment of complaints received regarding compliance issues and the confidential anonymous submission by employees of concerns regarding ethically or legally questionable matters.
24. The Committee shall meet with the Chief Audit Executive, the System-wide Compliance
Officer, executive management, or any employed external auditors in executive session to discuss any matters that the Committee or the before named believe should be discussed privately with the Committee, to the extent permitted by applicable law.
25. The Committee shall review and update the Audit, Compliance, and Management Review
Committee Responsibilities Checklist annually.
Prepared by: System Audit Office October 2003
5
7.5
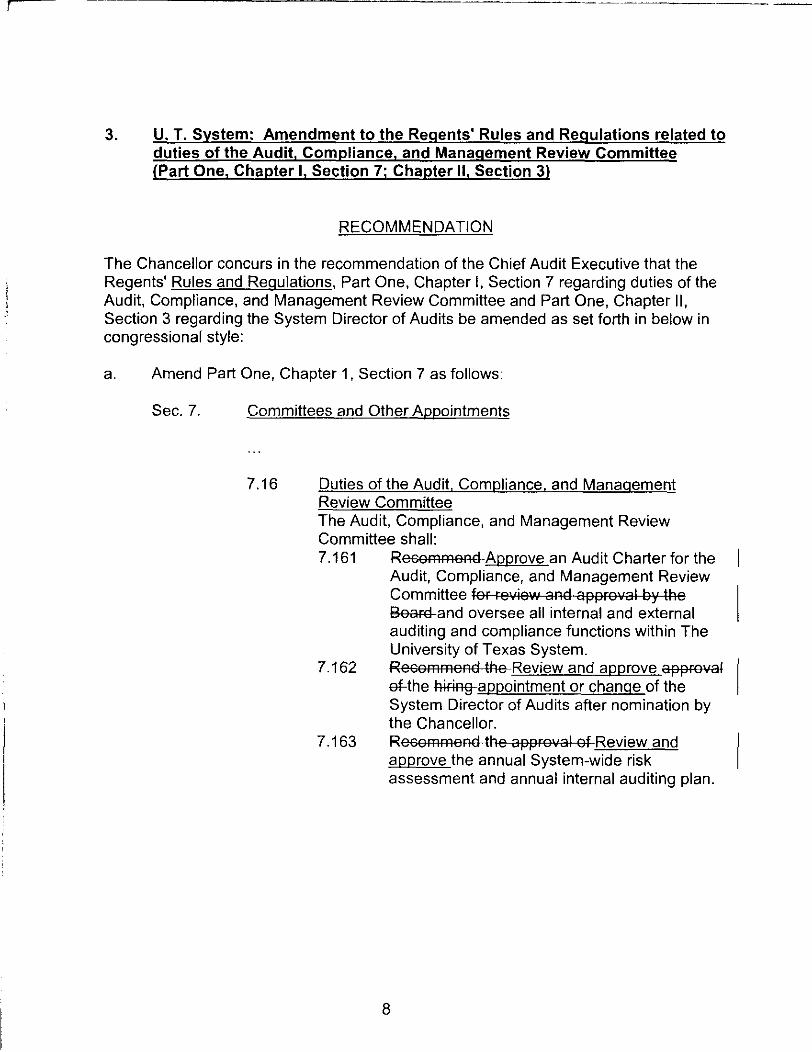
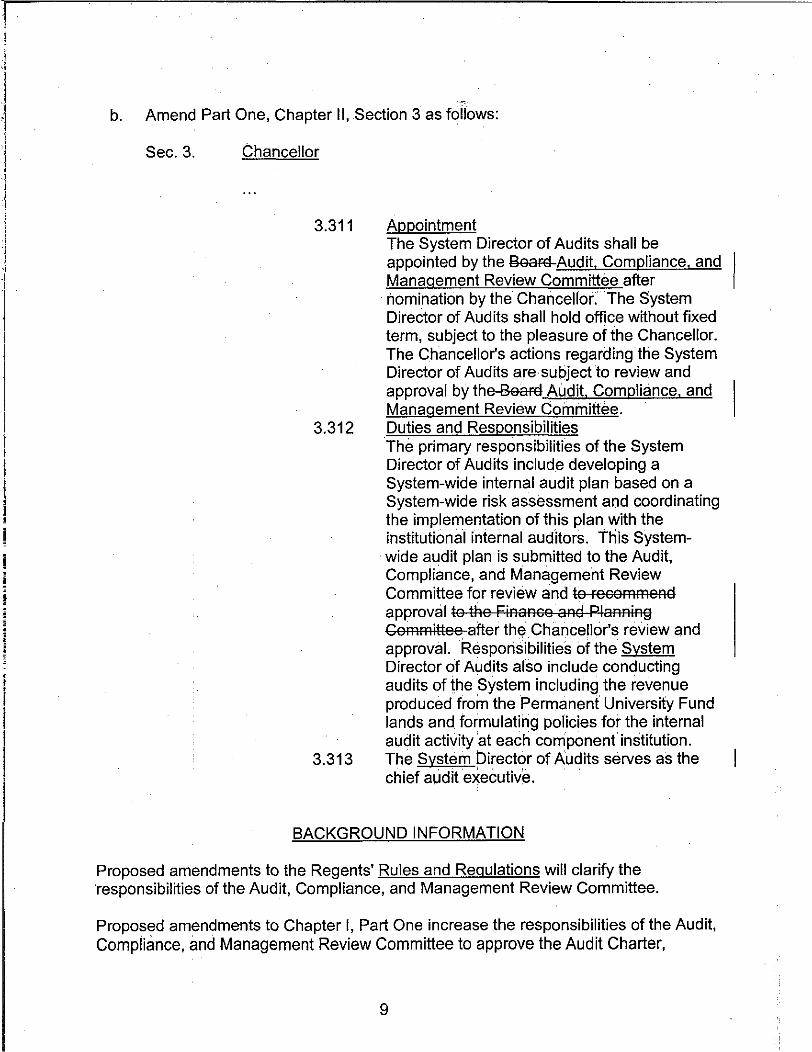

approve the appointment or change of the System Director of Audits after nomination by the Chancellor, and approve the annual System-wide risk assessment and annual internal auditing plan. Proposed amendments to Chapter II, Part One make these rules consistent with the changes made in Chapter I. 4. U. T. System: Approval of the Sarbanes-Oxley Action Plan for U. T.
System
RECOMMENDATION An ad hoc committee, formed at the request of the Chancellor to review issues regarding the “spirit” of the Sarbanes-Oxley Act of 2002, recommends that the Audit, Compliance, and Management Review Committee of the U. T. Board of Regents approve the proposed action plan as set forth on Pages 10.1 - 10.11.
BACKGROUND INFORMATION The Committee discussed the Sarbanes-Oxley Act of 2002 in August 2003 and requested that additional review be conducted. The Chancellor requested that Mr. Randy Wallace, Assistant Vice Chancellor - Controller and Chief Budget Officer, and Mr. Charles Chaffin, Chief Audit Executive and System-wide Compliance Officer, form an ad hoc committee to develop an action plan to implement the "spirit" of the Sarbanes-Oxley Act of 2002. The ad hoc committee is made up of nine chief business officers and five internal audit directors, representing eleven U. T. components. On September 30, 2003, the Committee discussed the Sarbanes-Oxley Act of 2002, Mr. Wallace and Mr. Chaffin presented an update on the ad hoc committee's progress, and a representative from the State Auditor's Office discussed the Financial Statement Audit they have planned for the fiscal year ended August 31, 2003.
10
Action Plan to Implement The “Spirit” of the Sarbanes-Oxley Act of 2002
The University of Texas System 2003
DRAFT
To be presented to the Audit, Compliance, and Management Review Committee of the Board of Regents on November 12, 2003
10.1

I N T R O D U C T I O N
The Sarbanes-Oxley Act of 2002 (SOX) was enacted to improve the accuracy and reliability of reported financial information. SOX, which became law on July 30, 2002, requires various representations regarding the fairness of financial statements and the effectiveness of disclosure controls and procedures. While intended to restore investor confidence in the integrity of financial information issued by Securities and Exchanges Commission registrants, it is both prudent and advantageous for other organizations to establish sound internal control structures and manage and monitor that structure proactively. Data integrity provides for improved planning and decision making by the organization’s management. The criteria for evaluating internal controls were introduced in the early 1990s by the Committee of Sponsoring Organizations (COSO) Internal Control – Integrated Framework and included the following objectives:
• efficiency and effectiveness of operations; • reliability of financial reporting; and • compliance with applicable laws and regulations.
On July 16, 2003, a white paper highlighting the sections of the Sarbanes-Oxley Act of 2002 pertaining to higher education, as discussed in the draft NACUBO Advisory Report entitled “The Sarbanes-Oxley Act of 2002: Recommendations for Higher Education”, was presented to The University of Texas System (U. T. System) Council. The U. T. System Council is chaired by the Chancellor and is composed of the Presidents from the fifteen component institutions. The NACUBO Advisory Report represents the preferred practices as applicable for higher education. As previously noted, SOX is not required for Colleges and Universities. However, certain sections are relevant to institutions of higher education and, in an effort to promote best practices, implementation is highly encouraged. Pursuant to the U. T. System Council meeting, Chancellor Yudof directed the rewrite of the white paper to include suggestions on how the U. T. System could implement the “spirit” of Sarbanes-Oxley. He also requested that an Ad Hoc committee be formed to determine how to implement SOX at the U. T. System. On August 6, 2003, the revised white paper, Implementing the Spirit of Sarbanes-Oxley Act of 2002 in The University of Texas System, was presented to the U. T. System Board of Regents’ Audit, Compliance, and Management Review Committee (ACMR). The Ad Hoc committee held its first meeting on September 29, 2003. This committee included Chief Business Officers and Internal Audit Directors from both health and academic components, along with representatives from System Administration. A draft
Prepared by the “Spirit” of Sarbanes-Oxley Act of 2002 Ad Hoc Committee October 2003
1
10.2

of this Action Plan was presented to the Ad Hoc committee for discussion. The Action Plan focused on the following key elements (applicable SOX sections are noted in parentheses):
Reporting Designation of a responsible party for financial reporting Management certifications (302) Off-balance sheet and pro forma disclosures (401)
Strengthening governance Audit committee standards (301) Disclosure of audit committee financial expert (407) Prohibition of certain services by auditors (201) Audit committee pre-approval of all services by auditors (202) Audit partner rotation (203) Auditor communications with audit committees (204) Restrictions on company hiring of audit team members (206) Providing the ACMR positive assurance concerning managements’
certification of the integrity of the financial statements of the U. T. System Financial relationships of Board members and senior management of
both the U. T. System and the components (402 & 403) Code of Ethics for senior financial officers (406) Protection for whistleblowers (806)
Evaluation of Internal Controls (404)
The committee also formed subcommittees for drafting a model audit committee charter and a business procedures memorandum related to the Action Plan. The Ad Hoc Committee believes that the implementation of the “spirit” of the Sarbanes-Oxley Act of 2002 is a positive indication of the intent of the Board of Regents and executive management of U. T. System to ensure integrity in all aspects of operations. As such, we respectfully submit this Action Plan to Implement the Spirit of the Sarbanes-Oxley Act of 2002 to the Chancellor for his review and approval and to the ACMR for their review and approval.
Prepared by the “Spirit” of Sarbanes-Oxley Act of 2002 Ad Hoc Committee October 2003
2
10.3
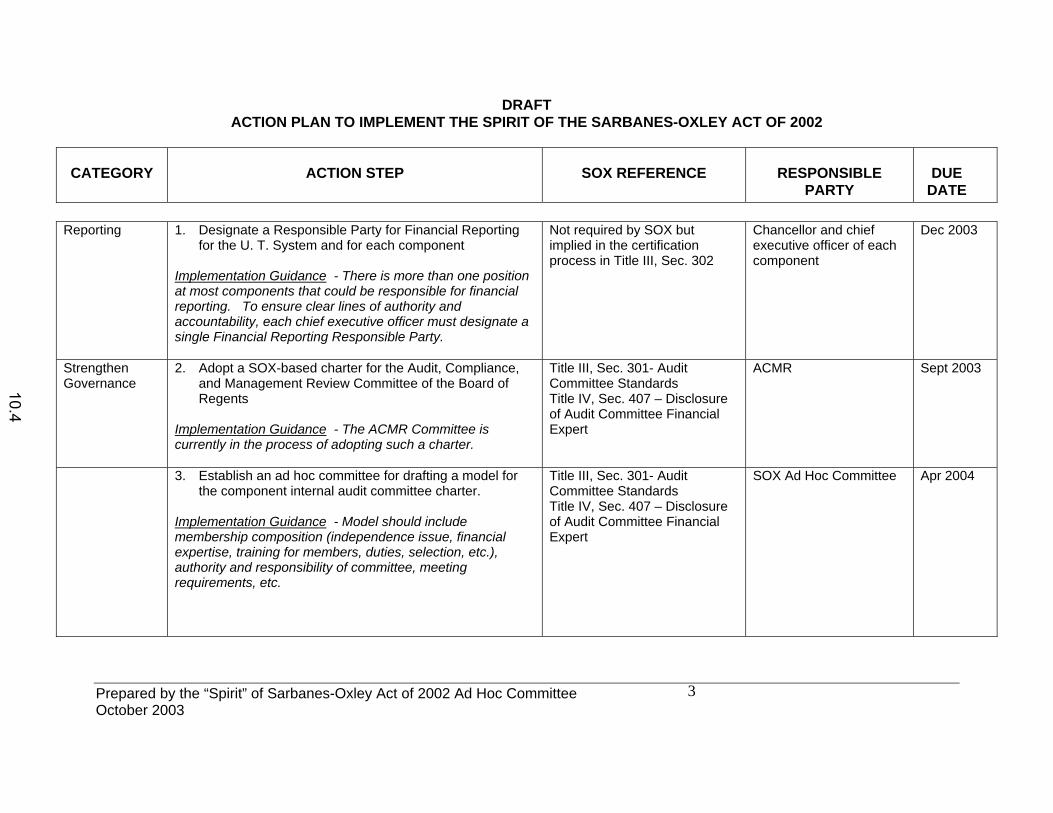
DRAFT ACTION PLAN TO IMPLEMENT THE SPIRIT OF THE SARBANES-OXLEY ACT OF 2002
CATEGORY ACTION STEP SOX REFERENCE RESPONSIBLE PARTY
DUE DATE
Prepared by the “Spirit” of Sarbanes-Oxley Act of 2002 Ad Hoc Committee
Reporting 1. Designate a Responsible Party for Financial Reporting for the U. T. System and for each component
Implementation Guidance - There is more than one position at most components that could be responsible for financial reporting. To ensure clear lines of authority and accountability, each chief executive officer must designate a single Financial Reporting Responsible Party.
Not required by SOX but implied in the certification process in Title III, Sec. 302
Chancellor and chief executive officer of each component
Dec 2003
Strengthen Governance
2. Adopt a SOX-based charter for the Audit, Compliance, and Management Review Committee of the Board of Regents
Implementation Guidance - The ACMR Committee is currently in the process of adopting such a charter.
Title III, Sec. 301- Audit Committee Standards Title IV, Sec. 407 – Disclosure of Audit Committee Financial Expert
ACMR Sept 2003
3. Establish an ad hoc committee for drafting a model for the component internal audit committee charter.
Implementation Guidance - Model should include membership composition (independence issue, financial expertise, training for members, duties, selection, etc.), authority and responsibility of committee, meeting requirements, etc.
Title III, Sec. 301- Audit Committee Standards Title IV, Sec. 407 – Disclosure of Audit Committee Financial Expert
SOX Ad Hoc Committee Apr 2004
3 October 2003
10.4
DRAFT ACTION PLAN TO IMPLEMENT THE SPIRIT OF THE SARBANES-OXLEY ACT OF 2002
CATEGORY ACTION STEP SOX REFERENCE RESPONSIBLE PARTY
DUE DATE
Prepared by the “Spirit” of Sarbanes-Oxley Act of 2002 Ad Hoc Committee
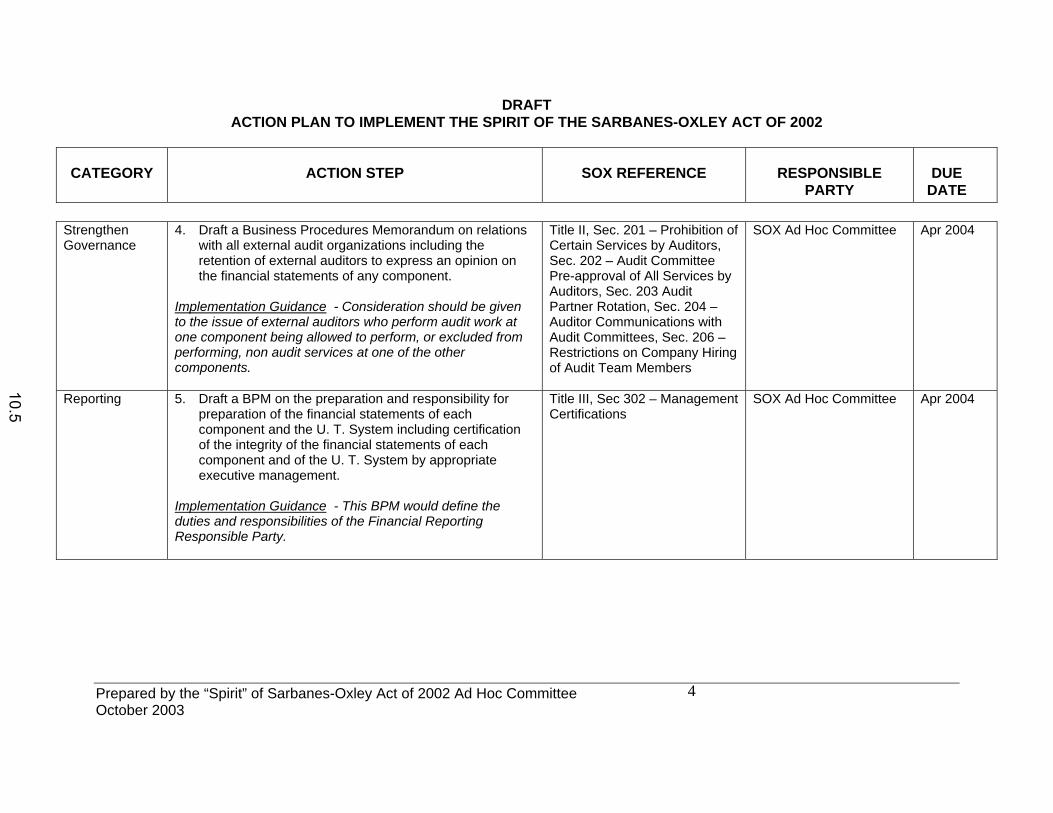
Strengthen Governance
4. Draft a Business Procedures Memorandum on relations with all external audit organizations including the retention of external auditors to express an opinion on the financial statements of any component.
Implementation Guidance - Consideration should be given to the issue of external auditors who perform audit work at one component being allowed to perform, or excluded from performing, non audit services at one of the other components.
Title II, Sec. 201 – Prohibition of Certain Services by Auditors, Sec. 202 – Audit Committee Pre-approval of All Services by Auditors, Sec. 203 Audit Partner Rotation, Sec. 204 – Auditor Communications with Audit Committees, Sec. 206 – Restrictions on Company Hiring of Audit Team Members
SOX Ad Hoc Committee Apr 2004
Reporting 5. Draft a BPM on the preparation and responsibility for preparation of the financial statements of each component and the U. T. System including certification of the integrity of the financial statements of each component and of the U. T. System by appropriate executive management.
Implementation Guidance - This BPM would define the duties and responsibilities of the Financial Reporting Responsible Party.
Title III, Sec 302 – Management Certifications
SOX Ad Hoc Committee Apr 2004
4 October 2003
10.5
DRAFT ACTION PLAN TO IMPLEMENT THE SPIRIT OF THE SARBANES-OXLEY ACT OF 2002
CATEGORY ACTION STEP SOX REFERENCE RESPONSIBLE PARTY
DUE DATE
Prepared by the “Spirit” of Sarbanes-Oxley Act of 2002 Ad Hoc Committee 5
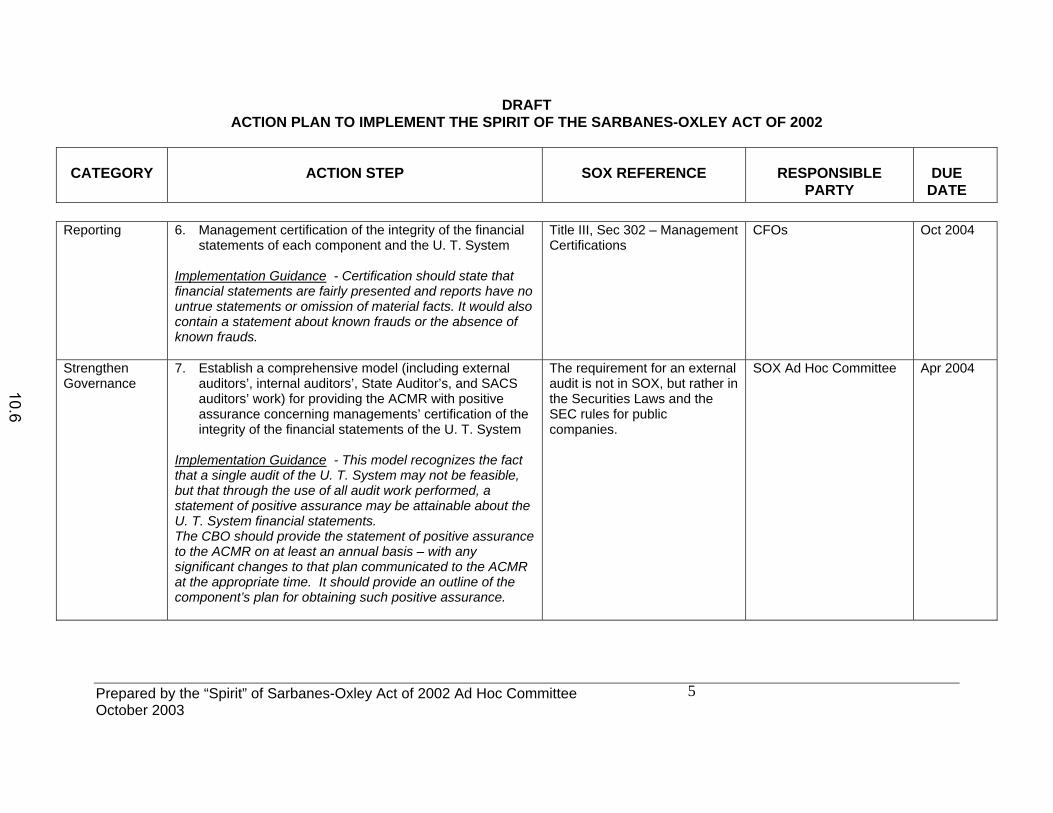
Reporting 6. Management certification of the integrity of the financial statements of each component and the U. T. System
Implementation Guidance - Certification should state that financial statements are fairly presented and reports have no untrue statements or omission of material facts. It would also contain a statement about known frauds or the absence of known frauds.
Title III, Sec 302 – Management Certifications
CFOs Oct 2004
Strengthen Governance
7. Establish a comprehensive model (including external auditors’, internal auditors’, State Auditor’s, and SACS auditors’ work) for providing the ACMR with positive assurance concerning managements’ certification of the integrity of the financial statements of the U. T. System
Implementation Guidance - This model recognizes the fact that a single audit of the U. T. System may not be feasible, but that through the use of all audit work performed, a statement of positive assurance may be attainable about the U. T. System financial statements. The CBO should provide the statement of positive assurance to the ACMR on at least an annual basis – with any significant changes to that plan communicated to the ACMR at the appropriate time. It should provide an outline of the component’s plan for obtaining such positive assurance.
The requirement for an external audit is not in SOX, but rather in the Securities Laws and the SEC rules for public companies.
SOX Ad Hoc Committee Apr 2004
October 2003
10.6
DRAFT ACTION PLAN TO IMPLEMENT THE SPIRIT OF THE SARBANES-OXLEY ACT OF 2002
CATEGORY ACTION STEP SOX REFERENCE RESPONSIBLE PARTY
DUE DATE
Prepared by the “Spirit” of Sarbanes-Oxley Act of 2002 Ad Hoc Committee
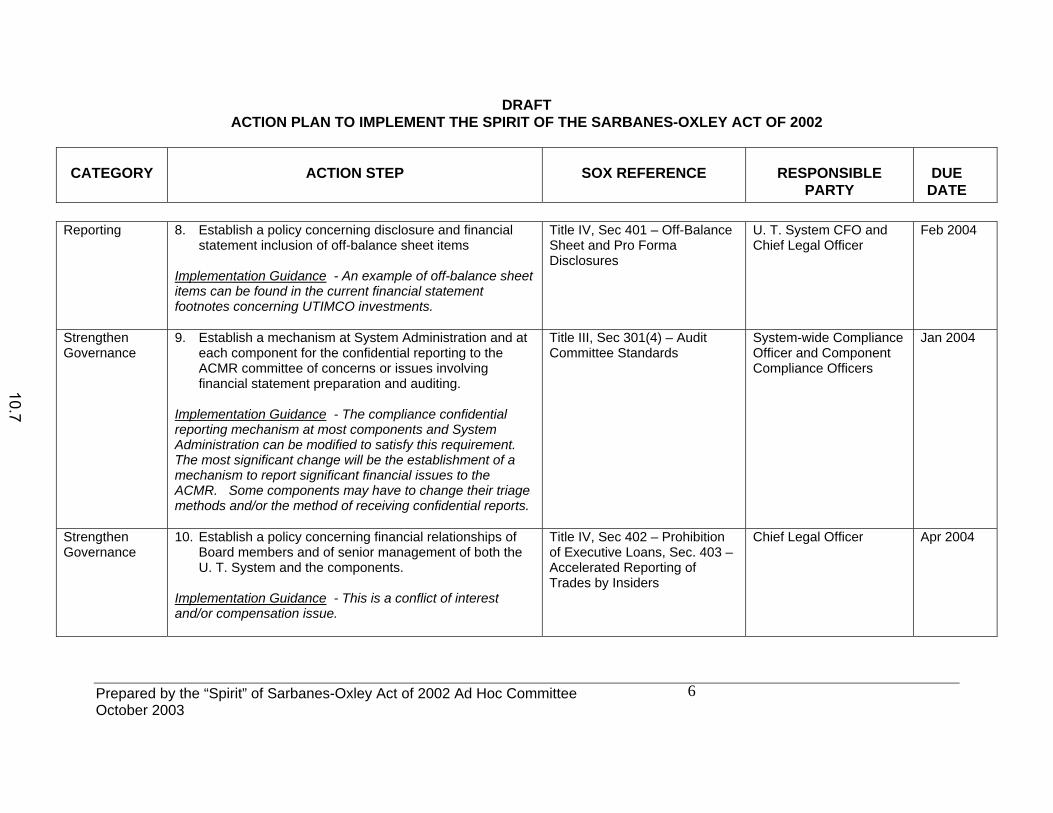
Reporting 8. Establish a policy concerning disclosure and financial statement inclusion of off-balance sheet items
Implementation Guidance - An example of off-balance sheet items can be found in the current financial statement footnotes concerning UTIMCO investments.
Title IV, Sec 401 – Off-Balance Sheet and Pro Forma Disclosures
U. T. System CFO and Chief Legal Officer
Feb 2004
Strengthen Governance
9. Establish a mechanism at System Administration and at each component for the confidential reporting to the ACMR committee of concerns or issues involving financial statement preparation and auditing.
Implementation Guidance - The compliance confidential reporting mechanism at most components and System Administration can be modified to satisfy this requirement. The most significant change will be the establishment of a mechanism to report significant financial issues to the ACMR. Some components may have to change their triage methods and/or the method of receiving confidential reports.
Title III, Sec 301(4) – Audit Committee Standards
System-wide Compliance Officer and Component Compliance Officers
Jan 2004
Strengthen Governance
10. Establish a policy concerning financial relationships of Board members and of senior management of both the U. T. System and the components.
Implementation Guidance - This is a conflict of interest and/or compensation issue.
Title IV, Sec 402 – Prohibition of Executive Loans, Sec. 403 – Accelerated Reporting of Trades by Insiders
Chief Legal Officer Apr 2004
6 October 2003
10.7
DRAFT ACTION PLAN TO IMPLEMENT THE SPIRIT OF THE SARBANES-OXLEY ACT OF 2002
CATEGORY ACTION STEP SOX REFERENCE RESPONSIBLE PARTY
DUE DATE
Prepared by the “Spirit” of Sarbanes-Oxley Act of 2002 Ad Hoc Committee
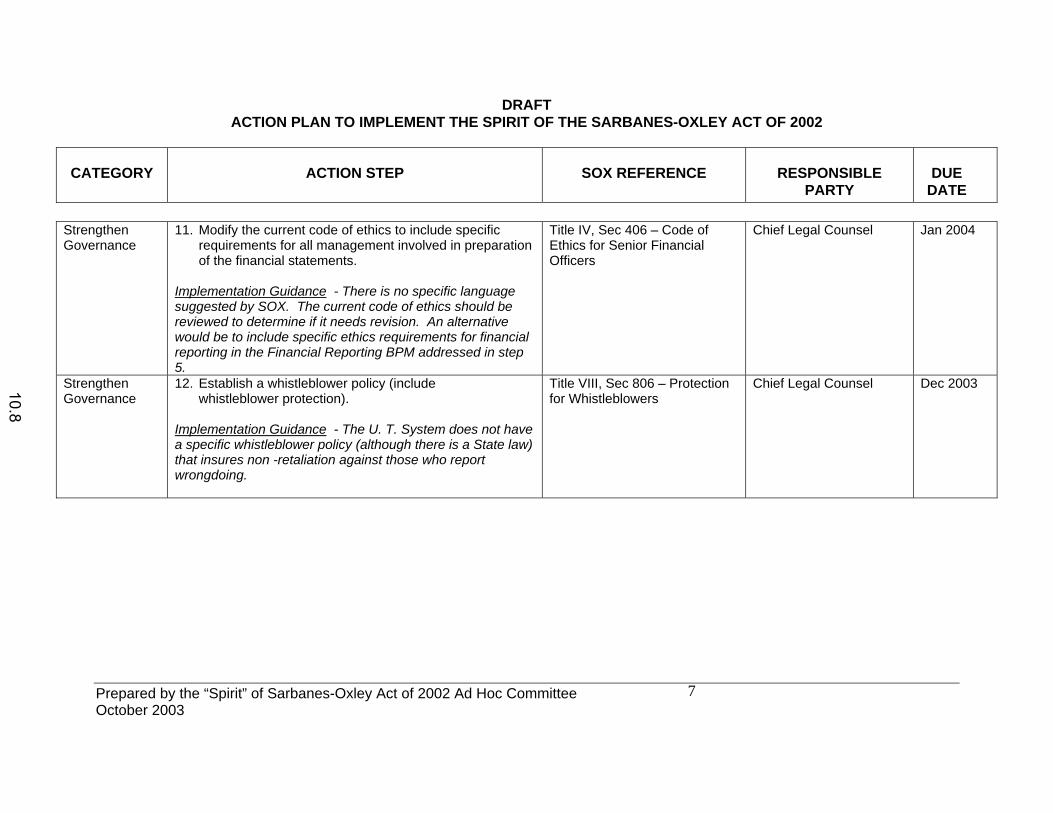
Strengthen Governance
11. Modify the current code of ethics to include specific requirements for all management involved in preparation of the financial statements.
Implementation Guidance - There is no specific language suggested by SOX. The current code of ethics should be reviewed to determine if it needs revision. An alternative would be to include specific ethics requirements for financial reporting in the Financial Reporting BPM addressed in step 5.
Title IV, Sec 406 – Code of Ethics for Senior Financial Officers
Chief Legal Counsel Jan 2004
Strengthen Governance
12. Establish a whistleblower policy (include whistleblower protection).
Implementation Guidance - The U. T. System does not have a specific whistleblower policy (although there is a State law) that insures non -retaliation against those who report wrongdoing.
Title VIII, Sec 806 – Protection for Whistleblowers
Chief Legal Counsel Dec 2003
7 October 2003
10.8

DRAFT ACTION PLAN TO IMPLEMENT THE SPIRIT OF THE SARBANES-OXLEY ACT OF 2002
CATEGORY ACTION STEP SOX REFERENCE RESPONSIBLE PARTY
DUE DATE
Prepared by the “Spirit” of Sarbanes-Oxley Act of 2002 Ad Hoc Committee
Evaluation of Internal Controls
13. Establish a model for management use to document and report on the efficiency and effectiveness of critical internal controls over the recording of financial information and the preparation of financial statements.
Implementation Guidance - The model should include options for piloting and documenting one or two processes that are common to most components, or an internal control assessment for fiscal functions that feed the general ledger and the annual financial statements. If the” pilot project” approach is used, lessons learned in the pilot project will then be used to develop the model for documenting and reporting on critical controls affecting the integrity of the financial statements. If an “internal control assessment” is determined to be the best alternative, then policies and procedures should be evaluated, the organizational structure as it relates to internal controls should be reviewed, and the principal objective will be to identify the key control activities and weaknesses and provide recommendations.
Title IV, Sec. 404 – Evaluation of Internal Controls
SOX Ad Hoc Committee Dec 2004
8 October 2003
10.9
DRAFT ACTION PLAN TO IMPLEMENT THE SPIRIT OF THE SARBANES-OXLEY ACT OF 2002
CATEGORY ACTION STEP SOX REFERENCE RESPONSIBLE PARTY
DUE DATE
Prepared by the “Spirit” of Sarbanes-Oxley Act of 2002 Ad Hoc Committee
Evaluation of Internal Controls
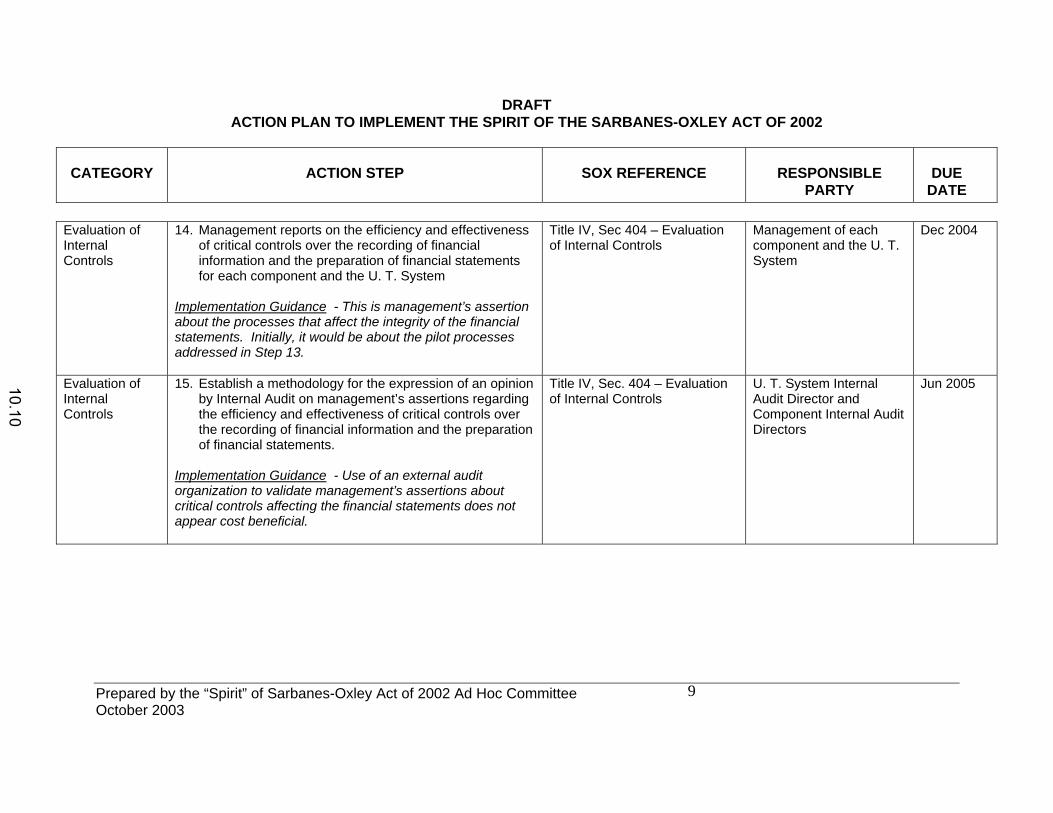
14. Management reports on the efficiency and effectiveness of critical controls over the recording of financial information and the preparation of financial statements for each component and the U. T. System
Implementation Guidance - This is management’s assertion about the processes that affect the integrity of the financial statements. Initially, it would be about the pilot processes addressed in Step 13.
Title IV, Sec 404 – Evaluation of Internal Controls
Management of each component and the U. T. System
Dec 2004
Evaluation of Internal Controls
15. Establish a methodology for the expression of an opinion by Internal Audit on management’s assertions regarding the efficiency and effectiveness of critical controls over the recording of financial information and the preparation of financial statements.
Implementation Guidance - Use of an external audit organization to validate management’s assertions about critical controls affecting the financial statements does not appear cost beneficial.
Title IV, Sec. 404 – Evaluation of Internal Controls
U. T. System Internal Audit Director and Component Internal Audit Directors
Jun 2005
9 October 2003
10.10
DRAFT ACTION PLAN TO IMPLEMENT THE SPIRIT OF THE SARBANES-OXLEY ACT OF 2002
CATEGORY ACTION STEP SOX REFERENCE RESPONSIBLE PARTY
DUE DATE
Prepared by the “Spirit” of Sarbanes-Oxley Act of 2002 Ad Hoc Committee
Evaluation of Internal Controls
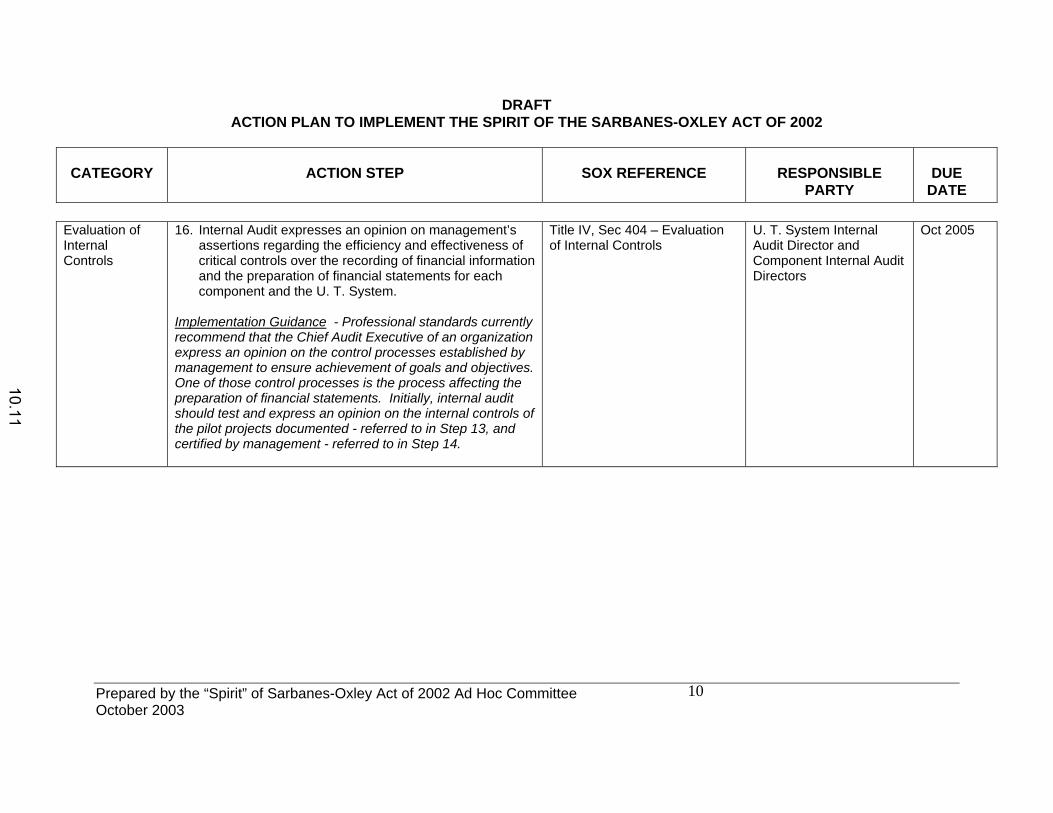
16. Internal Audit expresses an opinion on management’s assertions regarding the efficiency and effectiveness of critical controls over the recording of financial information and the preparation of financial statements for each component and the U. T. System.
Implementation Guidance - Professional standards currently recommend that the Chief Audit Executive of an organization express an opinion on the control processes established by management to ensure achievement of goals and objectives. One of those control processes is the process affecting the preparation of financial statements. Initially, internal audit should test and express an opinion on the internal controls of the pilot projects documented - referred to in Step 13, and certified by management - referred to in Step 14.
Title IV, Sec 404 – Evaluation of Internal Controls
U. T. System Internal Audit Director and Component Internal Audit Directors
Oct 2005
10 October 2003
10.11
5. U. T. System: Annual Report on System-wide Institutional Compliance
Program
REPORT Mr. Charles Chaffin, Chief Audit Executive, will brief the Board of Regents on the annual report of the System-wide Compliance Program, located on Pages 11.1 - 11.3. Activity reports are presented to the Audit, Compliance, and Management Review Committee of the Board of Regents on a quarterly basis. Mr. Greg Lee, UTIMCO Finance and Administration Manager, will report on the UTIMCO Enterprise Risk Management Initiative, as set forth on Pages 11.4 - 11.5.
11
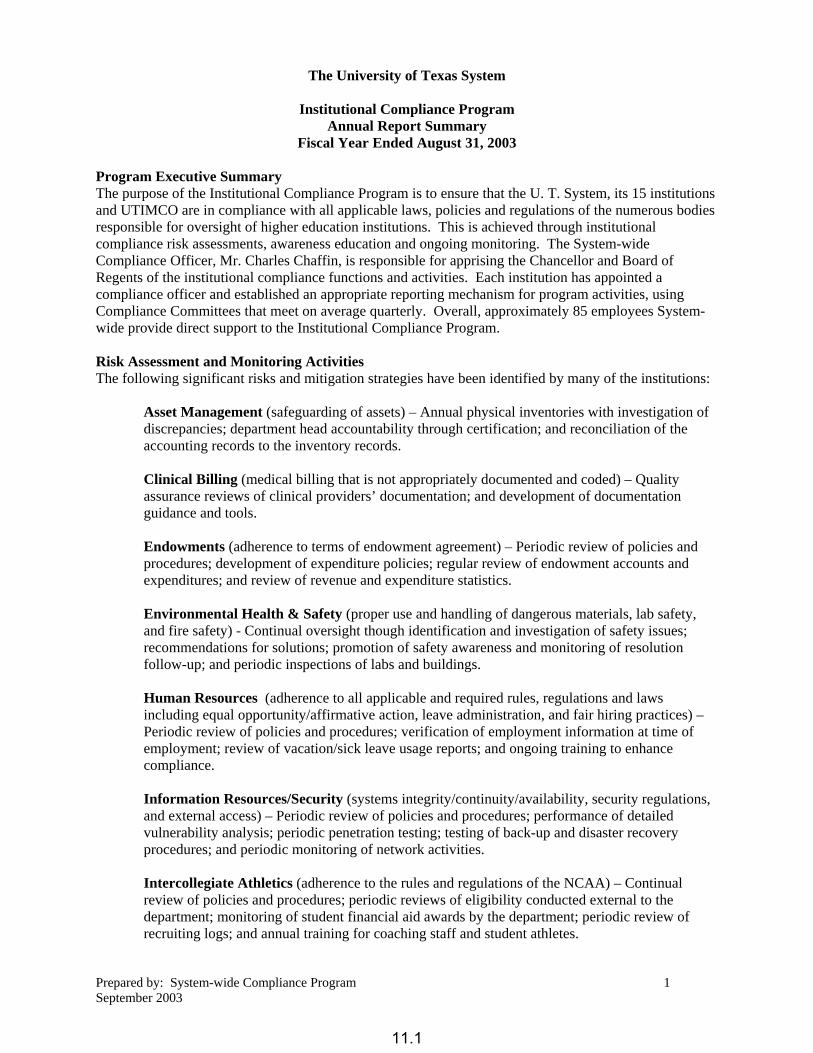
The University of Texas System
Institutional Compliance Program Annual Report Summary
Fiscal Year Ended August 31, 2003 Program Executive Summary The purpose of the Institutional Compliance Program is to ensure that the U. T. System, its 15 institutions and UTIMCO are in compliance with all applicable laws, policies and regulations of the numerous bodies responsible for oversight of higher education institutions. This is achieved through institutional compliance risk assessments, awareness education and ongoing monitoring. The System-wide Compliance Officer, Mr. Charles Chaffin, is responsible for apprising the Chancellor and Board of Regents of the institutional compliance functions and activities. Each institution has appointed a compliance officer and established an appropriate reporting mechanism for program activities, using Compliance Committees that meet on average quarterly. Overall, approximately 85 employees System-wide provide direct support to the Institutional Compliance Program. Risk Assessment and Monitoring Activities The following significant risks and mitigation strategies have been identified by many of the institutions:
Asset Management (safeguarding of assets) – Annual physical inventories with investigation of discrepancies; department head accountability through certification; and reconciliation of the accounting records to the inventory records. Clinical Billing (medical billing that is not appropriately documented and coded) – Quality assurance reviews of clinical providers’ documentation; and development of documentation guidance and tools. Endowments (adherence to terms of endowment agreement) – Periodic review of policies and procedures; development of expenditure policies; regular review of endowment accounts and expenditures; and review of revenue and expenditure statistics. Environmental Health & Safety (proper use and handling of dangerous materials, lab safety, and fire safety) - Continual oversight though identification and investigation of safety issues; recommendations for solutions; promotion of safety awareness and monitoring of resolution follow-up; and periodic inspections of labs and buildings. Human Resources (adherence to all applicable and required rules, regulations and laws including equal opportunity/affirmative action, leave administration, and fair hiring practices) – Periodic review of policies and procedures; verification of employment information at time of employment; review of vacation/sick leave usage reports; and ongoing training to enhance compliance. Information Resources/Security (systems integrity/continuity/availability, security regulations, and external access) – Periodic review of policies and procedures; performance of detailed vulnerability analysis; periodic penetration testing; testing of back-up and disaster recovery procedures; and periodic monitoring of network activities. Intercollegiate Athletics (adherence to the rules and regulations of the NCAA) – Continual review of policies and procedures; periodic reviews of eligibility conducted external to the department; monitoring of student financial aid awards by the department; periodic review of recruiting logs; and annual training for coaching staff and student athletes.
Prepared by: System-wide Compliance Program 1 September 2003
11.1
Research (research not conducted in accordance with approved protocol or federal regulations) – Review of all human subject research, consents and forms by the Institutional Review Board; periodic inspection of animal laboratories and reviews of animal research protocols; review of policies and procedures on a periodic basis; and review of conflict of interest forms and management plans.
Assurance Activities and Significant Findings The following types of assurance activities were performed at the institutions during the year:
Inspections – Inspections were completed in the high-risk areas of Endowments, Environmental Health and Safety and Research. Audits – Internal and external audits were performed on high-risk areas. Internal audits were conducted in the areas of Research Compliance, NCAA Compliance, Clinical Billing and Procurement. External audits were conducted in the areas of Environmental Health & Safety, Credentialing, Research, and EEO/Sexual Harassment.
Peer Reviews – Peer reviews were conducted on several high-risk areas including Student Financial Aid, Contracting, Information Technology, and Purchasing.
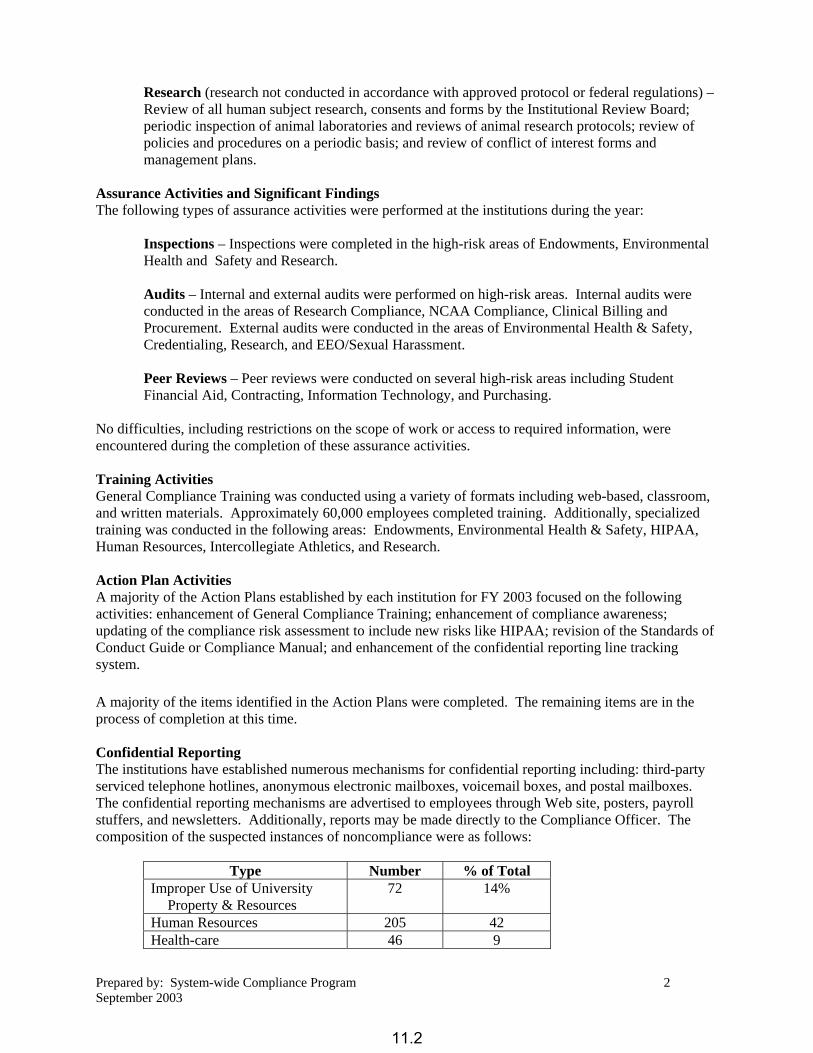
No difficulties, including restrictions on the scope of work or access to required information, were encountered during the completion of these assurance activities. Training Activities General Compliance Training was conducted using a variety of formats including web-based, classroom, and written materials. Approximately 60,000 employees completed training. Additionally, specialized training was conducted in the following areas: Endowments, Environmental Health & Safety, HIPAA, Human Resources, Intercollegiate Athletics, and Research. Action Plan Activities A majority of the Action Plans established by each institution for FY 2003 focused on the following activities: enhancement of General Compliance Training; enhancement of compliance awareness; updating of the compliance risk assessment to include new risks like HIPAA; revision of the Standards of Conduct Guide or Compliance Manual; and enhancement of the confidential reporting line tracking system. A majority of the items identified in the Action Plans were completed. The remaining items are in the process of completion at this time. Confidential Reporting The institutions have established numerous mechanisms for confidential reporting including: third-party serviced telephone hotlines, anonymous electronic mailboxes, voicemail boxes, and postal mailboxes. The confidential reporting mechanisms are advertised to employees through Web site, posters, payroll stuffers, and newsletters. Additionally, reports may be made directly to the Compliance Officer. The composition of the suspected instances of noncompliance were as follows:
Type Number % of Total Improper Use of University
Property & Resources 72
14%
Human Resources 205 42 Health-care 46 9
Prepared by: System-wide Compliance Program 2 September 2003
11.2

Miscellaneous 102 20 Ethics 70 14 Fiscal Reporting/Audit 3 1
Total 498 100% Each institution has established an appropriate triage process. Members of the triage teams may include: Compliance Officer, Chief of Police, Director of Internal Audit, Director of Human Resources, Legal Officer, or other members of the Compliance Committee. Three reports received were considered significant and the System-wide Compliance Officer was appropriately notified and briefed on the issues and resolution. All confidential reports were appropriately resolved. The 2003 Annual Summary Report is submitted by:
Charles G. Chaffin, System-wide Compliance Officer
Prepared by: System-wide Compliance Program 3 September 2003
11.3
UTIMCO Enterprise Risk Management Initiative
Summary
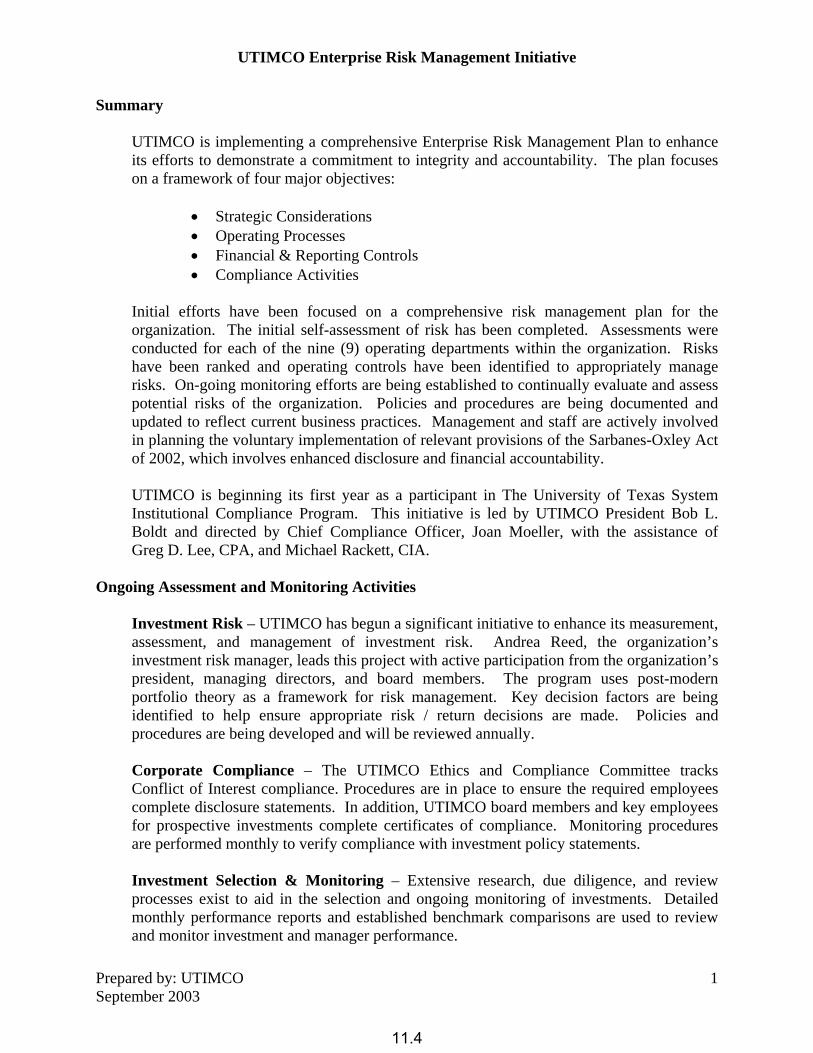
UTIMCO is implementing a comprehensive Enterprise Risk Management Plan to enhance its efforts to demonstrate a commitment to integrity and accountability. The plan focuses on a framework of four major objectives:
• Strategic Considerations • Operating Processes • Financial & Reporting Controls • Compliance Activities
Initial efforts have been focused on a comprehensive risk management plan for the organization. The initial self-assessment of risk has been completed. Assessments were conducted for each of the nine (9) operating departments within the organization. Risks have been ranked and operating controls have been identified to appropriately manage risks. On-going monitoring efforts are being established to continually evaluate and assess potential risks of the organization. Policies and procedures are being documented and updated to reflect current business practices. Management and staff are actively involved in planning the voluntary implementation of relevant provisions of the Sarbanes-Oxley Act of 2002, which involves enhanced disclosure and financial accountability. UTIMCO is beginning its first year as a participant in The University of Texas System Institutional Compliance Program. This initiative is led by UTIMCO President Bob L. Boldt and directed by Chief Compliance Officer, Joan Moeller, with the assistance of Greg D. Lee, CPA, and Michael Rackett, CIA.
Ongoing Assessment and Monitoring Activities
Investment Risk – UTIMCO has begun a significant initiative to enhance its measurement, assessment, and management of investment risk. Andrea Reed, the organization’s investment risk manager, leads this project with active participation from the organization’s president, managing directors, and board members. The program uses post-modern portfolio theory as a framework for risk management. Key decision factors are being identified to help ensure appropriate risk / return decisions are made. Policies and procedures are being developed and will be reviewed annually. Corporate Compliance – The UTIMCO Ethics and Compliance Committee tracks Conflict of Interest compliance. Procedures are in place to ensure the required employees complete disclosure statements. In addition, UTIMCO board members and key employees for prospective investments complete certificates of compliance. Monitoring procedures are performed monthly to verify compliance with investment policy statements. Investment Selection & Monitoring – Extensive research, due diligence, and review processes exist to aid in the selection and ongoing monitoring of investments. Detailed monthly performance reports and established benchmark comparisons are used to review and monitor investment and manager performance.
Prepared by: UTIMCO September 2003
1
11.4
UTIMCO Enterprise Risk Management Initiative
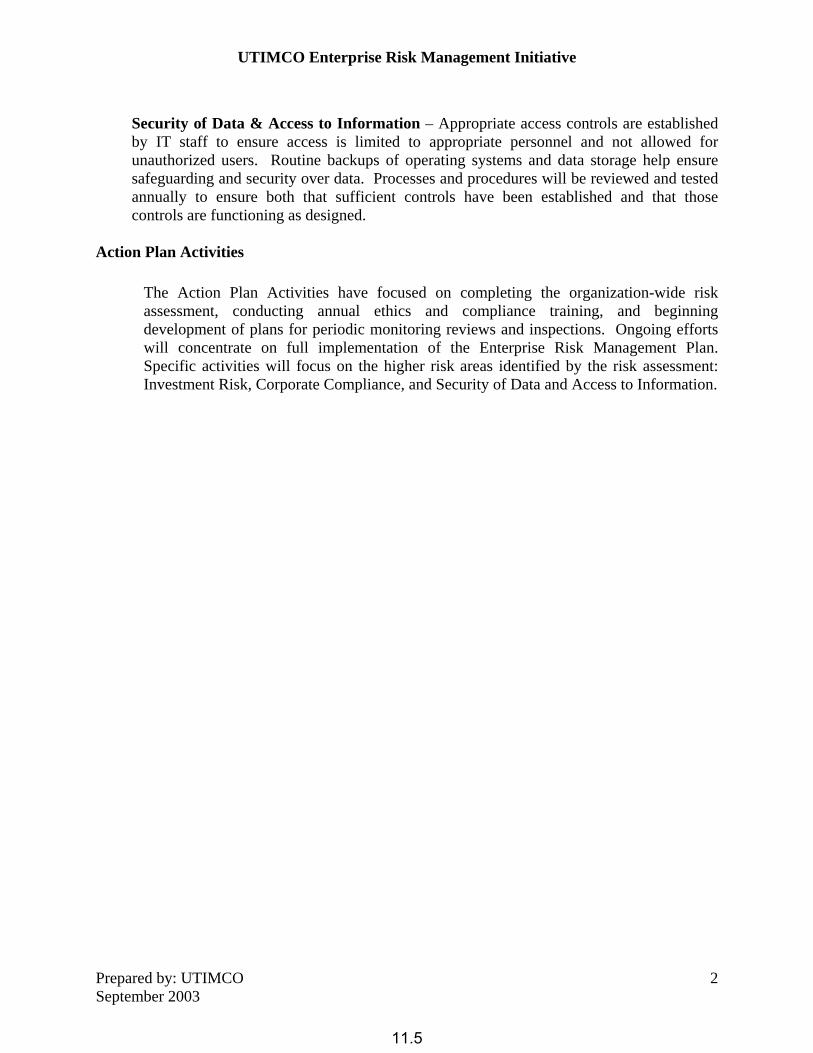
Security of Data & Access to Information – Appropriate access controls are established by IT staff to ensure access is limited to appropriate personnel and not allowed for unauthorized users. Routine backups of operating systems and data storage help ensure safeguarding and security over data. Processes and procedures will be reviewed and tested annually to ensure both that sufficient controls have been established and that those controls are functioning as designed.
Action Plan Activities
The Action Plan Activities have focused on completing the organization-wide risk assessment, conducting annual ethics and compliance training, and beginning development of plans for periodic monitoring reviews and inspections. Ongoing efforts will concentrate on full implementation of the Enterprise Risk Management Plan. Specific activities will focus on the higher risk areas identified by the risk assessment: Investment Risk, Corporate Compliance, and Security of Data and Access to Information.
Prepared by: UTIMCO September 2003
2
11.5

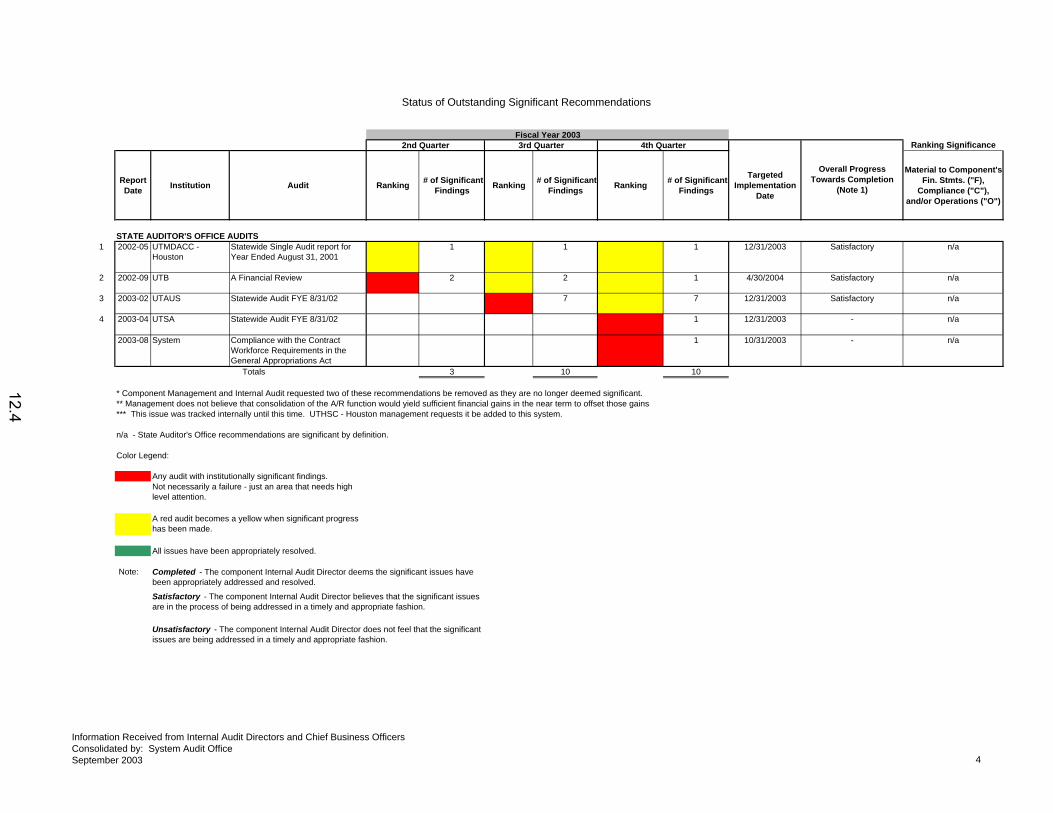
6. U. T. System: Report on System-wide Audit Activity (red, yellow, green
project)
REPORT The fourth quarter activity report on the status of outstanding significant recommendations of the System-wide Audit Activity report is set out on Pages 12.1 - 12.4. Additionally, a list of other audit reports that have been issued by the System-wide audit program, the State Auditor's Office, and the Comptroller of Public Accounts follows on Pages 12.5 - 12.6. There are two types of audit findings/recommendations: reportable and significant. A "reportable" audit finding/recommendation should be included in an audit report if it is material to the operation, financial reporting, or legal compliance of the audited activity, and the corrective action has not been fully implemented. "Significant" audit findings/recommendations are reportable audit findings/recommendations that are deemed significant at the institutional level by the component internal audit committee or their designee. Significant audit findings/recommendations are submitted to and tracked by the System Audit Office. Quarterly, the chief business officers are asked for the status of implementation; the internal audit directors verify implementation. A summary report is provided to the Audit, Compliance, and Management Review Committee of the U. T. Board of Regents. Additionally, the Committee members receive a detailed summary of "new" significant recommendations quarterly.
12

Status of Outstanding Significant Recommendations
Report Date Institution Audit Ranking # of Significant
Findings Ranking # of Significant Findings Ranking # of Significant
Findings
Targeted Implementation
Date
Material to Component's Fin. Stmts. ("F),
Compliance ("C"), and/or Operations ("O")
1 1998-06 UTSYS ADM Office of Human Resources 1 1 0 n/a Completed O
2 1998-07 UTHSC - Houston Federal Contracts & Grants Review 1 1 1 2/28/2004 Satisfactory C
3 1999-02 UTPB Compliance Program 1 1 1 10/31/2003 Satisfactory C
4 1999-11 UTD Green Commons Club 1 1 0 n/a Completed O
5 2000-04 UTHSC - Houston Medical Service Research & Development Plan Summary of Operations Review
1 1 1 11/30/2003 Satisfactory C
6 2000-04 UTSYS ADM Trust Minerals 1 1 1 12/31/2003 Satisfactory C
7 2000-05 UTHC - Tyler Information Technology Audit of Physical Security - Safeguarding & Storage of System Media
2 2 1 10/31/2004 Satisfactory O
8 2000-09 UTAUS Federal Funds Principal Investigators
4 4 4 12/31/03 Satisfactory C
9 2001-01 UTHSC - Houston Casual Appointments, Compensation Compliance & Monitoring Review
1 1 0 n/a Completed C
10 2001-04 UTPA Internet Security 1 1 1 10/31/2003 Satisfactory O
11 2001-08 UTMB - Galveston Institutional E-mail Systems 2 2 0 n/a Completed O
12 2001-08 UTMDACC - Houston
Lotus Notes Environment 3 3 3 12/31/2003 Satisfactory O
13 2001-09 UTPA Advanced Research/Technology Programs
3 3 0 n/a Completed* O, C
14 2001-10 UTHSC - San Antonio
Information Security 2 2 1 9/1/2004 Satisfactory C, O
15 2001-10 UTMDACC - Houston
Disaster Recovery/Business Continuity Planning
1 1 1 6/30/2004 Satisfactory O
16 2001-11 UTEP Department of Chemistry 1 1 1 10/31/2003 Satisfactory C
17 2001-11 UTEP Model Institutions for Excellence 1 1 1 10/31/2003 Satisfactory C
18 2001-11 UTTY Information Technology General Security Review
2 2 2 9/1/2004 Satisfactory O
Ranking Significance2nd QuarterFiscal Year 2003
Overall Progress Towards Completion
(Note 1)
3rd Quarter 4th Quarter
Information Received from Internal Audit Directors and Chief Business OfficersConsolidated by: System Audit Office September 2003 1
12.1

Status of Outstanding Significant Recommendations
Report Date Institution Audit Ranking # of Significant
Findings Ranking # of Significant Findings Ranking # of Significant
Findings
Targeted Implementation
Date
Material to Component's Fin. Stmts. ("F),
Compliance ("C"), and/or Operations ("O")
Ranking Significance2nd QuarterFiscal Year 2003
Overall Progress Towards Completion
(Note 1)
3rd Quarter 4th Quarter
19 2001-11 UTHSC - Houston Report on University Care Plus (UCP)/Physician Business Services (PBS) Payment Process & A/R Credit Balance Review
2 2 1 11/30/2003 Satisfactory C
20 2002-02 UTD Follow-Up of Prior Audit Recommendations
1 1 0 n/a Completed F
21 2002-02 UTHSC - Houston Time Management System Post Implementation Review
1 1 0 n/a Completed O, C
22 2002-02 UTHSC - Houston Environmental & Physical Safety Compliance Program Review
1 1 1 2/28/2004 Satisfactory C
23 2002-04 UTB General Controls Audit of Information Technology
1 1 1 3/31/2004 Satisfactory O
24 2002-05 UTARL Network Support Audit 2 2 2 11/30/2003 Satisfactory O
25 2002-05 UTHC - Tyler Office of the Vice President for Finance & Administration Departmental Audit
1 1 0 n/a Completed F
26 2002-05 UTSYS ADM Office of Information Resources Follow-up
1 1 1 4/1/2004 Satisfactory O
27 2002-07 UTMB - Galveston Clinical Interface Engine 2 2 0 n/a Completed O
28 2002-07 UTHSC - Houston Healthcare Billing Compliance Review ***
1 11/30/2003 - F, C
29 2002-08 UTHSC - San Antonio
Institutional Compliance Program 3 3 2 6/30/2004 Satisfactory C
30 2002-08 UTSYS ADM Travel and Entertainment Expenditures
1 1 1 11/30/2003 Satisfactory O, C
31 2002-09 UTAUS Travel 2 2 2 5/1/2004 Satisfactory O, C
32 2002-09 UTSA Change in Management Departmental Reviews
1 1 1 10/31/2003 Satisfactory O
33 2002-10 UTAUS Student Accounts Receivable/Fee Billing System
1 1 Implementation Cancelled**
0 [none] Cancelled** O
34 2002-10 UTAUS Unit Heads 1 1 1 5/1/2004 Satisfactory O, C
35 2002-10 UTB Workforce Training and Continuing Education Audit
1 1 1 12/31/03 Satisfactory F,O
36 2002-10 UTTY Performance Measures 1 1 1 12/15/2003 Satisfactory C
37 2002-10 UTSYS ADM UTHC - Tyler Clinical Trials 1 1 1 1/1/2005 Satisfactory O, F
Information Received from Internal Audit Directors and Chief Business OfficersConsolidated by: System Audit Office September 2003 2
12.2

Status of Outstanding Significant Recommendations
Report Date Institution Audit Ranking # of Significant
Findings Ranking # of Significant Findings Ranking # of Significant
Findings
Targeted Implementation
Date
Material to Component's Fin. Stmts. ("F),
Compliance ("C"), and/or Operations ("O")
Ranking Significance2nd QuarterFiscal Year 2003
Overall Progress Towards Completion
(Note 1)
3rd Quarter 4th Quarter
38 2002-11 UTPB POISE Application Audit 2 2 1 10/31/2003 Satisfactory O
39 2003-01 UTSMC - Dallas Willed Body Program 1 0 n/a Completed C, O
40 2003-02 UTSYS ADM Employee Group Insurance - Benefits and Eligibility Systems
1 1 12/31/2003 Satisfactory O
41 2003-03 UTD Accounts Receivable & Allowance for Doubtful Accounts
1 0 n/a Completed O
42 2003-03 UTEP Miner Village 2 3/31/2003 Completed C, O, F
43 2003-03 UTPA General Controls 11 11 6/30/2004 Satisfactory O44 2003-03 UTSA Library System 1 0 n/a Completed O
45 2003-03 UTMB - Galveston Correctional Managed Care Information Systems Operations
5 2 11/30/2003 Satisfactory O
46 2003-03 UTHSC - San Antonio
PeopleSoft Payroll 5 7/31/2003 Completed O
47 2003-04 UTD Research Compliance 2 0 n/a Completed C
48 2003-06 UTARL Internal Audit Office Peer Review 3 11/30/2003 - C,O
49 2003-06 UTAUS University Data Center 2 11/30/2003 - O
50 2003-06 UTD General Controls 3 6/30/2004 - C,O
51 2003-07 UTD Printing Division 1 4/30/2004 - C, O
52 2003-07 UTSA Student Financial Aid 1 10/31/2003 - F , C
53 2003-08 UTPA Center for International Programs 4 12/30/2003 - F, C
54 2003-08 UTSYS ADM Office of Information Resources Backup and Recovery
1 11/1/2003 - O
55 2003-08 UTSYS ADM System Available Balances 1 10/31/2003 - F
Totals 55 77 74
Information Received from Internal Audit Directors and Chief Business OfficersConsolidated by: System Audit Office September 2003 3
12.3
Status of Outstanding Significant Recommendations
Report Date Institution Audit Ranking # of Significant
Findings Ranking # of Significant Findings Ranking # of Significant
Findings
Targeted Implementation
Date
Material to Component's Fin. Stmts. ("F),
Compliance ("C"), and/or Operations ("O")
Ranking Significance2nd QuarterFiscal Year 2003
Overall Progress Towards Completion
(Note 1)
3rd Quarter 4th Quarter
1 2002-05 UTMDACC - Houston
Statewide Single Audit report for Year Ended August 31, 2001
1 1 1 12/31/2003 Satisfactory
2 2002-09 UTB A Financial Review 2 2 1 4/30/2004 Satisfactory n/a
3 2003-02 UTAUS Statewide Audit FYE 8/31/02 7 7 12/31/2003 Satisfactory
4 2003-04 UTSA Statewide Audit FYE 8/31/02 1 12/31/2003 -
2003-08 System Compliance with the Contract Workforce Requirements in the General Appropriations Act
1 10/31/2003 -
Totals 3 10 10
Color Legend:
Any audit with institutionally significant findings.
All issues have been appropriately resolved.
Note:
n/aSTATE AUDITOR'S OFFICE AUDITS
n/a
n/a
Unsatisfactory - The component Internal Audit Director does not feel that the significant issues are being addressed in a timely and appropriate fashion.
n/a - State Auditor's Office recommendations are significant by definition.
Completed - The component Internal Audit Director deems the significant issues have been appropriately addressed and resolved.
Not necessarily a failure - just an area that needs high level attention.
A red audit becomes a yellow when significant progress has been made.
n/a
* Component Management and Internal Audit requested two of these recommendations be removed as they are no longer deemed significant.** Management does not believe that consolidation of the A/R function would yield sufficient financial gains in the near term to offset those gains *** This issue was tracked internally until this time. UTHSC - Houston management requests it be added to this system.
Satisfactory - The component Internal Audit Director believes that the significant issues are in the process of being addressed in a timely and appropriate fashion.
Information Received from Internal Audit Directors and Chief Business OfficersConsolidated by: System Audit Office September 2003 4
12.4

* OTHER U. T. SYSTEM AUDITS COMPLETED - 6/2003 through 8/2003
Month Received by
System
Institution Audit
2003 - 06 UTHC - Tyler Office of the Vice President & Chief Information Officer 2003 - 06 UTARL Accounts Receivable & Allowance for Doubtful Accounts2003 - 06 UTARL Time Reporting Audit2003 - 06 UTARL Information Technology Vulnerability Action Plan - Phase 12003 - 06 UTAUS Information Technology Vulnerability Action Plan - Phase 12003 - 06 UTAUS Advanced Research & Advanced Technology Programs2003 - 06 UTD Information Technology Vulnerability Action Plan - Phase 12003 - 06 UTEP Information Technology Vulnerability Action Plan - Phase 12003 - 06 UTHC - Tyler Information Technology Vulnerability Action Plan - Phase 12003 - 06 UTHSC - Houston Information Technology Vulnerability Action Plan - Phase 12003 - 06 UTHSC - Houston Advanced Research & Advanced Technology Programs2003 - 06 UTHSC - Houston Department of Obstetrics/Gynecology and Gynecology and
Reproductive Sciences2003 - 06 UTHSC - San Antonio Department of Dental Diagnostic Science
2003 - 06 UTHSC - San Antonio Information Technology Vulnerability Action Plan - Phase 1
2003 - 06 UTMB - Galveston Information Technology Vulnerability Action Plan - Phase 12003 - 06 UTPA Personnel Services Office Departmental Audit2003 - 06 UTPA NCAA Agreed-Upon Procedures Report FYE 8/31/022003 - 06 UTPB Information Technology Vulnerability Action Plan - Phase 12003 - 06 UTSA Information Technology Vulnerability Action Plan - Phase 12003 - 06 UTSMC - Dallas Information Technology Vulnerability Action Plan - Phase 12003 - 06 UTSYS ADM Information Technology Vulnerability Action Plan - Phase 12003 - 07 UTAUS 12th Class Day Reporting/Formula Funding2003 - 07 UTAUS Pharmacy Inventory2003 - 07 UTHSC - San Antonio Physical Therapy
2003 - 07 UTHSC - San Antonio Prosthodontics
2003 - 07 UTMB - Galveston Information Technology Vulnerability Report - Phase 22003 - 07 UTMDACC Billing Compliance Effectiveness2003 - 07 UTMDACC Charge Capture - Emergency Center2003 - 07 UTMDACC Define Organization and Relationship2003 - 07 UTMDACC Neuro-Oncology Long Distance2003 - 07 UTMDACC International Center Credit Card Internal Control Weakness2003 - 07 UTMDACC Financial Management System Application2003 - 07 UTMDACC PC Lease Review2003 - 07 UTMDACC Use of Institutional Funds for Charitable Expenditures, Follow up2003 - 07 UTSMC - Dallas Workers Compensation Insurance Resource Allocation Program2003 - 07 UTSYS ADM Management Review of The University of Texas at Arlington2003 - 07 UTSYS ADM MBA Program Office Time Reporting Policies & Practices Report
2003 - 07 UTSYS ADM UTHSC - Houston Organizational & Administrative & Finance Reviews Follow-Up
2003 - 07 UTSYS ADM UTEP NCAA Agreed-Upon Procedures Report FYE 8/31/022003 - 08 UTARL NCAA Student Financial Aid Compliance Audit2003 - 08 UTARL Information Technology Vulnerability Report - Phase 22003 - 08 UTAUS Information Technology Vulnerability Report - Phase 22003 - 08 UTAUS Bevo Bucks/Dining Dollars System
Information Received from Internal Audit Directors and Chief Business OfficersConsolidated by: System Audit OfficeSeptember 2003
5
12.5

Month Received by
System
Institution Audit
2003 - 08 UTD Callier Child Care Program2003 - 08 UTD Information Technology Vulnerability Report - Phase 22003 - 08 UTD Admissions Office2003 - 08 UTEP Information Technology Vulnerability Report - Phase 22003 - 08 UTHC - Tyler Information Technology Vulnerability Report - Phase 22003 - 08 UTHSC - Houston Information Technology Vulnerability Report - Phase 22003 - 08 UTHSC - SA Research - Animal Care Audit2003 - 08 UTHSC - SA Information Technology Vulnerability Report - Phase 22003 - 08 UTMB - Galveston Family Practice Residency Program2003 - 08 UTMB - Galveston Pulmonary Care Services Department Review2003 - 08 UTMB - Galveston Laboratory Safety Inspection Process Design Review2003 - 08 UTMB - Galveston Operational Review - Delivery of Operating Room Services2003 - 08 UTMB - Galveston School of Nursing Change in Management Review2003 - 08 UTPA Advanced Research & Advanced Technology Programs2003 - 08 UTSA Faculty Recruitment2003 - 08 UTSMC - Dallas Parkland Contract Payments for Graduate Medical Education2003 - 08 UTSYS ADM UTPB Follow-Up Audit FY 20032003 - 08 UTSYS ADM Office of Academic Affairs Audit Report FY 20032003 - 08 UTSYS ADM OFPC Customer/Client Surveys2003 - 08 UTSYS ADM 4th Quarter Follow-up FY 20032003 - 08 UTSYS ADM Information Technology Vulnerability Report - Phase 2
* STATE AUDITOR'S OFFICE AUDITS COMPLETED - 6/2003 through 8/2003 - NO RECOMMENDATIONS
Report Issuance
Date2003-07-30
2003-08-29
2003-08-29
* COMPTROLLER OF PUBLIC ACCOUNTS AUDITS COMPLETED - 6/2003 through 8/2003
Report Issuance
Date
Institution Audit
2003-08-22 UTSYS ADM Post Payment Audit of The University of Texas System Administration
2003-08-25 UTHSC - Houston Post Payment Audit of The University of Texas Health Science Center at Houston
Audit
A Review of State Entities' Preparedness for Compliance with the Health Insurance Portability and Accountability ActA Review of Enrollment Reporting by Texas Public Universities and Health-Related Institutions
A Review of Financial Controls over Patient Accounts Receivable and Uncompensated Care at State Medical Institutions
Information Received from Internal Audit Directors and Chief Business OfficersConsolidated by: System Audit OfficeSeptember 2003
6
12.6
7. U. T. System: Report on the Results of the UTIMCO Audit
REPORT Mr. Ricky Richter of Ernst & Young LLP will report on the results of the audit of the financial statements of the Permanent University Fund, General Endowment Fund, Permanent Health Fund, Long Term Fund, and Short Intermediate Term Fund (following on Pages 13.1 - 13.91). Ernst & Young LLP’s Audit Results and Communications are included on Pages 13.1 - 13.5. Ernst & Young LLP’s Report of Independent Auditors for each fund is available as follows:
• Permanent University Fund (Pages 13.6 - 13.27) • General Endowment Fund (Pages 13.28 - 13.48) • Permanent Health Fund (Pages 13.49 - 13.63) • Long Term Fund (Pages 13.64 - 13.78) • Short Intermediate Term Fund (Pages 13.79 - 13.91)
The full financial statements including the Permanent University Fund Detail Schedules of Investment Securities and the Statement of Investment Performance Statistics, which are not attached to this report, are accessible at http://www.utsystem.edu/bor/agendabook/ effective November 3, 2003. Ernst & Young LLP was selected to perform the 2003 financial audit of the funds managed by The University of Texas Investment Management Company (UTIMCO), following a Request for Proposals (RFP) process in June 2003. The Board of Regents is required, by statute, to have the financial statements of the Permanent University Fund audited annually.
13
i
TABLE OF CONTENTS FOR
FINANCE AND PLANNING COMMITTEE
Committee Meeting: 11/12/2003 MCM Elegante Hotel
Board Meeting: 11/13/2003 U. T. Permian Basin
Woody L. Hunt, Chairman H. Scott Caven, Jr. James Richard Huffines Cyndi Taylor Krier
Committee Meeting
Board Meeting
Page
Convene 11:00 a.m. Chairman Hunt
1. U. T. System: Approval of Docket No. 115 Not on Agenda Action 14 2. U. T. Board of Regents: Amendments to the Regents'
Rules and Regulations regarding disclosure requirements for financial advisors and service providers (Part Two, Chapter IX, Sections 3 and 4)
11:05 a.m. Action Mr. Aldridge
Action
15
3. U. T. Board of Regents: Adoption of Thirteenth Supplemental Resolution authorizing the issuance of additional Revenue Financing System (RFS) Bonds; authorization to execute interest rate swap transactions in connection with the Bonds; authorization to complete all related transactions; and approval as to form for use of documents
11:10 a.m. Action Mr. Aldridge
Action
17
4. U. T. Board of Regents: Adoption of Resolution authorizing the execution of Master Interest Rate Swap Agreements and approval as to form for use of documents
11:20 a.m. Action Mr. Aldridge
Action
21
5. U. T. Board of Regents: Report on Investments for the three months ended August 31, 2003, and Performance Report by Ennis Knupp
11:25 a.m. Action Mr. Boldt Mr. Steve Voss, Ennis Knupp
Action
27
6. U. T. System: Permanent University Fund quarterly update 11:40 a.m. Report Mr. Aldridge
Not on Agenda
28
7. U. T. System: Report of the Energy Utility Task Force for Fiscal Year 2003
11:50 a.m. Report Mr. Aldridge
Not on Agenda
29
Adjourn
14
1. U. T. System: Approval of Docket No. 115
RECOMMENDATION It is recommended that Docket No. 115 as attached beginning on Page Docket - 1 be approved. It is requested that the Committee confirm that authority to execute contracts, docu-ments, or instruments approved therein has been delegated to appropriate officials of the respective institution involved.
15
2. U. T. Board of Regents: Amendments to the Regents' Rules and Regula-tions regarding disclosure requirements for financial advisors and service providers (Part Two, Chapter IX, Sections 3 and 4)
RECOMMENDATION The Chancellor concurs in the recommendation of the Executive Vice Chancellor for Academic Affairs, the Acting Executive Vice Chancellor for Health Affairs, the Interim Vice Chancellor for Business Affairs, and the Vice Chancellor and General Counsel that the Regents' Rules and Regulations, Part Two, Chapter IX, Sections 3 and 4, concern-ing disclosure requirements for financial advisors and service providers, be amended as set forth below in congressional style:
a. Amend Section 3 to add a new Subsection 3.5 as follows: Sec. 3. Policy for Investment and Management of the PUF
. . .
3.5 Financial Advisors and Service Providers Financial advisors and service providers as defined in Texas Government Code Section 2263.002 shall comply with the disclosure requirements contained in Texas Government Code Section 2263.005.
b. Amend Section 4 as follows:
Sec. 4. Policy for Investment and Management of U. T. Investment Pools
4.1 Investment Policy Statement The policies for the investment of funds for U. T. investment pools shall be those outlined in the applicable Investment Policy Statement.
4.2 Application of Other Regulations
The provisions of Subsections 3.2, 3.3, and 3.4, and 3.5 of this Chapter with respect to the investment and management of the PUF, shall also likewise apply to other U. T. investment pools.
4.3 System Professional Medical Liability Benefit Plan
The Professional Medical Liability Fund shall be administered in a manner consistent with all provisions of the System Professional Medical Liability Benefit Plan.
16
4.4 Conformance with Trust Indenture and State Law Each pooled income fund established by U. T. shall be administered according to The University of Texas System Separately Invested Endowment, Trust, and Other Accounts Investment Policy Statement, the fund’s trust indenture, and applicable law.
BACKGROUND INFORMATION The proposed amendments to the Regents' Rules and Regulations, Part Two, Chap-ter IX, Sections 3 and 4 implement the requirements of Senate Bill 1059, relating to corporate ethics and integrity, which became effective September 1, 2003. Senate Bill 1059 added Chapter 2263 to the Texas Government Code, dealing with ethics and disclosure requirements for outside financial advisors and service providers. The new law requires governing bodies of governmental entities that manage or invest state funds to adopt by rule, no later than January 1, 2004, standards of conduct for financial advisors and service providers (defined as "a person or business entity who acts as a financial advisor, financial consultant, money or investment manager, or broker") who: a. may be expected to receive more than $10,000 in compensation per year;
or b. who render important investment of funds management advice to the
entity. Senate Bill 1059 requires outside financial advisors and service providers to disclose, in writing, to both the state entity and State Auditor: a. any relationship the financial advisor or service provider have with any
party to a state entity transaction, other than a relationship necessary to the financial services being provided, if a reasonable person could expect the relationship to diminish the advisor's or provider's independence of judgment in the performance of the advisor's or provider's responsibilities to the state entity; and
b. all direct and indirect pecuniary interests the advisor or provider has in any
party to a state entity transaction, if the transaction is connected with the advice or service being provided in connection with the management or investment of state funds.
The University of Texas Investment Management Company (UTIMCO) is the Board of Regents' primary investment advisor and the Board of Regents is required, under the statute authorizing UTIMCO, to approve UTIMCO's Code of Ethics. The current UTIMCO Code of Ethics, last approved by the U. T. Board on August 7, 2003, goes beyond the disclosure requirements created by Senate Bill 1059 and satisfies, in large
17
part, the intent behind Senate Bill 1059. However, the definition of "financial advisor or service provider" is sufficiently broad that a number of individuals, firms, or companies that do business with UTIMCO, as well as the independent financial advisor recently hired by the Board of Regents, will be required to file disclosure forms, promulgated by the State Auditor, on an annual basis at minimum. UTIMCO's internal managers and the brokers and dealers they trade with, investment partnerships, hedge funds, and "fund of fund" managers will be subject to the new disclosure requirements. The U. T. System liaison to UTIMCO will coordinate distribution and collection of forms from UTIMCO and the other financial advisors and service providers required to submit them, review the forms, and provide relevant disclosure to the Board of Regents. 3. U. T. Board of Regents: Adoption of Thirteenth Supplemental Resolution
authorizing the issuance of additional Revenue Financing System (RFS) Bonds; authorization to execute interest rate swap transactions in connection with the Bonds; authorization to complete all related transactions; and approval as to form for use of documents
RECOMMENDATION The Chancellor concurs in the recommendation of the Interim Vice Chancellor for Business Affairs that the U. T. Board of Regents: a. adopt the Thirteenth Supplemental Resolution to the Master Resolution,
substantially in the form presented to the Board of Regents, authorizing the issuance, sale, and delivery of Board of Regents of The University of Texas System Revenue Financing System Bonds in one or more install-ments in an aggregate principal amount not to exceed $496,000,000 with a final maturity not to exceed the Year 2035 for the purpose of advance refunding certain outstanding Revenue Financing System Bonds to produce present value debt service savings; to refund a portion of the outstanding Revenue Financing System Commercial Paper Notes, Series A; to provide new money to fund construction and acquisition costs of projects in the Capital Improvement Program; and to pay the costs of issuance and any original issue discount;
b. authorize issuance of the Bonds with natural or synthetic fixed interest
rates and the execution of interest rate swap transactions to convert variable interest rates on the bonds into fixed rate obligations if the Bonds are issued with variable interest rates; and
c. authorize appropriate officers and employees of the U. T. System as set
forth in the Thirteenth Supplemental Resolution to take any and all actions necessary to carry out the intentions of the U. T. Board of Regents, within the limitations and procedures specified therein, make certain covenants

18
and agreements in connection therewith; and resolve other matters incident and related to the issuance, sale, security, and delivery of such Bonds.
The Chancellor also concurs in the recommendation of the Interim Vice Chancellor for Business Affairs that, in compliance with Section 5 of the Amended and Restated Master Resolution Establishing The University of Texas System Revenue Financing System adopted by the U. T. Board of Regents on February 14, 1991, amended on October 8, 1993 and August 14, 1997, and upon delivery of the Certificate of an Autho-rized Representative as required by Section 5 of the Master Resolution, the U. T. Board of Regents resolves that:
a. sufficient funds will be available to meet the financial obligations of the U. T. System, including sufficient Pledged Revenues as defined in the Master Resolution to satisfy the Annual Debt Service Requirements of the Financing System, and to meet all financial obligations of the Board relating to the Financing System; and
b. the component institutions, which are "Members" as such term is used in the Master Resolution, possess the financial capacity to satisfy their direct obligation as defined in the Master Resolution relating to the issuance by the U. T. Board of Regents of tax-exempt Parity Debt.
The Chancellor further concurs in the recommendation that the forms used for this transaction may be used for future approved transactions, following review by the U. T. System Office of General Counsel and outside bond counsel.
BACKGROUND INFORMATION On February 14, 1991, the Board adopted a Master Resolution establishing the Revenue Financing System (RFS) to create a cost-effective, System-wide financing structure for component institutions of the U. T. System. Since that time, the Board has adopted 12 supplemental resolutions to provide debt financing for projects that have received the requisite U. T. System Board of Regents and Texas Higher Education Coordinating Board approvals. Adoption of the Thirteenth Supplemental Resolution (Resolution) would authorize the advance refunding of certain outstanding RFS Bonds provided the refunding exceeds a minimum 3% present value debt service savings threshold. An advance refunding involves issuing bonds to refund outstanding bonds in advance of the call date. Refunding bonds are issued at lower interest rates thereby producing debt service savings. The Resolution provides flexibility to execute the transaction using either natural or synthetic fixed rate debt. Natural fixed rate debt involves issuing fixed rate bonds. Synthetic fixed rate debt involves issuing variable rate bonds and executing a corresponding floating-to-fixed interest rate swap agreement to effectively convert the
19
interest rate on the bonds to a fixed interest rate. The determination to issue either natural or synthetic fixed rate debt will be made based on market conditions at the time of pricing. The use of any interest rate swap agreements will be in accordance with the U. T. System Interest Rate Swap Policy approved by the Board in February 2003 using standard International Swaps and Derivatives Association, Inc. (ISDA) documentation. Concurrently with the consideration of the Resolution, the Board will consider a reso-lution authorizing master interest rate swap agreements with seven investment banking firms selected through a procurement process. The Board currently has master interest rate swap agreements with three of the firms and these agreements may be amended to conform to the new agreements to be entered into. The Resolution authorizes inter-est rate swap transactions relating to the Bonds and other Parity Debt under the seven interest rate swap agreements. In addition, the Resolution authorizes remarketing, tender, auction and broker-dealer agreements customarily utilized in connection with the types of variable rate instruments authorized. The Resolution also authorizes the refunding of a portion of the outstanding Revenue Financing System Commercial Paper Notes, Series A and to provide new money to fund construction and acquisition costs of projects in the Capital Improvement Program. Generally, commercial paper debt is issued to fund projects during the construction phase and the debt is not amortized. Once construction is complete, the commercial paper is refunded with bonds. Depending on the level of interest rates at the time of pricing, outstanding commercial paper and new money for construction may be financed with long-term debt. As provided in the Resolution, the potential bonds to be refunded include up to: • $42,895,000 of the RFS Bonds, Series 1995A maturing 2008-2017 • $45,950,000 of the RFS Bonds, Series 1996A and $133,460,000 of RFS Bonds,
Series 1996B maturing 2007-2016 • $7,010,000 of the RFS Bonds, Series 1998A and $73,660,000 of RFS Bonds,
Series 1998B maturing 2008-2018 • $29,520,000 of the RFS Bonds, Series 1998C and $66,400,000 of RFS Bonds,
Series 1998D maturing 2009-2019 • $14,130,000 of the RFS Bonds, Series 1999A maturing 2017 and 2018 • $12,895,000 of RFS Bonds, Series 1999B maturing 2018 • $119,955,000 of RFS Bonds, Series 2001B and $56,680,000 of RFS Bonds,
Series 2001C maturing 2012-2022. Adoption of this Resolution will provide the flexibility to select the particular bonds to be refunded depending on market conditions at the time of pricing provided the refunding achieves the minimum 3% savings target.
20
Note: Based on the opinion of outside bond counsel, the Thirteenth Supplemen-tal Resolution and forms of auction agreement and broker-dealer agreement are required to be provided to the Board to comply with applicable provisions of the Texas Government Code. The proposed Thirteenth Supplemental Resolution has been reviewed by outside bond counsel and the U. T. System Office of General Counsel and is available on-line at http://www.utsystem.edu/bor/agendabook. Following approval of the form of these documents by the Board, succeeding documents that are in substantially the same form will not have to be made available as part of the agenda materials.
See Item 4 on Page 21 related to the adoption of master interest rate swap agreements. An overview of proposed Revenue Financing System Advanced Refunding is illustrated on Pages 20.1 - 20.7.
Prepared by the Office of Finance October 24, 2003
Page 1
Overview of Proposed Revenue Financing System Advanced
RefundingThe Office of Finance is requesting Board of Regents’ approval to issue Revenue Financing System (RFS) debt for the primary purpose of advance refunding certain outstanding RFS bonds (including tuition revenue bonds) to achieve present value debt service savings (assuming 3% minimum present value savings).
The System has issued its fixed-rate debt during periods of relatively low interest rates. Additionally, various refunding transactions have been executed to refund the System’s highest cost debt.
The remaining refunding candidates are marginal and can only be refunded for significant savings under certain market conditions. The average coupon rate of the potential refunding candidates is 5.01%.
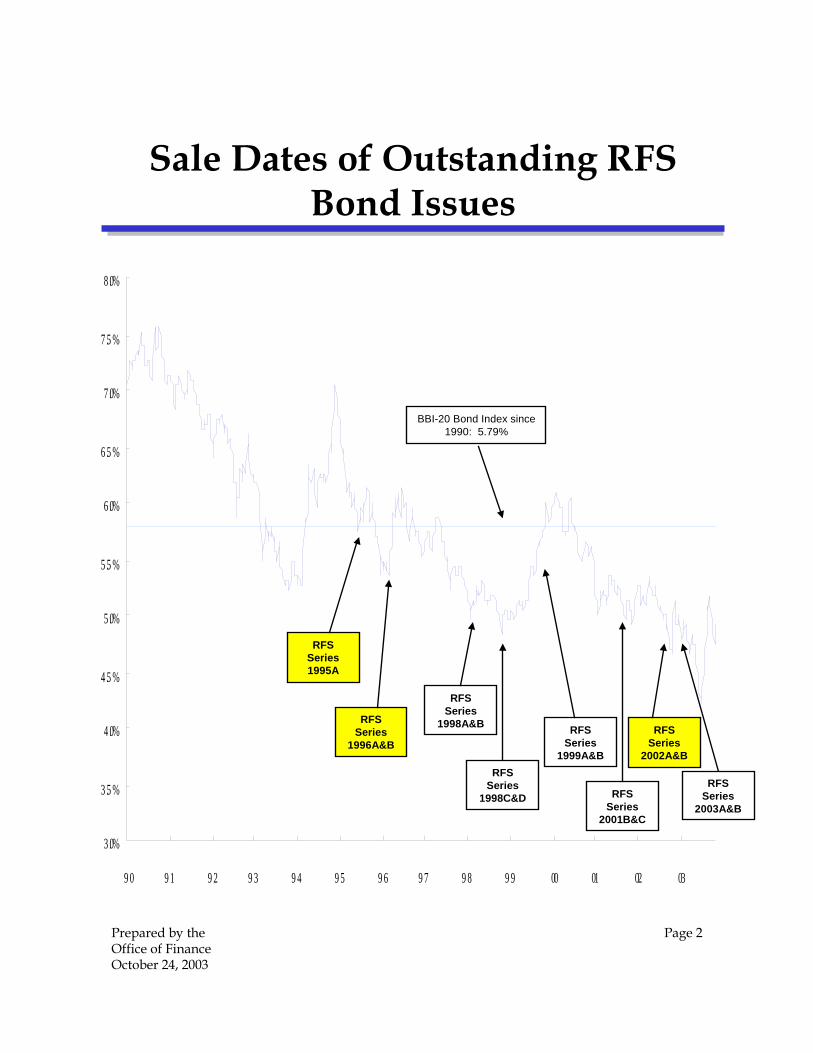
Prepared by the Office of Finance October 24, 2003
Page 2
3 .0%
3 .5 %
4 .0%
4 .5 %
5 .0%
5 .5 %
6 .0%
6 .5 %
7 .0%
7 .5 %
8 .0%
9 0 9 1 9 2 9 3 9 4 9 5 9 6 9 7 9 8 9 9 00 01 02 03
Sale Dates of Outstanding RFS Bond Issues
RFS Series
2001B&C
RFS Series
2002A&B
RFS Series
1999A&B
RFS Series
1998A&B
RFS Series
1998C&D
RFS Series 1995A
RFS Series
1996A&B
RFS Series
2003A&B
BBI-20 Bond Index since 1990: 5.79%

Prepared by the Office of Finance October 24, 2003
Page 3
0 . 0
1. 0
2 . 0
3 . 0
4 . 0
5 . 0
6 . 0
1 2 3 4 5 6 7 8 9 10 11 12 13 14 15 16 17 18 19 2 0
Ma tur i t y (Ye a r s )
%
Cur r en t AAA Mar ket RFS 9 5 A
RFS 9 6 A&B RFS 9 8 A
RFS 9 8 B RFS 9 8 C
RFS 9 8 D RFS 9 9 A&B
RFS 0 1B&C
Coupon Rates of Potential RFS Refunding Candidates versus Current Market Rates as of
October 16, 2003
Prepared by the Office of Finance October 24, 2003
Page 4
Key Points
Interest rates are near all-time lows
Requesting approval to issue either natural fixed rate debt or issue variable and enter a fixed payer swap to achieve fixed-rate financing
Having approvals in place will allow the System to quickly respond in favorable market conditions to capture debt service savings
Size of the transaction is dependent on market interest rates
Transaction could include new money and/or refunding of outstanding commercial paper

Prepared by the Office of Finance October 24, 2003
Page 5
The U.T. System Typically Issues “Natural” Floating Rate Debt or
Fixed Rate Debt
U.T. System
Fixed Rate
U.T. System
Bondholders
Floating Rate
U.T. System
Bondholders
Bondholders

Prepared by the Office of Finance October 24, 2003
Page 6
“Synthetic” Fixed Rate Debt(Issue “natural” floating rate debt and swap to a
fixed rate)
U.T. System
Fixed Rate
Floating Rate
U.T. System
Bank Swap Counterparty
Bondholders
Floating Rate

Prepared by the Office of Finance October 24, 2003
Page 7
Refunding Constraints
The resolution authorizes the issuance of up to $496 million of bonds no later than Nov. 1, 2004.
Refunding must produce a minimum of 3% present value debt service savings.
Any transaction must be in compliance with the System’s interest rate swap policy approved by the Board in February 2003 and the System’s debt policy approved by the Board in May 2003.
Any transaction requires the approving opinion of outside bond counsel and approval by the Office of the Attorney General.

21
4. U. T. Board of Regents: Adoption of Resolution authorizing the execution of Master Interest Rate Swap Agreements and approval as to form for use of documents
RECOMMENDATION The Chancellor concurs in the recommendation of the Interim Vice Chancellor for Business Affairs that the U. T. Board of Regents adopt a resolution substantially in the form set out on Pages 23 - 26 (the Resolution) authorizing appropriate officers of the U. T. System to enter into master interest rate swap agreements with Bank of America Securities; Morgan Stanley Capital Services; Lehman Brothers Special Financing Inc.; UBS AG; Goldman Sachs Mitsui Marine Derivative Products, L.P.; J.P. Morgan Chase Bank; and Merrill Lynch Capital Services, Inc.; to execute confirmations under such agreements, and to take any and all actions necessary to carry out the intentions of the U. T. Board of Regents. The Chancellor also concurs in the recommendation of the Interim Vice Chancellor for Business Affairs that, in compliance with Section 5 of the Amended and Restated Master Resolution Establishing The University of Texas System Revenue Financing System, adopted by the U. T. Board of Regents on February 14, 1991, and amended on October 8, 1993 and August 14, 1997, and based in part upon the delivery of the Certificate of an Authorized Representative as required by Section 5 of the Master Resolution, the U. T. Board of Regents resolves that: a. sufficient funds will be available to meet the financial obligations of the
U. T. System, including sufficient Pledged Revenues as defined in the Master Resolution to satisfy the Annual Debt Service Requirements of the Financing System, and to meet all financial obligations of the Board relating to the Financing System; and
b. the component institutions and U. T. System Administration, which are
"Members" as such term is used in the Master Resolution, possess the financial capacity to satisfy their direct obligation as defined in the Master Resolution relating to the issuance by the U. T. Board of Regents of Parity Debt pursuant to the master interest rate swap agreements.
The Chancellor further concurs in the recommendation that the forms used for this transaction may be used for future approved transactions, following review by the U. T. System Office of General Counsel and outside bond counsel.
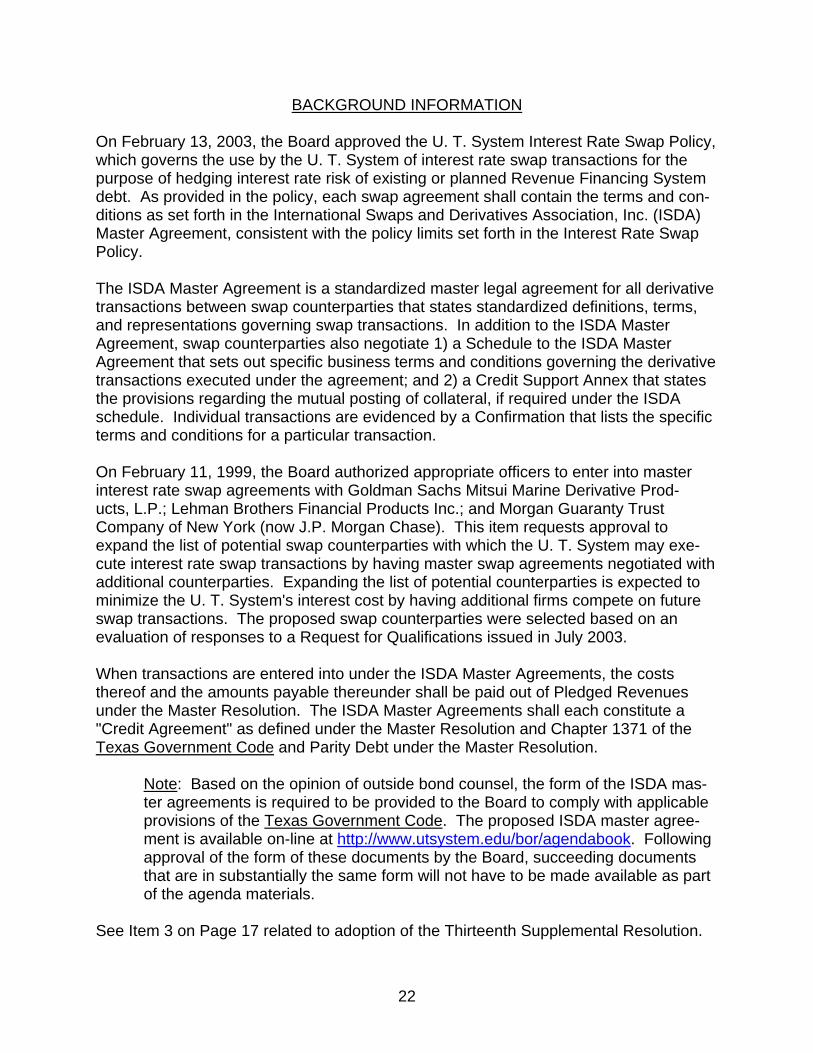
22
BACKGROUND INFORMATION On February 13, 2003, the Board approved the U. T. System Interest Rate Swap Policy, which governs the use by the U. T. System of interest rate swap transactions for the purpose of hedging interest rate risk of existing or planned Revenue Financing System debt. As provided in the policy, each swap agreement shall contain the terms and con-ditions as set forth in the International Swaps and Derivatives Association, Inc. (ISDA) Master Agreement, consistent with the policy limits set forth in the Interest Rate Swap Policy. The ISDA Master Agreement is a standardized master legal agreement for all derivative transactions between swap counterparties that states standardized definitions, terms, and representations governing swap transactions. In addition to the ISDA Master Agreement, swap counterparties also negotiate 1) a Schedule to the ISDA Master Agreement that sets out specific business terms and conditions governing the derivative transactions executed under the agreement; and 2) a Credit Support Annex that states the provisions regarding the mutual posting of collateral, if required under the ISDA schedule. Individual transactions are evidenced by a Confirmation that lists the specific terms and conditions for a particular transaction. On February 11, 1999, the Board authorized appropriate officers to enter into master interest rate swap agreements with Goldman Sachs Mitsui Marine Derivative Prod-ucts, L.P.; Lehman Brothers Financial Products Inc.; and Morgan Guaranty Trust Company of New York (now J.P. Morgan Chase). This item requests approval to expand the list of potential swap counterparties with which the U. T. System may exe-cute interest rate swap transactions by having master swap agreements negotiated with additional counterparties. Expanding the list of potential counterparties is expected to minimize the U. T. System's interest cost by having additional firms compete on future swap transactions. The proposed swap counterparties were selected based on an evaluation of responses to a Request for Qualifications issued in July 2003. When transactions are entered into under the ISDA Master Agreements, the costs thereof and the amounts payable thereunder shall be paid out of Pledged Revenues under the Master Resolution. The ISDA Master Agreements shall each constitute a "Credit Agreement" as defined under the Master Resolution and Chapter 1371 of the Texas Government Code and Parity Debt under the Master Resolution.
Note: Based on the opinion of outside bond counsel, the form of the ISDA mas-ter agreements is required to be provided to the Board to comply with applicable provisions of the Texas Government Code. The proposed ISDA master agree-ment is available on-line at http://www.utsystem.edu/bor/agendabook. Following approval of the form of these documents by the Board, succeeding documents that are in substantially the same form will not have to be made available as part of the agenda materials.
See Item 3 on Page 17 related to adoption of the Thirteenth Supplemental Resolution.
23
A RESOLUTION AUTHORIZING THE EXECUTION AND DELIVERY OF MASTER INTEREST RATE SWAP AGREEMENTS AND AUTHORIZING AND APPROVING OTHER INSTRUMENTS AND PROCEDURES RELATING TO SAID AGREEMENTS
November 13, 2003
WHEREAS, the Board of Regents (the "Board") of The University of Texas System (the "U. T. System") is the governing body of the U. T. System, an institution of higher education under the Texas Education Code and an agency of the State of Texas; and WHEREAS, on February 14, 1991, the Board adopted the First Amended and Restated Master Resolution Establishing The University of Texas System Revenue Financing System and amended such resolution on October 8, 1993, and August 14, 1997 (referred to herein as the "Master Resolution"); and WHEREAS, unless otherwise defined herein, terms used herein shall have the meaning given in the Master Resolution; and WHEREAS, the Master Resolution establishes the Revenue Financing System comprised of the institutions now or hereafter constituting components of the U. T. System that are designated "Members" of the Financing System by action of the Board and pledges the Pledged Revenues attributable to each Member of the Financing System to the payment of Parity Debt to be outstanding under the Master Resolution; and WHEREAS, simultaneously with the adoption of this Resolution, the Board has adopted the Thirteenth Supplemental Resolution to the Master Resolution authorizing the issuance and delivery of one or more series of additional bonds as Parity Debt (the "2004 Bonds"). The 2004 Bonds, together with the outstanding Parity Debt and any additional Parity Debt to be issued or entered into under the Master Resolution are special, limited obligations of the Board payable solely from, and secured by a lien on and pledge of, the Pledged Revenues. The Pledged Revenues are pledged for the equal and proportionate benefit and security of all owners of Parity Debt; and
WHEREAS, the Chancellor and the Interim Vice Chancellor for Business Affairs have recommended the implementation of a financial plan which involves the possible issuance of a portion of the 2004 Bonds as synthetic fixed rate bonds to refund a portion of the outstanding Parity Debt to achieve debt service savings and the authorization and approval of International Swaps and Derivatives Association, Inc. (“ISDA”) Master Agreements with Bank of America Securities, Morgan Stanley Capital Services, Lehman Brothers Special Financing Inc., UBS AG, Goldman Sachs Mitsui Marine Derivative Products, L.P., J.P. Morgan Chase Bank, and Merrill Lynch Capital Services, Inc., (the "Potential Swap Providers") pursuant to which the Board could enter into interest rate swap transactions with some or all of the Potential Swap Providers; and
24
WHEREAS, the Chancellor and the Interim Vice Chancellor for Business Affairs have further recommended that the Board authorize the U. T. System Representative to enter into interest rate swap transactions with one or more of the Potential Swap Providers, when, in the judgment of the U. T. System Representative and in accordance with the U. T. System Interest Rate Swap Policy and Chapter 1371, Texas Government Code, the transaction is expected to result in a lowering of the debt service burden on the U. T. System. NOW THEREFORE BE IT RESOLVED, that 1. The U. T. System Representative is hereby authorized to enter into ISDA Master Agreements (the "Swap Agreements") with each of the Potential Swap Providers in substantially the forms presented to the Board, including the forms of Schedules and Confirmations attached thereto, with such changes as, in the judgment of the U. T. System Representative, with the advice and counsel of the U. T. System Office of General Counsel and Bond Counsel, are necessary to carry out the intent of the Board as expressed in this Resolution, to receive approval of the Swap Agreements by the Attorney General of the State of Texas, or to satisfy conditions of a credit rating agency relating to the Swap Agreements. 2. The U. T. System Representative is further authorized and directed to enter into one or more interest rate swap transactions and agreements terminating any such interest rate swap transaction, pursuant to the U. T. System Interest Rate Swap Policy, each Swap Agreement, and the Confirmation exchanged between the parties confirming such interest rate swap transactions. The terms of the initial interest rate swap transaction, including interest rate, term, notional amount, and options as to commencement and termination of payments shall be as described in the Swap Agreement and as provided in the related Confirmation. The U. T. System Representative shall not enter into transactions under the Swap Agreements unless he or she determines that the transaction conforms to the U. T. System Interest Rate Swap Policy and that the expected debt service cost as a result of entering into the swap transaction is materially lower than the expected debt service cost if the swap had not been executed. 3. In connection with each proposed transaction, the U. T. System Representative shall either (i) seek competitive bids from each of the Potential Swap Providers under the respective Swap Agreements or (ii) enter into a negotiated transaction with one or more of the Potential Swap Providers. The U. T. System Representative shall determine whether a competitive or negotiated transaction will be of greater benefit to the Board. The U. T. System Representative shall specify in the bid documents for a competitive transaction or in the terms of a negotiated transaction as the standard for determining the variable rate under the transaction the Bond Market Association index, a percentage of London Inter-Bank Offer Rate (“LIBOR”), or a combination of the two as contemplated by the forms of Confirmations attached to the Swap Agreements. The U. T. System Representative's determination of which variable rate standard to be used shall be based upon the U. T. System Representative's opinion as to which standard will result in the Board paying the lowest net effective interest rate on the outstanding Parity Debt.

25
If competitive bids are solicited, upon determination of the best bid, the U. T. System Representative will inform each of the Potential Swap Providers of the best bid. If provided in the bid proceedings, the U. T. System Representative may allow a firm or firms not submitting the bid that produces the lowest cost to match the lowest bid and be awarded a predetermined percentage of the notional amount of the swap transaction, in accordance with the U. T. System Interest Rate Swap Policy. In that event those Potential Swap Providers shall have the right to enter into a Confirmation under its respective Swap Agreement in notional amounts as provided in the bid proceedings, on the same terms as the best bid. The U. T. System Representative shall also accept and execute a Confirmation under the Swap Agreement with the Potential Swap Provider submitting the best bid in a notional amount equal to the total notional amount of the swap transaction less the notional amount, if any, of the Confirmations entered into with the other Potential Swap Providers. Each of the Potential Swap Providers executing a Confirmation is hereafter referred to as a "Counterparty." 4. The actions contemplated in the Swap Agreement, and each Confirmation, are hereby in all respects approved, authorized, adopted, ratified, and confirmed. 5. The U. T. System Representative and all officers or officials of the Board are authorized to execute and deliver (i) the Swap Agreements in the name and on behalf of the Board (ii) the Confirmations for transactions as authorized in paragraph 2, and (iii) such other agreements and documents as are contemplated by this Resolution and the Agreement or are otherwise necessary in connection with entering into the interest rate swap transactions described in paragraph 2, as any such officer or official shall deem appropriate, including without limitation, officer certificates, legal opinions, and credit support documents. 6. All officers or officials of the Board and its agents and counsel are authorized to take all such further actions, to execute and deliver such further instruments and documents in the name and on behalf of the Board to pay all such expenses as in his or her judgment shall be necessary or advisable in order to fully carry out the purposes of this Resolution. 7. When Confirmations are executed on behalf of the Board, the costs thereof and the amounts payable thereunder shall constitute Parity Debt under the Master Resolution and, as such, shall be special, limited obligations of the Board payable solely from, and secured by a lien on and pledge of, the Pledged Revenues. 8. The Board further determines that, in connection with the execution and delivery of the Swap Agreements and the execution of the transactions thereunder: a. Sufficient funds will be available to meet the financial obligations of the U. T. System, including sufficient Pledged Revenues as defined in the Master Resolution to satisfy the Annual Debt Service Requirements of the Financing System, and to meet all financial obligations of the Board relating to the Financing System
26
b. The component institutions and U. T. System Administration, which are “Members” as such term is used in the Master Resolution, possess the financial capacity to satisfy their direct obligation as defined in the Master Resolution relating to the issuance by the Board of Parity Debt pursuant to the Swap Agreements. 9. The Board has previously entered into Master Interest Rate Swap Agreements with Goldman Sachs Capital Markets, L.P. (the "1994 Goldman Swap Agreement"), Goldman Sachs Mitsui Marine Derivative Products, L.P. (the "1999 Goldman Swap Agreement"), Morgan Guaranty Trust Company of New York (the "1999 Goldman Swap Agreement "), and Lehman Brothers Financial Products, Inc. (the "1999 Lehman Swap Agreement" and with the 1994 Goldman Swap Agreement, the 1999 Goldman Swap Agreement, and the 1999 Goldman Swap Agreement the "Existing Swap Agreements"). The Board confirms the authority of the U. T. System Representative to enter into Confirmations under each of the Existing Swap Agreements and to enter into amendments to the Existing Swap Agreements rather than entering into new Swap Agreements with the parties to the Existing Swap Agreements. The other provisions of this Resolution shall govern transactions to be entered into under the Existing Swap Agreements.
27
5. U. T. Board of Regents: Report on Investments for the three months ended August 31, 2003, and Performance Report by Ennis Knupp
REPORT Pages 27.1 - 27.9 contain the Summary Reports on Investments for the three months ended August 31, 2003. Item I on Pages 27.1 - 27.3 reports summary activity for the Permanent University Fund (PUF) investments. The PUF's net investment return for the three months was 5.40% versus its composite benchmark return of 4.60%. The PUF's net asset value increased by $393.9 million since the beginning of the quarter to $7,244.8 million. This change in net asset value includes increases due to contributions from PUF land receipts and net investment return. Item II on Pages 27.4 - 27.7 reports summary activity for the General Endowment Fund (GEF), the Permanent Health Fund (PHF), and Long Term Fund (LTF). The GEF's net investment return for the three months was 5.45% versus its composite benchmark return of 4.60%. The GEF's net asset value increased $120.8 million since the beginning of the quarter to $3,584.8 million. Item III on Page 27.8 reports summary activity for the Short Intermediate Term Fund (SITF). Total net investment return on the SITF was negative .29% for the three months versus the SITF's performance benchmark of negative .71%. The SITF's net asset value decreased by $203.0 million since the beginning of the quarter to $1,435.3 million. This decrease in net asset value includes withdrawals from the SITF, distributions, and net investment return. Item IV on Page 27.9 presents book and market value of cash, fixed income, equity, and other securities held in funds outside of internal investment pools. Total cash and equivalents, consisting primarily of component operating funds held in the Dreyfus money market fund, increased by $410,347 thousand to $2,023,603 thousand during the three months since the last reporting period. Market values for the remaining asset types were fixed income securities: $209,934 thousand versus $321,821 thousand at the beginning of the period; equities: $237,065 thousand versus $211,361 thousand at the beginning of the period; and other investments: $40,536 thousand versus $10,226 thousand at the beginning of the period. The Ennis Knupp Performance Report is on Pages 27.10 - 20.105.
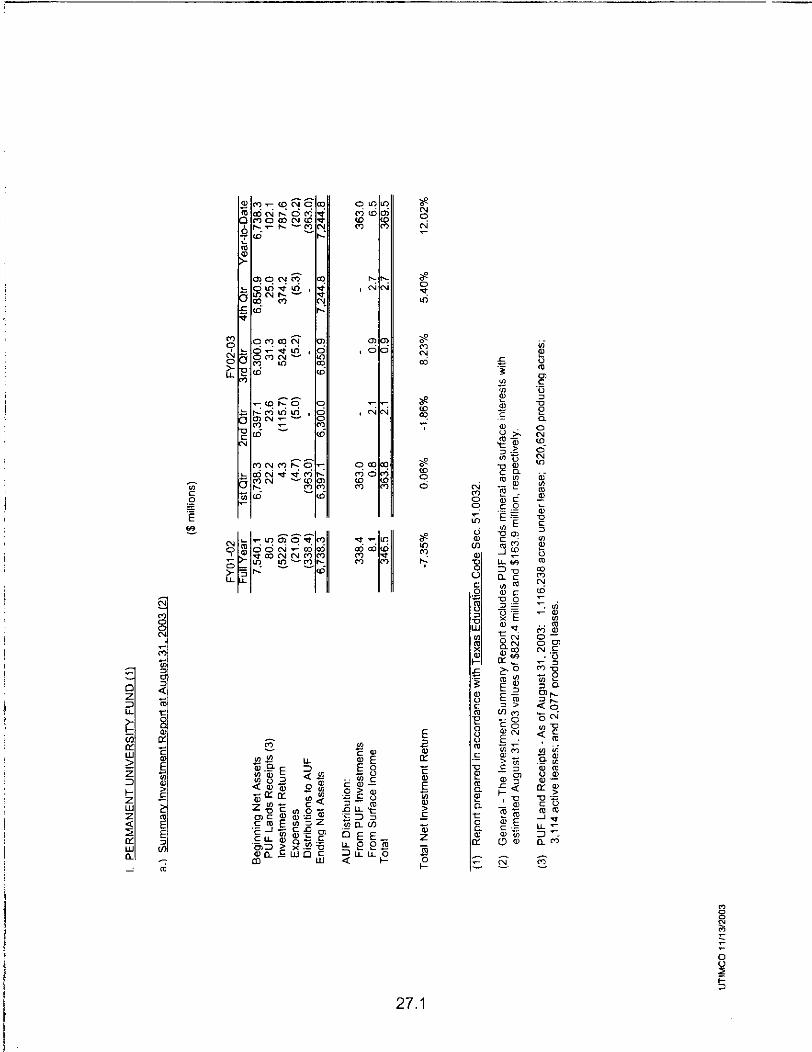


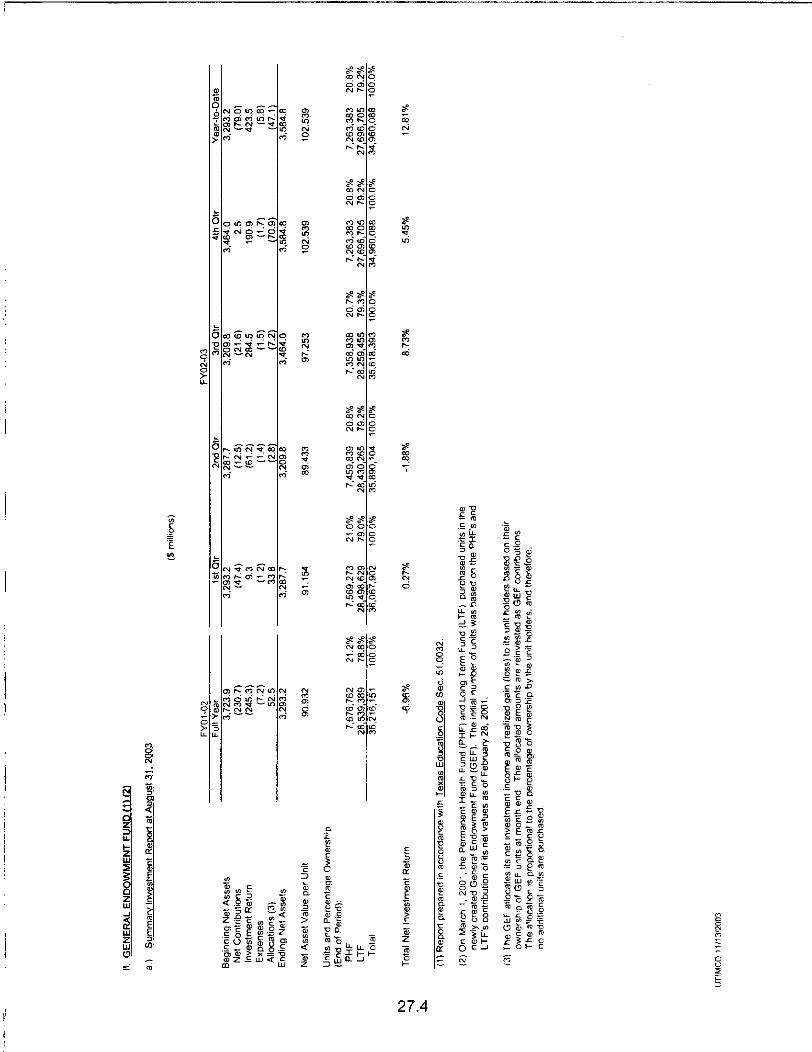
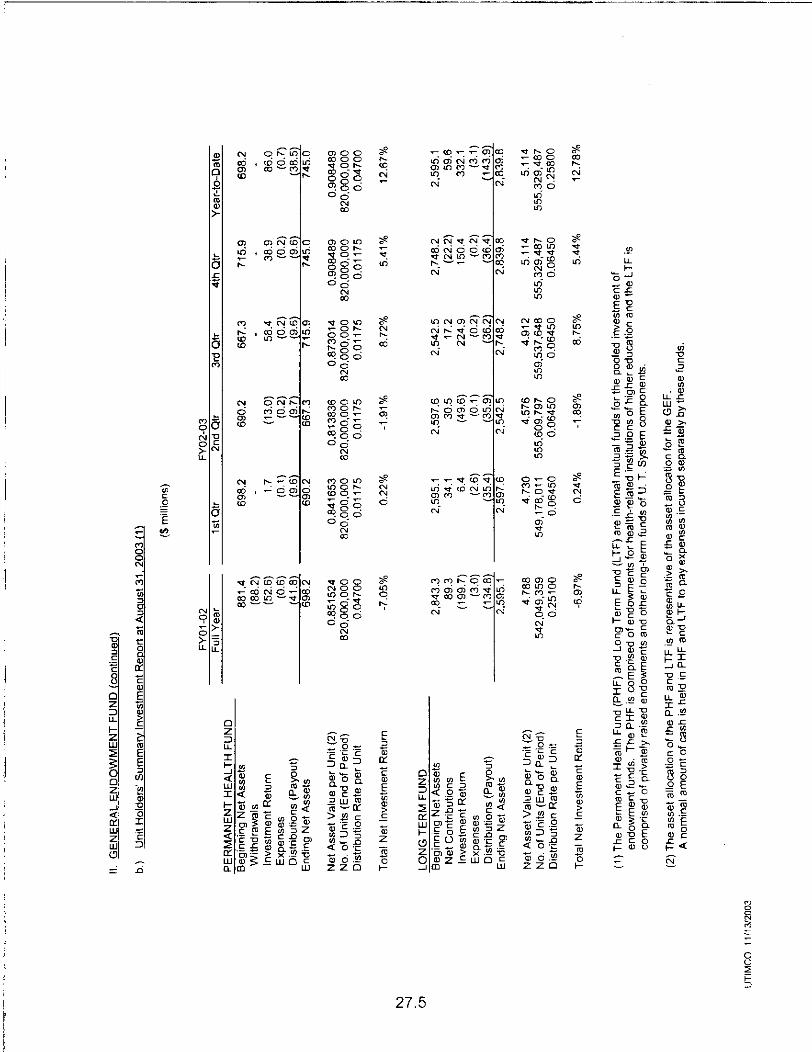

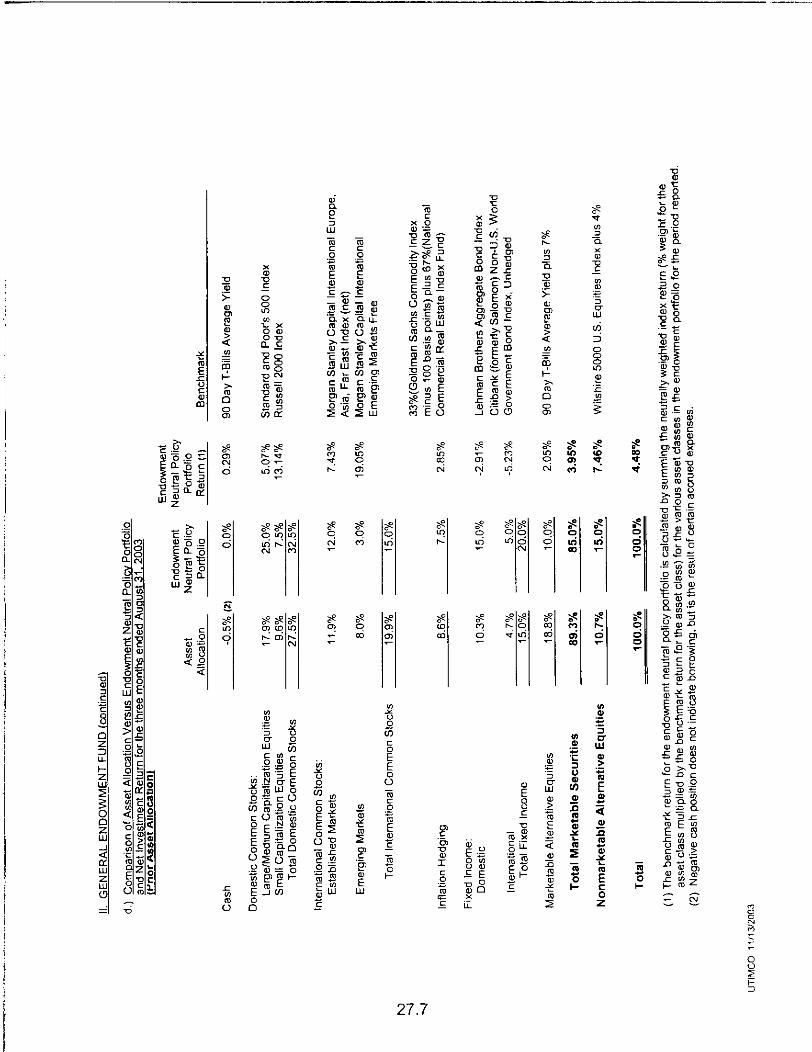
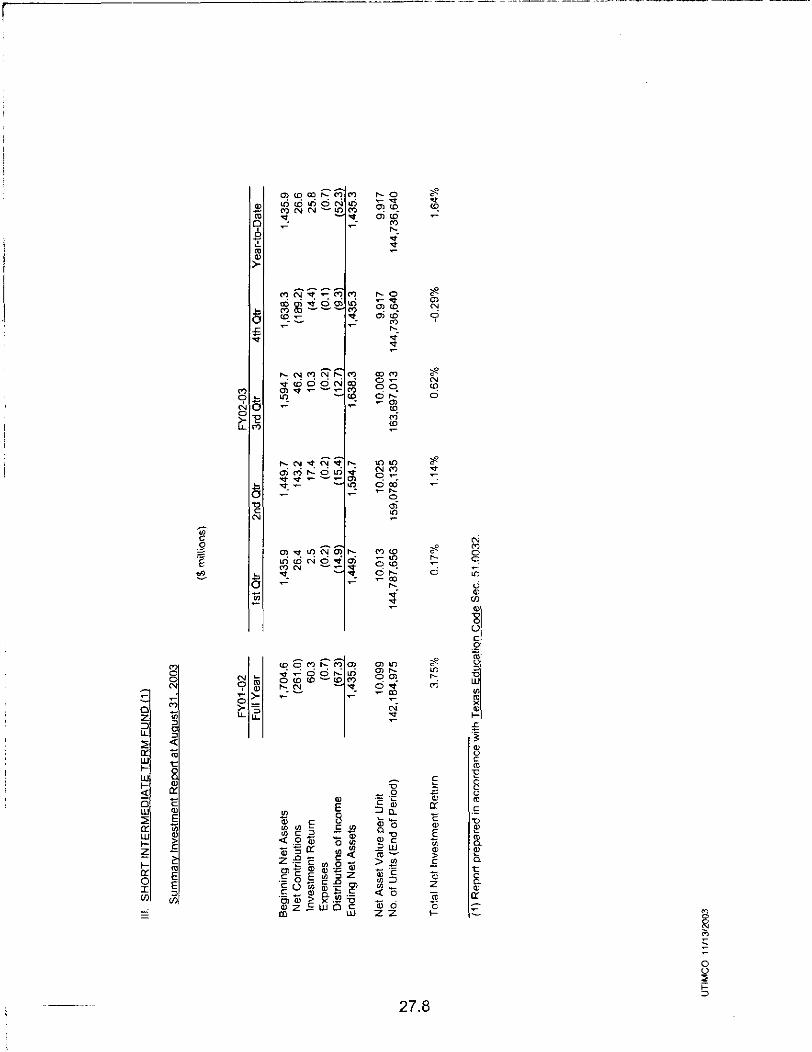

Independent advice for the institutional investor
The University of Texas System Quarter and Fiscal Year Ending August 31, 2003
PERF
ORM
ANCE
REP
ORT

(This page left blank intentionally)
CONTENTS
1 Executive Summary
2 Permanent University Fund
3 General Endowment Fund
4 Operating Funds
5 Appendix All data found in this report has been provided by UTIMCO and Russell Mellon. All rates of return contained in this report are net-of-fees and annualized for time periods greater than one year.

(This page left blank intentionally)

EXECUTIVE SUMMARY
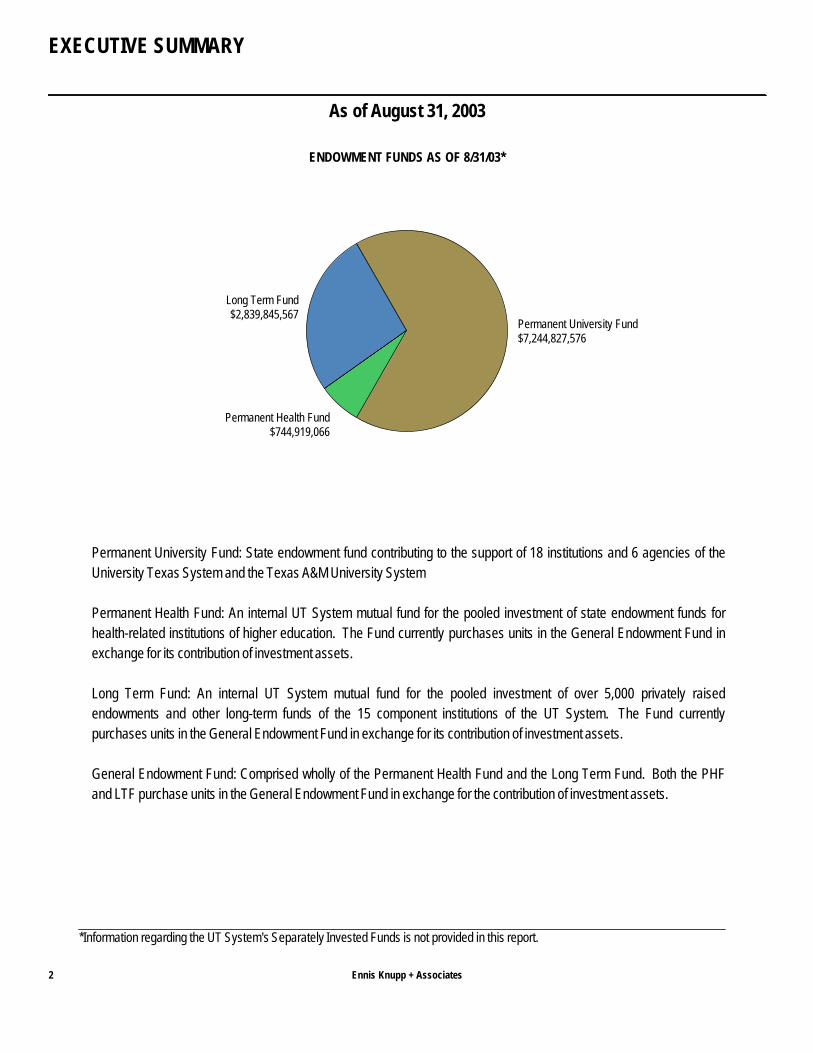
EXECUTIVE SUMMARY
As of August 31, 2003
Ennis Knupp + Associates2
Permanent University Fund$7,244,827,576
Long Term Fund$2,839,845,567
Permanent Health Fund$744,919,066
ENDOWMENT FUNDS AS OF 8/31/03*
Permanent University Fund: State endowment fund contributing to the support of 18 institutions and 6 agencies of theUniversity Texas System and the Texas A&M University System
Permanent Health Fund: An internal UT System mutual fund for the pooled investment of state endowment funds forhealth-related institutions of higher education. The Fund currently purchases units in the General Endowment Fund inexchange for its contribution of investment assets.
Long Term Fund: An internal UT System mutual fund for the pooled investment of over 5,000 privately raisedendowments and other long-term funds of the 15 component institutions of the UT System. The Fund currentlypurchases units in the General Endowment Fund in exchange for its contribution of investment assets.
General Endowment Fund: Comprised wholly of the Permanent Health Fund and the Long Term Fund. Both the PHFand LTF purchase units in the General Endowment Fund in exchange for the contribution of investment assets.
*Information regarding the UT System's Separately Invested Funds is not provided in this report.
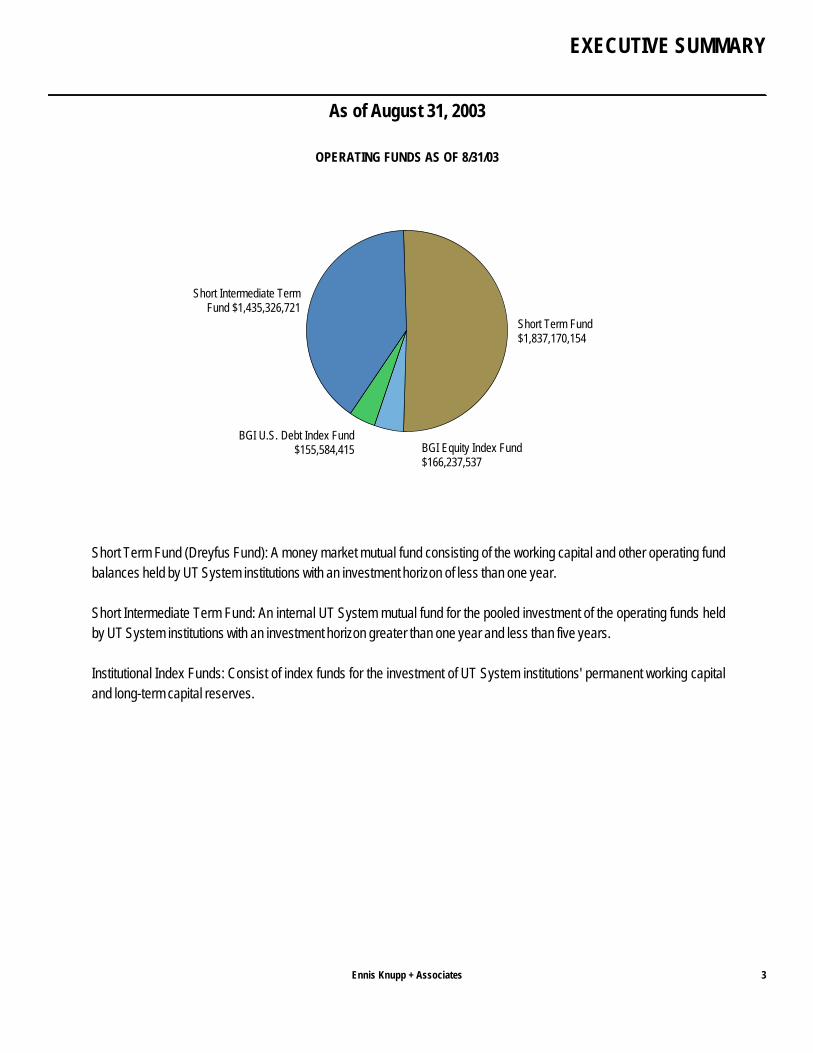
EXECUTIVE SUMMARY
As of August 31, 2003
Ennis Knupp + Associates 3
Short Term Fund$1,837,170,154
Short Intermediate TermFund $1,435,326,721
BGI U.S. Debt Index Fund$155,584,415 BGI Equity Index Fund
$166,237,537
OPERATING FUNDS AS OF 8/31/03
Short Term Fund (Dreyfus Fund): A money market mutual fund consisting of the working capital and other operating fundbalances held by UT System institutions with an investment horizon of less than one year.
Short Intermediate Term Fund: An internal UT System mutual fund for the pooled investment of the operating funds heldby UT System institutions with an investment horizon greater than one year and less than five years.
Institutional Index Funds: Consist of index funds for the investment of UT System institutions' permanent working capitaland long-term capital reserves.
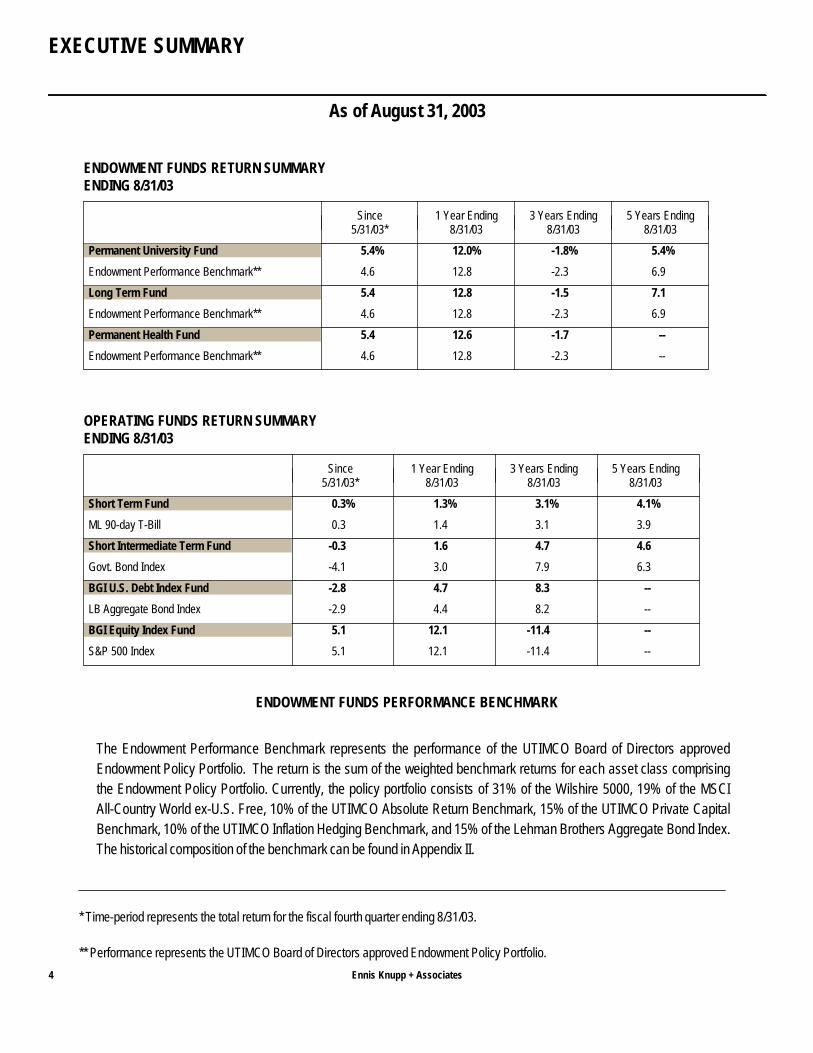
EXECUTIVE SUMMARY
As of August 31, 2003
Ennis Knupp + Associates4
Since 1 Year Ending 3 Years Ending 5 Years Ending5/31/03* 8/31/03 8/31/03 8/31/03
Permanent University Fund 5.4% 12.0% -1.8% 5.4%
Endowment Performance Benchmark** 4.6 12.8 -2.3 6.9
Long Term Fund 5.4 12.8 -1.5 7.1
Endowment Performance Benchmark** 4.6 12.8 -2.3 6.9
Permanent Health Fund 5.4 12.6 -1.7 --
Endowment Performance Benchmark** 4.6 12.8 -2.3 --
ENDING 8/31/03ENDOWMENT FUNDS RETURN SUMMARY
Since 1 Year Ending 3 Years Ending 5 Years Ending5/31/03* 8/31/03 8/31/03 8/31/03
Short Term Fund 0.3% 1.3% 3.1% 4.1%
ML 90-day T-Bill 0.3 1.4 3.1 3.9
Short Intermediate Term Fund -0.3 1.6 4.7 4.6
Govt. Bond Index -4.1 3.0 7.9 6.3
BGI U.S. Debt Index Fund -2.8 4.7 8.3 --
LB Aggregate Bond Index -2.9 4.4 8.2 --
BGI Equity Index Fund 5.1 12.1 -11.4 --
S&P 500 Index 5.1 12.1 -11.4 --
ENDING 8/31/03OPERATING FUNDS RETURN SUMMARY
The Endowment Performance Benchmark represents the performance of the UTIMCO Board of Directors approvedEndowment Policy Portfolio. The return is the sum of the weighted benchmark returns for each asset class comprisingthe Endowment Policy Portfolio. Currently, the policy portfolio consists of 31% of the Wilshire 5000, 19% of the MSCIAll-Country World ex-U.S. Free, 10% of the UTIMCO Absolute Return Benchmark, 15% of the UTIMCO Private CapitalBenchmark, 10% of the UTIMCO Inflation Hedging Benchmark, and 15% of the Lehman Brothers Aggregate Bond Index.The historical composition of the benchmark can be found in Appendix II.
ENDOWMENT FUNDS PERFORMANCE BENCHMARK
* Time-period represents the total return for the fiscal fourth quarter ending 8/31/03.
** Performance represents the UTIMCO Board of Directors approved Endowment Policy Portfolio.
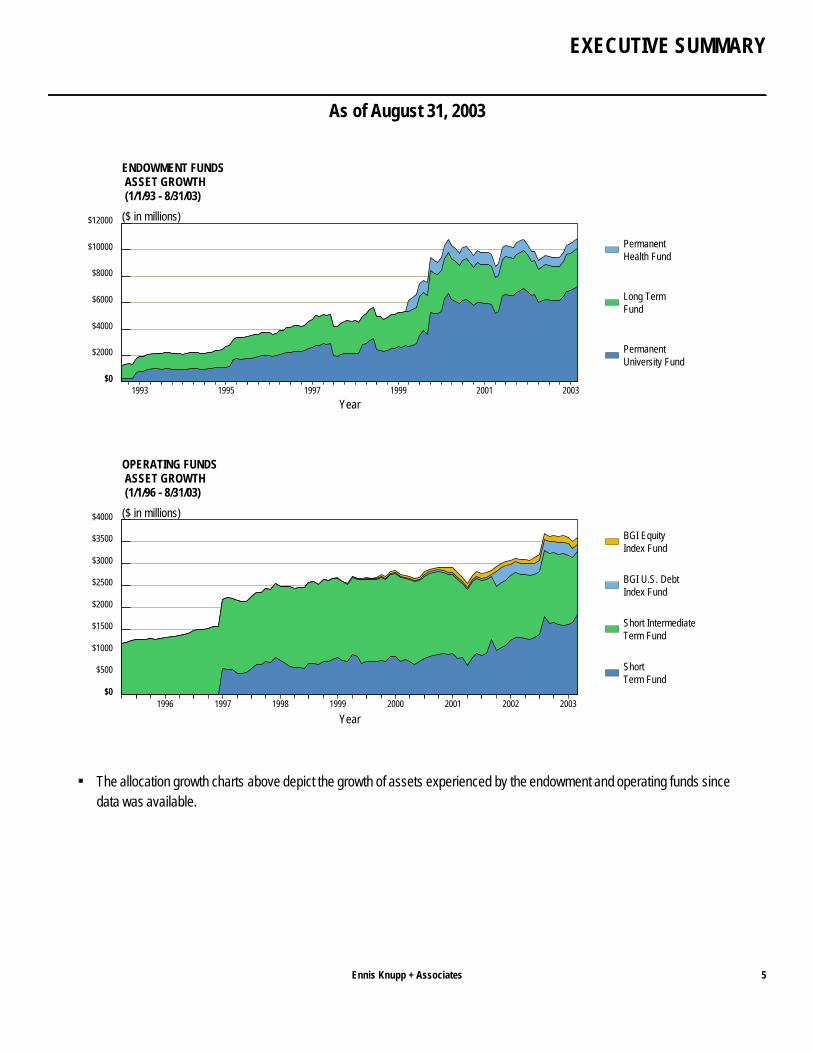
EXECUTIVE SUMMARY
As of August 31, 2003
Ennis Knupp + Associates 5
1993 1995 1997 1999 2001 2003
Year
$0
$2000
$4000
$6000
$8000
$10000
$12000
$0
($ in millions)
PermanentUniversity Fund
Long TermFund
PermanentHealth Fund
ENDOWMENT FUNDS ASSET GROWTH (1/1/93 - 8/31/03)
1996 1997 1998 1999 2000 2001 2002 2003
Year
$0
$500
$1000
$1500
$2000
$2500
$3000
$3500
$4000
$0
($ in millions)
ShortTerm Fund
Short IntermediateTerm Fund
BGI U.S. DebtIndex Fund
BGI EquityIndex Fund
OPERATING FUNDS ASSET GROWTH (1/1/96 - 8/31/03)
The allocation growth charts above depict the growth of assets experienced by the endowment and operating funds sincedata was available.
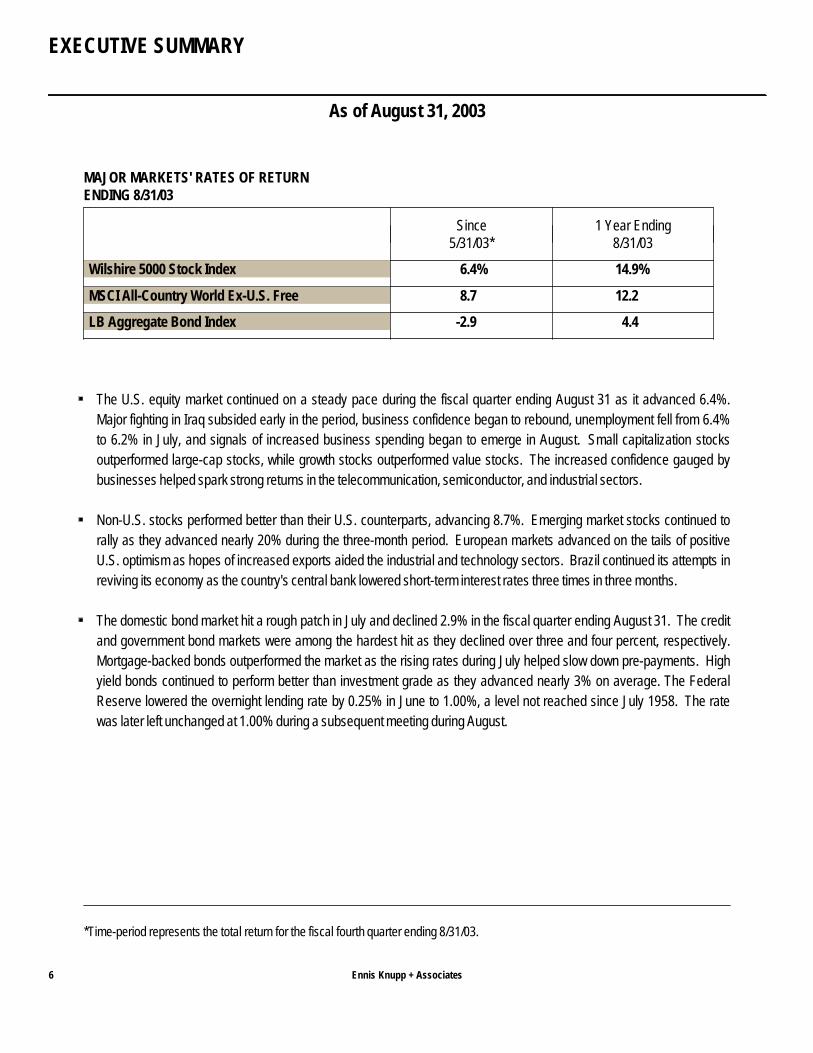
EXECUTIVE SUMMARY
As of August 31, 2003
Ennis Knupp + Associates6
Since 1 Year Ending5/31/03* 8/31/03
Wilshire 5000 Stock Index 6.4% 14.9%
MSCI All-Country World Ex-U.S. Free 8.7 12.2
LB Aggregate Bond Index -2.9 4.4
ENDING 8/31/03MAJOR MARKETS' RATES OF RETURN
The U.S. equity market continued on a steady pace during the fiscal quarter ending August 31 as it advanced 6.4%.Major fighting in Iraq subsided early in the period, business confidence began to rebound, unemployment fell from 6.4%to 6.2% in July, and signals of increased business spending began to emerge in August. Small capitalization stocksoutperformed large-cap stocks, while growth stocks outperformed value stocks. The increased confidence gauged bybusinesses helped spark strong returns in the telecommunication, semiconductor, and industrial sectors.
Non-U.S. stocks performed better than their U.S. counterparts, advancing 8.7%. Emerging market stocks continued torally as they advanced nearly 20% during the three-month period. European markets advanced on the tails of positiveU.S. optimism as hopes of increased exports aided the industrial and technology sectors. Brazil continued its attempts inreviving its economy as the country's central bank lowered short-term interest rates three times in three months.
The domestic bond market hit a rough patch in July and declined 2.9% in the fiscal quarter ending August 31. The creditand government bond markets were among the hardest hit as they declined over three and four percent, respectively.Mortgage-backed bonds outperformed the market as the rising rates during July helped slow down pre-payments. Highyield bonds continued to perform better than investment grade as they advanced nearly 3% on average. The FederalReserve lowered the overnight lending rate by 0.25% in June to 1.00%, a level not reached since July 1958. The ratewas later left unchanged at 1.00% during a subsequent meeting during August.
*Time-period represents the total return for the fiscal fourth quarter ending 8/31/03.
PERMANENT UNIVERSITY FUND
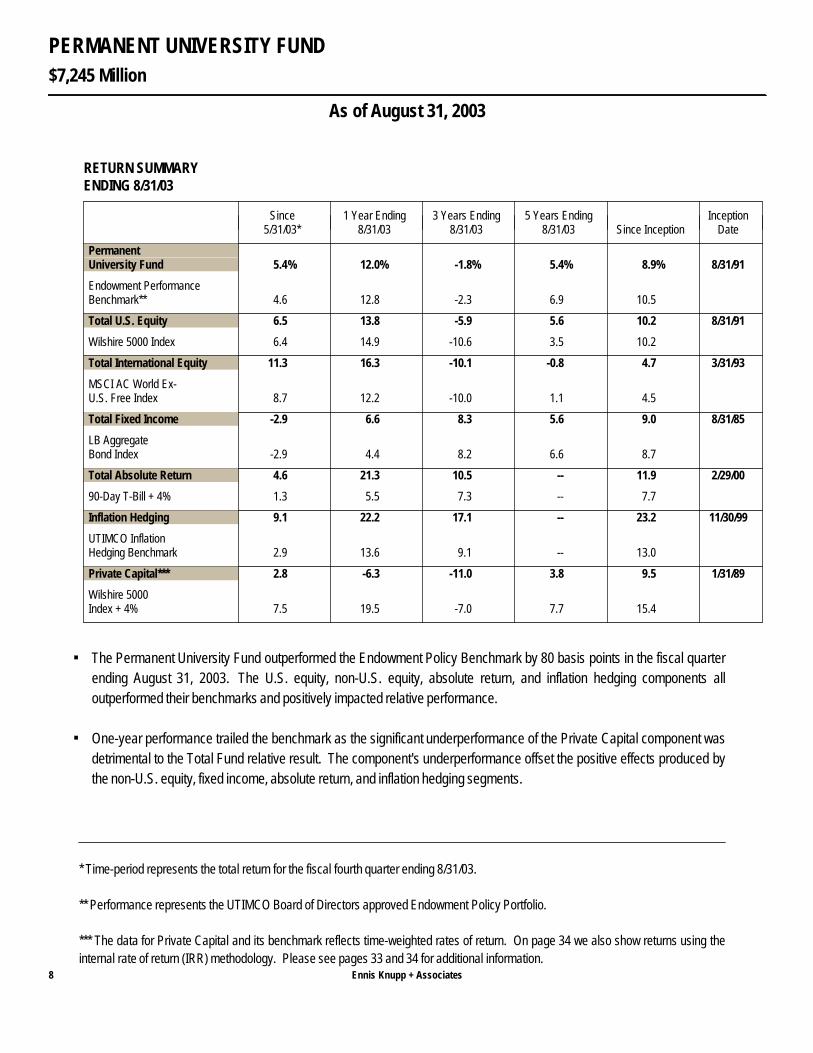
$7,245 Million
PERMANENT UNIVERSITY FUND
As of August 31, 2003
Ennis Knupp + Associates8
Since 1 Year Ending 3 Years Ending 5 Years Ending Inception5/31/03* 8/31/03 8/31/03 8/31/03 Since Inception Date
PermanentUniversity Fund 5.4% 12.0% -1.8% 5.4% 8.9% 8/31/91
Endowment PerformanceBenchmark** 4.6 12.8 -2.3 6.9 10.5
Total U.S. Equity 6.5 13.8 -5.9 5.6 10.2 8/31/91
Wilshire 5000 Index 6.4 14.9 -10.6 3.5 10.2
Total International Equity 11.3 16.3 -10.1 -0.8 4.7 3/31/93
MSCI AC World Ex-U.S. Free Index 8.7 12.2 -10.0 1.1 4.5
Total Fixed Income -2.9 6.6 8.3 5.6 9.0 8/31/85
LB AggregateBond Index -2.9 4.4 8.2 6.6 8.7
Total Absolute Return 4.6 21.3 10.5 -- 11.9 2/29/00
90-Day T-Bill + 4% 1.3 5.5 7.3 -- 7.7
Inflation Hedging 9.1 22.2 17.1 -- 23.2 11/30/99
UTIMCO InflationHedging Benchmark 2.9 13.6 9.1 -- 13.0
Private Capital*** 2.8 -6.3 -11.0 3.8 9.5 1/31/89
Wilshire 5000Index + 4% 7.5 19.5 -7.0 7.7 15.4
ENDING 8/31/03RETURN SUMMARY
The Permanent University Fund outperformed the Endowment Policy Benchmark by 80 basis points in the fiscal quarterending August 31, 2003. The U.S. equity, non-U.S. equity, absolute return, and inflation hedging components alloutperformed their benchmarks and positively impacted relative performance.
One-year performance trailed the benchmark as the significant underperformance of the Private Capital component wasdetrimental to the Total Fund relative result. The component's underperformance offset the positive effects produced bythe non-U.S. equity, fixed income, absolute return, and inflation hedging segments.
* Time-period represents the total return for the fiscal fourth quarter ending 8/31/03.
** Performance represents the UTIMCO Board of Directors approved Endowment Policy Portfolio.
*** The data for Private Capital and its benchmark reflects time-weighted rates of return. On page 34 we also show returns using theinternal rate of return (IRR) methodology. Please see pages 33 and 34 for additional information.
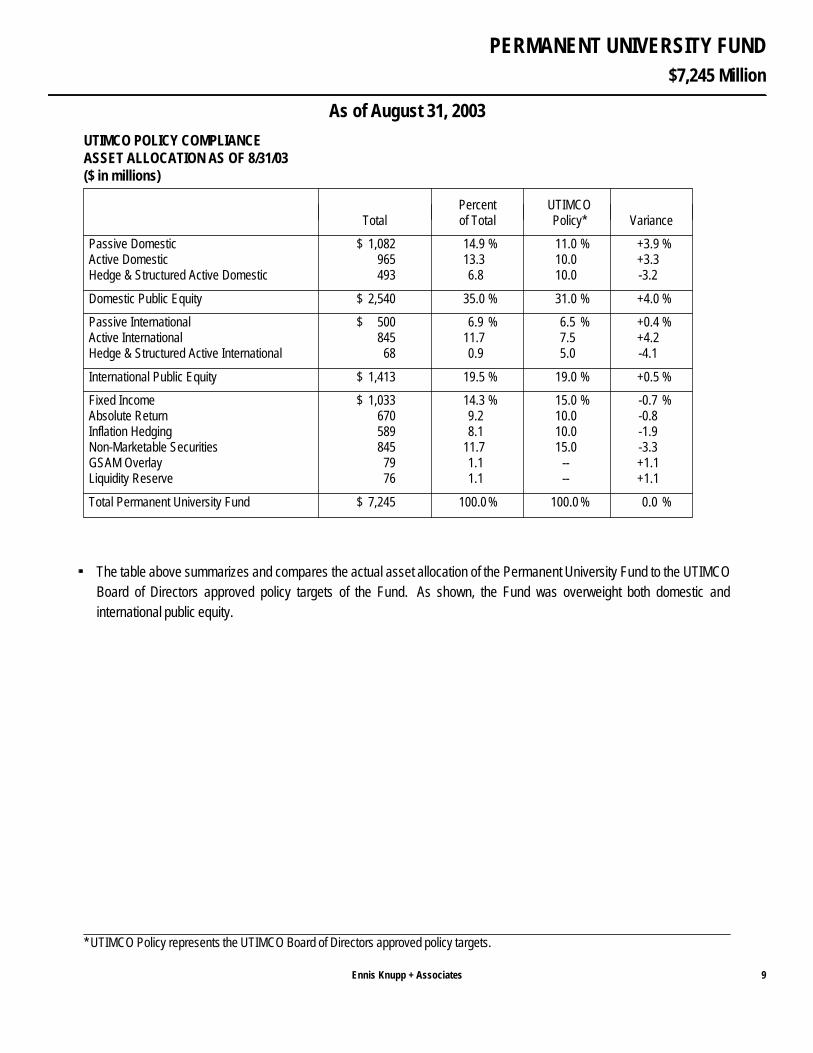
$7,245 Million
PERMANENT UNIVERSITY FUND
As of August 31, 2003
Ennis Knupp + Associates 9
Percent UTIMCO Total of Total Policy* Variance
Passive Domestic $ 1,082 14.9 % 11.0 % +3.9 %Active Domestic 965 13.3 10.0 +3.3 Hedge & Structured Active Domestic 493 6.8 10.0 -3.2
Domestic Public Equity $ 2,540 35.0 % 31.0 % +4.0 %
Passive International $ 500 6.9 % 6.5 % +0.4 %Active International 845 11.7 7.5 +4.2 Hedge & Structured Active International 68 0.9 5.0 -4.1
International Public Equity $ 1,413 19.5 % 19.0 % +0.5 %
Fixed Income $ 1,033 14.3 % 15.0 % -0.7 %Absolute Return 670 9.2 10.0 -0.8 Inflation Hedging 589 8.1 10.0 -1.9 Non-Marketable Securities 845 11.7 15.0 -3.3 GSAM Overlay 79 1.1 -- +1.1 Liquidity Reserve 76 1.1 -- +1.1
Total Permanent University Fund $ 7,245 100.0 % 100.0 % 0.0 %
UTIMCO POLICY COMPLIANCE ASSET ALLOCATION AS OF 8/31/03 ($ in millions)
The table above summarizes and compares the actual asset allocation of the Permanent University Fund to the UTIMCOBoard of Directors approved policy targets of the Fund. As shown, the Fund was overweight both domestic andinternational public equity.
* UTIMCO Policy represents the UTIMCO Board of Directors approved policy targets.
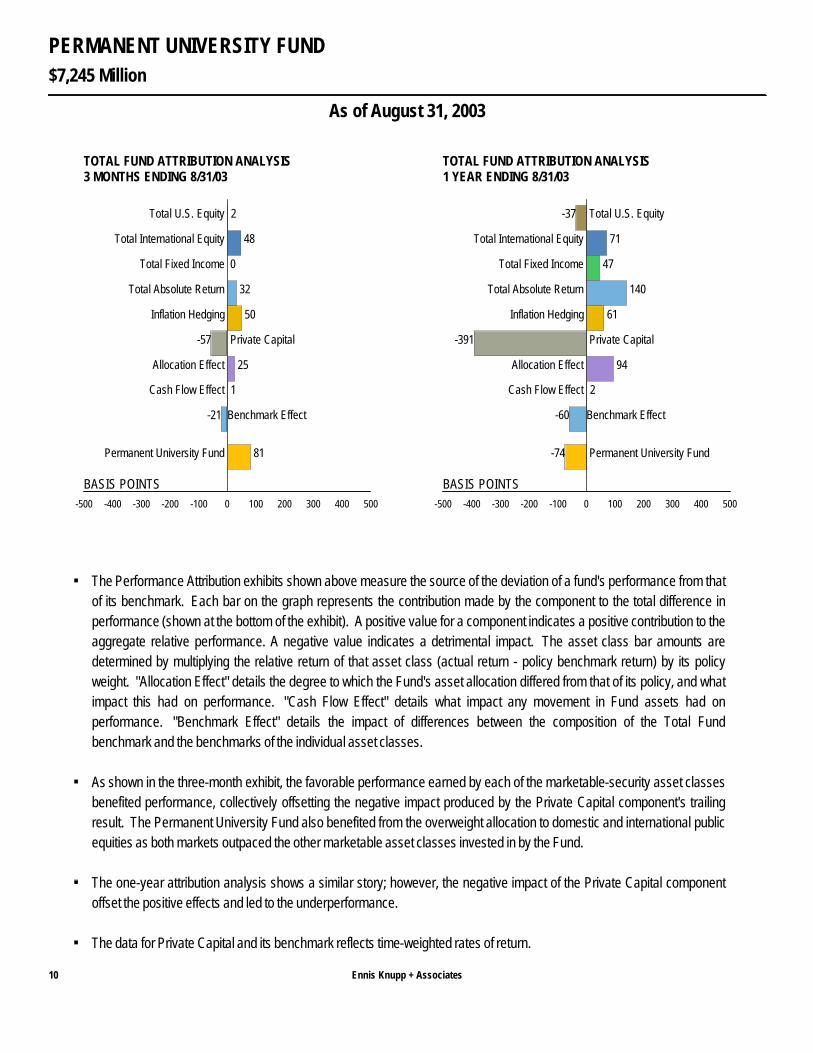
$7,245 Million
PERMANENT UNIVERSITY FUND
As of August 31, 2003
Ennis Knupp + Associates10
-500 -400 -300 -200 -100 0 100 200 300 400 500
BASIS POINTS
2 Total U.S. Equity
48 Total International Equity
0 Total Fixed Income
32 Total Absolute Return
50 Inflation Hedging
-57 Private Capital
25Allocation Effect
1Cash Flow Effect
-21 Benchmark Effect
81 Permanent University Fund
3 MONTHS ENDING 8/31/03TOTAL FUND ATTRIBUTION ANALYSIS
-500 -400 -300 -200 -100 0 100 200 300 400 500
BASIS POINTS
-37 Total U.S. Equity
71 Total International Equity
47 Total Fixed Income
140 Total Absolute Return
61 Inflation Hedging
-391 Private Capital
94Allocation Effect
2Cash Flow Effect
-60 Benchmark Effect
-74 Permanent University Fund
1 YEAR ENDING 8/31/03TOTAL FUND ATTRIBUTION ANALYSIS
The Performance Attribution exhibits shown above measure the source of the deviation of a fund's performance from thatof its benchmark. Each bar on the graph represents the contribution made by the component to the total difference inperformance (shown at the bottom of the exhibit). A positive value for a component indicates a positive contribution to theaggregate relative performance. A negative value indicates a detrimental impact. The asset class bar amounts aredetermined by multiplying the relative return of that asset class (actual return - policy benchmark return) by its policyweight. "Allocation Effect" details the degree to which the Fund's asset allocation differed from that of its policy, and whatimpact this had on performance. "Cash Flow Effect" details what impact any movement in Fund assets had onperformance. "Benchmark Effect" details the impact of differences between the composition of the Total Fundbenchmark and the benchmarks of the individual asset classes.
As shown in the three-month exhibit, the favorable performance earned by each of the marketable-security asset classesbenefited performance, collectively offsetting the negative impact produced by the Private Capital component's trailingresult. The Permanent University Fund also benefited from the overweight allocation to domestic and international publicequities as both markets outpaced the other marketable asset classes invested in by the Fund.
The one-year attribution analysis shows a similar story; however, the negative impact of the Private Capital componentoffset the positive effects and led to the underperformance.
The data for Private Capital and its benchmark reflects time-weighted rates of return.
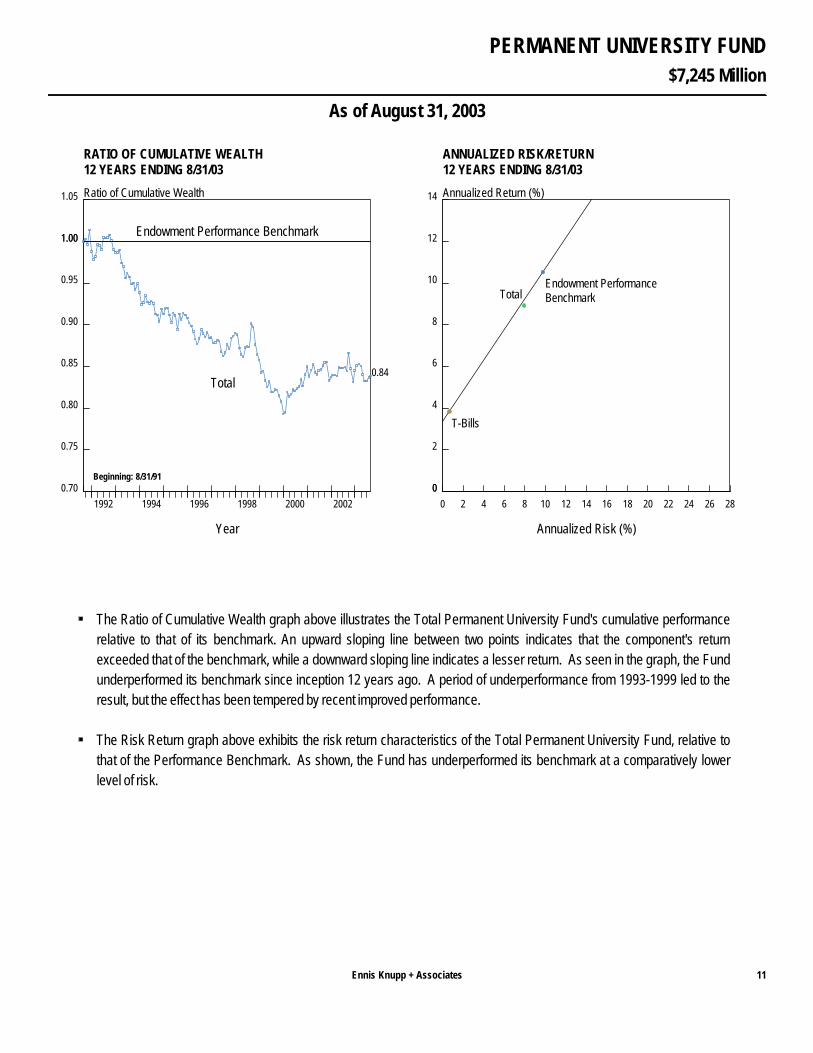
$7,245 Million
PERMANENT UNIVERSITY FUND
As of August 31, 2003
Ennis Knupp + Associates 11
1992 1994 1996 1998 2000 2002
Year
1.00
1.05
1.00
0.95
0.90
0.85
0.80
0.75
0.70
Ratio of Cumulative Wealth
Total
Endowment Performance Benchmark
0.84
12 YEARS ENDING 8/31/03RATIO OF CUMULATIVE WEALTH
Beginning: 8/31/91
0 2 4 6 8 10 12 14 16 18 20 22 24 26 28
Annualized Risk (%)
0
2
4
6
8
10
12
14
0
Annualized Return (%)
T-Bills
Endowment PerformanceBenchmarkTotal
12 YEARS ENDING 8/31/03ANNUALIZED RISK/RETURN
The Ratio of Cumulative Wealth graph above illustrates the Total Permanent University Fund's cumulative performancerelative to that of its benchmark. An upward sloping line between two points indicates that the component's returnexceeded that of the benchmark, while a downward sloping line indicates a lesser return. As seen in the graph, the Fundunderperformed its benchmark since inception 12 years ago. A period of underperformance from 1993-1999 led to theresult, but the effect has been tempered by recent improved performance.
The Risk Return graph above exhibits the risk return characteristics of the Total Permanent University Fund, relative tothat of the Performance Benchmark. As shown, the Fund has underperformed its benchmark at a comparatively lowerlevel of risk.

$7,245 Million
PERMANENT UNIVERSITY FUND
As of August 31, 2003
Ennis Knupp + Associates12
Permanent University Fund Endowment Performance Benchmark**Return
Return Return Difference
1991 (4 months) 6.4% 7.8% -1.41992 7.2 7.4 -0.21993 10.8 16.5 -5.71994 -0.4 2.4 -2.81995 26.3 27.0 -0.71996 12.7 15.7 -3.01997 21.0 20.2 0.81998 13.4 17.7 -4.31999 9.8 18.7 -8.92000 5.5 -1.6 7.12001 -6.1 -4.7 -1.42002 -7.6 -8.4 0.82003 (8 months) 12.9 13.7 -0.8
Trailing 1-Year 12.0% 12.8% -0.8Trailing 3-Year -1.8 -2.3 0.5Trailing 5-Year 5.4 6.9 -1.5Trailing 10-Year 8.4 9.8 -1.4Since Inception 8.9 10.5 -1.6(8/31/91)
(BY YEAR)HISTORICAL RETURNS*
The table above compares the annual return history of the Permanent University Fund to that of its performancebenchmark.
* The annual returns in this exhibit represent calendar-year periods.
** The Endowment Performance Benchmark represents the returns of the UTIMCO Board of Directors approved Endowment PolicyPortfolio.

$2,540 Million
DOMESTIC EQUITY SUMMARY
As of August 31, 2003
PERMANENT UNIVERSITY FUND
Ennis Knupp + Associates 13
Since 1 Year Ending 3 Years Ending 5 Years Ending Inception5/31/03* 8/31/03 8/31/03 8/31/03 Since Inception Date
Total U.S.Equity 6.5% 13.8% -5.9% 5.6% 10.2% 8/31/91
Wilshire5000 Index 6.4 14.9 -10.6 3.5 10.2
ENDING 8/31/03RETURN SUMMARY
BGI S&P 500 Index 4.3%
BGI Mid Cap Index 18.4%
Russell 2000 Futures 2.8%BGI Russell 2000 0.2%
Cash Equitization 16.9%
BGI Russell 3000 Alpha Tilts 4.1%Davis Hamilton 1.8%
GSAM Large Cap 7.1%
Cordillera 4.3%
Schroder 8.1%
Value Act 1.5%
BGI Russell 2000 Alpha Tilts 8.4% GSAM Small Cap 2.7%Eminence 0.8%
BGI Global Market Neutral 4.4%
Maverick 11.7%
Sirios 1.3%Standard Pacific 1.2%
MANAGER ALLOCATION AS OF 8/31/03
The table above details the trailing-period performance of the total U.S. equity component relative to the Wilshire 5000Index. The component has outperformed its benchmark over the three- and five-year periods, and matches its targetsince inception. One-year performance, however, is below-benchmark due to the underperformance of the component'sactive managers.
The graph above details the allocation to each manager of the U.S. equity component as of quarter-end.
* Time period represents the total return for the fiscal fourth quarter ending 8/31/03.

$2,540 Million
DOMESTIC EQUITY SUMMARY
As of August 31, 2003
PERMANENT UNIVERSITY FUND
Ennis Knupp + Associates14
-150 -100 -50 0 50 100 150
BASIS POINTS
1 Davis Hamilton9 GSAM Large Cap10 Cordillera
-20 Fortaleza-55 Schroder
-1 BGI Russell 2000 Alpha Tilts-1 GSAM Small Cap
0 BGI S&P 500 Index0 BGI Mid Cap Index
-1 BGI Russell 2000-5 Cash Equitization
-8 BGI Global Market Neutral-47 Maverick
0 Sirios-5 Standard Pacific
28Cash Flow Effect101Benchmark Effect
6 Total U.S. Equity
3 MONTHS ENDING 8/31/03MANAGER ATTRIBUTION ANALYSIS
-150 -100 -50 0 50 100 150
BASIS POINTS
-3 Davis Hamilton-1 GSAM Large Cap
-45 Cordillera-26 Fortaleza
-33 Schroder-7 BGI Russell 2000 Alpha Tilts
-12 GSAM Small Cap0 BGI S&P 500 Index0 BGI Mid Cap Index
-1 BGI Russell 2000-2 Cash Equitization
-7 BGI Global Market Neutral-46 Maverick
0 Sirios-15 Standard Pacific
-21 Cash Flow Effect111Benchmark Effect
-108 Total U.S. Equity
1 YEAR ENDING 8/31/03MANAGER ATTRIBUTION ANALYSIS
The Performance Attribution exhibits shown above measure the source of the deviation of the asset class performancefrom that of its benchmark. The bar labeled "Total U.S. Equity" represents the component's performance relative to theWilshire 5000 Index in basis points. The value of the manager bars are derived by taking the relative performance ofeach manager, versus its style specific benchmark, and multiplying this by the manager's asset weight in the component.The bar labeled "Benchmark Effect" represents the difference between the benchmarks of the individual managers andthe U.S. equity benchmark.
As shown in the three-month exhibit, underperformance by the Fortaleza and Schroder small-cap and Maverick hedgefund portfolios was offset by the small capitalization bias of the component. The benchmark effect is a result of this biasduring a period of which the small cap market outperformed the overall equity market.
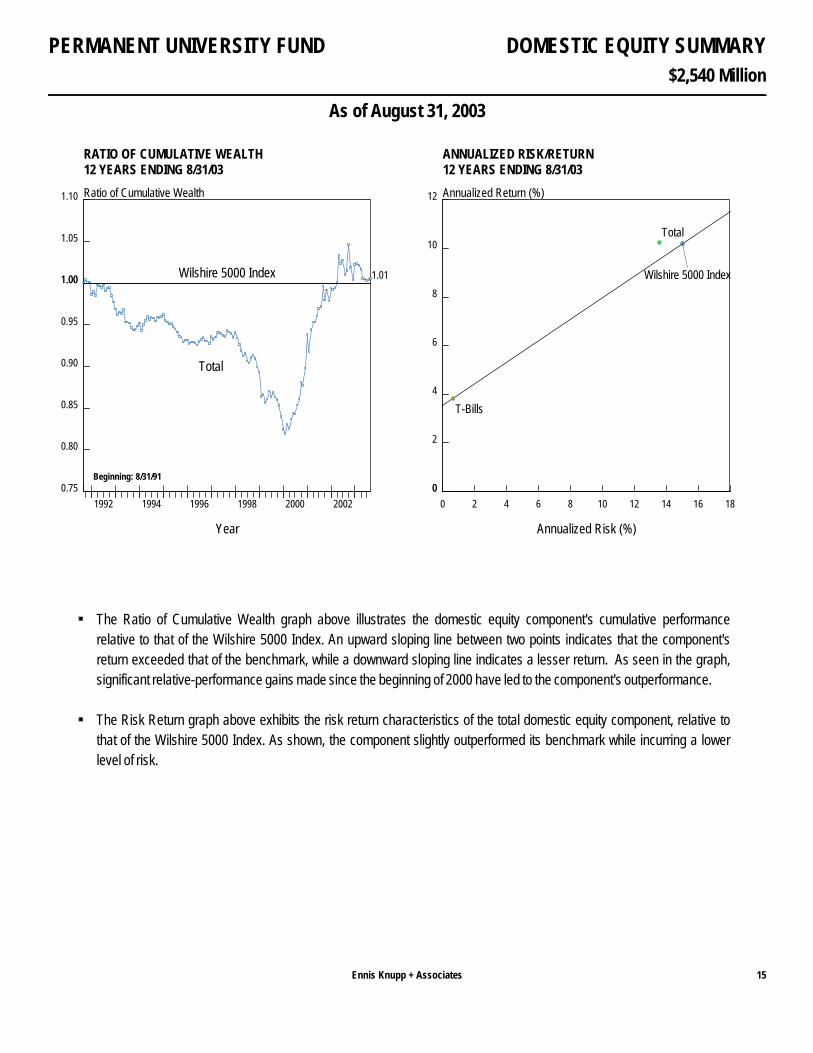
$2,540 Million
DOMESTIC EQUITY SUMMARY
As of August 31, 2003
PERMANENT UNIVERSITY FUND
Ennis Knupp + Associates 15
1992 1994 1996 1998 2000 2002
Year
1.00
1.05
1.10
1.00
0.95
0.90
0.85
0.80
0.75
Ratio of Cumulative Wealth
Total
Wilshire 5000 Index 1.01
12 YEARS ENDING 8/31/03RATIO OF CUMULATIVE WEALTH
Beginning: 8/31/91
0 2 4 6 8 10 12 14 16 18
Annualized Risk (%)
0
2
4
6
8
10
12
0
Annualized Return (%)
T-Bills
Wilshire 5000 Index
Total
12 YEARS ENDING 8/31/03ANNUALIZED RISK/RETURN
The Ratio of Cumulative Wealth graph above illustrates the domestic equity component's cumulative performancerelative to that of the Wilshire 5000 Index. An upward sloping line between two points indicates that the component'sreturn exceeded that of the benchmark, while a downward sloping line indicates a lesser return. As seen in the graph,significant relative-performance gains made since the beginning of 2000 have led to the component's outperformance.
The Risk Return graph above exhibits the risk return characteristics of the total domestic equity component, relative tothat of the Wilshire 5000 Index. As shown, the component slightly outperformed its benchmark while incurring a lowerlevel of risk.
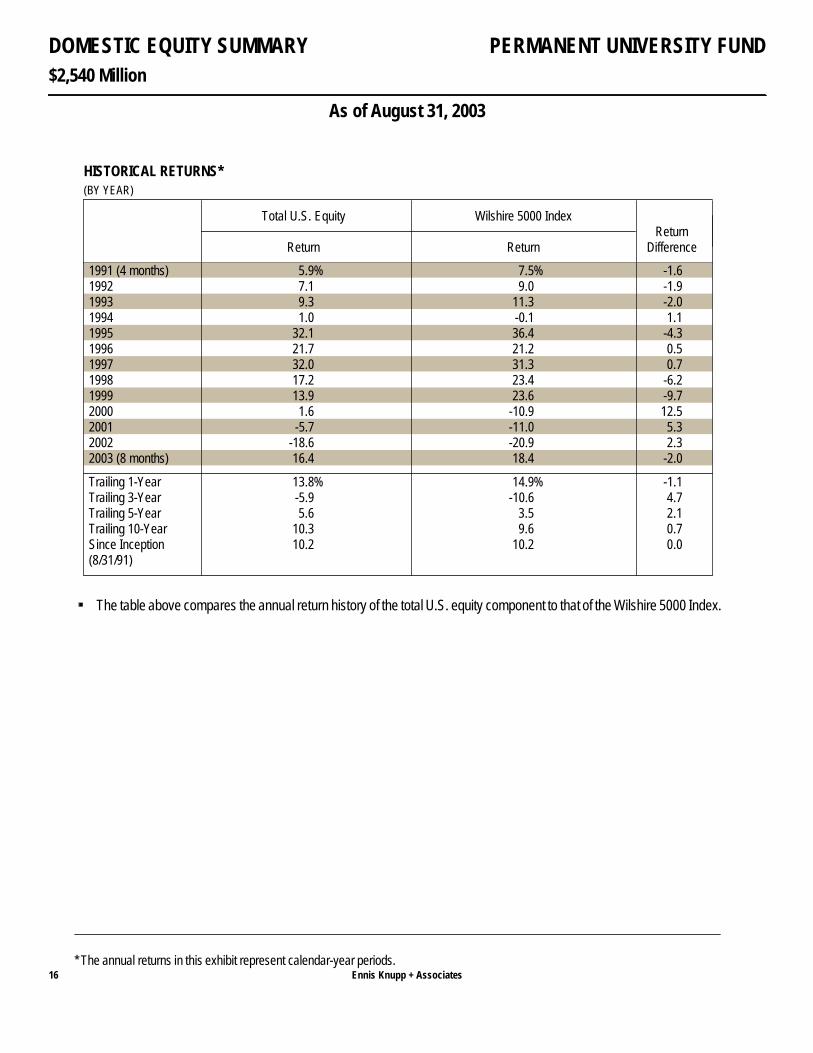
$2,540 Million
DOMESTIC EQUITY SUMMARY
As of August 31, 2003
PERMANENT UNIVERSITY FUND
Ennis Knupp + Associates16
Total U.S. Equity Wilshire 5000 IndexReturn
Return Return Difference
1991 (4 months) 5.9% 7.5% -1.61992 7.1 9.0 -1.91993 9.3 11.3 -2.01994 1.0 -0.1 1.11995 32.1 36.4 -4.31996 21.7 21.2 0.51997 32.0 31.3 0.71998 17.2 23.4 -6.21999 13.9 23.6 -9.72000 1.6 -10.9 12.52001 -5.7 -11.0 5.32002 -18.6 -20.9 2.32003 (8 months) 16.4 18.4 -2.0
Trailing 1-Year 13.8% 14.9% -1.1Trailing 3-Year -5.9 -10.6 4.7Trailing 5-Year 5.6 3.5 2.1Trailing 10-Year 10.3 9.6 0.7Since Inception 10.2 10.2 0.0(8/31/91)
(BY YEAR)HISTORICAL RETURNS*
The table above compares the annual return history of the total U.S. equity component to that of the Wilshire 5000 Index.
* The annual returns in this exhibit represent calendar-year periods.
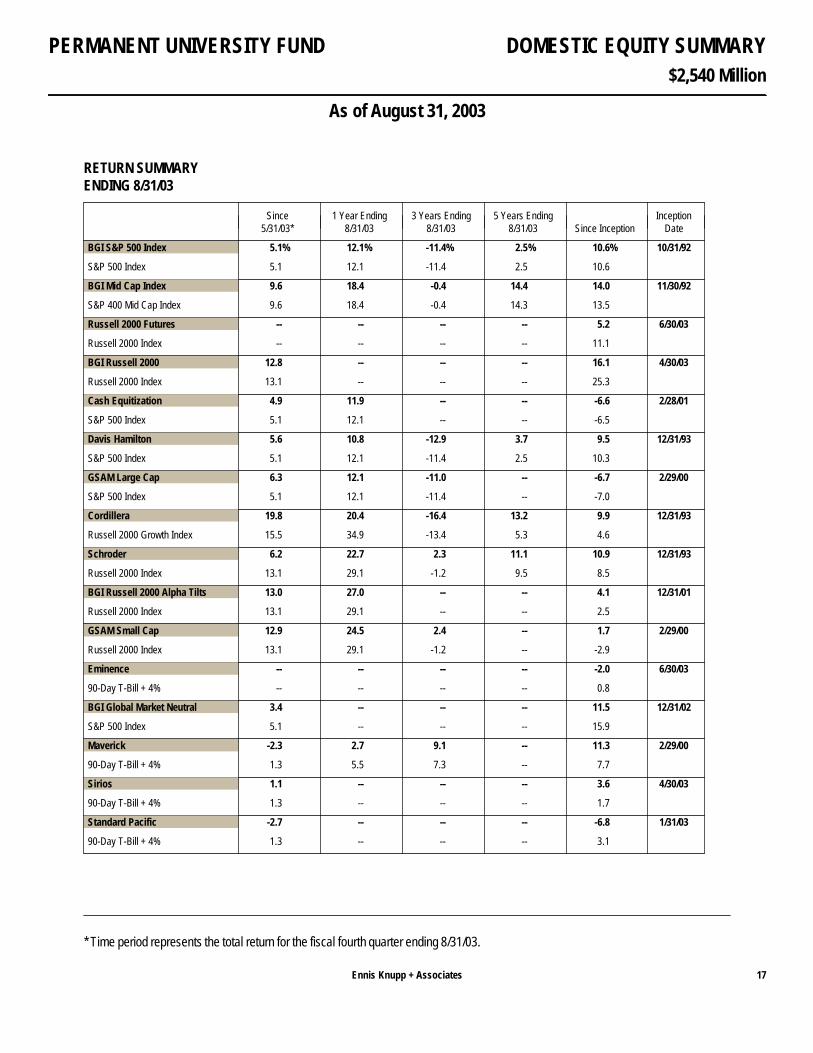
$2,540 Million
DOMESTIC EQUITY SUMMARY
As of August 31, 2003
PERMANENT UNIVERSITY FUND
Ennis Knupp + Associates 17
Since 1 Year Ending 3 Years Ending 5 Years Ending Inception5/31/03* 8/31/03 8/31/03 8/31/03 Since Inception Date
BGI S&P 500 Index 5.1% 12.1% -11.4% 2.5% 10.6% 10/31/92
S&P 500 Index 5.1 12.1 -11.4 2.5 10.6
BGI Mid Cap Index 9.6 18.4 -0.4 14.4 14.0 11/30/92
S&P 400 Mid Cap Index 9.6 18.4 -0.4 14.3 13.5
Russell 2000 Futures -- -- -- -- 5.2 6/30/03
Russell 2000 Index -- -- -- -- 11.1
BGI Russell 2000 12.8 -- -- -- 16.1 4/30/03
Russell 2000 Index 13.1 -- -- -- 25.3
Cash Equitization 4.9 11.9 -- -- -6.6 2/28/01
S&P 500 Index 5.1 12.1 -- -- -6.5
Davis Hamilton 5.6 10.8 -12.9 3.7 9.5 12/31/93
S&P 500 Index 5.1 12.1 -11.4 2.5 10.3
GSAM Large Cap 6.3 12.1 -11.0 -- -6.7 2/29/00
S&P 500 Index 5.1 12.1 -11.4 -- -7.0
Cordillera 19.8 20.4 -16.4 13.2 9.9 12/31/93
Russell 2000 Growth Index 15.5 34.9 -13.4 5.3 4.6
Schroder 6.2 22.7 2.3 11.1 10.9 12/31/93
Russell 2000 Index 13.1 29.1 -1.2 9.5 8.5
BGI Russell 2000 Alpha Tilts 13.0 27.0 -- -- 4.1 12/31/01
Russell 2000 Index 13.1 29.1 -- -- 2.5
GSAM Small Cap 12.9 24.5 2.4 -- 1.7 2/29/00
Russell 2000 Index 13.1 29.1 -1.2 -- -2.9
Eminence -- -- -- -- -2.0 6/30/03
90-Day T-Bill + 4% -- -- -- -- 0.8
BGI Global Market Neutral 3.4 -- -- -- 11.5 12/31/02
S&P 500 Index 5.1 -- -- -- 15.9
Maverick -2.3 2.7 9.1 -- 11.3 2/29/00
90-Day T-Bill + 4% 1.3 5.5 7.3 -- 7.7
Sirios 1.1 -- -- -- 3.6 4/30/03
90-Day T-Bill + 4% 1.3 -- -- -- 1.7
Standard Pacific -2.7 -- -- -- -6.8 1/31/03
90-Day T-Bill + 4% 1.3 -- -- -- 3.1
ENDING 8/31/03RETURN SUMMARY
* Time period represents the total return for the fiscal fourth quarter ending 8/31/03.
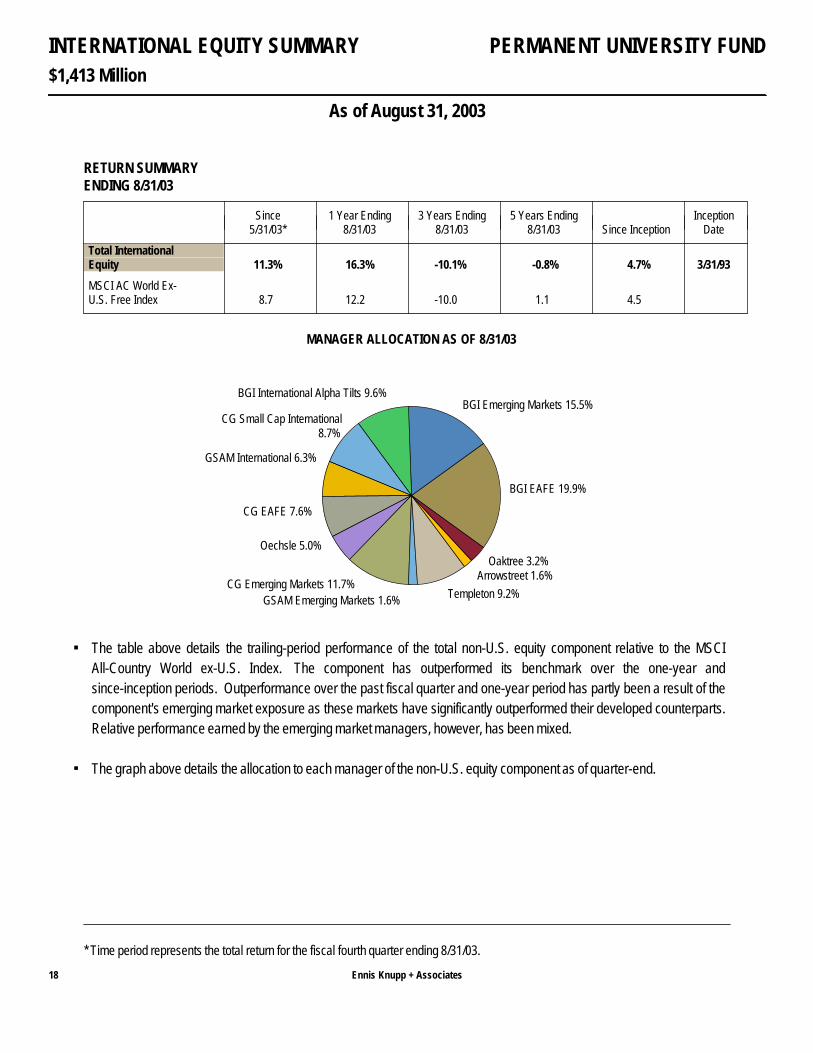
$1,413 Million
INTERNATIONAL EQUITY SUMMARY
As of August 31, 2003
PERMANENT UNIVERSITY FUND
Ennis Knupp + Associates18
Since 1 Year Ending 3 Years Ending 5 Years Ending Inception5/31/03* 8/31/03 8/31/03 8/31/03 Since Inception Date
Total InternationalEquity 11.3% 16.3% -10.1% -0.8% 4.7% 3/31/93
MSCI AC World Ex-U.S. Free Index 8.7 12.2 -10.0 1.1 4.5
ENDING 8/31/03RETURN SUMMARY
BGI EAFE 19.9%
BGI Emerging Markets 15.5%BGI International Alpha Tilts 9.6%
CG Small Cap International8.7%
GSAM International 6.3%
CG EAFE 7.6%
Oechsle 5.0%
CG Emerging Markets 11.7%GSAM Emerging Markets 1.6% Templeton 9.2%
Arrowstreet 1.6%Oaktree 3.2%
MANAGER ALLOCATION AS OF 8/31/03
The table above details the trailing-period performance of the total non-U.S. equity component relative to the MSCIAll-Country World ex-U.S. Index. The component has outperformed its benchmark over the one-year andsince-inception periods. Outperformance over the past fiscal quarter and one-year period has partly been a result of thecomponent's emerging market exposure as these markets have significantly outperformed their developed counterparts.Relative performance earned by the emerging market managers, however, has been mixed.
The graph above details the allocation to each manager of the non-U.S. equity component as of quarter-end.
* Time period represents the total return for the fiscal fourth quarter ending 8/31/03.
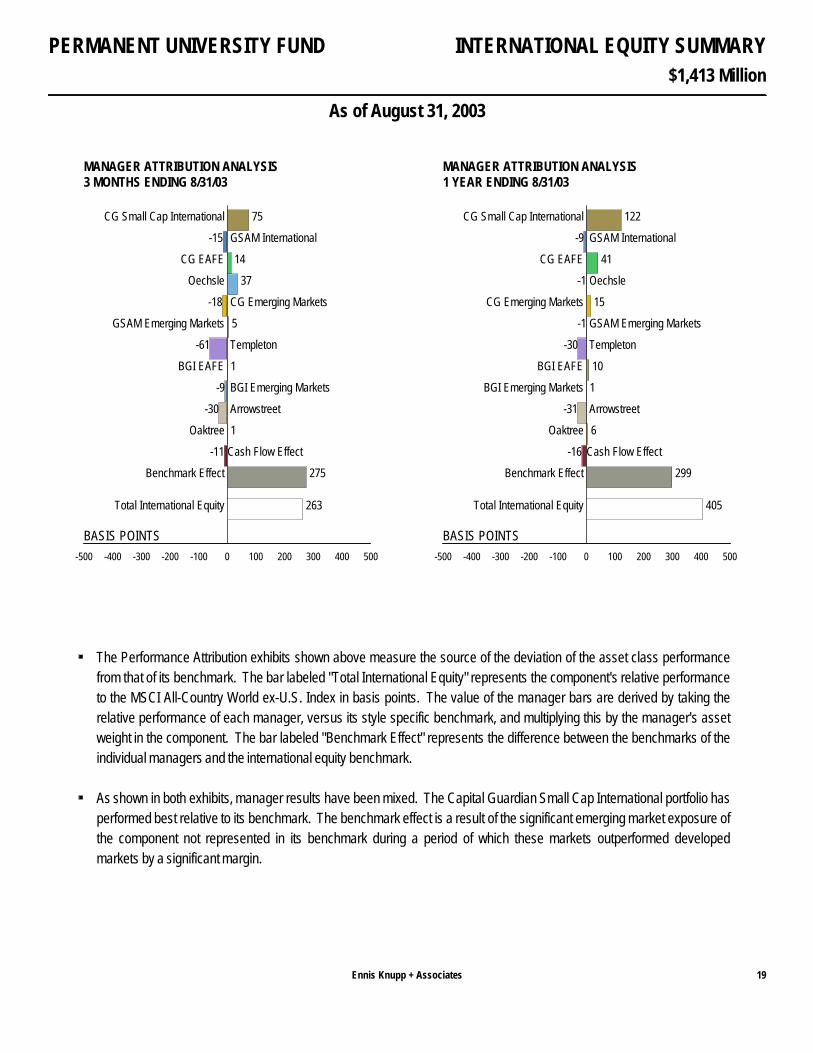
$1,413 Million
INTERNATIONAL EQUITY SUMMARY
As of August 31, 2003
PERMANENT UNIVERSITY FUND
Ennis Knupp + Associates 19
-500 -400 -300 -200 -100 0 100 200 300 400 500
BASIS POINTS
75 CG Small Cap International
-15 GSAM International
14 CG EAFE
37 Oechsle
-18 CG Emerging Markets
5 GSAM Emerging Markets
-61 Templeton
1 BGI EAFE
-9 BGI Emerging Markets
-30 Arrowstreet
1 Oaktree
-11 Cash Flow Effect
275Benchmark Effect
263 Total International Equity
3 MONTHS ENDING 8/31/03MANAGER ATTRIBUTION ANALYSIS
-500 -400 -300 -200 -100 0 100 200 300 400 500
BASIS POINTS
122 CG Small Cap International
-9 GSAM International
41 CG EAFE
-1 Oechsle
15 CG Emerging Markets
-1 GSAM Emerging Markets
-30 Templeton
10 BGI EAFE
1 BGI Emerging Markets
-31 Arrowstreet
6 Oaktree
-16 Cash Flow Effect
299Benchmark Effect
405 Total International Equity
1 YEAR ENDING 8/31/03MANAGER ATTRIBUTION ANALYSIS
The Performance Attribution exhibits shown above measure the source of the deviation of the asset class performancefrom that of its benchmark. The bar labeled "Total International Equity" represents the component's relative performanceto the MSCI All-Country World ex-U.S. Index in basis points. The value of the manager bars are derived by taking therelative performance of each manager, versus its style specific benchmark, and multiplying this by the manager's assetweight in the component. The bar labeled "Benchmark Effect" represents the difference between the benchmarks of theindividual managers and the international equity benchmark.
As shown in both exhibits, manager results have been mixed. The Capital Guardian Small Cap International portfolio hasperformed best relative to its benchmark. The benchmark effect is a result of the significant emerging market exposure ofthe component not represented in its benchmark during a period of which these markets outperformed developedmarkets by a significant margin.
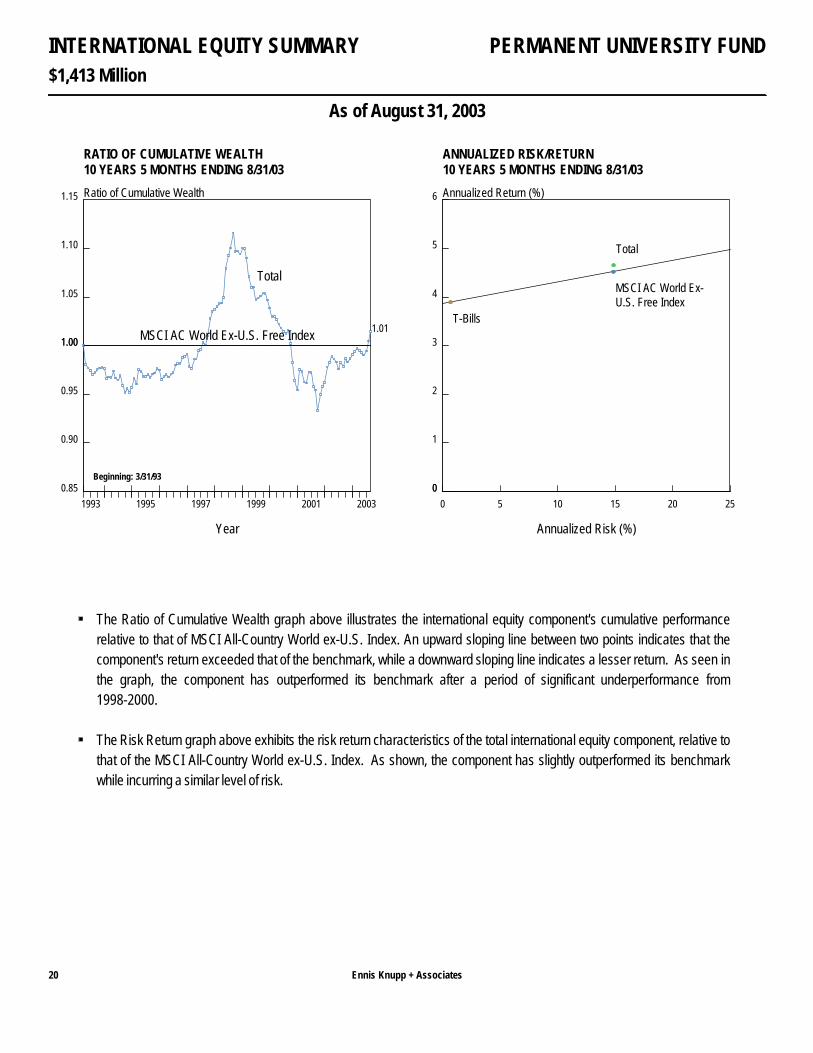
$1,413 Million
INTERNATIONAL EQUITY SUMMARY
As of August 31, 2003
PERMANENT UNIVERSITY FUND
Ennis Knupp + Associates20
1993 1995 1997 1999 2001 2003
Year
1.00
1.05
1.10
1.15
1.00
0.95
0.90
0.85
Ratio of Cumulative Wealth
Total
MSCI AC World Ex-U.S. Free Index 1.01
10 YEARS 5 MONTHS ENDING 8/31/03RATIO OF CUMULATIVE WEALTH
Beginning: 3/31/93
0 5 10 15 20 25
Annualized Risk (%)
0
1
2
3
4
5
6
0
Annualized Return (%)
T-Bills
MSCI AC World Ex-U.S. Free Index
Total
10 YEARS 5 MONTHS ENDING 8/31/03ANNUALIZED RISK/RETURN
The Ratio of Cumulative Wealth graph above illustrates the international equity component's cumulative performancerelative to that of MSCI All-Country World ex-U.S. Index. An upward sloping line between two points indicates that thecomponent's return exceeded that of the benchmark, while a downward sloping line indicates a lesser return. As seen inthe graph, the component has outperformed its benchmark after a period of significant underperformance from1998-2000.
The Risk Return graph above exhibits the risk return characteristics of the total international equity component, relative tothat of the MSCI All-Country World ex-U.S. Index. As shown, the component has slightly outperformed its benchmarkwhile incurring a similar level of risk.

$1,413 Million
INTERNATIONAL EQUITY SUMMARY
As of August 31, 2003
PERMANENT UNIVERSITY FUND
Ennis Knupp + Associates 21
Total International Equity MSCI AC World Ex-U.S. Free IndexReturn
Return Return Difference
1993 (9 months) 18.0% 21.0% -3.01994 4.6 6.6 -2.01995 12.0 9.9 2.11996 8.5 6.7 1.81997 6.8 2.0 4.81998 21.4 14.5 6.91999 23.6 30.9 -7.32000 -22.0 -15.1 -6.92001 -18.8 -19.5 0.72002 -12.1 -14.7 2.62003 (8 months) 20.2 17.5 2.7
Trailing 1-Year 16.3% 12.2% 4.1Trailing 3-Year -10.1 -10.0 -0.1Trailing 5-Year -0.8 1.1 -1.9Trailing 10-Year 3.3 2.8 0.5Since Inception 4.7 4.5 0.2(3/31/93)
(BY YEAR)HISTORICAL RETURNS*
The table above compares the annual return history of the international equity component to that of the MSCI All-CountryWorld ex-U.S. Index.
* The annual returns in this exhibit represent calendar-year periods.

$1,413 Million
INTERNATIONAL EQUITY SUMMARY
As of August 31, 2003
PERMANENT UNIVERSITY FUND
Ennis Knupp + Associates22
Since 1 Year Ending 3 Years Ending 5 Years Ending Inception5/31/03* 8/31/03 8/31/03 8/31/03 Since Inception Date
BGI EAFE 7.5% 9.4% -10.6% -0.9% 4.6% 3/31/93
EAFE Index 7.4 9.1 -11.1 -0.7 4.1
BGI EmergingMarkets 19.0 30.9 -- -- 11.2 1/31/02
MSCI EmergingMarkets Free Net 19.8 28.9 -- -- 11.7
CG Small CapInternational 16.3 22.5 -13.9 -- -13.2 2/29/00
EAFE Index 7.4 9.1 -11.1 -- -10.6
GSAMInternational 5.2 8.5 -12.2 -- -11.9 2/29/00
EAFE Index 7.4 9.1 -11.1 -- -10.6
CG EAFE 9.2 14.0 -11.3 -- -10.2 7/31/00
EAFE Index 7.4 9.1 -11.1 -- -10.6
Oechsle 14.9 10.1 -13.5 -- -13.3 7/31/00
EAFE Index 7.4 9.1 -11.1 -- -10.6
CG EmergingMarkets 18.1 29.9 -5.5 -- -4.7 7/31/00
MSCI EmergingMarkets Free Net 19.8 28.9 -1.7 -- -1.5
GSAM EmergingMarkets 22.9 29.5 -2.8 -- -6.1 2/29/00
MSCI EmergingMarkets Free Net 19.8 28.9 -1.7 -- -5.7
Templeton 12.9 26.6 0.2 -- 0.7 7/31/00
MSCI EmergingMarkets Free Net 19.8 28.9 -1.7 -- -1.5
Arrowstreet -12.5 -- -- -- -12.5 5/31/03
90-Day T-Bill + 4% 1.3 -- -- -- 1.3
Oaktree 1.5 7.6 -- -- 8.8 12/31/01
90-Day T-Bill + 4% 1.3 5.5 -- -- 5.7
ENDING 8/31/03RETURN SUMMARY
* Time period represents the total return for the fiscal fourth quarter ending 8/31/03.
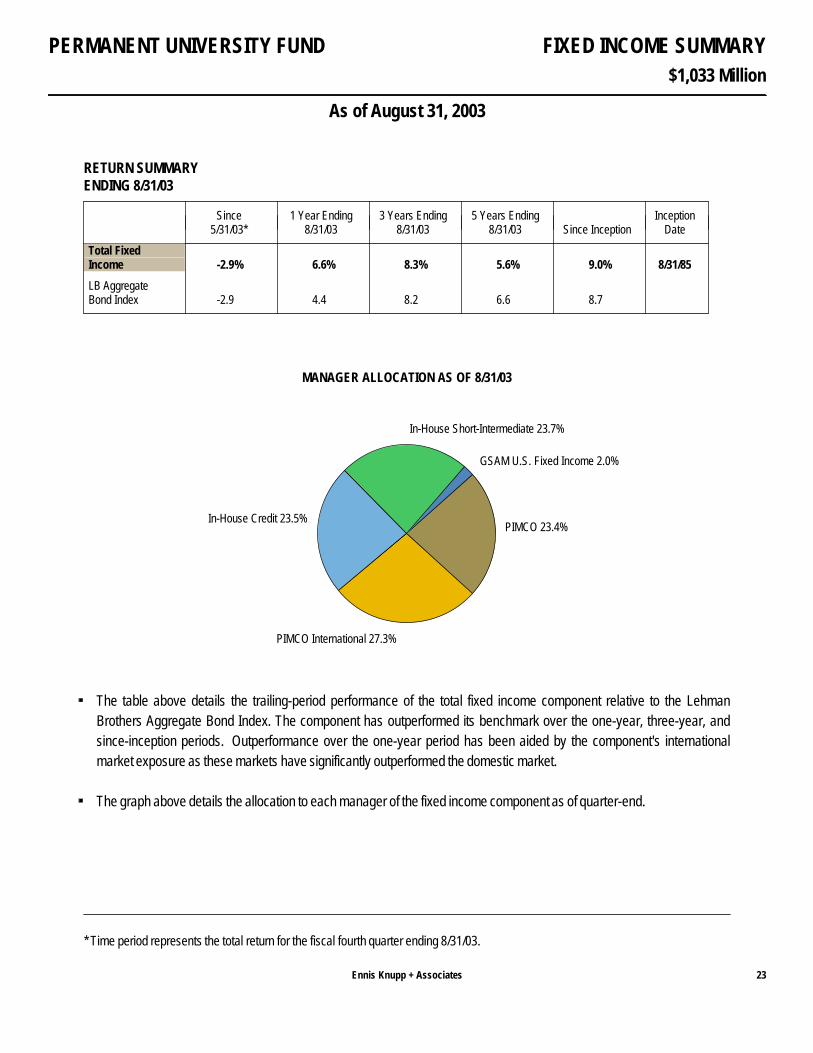
$1,033 Million
FIXED INCOME SUMMARY
As of August 31, 2003
PERMANENT UNIVERSITY FUND
Ennis Knupp + Associates 23
Since 1 Year Ending 3 Years Ending 5 Years Ending Inception5/31/03* 8/31/03 8/31/03 8/31/03 Since Inception Date
Total FixedIncome -2.9% 6.6% 8.3% 5.6% 9.0% 8/31/85
LB AggregateBond Index -2.9 4.4 8.2 6.6 8.7
ENDING 8/31/03RETURN SUMMARY
PIMCO 23.4%
GSAM U.S. Fixed Income 2.0%
In-House Short-Intermediate 23.7%
In-House Credit 23.5%
PIMCO International 27.3%
MANAGER ALLOCATION AS OF 8/31/03
The table above details the trailing-period performance of the total fixed income component relative to the LehmanBrothers Aggregate Bond Index. The component has outperformed its benchmark over the one-year, three-year, andsince-inception periods. Outperformance over the one-year period has been aided by the component's internationalmarket exposure as these markets have significantly outperformed the domestic market.
The graph above details the allocation to each manager of the fixed income component as of quarter-end.
* Time period represents the total return for the fiscal fourth quarter ending 8/31/03.
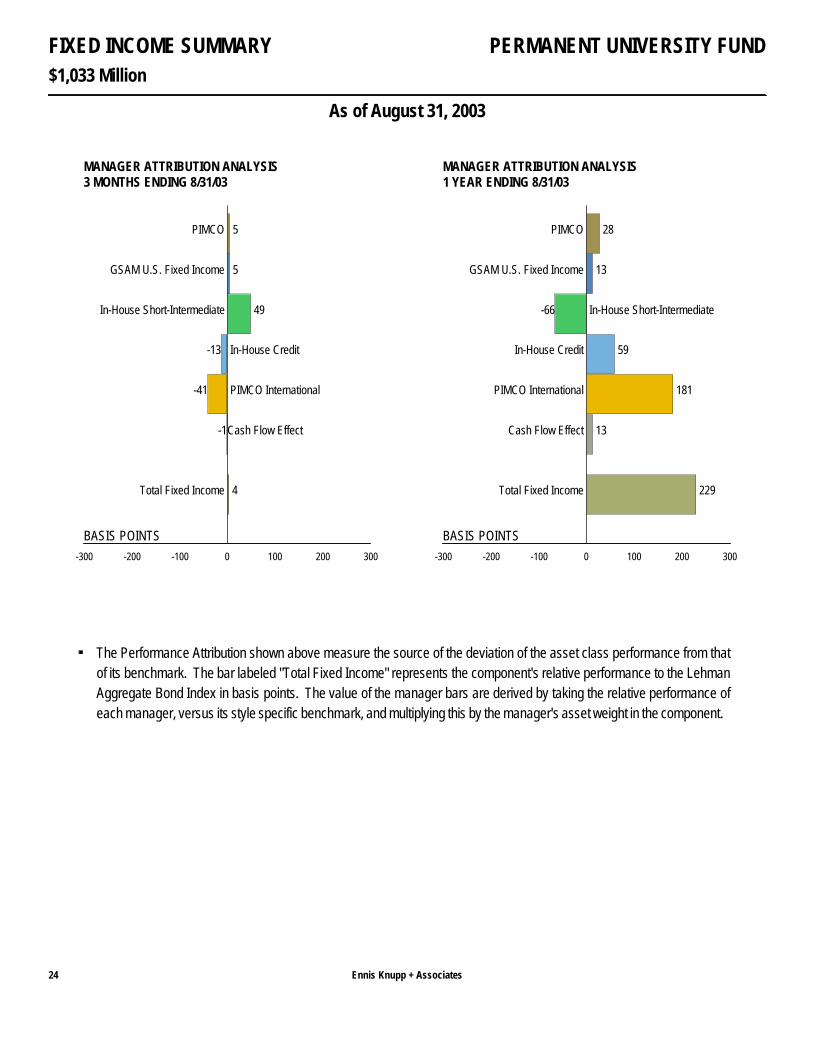
$1,033 Million
FIXED INCOME SUMMARY
As of August 31, 2003
PERMANENT UNIVERSITY FUND
Ennis Knupp + Associates24
-300 -200 -100 0 100 200 300
BASIS POINTS
5 PIMCO
5 GSAM U.S. Fixed Income
49 In-House Short-Intermediate
-13 In-House Credit
-41 PIMCO International
-1Cash Flow Effect
4 Total Fixed Income
3 MONTHS ENDING 8/31/03MANAGER ATTRIBUTION ANALYSIS
-300 -200 -100 0 100 200 300
BASIS POINTS
28 PIMCO
13 GSAM U.S. Fixed Income
-66 In-House Short-Intermediate
59 In-House Credit
181 PIMCO International
13Cash Flow Effect
229 Total Fixed Income
1 YEAR ENDING 8/31/03MANAGER ATTRIBUTION ANALYSIS
The Performance Attribution shown above measure the source of the deviation of the asset class performance from thatof its benchmark. The bar labeled "Total Fixed Income" represents the component's relative performance to the LehmanAggregate Bond Index in basis points. The value of the manager bars are derived by taking the relative performance ofeach manager, versus its style specific benchmark, and multiplying this by the manager's asset weight in the component.

$1,033 Million
FIXED INCOME SUMMARY
As of August 31, 2003
PERMANENT UNIVERSITY FUND
Ennis Knupp + Associates 25
1986 1988 1990 1992 1994 1996 1998 2000 2002
Year
1.00
1.02
1.04
1.06
1.08
1.10
1.12
1.14
1.00
0.98
0.96
Ratio of Cumulative Wealth
Total
LB Aggregate Bond Index
1.05
18 YEARS ENDING 8/31/03RATIO OF CUMULATIVE WEALTH
Beginning: 8/31/85
0 2 4 6 8 10
Annualized Risk (%)
0
2
4
6
8
10
12
0
Annualized Return (%)
T-Bills
LB Aggregate Bond Index
Total
18 YEARS ENDING 8/31/03ANNUALIZED RISK/RETURN
The Ratio of Cumulative Wealth graph above illustrates the fixed income component's cumulative performance relative tothat of its benchmark. An upward sloping line between two points indicates that the component's return exceeded that ofthe benchmark, while a downward sloping line indicates a lesser return. As seen in the graph, the fixed incomecomponent's return exceeded that of the benchmark until 1999, then experienced a period of underperformance until theend of 2002. Recent outperformance has resulted in increased value-added relative to the Lehman Aggregate BondIndex since inception.
The Risk Return graph above exhibits the risk return characteristics of the total fixed income component, relative to thoseof the performance benchmark. As shown, the component has generated a slightly higher rate of return than the Indexwhile incurring a slightly higher level of risk.
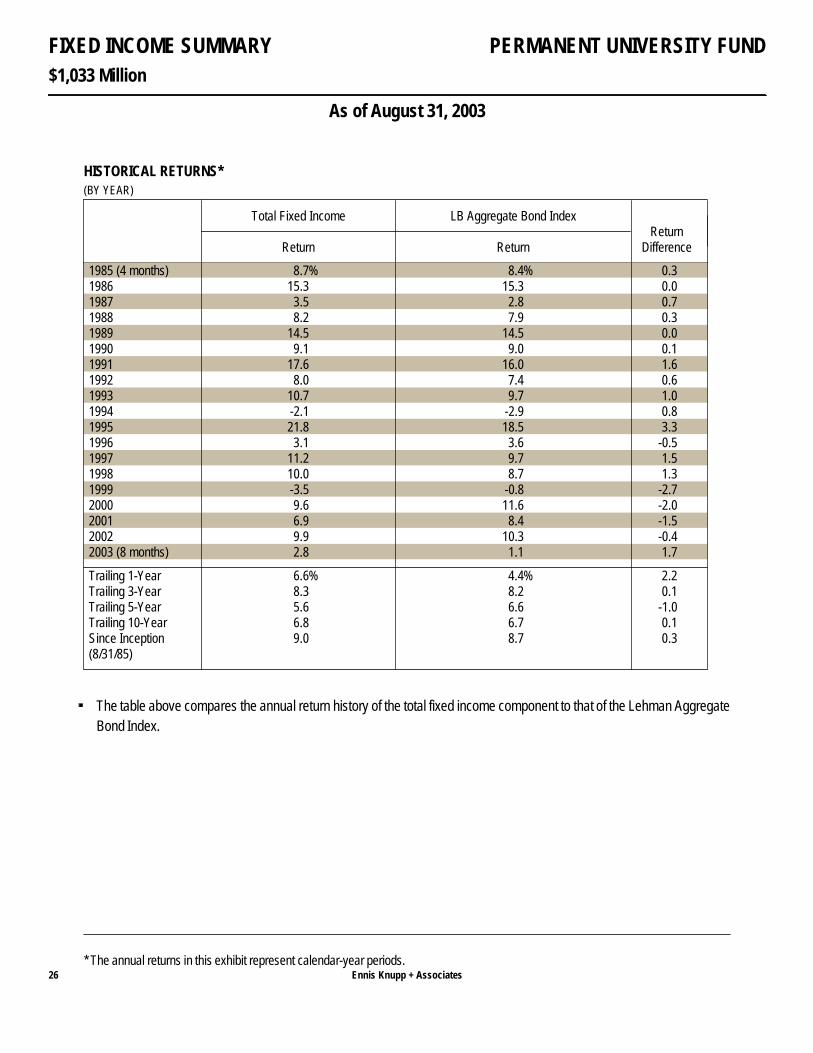
$1,033 Million
FIXED INCOME SUMMARY
As of August 31, 2003
PERMANENT UNIVERSITY FUND
Ennis Knupp + Associates26
Total Fixed Income LB Aggregate Bond IndexReturn
Return Return Difference
1985 (4 months) 8.7% 8.4% 0.31986 15.3 15.3 0.01987 3.5 2.8 0.71988 8.2 7.9 0.31989 14.5 14.5 0.01990 9.1 9.0 0.11991 17.6 16.0 1.61992 8.0 7.4 0.61993 10.7 9.7 1.01994 -2.1 -2.9 0.81995 21.8 18.5 3.31996 3.1 3.6 -0.51997 11.2 9.7 1.51998 10.0 8.7 1.31999 -3.5 -0.8 -2.72000 9.6 11.6 -2.02001 6.9 8.4 -1.52002 9.9 10.3 -0.42003 (8 months) 2.8 1.1 1.7
Trailing 1-Year 6.6% 4.4% 2.2Trailing 3-Year 8.3 8.2 0.1Trailing 5-Year 5.6 6.6 -1.0Trailing 10-Year 6.8 6.7 0.1Since Inception 9.0 8.7 0.3(8/31/85)
(BY YEAR)HISTORICAL RETURNS*
The table above compares the annual return history of the total fixed income component to that of the Lehman AggregateBond Index.
* The annual returns in this exhibit represent calendar-year periods.
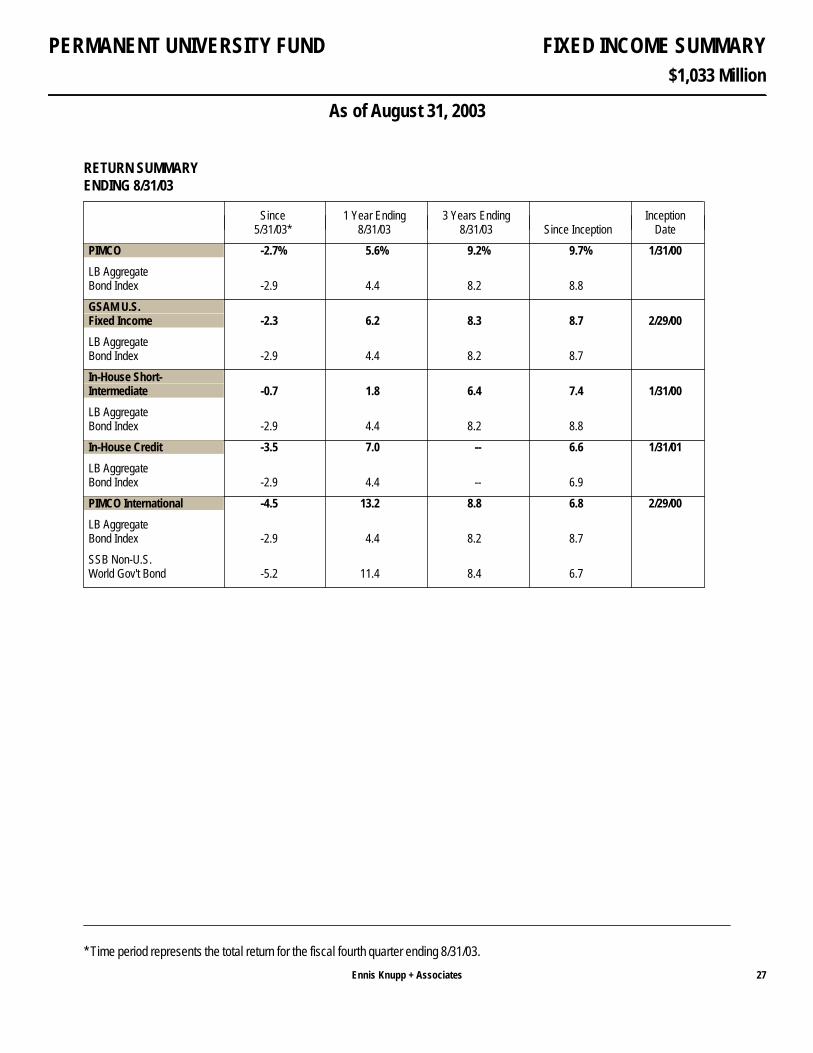
$1,033 Million
FIXED INCOME SUMMARY
As of August 31, 2003
PERMANENT UNIVERSITY FUND
Ennis Knupp + Associates 27
Since 1 Year Ending 3 Years Ending Inception5/31/03* 8/31/03 8/31/03 Since Inception Date
PIMCO -2.7% 5.6% 9.2% 9.7% 1/31/00
LB AggregateBond Index -2.9 4.4 8.2 8.8
GSAM U.S.Fixed Income -2.3 6.2 8.3 8.7 2/29/00
LB AggregateBond Index -2.9 4.4 8.2 8.7
In-House Short-Intermediate -0.7 1.8 6.4 7.4 1/31/00
LB AggregateBond Index -2.9 4.4 8.2 8.8
In-House Credit -3.5 7.0 -- 6.6 1/31/01
LB AggregateBond Index -2.9 4.4 -- 6.9
PIMCO International -4.5 13.2 8.8 6.8 2/29/00
LB AggregateBond Index -2.9 4.4 8.2 8.7
SSB Non-U.S.World Gov't Bond -5.2 11.4 8.4 6.7
ENDING 8/31/03RETURN SUMMARY
* Time period represents the total return for the fiscal fourth quarter ending 8/31/03.
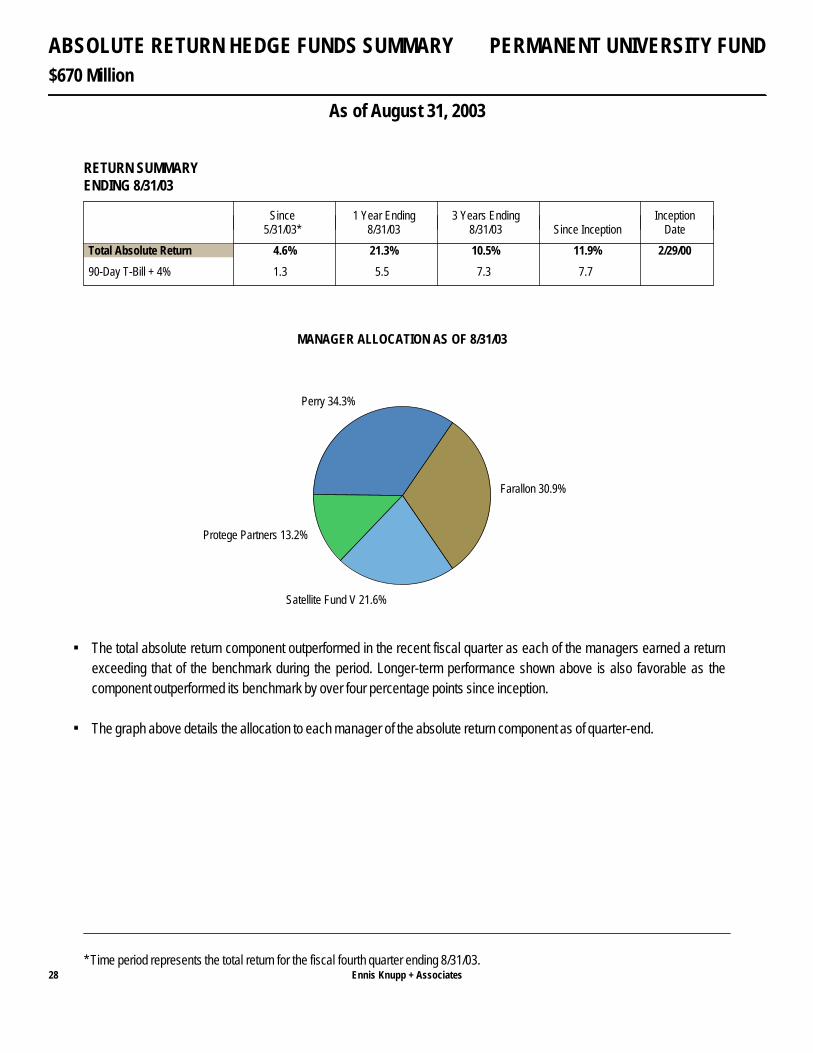
$670 Million
ABSOLUTE RETURN HEDGE FUNDS SUMMARY
As of August 31, 2003
PERMANENT UNIVERSITY FUND
Ennis Knupp + Associates28
Since 1 Year Ending 3 Years Ending Inception5/31/03* 8/31/03 8/31/03 Since Inception Date
Total Absolute Return 4.6% 21.3% 10.5% 11.9% 2/29/00
90-Day T-Bill + 4% 1.3 5.5 7.3 7.7
ENDING 8/31/03RETURN SUMMARY
Farallon 30.9%
Perry 34.3%
Protege Partners 13.2%
Satellite Fund V 21.6%
MANAGER ALLOCATION AS OF 8/31/03
The total absolute return component outperformed in the recent fiscal quarter as each of the managers earned a returnexceeding that of the benchmark during the period. Longer-term performance shown above is also favorable as thecomponent outperformed its benchmark by over four percentage points since inception.
The graph above details the allocation to each manager of the absolute return component as of quarter-end.
* Time period represents the total return for the fiscal fourth quarter ending 8/31/03.
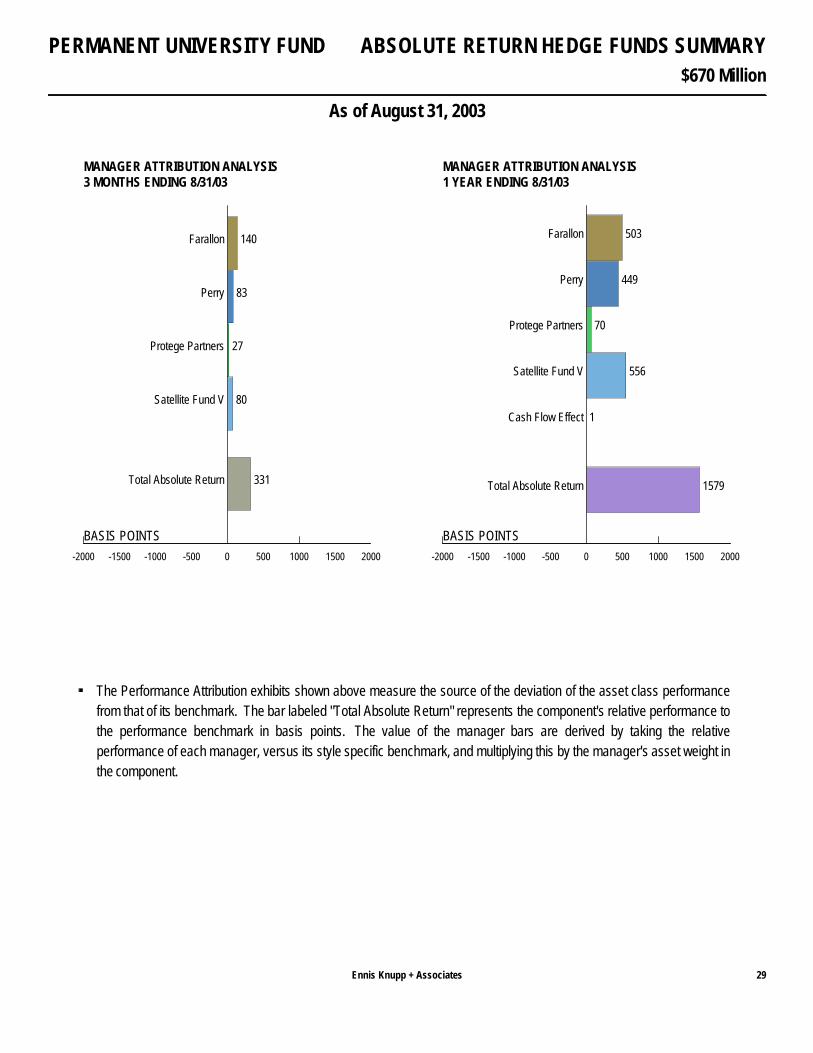
$670 Million
ABSOLUTE RETURN HEDGE FUNDS SUMMARY
As of August 31, 2003
PERMANENT UNIVERSITY FUND
Ennis Knupp + Associates 29
-2000 -1500 -1000 -500 0 500 1000 1500 2000
BASIS POINTS
140 Farallon
83 Perry
27 Protege Partners
80 Satellite Fund V
331 Total Absolute Return
3 MONTHS ENDING 8/31/03MANAGER ATTRIBUTION ANALYSIS
-2000 -1500 -1000 -500 0 500 1000 1500 2000
BASIS POINTS
503 Farallon
449 Perry
70 Protege Partners
556 Satellite Fund V
1Cash Flow Effect
1579 Total Absolute Return
1 YEAR ENDING 8/31/03MANAGER ATTRIBUTION ANALYSIS
The Performance Attribution exhibits shown above measure the source of the deviation of the asset class performancefrom that of its benchmark. The bar labeled "Total Absolute Return" represents the component's relative performance tothe performance benchmark in basis points. The value of the manager bars are derived by taking the relativeperformance of each manager, versus its style specific benchmark, and multiplying this by the manager's asset weight inthe component.

$670 Million
ABSOLUTE RETURN HEDGE FUNDS SUMMARY
As of August 31, 2003
PERMANENT UNIVERSITY FUND
Ennis Knupp + Associates30
2000 2001 2002 2003
Year
1.00
1.02
1.04
1.06
1.08
1.10
1.12
1.14
1.16
1.18
1.00
0.98
0.96
0.94
Ratio of Cumulative Wealth
Total
90-Day T-Bill + 4%
1.14
3 YEARS 6 MONTHS ENDING 8/31/03RATIO OF CUMULATIVE WEALTH
Beginning: 2/29/00
0 2 4 6 8 10
Annualized Risk (%)
0
2
4
6
8
10
12
14
0
Annualized Return (%)
T-Bills
90-Day T-Bill + 4%
Total
3 YEARS 6 MONTHS ENDING 8/31/03ANNUALIZED RISK/RETURN
The Ratio of Cumulative Wealth graph above illustrates the absolute return component's cumulative performance relativeto that of its benchmark. An upward sloping line between two points indicates that the component's return exceeded thatof the benchmark, while a downward sloping line indicates a lesser return. As seen in the graph, the component hasexperienced a significant relative-performance gain since mid-2002 and leads its benchmark since inception.
The Risk Return graph above exhibits the risk return characteristics of the total absolute return component, relative to thatof its performance benchmark. As shown, the component has outperformed its benchmark since inception, whileincurring a significantly greater level of risk.

$670 Million
ABSOLUTE RETURN HEDGE FUNDS SUMMARY
As of August 31, 2003
PERMANENT UNIVERSITY FUND
Ennis Knupp + Associates 31
Total Absolute Return 90-Day T-Bill + 4%Return
Return Return Difference
2000 (10 months) 14.6% 8.8% 5.82001 13.3 8.7 4.62002 -1.0 6.0 -7.02003 (8 months) 15.4 3.5 11.9
Trailing 1-Year 21.3% 5.5% 15.8Trailing 3-Year 10.5 7.3 3.2Since Inception 11.9 7.7 4.2(2/29/00)
(BY YEAR)HISTORICAL RETURNS*
The table above compares the annual return history of the total absolute return component to that of the performancebenchmark.
* The annual returns in this exhibit represent calendar-year periods.

$670 Million
ABSOLUTE RETURN HEDGE FUNDS SUMMARY
As of August 31, 2003
PERMANENT UNIVERSITY FUND
Ennis Knupp + Associates32
Since 1 Year Ending 3 Years Ending Inception5/31/03* 8/31/03 8/31/03 Since Inception Date
Farallon 5.9% 21.0% 12.5% 12.8% 2/29/00
90-Day T-Bill + 4% 1.3 5.5 7.3 7.7
Perry 3.7 17.3 12.7 14.2 2/29/00
90-Day T-Bill + 4% 1.3 5.5 7.3 7.7
Protege Partners 3.4 -- -- 7.8 2/28/03
90-Day T-Bill + 4% 1.3 -- -- 2.6
Satellite Fund V 5.0 31.4 5.5 5.5 8/31/00
90-Day T-Bill + 4% 1.3 5.5 7.3 7.3
ENDING 8/31/03RETURN SUMMARY
* Time period represents the total return for the fiscal fourth quarter ending 8/31/03.
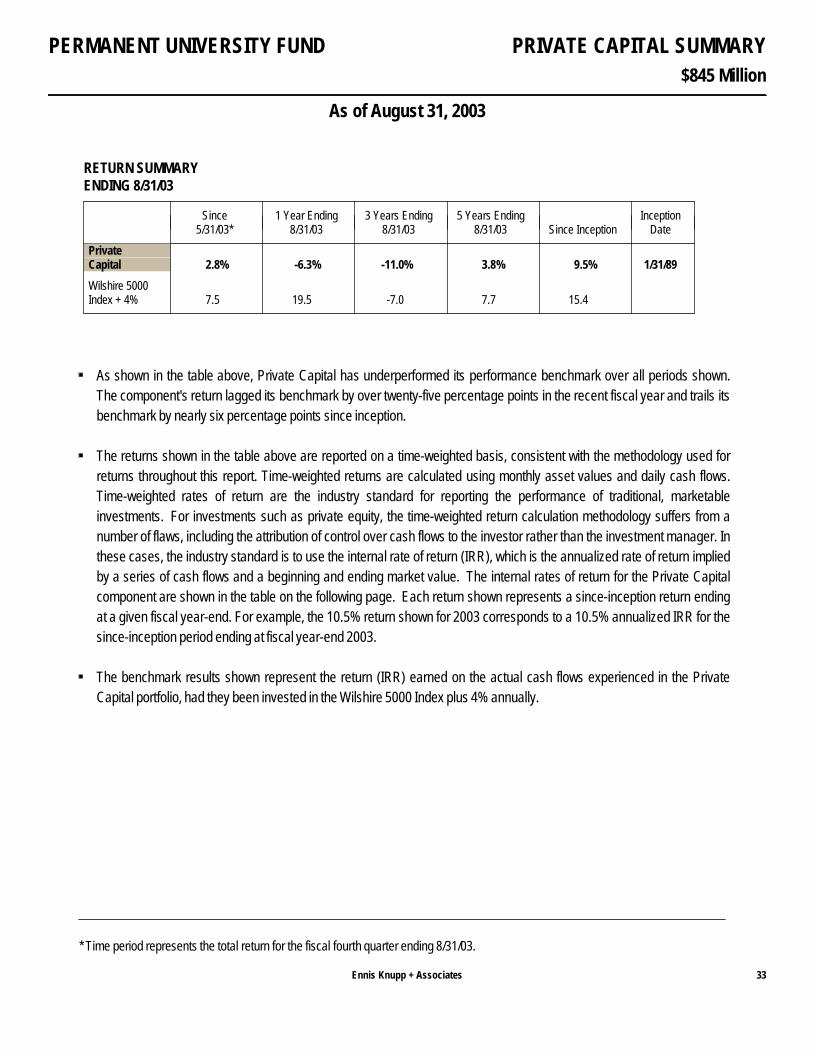
$845 Million
PRIVATE CAPITAL SUMMARY
As of August 31, 2003
PERMANENT UNIVERSITY FUND
Ennis Knupp + Associates 33
Since 1 Year Ending 3 Years Ending 5 Years Ending Inception5/31/03* 8/31/03 8/31/03 8/31/03 Since Inception Date
PrivateCapital 2.8% -6.3% -11.0% 3.8% 9.5% 1/31/89
Wilshire 5000Index + 4% 7.5 19.5 -7.0 7.7 15.4
ENDING 8/31/03RETURN SUMMARY
As shown in the table above, Private Capital has underperformed its performance benchmark over all periods shown.The component's return lagged its benchmark by over twenty-five percentage points in the recent fiscal year and trails itsbenchmark by nearly six percentage points since inception.
The returns shown in the table above are reported on a time-weighted basis, consistent with the methodology used forreturns throughout this report. Time-weighted returns are calculated using monthly asset values and daily cash flows.Time-weighted rates of return are the industry standard for reporting the performance of traditional, marketableinvestments. For investments such as private equity, the time-weighted return calculation methodology suffers from anumber of flaws, including the attribution of control over cash flows to the investor rather than the investment manager. Inthese cases, the industry standard is to use the internal rate of return (IRR), which is the annualized rate of return impliedby a series of cash flows and a beginning and ending market value. The internal rates of return for the Private Capitalcomponent are shown in the table on the following page. Each return shown represents a since-inception return endingat a given fiscal year-end. For example, the 10.5% return shown for 2003 corresponds to a 10.5% annualized IRR for thesince-inception period ending at fiscal year-end 2003.
The benchmark results shown represent the return (IRR) earned on the actual cash flows experienced in the PrivateCapital portfolio, had they been invested in the Wilshire 5000 Index plus 4% annually.
* Time period represents the total return for the fiscal fourth quarter ending 8/31/03.
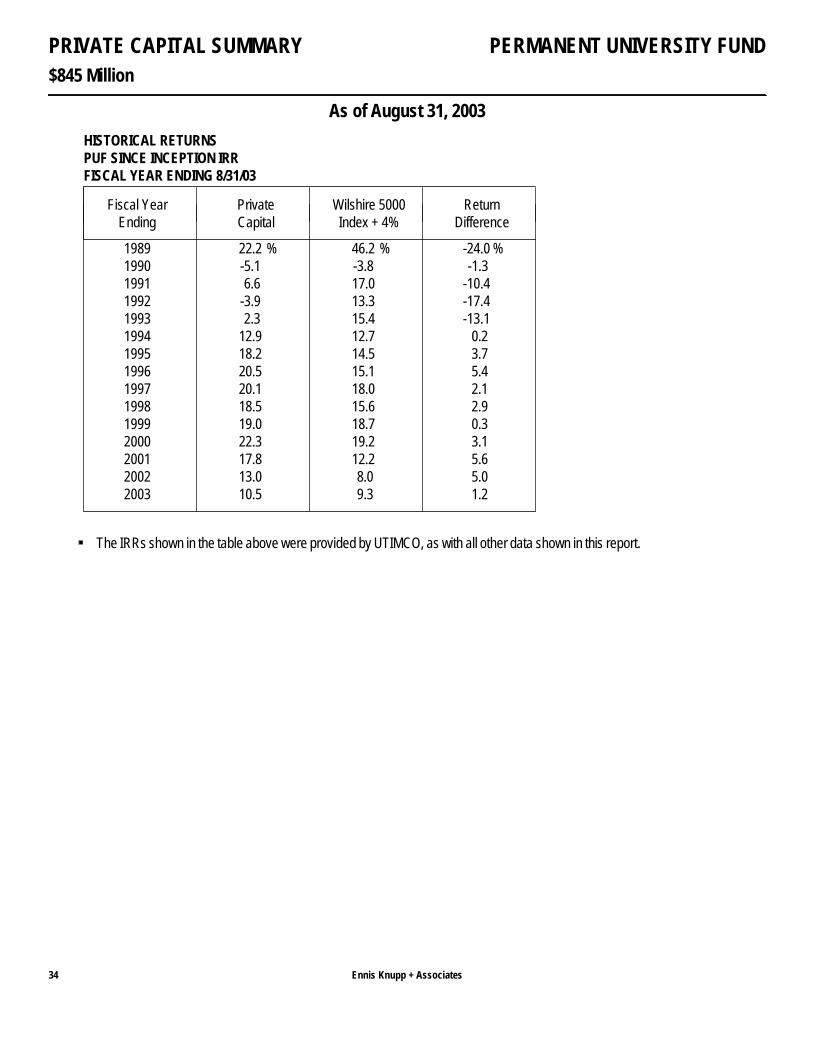
$845 Million
PRIVATE CAPITAL SUMMARY
As of August 31, 2003
PERMANENT UNIVERSITY FUND
Ennis Knupp + Associates34
Fiscal Year Private Wilshire 5000 ReturnEnding Capital Index + 4% Difference
1989 22.2 % 46.2 % -24.0 %1990 -5.1 -3.8 -1.31991 6.6 17.0 -10.41992 -3.9 13.3 -17.41993 2.3 15.4 -13.11994 12.9 12.7 0.21995 18.2 14.5 3.71996 20.5 15.1 5.41997 20.1 18.0 2.11998 18.5 15.6 2.91999 19.0 18.7 0.32000 22.3 19.2 3.12001 17.8 12.2 5.62002 13.0 8.0 5.02003 10.5 9.3 1.2
HISTORICAL RETURNS PUF SINCE INCEPTION IRR FISCAL YEAR ENDING 8/31/03
The IRRs shown in the table above were provided by UTIMCO, as with all other data shown in this report.

$845 Million
PRIVATE CAPITAL SUMMARY
As of August 31, 2003
PERMANENT UNIVERSITY FUND
Ennis Knupp + Associates 35
1989 1991 1993 1995 1997 1999 2001 2003
Year
1.0
1.1
1.2
1.0
0.9
0.8
0.7
0.6
0.5
0.4
0.3
0.2
Ratio of Cumulative Wealth
Total
Wilshire 5000 Index + 4%
0.46
14 YEARS 7 MONTHS ENDING 8/31/03RATIO OF CUMULATIVE WEALTH
Beginning: 1/31/89
0 5 10 15 20 25 30
Annualized Risk (%)
0
2
4
6
8
10
12
14
16
18
20
0
Annualized Return (%)
T-Bills
Wilshire 5000 Index + 4%
Total
14 YEARS 7 MONTHS ENDING 8/31/03ANNUALIZED RISK/RETURN
The data shown in the exhibits above reflect time-weighted returns.
The Ratio of Cumulative Wealth graph above illustrates the private capital securities component's cumulativeperformance relative to that of its benchmark. An upward sloping line between two points indicates that the component'sreturn exceeded that of the benchmark, while a downward sloping line indicates a lesser return. As seen in the graph, thecomponent has significantly underperformed since inception. A sizeable portion of the underperformance is a result ofbelow-benchmark returns earned early in the component's life (namely 1990-1991).
The Risk Return graph above exhibits the risk return characteristics of the private capital component, relative to that of itsbenchmark. As shown, the component has underperformed the benchmark of the Wilshire 5000 +4% while incurring asimilar level of risk.
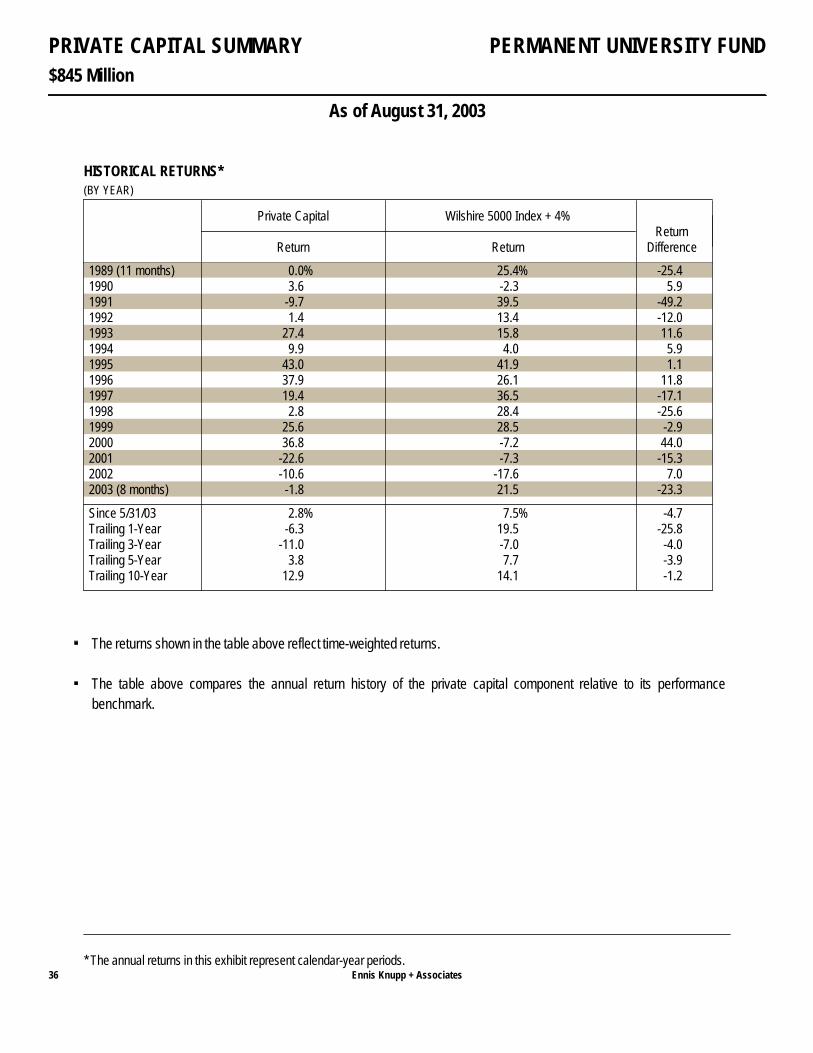
$845 Million
PRIVATE CAPITAL SUMMARY
As of August 31, 2003
PERMANENT UNIVERSITY FUND
Ennis Knupp + Associates36
Private Capital Wilshire 5000 Index + 4%Return
Return Return Difference
1989 (11 months) 0.0% 25.4% -25.41990 3.6 -2.3 5.91991 -9.7 39.5 -49.21992 1.4 13.4 -12.01993 27.4 15.8 11.61994 9.9 4.0 5.91995 43.0 41.9 1.11996 37.9 26.1 11.81997 19.4 36.5 -17.11998 2.8 28.4 -25.61999 25.6 28.5 -2.92000 36.8 -7.2 44.02001 -22.6 -7.3 -15.32002 -10.6 -17.6 7.02003 (8 months) -1.8 21.5 -23.3
Since 5/31/03 2.8% 7.5% -4.7Trailing 1-Year -6.3 19.5 -25.8Trailing 3-Year -11.0 -7.0 -4.0Trailing 5-Year 3.8 7.7 -3.9Trailing 10-Year 12.9 14.1 -1.2
(BY YEAR)HISTORICAL RETURNS*
The returns shown in the table above reflect time-weighted returns.
The table above compares the annual return history of the private capital component relative to its performancebenchmark.
* The annual returns in this exhibit represent calendar-year periods.

$589 Million
INFLATION HEDGING SUMMARY
As of August 31, 2003
PERMANENT UNIVERSITY FUND
Ennis Knupp + Associates 37
Since 1 Year Ending 3 Years Ending Inception5/31/03* 8/31/03 8/31/03 Since Inception Date
Inflation Hedging 9.1% 22.2% 17.1% 23.2% 11/30/99
UTIMCO InflationHedging Benchmark 2.9 13.6 9.1 13.0
ENDING 8/31/03RETURN SUMMARY
GSAM Commodity Index16.5%
In-House REITs 83.5%
MANAGER ALLOCATION AS OF 8/31/03
The total inflation hedging component's return exceeded the performance of the benchmark over all time-periods shownabove. The asset class component has outperformed its benchmark by over ten percentage points since inception.
The graph above details the manager allocations of the inflation hedging asset class as of quarter-end.
* Time period represents the total return for the fiscal fourth quarter ending 8/31/03.

$589 Million
INFLATION HEDGING SUMMARY
As of August 31, 2003
PERMANENT UNIVERSITY FUND
Ennis Knupp + Associates38
-2000 -1500 -1000 -500 0 500 1000 1500 2000
BASIS POINTS
8 GSAM Commodity Index
79 In-House REITs
1Cash Flow Effect
534Benchmark Effect
622 Inflation Hedging
3 MONTHS ENDING 8/31/03MANAGER ATTRIBUTION ANALYSIS
-2000 -1500 -1000 -500 0 500 1000 1500 2000
BASIS POINTS
19 GSAM Commodity Index
247 In-House REITs
-92 Cash Flow Effect
687Benchmark Effect
861 Inflation Hedging
1 YEAR ENDING 8/31/03MANAGER ATTRIBUTION ANALYSIS
The Performance Attribution exhibits shown above measure the source of the deviation of the asset class performancefrom that of its benchmark. The bar labeled "Total Inflation Hedging" represents the component's relative performance tothe performance benchmark in basis points. The value of the manager bars are derived by taking the relativeperformance of each manager, versus its style specific benchmark, and multiplying this by the manager's asset weight inthe component. The bar labeled "Benchmark Effect" represents the difference between the benchmarks of the individualmanagers and the UTIMCO inflation hedging benchmark.
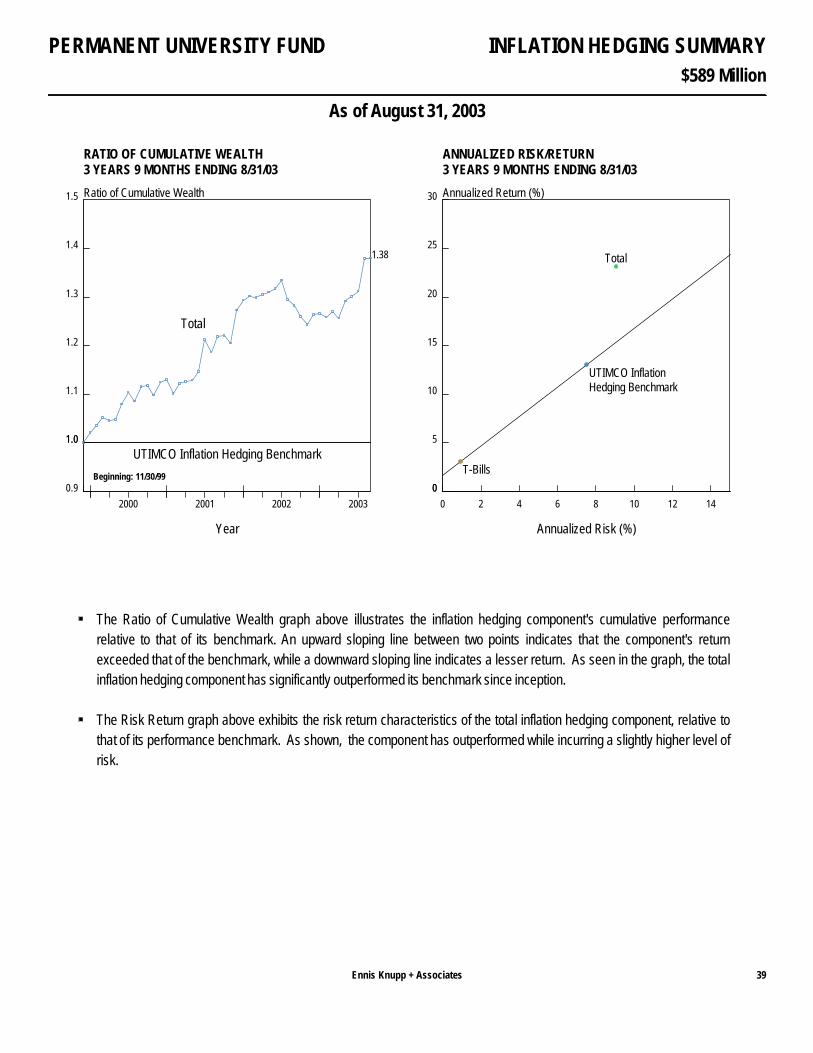
$589 Million
INFLATION HEDGING SUMMARY
As of August 31, 2003
PERMANENT UNIVERSITY FUND
Ennis Knupp + Associates 39
2000 2001 2002 2003
Year
1.0
1.1
1.2
1.3
1.4
1.5
1.0
0.9
Ratio of Cumulative Wealth
Total
UTIMCO Inflation Hedging Benchmark
1.38
3 YEARS 9 MONTHS ENDING 8/31/03RATIO OF CUMULATIVE WEALTH
Beginning: 11/30/99
0 2 4 6 8 10 12 14
Annualized Risk (%)
0
5
10
15
20
25
30
0
Annualized Return (%)
T-Bills
UTIMCO InflationHedging Benchmark
Total
3 YEARS 9 MONTHS ENDING 8/31/03ANNUALIZED RISK/RETURN
The Ratio of Cumulative Wealth graph above illustrates the inflation hedging component's cumulative performancerelative to that of its benchmark. An upward sloping line between two points indicates that the component's returnexceeded that of the benchmark, while a downward sloping line indicates a lesser return. As seen in the graph, the totalinflation hedging component has significantly outperformed its benchmark since inception.
The Risk Return graph above exhibits the risk return characteristics of the total inflation hedging component, relative tothat of its performance benchmark. As shown, the component has outperformed while incurring a slightly higher level ofrisk.
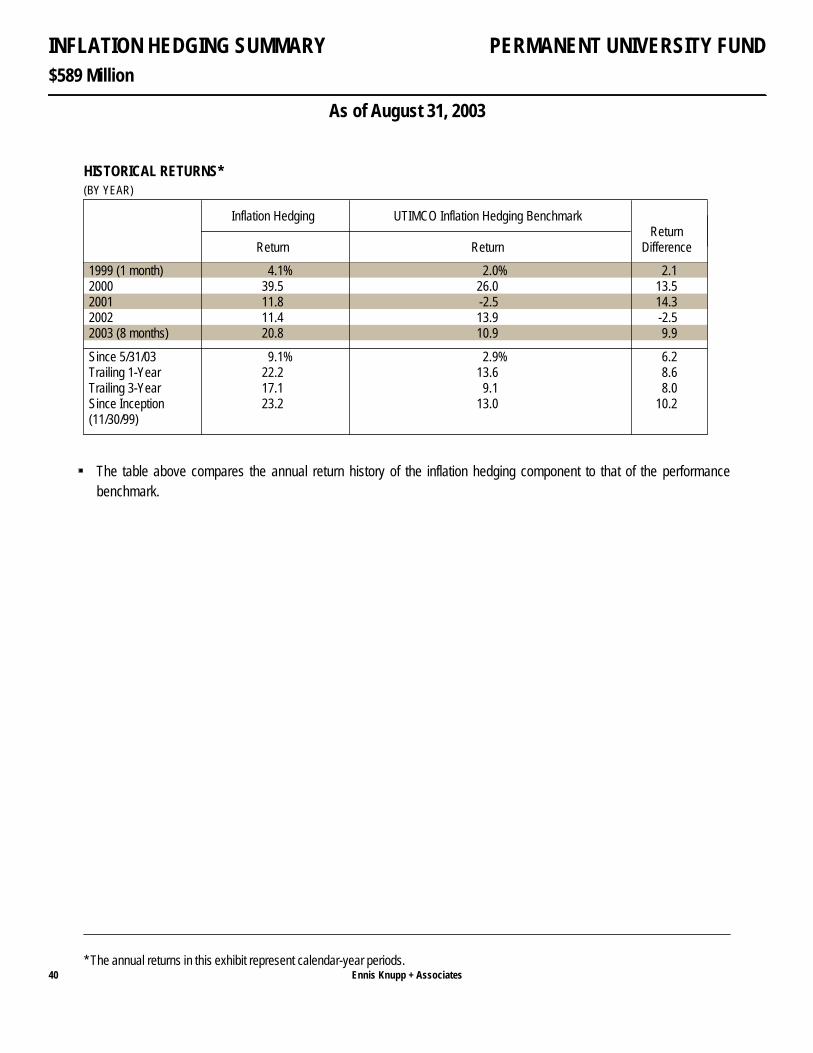
$589 Million
INFLATION HEDGING SUMMARY
As of August 31, 2003
PERMANENT UNIVERSITY FUND
Ennis Knupp + Associates40
Inflation Hedging UTIMCO Inflation Hedging BenchmarkReturn
Return Return Difference
1999 (1 month) 4.1% 2.0% 2.12000 39.5 26.0 13.52001 11.8 -2.5 14.32002 11.4 13.9 -2.52003 (8 months) 20.8 10.9 9.9
Since 5/31/03 9.1% 2.9% 6.2Trailing 1-Year 22.2 13.6 8.6Trailing 3-Year 17.1 9.1 8.0Since Inception 23.2 13.0 10.2(11/30/99)
(BY YEAR)HISTORICAL RETURNS*
The table above compares the annual return history of the inflation hedging component to that of the performancebenchmark.
* The annual returns in this exhibit represent calendar-year periods.
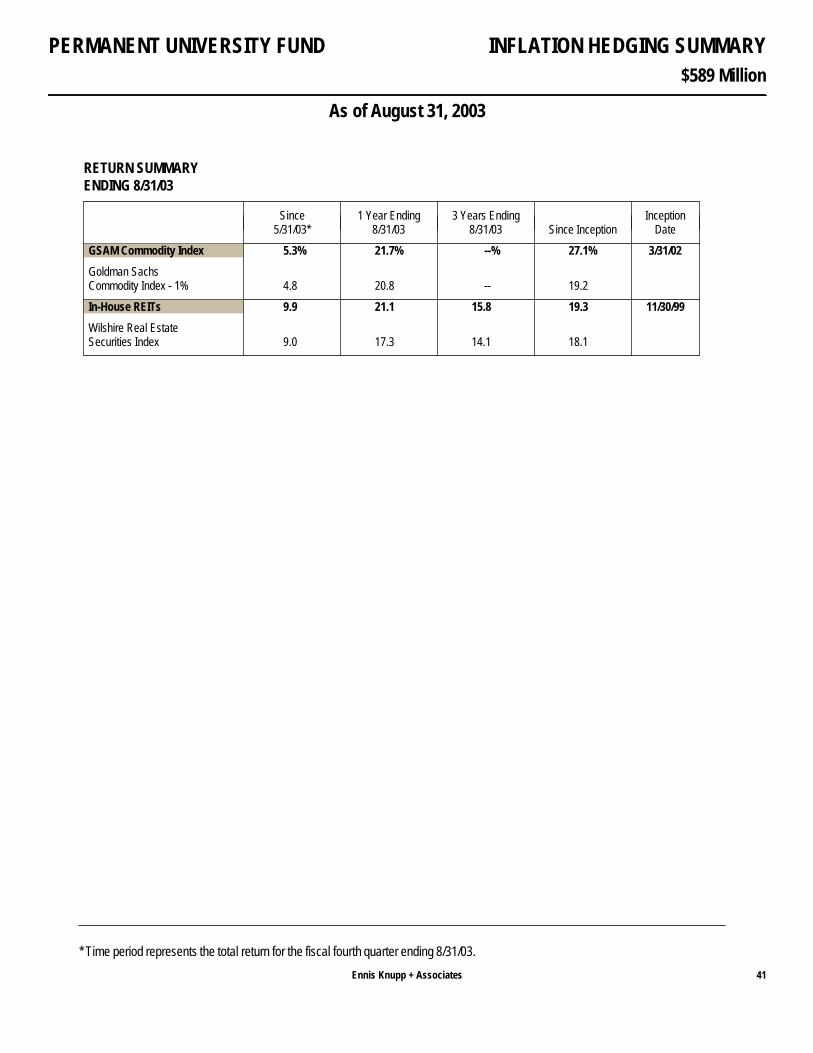
$589 Million
INFLATION HEDGING SUMMARY
As of August 31, 2003
PERMANENT UNIVERSITY FUND
Ennis Knupp + Associates 41
Since 1 Year Ending 3 Years Ending Inception5/31/03* 8/31/03 8/31/03 Since Inception Date
GSAM Commodity Index 5.3% 21.7% --% 27.1% 3/31/02
Goldman SachsCommodity Index - 1% 4.8 20.8 -- 19.2
In-House REITs 9.9 21.1 15.8 19.3 11/30/99
Wilshire Real EstateSecurities Index 9.0 17.3 14.1 18.1
ENDING 8/31/03RETURN SUMMARY
* Time period represents the total return for the fiscal fourth quarter ending 8/31/03.

(This page left blank intentionally)
42

GENERAL ENDOWMENT FUND
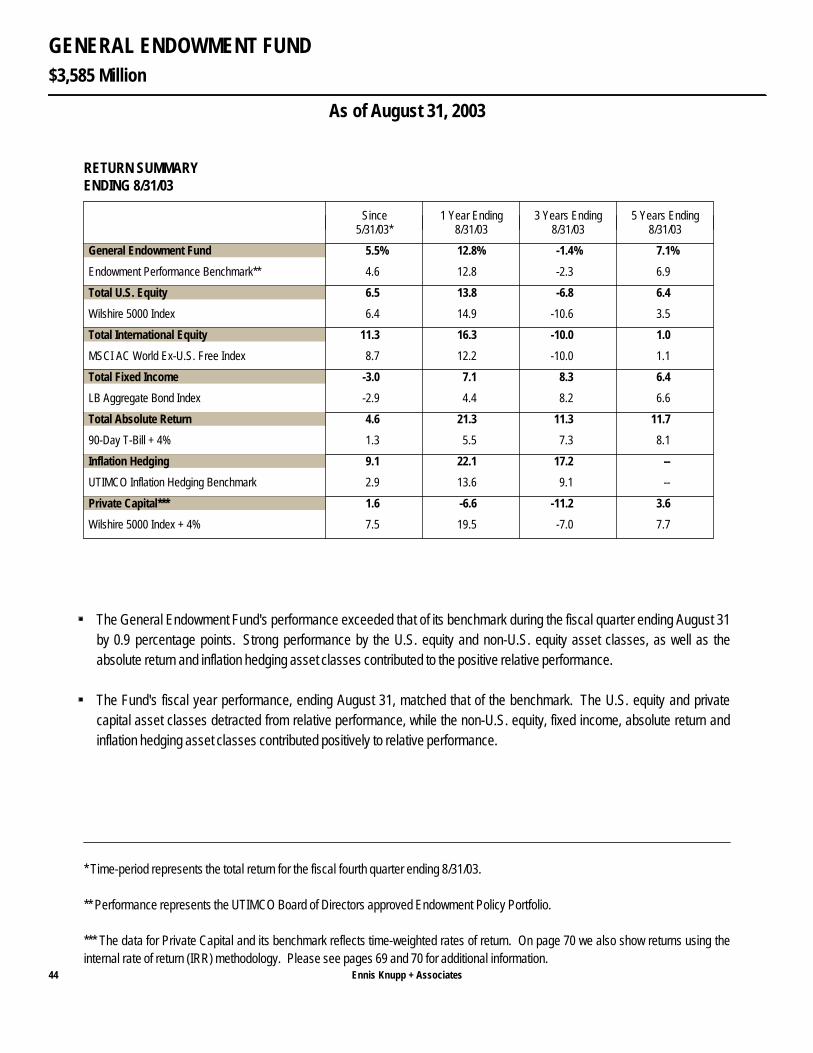
$3,585 Million
GENERAL ENDOWMENT FUND
As of August 31, 2003
Ennis Knupp + Associates44
Since 1 Year Ending 3 Years Ending 5 Years Ending5/31/03* 8/31/03 8/31/03 8/31/03
General Endowment Fund 5.5% 12.8% -1.4% 7.1%
Endowment Performance Benchmark** 4.6 12.8 -2.3 6.9
Total U.S. Equity 6.5 13.8 -6.8 6.4
Wilshire 5000 Index 6.4 14.9 -10.6 3.5
Total International Equity 11.3 16.3 -10.0 1.0
MSCI AC World Ex-U.S. Free Index 8.7 12.2 -10.0 1.1
Total Fixed Income -3.0 7.1 8.3 6.4
LB Aggregate Bond Index -2.9 4.4 8.2 6.6
Total Absolute Return 4.6 21.3 11.3 11.7
90-Day T-Bill + 4% 1.3 5.5 7.3 8.1
Inflation Hedging 9.1 22.1 17.2 --
UTIMCO Inflation Hedging Benchmark 2.9 13.6 9.1 --
Private Capital*** 1.6 -6.6 -11.2 3.6
Wilshire 5000 Index + 4% 7.5 19.5 -7.0 7.7
ENDING 8/31/03RETURN SUMMARY
The General Endowment Fund's performance exceeded that of its benchmark during the fiscal quarter ending August 31by 0.9 percentage points. Strong performance by the U.S. equity and non-U.S. equity asset classes, as well as theabsolute return and inflation hedging asset classes contributed to the positive relative performance.
The Fund's fiscal year performance, ending August 31, matched that of the benchmark. The U.S. equity and privatecapital asset classes detracted from relative performance, while the non-U.S. equity, fixed income, absolute return andinflation hedging asset classes contributed positively to relative performance.
* Time-period represents the total return for the fiscal fourth quarter ending 8/31/03.
** Performance represents the UTIMCO Board of Directors approved Endowment Policy Portfolio.
*** The data for Private Capital and its benchmark reflects time-weighted rates of return. On page 70 we also show returns using theinternal rate of return (IRR) methodology. Please see pages 69 and 70 for additional information.

$3,585 Million
GENERAL ENDOWMENT FUND
As of August 31, 2003
Ennis Knupp + Associates 45
Percent UTIMCO Total of Total Policy* Variance
Passive Domestic $ 508 14.2 % 11.0 % +3.2 %Active Domestic 497 13.9 10.0 +3.9 Hedge & Structured Active Domestic 269 7.5 10.0 -2.5
Domestic Public Equity $ 1,274 35.5 % 31.0 % +4.5 %
Passive International $ 286 8.0 % 6.5 % +1.5 %Active International 432 12.1 7.5 +4.6 Hedge & Structured Active International 35 1.0 5.0 -4.0
International Public Equity $ 753 21.0 % 19.0 % +2.0 %
Fixed Income $ 495 13.8 % 15.0 % -1.2 %Absolute Return 369 10.3 10.0 +0.3 Inflation Hedging 309 8.6 10.0 -1.4 Private Capital 385 10.7 15.0 -4.3 GSAM Overlay 41 1.1 -- +1.1 Liquidity Reserve -41 -1.1 -- -1.1
Total General Endowment Fund $ 3,585 100.0 % 100.0 % 0.0 %
UTIMCO POLICY COMPLIANCE ASSET ALLOCATION AS OF 8/31/03 ($ in millions)
The table above summarizes and compares the actual asset allocation of the General Endowment Fund to UTIMCOBoard of Directors approved policy targets of the Fund.
As shown, the Fund was overweight to public equity as of August 31.
As of August 31, 20.8% of the General Endowment Fund was representative of the Permanent Health Fund and theremaining 79.2% was of the Long Term Fund.
* UTIMCO Policy represents the UTIMCO Board of Directors approved policy targets.

$3,585 Million
GENERAL ENDOWMENT FUND
As of August 31, 2003
Ennis Knupp + Associates46
-400 -300 -200 -100 0 100 200 300 400
BASIS POINTS
4 Total U.S. Equity
51 Total International Equity
-1 Total Fixed Income
35 Total Absolute Return
51 Inflation Hedging
-63 Private Capital
28Allocation Effect
3Cash Flow Effect
-21 Benchmark Effect
86 General Endowment Fund
3 MONTHS ENDING 8/31/03TOTAL FUND ATTRIBUTION ANALYSIS
-400 -300 -200 -100 0 100 200 300 400
BASIS POINTS
-46 Total U.S. Equity
75 Total International Equity
55 Total Fixed Income
151 Total Absolute Return
63 Inflation Hedging
-327 Private Capital
99Allocation Effect
-4 Cash Flow Effect
-60 Benchmark Effect
5 General Endowment Fund
1 YEAR ENDING 8/31/03TOTAL FUND ATTRIBUTION ANALYSIS
The Performance Attribution exhibits shown above measure the source of the deviation of a fund's performance from thatof its benchmark. Each bar on the graph represents the contribution made by the component to the total difference inperformance (shown at the bottom of the exhibit). A positive value for a component indicates a positive contribution to theaggregate relative performance. A negative value indicates a detrimental impact. The asset class bar amounts aredetermined by multiplying the relative return of that asset class (actual return - policy benchmark return) by its policyweight. "Allocation Effect" details the degree to which the Fund's asset allocation differed from that of its policy, and whatimpact this had on performance. "Cash Flow Effect" details what impact any movement in Fund assets had onperformance. "Benchmark Effect" details the impact of differences between the composition of the Total Fundbenchmark and the benchmarks of the individual asset classes.
As shown in the three-month exhibit, the favorable performance earned by the U.S. equity, non-U.S. equity, absolutereturn, and inflation hedging asset classes benefited performance, collectively offsetting the negative impact produced bythe Private Capital component's trailing result. The General Endowment Fund also benefited from the overweightallocation to domestic and international public equities as both markets outpaced the other marketable asset classesinvested in by the Fund.
The one-year attribution analysis shows a similar story; however, the General Endowment Fund only narrowlyoutperformed its benchmark.
The data for Private Capital and its benchmark reflects time-weighted rates of return.

$3,585 Million
GENERAL ENDOWMENT FUND
As of August 31, 2003
Ennis Knupp + Associates 47
1992 1994 1996 1998 2000 2002
Year
1.00
1.05
1.00
0.95
0.90
0.85
0.80
0.75
Ratio of Cumulative Wealth
Total
Endowment Performance Benchmark
0.90
12 YEARS ENDING 8/31/03RATIO OF CUMULATIVE WEALTH
Beginning: 8/31/91
0 2 4 6 8 10 12 14 16 18 20
Annualized Risk (%)
0
2
4
6
8
10
12
14
16
0
Annualized Return (%)
T-Bills
Endowment PerformanceBenchmark
Total
12 YEARS ENDING 8/31/03ANNUALIZED RISK/RETURN
The Ratio of Cumulative Wealth graph above illustrates the Total General Endowment Fund's cumulative performancerelative to that of its benchmark. An upward sloping line between two points indicates that the component's returnexceeded that of the benchmark, while a downward sloping line indicates a lesser return. As seen in the graph, between1993 and 1999 the Fund's performance trailed that of the benchmark. Since 1999, the Fund has exceeded theperformance of its benchmark.
The Risk Return graph above exhibits the risk return characteristics of the Total General Endowment Fund, relative tothat of the Performance Benchmark. As shown, the Fund earned a slightly lower return at a comparatively lower level ofvolatility.

$3,585 Million
GENERAL ENDOWMENT FUND
As of August 31, 2003
Ennis Knupp + Associates48
General Endowment Fund Endowment Performance Benchmark**Return
Return Return Difference
1991 (4 months) 6.4% 7.8% -1.41992 7.8 7.4 0.41993 10.9 16.5 -5.61994 0.2 2.4 -2.21995 25.1 27.0 -1.91996 14.3 15.7 -1.41997 20.5 20.2 0.31998 11.6 17.7 -6.11999 18.6 18.7 -0.12000 3.9 -1.6 5.52001 -5.0 -4.7 -0.32002 -7.7 -8.4 0.72003 (8 months) 13.5 13.7 -0.2
Trailing 1-Year 12.8% 12.8% 0.0Trailing 3-Year -1.4 -2.3 0.9Trailing 5-Year 7.1 6.9 0.2Trailing 10-Year 9.2 9.8 -0.6Since Inception 9.6 10.5 -0.9(8/31/91)
(BY YEAR)HISTORICAL RETURNS*
The table above compares the annual return history of the General Endowment Fund to that of its performancebenchmark.
* The annual returns in this exhibit represent calendar-year periods.
** The Endowment Performance Benchmark represents the returns of the UTIMCO Board of Directors approved Endowment PolicyPortfolio.

$1,274 Million
DOMESTIC EQUITY SUMMARY
As of August 31, 2003
GENERAL ENDOWMENT FUND
Ennis Knupp + Associates 49
Since 1 Year Ending 3 Years Ending 5 Years Ending Inception5/31/03* 8/31/03 8/31/03 8/31/03 Since Inception Date
Total U.S. Equity 6.5% 13.8% -6.8% 6.4% 10.3% 8/31/91
Wilshire5000 Index 6.4 14.9 -10.6 3.5 10.2
ENDING 8/31/03RETURN SUMMARY
Russell 2000 Futures 2.7%
BGI Russell 2000 Alpha Tilts8.7%
BGI S&P 500 Index 8.2%
BGI Mid Cap Index 18.8%
Cash Equitization 10.1%
BGI Russell 3000 Alpha Tilts 4.1%
Davis Hamilton 1.8%
GSAM Large Cap 7.4%
Cordillera 4.9%
Schroder 7.7%
Value Act 1.5% GSAM Small Cap 2.8%BGI Global Market Neutral 4.5%
Eminence 0.8%
Maverick 13.1%
Sirios 1.4%Standard Pacific 1.2%
MANAGER ALLOCATION AS OF 8/31/03
The total U.S. equity asset class return exceeded the performance of the Wilshire 5000 Index by 0.1 percentage pointduring the fiscal quarter, though it trailed the benchmark by 1.1 percentage points during the fiscal year.
The graph above details the manager allocations of the U.S. equity asset class as of August 31.
* Time period represents the total return for the fiscal fourth quarter ending 8/31/03.

$1,274 Million
DOMESTIC EQUITY SUMMARY
As of August 31, 2003
GENERAL ENDOWMENT FUND
Ennis Knupp + Associates50
-200 -150 -100 -50 0 50 100 150 200
BASIS POINTS
1 Davis Hamilton9 GSAM Large Cap
0 MBA17 Cordillera
-51 Schroder-1 GSAM Small Cap
0 BGI Russell 2000-2 BGI Russell 2000 Alpha Tilts
0 BGI S&P 500 Index0 BGI Mid Cap Index
-3 Cash Equitization-8 BGI Global Market Neutral
-52 Maverick0 Sirios
-5 Standard Pacific11Cash Flow Effect
95Benchmark Effect
10 Total U.S. Equity
3 MONTHS ENDING 8/31/03MANAGER ATTRIBUTION ANALYSIS
-200 -150 -100 -50 0 50 100 150 200
BASIS POINTS
-3 Davis Hamilton0 GSAM Large Cap0 MBA
-65 Cordillera-40 Schroder
-11 GSAM Small Cap0 BGI Russell 2000
-12 BGI Russell 2000 Alpha Tilts0 BGI S&P 500 Index0 BGI Mid Cap Index
-1 Cash Equitization-7 BGI Global Market Neutral
-53 Maverick0 Sirios
-15 Standard Pacific-50 Cash Flow Effect
147Benchmark Effect
-110 Total U.S. Equity
1 YEAR ENDING 8/31/03MANAGER ATTRIBUTION ANALYSIS
The Performance Attribution exhibits shown above measure the source of the deviation of the asset class performancefrom that of its benchmark. The bar labeled "Total U.S. Equity" represents the component's relative performance to theWilshire 5000 in basis points. The value of the manager bars are derived by taking the relative performance of eachmanager, versus its style specific benchmark, and multiplying this by the manager's asset weight in the component. Thebar labeled "Benchmark Effect" represents the difference between the benchmarks of the individual managers and theU.S. equity benchmark.

$1,274 Million
DOMESTIC EQUITY SUMMARY
As of August 31, 2003
GENERAL ENDOWMENT FUND
Ennis Knupp + Associates 51
1992 1994 1996 1998 2000 2002
Year
1.00
1.05
1.10
1.00
0.95
0.90
0.85
0.80
0.75
Ratio of Cumulative Wealth
Total
Wilshire 5000 Index 1.01
12 YEARS ENDING 8/31/03RATIO OF CUMULATIVE WEALTH
Beginning: 8/31/91
0 2 4 6 8 10 12 14 16 18 20
Annualized Risk (%)
0
2
4
6
8
10
12
14
16
0
Annualized Return (%)
T-Bills
Wilshire 5000 Index
Total
12 YEARS ENDING 8/31/03ANNUALIZED RISK/RETURN
The Ratio of Cumulative Wealth graph above illustrates the domestic equity component's cumulative performancerelative to that of its benchmark. An upward sloping line between two points indicates that the component's returnexceeded that of the benchmark, while a downward sloping line indicates a lesser return. As seen in the graph,performance trailed the Index prior to 1999, though it has exceeded that of the Index since 1999.
The Risk Return graph above exhibits the risk return characteristics of the total domestic equity component, relative tothat of the Performance Benchmark. As shown, the asset class has achieved a similar return as the Index at a slightlylower level of volatility.

$1,274 Million
DOMESTIC EQUITY SUMMARY
As of August 31, 2003
GENERAL ENDOWMENT FUND
Ennis Knupp + Associates52
Total U.S. Equity Wilshire 5000 IndexReturn
Return Return Difference
1991 (4 months) 5.9% 7.5% -1.61992 7.1 9.0 -1.91993 9.4 11.3 -1.91994 1.0 -0.1 1.11995 32.3 36.4 -4.11996 21.0 21.2 -0.21997 30.2 31.3 -1.11998 14.6 23.4 -8.81999 24.3 23.6 0.72000 -2.8 -10.9 8.12001 -5.9 -11.0 5.12002 -18.4 -20.9 2.52003 (8 months) 16.6 18.4 -1.8
Trailing 1-Year 13.8% 14.9% -1.1Trailing 3-Year -6.8 -10.6 3.8Trailing 5-Year 6.4 3.5 2.9Trailing 10-Year 10.3 9.6 0.7Since Inception 10.3 10.2 0.1(8/31/91)
(BY YEAR)HISTORICAL RETURNS*
The table above compares the annual return history of the total domestic equity component to that of the Wilshire 5000Index.
* The annual returns in this exhibit represent calendar-year periods.
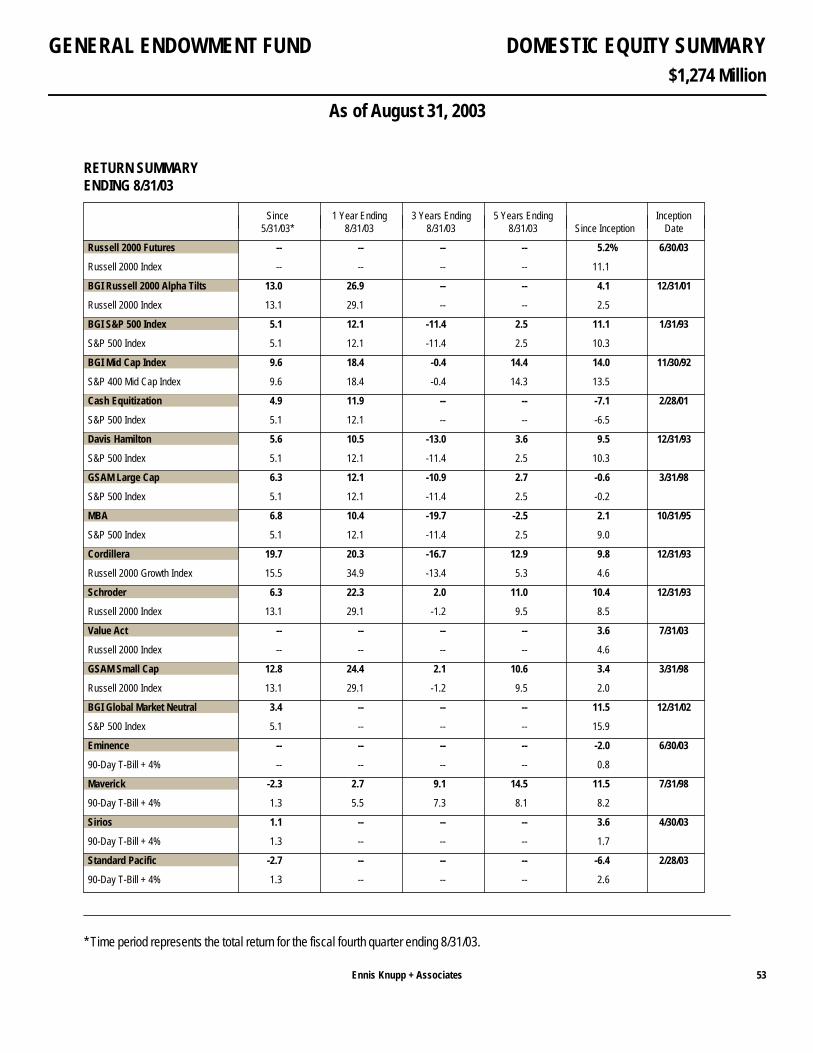
$1,274 Million
DOMESTIC EQUITY SUMMARY
As of August 31, 2003
GENERAL ENDOWMENT FUND
Ennis Knupp + Associates 53
Since 1 Year Ending 3 Years Ending 5 Years Ending Inception5/31/03* 8/31/03 8/31/03 8/31/03 Since Inception Date
Russell 2000 Futures -- -- -- -- 5.2% 6/30/03
Russell 2000 Index -- -- -- -- 11.1
BGI Russell 2000 Alpha Tilts 13.0 26.9 -- -- 4.1 12/31/01
Russell 2000 Index 13.1 29.1 -- -- 2.5
BGI S&P 500 Index 5.1 12.1 -11.4 2.5 11.1 1/31/93
S&P 500 Index 5.1 12.1 -11.4 2.5 10.3
BGI Mid Cap Index 9.6 18.4 -0.4 14.4 14.0 11/30/92
S&P 400 Mid Cap Index 9.6 18.4 -0.4 14.3 13.5
Cash Equitization 4.9 11.9 -- -- -7.1 2/28/01
S&P 500 Index 5.1 12.1 -- -- -6.5
Davis Hamilton 5.6 10.5 -13.0 3.6 9.5 12/31/93
S&P 500 Index 5.1 12.1 -11.4 2.5 10.3
GSAM Large Cap 6.3 12.1 -10.9 2.7 -0.6 3/31/98
S&P 500 Index 5.1 12.1 -11.4 2.5 -0.2
MBA 6.8 10.4 -19.7 -2.5 2.1 10/31/95
S&P 500 Index 5.1 12.1 -11.4 2.5 9.0
Cordillera 19.7 20.3 -16.7 12.9 9.8 12/31/93
Russell 2000 Growth Index 15.5 34.9 -13.4 5.3 4.6
Schroder 6.3 22.3 2.0 11.0 10.4 12/31/93
Russell 2000 Index 13.1 29.1 -1.2 9.5 8.5
Value Act -- -- -- -- 3.6 7/31/03
Russell 2000 Index -- -- -- -- 4.6
GSAM Small Cap 12.8 24.4 2.1 10.6 3.4 3/31/98
Russell 2000 Index 13.1 29.1 -1.2 9.5 2.0
BGI Global Market Neutral 3.4 -- -- -- 11.5 12/31/02
S&P 500 Index 5.1 -- -- -- 15.9
Eminence -- -- -- -- -2.0 6/30/03
90-Day T-Bill + 4% -- -- -- -- 0.8
Maverick -2.3 2.7 9.1 14.5 11.5 7/31/98
90-Day T-Bill + 4% 1.3 5.5 7.3 8.1 8.2
Sirios 1.1 -- -- -- 3.6 4/30/03
90-Day T-Bill + 4% 1.3 -- -- -- 1.7
Standard Pacific -2.7 -- -- -- -6.4 2/28/03
90-Day T-Bill + 4% 1.3 -- -- -- 2.6
ENDING 8/31/03RETURN SUMMARY
* Time period represents the total return for the fiscal fourth quarter ending 8/31/03.
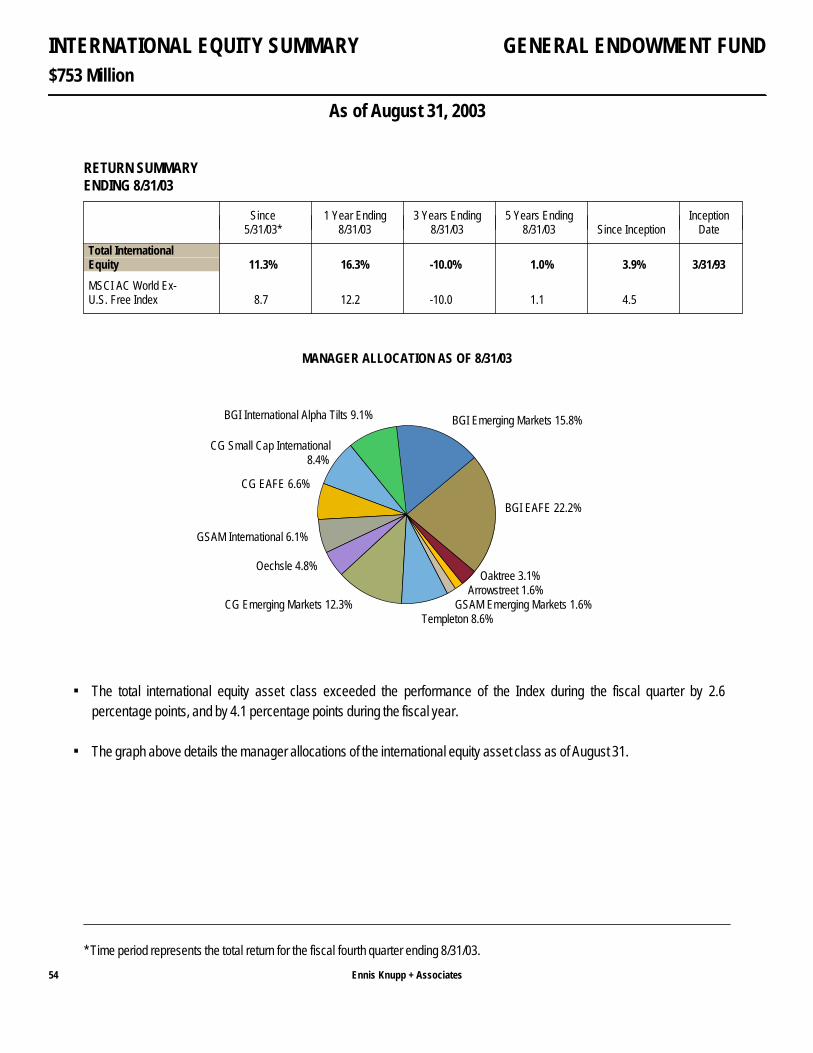
$753 Million
INTERNATIONAL EQUITY SUMMARY
As of August 31, 2003
GENERAL ENDOWMENT FUND
Ennis Knupp + Associates54
Since 1 Year Ending 3 Years Ending 5 Years Ending Inception5/31/03* 8/31/03 8/31/03 8/31/03 Since Inception Date
Total InternationalEquity 11.3% 16.3% -10.0% 1.0% 3.9% 3/31/93
MSCI AC World Ex-U.S. Free Index 8.7 12.2 -10.0 1.1 4.5
ENDING 8/31/03RETURN SUMMARY
BGI EAFE 22.2%
BGI Emerging Markets 15.8%BGI International Alpha Tilts 9.1%
CG Small Cap International8.4%
CG EAFE 6.6%
GSAM International 6.1%
Oechsle 4.8%
CG Emerging Markets 12.3%Templeton 8.6%
GSAM Emerging Markets 1.6%Arrowstreet 1.6%
Oaktree 3.1%
MANAGER ALLOCATION AS OF 8/31/03
The total international equity asset class exceeded the performance of the Index during the fiscal quarter by 2.6percentage points, and by 4.1 percentage points during the fiscal year.
The graph above details the manager allocations of the international equity asset class as of August 31.
* Time period represents the total return for the fiscal fourth quarter ending 8/31/03.

$753 Million
INTERNATIONAL EQUITY SUMMARY
As of August 31, 2003
GENERAL ENDOWMENT FUND
Ennis Knupp + Associates 55
-500 -400 -300 -200 -100 0 100 200 300 400 500
BASIS POINTS
72 CG Small Cap International
11 CG EAFE
-15 GSAM International
36 Oechsle
-19 CG Emerging Markets
-57 Templeton
5 GSAM Emerging Markets
1 BGI EAFE
-10 BGI Emerging Markets
-29 Arrowstreet
1 Oaktree
-10 Cash Flow Effect
278Benchmark Effect
264 Total International Equity
3 MONTHS ENDING 8/31/03MANAGER ATTRIBUTION ANALYSIS
-500 -400 -300 -200 -100 0 100 200 300 400 500
BASIS POINTS
114 CG Small Cap International
32 CG EAFE
-9 GSAM International
0 Oechsle
15 CG Emerging Markets
-29 Templeton
-1 GSAM Emerging Markets
12 BGI EAFE
3 BGI Emerging Markets
-30 Arrowstreet
6 Oaktree
-14 Cash Flow Effect
306Benchmark Effect
405 Total International Equity
1 YEAR ENDING 8/31/03MANAGER ATTRIBUTION ANALYSIS
The Performance Attribution exhibits shown above measure the source of the deviation of the asset class performancefrom that of its benchmark. The bar labeled "Total International Equity" represents the component's relative performanceto the MSCI All Country World ex-U.S. Free Index in basis points. The value of the manager bars are derived by takingthe relative performance of each manager, versus its style specific benchmark, and multiplying this by the manager'sasset weight in the component. The bar labeled "Benchmark Effect" represents the difference between the benchmarksof the individual managers and the international equity benchmark.
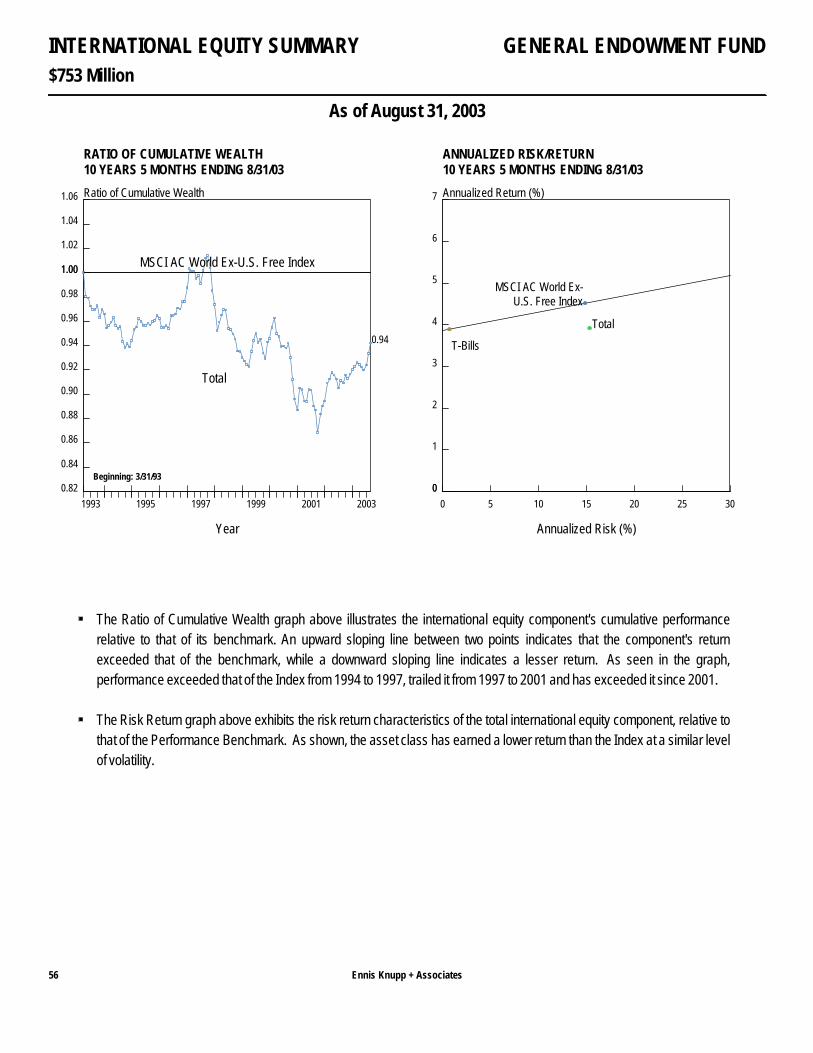
$753 Million
INTERNATIONAL EQUITY SUMMARY
As of August 31, 2003
GENERAL ENDOWMENT FUND
Ennis Knupp + Associates56
1993 1995 1997 1999 2001 2003
Year
1.00
1.02
1.04
1.06
1.00
0.98
0.96
0.94
0.92
0.90
0.88
0.86
0.84
0.82
Ratio of Cumulative Wealth
Total
MSCI AC World Ex-U.S. Free Index
0.94
10 YEARS 5 MONTHS ENDING 8/31/03RATIO OF CUMULATIVE WEALTH
Beginning: 3/31/93
0 5 10 15 20 25 30
Annualized Risk (%)
0
1
2
3
4
5
6
7
0
Annualized Return (%)
T-Bills
MSCI AC World Ex-U.S. Free Index
Total
10 YEARS 5 MONTHS ENDING 8/31/03ANNUALIZED RISK/RETURN
The Ratio of Cumulative Wealth graph above illustrates the international equity component's cumulative performancerelative to that of its benchmark. An upward sloping line between two points indicates that the component's returnexceeded that of the benchmark, while a downward sloping line indicates a lesser return. As seen in the graph,performance exceeded that of the Index from 1994 to 1997, trailed it from 1997 to 2001 and has exceeded it since 2001.
The Risk Return graph above exhibits the risk return characteristics of the total international equity component, relative tothat of the Performance Benchmark. As shown, the asset class has earned a lower return than the Index at a similar levelof volatility.

$753 Million
INTERNATIONAL EQUITY SUMMARY
As of August 31, 2003
GENERAL ENDOWMENT FUND
Ennis Knupp + Associates 57
Total International Equity MSCI AC World Ex-U.S. Free IndexReturn
Return Return Difference
1993 (9 months) 16.8% 21.0% -4.21994 4.2 6.6 -2.41995 12.0 9.9 2.11996 9.6 6.7 2.91997 0.6 2.0 -1.41998 9.3 14.5 -5.21999 33.1 30.9 2.22000 -20.4 -15.1 -5.32001 -18.8 -19.5 0.72002 -12.2 -14.7 2.52003 (8 months) 20.3 17.5 2.8
Trailing 1-Year 16.3% 12.2% 4.1Trailing 3-Year -10.0 -10.0 0.0Trailing 5-Year 1.0 1.1 -0.1Trailing 10-Year 2.6 2.8 -0.2Since Inception 3.9 4.5 -0.6(3/31/93)
(BY YEAR)HISTORICAL RETURNS*
The table above compares the annual return history of the international equity component to that of its performancebenchmark.
* The annual returns in this exhibit represent calendar-year periods.
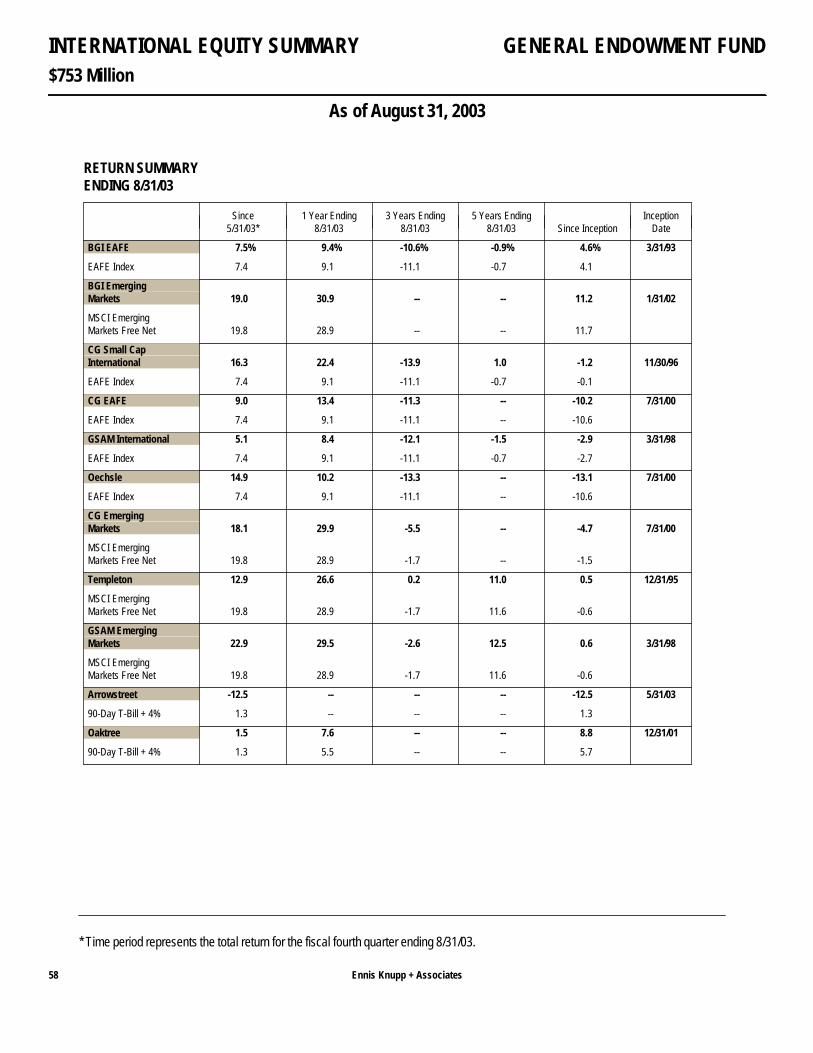
$753 Million
INTERNATIONAL EQUITY SUMMARY
As of August 31, 2003
GENERAL ENDOWMENT FUND
Ennis Knupp + Associates58
Since 1 Year Ending 3 Years Ending 5 Years Ending Inception5/31/03* 8/31/03 8/31/03 8/31/03 Since Inception Date
BGI EAFE 7.5% 9.4% -10.6% -0.9% 4.6% 3/31/93
EAFE Index 7.4 9.1 -11.1 -0.7 4.1
BGI EmergingMarkets 19.0 30.9 -- -- 11.2 1/31/02
MSCI EmergingMarkets Free Net 19.8 28.9 -- -- 11.7
CG Small CapInternational 16.3 22.4 -13.9 1.0 -1.2 11/30/96
EAFE Index 7.4 9.1 -11.1 -0.7 -0.1
CG EAFE 9.0 13.4 -11.3 -- -10.2 7/31/00
EAFE Index 7.4 9.1 -11.1 -- -10.6
GSAM International 5.1 8.4 -12.1 -1.5 -2.9 3/31/98
EAFE Index 7.4 9.1 -11.1 -0.7 -2.7
Oechsle 14.9 10.2 -13.3 -- -13.1 7/31/00
EAFE Index 7.4 9.1 -11.1 -- -10.6
CG EmergingMarkets 18.1 29.9 -5.5 -- -4.7 7/31/00
MSCI EmergingMarkets Free Net 19.8 28.9 -1.7 -- -1.5
Templeton 12.9 26.6 0.2 11.0 0.5 12/31/95
MSCI EmergingMarkets Free Net 19.8 28.9 -1.7 11.6 -0.6
GSAM EmergingMarkets 22.9 29.5 -2.6 12.5 0.6 3/31/98
MSCI EmergingMarkets Free Net 19.8 28.9 -1.7 11.6 -0.6
Arrowstreet -12.5 -- -- -- -12.5 5/31/03
90-Day T-Bill + 4% 1.3 -- -- -- 1.3
Oaktree 1.5 7.6 -- -- 8.8 12/31/01
90-Day T-Bill + 4% 1.3 5.5 -- -- 5.7
ENDING 8/31/03RETURN SUMMARY
* Time period represents the total return for the fiscal fourth quarter ending 8/31/03.

$495 Million
FIXED INCOME SUMMARY
As of August 31, 2003
GENERAL ENDOWMENT FUND
Ennis Knupp + Associates 59
Since 1 Year Ending 3 Years Ending 5 Years Ending Inception5/31/03* 8/31/03 8/31/03 8/31/03 Since Inception Date
Total FixedIncome -3.0% 7.1% 8.3% 6.4% 11.2% 8/31/81
LB AggregateBond Index -2.9 4.4 8.2 6.6 10.6
ENDING 8/31/03RETURN SUMMARY
PIMCO 25.2%
GSAM U.S. Fixed Income 1.9%
In-House Short-Intermediate 20.2%
In-House Credit 20.6%
PIMCO International 32.2%
MANAGER ALLOCATION AS OF 8/31/03
The total fixed income asset class trailed the performance of the Index during the fiscal quarter by 0.1 percentage points,though exceeded it by 2.7 percentage points during the fiscal year.
The graph above details the manager allocations of the fixed income asset class as of August 31.
* Time period represents the total return for the fiscal fourth quarter ending 8/31/03.
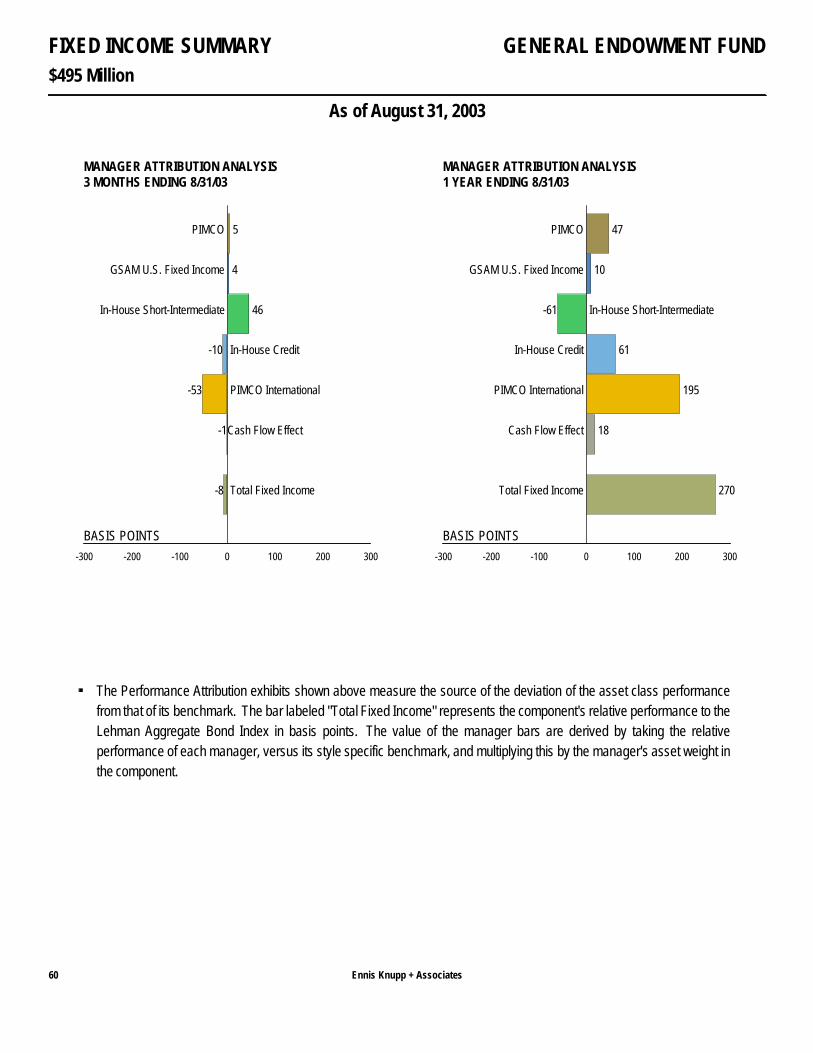
$495 Million
FIXED INCOME SUMMARY
As of August 31, 2003
GENERAL ENDOWMENT FUND
Ennis Knupp + Associates60
-300 -200 -100 0 100 200 300
BASIS POINTS
5 PIMCO
4 GSAM U.S. Fixed Income
46 In-House Short-Intermediate
-10 In-House Credit
-53 PIMCO International
-1Cash Flow Effect
-8 Total Fixed Income
3 MONTHS ENDING 8/31/03MANAGER ATTRIBUTION ANALYSIS
-300 -200 -100 0 100 200 300
BASIS POINTS
47 PIMCO
10 GSAM U.S. Fixed Income
-61 In-House Short-Intermediate
61 In-House Credit
195 PIMCO International
18Cash Flow Effect
270 Total Fixed Income
1 YEAR ENDING 8/31/03MANAGER ATTRIBUTION ANALYSIS
The Performance Attribution exhibits shown above measure the source of the deviation of the asset class performancefrom that of its benchmark. The bar labeled "Total Fixed Income" represents the component's relative performance to theLehman Aggregate Bond Index in basis points. The value of the manager bars are derived by taking the relativeperformance of each manager, versus its style specific benchmark, and multiplying this by the manager's asset weight inthe component.
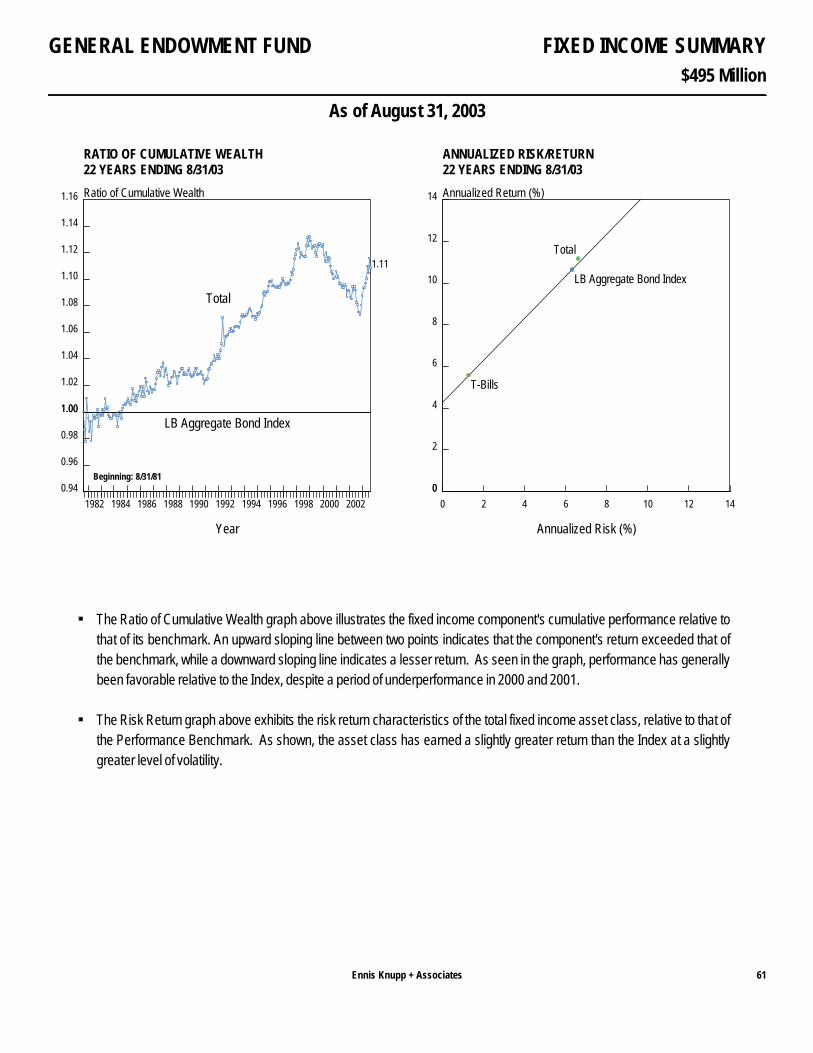
$495 Million
FIXED INCOME SUMMARY
As of August 31, 2003
GENERAL ENDOWMENT FUND
Ennis Knupp + Associates 61
1982 1984 1986 1988 1990 1992 1994 1996 1998 2000 2002
Year
1.00
1.02
1.04
1.06
1.08
1.10
1.12
1.14
1.16
1.00
0.98
0.96
0.94
Ratio of Cumulative Wealth
Total
LB Aggregate Bond Index
1.11
22 YEARS ENDING 8/31/03RATIO OF CUMULATIVE WEALTH
Beginning: 8/31/81
0 2 4 6 8 10 12 14
Annualized Risk (%)
0
2
4
6
8
10
12
14
0
Annualized Return (%)
T-Bills
LB Aggregate Bond Index
Total
22 YEARS ENDING 8/31/03ANNUALIZED RISK/RETURN
The Ratio of Cumulative Wealth graph above illustrates the fixed income component's cumulative performance relative tothat of its benchmark. An upward sloping line between two points indicates that the component's return exceeded that ofthe benchmark, while a downward sloping line indicates a lesser return. As seen in the graph, performance has generallybeen favorable relative to the Index, despite a period of underperformance in 2000 and 2001.
The Risk Return graph above exhibits the risk return characteristics of the total fixed income asset class, relative to that ofthe Performance Benchmark. As shown, the asset class has earned a slightly greater return than the Index at a slightlygreater level of volatility.

$495 Million
FIXED INCOME SUMMARY
As of August 31, 2003
GENERAL ENDOWMENT FUND
Ennis Knupp + Associates62
Total Fixed Income LB Aggregate Bond IndexReturn
Return Return Difference
1981 (4 months) 10.0% 10.5% -0.51982 32.8 32.6 0.21983 8.5 8.4 0.11984 16.3 15.1 1.21985 23.5 22.1 1.41986 15.0 15.3 -0.31987 4.3 2.8 1.51988 7.6 7.9 -0.31989 14.2 14.5 -0.31990 8.6 9.0 -0.41991 18.0 16.0 2.01992 9.4 7.4 2.01993 10.9 9.7 1.21994 -2.7 -2.9 0.21995 21.1 18.5 2.61996 3.6 3.6 0.01997 12.0 9.7 2.31998 9.6 8.7 0.91999 -1.3 -0.8 -0.52000 9.6 11.6 -2.02001 7.0 8.4 -1.42002 9.9 10.3 -0.42003 (8 months) 3.1 1.1 2.0
Trailing 1-Year 7.1% 4.4% 2.7Trailing 3-Year 8.3 8.2 0.1Trailing 5-Year 6.4 6.6 -0.2Trailing 10-Year 7.1 6.7 0.4Since Inception 11.2 10.6 0.6(8/31/81)
(BY YEAR)HISTORICAL RETURNS*
The table above compares the annual return history of the total fixed income component to that of the Lehman AggregateBond Index.
* The annual returns in this exhibit represent calendar-year periods.
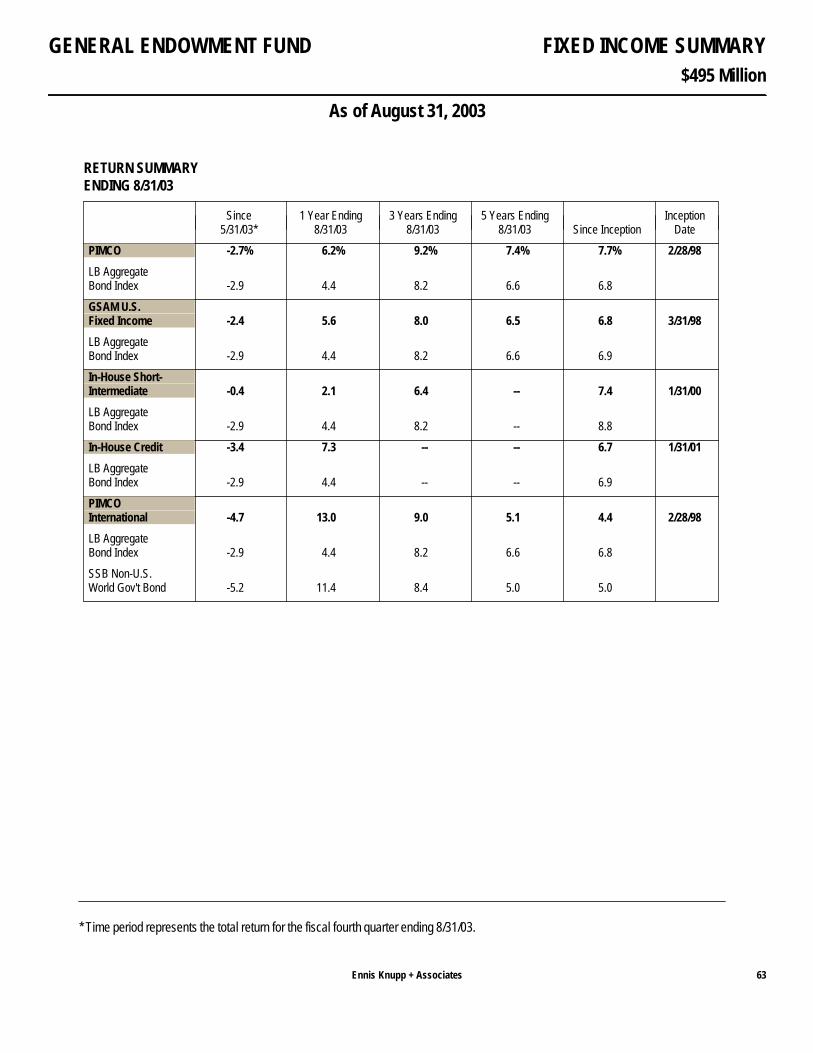
$495 Million
FIXED INCOME SUMMARY
As of August 31, 2003
GENERAL ENDOWMENT FUND
Ennis Knupp + Associates 63
Since 1 Year Ending 3 Years Ending 5 Years Ending Inception5/31/03* 8/31/03 8/31/03 8/31/03 Since Inception Date
PIMCO -2.7% 6.2% 9.2% 7.4% 7.7% 2/28/98
LB AggregateBond Index -2.9 4.4 8.2 6.6 6.8
GSAM U.S.Fixed Income -2.4 5.6 8.0 6.5 6.8 3/31/98
LB AggregateBond Index -2.9 4.4 8.2 6.6 6.9
In-House Short-Intermediate -0.4 2.1 6.4 -- 7.4 1/31/00
LB AggregateBond Index -2.9 4.4 8.2 -- 8.8
In-House Credit -3.4 7.3 -- -- 6.7 1/31/01
LB AggregateBond Index -2.9 4.4 -- -- 6.9
PIMCOInternational -4.7 13.0 9.0 5.1 4.4 2/28/98
LB AggregateBond Index -2.9 4.4 8.2 6.6 6.8
SSB Non-U.S.World Gov't Bond -5.2 11.4 8.4 5.0 5.0
ENDING 8/31/03RETURN SUMMARY
* Time period represents the total return for the fiscal fourth quarter ending 8/31/03.

$369 Million
ABSOLUTE RETURN HEDGE FUNDS SUMMARY
As of August 31, 2003
GENERAL ENDOWMENT FUND
Ennis Knupp + Associates64
Since 1 Year Ending 3 Years Ending 5 Years Ending Inception5/31/03* 8/31/03 8/31/03 8/31/03 Since Inception Date
Total AbsoluteReturn 4.6% 21.3% 11.3% 11.7% 10.3% 7/31/98
90-Day T-Bill + 4% 1.3 5.5 7.3 8.1 8.2
ENDING 8/31/03RETURN SUMMARY
Farallon 31.6%
Perry 34.6%
Protege Partners 12.3%
Satellite Fund V 21.5%
MANAGER ALLOCATION AS OF 8/31/03
The total absolute return asset class exceeded the performance of the benchmark during the fiscal quarter by 3.3percentage points, and exceeded it by 15.8 percentage points during the fiscal year.
The graph above details the manager allocations of the absolute return asset class as of August 31.
* Time period represents the total return for the fiscal fourth quarter ending 8/31/03.
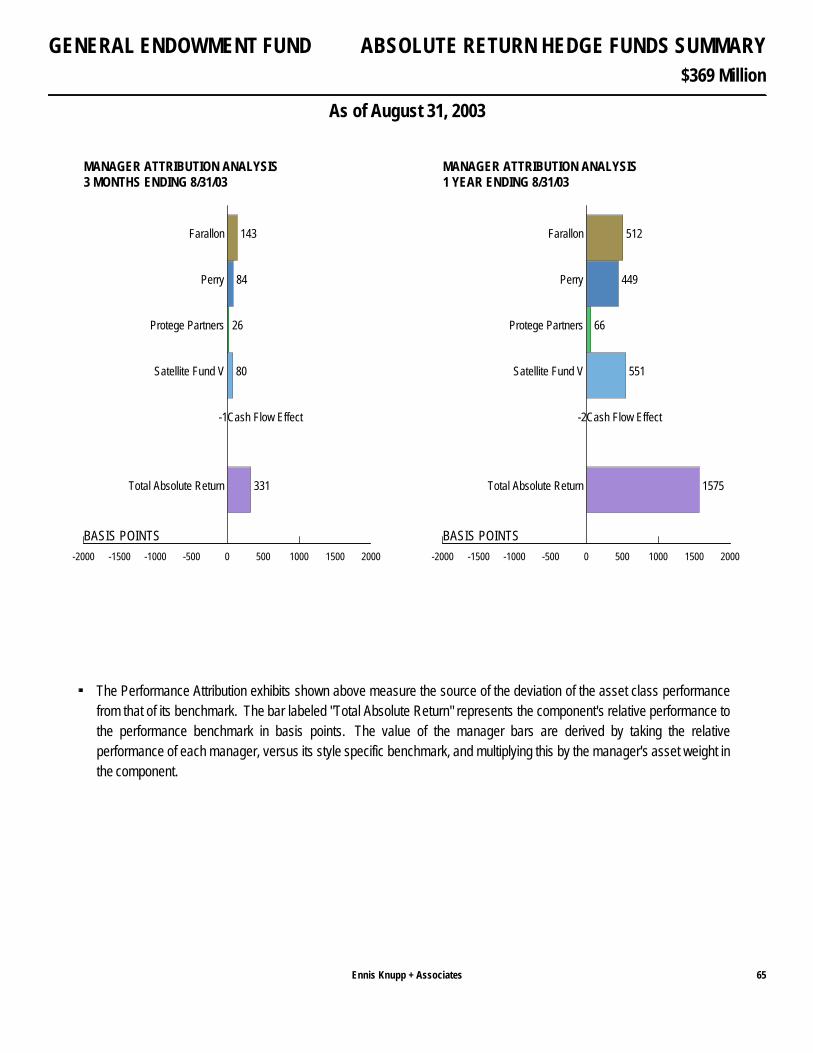
$369 Million
ABSOLUTE RETURN HEDGE FUNDS SUMMARY
As of August 31, 2003
GENERAL ENDOWMENT FUND
Ennis Knupp + Associates 65
-2000 -1500 -1000 -500 0 500 1000 1500 2000
BASIS POINTS
143 Farallon
84 Perry
26 Protege Partners
80 Satellite Fund V
-1Cash Flow Effect
331 Total Absolute Return
3 MONTHS ENDING 8/31/03MANAGER ATTRIBUTION ANALYSIS
-2000 -1500 -1000 -500 0 500 1000 1500 2000
BASIS POINTS
512 Farallon
449 Perry
66 Protege Partners
551 Satellite Fund V
-2Cash Flow Effect
1575 Total Absolute Return
1 YEAR ENDING 8/31/03MANAGER ATTRIBUTION ANALYSIS
The Performance Attribution exhibits shown above measure the source of the deviation of the asset class performancefrom that of its benchmark. The bar labeled "Total Absolute Return" represents the component's relative performance tothe performance benchmark in basis points. The value of the manager bars are derived by taking the relativeperformance of each manager, versus its style specific benchmark, and multiplying this by the manager's asset weight inthe component.

$369 Million
ABSOLUTE RETURN HEDGE FUNDS SUMMARY
As of August 31, 2003
GENERAL ENDOWMENT FUND
Ennis Knupp + Associates66
1999 2001 2003
Year
1.00
1.05
1.10
1.15
1.00
0.95
0.90
0.85
Ratio of Cumulative Wealth
Total
90-Day T-Bill + 4%
1.11
5 YEARS 1 MONTH ENDING 8/31/03RATIO OF CUMULATIVE WEALTH
Beginning: 7/31/98
0 2 4 6 8 10 12
Annualized Risk (%)
0
2
4
6
8
10
12
0
Annualized Return (%)
T-Bills
90-Day T-Bill + 4%
Total
5 YEARS 1 MONTH ENDING 8/31/03ANNUALIZED RISK/RETURN
The Ratio of Cumulative Wealth graph above illustrates the absolute return component's cumulative performance relativeto that of its benchmark. An upward sloping line between two points indicates that the component's return exceeded thatof the benchmark, while a downward sloping line indicates a lesser return. As seen in the graph, performance hasgenerally been favorable relative to the Index, despite a period of underperformance in 2002.
The Risk Return graph above exhibits the risk return characteristics of the absolute return asset class, relative to that ofthe benchmark. As shown, the asset class has earned a greater return than the benchmark at a greater level of volatility.
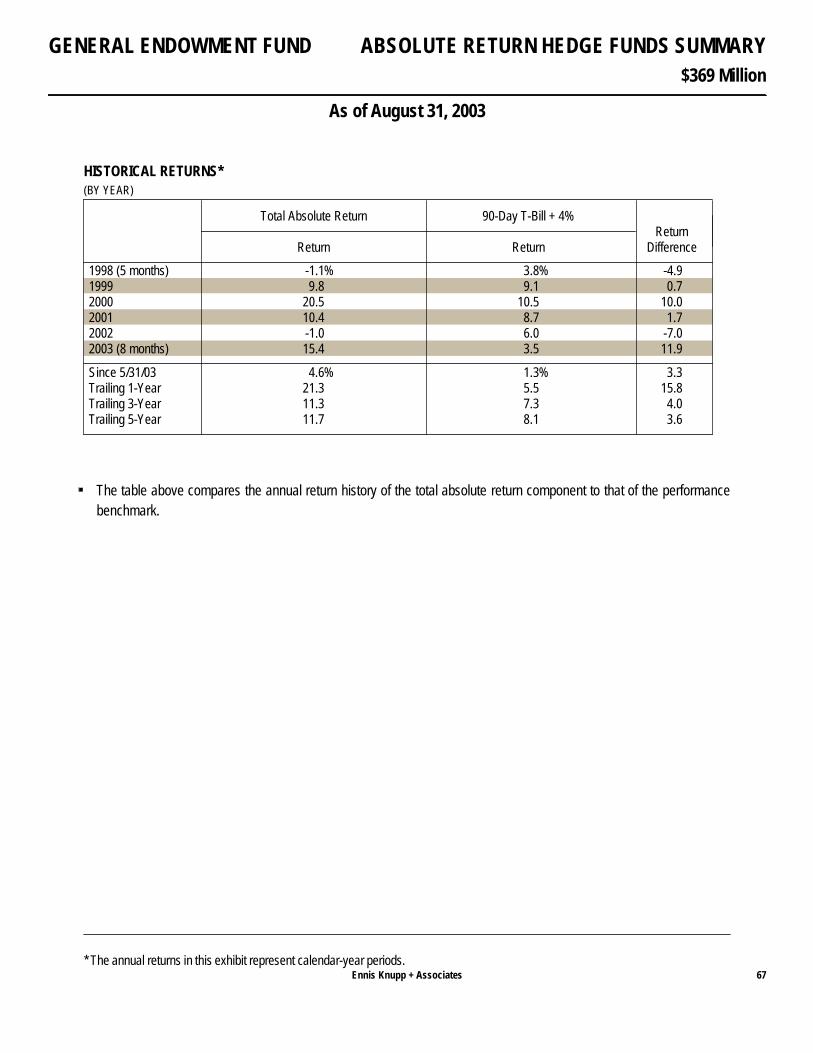
$369 Million
ABSOLUTE RETURN HEDGE FUNDS SUMMARY
As of August 31, 2003
GENERAL ENDOWMENT FUND
Ennis Knupp + Associates 67
Total Absolute Return 90-Day T-Bill + 4%Return
Return Return Difference
1998 (5 months) -1.1% 3.8% -4.91999 9.8 9.1 0.72000 20.5 10.5 10.02001 10.4 8.7 1.72002 -1.0 6.0 -7.02003 (8 months) 15.4 3.5 11.9
Since 5/31/03 4.6% 1.3% 3.3Trailing 1-Year 21.3 5.5 15.8Trailing 3-Year 11.3 7.3 4.0Trailing 5-Year 11.7 8.1 3.6
(BY YEAR)HISTORICAL RETURNS*
The table above compares the annual return history of the total absolute return component to that of the performancebenchmark.
* The annual returns in this exhibit represent calendar-year periods.

$369 Million
ABSOLUTE RETURN HEDGE FUNDS SUMMARY
As of August 31, 2003
GENERAL ENDOWMENT FUND
Ennis Knupp + Associates68
Since 1 Year Ending 3 Years Ending 5 Years Ending Inception5/31/03* 8/31/03 8/31/03 8/31/03 Since Inception Date
Farallon 5.9% 21.0% 12.5% 14.5% 13.3% 7/31/98
90-Day T-Bill + 4% 1.3 5.5 7.3 8.1 8.2
Perry 3.7 17.3 12.5 15.2 12.9 7/31/98
90-Day T-Bill + 4% 1.3 5.5 7.3 8.1 8.2
ProtegePartners 3.4 -- -- -- 7.8 2/28/03
90-Day T-Bill + 4% 1.3 -- -- -- 2.6
SatelliteFund V 5.0 31.4 5.5 -- 5.5 8/31/00
90-Day T-Bill + 4% 1.3 5.5 7.3 -- 7.3
ENDING 8/31/03RETURN SUMMARY
* Time period represents the total return for the fiscal fourth quarter ending 8/31/03.

$385 Million
PRIVATE CAPITAL SUMMARY
As of August 31, 2003
GENERAL ENDOWMENT FUND
Ennis Knupp + Associates 69
Since 1 Year Ending 3 Years Ending 5 Years Ending Inception5/31/03* 8/31/03 8/31/03 8/31/03 Since Inception Date
PrivateCapital 1.6% -6.6% -11.2% 3.6% 9.5% 11/30/86
Wilshire 5000Index + 4% 7.5 19.5 -7.0 7.7 15.4
ENDING 8/31/03RETURN SUMMARY
The private capital asset class trailed the performance of the benchmark during the fiscal quarter by 5.9 percentagepoints, and by 26.1 percentage points during the fiscal year.
The returns shown in the table above are reported on a time-weighted basis, consistent with the methodology used forreturns throughout this report. Time-weighted returns are calculated using monthly asset values and daily cash flows.Time-weighted rates of return are the industry standard for reporting the performance of traditional, marketableinvestments. For investments such as private equity, the time-weighted return calculation methodology suffers from anumber of flaws, including the attribution of control over cash flows to the investor rather than the investment manager. Inthese cases, the industry standard is to use the internal rate of return (IRR), which is the annualized rate of return impliedby a series of cash flows and a beginning and ending market value. The internal rates of return for the Private Capitalcomponent are shown in the table on the following page. Each return shown represents a since-inception return endingat a given fiscal year-end. For example, the 8.6% return shown for 2003 corresponds to a 8.6% annualized IRR for thesince-inception period ending at fiscal year-end 2003.
The benchmark results shown represent the return (IRR) earned on the actual cash flows experienced in the PrivateCapital portfolio, had they been invested in the Wilshire 5000 Index plus 4% annually.
* Time period represents the total return for the fiscal fourth quarter ending 8/31/03.
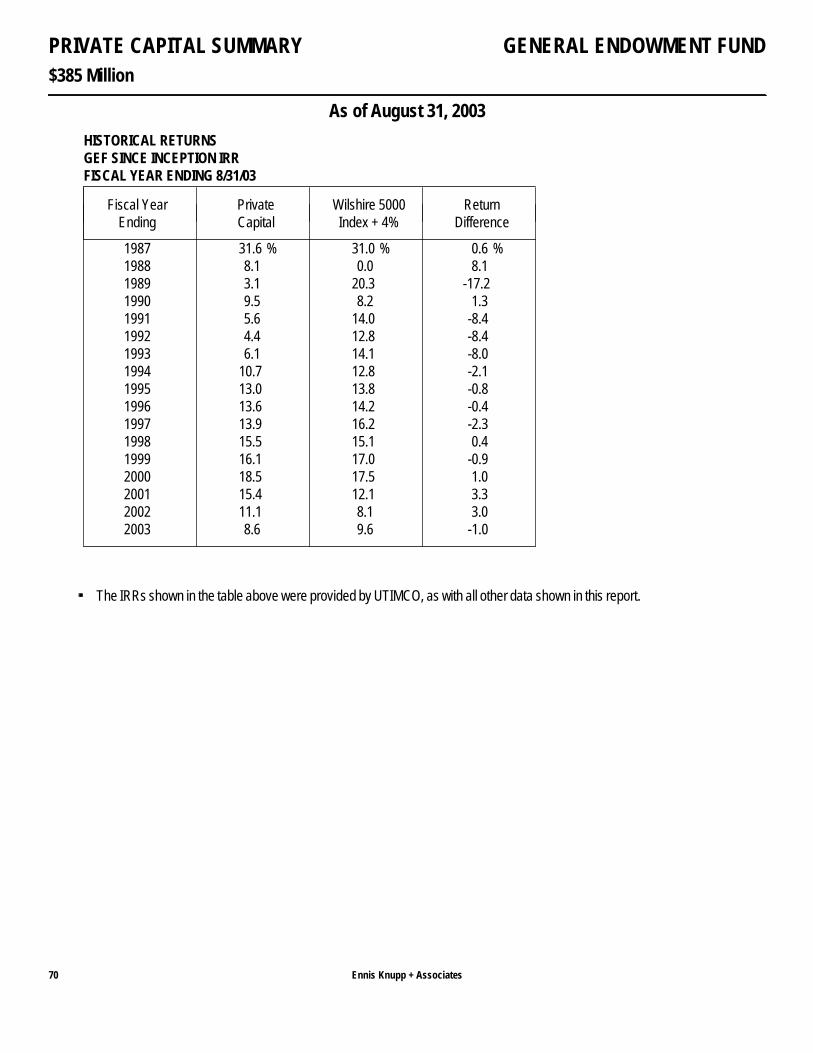
$385 Million
PRIVATE CAPITAL SUMMARY
As of August 31, 2003
GENERAL ENDOWMENT FUND
Ennis Knupp + Associates70
Fiscal Year Private Wilshire 5000 ReturnEnding Capital Index + 4% Difference
1987 31.6 % 31.0 % 0.6 %1988 8.1 0.0 8.11989 3.1 20.3 -17.21990 9.5 8.2 1.31991 5.6 14.0 -8.41992 4.4 12.8 -8.41993 6.1 14.1 -8.01994 10.7 12.8 -2.11995 13.0 13.8 -0.81996 13.6 14.2 -0.41997 13.9 16.2 -2.31998 15.5 15.1 0.41999 16.1 17.0 -0.92000 18.5 17.5 1.02001 15.4 12.1 3.32002 11.1 8.1 3.02003 8.6 9.6 -1.0
HISTORICAL RETURNS GEF SINCE INCEPTION IRR FISCAL YEAR ENDING 8/31/03
The IRRs shown in the table above were provided by UTIMCO, as with all other data shown in this report.
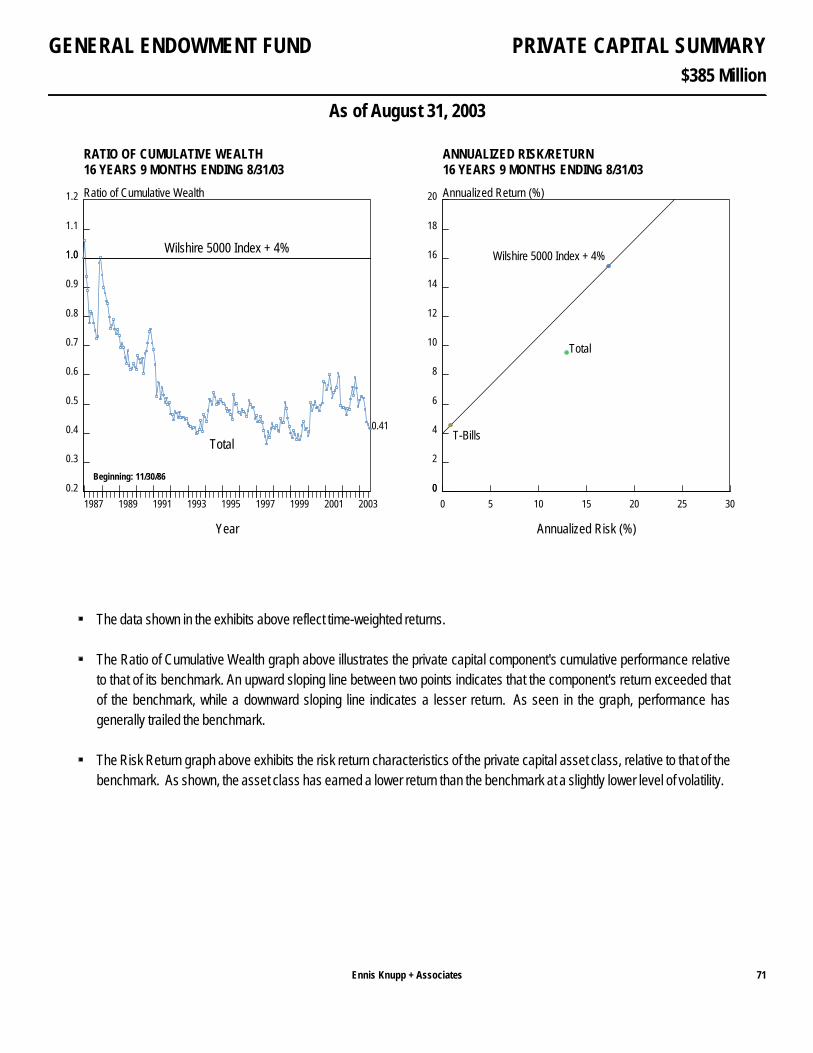
$385 Million
PRIVATE CAPITAL SUMMARY
As of August 31, 2003
GENERAL ENDOWMENT FUND
Ennis Knupp + Associates 71
1987 1989 1991 1993 1995 1997 1999 2001 2003
Year
1.0
1.1
1.2
1.0
0.9
0.8
0.7
0.6
0.5
0.4
0.3
0.2
Ratio of Cumulative Wealth
Total
Wilshire 5000 Index + 4%
0.41
16 YEARS 9 MONTHS ENDING 8/31/03RATIO OF CUMULATIVE WEALTH
Beginning: 11/30/86
0 5 10 15 20 25 30
Annualized Risk (%)
0
2
4
6
8
10
12
14
16
18
20
0
Annualized Return (%)
T-Bills
Wilshire 5000 Index + 4%
Total
16 YEARS 9 MONTHS ENDING 8/31/03ANNUALIZED RISK/RETURN
The data shown in the exhibits above reflect time-weighted returns.
The Ratio of Cumulative Wealth graph above illustrates the private capital component's cumulative performance relativeto that of its benchmark. An upward sloping line between two points indicates that the component's return exceeded thatof the benchmark, while a downward sloping line indicates a lesser return. As seen in the graph, performance hasgenerally trailed the benchmark.
The Risk Return graph above exhibits the risk return characteristics of the private capital asset class, relative to that of thebenchmark. As shown, the asset class has earned a lower return than the benchmark at a slightly lower level of volatility.

$385 Million
PRIVATE CAPITAL SUMMARY
As of August 31, 2003
GENERAL ENDOWMENT FUND
Ennis Knupp + Associates72
Private Capital Wilshire 5000 Index + 4%Return
Return Return Difference
1986 (1 month) 3.6% -2.1% 5.71987 -5.4 6.5 -11.91988 -4.3 22.7 -27.01989 12.7 34.3 -21.61990 8.8 -2.3 11.11991 -5.7 39.5 -45.21992 5.5 13.4 -7.91993 21.8 15.8 6.01994 15.9 4.0 11.91995 31.5 41.9 -10.41996 23.5 26.1 -2.61997 24.3 36.5 -12.21998 22.4 28.4 -6.01999 25.1 28.5 -3.42000 36.4 -7.2 43.62001 -21.0 -7.3 -13.72002 -13.1 -17.6 4.52003 (8 months) -2.1 21.5 -23.6
Since 5/31/03 1.6% 7.5% -5.9Trailing 1-Year -6.6 19.5 -26.1Trailing 3-Year -11.2 -7.0 -4.2Trailing 5-Year 3.6 7.7 -4.1Trailing 10-Year 14.1 14.1 0.0
(BY YEAR)HISTORICAL RETURNS*
The returns shown in the table above reflect time-weighted returns.
The table above compares the annual return history of private capital to that of its performance benchmark.
* The annual returns in this exhibit represent calendar-year periods.
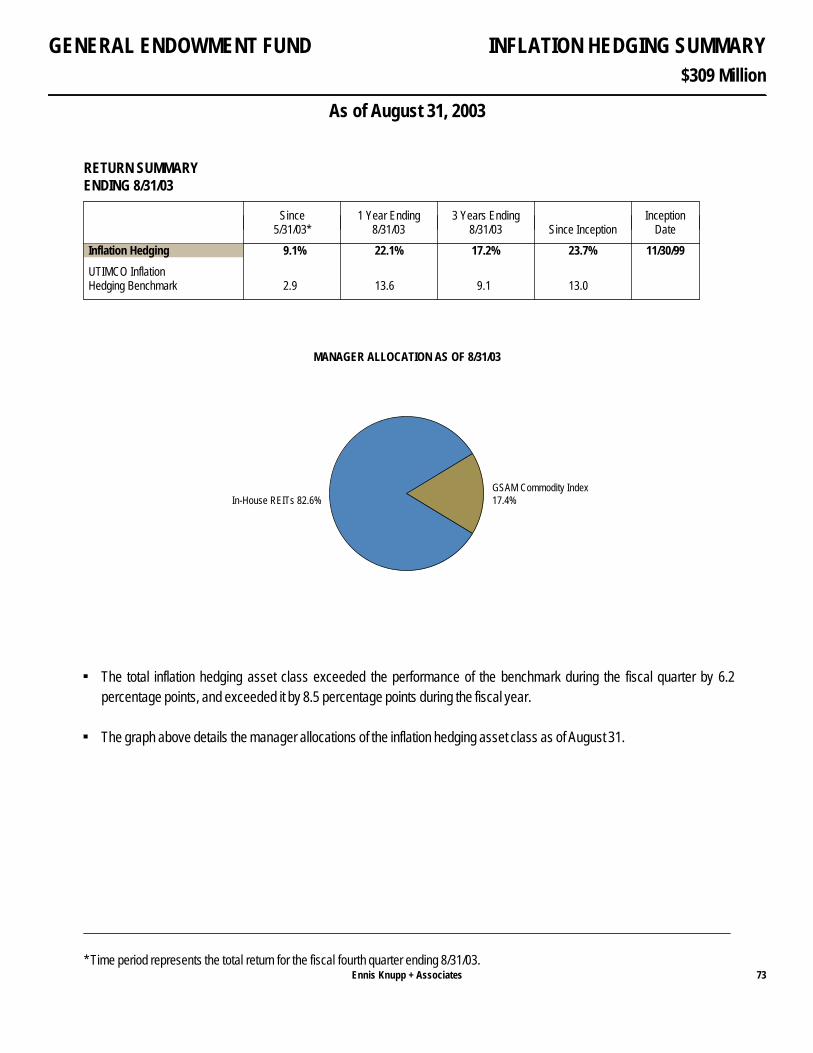
$309 Million
INFLATION HEDGING SUMMARY
As of August 31, 2003
GENERAL ENDOWMENT FUND
Ennis Knupp + Associates 73
Since 1 Year Ending 3 Years Ending Inception5/31/03* 8/31/03 8/31/03 Since Inception Date
Inflation Hedging 9.1% 22.1% 17.2% 23.7% 11/30/99
UTIMCO InflationHedging Benchmark 2.9 13.6 9.1 13.0
ENDING 8/31/03RETURN SUMMARY
GSAM Commodity Index17.4%In-House REITs 82.6%
MANAGER ALLOCATION AS OF 8/31/03
The total inflation hedging asset class exceeded the performance of the benchmark during the fiscal quarter by 6.2percentage points, and exceeded it by 8.5 percentage points during the fiscal year.
The graph above details the manager allocations of the inflation hedging asset class as of August 31.
* Time period represents the total return for the fiscal fourth quarter ending 8/31/03.

$309 Million
INFLATION HEDGING SUMMARY
As of August 31, 2003
GENERAL ENDOWMENT FUND
Ennis Knupp + Associates74
-1000 -800 -600 -400 -200 0 200 400 600 800 1000
BASIS POINTS
9 GSAM Commodity Index
79 In-House REITs
531Benchmark Effect
618 Inflation Hedging
3 MONTHS ENDING 8/31/03MANAGER ATTRIBUTION ANALYSIS
-1000 -800 -600 -400 -200 0 200 400 600 800 1000
BASIS POINTS
20 GSAM Commodity Index
242 In-House REITs
-90 Cash Flow Effect
685Benchmark Effect
858 Inflation Hedging
1 YEAR ENDING 8/31/03MANAGER ATTRIBUTION ANALYSIS
The Performance Attribution exhibits shown above measure the source of the deviation of the asset class performancefrom that of its benchmark. The bar labeled "Total Inflation Hedging" represents the component's relative performance tothe performance benchmark in basis points. The value of the manager bars are derived by taking the relativeperformance of each manager, versus its style specific benchmark, and multiplying this by the manager's asset weight inthe component. The bar labeled "Benchmark Effect" represents the difference between the benchmarks of the individualmanagers and the UTIMCO inflation hedging benchmark.

$309 Million
INFLATION HEDGING SUMMARY
As of August 31, 2003
GENERAL ENDOWMENT FUND
Ennis Knupp + Associates 75
2000 2001 2002 2003
Year
1.0
1.1
1.2
1.3
1.4
1.5
1.0
0.9
Ratio of Cumulative Wealth
Total
UTIMCO Inflation Hedging Benchmark
1.40
3 YEARS 9 MONTHS ENDING 8/31/03RATIO OF CUMULATIVE WEALTH
Beginning: 11/30/99
0 2 4 6 8 10 12 14
Annualized Risk (%)
0
5
10
15
20
25
30
0
Annualized Return (%)
T-Bills
UTIMCO InflationHedging Benchmark
Total
3 YEARS 9 MONTHS ENDING 8/31/03ANNUALIZED RISK/RETURN
The Ratio of Cumulative Wealth graph above illustrates the inflation hedging component's cumulative performancerelative to that of its benchmark. An upward sloping line between two points indicates that the component's returnexceeded that of the benchmark, while a downward sloping line indicates a lesser return. As seen in the graph,performance has generally been favorable relative to the Index.
The Risk Return graph above exhibits the risk return characteristics of the inflation hedging asset class, relative to that ofthe benchmark. As shown, the asset class has earned a greater return than the benchmark at a greater level of volatility.

$309 Million
INFLATION HEDGING SUMMARY
As of August 31, 2003
GENERAL ENDOWMENT FUND
Ennis Knupp + Associates76
Inflation Hedging UTIMCO Inflation Hedging BenchmarkReturn
Return Return Difference
1999 (1 month) 2.8% 2.0% 0.82000 43.5 26.0 17.52001 11.9 -2.5 14.42002 11.5 13.9 -2.42003 (8 months) 20.8 10.9 9.9
Since 5/31/03 9.1% 2.9% 6.2Trailing 1-Year 22.1 13.6 8.5Trailing 3-Year 17.2 9.1 8.1
(BY YEAR)HISTORICAL RETURNS*
The table above compares the annual return history of the inflation hedging component to that of the performancebenchmark.
* The annual returns in this exhibit represent calendar-year periods.

$309 Million
INFLATION HEDGING SUMMARY
As of August 31, 2003
GENERAL ENDOWMENT FUND
Ennis Knupp + Associates 77
Since 1 Year Ending 3 Years Ending Inception5/31/03* 8/31/03 8/31/03 Since Inception Date
GSAM Commodity Index 5.3% 21.8% --% 27.3% 3/31/02
Goldman SachsCommodity Index - 1% 4.8 20.8 -- 19.2
In-House REITs 9.9 21.0 15.8 13.8 4/30/93
Wilshire Real EstateSecurities Index 9.0 17.3 14.1 10.4
ENDING 8/31/03RETURN SUMMARY
* Time period represents the total return for the fiscal fourth quarter ending 8/31/03.

(This page left blank intentionally)
78

OPERATING FUNDS
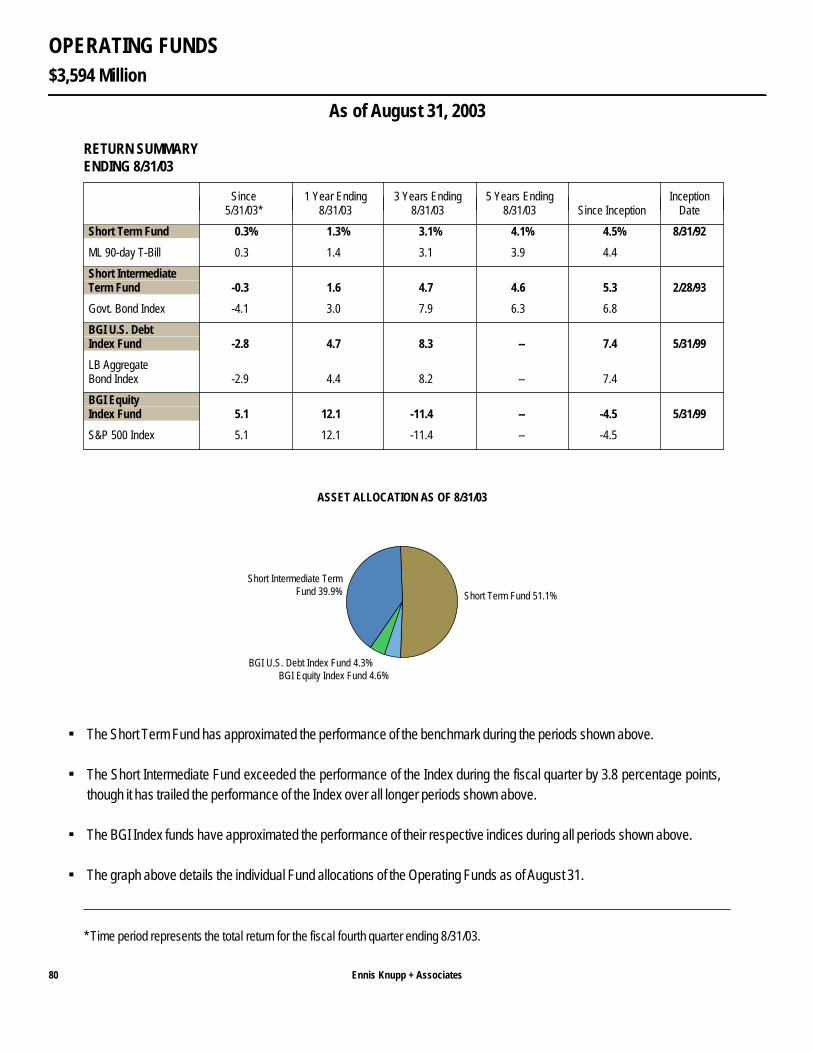
$3,594 Million
OPERATING FUNDS
As of August 31, 2003
Ennis Knupp + Associates80
Since 1 Year Ending 3 Years Ending 5 Years Ending Inception5/31/03* 8/31/03 8/31/03 8/31/03 Since Inception Date
Short Term Fund 0.3% 1.3% 3.1% 4.1% 4.5% 8/31/92
ML 90-day T-Bill 0.3 1.4 3.1 3.9 4.4
Short IntermediateTerm Fund -0.3 1.6 4.7 4.6 5.3 2/28/93
Govt. Bond Index -4.1 3.0 7.9 6.3 6.8
BGI U.S. DebtIndex Fund -2.8 4.7 8.3 -- 7.4 5/31/99
LB AggregateBond Index -2.9 4.4 8.2 -- 7.4
BGI EquityIndex Fund 5.1 12.1 -11.4 -- -4.5 5/31/99
S&P 500 Index 5.1 12.1 -11.4 -- -4.5
ENDING 8/31/03RETURN SUMMARY
Short Term Fund 51.1%
Short Intermediate TermFund 39.9%
BGI U.S. Debt Index Fund 4.3%BGI Equity Index Fund 4.6%
ASSET ALLOCATION AS OF 8/31/03
The Short Term Fund has approximated the performance of the benchmark during the periods shown above.
The Short Intermediate Fund exceeded the performance of the Index during the fiscal quarter by 3.8 percentage points,though it has trailed the performance of the Index over all longer periods shown above.
The BGI Index funds have approximated the performance of their respective indices during all periods shown above.
The graph above details the individual Fund allocations of the Operating Funds as of August 31.
* Time period represents the total return for the fiscal fourth quarter ending 8/31/03.
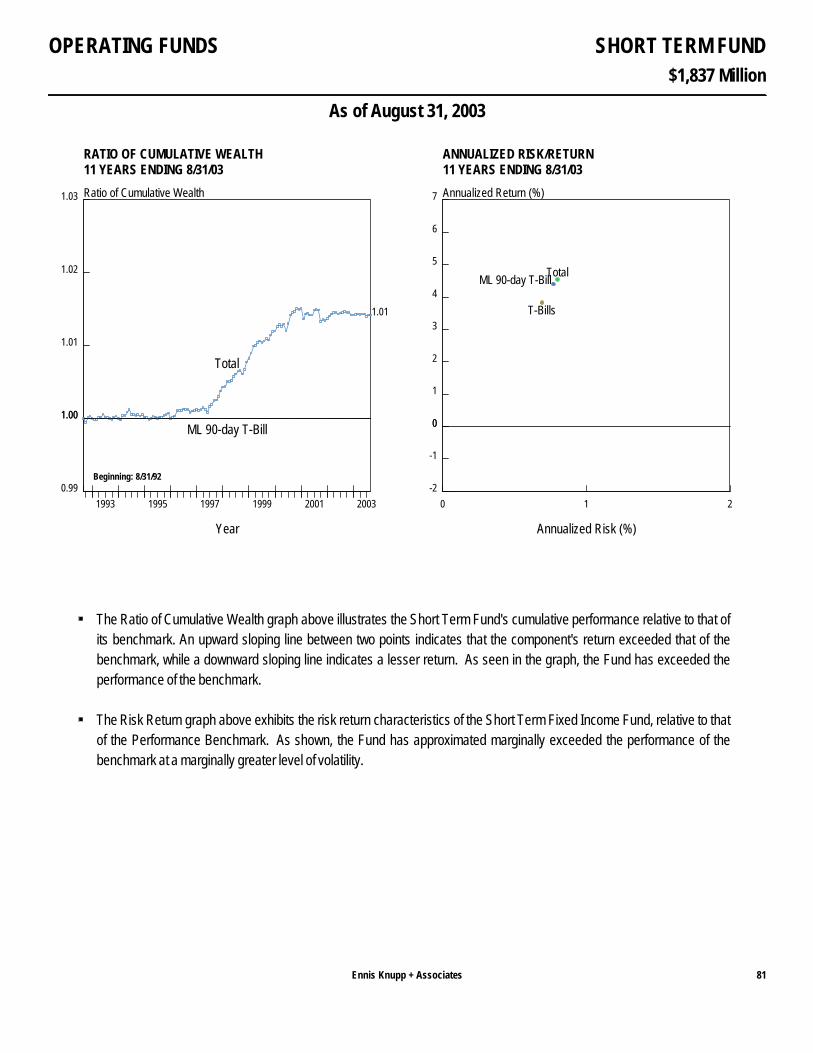
$1,837 Million
SHORT TERM FUND
As of August 31, 2003
OPERATING FUNDS
Ennis Knupp + Associates 81
1993 1995 1997 1999 2001 2003
Year
1.00
1.01
1.02
1.03
1.00
0.99
Ratio of Cumulative Wealth
Total
ML 90-day T-Bill
1.01
11 YEARS ENDING 8/31/03RATIO OF CUMULATIVE WEALTH
Beginning: 8/31/92
0 1 2
Annualized Risk (%)
0
1
2
3
4
5
6
7
0
-1
-2
Annualized Return (%)
T-Bills
ML 90-day T-BillTotal
11 YEARS ENDING 8/31/03ANNUALIZED RISK/RETURN
The Ratio of Cumulative Wealth graph above illustrates the Short Term Fund's cumulative performance relative to that ofits benchmark. An upward sloping line between two points indicates that the component's return exceeded that of thebenchmark, while a downward sloping line indicates a lesser return. As seen in the graph, the Fund has exceeded theperformance of the benchmark.
The Risk Return graph above exhibits the risk return characteristics of the Short Term Fixed Income Fund, relative to thatof the Performance Benchmark. As shown, the Fund has approximated marginally exceeded the performance of thebenchmark at a marginally greater level of volatility.
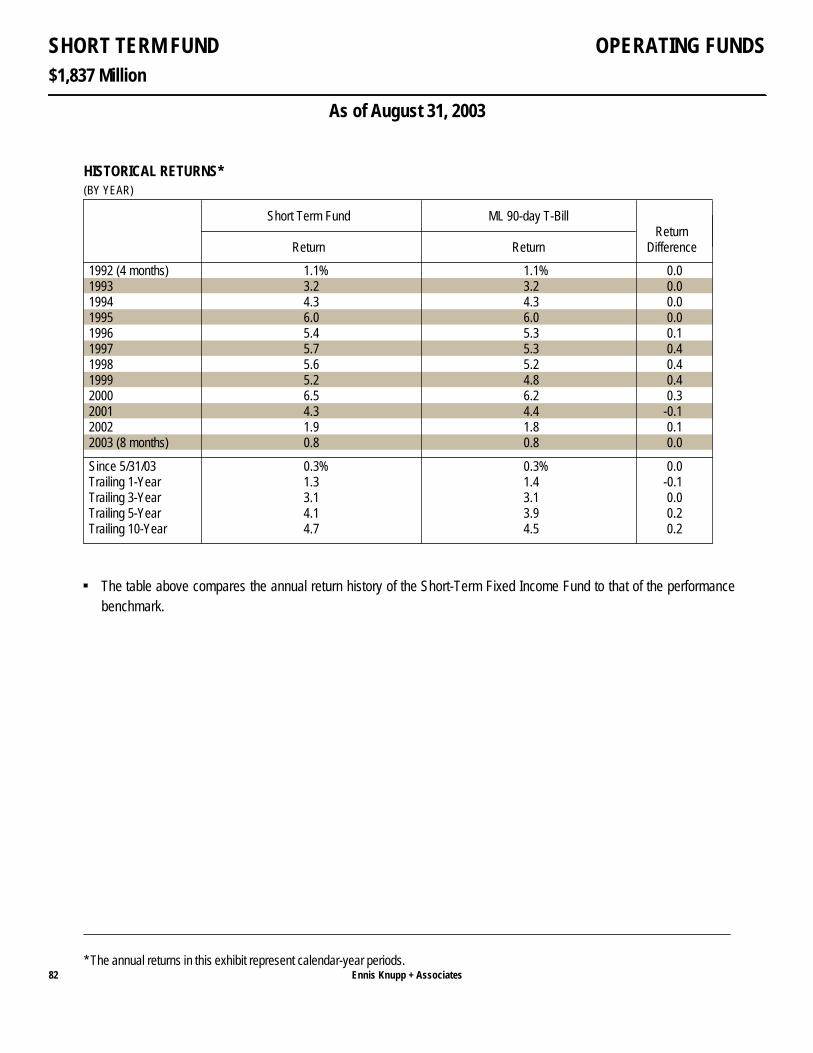
$1,837 Million
SHORT TERM FUND
As of August 31, 2003
OPERATING FUNDS
Ennis Knupp + Associates82
Short Term Fund ML 90-day T-BillReturn
Return Return Difference
1992 (4 months) 1.1% 1.1% 0.01993 3.2 3.2 0.01994 4.3 4.3 0.01995 6.0 6.0 0.01996 5.4 5.3 0.11997 5.7 5.3 0.41998 5.6 5.2 0.41999 5.2 4.8 0.42000 6.5 6.2 0.32001 4.3 4.4 -0.12002 1.9 1.8 0.12003 (8 months) 0.8 0.8 0.0
Since 5/31/03 0.3% 0.3% 0.0Trailing 1-Year 1.3 1.4 -0.1Trailing 3-Year 3.1 3.1 0.0Trailing 5-Year 4.1 3.9 0.2Trailing 10-Year 4.7 4.5 0.2
(BY YEAR)HISTORICAL RETURNS*
The table above compares the annual return history of the Short-Term Fixed Income Fund to that of the performancebenchmark.
* The annual returns in this exhibit represent calendar-year periods.
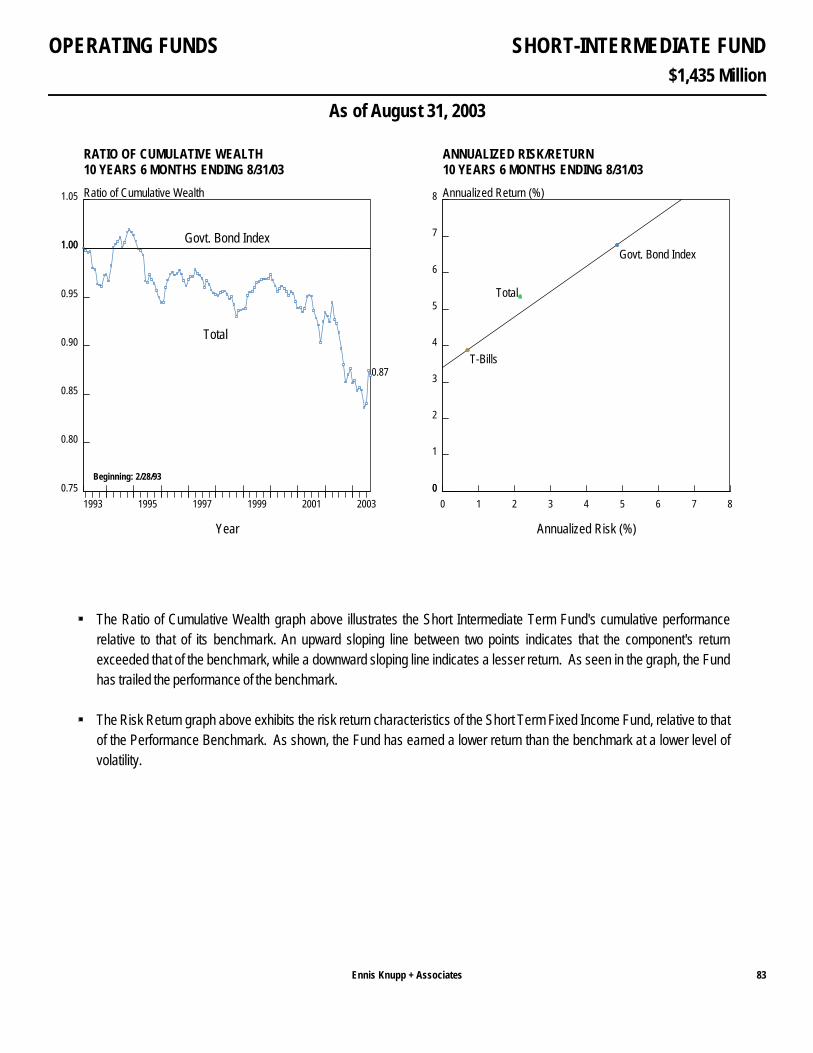
$1,435 Million
SHORT-INTERMEDIATE FUND
As of August 31, 2003
OPERATING FUNDS
Ennis Knupp + Associates 83
1993 1995 1997 1999 2001 2003
Year
1.00
1.05
1.00
0.95
0.90
0.85
0.80
0.75
Ratio of Cumulative Wealth
Total
Govt. Bond Index
0.87
10 YEARS 6 MONTHS ENDING 8/31/03RATIO OF CUMULATIVE WEALTH
Beginning: 2/28/93
0 1 2 3 4 5 6 7 8
Annualized Risk (%)
0
1
2
3
4
5
6
7
8
0
Annualized Return (%)
T-Bills
Govt. Bond Index
Total
10 YEARS 6 MONTHS ENDING 8/31/03ANNUALIZED RISK/RETURN
The Ratio of Cumulative Wealth graph above illustrates the Short Intermediate Term Fund's cumulative performancerelative to that of its benchmark. An upward sloping line between two points indicates that the component's returnexceeded that of the benchmark, while a downward sloping line indicates a lesser return. As seen in the graph, the Fundhas trailed the performance of the benchmark.
The Risk Return graph above exhibits the risk return characteristics of the Short Term Fixed Income Fund, relative to thatof the Performance Benchmark. As shown, the Fund has earned a lower return than the benchmark at a lower level ofvolatility.
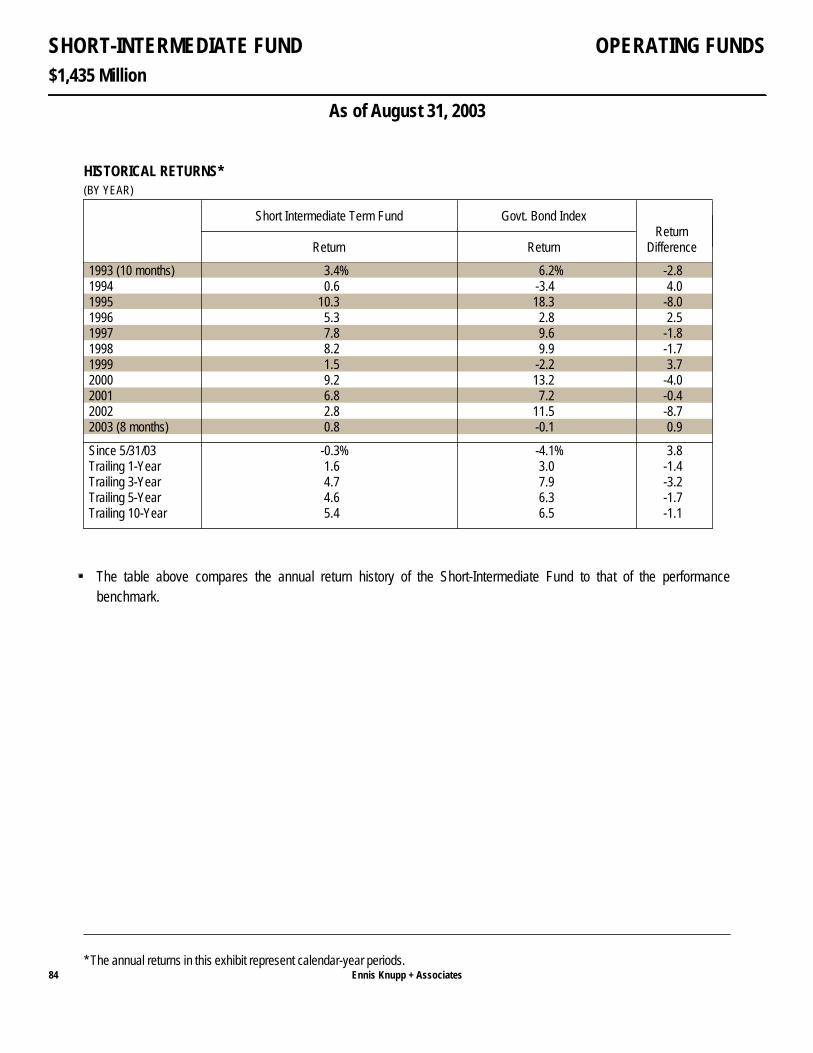
$1,435 Million
SHORT-INTERMEDIATE FUND
As of August 31, 2003
OPERATING FUNDS
Ennis Knupp + Associates84
Short Intermediate Term Fund Govt. Bond IndexReturn
Return Return Difference
1993 (10 months) 3.4% 6.2% -2.81994 0.6 -3.4 4.01995 10.3 18.3 -8.01996 5.3 2.8 2.51997 7.8 9.6 -1.81998 8.2 9.9 -1.71999 1.5 -2.2 3.72000 9.2 13.2 -4.02001 6.8 7.2 -0.42002 2.8 11.5 -8.72003 (8 months) 0.8 -0.1 0.9
Since 5/31/03 -0.3% -4.1% 3.8Trailing 1-Year 1.6 3.0 -1.4Trailing 3-Year 4.7 7.9 -3.2Trailing 5-Year 4.6 6.3 -1.7Trailing 10-Year 5.4 6.5 -1.1
(BY YEAR)HISTORICAL RETURNS*
The table above compares the annual return history of the Short-Intermediate Fund to that of the performancebenchmark.
* The annual returns in this exhibit represent calendar-year periods.

$166 Million
BGI EQUITY INDEX FUND
As of August 31, 2003
OPERATING FUNDS
Ennis Knupp + Associates 85
1999 2001 2003
Year
1.00
1.01
1.02
1.03
1.04
1.05
1.00
0.99
0.98
0.97
0.96
0.95
Ratio of Cumulative Wealth
Total
S&P 500 Index1.00
4 YEARS 3 MONTHS ENDING 8/31/03RATIO OF CUMULATIVE WEALTH
Beginning: 5/31/99
0 2 4 6 8 10 12 14 16 18 20 22 24
Annualized Risk (%)
0
2
4
6
0
-2
-4
-6
-8
Annualized Return (%)
T-Bills
S&P 500 IndexTotal
4 YEARS 3 MONTHS ENDING 8/31/03ANNUALIZED RISK/RETURN
The Ratio of Cumulative Wealth graph above illustrates the BGI Equity Index Fund's cumulative performance relative tothat of its benchmark. An upward sloping line between two points indicates that the component's return exceeded that ofthe benchmark, while a downward sloping line indicates a lesser return. As seen in the graph, the Fund approximated theperformance of the benchmark.
The Risk Return graph above exhibits the risk return characteristics of the BGI Equity Index Fund, relative to that of thebenchmark. As shown, the Fund has approximated the return and volatility of the benchmark.
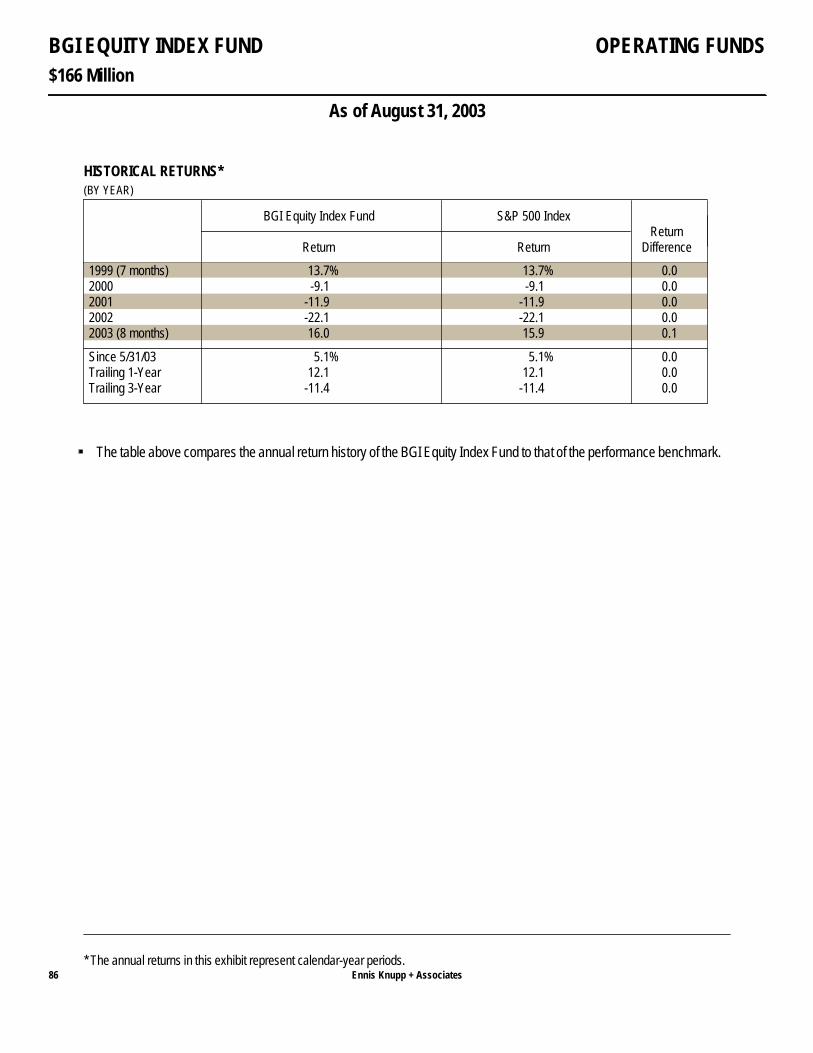
$166 Million
BGI EQUITY INDEX FUND
As of August 31, 2003
OPERATING FUNDS
Ennis Knupp + Associates86
BGI Equity Index Fund S&P 500 IndexReturn
Return Return Difference
1999 (7 months) 13.7% 13.7% 0.02000 -9.1 -9.1 0.02001 -11.9 -11.9 0.02002 -22.1 -22.1 0.02003 (8 months) 16.0 15.9 0.1
Since 5/31/03 5.1% 5.1% 0.0Trailing 1-Year 12.1 12.1 0.0Trailing 3-Year -11.4 -11.4 0.0
(BY YEAR)HISTORICAL RETURNS*
The table above compares the annual return history of the BGI Equity Index Fund to that of the performance benchmark.
* The annual returns in this exhibit represent calendar-year periods.
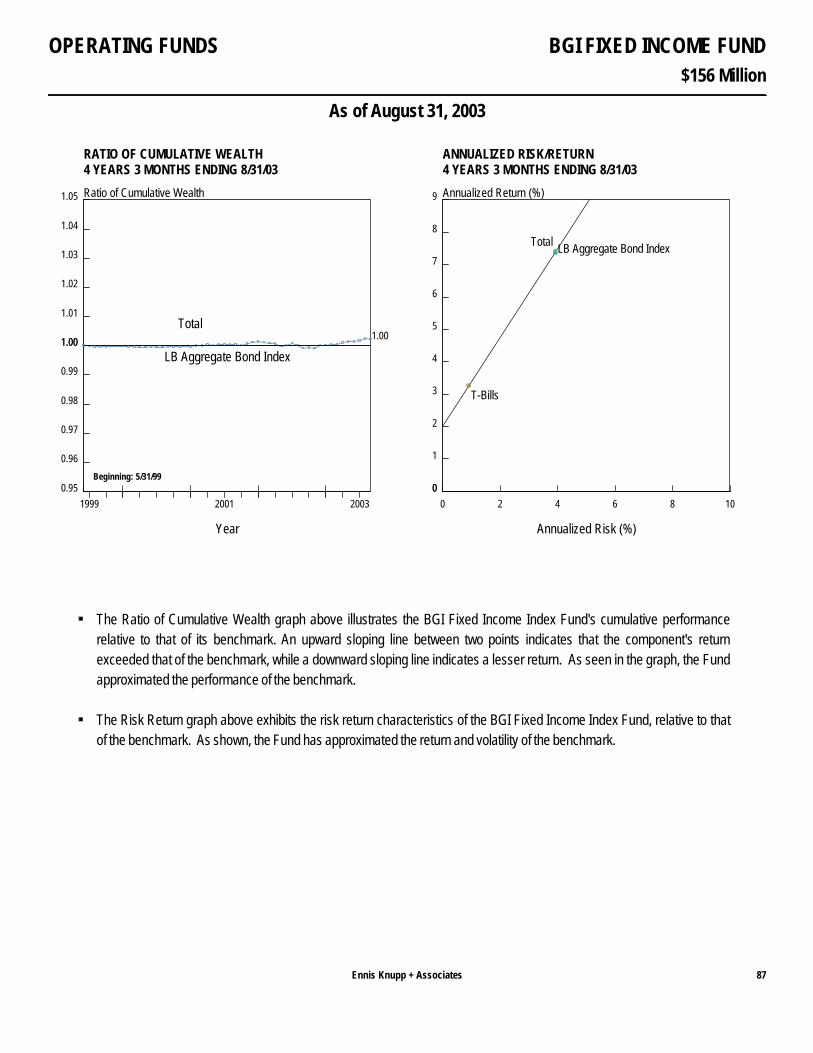
$156 Million
BGI FIXED INCOME FUND
As of August 31, 2003
OPERATING FUNDS
Ennis Knupp + Associates 87
1999 2001 2003
Year
1.00
1.01
1.02
1.03
1.04
1.05
1.00
0.99
0.98
0.97
0.96
0.95
Ratio of Cumulative Wealth
Total
LB Aggregate Bond Index
1.00
4 YEARS 3 MONTHS ENDING 8/31/03RATIO OF CUMULATIVE WEALTH
Beginning: 5/31/99
0 2 4 6 8 10
Annualized Risk (%)
0
1
2
3
4
5
6
7
8
9
0
Annualized Return (%)
T-Bills
LB Aggregate Bond IndexTotal
4 YEARS 3 MONTHS ENDING 8/31/03ANNUALIZED RISK/RETURN
The Ratio of Cumulative Wealth graph above illustrates the BGI Fixed Income Index Fund's cumulative performancerelative to that of its benchmark. An upward sloping line between two points indicates that the component's returnexceeded that of the benchmark, while a downward sloping line indicates a lesser return. As seen in the graph, the Fundapproximated the performance of the benchmark.
The Risk Return graph above exhibits the risk return characteristics of the BGI Fixed Income Index Fund, relative to thatof the benchmark. As shown, the Fund has approximated the return and volatility of the benchmark.

$156 Million
BGI FIXED INCOME FUND
As of August 31, 2003
OPERATING FUNDS
Ennis Knupp + Associates88
BGI U.S. Debt Index Fund LB Aggregate Bond IndexReturn
Return Return Difference
1999 (7 months) 0.2% 0.2% 0.02000 11.6 11.6 0.02001 8.6 8.4 0.22002 10.1 10.3 -0.22003 (8 months) 1.3 1.1 0.2
Since 5/31/03 -2.8% -2.9% 0.1Trailing 1-Year 4.7 4.4 0.3Trailing 3-Year 8.3 8.2 0.1
(BY YEAR)HISTORICAL RETURNS*
The table above compares the annual return history of the BGI Fixed Income Index Fund to that of the Lehman AggregateBond Index.
* The annual returns in this exhibit represent calendar-year periods.

RETURNS OF THE MAJOR CAPITAL MARKETS
APPENDIX I
Ennis Knupp + Associates 89
Annualized Periods Ending 8/31/03Fiscal
Quarter 1-Year 3-Year 5-Year 10-Year
Stock Indices:
Wilshire 5000 Index 6.4% 14.9% -10.6% 3.5% 9.6%
S&P 500 Index 5.1 12.1 -11.4 2.5 10.1
Russell Top 200 Value Index 3.0 9.7 -4.9 3.6 10.2
Russell Top 200 Growth Index 5.4 10.3 -22.2 -2.3 9.0
Russell MidCap Value Index 7.5 16.2 7.2 9.8 11.5
Russell MidCap Growth Index 10.8 30.4 -18.1 6.4 8.8
Russell 2000 Value Index 10.8 23.7 11.3 12.3 11.7
Russell 2000 Growth Index 15.5 34.9 -13.4 5.3 5.1
Bond Indices:
Lehman Brothers Aggregate -2.9% 4.4% 8.2% 6.6% 6.7%
Lehman Brothers Gov't/Credit -3.9 5.5 8.6 6.6 6.7
Lehman Brothers Long-Term Gov't/Credit -8.2 6.1 9.3 6.6 7.4
Lehman Brothers Intermed. Gov't/Credit -2.6 5.2 8.4 6.7 6.4
Lehman Brothers Mortgage-Backed -1.0 2.5 7.4 6.4 6.7
Lehman Brothers 1-3 Yr Gov't -0.4 2.6 6.3 5.7 5.7
Lehman Brothers Universal -2.5 5.8 8.2 6.8 6.7
Foreign Indices:
MSCI All Country World ex-U.S. Index 8.6% 11.8% -10.3% 0.8% 2.5%
MSCI EAFE Free 7.4 9.1 -11.1 -0.7 2.4
MSCI Emerging Markets Free Net 19.8 28.9 -1.7 11.6 1.4
MSCI Hedged EAFE Foreign Stock Index 10.9 0.9 -14.3 -0.7 4.0
SSB Non-U.S. World Gov't Bond -5.2 11.4 8.4 5.0 5.6
SSB Non-U.S. World Gov't Bond - Hedged -2.3 3.5 6.1 5.8 7.8
Cash Equivalents:
Treasury Bills (30-Day) 0.2% 1.0% 2.6% 3.4% 3.9%
EnnisKnupp STIF Index 0.3 1.6 3.3 4.2 4.7
Inflation Index
Consumer Price Index 0.6% 2.2% 2.2% 2.5% 2.5%
RETURNS OF THE MAJOR CAPITAL MARKETS
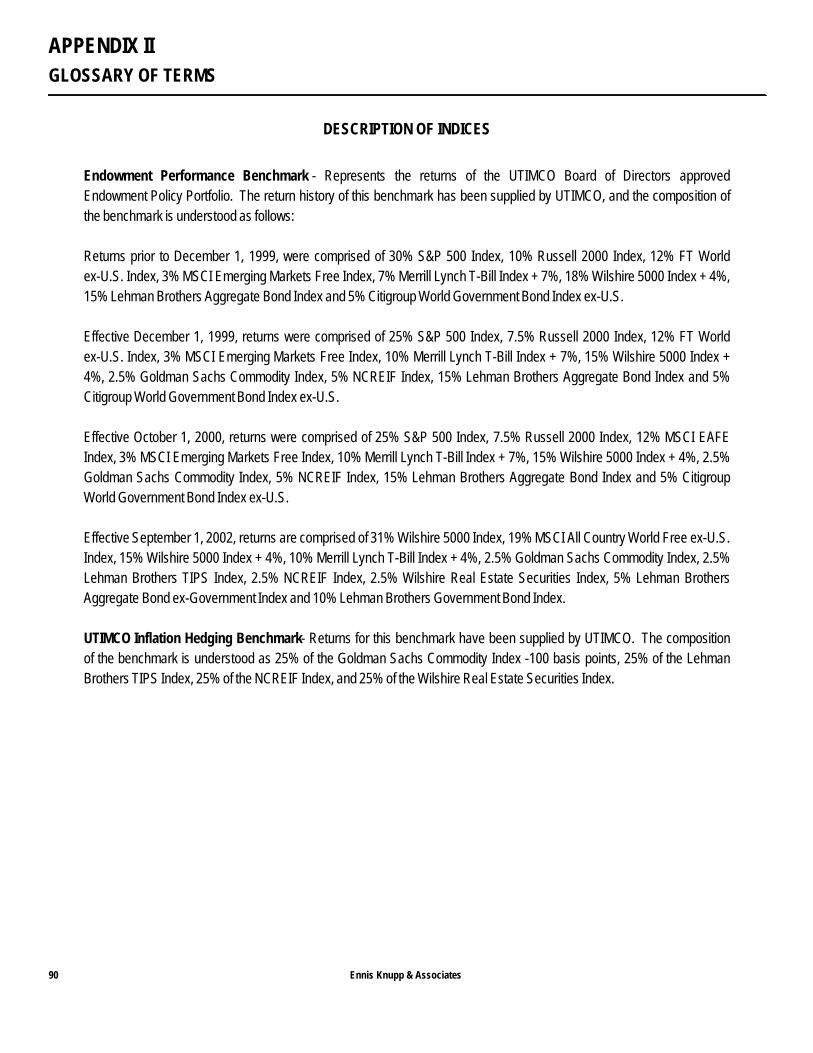
GLOSSARY OF TERMS
APPENDIX II
Ennis Knupp & Associates 90
Endowment Performance Benchmark - Represents the returns of the UTIMCO Board of Directors approvedEndowment Policy Portfolio. The return history of this benchmark has been supplied by UTIMCO, and the composition ofthe benchmark is understood as follows:
Returns prior to December 1, 1999, were comprised of 30% S&P 500 Index, 10% Russell 2000 Index, 12% FT Worldex-U.S. Index, 3% MSCI Emerging Markets Free Index, 7% Merrill Lynch T-Bill Index + 7%, 18% Wilshire 5000 Index + 4%,15% Lehman Brothers Aggregate Bond Index and 5% Citigroup World Government Bond Index ex-U.S.
Effective December 1, 1999, returns were comprised of 25% S&P 500 Index, 7.5% Russell 2000 Index, 12% FT Worldex-U.S. Index, 3% MSCI Emerging Markets Free Index, 10% Merrill Lynch T-Bill Index + 7%, 15% Wilshire 5000 Index +4%, 2.5% Goldman Sachs Commodity Index, 5% NCREIF Index, 15% Lehman Brothers Aggregate Bond Index and 5%Citigroup World Government Bond Index ex-U.S.
Effective October 1, 2000, returns were comprised of 25% S&P 500 Index, 7.5% Russell 2000 Index, 12% MSCI EAFEIndex, 3% MSCI Emerging Markets Free Index, 10% Merrill Lynch T-Bill Index + 7%, 15% Wilshire 5000 Index + 4%, 2.5%Goldman Sachs Commodity Index, 5% NCREIF Index, 15% Lehman Brothers Aggregate Bond Index and 5% CitigroupWorld Government Bond Index ex-U.S.
Effective September 1, 2002, returns are comprised of 31% Wilshire 5000 Index, 19% MSCI All Country World Free ex-U.S.Index, 15% Wilshire 5000 Index + 4%, 10% Merrill Lynch T-Bill Index + 4%, 2.5% Goldman Sachs Commodity Index, 2.5%Lehman Brothers TIPS Index, 2.5% NCREIF Index, 2.5% Wilshire Real Estate Securities Index, 5% Lehman BrothersAggregate Bond ex-Government Index and 10% Lehman Brothers Government Bond Index.
UTIMCO Inflation Hedging Benchmark- Returns for this benchmark have been supplied by UTIMCO. The compositionof the benchmark is understood as 25% of the Goldman Sachs Commodity Index -100 basis points, 25% of the LehmanBrothers TIPS Index, 25% of the NCREIF Index, and 25% of the Wilshire Real Estate Securities Index.
DESCRIPTION OF INDICES
GLOSSARY OF TERMS
APPENDIX II
Ennis Knupp & Associates 91
Wilshire 5000 Stock Index - A capitalization-weighted stock index representing all domestic common stocks tradedregularly on the organized exchanges. The Index is the broadest measure of the aggregate domestic stock market.
S&P 500 Stock Index - A capitalization-weighted stock index representing the 500 largest stocks in the U.S. equitymarket.
Russell 2000 Stock Index - A capitalization-weighted index of the 2000 smallest stocks in the Russell 3000 Index. Thisindex excludes the largest and smallest capitalization issues in the domestic stock market.
MSCI All-Country World Ex-U.S. Index - A capitalization-weighted index of stocks representing a broad range ofdeveloped and emerging country markets, excluding the U.S. market.
MSCI Europe, Australasia, Far East (EAFE) Index - A capitalization-weighted index of stocks representing 21developed markets in Europe, Australia, Asia and the Far East.
MSCI Emerging Markets Free Index- A capitalization-weighted index of stocks representing 26 emerging markets.
Lehman Brothers Aggregate Bond Index - A market value-weighted index consisting of the Lehman BrothersCorporate, Government, and Mortgage-Backed Securities Indices. The index also includes asset-backed securities, and isthe broadest measure of the aggregate U.S. fixed-income market.
Lehman Brothers Government Bond Index - A market value-weighted index consisting of all public obligations of theU.S. Treasury, excluding flower bonds, foreign targeted issues, debt of U.S. Government Agencies and corporate debtguaranteed by the U.S. Government.
Lehman Brothers Aggregate Bond ex-Government Index - A market value-weighted index consisting of the LehmanBrothers Corporate and Mortgage-backed Securities Indices and includes asset-backed securities.
DESCRIPTION OF INDICES CONTINUED

GLOSSARY OF TERMS
APPENDIX II
Ennis Knupp & Associates 92
Performance Comparison - Ratio of Cumulative Wealth: An illustration of a portfolio's cumulative, unannualizedperformance relative to that of its benchmark. An upward sloping line indicates fund outperformance. Conversely, adownward sloping line indicates underperformance by the fund. A flat line is indicative of benchmark-like performance.
Performance Comparison- Risk-Return: The horizontal axis, annualized standard deviation,is a statistical measure ofrisk, or the volatility of returns. The vertical axis is the annualized rate of return. As most investors generally prefer less riskto more risk and always prefer greater returns, the upper left corner of the graph is the most attractive place to be. The lineon this exhibit represents the risk and return tradeoffs associated with market portfolios, or index funds.
Performance Attribution- A measure of the source of the deviation of a fund's performance from that of its benchmark.Each bar on the graph represents the contribution made by the manager to the total difference in performance (shown atthe bottom of the exhibit). A positive value for a component indicates a positive contribution to the aggregate relativeperformance. A negative value indicates a detrimental impact. The magnitude of each component's contribution is afunction of (1) the performance of the component relative to its benchmark, and (2) the weight of the component in theaggregate.
DESCRIPTION OF TERMS
28
6. U. T. System: Permanent University Fund quarterly update
Mr. Philip R. Aldridge, Interim Vice Chancellor for Business Affairs, will update the Committee on changes in the forecasted distributions from the Permanent University Fund (PUF) to the Available University Fund (AUF) and the resulting impacts on remaining PUF debt capacity, U. T. Austin excellence funds, and the AUF balance.
REPORT As of August 31, 2003, the market value of the PUF was $7.24 billion compared to $6.85 billion as of May 31, 2003 (Figure A on Page 28.1). During Fiscal Year 2004, $348 million will be distributed to the AUF, compared to $363 million in Fiscal Year 2003 (Figure B on Page 28.2). PUF distributions to the AUF are projected to decline in Fiscal Year 2005 to $336 million before increasing thereafter. Beginning in Fiscal Year 2009, PUF distributions may be capped for a period of time because the purchasing power of the PUF will not have been maintained as required by the Texas Constitution (Figure B on Page 28.2). Based on the current assumptions and anticipated Library, Equipment, Repair and Rehabilitation allocations, there is an estimated $137-$181 million of additional debt capacity through Fiscal Year 2010 beyond the PUF projects currently approved, assuming a 7.40% or 9.35% investment return, respectively (Figures C and D on Pages 28.3 - 28.4). PUF debt capacity is affected by various factors, some of which are determined by the Board while others are dependent on future market conditions (Figure E on Page 28.5). Annually, the U. T. Board of Regents approves a distribution amount to the AUF. The PUF investment policy provides that, in conjunction with the annual U. T. System bud-get process, UTIMCO shall recommend to the U. T. Board each May an amount to be distributed to the AUF during the next fiscal year. UTIMCO's recommendation on the annual distribution shall be an amount equal to 4.75% of the trailing 12-quarter average of the net asset value of the PUF for the quarter ending February of each year. The AUF spending policy provides that a minimum of 45% of the projected income available to the U. T. System is distributed to U. T. Austin for excellence programs, the projected PUF debt service coverage ratio must not be less than 1.50 times, and the AUF balance must not be less than $30 million.
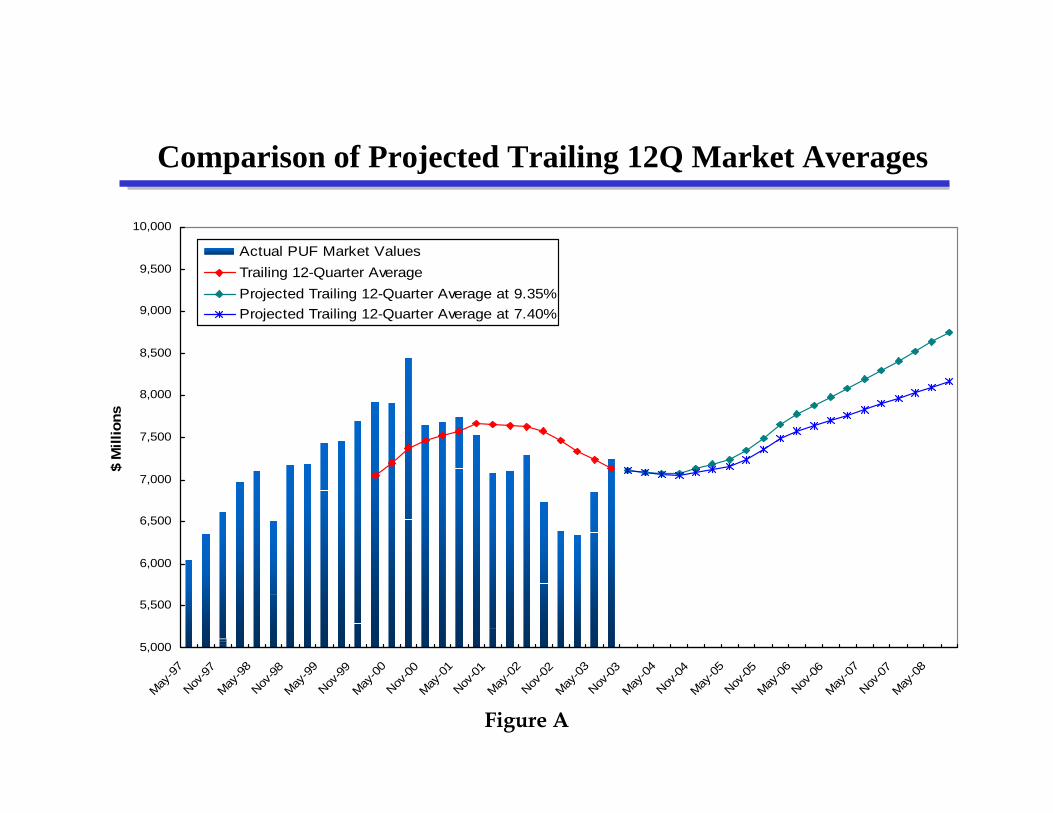
Figure A
Comparison of Projected Trailing 12Q Market Averages
5,000
5,500
6,000
6,500
7,000
7,500
8,000
8,500
9,000
9,500
10,000
May-9
7Nov
-97May
-98
Nov-98
May-9
9Nov
-99May
-00
Nov-00
May-0
1Nov
-01May
-02
Nov-02
May-0
3Nov
-03May
-04
Nov-04
May-0
5Nov
-05May
-06
Nov-06
May-0
7Nov
-07May
-08
$ M
illio
ns
Actual PUF Market ValuesTrailing 12-Quarter AverageProjected Trailing 12-Quarter Average at 9.35%Projected Trailing 12-Quarter Average at 7.40%

Figure B
Permanent University Fund Distributions
0
50
100
150
200
250
300
350
400
450
1986
-1987
1987
-1988
1988
-1989
1989
-1990
1990
-1991
1991
-1992
1992
-1993
1993
-1994
1994
-1995
1995
-1996
1996
-1997
1997
-1998
1998
-1999
1999
-2000
2000
-2001
2001
-2002
2002
-2003
2003
-2004
2004
-2005
2005
-2006
2006
-2007
2007
-2008
2008
-2009
2009
-2010
2010
-2011
$ M
illio
ns
PUF Distributions - Actual *PUF Distributions - Projected at 9.35%PUF Distributions - Projected at 7.40%
* Effective September 1, 1997, a statutory amendment changed the distribution of income from cash to an accrual basis, resulting in a one-time distribution adjustment to the AUF of $47.3 million, w hich is not reflected.
Proposition 17 Enacted
PUF “Frozen”
Distributions“Capped”
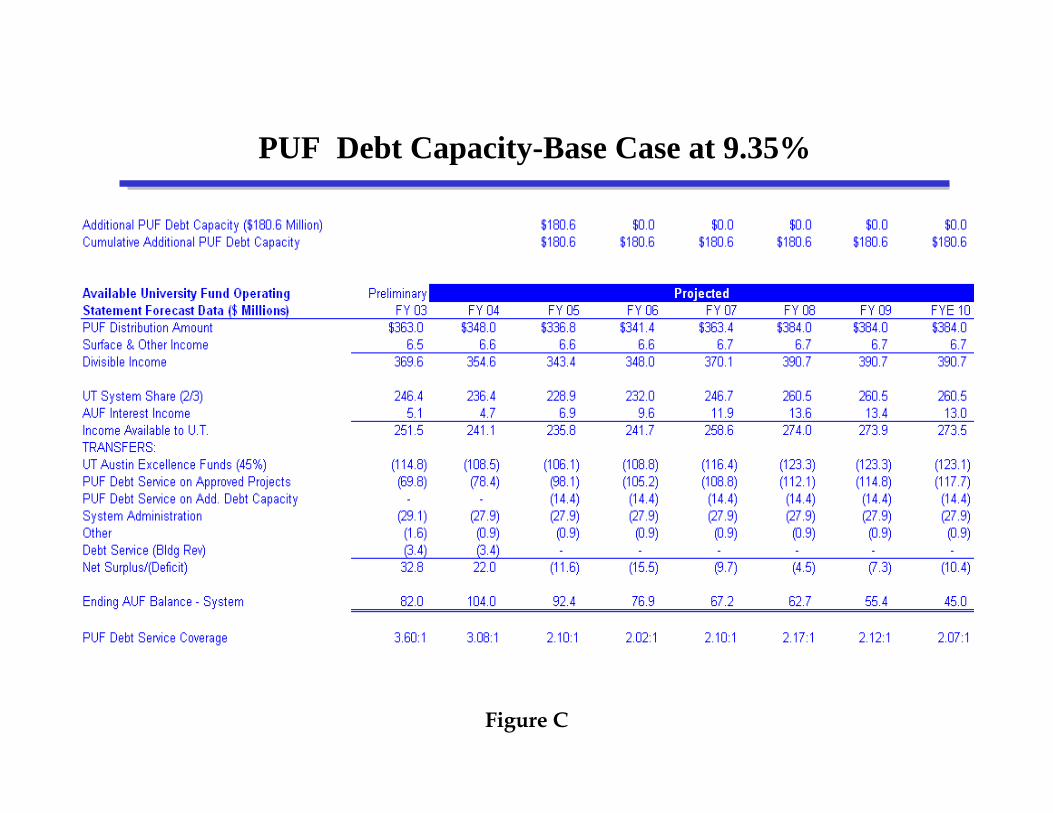
Figure C
PUF Debt Capacity-Base Case at 9.35%

Figure D
PUF Debt Capacity-Base Case at 7.40%
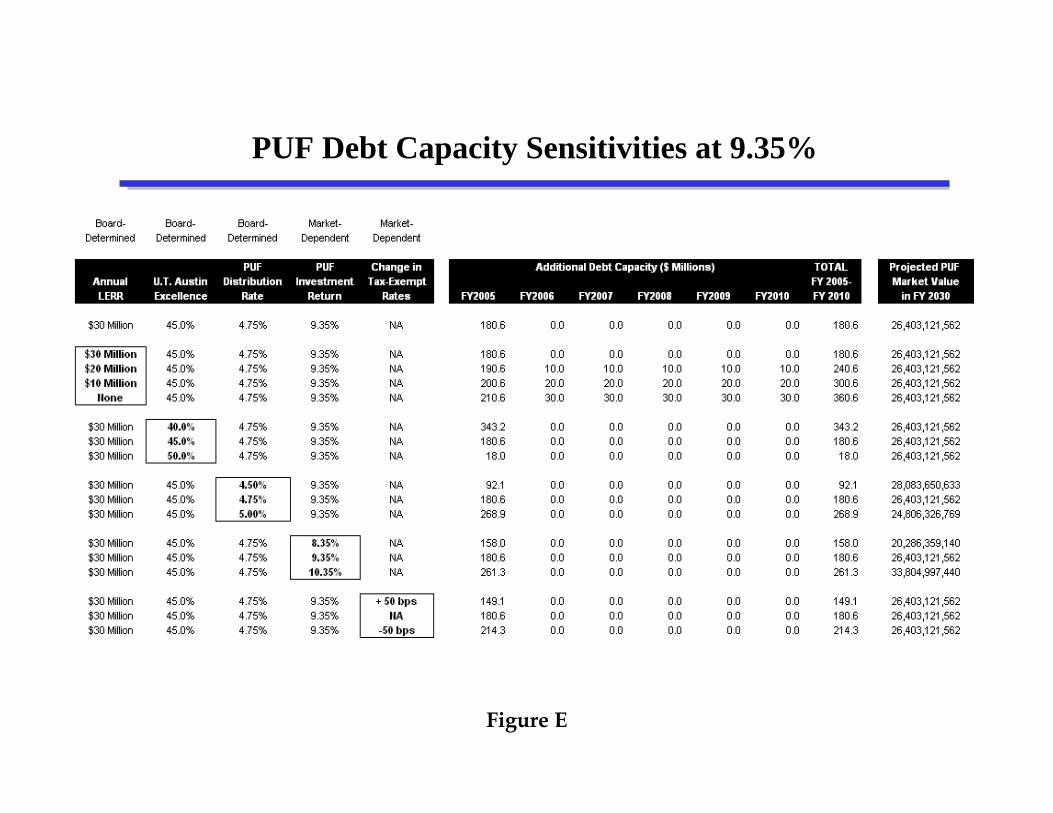
Figure E
PUF Debt Capacity Sensitivities at 9.35%
29
7. U. T. System: Report of the Energy Utility Task Force for Fiscal Year 2003
REPORT Mr. Philip R. Aldridge, Interim Vice Chancellor for Business Affairs, will report on the progress of the Energy Utility Task Force for Fiscal Year 2003 using materials attached on Pages 29.1 - 29.7. The Energy Utility Task Force was created in February 2001 to evaluate and recommend strategies for U. T. System component institutions to reduce energy consumption, better manage commodity price risk, and leverage its purchasing power to reduce energy costs. Initial recommendations and energy consumption reduction goals were presented to the Board in November 2001. A 2-4% reduction in System-wide energy usage per square foot was targeted for Fiscal Year 2003. An annual update is presented to the Finance and Planning Committee of the Board each year.
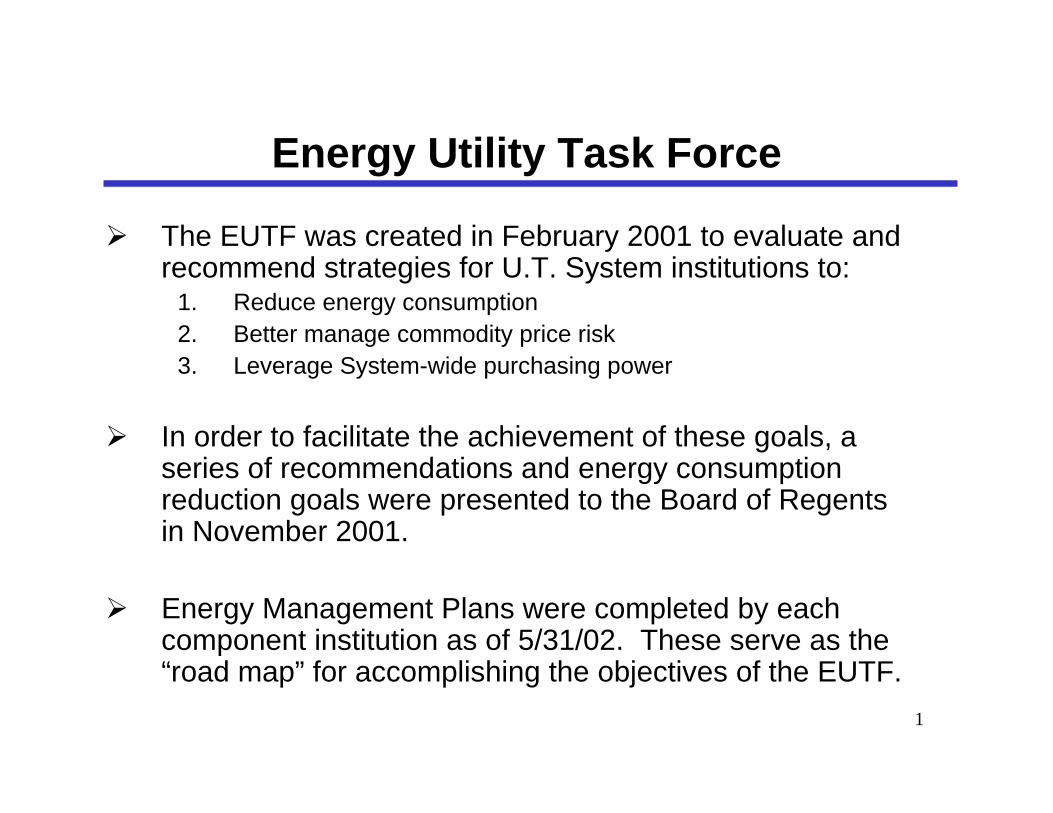
1
Energy Utility Task Force
The EUTF was created in February 2001 to evaluate and recommend strategies for U.T. System institutions to:
1. Reduce energy consumption2. Better manage commodity price risk3. Leverage System-wide purchasing power
In order to facilitate the achievement of these goals, a series of recommendations and energy consumption reduction goals were presented to the Board of Regents in November 2001.
Energy Management Plans were completed by each component institution as of 5/31/02. These serve as the “road map” for accomplishing the objectives of the EUTF.

2
Goal # 1: Reduce Energy Consumption
A 2.0% to 4.0% reduction in System-wide energy usage per square foot was targeted by the EUTF for FY 2003. The current estimate for FY 2003 shows a 6.5% reductionfrom FY 2001 levels.
Literally hundreds of energy efficiency projects have been initiated across the U.T. System since FY 2001.
Several dozen discrete capital projects have also been initiated to reduce energy costs. These projects range in size from several thousand dollars to $25 million.
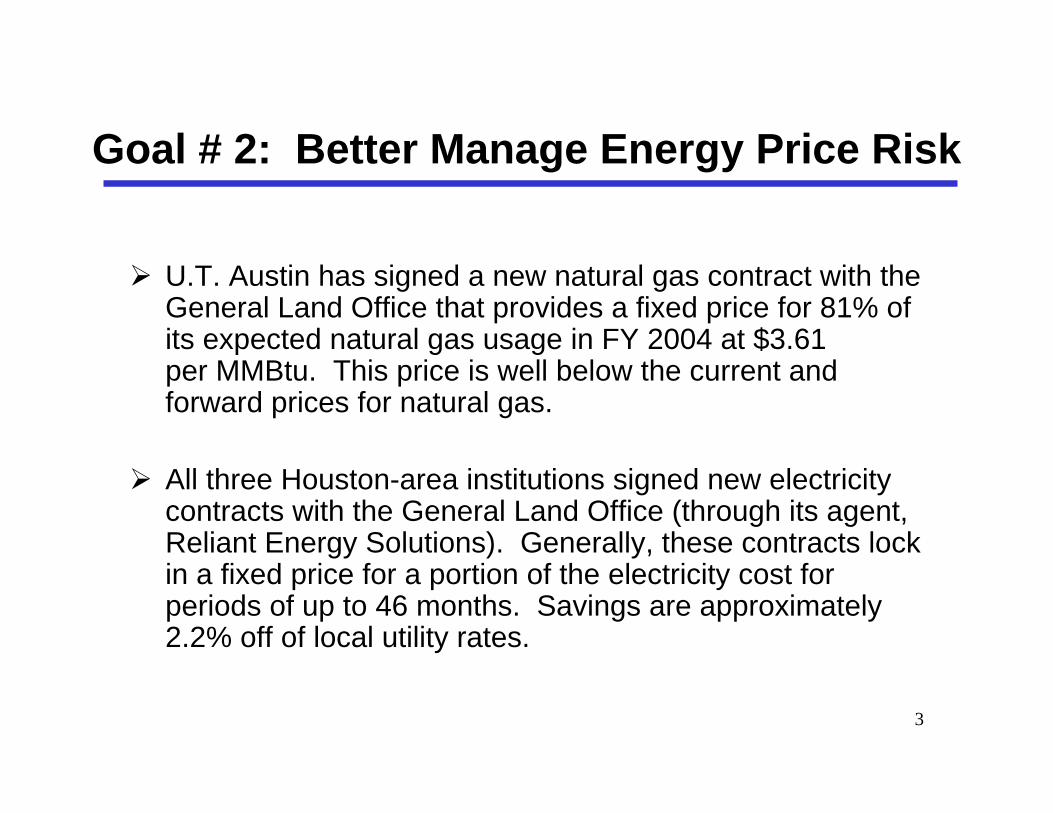
3
Goal # 2: Better Manage Energy Price Risk
U.T. Austin has signed a new natural gas contract with the General Land Office that provides a fixed price for 81% of its expected natural gas usage in FY 2004 at $3.61 per MMBtu. This price is well below the current and forward prices for natural gas.
All three Houston-area institutions signed new electricity contracts with the General Land Office (through its agent, Reliant Energy Solutions). Generally, these contracts lock in a fixed price for a portion of the electricity cost for periods of up to 46 months. Savings are approximately 2.2% off of local utility rates.
4
Goal # 3: Leverage Purchasing Power
U. T. Southwestern Medical Center - Dallas, U. T. Arlington, U. T. Dallas, U. T. Permian Basin, U. T. Tyler and U. T. Health Center - Tyler have issued a joint RFP for the purpose of procuring electricity from a single provider. The contract will provide for a discounted rate for electricity at each institution for a period of up to three years. Savings in the first year are estimated to be $3.5 million.
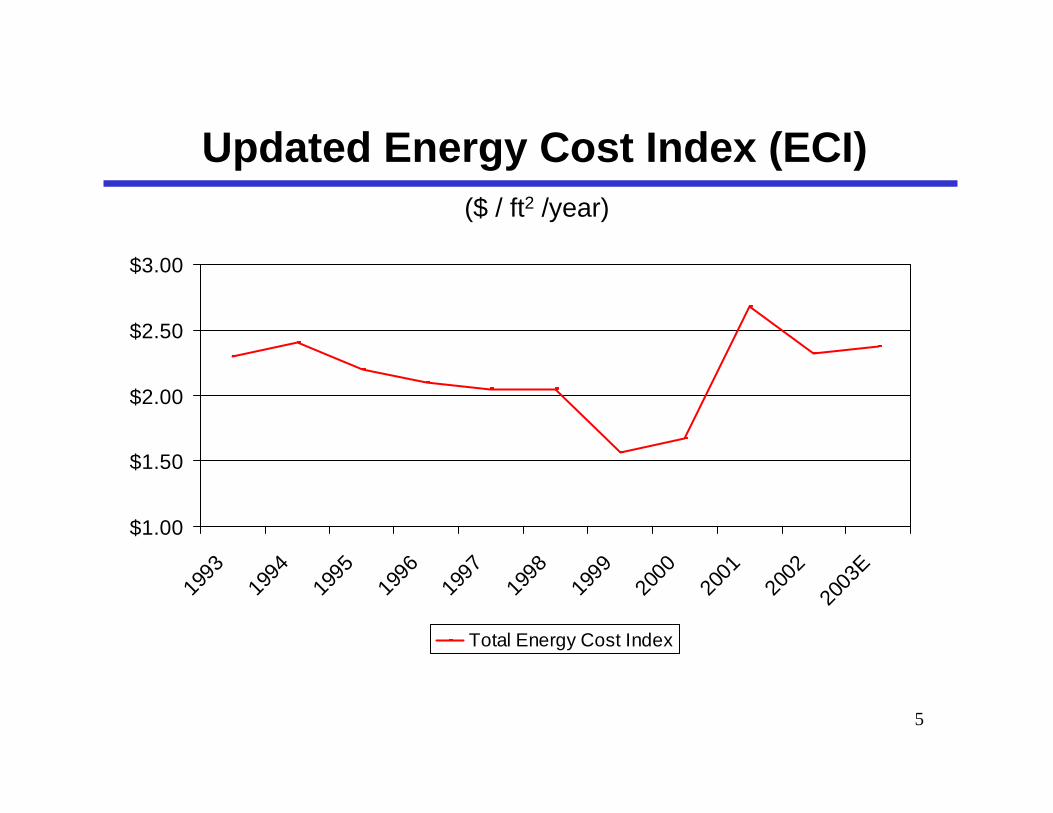
5
Updated Energy Cost Index (ECI)($ / ft2 /year)
$1.00
$1.50
$2.00
$2.50
$3.00
1993
1994
1995
1996
1997
1998
1999
2000
2001
2002
2003
E
Total Energy Cost Index
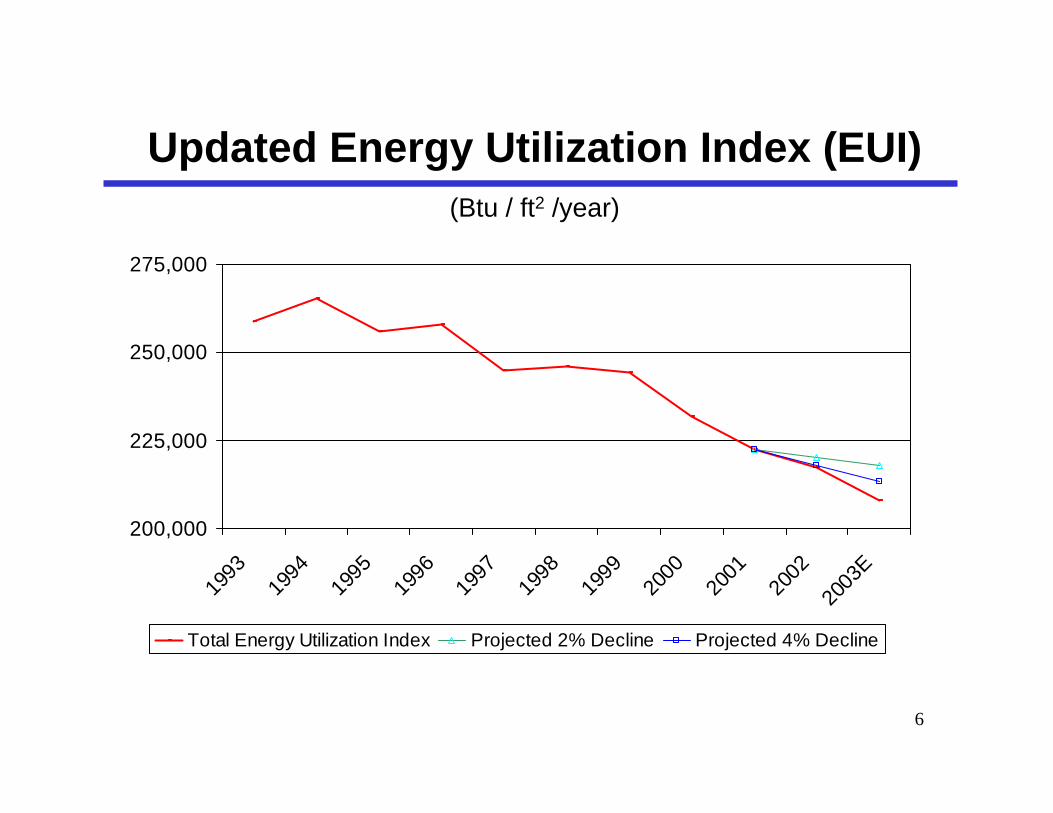
6
Updated Energy Utilization Index (EUI)(Btu / ft2 /year)
200,000
225,000
250,000
275,000
1993
1994
1995
1996
1997
1998
1999
2000
2001
2002
2003
E
Total Energy Utilization Index Projected 2% Decline Projected 4% Decline

7
Updated Energy Consumption and Costs
To ta l Energy To ta l
Elec tric ity Natura l Gas Elec tric ity Natura l Gas To ta l To ta l Other Other To ta l Gro s s Utiliza tio n Energy F is ca l Us age Us age Co s t Co s t Elec tric ity Natura l Gas Energy Energy Energy Square Index Co s t IndexYear (Kwh) (Mcf) ($ /Kwh) ($ /Mcf) Co s t Co s t (MMBtu) Co s t Co s t Fo o tage (Btu / ft2 / yr.) ($ / ft2 / yr.)
1993 758,530,624 5,853,351 $ 0.0513 $ 2.5104 38,935,177$ 14,694,160$ 13,089 20,417,665$ 99,749,453$ 43,391,126 258,814 2.30$ 1994 769,038,496 6,206,141 $ 0.0532 $ 2.4911 40,904,405$ 15,460,025$ 337 22,402,366$ 104,788,726$ 43,546,488 265,351 2.41$ 1995 808,741,916 6,042,415 $ 0.0487 $ 1.9311 39,375,137$ 11,668,437$ 40,677 24,128,388$ 97,624,796$ 44,244,580 256,299 2.21$ 1996 827,474,008 6,339,050 $ 0.0432 $ 2.3751 35,713,888$ 15,056,131$ 52,915 22,256,631$ 95,411,303$ 45,315,436 258,345 2.11$ 1997 929,746,528 6,773,047 $ 0.0447 $ 2.7372 41,591,080$ 18,539,034$ 27,059 24,583,570$ 97,767,351$ 48,171,597 244,217 2.03$ 1998 1,003,307,037 7,146,175 $ 0.0449 $ 2.7220 45,026,159$ 19,451,796$ 49,426 26,131,767$ 101,093,039$ 49,684,186 245,742 2.03$ 1999 1,006,136,057 6,972,357 $ 0.0445 $ 2.4820 44,763,535$ 17,305,073$ 28,863 25,298,997$ 99,614,128$ 50,930,293 242,971 1.96$ 2000 1,059,087,750 7,057,246 $ 0.0460 $ 3.4032 48,672,004$ 24,017,260$ 7,804 27,862,519$ 114,201,844$ 54,146,443 233,740 2.11$ 2001 1,054,912,766 7,173,448 $ 0.0569 $ 5.9528 60,042,574$ 42,701,958$ 13,640 29,463,687$ 149,802,396$ 57,348,051 222,277 2.61$ 2002 1,084,875,822 7,155,613 $ 0.0562 $ 3.8175 61,024,225$ 27,316,386$ 9,853 32,089,508$ 136,953,021$ 59,104,344 217,331 2.32$
2003E 1,100,798,728 6,784,043 $ 0.0558 $ 5.0002 61,471,425$ 33,921,734$ 9,040 31,173,666$ 143,874,574$ 60,481,359 207,861 2.38$ 2004E 1,179,970,332 7,294,028 $ 0.0566 $ 4.8848 66,815,577$ 35,630,074$ 7,677 31,991,297$ 155,211,083$ 64,311,462 211,909 2.41$
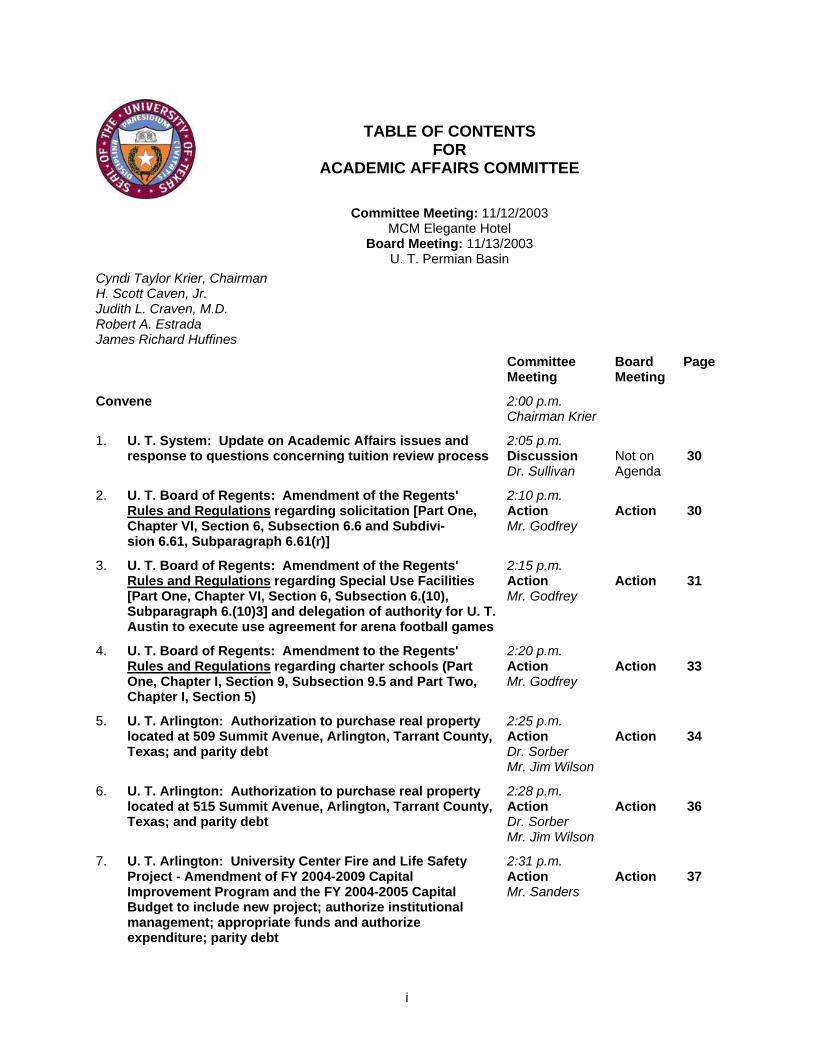
TABLE OF CONTENTS
FOR ACADEMIC AFFAIRS COMMITTEE
Committee Meeting: 11/12/2003 MCM Elegante Hotel
Board Meeting: 11/13/2003 U. T. Permian Basin
Cyndi Taylor Krier, Chairman H. Scott Caven, Jr. Judith L. Craven, M.D. Robert A. Estrada James Richard Huffines
Committee Meeting
Board Meeting
Page
Convene 2:00 p.m. Chairman Krier
1. U. T. System: Update on Academic Affairs issues and response to questions concerning tuition review process
2:05 p.m. Discussion Dr. Sullivan
Not on Agenda
30
2. U. T. Board of Regents: Amendment of the Regents' Rules and Regulations regarding solicitation [Part One, Chapter VI, Section 6, Subsection 6.6 and Subdivi-sion 6.61, Subparagraph 6.61(r)]
2:10 p.m. Action Mr. Godfrey
Action
30
3. U. T. Board of Regents: Amendment of the Regents' Rules and Regulations regarding Special Use Facilities [Part One, Chapter VI, Section 6, Subsection 6.(10), Subparagraph 6.(10)3] and delegation of authority for U. T. Austin to execute use agreement for arena football games
2:15 p.m. Action Mr. Godfrey
Action
31
4. U. T. Board of Regents: Amendment to the Regents' Rules and Regulations regarding charter schools (Part One, Chapter I, Section 9, Subsection 9.5 and Part Two, Chapter I, Section 5)
2:20 p.m. Action Mr. Godfrey
Action
33
5. U. T. Arlington: Authorization to purchase real property located at 509 Summit Avenue, Arlington, Tarrant County, Texas; and parity debt
2:25 p.m. Action Dr. Sorber Mr. Jim Wilson
Action
34
6. U. T. Arlington: Authorization to purchase real property located at 515 Summit Avenue, Arlington, Tarrant County, Texas; and parity debt
2:28 p.m. Action Dr. Sorber Mr. Jim Wilson
Action
36
7. U. T. Arlington: University Center Fire and Life Safety Project - Amendment of FY 2004-2009 Capital Improvement Program and the FY 2004-2005 Capital Budget to include new project; authorize institutional management; appropriate funds and authorize expenditure; parity debt
2:31 p.m. Action Mr. Sanders
Action
37
i
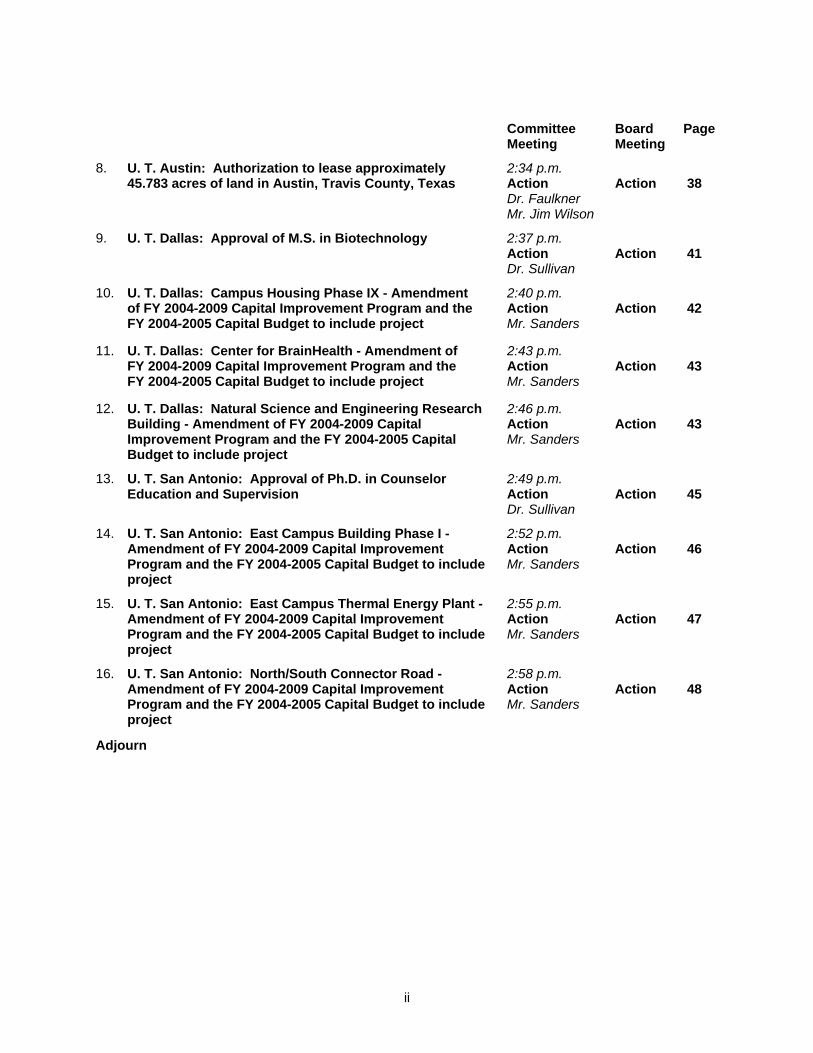
Committee
Meeting Board Meeting
Page
8. U. T. Austin: Authorization to lease approximately 45.783 acres of land in Austin, Travis County, Texas
2:34 p.m. Action Dr. Faulkner Mr. Jim Wilson
Action
38
9. U. T. Dallas: Approval of M.S. in Biotechnology 2:37 p.m. Action Dr. Sullivan
Action
41
10. U. T. Dallas: Campus Housing Phase IX - Amendment of FY 2004-2009 Capital Improvement Program and the FY 2004-2005 Capital Budget to include project
2:40 p.m. Action Mr. Sanders
Action
42
11. U. T. Dallas: Center for BrainHealth - Amendment of FY 2004-2009 Capital Improvement Program and the FY 2004-2005 Capital Budget to include project
2:43 p.m. Action Mr. Sanders
Action
43
12. U. T. Dallas: Natural Science and Engineering Research Building - Amendment of FY 2004-2009 Capital Improvement Program and the FY 2004-2005 Capital Budget to include project
2:46 p.m. Action Mr. Sanders
Action
43
13. U. T. San Antonio: Approval of Ph.D. in Counselor Education and Supervision
2:49 p.m. Action Dr. Sullivan
Action
45
14. U. T. San Antonio: East Campus Building Phase I - Amendment of FY 2004-2009 Capital Improvement Program and the FY 2004-2005 Capital Budget to include project
2:52 p.m. Action Mr. Sanders
Action
46
15. U. T. San Antonio: East Campus Thermal Energy Plant - Amendment of FY 2004-2009 Capital Improvement Program and the FY 2004-2005 Capital Budget to include project
2:55 p.m. Action Mr. Sanders
Action
47
16. U. T. San Antonio: North/South Connector Road - Amendment of FY 2004-2009 Capital Improvement Program and the FY 2004-2005 Capital Budget to include project
2:58 p.m. Action Mr. Sanders
Action
48
Adjourn
ii
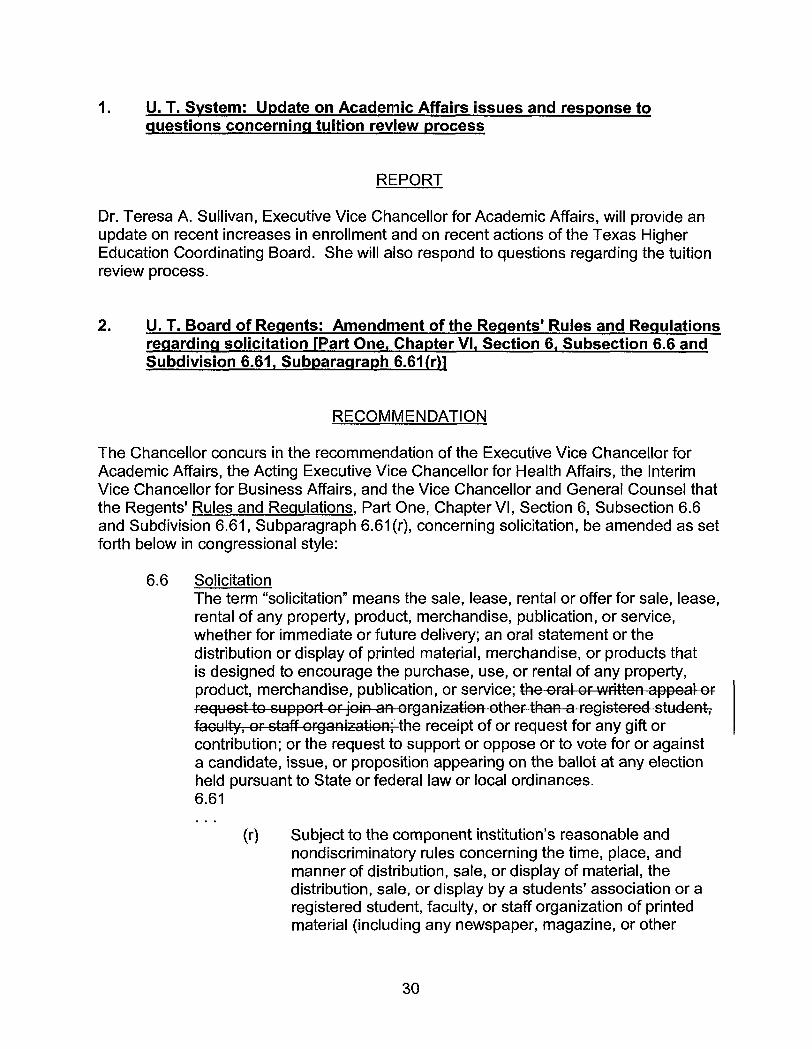
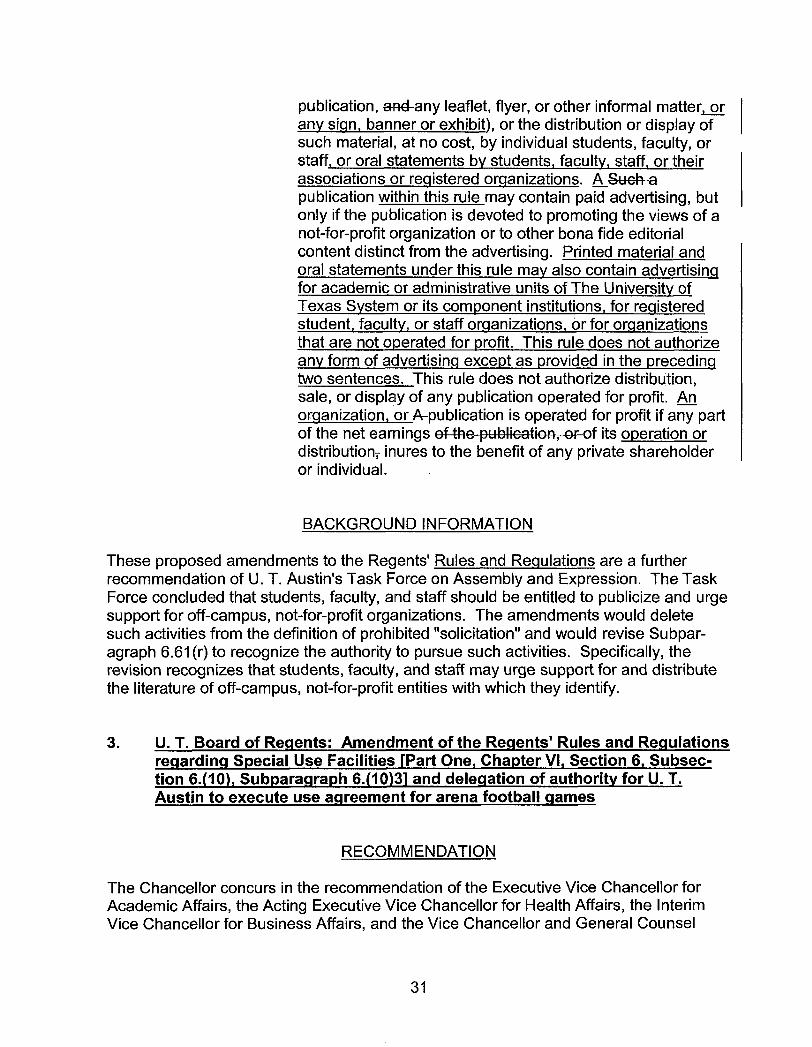
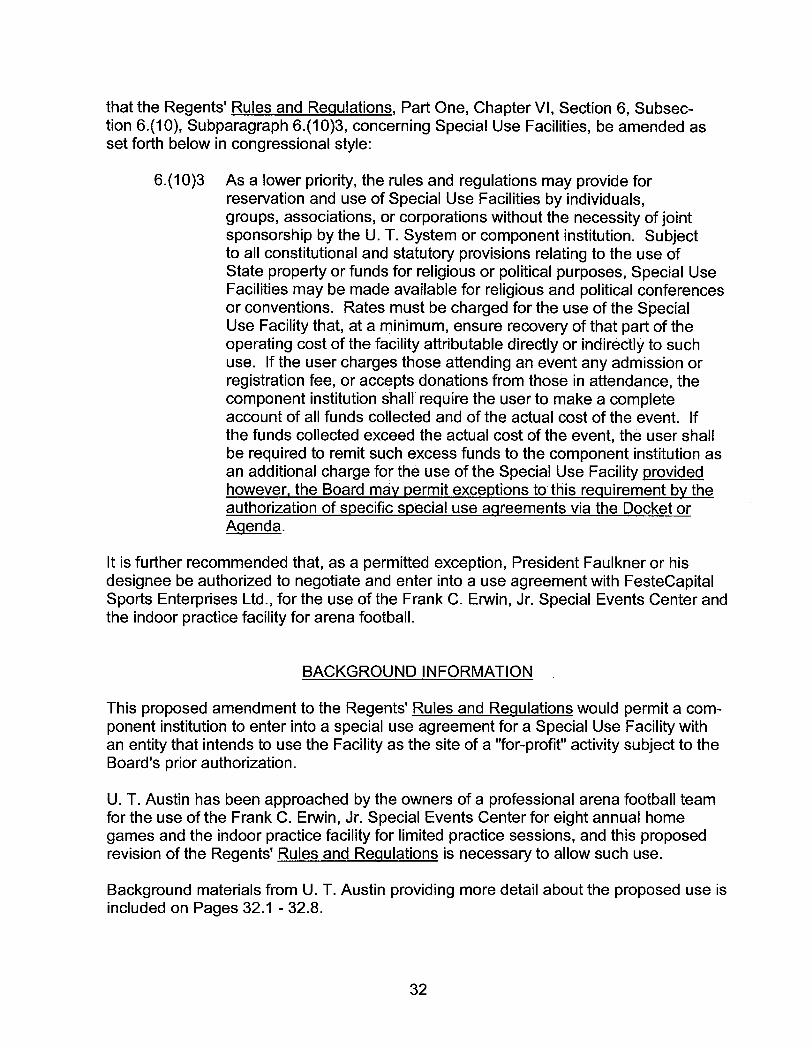


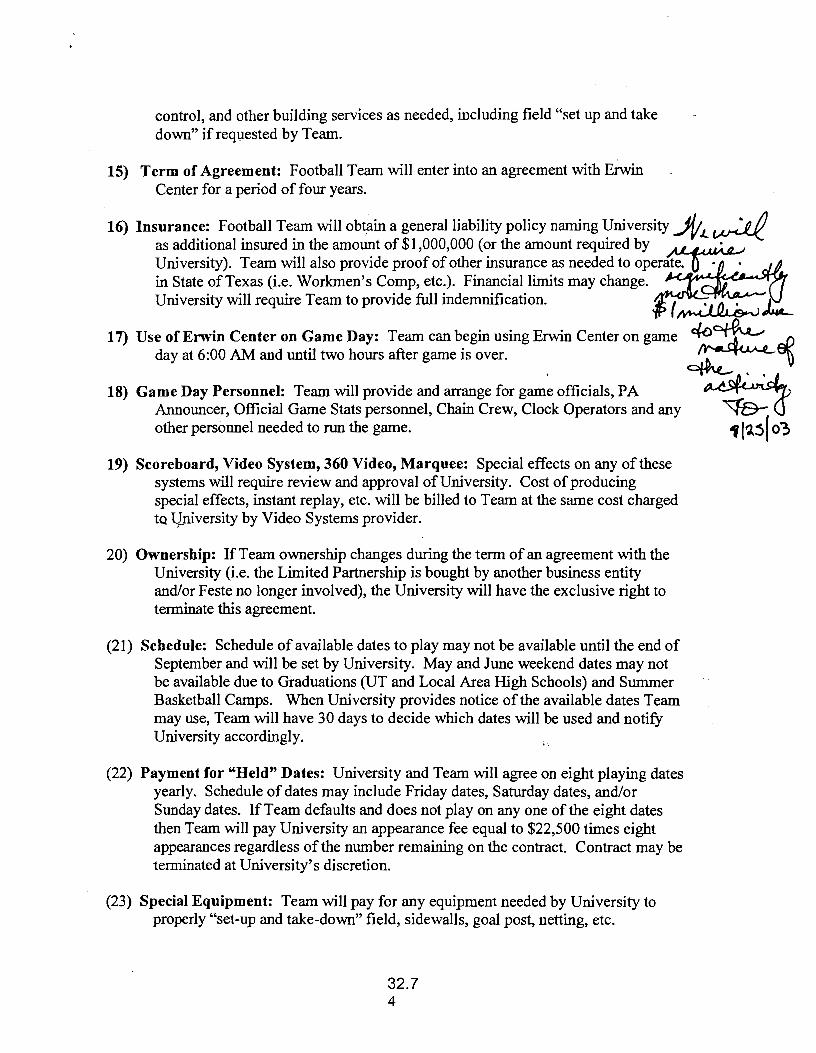


4. U. T. Board of Regents: Amendment to the Regents' Rules and Regulations regarding charter schools (Part One, Chapter I, Section 9, Subsection 9.5 and Part Two, Chapter I, Section 5)
RECOMMENDATION The Chancellor concurs in the recommendation of the Executive Vice Chancellor for Academic Affairs and the Vice Chancellor and General Counsel that the Regents' Rules and Regulations, Part One, Chapter I, Section 9, Subsection 9.5 and Part Two, Chap-ter I, Section 5, regarding charter school operations, be amended as set forth below in congressional style: a. Amend Part One, Chapter I, Section 9, Subsection 9.5 as follows:
Sec. 9. Delegation to Act on Behalf of the Board . . .
9.5 Delegation of Authority Related to Charter School
OperationsAuthority delegated by the Board in these Rules and Regulations includes actions related to the oversight and operation of a an open enrollment charter school as authorized in Part Two, Chapter I, Section 5 of these Rules and Regulations.
b. Amend Part Two, Chapter I, Section 5 as follows:
Sec. 5. Charter School Operations
Upon a finding by the Chancellor and the Executive Vice Chancellor for Academic Affairs that a proposed application for a charter to operate a an open enrollment charter school as authorized by Texas Education Code Chapter 12 meets requirements of State law and furthers the institutional mission, an institution may apply to the State Board of Education to operate a charter school. Charter school operations will adhere to all applicable provisions of State law including the Texas Public Information Act.
The oversight and supervision of the charter school is delegated to the institutional president, with a report to the Board each year, detailing activities and performance of the charter school.
33
A board or An advisory council may shall be appointed by the president to advise him or her on operation of the charter school. The board or advisory council will comply with all provisions of the Texas Open Meetings Act applicable to the Board of Regents.
BACKGROUND INFORMATION These amendments to the Regents' Rules and Regulations are proposed to reflect the legislative change authorizing a university to apply for an open enrollment charter as well as a college or university charter. At the time these Regents' Rules were added, Section 12.101 of the Texas Education Code authorized a university to apply to the State Board of Education to operate an open enrollment charter school. The legislature has provided authorization for another class of charter schools (a college or university charter) in Texas Education Code Section 12.152. The amendment to the Regents' Rules also authorizes a "board" to be appointed by the president to advise him or her regarding operations of the charter school. 5. U. T. Arlington: Authorization to purchase real property located at
509 Summit Avenue, Arlington, Tarrant County, Texas; and parity debt
RECOMMENDATION The Chancellor concurs in the recommendation of the Executive Vice Chancellor for Academic Affairs, the Interim Vice Chancellor for Business Affairs, and President ad Interim Sorber that the U. T. Board of Regents:
a. authorize the Executive Director of Real Estate to take all steps necessary to purchase the property located at 509 Summit Avenue, Arlington, Tarrant County, Texas, and to execute all documents related thereto; and
b. make the “finding of fact” determinations required by Section 5 of the
Master Resolution regarding the ability to repay debt prior to the issuance of additional Revenue Financing System parity debt. This resolution satisfies the official intent requirements set forth in Section 1.150-2 of the Code of Federal Regulations.
34
BACKGROUND INFORMATION U. T. Arlington wishes to acquire the Racquet Club Apartments property, which exists in a strategic location within the legislatively authorized acquisition zone for the U. T. Arlington campus and is needed to assemble a site on which to construct new student housing. The property is also designated for future acquisition in the campus master plan approved by the U. T. Board of Regents. The proposed purchase price is the appraised market value of $1.45 million, and the proposed source of acquisition financ-ing is Revenue Financing System Bond Proceeds to be repaid with net revenues from U. T. Arlington's housing operations. The terms and conditions are as reflected in the transaction summary below: Transaction Summary Component: U. T. Arlington Type of Transaction: Purchase Property Name: Racquet Club Apartments Property Address: 509 Summit Avenue Type of Property: 52-unit apartment complex Year Built: 1958 Site: 56,088 square feet (1.29 acres) Improvements: 39,422 gross square feet 38,749 rentable square feet Parking: 66 spaces Purchase Price: $1,450,000 Price Per Unit: $27,885 Price Per Rentable S.F.: $37.42 Appraised Value: $1,450,000 (Hanes Appraisal Company, James S. Hanes, MAI, July 2, 2003)
35
6. U. T. Arlington: Authorization to purchase real property located at 515 Summit Avenue, Arlington, Tarrant County, Texas; and parity debt
RECOMMENDATION The Chancellor concurs in the recommendation of the Executive Vice Chancellor for Academic Affairs, the Interim Vice Chancellor for Business Affairs, and President ad Interim Sorber that the U. T. Board of Regents:
a. authorize the Executive Director of Real Estate to take all steps necessary to purchase the property located at 515 Summit Avenue, Arlington, Tarrant County, Texas, and to execute all documents related thereto; and
b. make the “finding of fact” determinations required by Section 5 of the
Master Resolution regarding the ability to repay debt prior to the issuance of additional Revenue Financing System parity debt. This resolution satisfies the official intent requirements set forth in Section 1.150-2 of the Code of Federal Regulations.
BACKGROUND INFORMATION U. T. Arlington wishes to acquire the Campus West Apartments property, which exists in a strategic location within the legislatively authorized acquisition zone for the U. T. Arlington campus and is needed to assemble a site on which to construct new student housing. The property is also designated for future acquisition in the campus master plan approved by the U. T. Board of Regents. The proposed purchase price is the appraised market value of $1.4 million, and the proposed source of acquisition financing is Revenue Financing System Bond Proceeds to be repaid with net revenues from U. T. Arlington's housing operations. The terms and conditions are as reflected on the trans-action summary below: Transaction Summary Component: U. T. Arlington Type of Transaction: Purchase Property Name: Campus West Apartments Property Address: 515 Summit Avenue Type of Property: 50-unit apartment complex
36

Year Built: 1962 Site: 46,174 square feet (1.06 acres) Improvements: 30,355 gross square feet 29,907 rentable square feet Parking: 66 spaces Purchase Price: $1,400,000 Price Per Unit: $28,000 Price Per Rentable S.F.: $46.81 Appraised Value: $1,400,000 (Hanes Appraisal Company,
James S. Hanes, MAI, August 27, 2003) 7. U. T. Arlington: University Center Fire and Life Safety Project - Amendment
of FY 2004-2009 Capital Improvement Program and the FY 2004-2005 Cap-ital Budget to include new project; authorize institutional management; appropriate funds and authorize expenditure; parity debt
RECOMMENDATION The Chancellor concurs in the recommendation of the Executive Vice Chancellor for Academic Affairs, the Interim Vice Chancellor for Business Affairs, and President ad Interim Sorber that the U. T. Board of Regents approve the recommendations listed below for the U. T. Arlington University Center Fire and Life Safety Project: Architecturally or Historically Significant:
Yes No
Project Delivery Method: Competitive Sealed Proposals
Substantial Completion Date: June 2004
Total Project Cost: Source* RFS
Current -
Proposed $1,170,000
Debt Service: The debt will be repaid from U. T. Arlington's auxiliary enterprise income and fund balances. The $1,170,000 will be funded by commercial paper notes and retired over five years. The annual debt service coverage on this project is expected to be at least 1.8 times.
37
Recommendations:
a. amend the FY 2004-2009 Capital Improvement Program and the FY 2004-2005 Capital Budget to include the University Center Fire and Life Safety Project at U. T. Arlington at a preliminary project cost of $1,170,000 with funding from Revenue Financing System Bond Proceeds;
b. authorize U. T. Arlington to manage the total project budgets,
appoint architects, approve facility programs, prepare final plans, and award contracts;
c. appropriate funds and authorize expenditure of $1,170,000 from
Revenue Financing System Bond Proceeds; and d. make the “finding of fact” determinations required by Section 5 of
the Master Resolution regarding the ability to repay debt prior to the issuance of additional Revenue Financing System parity debt.
Project Description: U. T. Arlington prepared a campus-wide survey to determine general
compliance with good fire protection and life safety practice. The University Center currently has an outdated fire alarm system throughout, along with a fire sprinkler system in approximately 60% of the building. The University Center Fire and Life Safety Project will update and replace the existing fire alarm and fire sprinkler systems and add to the existing fire suppression system in the University Center to ensure compliance as defined by the National Fire Protection Association (NFPA) 101, 2000 Edition. Due to the coordination issues, this repair and rehabilitation project would best be managed by the U. T. Arlington Facilities Management personnel who have the experience and capability to manage all aspects of the work. This off-cycle project has been approved by U. T. System staff and meets the criteria for inclusion in the Capital Improvement Program.
*Funding Source = RFS (Revenue Financing System Bond Proceeds) 8. U. T. Austin: Authorization to lease approximately 45.783 acres of land in
Austin, Travis County, Texas
RECOMMENDATION The Chancellor concurs in the recommendation of the Executive Vice Chancellor for Academic Affairs, the Interim Vice Chancellor for Business Affairs, and President Faulkner that authorization be given for the U. T. System Real Estate Office, on behalf of U. T. Austin, to lease approximately 45.783 acres of land in Austin, Travis County, Texas, to the Simon Property Group, Inc., or affiliated business entity.
38
It is further recommended that the Interim Vice Chancellor for Business Affairs or the Executive Director of Real Estate be authorized to execute all documents, instruments and other agreements, and to take all further actions deemed necessary or advisable to carry out the purpose and intent of the foregoing recommendation.
BACKGROUND INFORMATION On July 7, 2003, the U. T. Board of Regents reviewed ground lease proposals sub-mitted by six development firms in response to a Request for Ground Lease Proposals issued on May 1, 2003, by the U. T. System Real Estate Office on behalf of U. T. Austin. The Board authorized negotiations with the Simon Property Group for the ground lease of approximately 45.8 acres of vacant land located immediately west of the main J. J. Pickle Research Campus in Austin, Texas.
39

This page left intentionally blank.
40

9. U. T. Dallas: Approval of M.S. in Biotechnology
RECOMMENDATION The Chancellor concurs in the recommendation of the Executive Vice Chancellor for Academic Affairs and President Jenifer that authorization be granted to establish a Master of Science in Biotechnology at U. T. Dallas; to submit the proposal to the Texas Higher Education Coordinating Board for review and appropriate action; and to autho-rize the Executive Vice Chancellor for Academic Affairs to certify on behalf of the Board of Regents that relevant Coordinating Board criteria for approval by the Commissioner of Higher Education have been met. In addition, the Coordinating Board will be asked to change the Table of Programs for U. T. Dallas to reflect authorization for the proposed degree program. Upon approval by the Coordinating Board, the next appropriate catalog published at U. T. Dallas will be amended to reflect this action.
BACKGROUND INFORMATION Program Description The primary educational objective of the proposed program is to provide a profes-sional master's degree that links the technical skills of students and the needs of biotechnology companies in the Dallas/Fort Worth Metroplex. Because biotechnology companies need employees with a wide variety of disciplinary backgrounds, the pro-gram is designed to combine a rigorous 12 semester credit hour core of biology with 24 semester credit hours of electives from the fields of chemistry, computer science, mathematics, management, and political economy. The program will target students who have just completed their baccalaureate degrees and an important group of individuals who have entered career employment and who seek to enhance their skills, such as individuals who seek to use their chemistry, computer science, or management degrees in the new and growing area of biotechnology. Program Quality The proposed program will be administered by the School of Natural Sciences and Mathematics. The School currently offers master's and doctoral degrees in Chemistry, Mathematics, Molecular and Cell Biology, Physics, and Science Education. The same highly qualified faculty who teach and conduct research in these graduate degree pro-grams will teach the core courses for the proposed program.
41
Program Cost Estimated expenditures for the first five years of the proposed program are $376,500. This includes $160,000 for new faculty salaries, $90,000 for program administration, $90,000 for new graduate assistantships, $12,500 for clerical staff, and $24,000 for supplies and materials. U. T. Dallas will commit $141,000 of existing resources in addition to $409,416 in formula funding to finance the first five years of the program. 10. U. T. Dallas: Campus Housing Phase IX - Amendment of FY 2004-2009
Capital Improvement Program and the FY 2004-2005 Capital Budget to include project
RECOMMENDATION The Chancellor concurs in the recommendation of the Executive Vice Chancellor for Academic Affairs, the Interim Vice Chancellor for Business Affairs, and President Jenifer that the U. T. Board of Regents amend the FY 2004-2009 Capital Improvement Pro-gram and the FY 2004-2005 Capital Budget to include the Campus Housing Phase IX project at U. T. Dallas. Architecturally or Historically Significant:
(Note: Item is before the Board; see Item 10 on Page 71)
Project Delivery Method: Competitive Sealed Proposals
Substantial Completion Date: July 2005
Total Project Cost: Source* RFS
Current -
Proposed $4,000,000
Project Description: U. T. Dallas has requested that the Campus Housing Phase IX project begin because of the anticipated growth in enrollment and the heavy demand for housing. Current facilities are operating at close to 100% occupancy. The number of beds will increase by approximately 200 to be constructed in garden-style apartments. This off-cycle project has been approved by U. T. System staff and meets the criteria for inclusion in the Capital Improvement Program.
*Funding Source = RFS (Revenue Financing System Bond Proceeds)
42
11. U. T. Dallas: Center for BrainHealth - Amendment of FY 2004-2009 Capital Improvement Program and the FY 2004-2005 Capital Budget to include project
RECOMMENDATION The Chancellor concurs in the recommendation of the Executive Vice Chancellor for Academic Affairs, the Interim Vice Chancellor for Business Affairs, and President Jenifer that the U. T. Board of Regents amend the FY 2004-2009 Capital Improvement Pro-gram and the FY 2004-2005 Capital Budget to include the Center for BrainHealth project at U. T. Dallas. Architecturally or Historically Significant:
(Note: Item is before the Board; see Item 10 on Page 71)
Project Delivery Method: Competitive Sealed Proposals
Substantial Completion Date: October 2005
Total Project Cost: Source Gifts
Current –
Proposed $5,000,000
Project Description: U. T. Dallas has received a significant contribution to support the building or the acquisition of a facility to house the Center for BrainHealth. The Center, which conducts innovative research and provides clinical services for a variety of brain disorders including brain injury, Alzheimer's disease, and stroke, is an important initiative and hasgenerated significant community support in addition to this pledge. This off-cycle project has been approved by U. T. System staff and meets the criteria for inclusion in the Capital Improvement Program.
12. U. T. Dallas: Natural Science and Engineering Research Building -
Amendment of FY 2004-2009 Capital Improvement Program and the FY 2004-2005 Capital Budget to include project
RECOMMENDATION The Chancellor concurs in the recommendation of the Executive Vice Chancellor for Academic Affairs, the Interim Vice Chancellor for Business Affairs, and President Jenifer that the U. T. Board of Regents amend the FY 2004-2009 Capital Improvement Program and the FY 2004-2005 Capital Budget to include the Natural Science and Engineering Research Building project at U. T. Dallas.
43
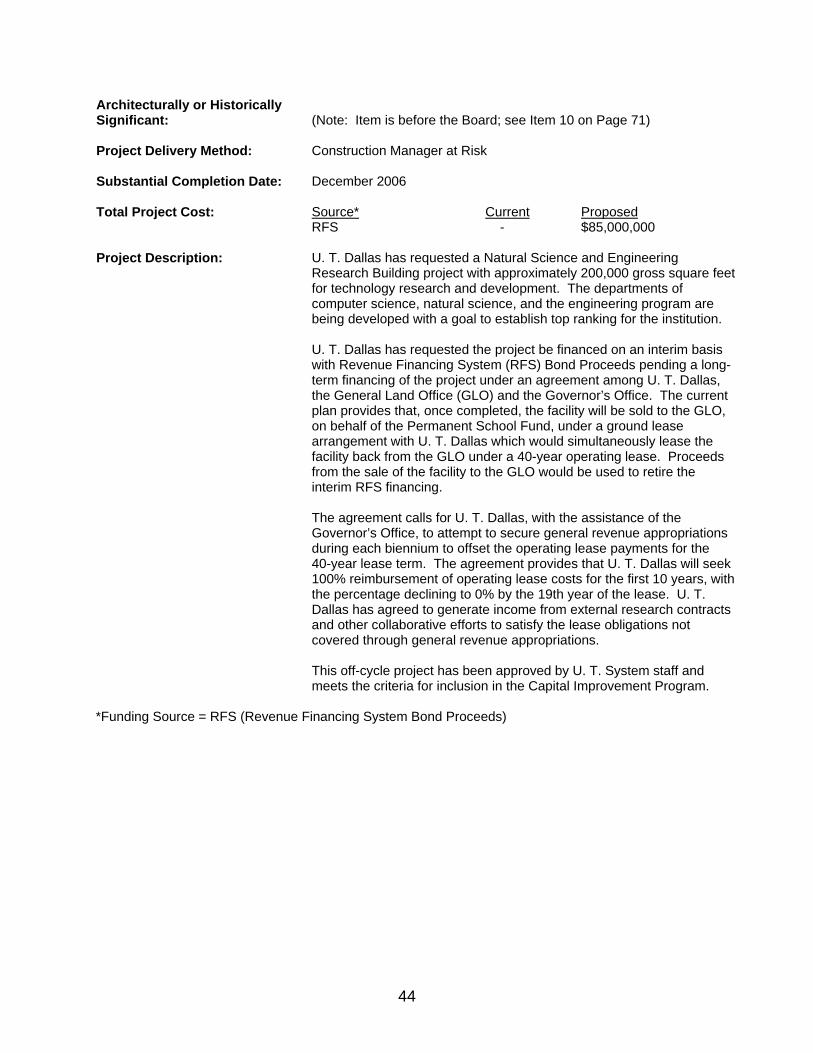
Architecturally or Historically Significant:
(Note: Item is before the Board; see Item 10 on Page 71)
Project Delivery Method: Construction Manager at Risk
Substantial Completion Date: December 2006
Total Project Cost: Source* RFS
Current -
Proposed $85,000,000
Project Description: U. T. Dallas has requested a Natural Science and Engineering Research Building project with approximately 200,000 gross square feet for technology research and development. The departments of computer science, natural science, and the engineering program are being developed with a goal to establish top ranking for the institution. U. T. Dallas has requested the project be financed on an interim basis with Revenue Financing System (RFS) Bond Proceeds pending a long-term financing of the project under an agreement among U. T. Dallas, the General Land Office (GLO) and the Governor’s Office. The current plan provides that, once completed, the facility will be sold to the GLO, on behalf of the Permanent School Fund, under a ground lease arrangement with U. T. Dallas which would simultaneously lease the facility back from the GLO under a 40-year operating lease. Proceeds from the sale of the facility to the GLO would be used to retire the interim RFS financing. The agreement calls for U. T. Dallas, with the assistance of the Governor’s Office, to attempt to secure general revenue appropriations during each biennium to offset the operating lease payments for the 40-year lease term. The agreement provides that U. T. Dallas will seek 100% reimbursement of operating lease costs for the first 10 years, with the percentage declining to 0% by the 19th year of the lease. U. T. Dallas has agreed to generate income from external research contracts and other collaborative efforts to satisfy the lease obligations not covered through general revenue appropriations.
This off-cycle project has been approved by U. T. System staff and meets the criteria for inclusion in the Capital Improvement Program.
*Funding Source = RFS (Revenue Financing System Bond Proceeds)
44
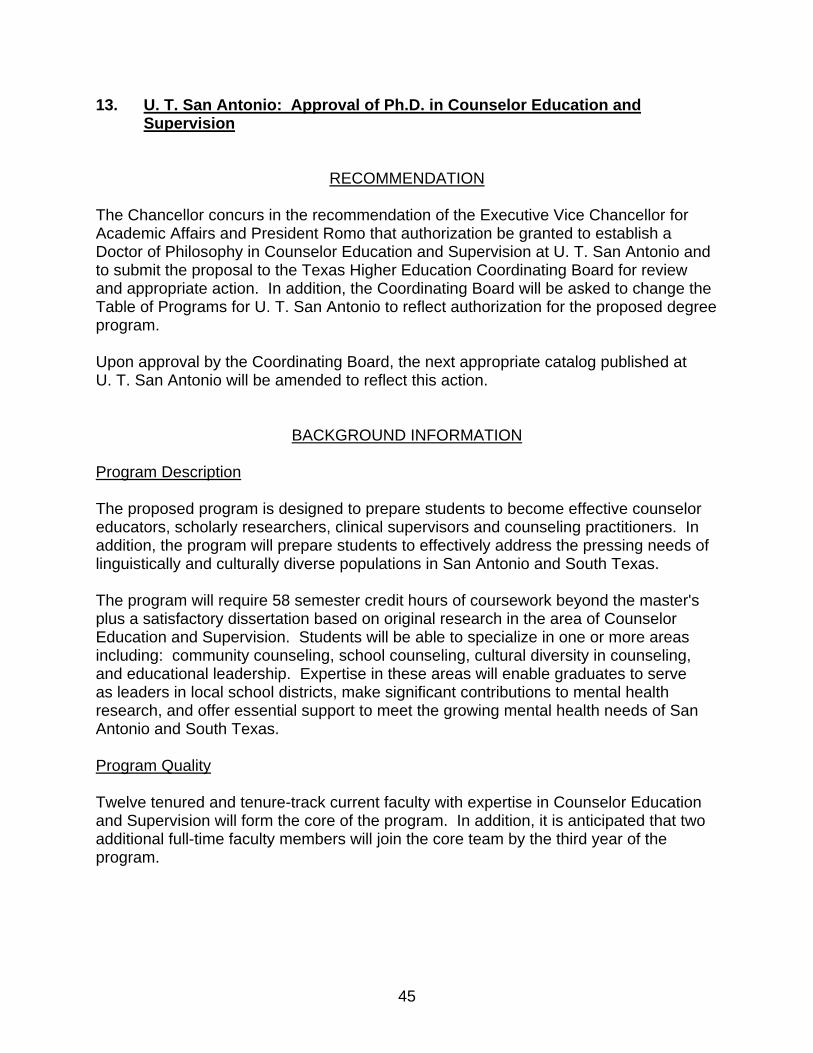
13. U. T. San Antonio: Approval of Ph.D. in Counselor Education and Supervision
RECOMMENDATION The Chancellor concurs in the recommendation of the Executive Vice Chancellor for Academic Affairs and President Romo that authorization be granted to establish a Doctor of Philosophy in Counselor Education and Supervision at U. T. San Antonio and to submit the proposal to the Texas Higher Education Coordinating Board for review and appropriate action. In addition, the Coordinating Board will be asked to change the Table of Programs for U. T. San Antonio to reflect authorization for the proposed degree program. Upon approval by the Coordinating Board, the next appropriate catalog published at U. T. San Antonio will be amended to reflect this action.
BACKGROUND INFORMATION Program Description The proposed program is designed to prepare students to become effective counselor educators, scholarly researchers, clinical supervisors and counseling practitioners. In addition, the program will prepare students to effectively address the pressing needs of linguistically and culturally diverse populations in San Antonio and South Texas. The program will require 58 semester credit hours of coursework beyond the master's plus a satisfactory dissertation based on original research in the area of Counselor Education and Supervision. Students will be able to specialize in one or more areas including: community counseling, school counseling, cultural diversity in counseling, and educational leadership. Expertise in these areas will enable graduates to serve as leaders in local school districts, make significant contributions to mental health research, and offer essential support to meet the growing mental health needs of San Antonio and South Texas. Program Quality Twelve tenured and tenure-track current faculty with expertise in Counselor Education and Supervision will form the core of the program. In addition, it is anticipated that two additional full-time faculty members will join the core team by the third year of the program.
45

The Counseling faculty and staff have recently moved to the newly constructed Durango Building at the U. T. San Antonio Downtown campus. An existing clinic in the building includes audiovisual equipment and will be used to provide students with supervised clinical experience. Program Cost Estimated expenditures for the first five years of the program total $2,010,500. This includes $747,500 for new faculty salaries; $82,500 for new program administrative costs; $546,000 for student fellowships; $409,500 for new teaching assistantships; $125,000 for new clerical staff; and $100,000 for supplies, materials, and equipment. U. T. San Antonio will commit $1,405,024 of existing resources ($981,000 reallocated from department funds and $424,024 reallocated from other University funds) in addition to $663,941 in formula funding to finance the first five years of the program. 14. U. T. San Antonio: East Campus Building Phase I - Amendment of
FY 2004-2009 Capital Improvement Program and the FY 2004-2005 Capital Budget to include project
RECOMMENDATION The Chancellor concurs in the recommendation of the Executive Vice Chancellor for Academic Affairs, the Interim Vice Chancellor for Business Affairs, and President Romo that the U. T. Board of Regents amend the FY 2004-2009 Capital Improvement Pro-gram and the FY 2004-2005 Capital Budget to include the East Campus Building Phase I project at U. T. San Antonio. Architecturally or Historically Significant:
(Note: Item is before the Board; see Item 10 on Page 71)
Project Delivery Method: Competitive Sealed Proposals
Substantial Completion Date: November 2007
Total Project Cost: Source* RFS Gifts
Current –
Proposed $72,000,000 $ 3,000,000 $75,000,000
46

Project Description: Phase I of this project is a multiphase plan for developing U. T. San Antonio's East Campus Master Plan. The project would consist of a 150,000 gross square foot Research Building to include seminar rooms and conferencing facilities, research laboratories, faculty and staff offices, and student and faculty support facilities. This building would include sophisticated information technology features designed and installed for an information-intensive environment. This off-cycle project has been approved by U. T. System staff and meets the criteria for inclusion in the Capital Improvement Program.
*Funding Source = RFS (Revenue Financing System Bond Proceeds) 15. U. T. San Antonio: East Campus Thermal Energy Plant - Amendment
of FY 2004-2009 Capital Improvement Program and the FY 2004-2005 Capital Budget to include project
RECOMMENDATION The Chancellor concurs in the recommendation of the Executive Vice Chancellor for Academic Affairs, the Interim Vice Chancellor for Business Affairs, and President Romo that the U. T. Board of Regents amend the FY 2004-2009 Capital Improvement Program and the FY 2004-2005 Capital Budget to include the East Campus Thermal Energy Plant project at U. T. San Antonio. Architecturally or Historically Significant:
(Note: Item is before the Board; see Item 10 on Page 71)
Project Delivery Method: Competitive Sealed Proposals
Substantial Completion Date: December 2006
Total Project Cost: Source* RFS
Current –
Proposed $5,000,000
Project Description: The increase of U. T. San Antonio enrollment and campus growth have made expansion necessary for the undeveloped east portion of the 1604 Campus. The Thermal Energy Plant will be built in conjunction with the East Campus Building Phase I project. This project will contain approximately 25,000 gross square feet to provide chilled water, hot water and steam to support new buildings planned for the East Campus development.
This off-cycle project has been approved by U. T. System staff and meets the criteria for inclusion in the Capital Improvement Program.
*Funding Source = RFS (Revenue Financing System Bond Proceeds)
47
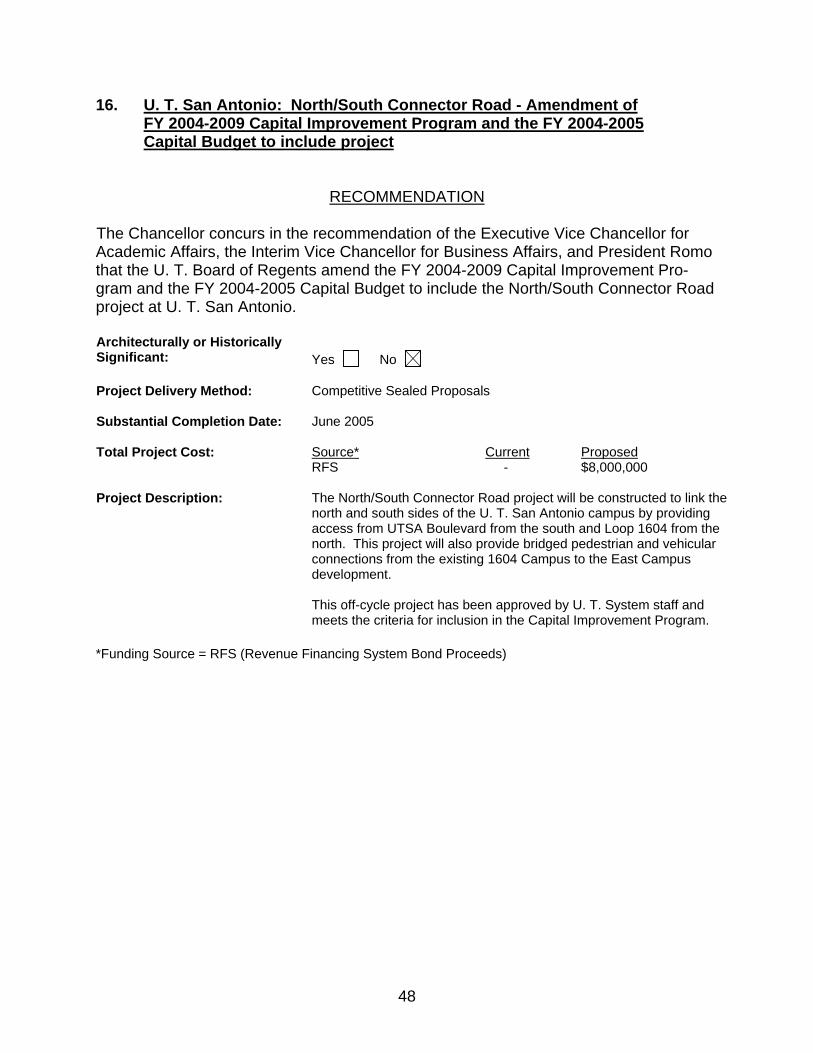
16. U. T. San Antonio: North/South Connector Road - Amendment of FY 2004-2009 Capital Improvement Program and the FY 2004-2005 Capital Budget to include project
RECOMMENDATION The Chancellor concurs in the recommendation of the Executive Vice Chancellor for Academic Affairs, the Interim Vice Chancellor for Business Affairs, and President Romo that the U. T. Board of Regents amend the FY 2004-2009 Capital Improvement Pro-gram and the FY 2004-2005 Capital Budget to include the North/South Connector Road project at U. T. San Antonio. Architecturally or Historically Significant:
Yes No
Project Delivery Method: Competitive Sealed Proposals
Substantial Completion Date: June 2005
Total Project Cost: Source* RFS
Current -
Proposed $8,000,000
Project Description: The North/South Connector Road project will be constructed to link the north and south sides of the U. T. San Antonio campus by providing access from UTSA Boulevard from the south and Loop 1604 from the north. This project will also provide bridged pedestrian and vehicular connections from the existing 1604 Campus to the East Campus development. This off-cycle project has been approved by U. T. System staff and meets the criteria for inclusion in the Capital Improvement Program.
*Funding Source = RFS (Revenue Financing System Bond Proceeds)
48

TABLE OF CONTENTS
FOR HEALTH AFFAIRS COMMITTEE
Committee Meeting: 11/12/2003 MCM Elegante Hotel
Board Meeting: 11/13/2003 U. T. Permian Basin
Rita C. Clements, Chairman H. Scott Caven, Jr. Judith L. Craven, M.D. James Richard Huffines Cyndi Taylor Krier Committee
Meeting Board Meeting
Page
Convene 3:00 p.m. Chairman Clements
1. U. T. System: Requested revision of Mission Statements for U. T. Health Science Center - Houston and U. T. Health Center - Tyler and expansion of degree planning authority for U. T. Health Science Center - San Antonio
3:05 p.m. Action Dr. Guckian
Action
49
2. U. T. Health Science Center - Houston: Approval to name the Institute of Molecular Medicine for the Prevention of Human Diseases as the Brown Foundation Institute of Molecular Medicine for the Prevention of Human Diseases (Regents' Rules and Regulations, Part Two, Chapter VIII, Section 1, Subsection 1.3, Honorific Namings)
3:10 p.m. Action Dr. Willerson
Action
55
3. U. T. Health Science Center - San Antonio: Medical Integrated Plaza Feasibility and Planning Study - Amendment of FY 2004-2009 Capital Improvement Program and the FY 2004-2005 Capital Budget to include study
3:15 p.m. Action Mr. Sanders
Action
55
4. U. T. Health Science Center - San Antonio: Recommendation for approval to include adjustment in allocation of royalties and award of incentive payments as provisions of institutional Invention Revenue Sharing Policy
3:20 p.m. Action Dr. Cigarroa
Action
56
5. U. T. Health Science Center - San Antonio: Authorization to conduct a private fundraising campaign
3:30 p.m. Action Dr. Cigarroa
Action
57
6. Expanded role with U. T. Austin and other organizations in medical education and health research in Austin
3:45 p.m. Discussion Dr. Guckian
Not on Agenda
58
Adjourn
i
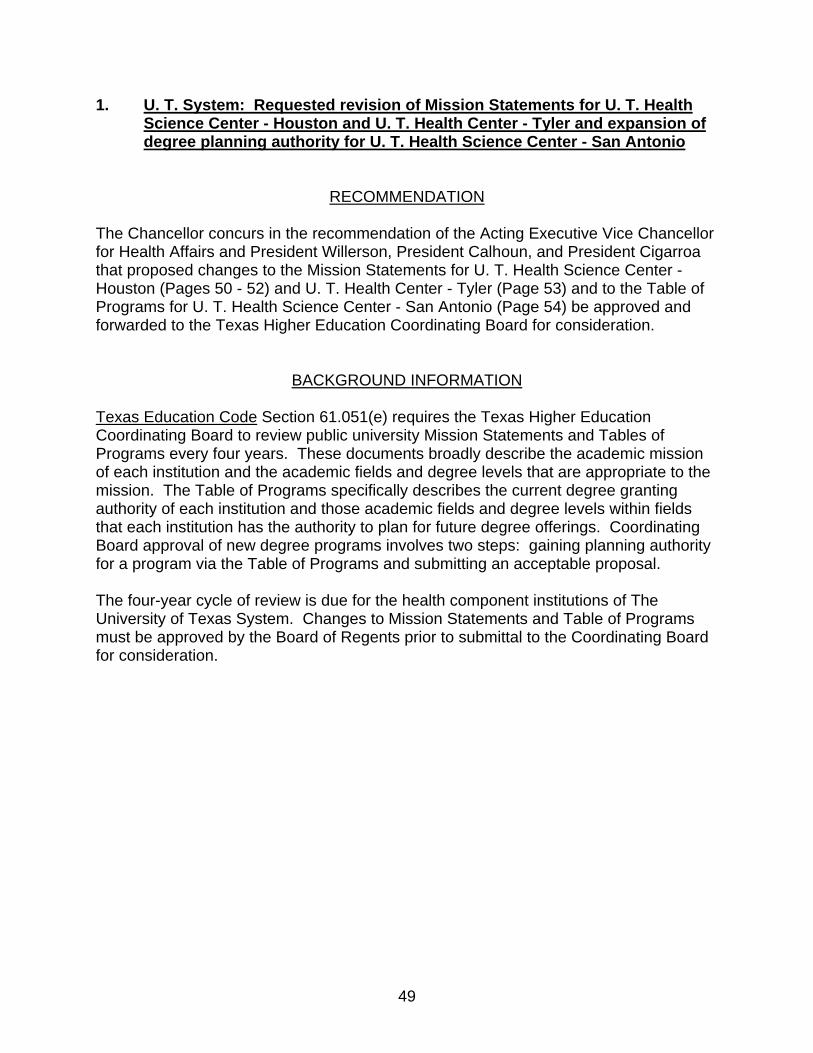
1. U. T. System: Requested revision of Mission Statements for U. T. Health Science Center - Houston and U. T. Health Center - Tyler and expansion of degree planning authority for U. T. Health Science Center - San Antonio
RECOMMENDATION The Chancellor concurs in the recommendation of the Acting Executive Vice Chancellor for Health Affairs and President Willerson, President Calhoun, and President Cigarroa that proposed changes to the Mission Statements for U. T. Health Science Center - Houston (Pages 50 - 52) and U. T. Health Center - Tyler (Page 53) and to the Table of Programs for U. T. Health Science Center - San Antonio (Page 54) be approved and forwarded to the Texas Higher Education Coordinating Board for consideration.
BACKGROUND INFORMATION Texas Education Code Section 61.051(e) requires the Texas Higher Education Coordinating Board to review public university Mission Statements and Tables of Programs every four years. These documents broadly describe the academic mission of each institution and the academic fields and degree levels that are appropriate to the mission. The Table of Programs specifically describes the current degree granting authority of each institution and those academic fields and degree levels within fields that each institution has the authority to plan for future degree offerings. Coordinating Board approval of new degree programs involves two steps: gaining planning authority for a program via the Table of Programs and submitting an acceptable proposal. The four-year cycle of review is due for the health component institutions of The University of Texas System. Changes to Mission Statements and Table of Programs must be approved by the Board of Regents prior to submittal to the Coordinating Board for consideration.
49


The University of Texas Health Center at Tyler
Proposed Mission Statement
To serve East Texas and beyond through excellent patient care and community health, comprehensive education, and innovative research.
Current Mission Statement The University of Texas Health Center at Tyler will provide the citizens of Texas with leadership and excellence in the diagnosis, treatment, and prevention of diseases, and in primary patient care, biomedical research and health education with an emphasis on cardiopulmonary disease.
53

The University of Texas Health Science Center at San Antonio Requested Expansion of Degree Planning Authority
Dentistry: Planning Authority for an integrated D.D.S. /
Ph.D. in Dentistry Medicine: Planning Authority for an integrated M.D. /
Ph.D. in Medicine
54

2. U. T. Health Science Center - Houston: Approval to name the Institute
of Molecular Medicine for the Prevention of Human Diseases as the Brown Foundation Institute of Molecular Medicine for the Prevention of Human Diseases (Regents' Rules and Regulations, Part Two, Chapter VIII, Sec-tion 1, Subsection 1.3, Honorific Namings)
RECOMMENDATION The Chancellor concurs in the recommendation of the Acting Executive Vice Chancellor for Health Affairs, the Vice Chancellor for External Relations, and President Willerson that approval be given U. T. Health Science Center - Houston to name the Institute of Molecular Medicine for the Prevention of Human Diseases as the Brown Foundation Institute of Molecular Medicine for the Prevention of Human Diseases.
BACKGROUND INFORMATION The Brown Foundation of Houston has been a longtime supporter of The University of Texas Health Science Center at Houston. The Foundation made a recent contribution of $20 million to the Health Science Center's New Frontiers Campaign. In recognition of the Foundation's continuous and generous support, it is fitting that one of the institution's major research centers be named in honor of the Foundation. The Brown Foundation Institute of Molecular Medicine for the Prevention of Human Diseases designates the official name of the center rather than the building. The specific name is in agreement with the action of the Foundation's Board of Trustees on Septem-ber 16, 2003. 3. U. T. Health Science Center - San Antonio: Medical Integrated Plaza
Feasibility and Planning Study - Amendment of FY 2004-2009 Capital Improvement Program and the FY 2004-2005 Capital Budget to include study
RECOMMENDATION The Chancellor concurs in the recommendation of the Acting Executive Vice Chancellor for Health Affairs, the Interim Vice Chancellor for Business Affairs, and President Cigarroa that the U. T. Board of Regents amend the FY 2004-2009 Capital Improvement Program and the FY 2004-2005 Capital Budget to include the Medical Integrated Plaza Feasibility and Planning Study at U. T. Health Science Center - San Antonio at a preliminary project cost of $300,000 with funding from Medical Services, Research and Development Plan.
55

BACKGROUND INFORMATION U. T. Health Science Center - San Antonio intends to explore the feasibility of developing an ambulatory clinic building to support the medical practice plan of the institution's medical faculty. Such a facility would allow the institution greater control in delivering health-care service, and enhancing the financial efficiency. In order to determine the feasibility, scope, and budget of the project, the institution will need to complete a facility use program involving preliminary design and the cost estimate. The Medical Integrated Plaza Feasibility and Planning Study at U. T. Health Science Center - San Antonio will help determine the scope of the project which will be submitted to the U. T. Board of Regents for approval at a future date.
4. U. T. Health Science Center - San Antonio: Recommendation for approval
to include adjustment in allocation of royalties and award of incentive payments as provisions of institutional Invention Revenue Sharing Policy
RECOMMENDATION The Chancellor concurs in the recommendation of the Acting Executive Vice Chancellor for Health Affairs, the Interim Vice Chancellor for Business Affairs, and the Vice Chancellor and General Counsel that The University of Texas Health Science Center at San Antonio be authorized to include provisions in its institutional Invention Revenue Sharing Policy to adjust the allocation of royalties, based upon net intellectual property income, as set out below:
Amount* Inventor HSC Unit** Dean ≤ $250,000 40% 27.5% 27.5% 5% >$250,000 40% 37.5% 17.5% 5%
*Net intellectual property income **Unit refers to the appropriate department, center, etc. When this is unclear, the Institutional Intellectual Property Advisory Committee will determine the appropriate unit.
It is further recommended that the institution be authorized to include provisions for award of incentive payments in its Invention Revenue Sharing Policy as follows:
• $250, shared by inventor(s), upon approval to go forward with the patent
application; and • $2,000, shared by the inventor(s), when patent is granted.
56

BACKGROUND INFORMATION Part Two, Chapter XII, Section 4, Subsection 4.2, Subdivision 4.25 of the Regents' Rules and Regulations provides that components may change the default royalty-sharing provision of 50% to the inventor(s) and 50% to the employing U. T. System institution with the Board's prior approval via an agenda item. Subdivision 4.25 requires that “in no event” shall the inventor receive more than 50% or less than 25% of such royalty proceeds. U. T. Health Science Center - San Antonio believes the proposed alternative royalty-sharing allocation and incentive payment authorization will encourage faculty to apply for patents and more appropriately reward the departments in which they are employed. The proposed policy changes are consistent with recommendations of a U. T. System Task Force on Technology Transfer presented to the Board’s Finance and Planning Committee on April 2, 2002. The Task Force recommended allocation of 40% of the royalties to the inventor and 60% to the institution. The proposed policy changes have been the subject of considerable review and discussion by faculty, staff, and administrators at U. T. Health Science Center - San Antonio and have received a favorable response.
5. U. T. Health Science Center - San Antonio: Authorization to conduct a
private fundraising campaign
RECOMMENDATION The Chancellor concurs in the recommendation of the Acting Executive Vice Chancellor for Health Affairs, the Vice Chancellor for External Relations, and President Cigarroa that authorization be given for U. T. Health Science Center - San Antonio to conduct a private fundraising campaign to fund priority areas of excellence pursuant to the Regents' Rules and Regulations, Part One, Chapter VII, Section 5, Subsection 5.5.
BACKGROUND INFORMATION Over the past three years, groundwork has been laid for a comprehensive fundraising campaign. After careful study, a recommendation was made to proceed with the campaign, which received unanimous endorsement by The University of Texas Health Science Center at San Antonio's Development Board on November 6, 2002.
57

The proposed campaign will focus on a major research building in the South Texas Medical Center and funding for five areas of excellence including (1) cardiovascular and metabolic biology, (2) neurobiology, (3) developmental and regenerative biology, (4) cancer biology, and (5) biodefense and infection. A goal for private sector support has been set at $200 million over five years, beginning January 1, 2004, and concluding December 31, 2008. To accomplish this goal, U. T. Health Science Center - San Antonio has worked to strengthen development and other volunteer organizations and continue to implement plans for alumni involvement. 6. Expanded role with U. T. Austin and other organizations in medical
education and health research in Austin
PURPOSE Dr. Guckian will lead a discussion of proposed collaborative plans for possible expanded medical education and research in Austin. No action is requested of the Board of Regents at this time. Any program or agreement requiring Regental action (for example, joint degree programs and contracts) will be presented for action at a later date.
BACKGROUND INFORMATION The University of Texas Medical Branch at Galveston has a long history of medical service and partnership in Austin. U. T. Medical Branch - Galveston has been training residents at Brackenridge Hospital since the 1950s. The 77th and 78th Legislatures authorized U. T. Medical Branch - Galveston to spend appropriated and institutional funds to support and develop student and resident training services in Austin (General Appropriations Act, Article III, Section 7). In 2002, 106 U. T. Medical Branch - Galveston medical students performed clerkships in Austin; U. T. Medical Branch - Galveston currently has 112 medical students in clerkships in Austin. Most recently, U. T. Medical Branch - Galveston presented to the accrediting body for medical residencies, the Residency Review Committee (RRC), its plan for an Austin-based U. T. Medical Branch - Galveston Obstetrics/Gynecology residency. U. T. Medical Branch - Galveston has entered into discussions with a number of organizations in Central Texas, with the U. T. Austin Graduate School establishing a M.D./Ph.D. program, with Seton/Brackenridge Hospital regarding expanding the number of residency programs and medical students in Austin, and with the Central Texas Veterans Healthcare System (VA System) regarding additional services provided to veterans and participating in clinical research. The U. T. Health Science Center - Houston School of Public Health likewise has entered into discussions with U. T. Austin
58

and the Texas Department of Health regarding collaborative planning in research and education. These collaborations would complement and benefit all three U. T. com-ponent institutions. Examples include bioengineering, informatics, and expanded and diverse clinical experiences for students and residents. Eventually, these organizations, along with several others, decided to work and plan more formally. As a consequence, they formed a nonprofit association, Central Texas Institute for Research and Education in Medicine and Biotechnology (CTI). CTI is committed to the advancement and application of biomedical research and health science education in Central Texas. Members of CTI include: • The University of Texas at Austin • The University of Texas Medical Branch at Galveston • The University of Texas School of Public Health at Houston • Daughters of Charity Health Services (Seton Medical Center/Brackenridge Hospital) - Austin • St. David's Healthcare Partnership - Austin • Central Texas Veterans Healthcare System - Temple • Greater Austin Chamber of Commerce The University of Texas Health Science Center at San Antonio recently appointed an advisory representative to CTI. EDUCATIONAL GOALS OF CTI Expand Health Professional Education in Austin To support, enhance, and bring recognition to undergraduate and graduate medical education by • providing a system for education of medical students and residents through
affiliated in-patient facilities and clinics in Austin; • studying community needs and providing additional residency programs to
address those needs; and • expanding access to health services to, and public health infrastructure for,
citizens in Central Texas. Establish Joint Degree Programs A jointly developed curriculum for M.D./Ph.D. (U. T. Austin and U. T. Medical Branch - Galveston) and M.D./Master of Public Health programs (U. T. Austin and U. T. Medical Branch - Galveston; U. T. Austin and U. T. School of Public Health - Houston) will be planned.
59

Expand School of Public Health Programs Strengthen public health activities in Austin by building relationships with other public health entities for the purpose of collaborating on meaningful and functional public health projects. Health-care Workforce Development To collaborate, develop, and participate in the coordination of health science education and training at the community college, undergraduate, and graduate levels for the purpose of creating a supply of medical personnel to staff area medical facilities. RESEARCH GOALS OF CTI Increase Multi-Institutional Collaboration • Develop facilities, infrastructure, and personnel • Joint work on clinical studies • Develop wet lab space • Acquire medical instrumentation • Imaging Center (The VA System, U. T. Austin and U. T. Medical Branch -
Galveston plan to install and operate an imaging center by the end of 2004.) • Move basic science research to commercialization • Collaborative grant writing Enhance the Development of Intellectual Property for Commercialization Interface with business community for the commercialization of biomedical and biotech research. Outcome of interfacing is to gain venture capital, business plans, and marketing expertise and to produce patents, products, and services. Increase Influence on Public Policy Through Evidence-Based Research Develop the capacity to enable researchers and public health students to collaborate and consolidate research expertise for all areas of public health. Expected outcomes are reports on the health of Texas and to translate research findings into public health policy.
60
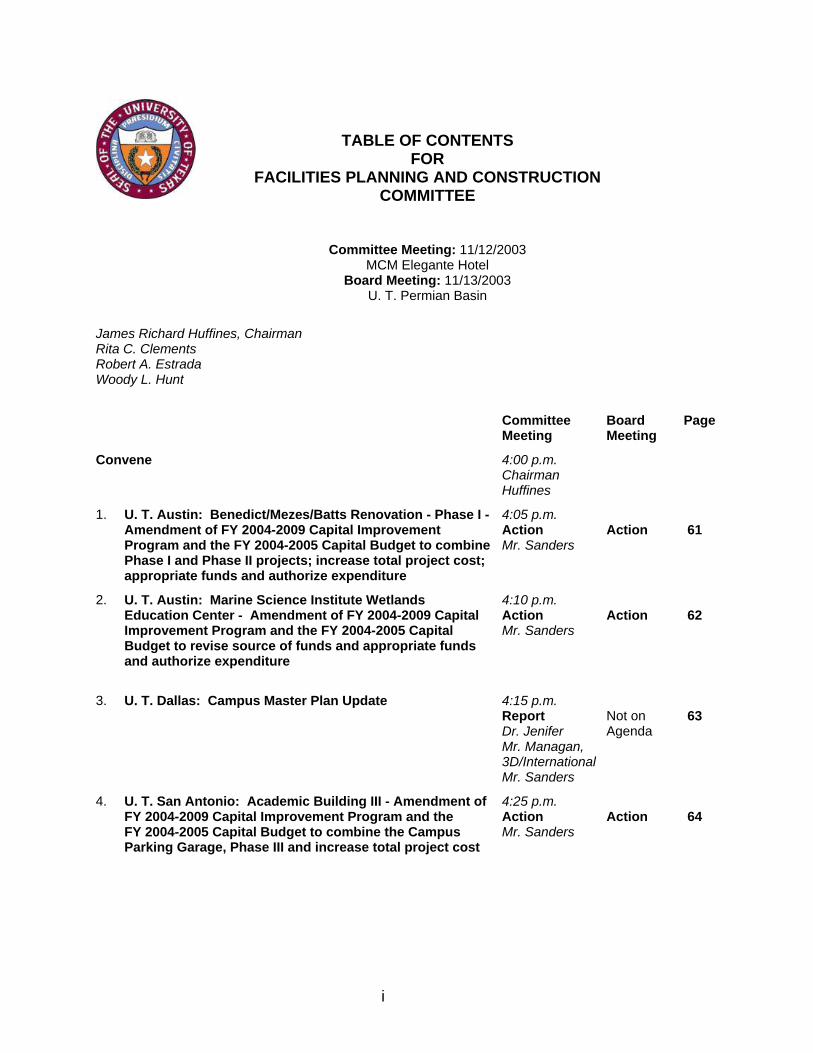
TABLE OF CONTENTS FOR
FACILITIES PLANNING AND CONSTRUCTION COMMITTEE
Committee Meeting: 11/12/2003 MCM Elegante Hotel
Board Meeting: 11/13/2003 U. T. Permian Basin
James Richard Huffines, Chairman Rita C. Clements Robert A. Estrada Woody L. Hunt
Committee Meeting
Board Meeting
Page
Convene 4:00 p.m. Chairman Huffines
1. U. T. Austin: Benedict/Mezes/Batts Renovation - Phase I - Amendment of FY 2004-2009 Capital Improvement Program and the FY 2004-2005 Capital Budget to combine Phase I and Phase II projects; increase total project cost; appropriate funds and authorize expenditure
4:05 p.m. Action Mr. Sanders
Action
61
2. U. T. Austin: Marine Science Institute Wetlands Education Center - Amendment of FY 2004-2009 Capital Improvement Program and the FY 2004-2005 Capital Budget to revise source of funds and appropriate funds and authorize expenditure
4:10 p.m. Action Mr. Sanders
Action
62
3. U. T. Dallas: Campus Master Plan Update 4:15 p.m. Report Dr. Jenifer Mr. Managan, 3D/International Mr. Sanders
Not on Agenda
63
4. U. T. San Antonio: Academic Building III - Amendment of FY 2004-2009 Capital Improvement Program and the FY 2004-2005 Capital Budget to combine the Campus Parking Garage, Phase III and increase total project cost
4:25 p.m. Action Mr. Sanders
Action
64
i

Committee
Meeting Board Meeting
Page
5. U. T. San Antonio: Biotechnology, Sciences and Engineering Building (West Campus Wet Lab phase) - Amendment of FY 2004-2009 Capital Improvement Program and the FY 2004-2005 Capital Budget to increase the total project cost; revise the source of funds; appropriate funds and authorize expenditure; and parity debt
4:30 p.m. Action Mr. Sanders
Action
65
6. U. T. Tyler: Student Apartments - Approve design development; approve alternative energy economic feasibility; approve total project cost; appropriate funds and authorize expenditure; and parity debt
4:35 p.m. Action Mr. Sanders
Action
66
7. U. T. Tyler: Student Dormitory and Academic Excellence Center - Approve design development; approve alternative energy economic feasibility; approve total project cost; appropriate funds and authorize expenditure; and parity debt
4:40 p.m. Action Mr. Sanders
Action
68
8. U. T. Medical Branch - Galveston: BSL-4 Laboratory Facility - Honorific Naming of Facility as the John Sealy Pavilion for Infectious Disease Research and Honorific Naming of Laboratory as the Robert E. Shope Laboratory
4:45 p.m. Action Mr. Sanders
Action
69
9. U. T. Health Science Center - Houston: Recreation Center Reconstruction - Amendment of FY 2004-2009 Capital Improvement Program and the FY 2004-2005 Capital Budget to increase total project cost and appropriate funds and authorize expenditure
4:50 p.m. Action Mr. Sanders
Action
70
10. U. T. System: Consideration of architecturally significant projects
4:55 p.m. Action Mr. Sanders
Not on Agenda
71
11. U. T. System: Historically Underutilized Businesses (HUB) Report and Update on Bonding and Technical Assistance program
4:58 p.m. Report Mr. Sanders
Not on Agenda
73
Adjourn
ii
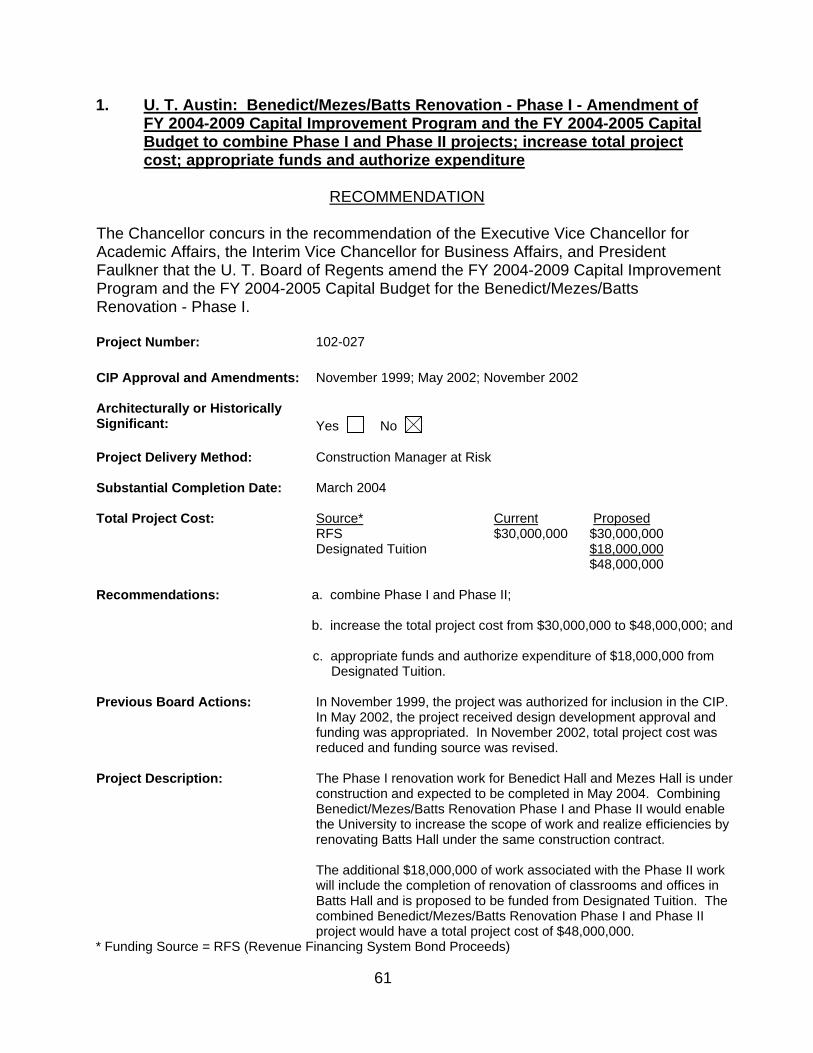
1. U. T. Austin: Benedict/Mezes/Batts Renovation - Phase I - Amendment of FY 2004-2009 Capital Improvement Program and the FY 2004-2005 Capital Budget to combine Phase I and Phase II projects; increase total project cost; appropriate funds and authorize expenditure
RECOMMENDATION
The Chancellor concurs in the recommendation of the Executive Vice Chancellor for Academic Affairs, the Interim Vice Chancellor for Business Affairs, and President Faulkner that the U. T. Board of Regents amend the FY 2004-2009 Capital Improvement Program and the FY 2004-2005 Capital Budget for the Benedict/Mezes/Batts Renovation - Phase I. Project Number: 102-027 CIP Approval and Amendments:
November 1999; May 2002; November 2002
Architecturally or Historically Significant:
Yes No
Project Delivery Method: Construction Manager at Risk
Substantial Completion Date: March 2004
Total Project Cost: Source* RFS Designated Tuition
Current $30,000,000
Proposed$30,000,000 $18,000,000$48,000,000
Recommendations:
a. combine Phase I and Phase II; b. increase the total project cost from $30,000,000 to $48,000,000; and c. appropriate funds and authorize expenditure of $18,000,000 from Designated Tuition.
Previous Board Actions: In November 1999, the project was authorized for inclusion in the CIP. In May 2002, the project received design development approval and funding was appropriated. In November 2002, total project cost was reduced and funding source was revised.
Project Description: The Phase I renovation work for Benedict Hall and Mezes Hall is under construction and expected to be completed in May 2004. Combining Benedict/Mezes/Batts Renovation Phase I and Phase II would enable the University to increase the scope of work and realize efficiencies by renovating Batts Hall under the same construction contract. The additional $18,000,000 of work associated with the Phase II work will include the completion of renovation of classrooms and offices in Batts Hall and is proposed to be funded from Designated Tuition. The combined Benedict/Mezes/Batts Renovation Phase I and Phase II project would have a total project cost of $48,000,000.
* Funding Source = RFS (Revenue Financing System Bond Proceeds)
61
2. U. T. Austin: Marine Science Institute Wetlands Education Center -
Amendment of FY 2004-2009 Capital Improvement Program and the FY 2004-2005 Capital Budget to revise source of funds and appropriate funds and authorize expenditure
The Chancellor concurs in the recommendation of the Executive Vice Chancellor for Academic Affairs, the Interim Vice Chancellor for Business Affairs, and President Faulkner that the U. T. Board of Regents amend the FY 2004-2009 Capital Improvement Program and the FY 2004-2005 Capital Budget for the Marine Science Institute Wetlands Education Center. Project Number: 102-026 CIP Approval and Amendments:
November 1999; August 2001
Architecturally or Historically Significant:
Yes No
Project Delivery Method: Competitive Sealed Proposals
Substantial Completion Date: December 2005
Total Project Cost: Source* Grants Designated Tuition Unexpended Plant Fund Gifts
Current $4,870,000 $ 130,000 $5,000,000
Proposed$3,870,000 $450,000 $550,000 $130,000$5,000,000
Recommendations:
a. revise the source of funds; and b. appropriate funds and authorize expenditure of $450,000 of Designated Tuition and $550,000 of Unexpended Plant Funds.
Previous Board Actions: The Board of Regents originally added this project to the CIP in November 1999 at $1,000,000. The project was increased to $5,000,000 as part of the CIP approval in August 2001.
Project Description: The University of Texas at Austin seeks Board of Regents'
approval to revise the source of funds in order to enter into a Section 206 Project Cooperation Agreement with the U. S. Department of the Army (Corps of Engineers or the Corps) for the purpose of accomplishing Stage 1a of the Marine Science Institute (MSI) Wetlands Education Center. This project is currently approved by the Board of Regents with a preliminary project cost of $5,000,000 with funding from Gifts and Grants. Institutional management of Stage 1a ($1.8 million) was approved by the Chancellor in June 2003.
62
U. T. Austin is prepared to enter into an agreement with the Corps under which the Corps will perform the majority of the work in Stage 1a of the MSI Wetlands Education Center project. The total value of the Corps work is estimated at approximately $2.5 million to $2.85 million, of which 65% will be funded by the federal government under the Federal Waterways Act and 35% by U. T. Austin. To secure the federal portion of the funding for this project, U. T. Austin is required to demonstrate that it has matching funds of up to $1 million available to satisfy its obligations. Approval of the proposed change in funding satisfies the matching requirement and will allow Stage 1a to proceed. The remaining stages of the project (totaling $3.2 million) will be presented to the Board of Regents for design development approval at a future date.
Stage 1a consists of site work to construct a salt marsh and modifications to the ship channel and boat basin to create a tidal pool. Future stages will include elevated walkways, trails, modifications to the existing visitor center and related parking. This facility will enhance the MSI Public Outreach Program as well as research opportunities for MSI students.
3. U. T. Dallas: Campus Master Plan Update
REPORT Mr. Sidney J. Sanders and Mr. Mike Managan, architect with 3D/International, will narrate graphics illustrating the Campus Master Plan, 2002 at U. T. Dallas, following remarks by President Franklyn Jenifer. The original campus plan of 1971 has been substantially built out and the campus continues to experience substantial growth pressures. The plan was prepared with an assumed period of growth and change that would, by 2027, result in a student body that is double its present size from 12,500 to 25,000. The goal of this campus master plan is to facilitate the development of the buildings, streets, infrastructure, and landscaping of the built environment that supports the mission and strategic intent of U. T. Dallas.
63

4. U. T. San Antonio: Academic Building III - Amendment of FY 2004-2009 Capital Improvement Program and the FY 2004-2005 Capital Budget to combine the Campus Parking Garage, Phase III and increase total project cost
RECOMMENDATION
The Chancellor concurs in the recommendation of the Executive Vice Chancellor for Academic Affairs, the Interim Vice Chancellor for Business Affairs, and President Romo that the U. T. Board of Regents amend the FY 2004-2009 Capital Improvement Program and the FY 2004-2005 Capital Budget for the U. T. San Antonio Academic Building III.
Project Number: 401-997 CIP Approval and Amendments:
February 2000, August 2003
Architecturally or Historically Significant:
(Note: Campus Parking Garage, Phase III is before the Board as architecturally significant item; see Item 10 on Page 71.)
Project Delivery Method: Design/Build
Substantial Completion Date: March 2005
Total Project Cost: Source* PUF TRB RFS
Current $37,332,154 $15,000,000 $ 0 $52,332,154
Proposed Debt Service$37,332,154 $15,000,000 $ 9,450,000 $9,450,000 $61,782,154
Recommendations:
a. amend FY 2004-2009 Capital Improvement Program and the FY 2004-2005 Capital Budget to combine the Campus Parking
Garage, Phase III project at U. T. San Antonio with the previously approved Academic Building III; and
b. increase the total project cost from $52,332,154 to $61,782,154 with additional funding of $9,450,000 from Revenue Financing System Bond Proceeds.
Previous Board Actions: The Academic Building III project received additional funding approval in February 2000 and design development approval in August 2000. Both projects were approved in the CIP in August 2003.
Project Description: The Campus Parking Garage, Phase III project will be located immediately adjacent to the Academic Building III site. U. T. San Antonio is requesting that the projects be combined because the design team is already mobilized and understands the design characteristics. In addition, completion of the garage will help mitigate the parking shortage at the site. Design development approval will be presented to the Board at a future date.
* Funding Sources = PUF (Permanent University Fund Bond Proceeds); TRB (Tuition Revenue Bond Proceeds); RFS (Revenue Financing System Bond Proceeds)
64
5. U. T. San Antonio: Biotechnology, Sciences and Engineering Building
(West Campus Wet Lab phase) - Amendment of FY 2004-2009 Capital Improvement Program and the FY 2004-2005 Capital Budget to increase the total project cost; revise the source of funds; appropriate funds and authorize expenditure; and parity debt
RECOMMENDATION The Chancellor concurs in the recommendation of the Executive Vice Chancellor for Academic Affairs, the Interim Vice Chancellor for Business Affairs, and President Romo that the U. T. Board of Regents amend the FY 2004-2009 Capital Improvement Program and the FY 2004-2005 Capital Budget for the U. T. San Antonio Biotechnology, Sciences and Engineering Building (West Campus Wet Lab phase). Project Number: 401-030 CIP Approval and Amendments:
February 2000; August 2003
Architecturally or Historically Significant:
Yes No
Project Delivery Method: Competitive Sealed Proposals
Substantial Completion Date: April 2005
Total Project Cost: Source* PUF TRB Gifts RFS
Current $54,000,000 $22,950,000 $12,750,000 $ 0 $89,700,000
Proposed Debt Service$54,000,000 $22,950,000 $ 6,750,000 $ 7,500,000 $7,500,000 $91,200,000
Debt Service: The debt will be repaid from U. T. San Antonio’s indirect cost recoveries. The annual debt service on the $7,500,000 in Revenue Financing System Bond Proceeds is projected to be $653,844. The debt service coverage for the project is expected to be at least 1.78 times.
Recommendations:
a. increase total project cost by $1,500,000 from $89,700,000 to $91,200,000; b. revise source of funds; c. appropriate funds and authorize expenditure of $7,500,000 from Revenue Financing System Bond Proceeds; and d. make the “finding of fact” determinations required by Section 5 of the Master Resolution regarding the ability to repay debt prior to the issuance of additional Revenue Financing System parity debt.
65

Previous Board Actions: The Facilities Planning and Construction Committee designated the project as architecturally significant in January 2001. The project received design development approval at $83,700,000 in May 2002. In August 2003, the total project cost was increased to $89,700,000.
Project Description: The West Campus Wet Lab phase of the project is a part of the Biotechnology, Sciences and Engineering Building at U. T. San Antonio. The new phase will contain 20,000 gross square feet adjacent to the Biotechnology, Sciences and Engineering Building and will house the wet lab research laboratory that includes 12 biology labs. The increase of $1,500,000 is the result of finalizing the West Campus Wet Lab project scope.
* Funding Sources = PUF (Permanent University Fund Bond Proceeds); TRB (Tuition Revenue Bond Proceeds); RFS (Revenue Financing System Bond Proceeds) 6. U. T. Tyler: Student Apartments - Approve design development; approve
alternative energy economic feasibility; approve total project cost; appropriate funds and authorize expenditure; and parity debt
RECOMMENDATION The Chancellor concurs in the recommendation of the Executive Vice Chancellor for Academic Affairs, the Interim Vice Chancellor for Business Affairs, and President Mabry that the U. T. Board of Regents approve the recommendations listed below for the U. T. Tyler Student Apartments to: Project Number: 802-171 CIP Approval and Amendments:
August 2003
Architecturally or Historically Significant:
Yes No
Project Delivery Method: Design/Build
Substantial Completion Date: July 2004
Total Project Cost: Source* RFS
Proposed $7,200,000
Debt Service: The $7,200,000 in Revenue Financing System Bond Proceeds debt will be repaid from net revenues on the Student Apartments project. The annual debt service will be structured proportionately to the projected amount of net revenue available. Debt service coverage on the project is expected to be at least 1.3 times.
Recommendations:
a. approve design development plans;
66
b. approve the evaluation of alternative energy economic feasibility;
c. approve total project cost;
d. appropriate funds and authorize expenditure of funds; and
e. make the “finding of fact” determinations required by Section 5 of the Master Resolution regarding the ability to repay debt prior to the issuance of additional Revenue Financing System parity debt.
Project Description: The Student Apartments project at U. T. Tyler will contain two three- story wood frame structures and a single-story, 2,000 gross square foot community building. The total gross square feet for the project is approximately 77,500. The apartment structures will accommodate a mix of four-bedroom and two-bedroom suites for housing approximately 184 students, a resident director, and 14 resident advisors. A single-story community building will accommodate the director’s offices, game room, television area, kitchen, and mailboxes. Outdoor recreation amenities are included in the project. The project is located on approximately seven acres of wooded land near the western edge of the campus and is adjacent to the existing University Pines Apartment complex. The project includes a perimeter security fence, parking for all residents, and landscaping. Enrollment expansion and enhanced character of student life on campus require housing for upper- and lower-division students. This apartment style housing will be the first housing project to be directly managed by U. T. Tyler and is needed to support the continued growth at U. T. Tyler. Texas Government Code Section 2166.403 requires the governing body of a State agency to verify in an open meeting the economic feasibility of incorporating alternative energy devices into a new State building. Therefore, the Project Architect prepared an evaluation for this project in accordance with the Energy Conservation Design Standards for New State Buildings. This evaluation determined that alternative energy devices such as solar, wind, biomass, or photovoltaic energy are not economically feasible for the project. The economic impact of the project will be reported to the U. T. Board of Regents as part of the design development presentation.
* Funding Source = RFS (Revenue Financing System Bond Proceeds)
67
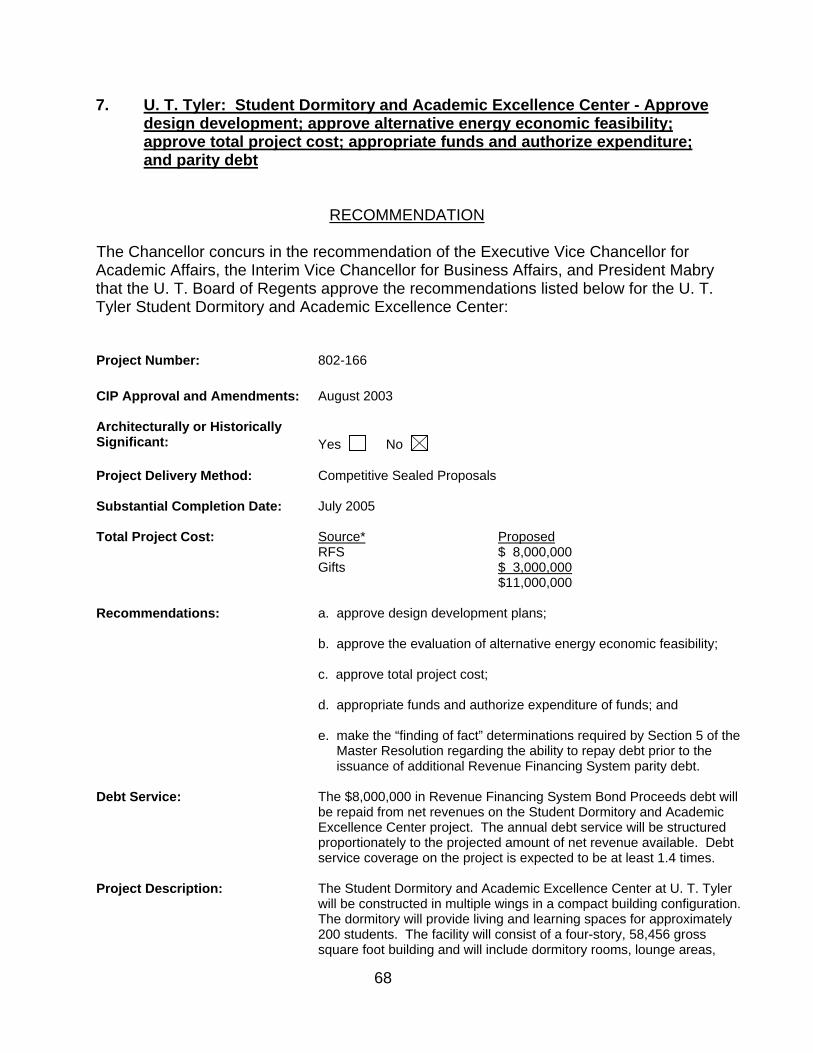
7. U. T. Tyler: Student Dormitory and Academic Excellence Center - Approve design development; approve alternative energy economic feasibility; approve total project cost; appropriate funds and authorize expenditure; and parity debt
RECOMMENDATION The Chancellor concurs in the recommendation of the Executive Vice Chancellor for Academic Affairs, the Interim Vice Chancellor for Business Affairs, and President Mabry that the U. T. Board of Regents approve the recommendations listed below for the U. T. Tyler Student Dormitory and Academic Excellence Center: Project Number: 802-166 CIP Approval and Amendments:
August 2003
Architecturally or Historically Significant:
Yes No
Project Delivery Method: Competitive Sealed Proposals
Substantial Completion Date: July 2005
Total Project Cost: Source* RFS Gifts
Proposed $ 8,000,000 $ 3,000,000 $11,000,000
Recommendations:
a. approve design development plans; b. approve the evaluation of alternative energy economic feasibility; c. approve total project cost; d. appropriate funds and authorize expenditure of funds; and e. make the “finding of fact” determinations required by Section 5 of the Master Resolution regarding the ability to repay debt prior to the issuance of additional Revenue Financing System parity debt.
Debt Service: The $8,000,000 in Revenue Financing System Bond Proceeds debt will be repaid from net revenues on the Student Dormitory and Academic Excellence Center project. The annual debt service will be structured proportionately to the projected amount of net revenue available. Debt service coverage on the project is expected to be at least 1.4 times.
Project Description: The Student Dormitory and Academic Excellence Center at U. T. Tyler will be constructed in multiple wings in a compact building configuration. The dormitory will provide living and learning spaces for approximately 200 students. The facility will consist of a four-story, 58,456 gross square foot building and will include dormitory rooms, lounge areas,
68
centralized laundry facility and kitchen, and offices for dormitory staff. The Academic Excellence Center will consist of a one-story, 12,829 gross square foot building with a large meeting room and smaller breakout rooms and will be connected on the first floor to the dormitory. Enrollment expansion and enhanced character of student life on campus require housing for freshman and sophomore students. This dormitory will be the first dormitory project to be directly managed by U. T. Tyler and is needed to support the continued growth at U. T. Tyler. Texas Government Code Section 2166.403 requires the governing body of a State agency to verify in an open meeting the economic feasibility of incorporating alternative energy devices into a new State building. Therefore, the Project Architect prepared an evaluation for this project in accordance with the Energy Conservation Design Standards for New State Buildings. This evaluation determined that alternative energy devices such as solar, wind, biomass, or photovoltaic energy are not economically feasible for the project. The economic impact of the project will be reported to the U. T. Board of Regents as part of the design development presentation.
* Funding Source = RFS (Revenue Financing System Bond Proceeds) 8. U. T. Medical Branch - Galveston: BSL-4 Laboratory Facility - Honorific
Naming of Facility as the John Sealy Pavilion for Infectious Diseases Research and Honorific Naming of Laboratory as the Robert E. Shope Laboratory (Regents' Rules and Regulations, Part Two, Chapter VIII, Sec-tion 1, Subsection 1.3, Honorific Namings)
RECOMMENDATION The Chancellor concurs in the recommendation of the Acting Executive Vice Chancellor for Health Affairs, the Interim Vice Chancellor for Business Affairs, the Vice Chancellor for External Relations, and President Stobo that the U. T. Board of Regents:
a. approve the naming of the BSL-4 Laboratory Facility project at U. T. Medical Branch - Galveston as the John Sealy Pavilion for Infectious Diseases Research; and
b. approve the naming of the laboratory of the BSL-4 Laboratory Facility as
the Robert E. Shope Laboratory.
69

BACKGROUND INFORMATION The BSL-4 Laboratory Facility at U. T. Medical Branch - Galveston consists of a three-story addition to the existing Keiller Building as well as some renovation work within the building to accommodate the addition. The combination of new work and renovation work will be approximately 12,000 gross square feet. Biosafety level-4 (BSL-4) containment laboratories are technically advanced facilities built with proven construction and engineering technologies to provide a safe environment for the researcher and minimize hazards to the outside environments. The naming of the John Sealy Pavilion for Infectious Diseases Research will recognize the commitment and the significant contribution of $7,500,000 by the Sealy & Smith Foundation toward the $15,500,000 total project cost. U. T. Medical Branch - Galveston's program in tropical and emerging infectious diseases flourished with the recruitment of Dr. Robert E. Shope, John D. Dunn Professor of Biodefense in the Department of Pathology and the Center for Biodefense and Emerging Infectious Diseases. Dr. Shope is a legend in his field and is revered by scientists from around the world. He has a vast lifetime of experience of conducting cutting-edge research on some of the world's most dangerous viruses. Dr. Shope has led a multidisciplinary team of U. T. Medical Branch scientists seeking to develop countermeasures for the Defense Advanced Research Projects Agency (DARPA) for viruses bioterrorists might employ. Dr. Shope has served the infectious diseases community, graduate students, academic colleagues, and the nation with humility and distinction for his entire career. The naming of the BSL-4 laboratory as the Robert E. Shope Laboratory will recognize Dr. Shope's outstanding contributions to infectious diseases research at the University. These namings are consistent with the Regents' Rules and Regulations, Part Two, Chapter VIII, Section 1, Subsection 1.2 and institutional guidelines on the naming of facilities, which allow naming for a current employee in unusual circumstances. 9. U. T. Health Science Center - Houston: Recreation Center Reconstruction -
Amendment of FY 2004-2009 Capital Improvement Program and the FY 2004-2005 Capital Budget to increase total project cost and appropriate funds and authorize expenditure
RECOMMENDATION The Chancellor concurs in the recommendation of the Acting Executive Vice Chancellor for Health Affairs, the Interim Vice Chancellor for Business Affairs, and President
70
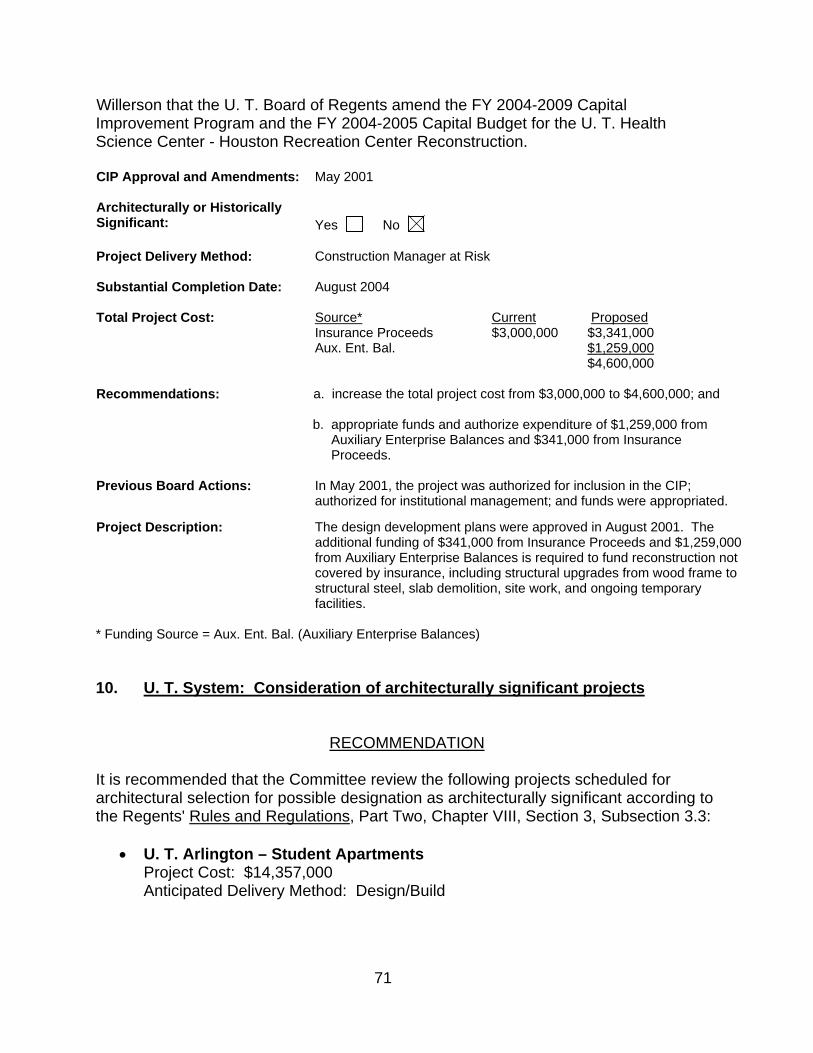
Willerson that the U. T. Board of Regents amend the FY 2004-2009 Capital Improvement Program and the FY 2004-2005 Capital Budget for the U. T. Health Science Center - Houston Recreation Center Reconstruction. CIP Approval and Amendments: May 2001
Architecturally or Historically Significant:
Yes No
Project Delivery Method: Construction Manager at Risk
Substantial Completion Date: August 2004
Total Project Cost: Source* Insurance Proceeds Aux. Ent. Bal.
Current $3,000,000
Proposed $3,341,000 $1,259,000 $4,600,000
Recommendations:
a. increase the total project cost from $3,000,000 to $4,600,000; and b. appropriate funds and authorize expenditure of $1,259,000 from Auxiliary Enterprise Balances and $341,000 from Insurance Proceeds.
Previous Board Actions: In May 2001, the project was authorized for inclusion in the CIP; authorized for institutional management; and funds were appropriated.
Project Description: The design development plans were approved in August 2001. The additional funding of $341,000 from Insurance Proceeds and $1,259,000 from Auxiliary Enterprise Balances is required to fund reconstruction not covered by insurance, including structural upgrades from wood frame to structural steel, slab demolition, site work, and ongoing temporary facilities.
* Funding Source = Aux. Ent. Bal. (Auxiliary Enterprise Balances) 10. U. T. System: Consideration of architecturally significant projects
RECOMMENDATION It is recommended that the Committee review the following projects scheduled for architectural selection for possible designation as architecturally significant according to the Regents' Rules and Regulations, Part Two, Chapter VIII, Section 3, Subsection 3.3:
• U. T. Arlington – Student Apartments Project Cost: $14,357,000 Anticipated Delivery Method: Design/Build
71
• U. T. Austin – Nueces Garage Project Cost: $20,500,000 Anticipated Delivery Method: Design/Build
• U. T. Austin – Biomedical Engineering Building Project Cost: $25,000,000 Anticipated Delivery Method: Design/Build
• U. T. Dallas – Center for BrainHealth
Project Cost: $5,000,000 Anticipated Delivery Method: Competitive Sealed Proposals (see Item 11 on Page 43)
• U. T. Dallas – Natural Science and Engineering Research Building Project Cost: $85,000,000 Anticipated Delivery Method: Construction Manager at Risk (see Item 12 on Page 43)
• U. T. El Paso – Parking Garage ID#, P-4
Project Cost: $25,000,000 Anticipated Delivery Method: Competitive Sealed Proposals
• U. T. Permian Basin – Student Housing Phase III
Project Cost: $6,000,000 Anticipated Delivery Method: Competitive Sealed Proposals
• U. T. San Antonio – Campus Parking Garage, Phase I Project Cost: $11,250,000 Anticipated Delivery Method: Competitive Sealed Proposals
• U. T. San Antonio – Campus Parking Garage, Phase III Project Cost: $9,450,000 Anticipated Delivery Method: Competitive Sealed Proposals (see Item 4 on Page 64)
• U. T. San Antonio – East Campus Building, Phase I
Project Cost: $75,000,000 Anticipated Delivery Method: Competitive Sealed Proposals (see Item 14 on Page 46)
• U. T. San Antonio – East Campus Thermal Energy Plant Project Cost: $5,000,000 Anticipated Delivery Method: Competitive Sealed Proposals (see Item 15 on Page 47)
72
• U. T. Health Science Center – San Antonio – Medical Integrated Plaza (feasibility and planning only) Project Cost: $300,000 Anticipated Delivery Method: N/A (see Item 3 on Page 55)
• U. T. M. D. Anderson Cancer Center – Bastrop Facility Strategic Plan
Project Cost: $9,000,000 Anticipated Delivery Method: Competitive Sealed Proposals
11. U. T. System: Historically Underutilized Businesses (HUB) Report and Update on Bonding and Technical Assistance program
Mr. Sanders will speak to the quarterly report on Historically Underutilized Businesses (HUB) for building construction for the U. T. System and will give an update on the Bonding and Technical Assistance program as set forth below.
REPORT
The total expenditures for Building Construction and Other Facilities by the Office of Facilities Planning and Construction through the fourth quarter of Fiscal Year 2003 was approximately $532,524,000. Of that amount, 16.28% was paid to Certified Historically Underutilized Businesses, 0.84% was paid to Graduated Historically Underutilized Businesses, and Noncertified Historically Underutilized Businesses received 6.49%, for a total of 23.61% or approximately $125,730,000. By comparison in Fiscal Year 2002, 10.10% was paid to Certified Historically Underutilized Businesses, 1.23% was paid to Graduated Historically Underutilized Businesses, and Noncertified Historically Underutilized Businesses received 11.40%, for a total of 22.73% or approximately $76,777,000. This information will be included in the U. T. System Administration HUB Report to the State.
The mission of the Bonding and Technical Assistance program (BTA) is to assist minority- and women-owned businesses to build business capacity and to successfully compete for work on the U. T. M. D.
73
Anderson Cancer Center Ambulatory Clinical Building, as well as other U. T. System projects. These services to assist minority- and women-owned businesses include the following: • General Business Management – Business plans,
implementation and action planning, organizational structuring, market analysis, market plan development, sales analysis, and operations assessments;
• Financial Administration – Financial accounting, cost
accounting, loan packaging, financial planning, job costing, work in progress reporting, payroll administration, and tax reporting;
• Technical Assistance – Identifying bid opportunities,
understanding blueprints and contractor specifications, estimating, bid preparation, scheduling, safety, and project management; and
• Bonding and Insurance – Bond application preparation or
review, market individual contractors to sureties, and monitor contractor performance.
The BTA expansion was initiated February 18, 2003, by negotiating a contract extension with Grijalva & Allen, PC consultants to include two additional projects of U. T. M. D. Anderson Cancer Center Cancer Prevention Building and the U. T. Health Science Center - Houston Institute of Molecular Medicine. These projects were added to the scope of work with Grijalva & Allen who committed to provide additional services on a third project at no additional cost to the campus.
74

TABLE OF CONTENTS
FOR STUDENT, FACULTY, AND STAFF CAMPUS LIFE
COMMITTEE
Committee Meeting: 11/12/2003 MCM Elegante Hotel
Judith L. Craven, M.D., Chairman Rita C. Clements Robert A. Estrada Woody L. Hunt Committee
Meeting Board Meeting
Page
Convene 1:00 p.m. Chairman Craven
1. U. T. Permian Basin: Overview of Campus Life at U. T. Permian Basin
1:05 p.m. Report Dr. Watts
Not on Agenda
75
2. U. T. System: Social Security Numbers Task Force Update - Report on new Business Procedures Memorandum
1:25 p.m. Report Ms. Mayne
Not on Agenda
76
3. U. T. System: Report on the status of the Management and Leadership Development Program
1:35 p.m. Report Mr. Dan Stewart
Not on Agenda 77
Adjourn
i
1. U. T. Permian Basin: Overview of Campus Life at U. T. Permian Basin
REPORT Dr. David Watts, President, will provide an overview of campus life at U. T. Permian Basin. A PowerPoint presentation is attached on Pages 75.1 - 75.10. Dr. Watts' report is the first in a series of campus life presentations that will be made at the Faculty, Staff and Student Campus Life Committee meetings.
75

1
Student, Faculty, and Staff Campus Life Committee PresentationNovember 12, 2003
Campus Life
Vision: To transform UTPB– Mission– Size and Scope– Students– Research
75.1

2
EnrollmentEnrollment Increases
16.0%12.4%Fall 0312.8%10.9%Fall 025.3%6.0%Fall 013.4%2.2%Fall 00SCHHC
Fall 2003 Preliminary EnrollmentHeadcount 3,072Undergraduate 2,351Graduate 721
Semester Credit Hours 31,379Undergraduate 27,391Graduate 3,988
Students from West Texas & Beyond
Fall 2002
75.2
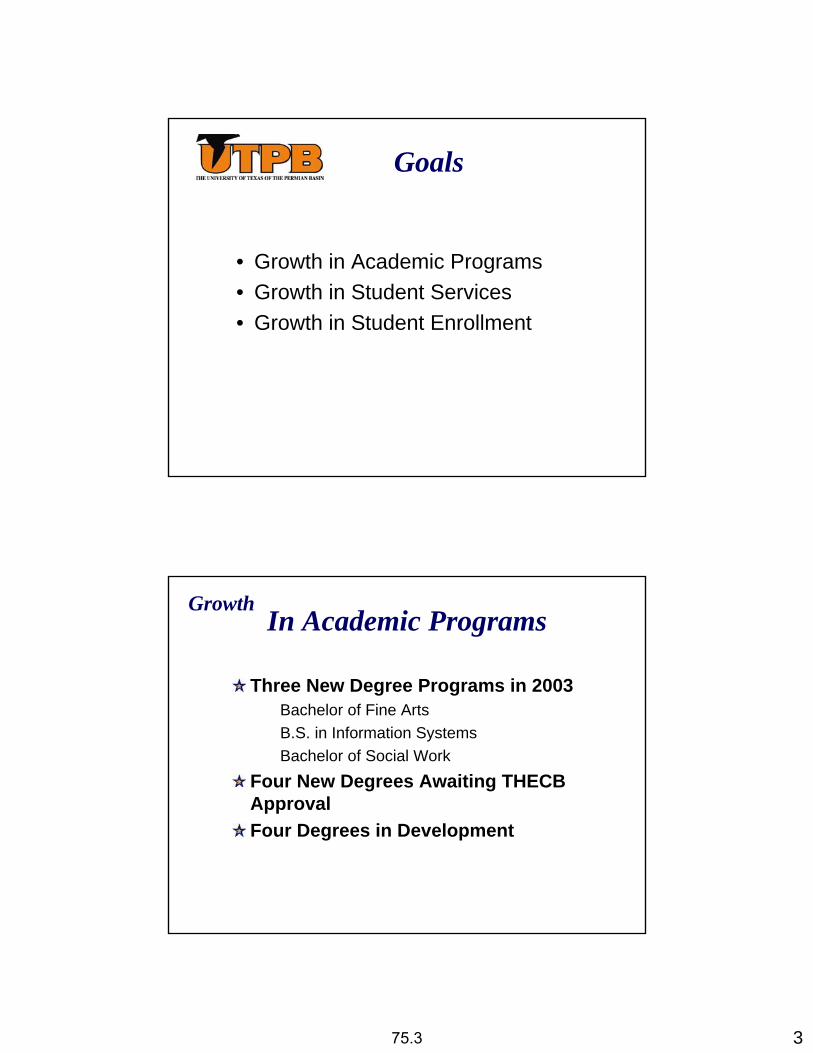
3
Goals
• Growth in Academic Programs• Growth in Student Services• Growth in Student Enrollment
In Academic Programs
Three New Degree Programs in 2003Bachelor of Fine ArtsB.S. in Information SystemsBachelor of Social Work
Four New Degrees Awaiting THECB ApprovalFour Degrees in Development
Growth
75.3

4
In Academic Programs• Seeking National
Specialized Accreditation– Business, Art, Education
• Expanded Off-campus Degree and Course Offerings- Midland, Big Spring, Snyder, San Angelo
• Expanded Online Programs
• Partnerships– Howard College, Midland College,
Odessa College– Universidad Autónoma de
Chihuahua
Growth
Hispanic Serving Institution Grant: OBRAS– Career planning and placement– Student mentor program– Technology infrastructure upgrade– Exit Test Coordinator– Instructional Development Coordinator– Enrollment management tracking system
In Student ServicesGrowth
75.4
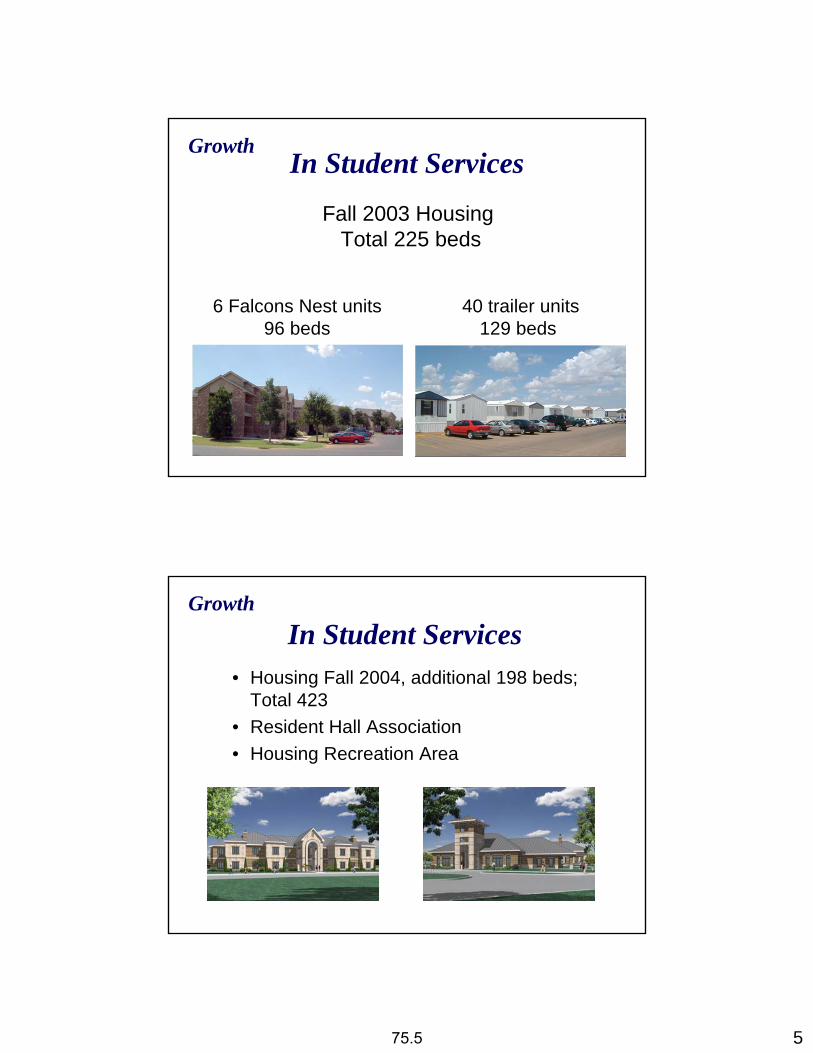
5
In Student Services
6 Falcons Nest units96 beds
40 trailer units129 beds
Fall 2003 Housing Total 225 beds
Growth
• Housing Fall 2004, additional 198 beds; Total 423
• Resident Hall Association• Housing Recreation Area
In Student ServicesGrowth
75.5
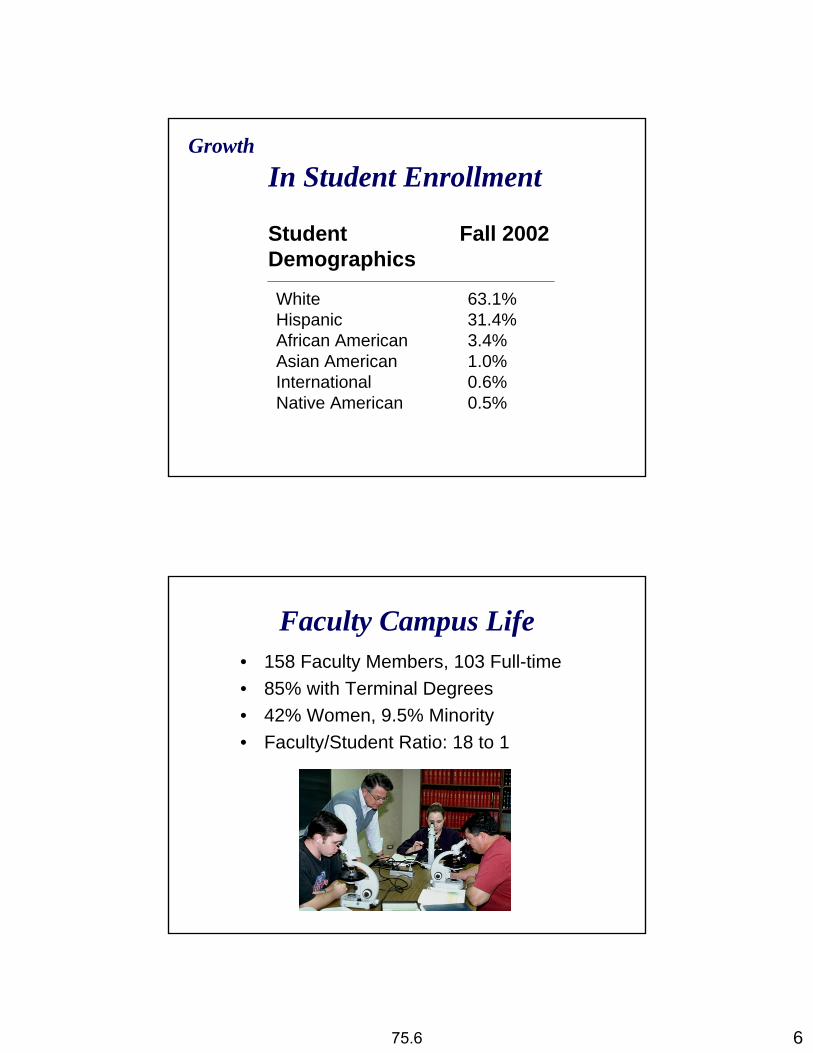
6
Student Fall 2002Demographics
In Student EnrollmentGrowth
White 63.1%Hispanic 31.4%African American 3.4%Asian American 1.0%International 0.6%Native American 0.5%
Faculty Campus Life• 158 Faculty Members, 103 Full-time• 85% with Terminal Degrees• 42% Women, 9.5% Minority• Faculty/Student Ratio: 18 to 1
75.6

7
Faculty Campus Life
• Average Non-lab Class Size is 31
• Growing Research Productivity
• Faculty Salaries: 6.5% Below National Means for Comparable Institutions
Student Campus Life• Student Activities
– Cheerleaders, Mariachi Band, Pep Band, Dance Team and Mascot
• Program Board• Intercollegiate Athletics
– Softball, Soccer, Volleyball, Basketball, Swimming and Baseball
• Intramural Sports• Student Union
75.7
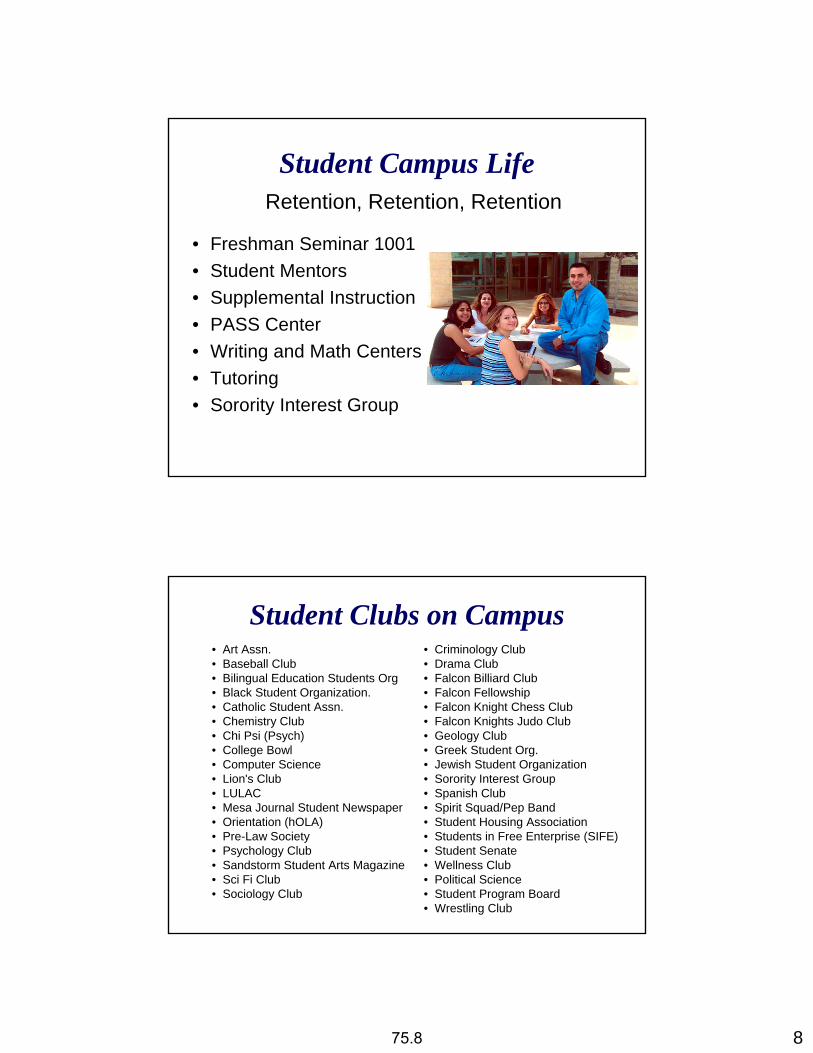
8
Student Campus Life
• Freshman Seminar 1001• Student Mentors• Supplemental Instruction• PASS Center• Writing and Math Centers• Tutoring• Sorority Interest Group
Retention, Retention, Retention
Student Clubs on Campus• Criminology Club • Drama Club• Falcon Billiard Club • Falcon Fellowship • Falcon Knight Chess Club • Falcon Knights Judo Club • Geology Club • Greek Student Org.• Jewish Student Organization • Sorority Interest Group • Spanish Club • Spirit Squad/Pep Band• Student Housing Association • Students in Free Enterprise (SIFE) • Student Senate • Wellness Club • Political Science • Student Program Board • Wrestling Club
• Art Assn. • Baseball Club• Bilingual Education Students Org • Black Student Organization. • Catholic Student Assn. • Chemistry Club • Chi Psi (Psych) • College Bowl• Computer Science• Lion's Club• LULAC• Mesa Journal Student Newspaper• Orientation (hOLA)• Pre-Law Society • Psychology Club • Sandstorm Student Arts Magazine • Sci Fi Club• Sociology Club
75.8

9
Campus Governance
• Administrative Council
• Faculty Senate• Staff Advisory Council• Student Senate
• Classroom and Lab Space –Eighth highest space utilization Fall 2002
Produces New ChallengesGrowth
• Parking Expansion• Faculty & Staff Salaries
75.9

10
Transformation of Campus Life
Growing --Programs
ServicesEnrollment
“Feels like a real university”
75.10

2. U. T. System: Social Security Numbers Task Force Update - Report on new
Business Procedures Memorandum
REPORT Florence Mayne, Assistant Vice Chancellor for Administration and System Administration Compliance Officer, will provide a final report on the strategies and recommendations of the U. T. System-wide Social Security Numbers Task Force. A draft of a proposed Business Procedures Memorandum regarding Protecting the Confidentiality of Social Security Numbers is attached on Pages 76.1 - 76.2.
76

Final Report on the Work of the System-wide Social Security Number Task Force and
Summary of Proposed Business Procedures Memorandum October 2003
The System-wide Social Security Number Task Force was established in March 2003. Its charge was to study and recommend a strategy with respect to a coordinated approach throughout The University of Texas System for the collection, maintenance, and dissemination of social security numbers. The task force was guided by the following four desired outcomes: 1. Increased awareness of the confidential nature of the social security number; 2. Reduced reliance on the social security number for identification purposes; 3. A consistent approach toward social security numbers throughout the System; 4. Increased confidence by all constituents that U. T. institutions handle social security numbers in a
confidential manner. The task force concluded that the development of a Business Procedures Memorandum would best achieve these desired outcomes. A Business Procedures Memorandum was drafted and has undergone review by the task force, the institutional presidents, and the Chancellor. The Business Procedures Memorandum contains the following policy statement:
It is the policy of The University of Texas System to protect the confidential nature of social security numbers without creating unjustified obstacles to the conduct of the business of The University of Texas System and the provision of services to its many constituencies.
The procedures to implement the policy are stated in the Business Procedures Memorandum. Due to the financial burdens and the potentially disruptive nature of reprogramming and immediate conversions of business and information systems, some of the procedures have delayed compliance dates. Institutions are to implement the procedures in a steady and purposeful manner so that they are fully implemented no later than the specified compliance dates. Each institution is to file with the Chancellor an annual report that sets forth the institution’s plan for and the status of implementation of the delayed compliance items, including progress to date and anticipated completion dates. The procedures are organized around six key privacy principles and are briefly summarized below:
• Reduce the Use and Collection of Social Security Numbers: The use of the social security number as an individual’s primary identification number will be discontinued. In place of the social security number, each institution shall assign a unique identifier to each individual at the individual’s first point of contact with the institution.
• Inform Individuals When the Institution Collects Social Security Numbers: As required by
Federal law, institutions will give notice to individuals each time a social security number is requested.
Prepared by Florence Mayne 76.1 1 October 2003

• Reduce the Public Display of Social Security Numbers: Grades may not be publicly posted or
displayed in a manner that reveals an individual’s social security number or unique identifier. The social security number may not be displayed on documents that can be widely seen by the general public (such as time cards, rosters, and bulletin board postings), unless required by law. Restrictions apply to the sending of the social security number through the mail or via email.
• Control Access to Social Security Numbers: Access to records containing social security
numbers will be restricted to those who need the numbers for the performance of job duties. • Protect Social Security Numbers with Security Safeguards: Administrative, physical, and
technical safeguards are required to protect social security numbers from unauthorized disclosure.
• Establish Accountability for Protecting the Confidentiality of Social Security Numbers:
Training of employees on the confidentiality of social security numbers and reporting of inappropriate disclosure of social security numbers are required.
Prepared by Florence Mayne 76.2 2 October 2003
3. U. T. System: Report on the status of the Management and Leadership Development Program
REPORT Mr. Dan Stewart, Executive Director of Benefits Administration, will provide an update on the U. T. System Administration Management and Leadership Development Program (MLDP). His presentation will include: a. evaluation/assessment of Class One of the MLDP; b. comparison of curriculum/projects/participants in Class One and Class
Two; c. Class Three eligibility criteria; and d. the future of the Management and Leadership Development Program.
77