schedule reminders nov 26: term paper proposals for grad students due awaiting final versions of...
Post on 20-Dec-2015
214 views
TRANSCRIPT
Schedule reminders
• Nov 26: term paper proposals for grad students due
• Awaiting final versions of essay#1
• Awaiting midterms of distance students before

Population Dynamics in Communities
• Multiple determinants of population abundance & dynamics• Metapolution dynamics & dispersal among habitat patches• Temporal patterns of community composition • Food webs: direct vs. indirect effects & trophic cascades• Community stability & food webs

Multiple determinants of Abundance and Dynamics of Populations
• What factors determine population density over time?
• Why do populations vary from place to place? Depends on:– Physiocochemical conditions
– Resource availability
– Life cycle characteristics
– Influence of competitors, parasites, predators & mutualists
• Effects of these factors on B, D, E & I
• Key-factor analysis to distinguish what determines and what regulates a population
• Dispersal, patches & metapopulation dynamics

Correlations can inform, but do not reveal mechanism+ relationships between food availability and population growth rate … but growth rate reaches an asymptote---why?
Red kangaroos Barn owls
WildebeestFeral pigs

Androsace population appears stable but this masks underlying dynamic processes
- gains from seed germination of 150-1000 seedlings/m2- 50-300 adults each yr
Irruptive population of mice (Mus) in agricultural field, Australia
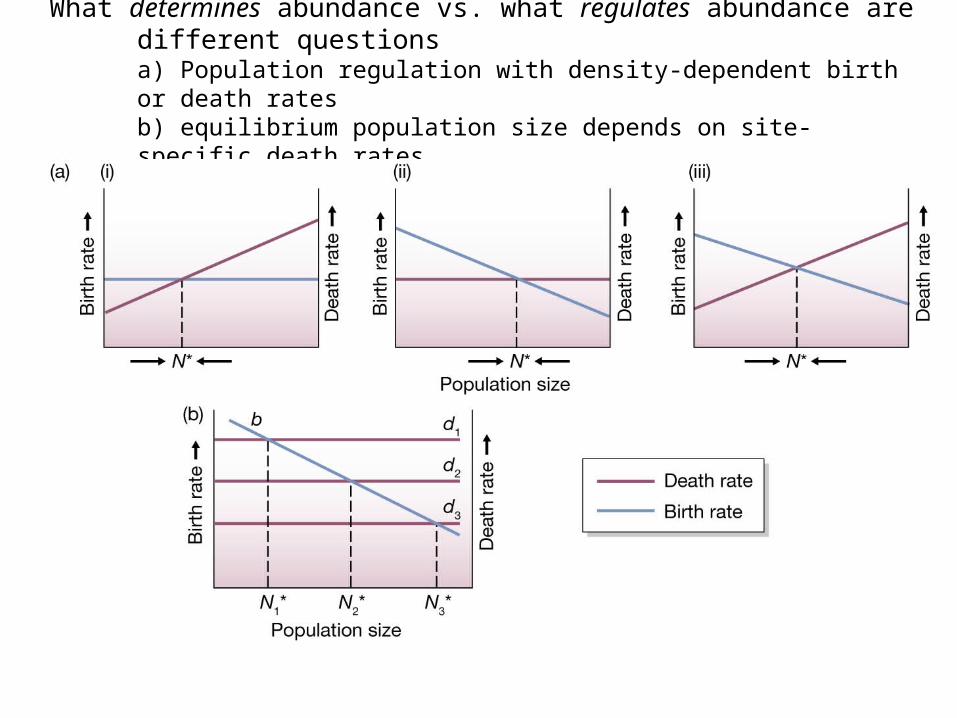
What determines abundance vs. what regulates abundance are different questionsa) Population regulation with density-dependent birth or death rates b) equilibrium population size depends on site-specific death rates

Possible patterns of population dynamics - dominated by:
a) Pop growth after disasters
b) Limited K with abundant resources
c) Limited K (low K)
d) Pop decline after colonization or recruitment

Key factor analysis
• Distinguish factors that determine vs. regulate abundance
• Technique: calculate k-values for different phases in the life cycle of a population– Actually, identify key phases of life cycle!
– K-values measure mortality (killing power)
– Construct life table
• Answer: How much of total mortality occurs in each phase?
• Also, what is relative importance of each phase in determining year to year fluctuations in abundance?
• Key phases have mortality strongly related to overall mortality

What are most important mortality factors?k-values for Colorado potato beetle - identifies key phases that determine abundance- life table data for seven life stages; data for one year- k-factors are differences in log N for successive phases

Which phases determine fluctuations in abundance?- examine regressions of phase mortality on total mortality across different years
-largest regression coefficientsassociated with key phasecausing population change-------> (summer adults, r=.906)
regulation: strongest density-dependence
Emigration ofsummer adults
starvation of larvae
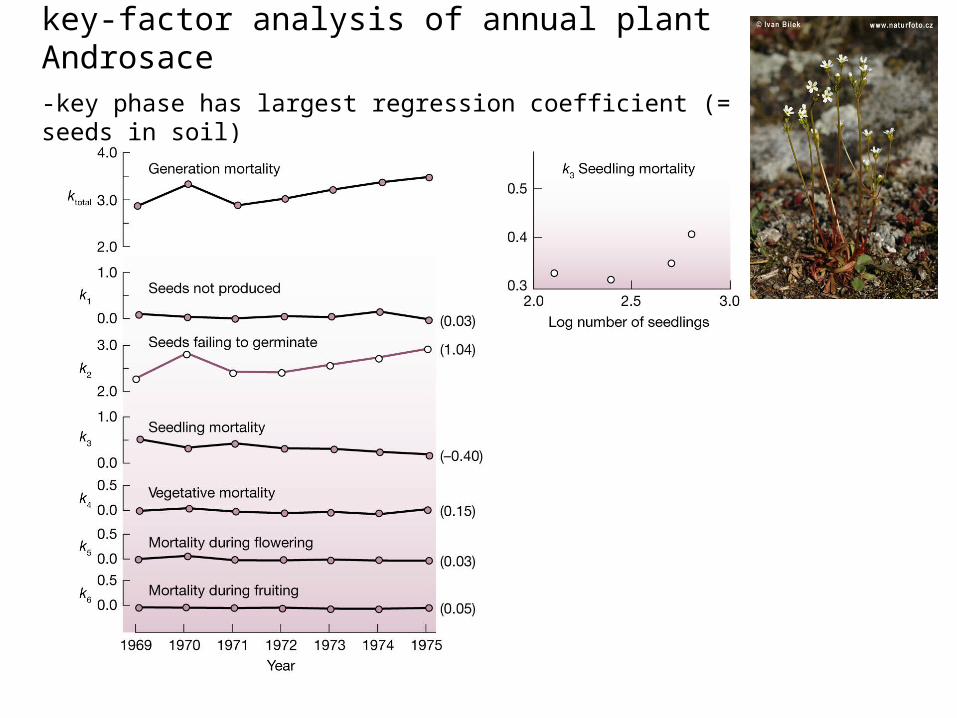
key-factor analysis of annual plant Androsace-key phase has largest regression coefficient (= seeds in soil)
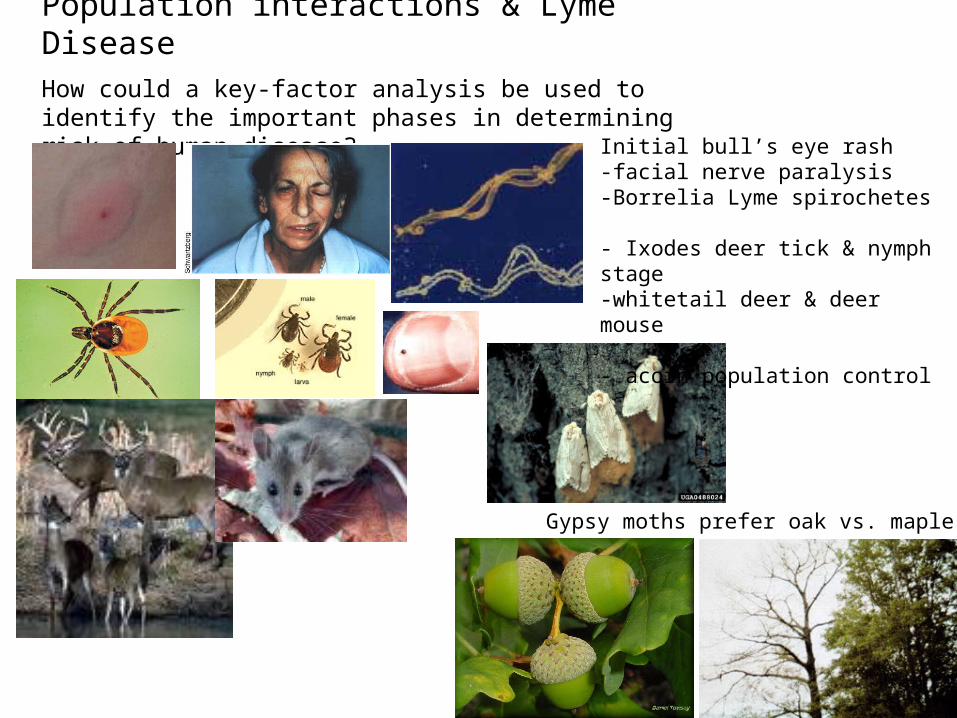
Population interactions & Lyme DiseaseHow could a key-factor analysis be used to identify the important phases in determining risk of human disease?
Gypsy moths prefer oak vs. maple
Initial bull’s eye rash -facial nerve paralysis -Borrelia Lyme spirochetes
- Ixodes deer tick & nymph stage -whitetail deer & deer mouse
- acorn population control

How can we identify the “key phases” in determining disease risk? Modeling several populations and factors
Hypothesis: acorn crop predicts Lyme disease intensity two years in future
Information:- acorn production linked to mice, ticks, deer, gypsy moth & weather - tick larvae 8x greater following large acorn crop & 40% more ticks/mouse- in experimental plots, acorn availability correlated with mice density
Which population density do we wish to understand?
- Borellia bacterium- deer tick Passenger pigeons -major predators - deer mice (& deer)? on acorns; controlled deer mice? - acorns- gypsy moth Key-factor analysis identifies factors thatdetermine density and its regulation
Managing populations “causing”disease?- controlling deer mice population? - controlling acorn crops?

Metapopulations: Dispersal among habitat patches- some populations are fragmented and subpopulations have different dynamics
c ) colonized: only 1990; e) extinct: only 1983; filled: present 1983 & 1990; open: present only 1990
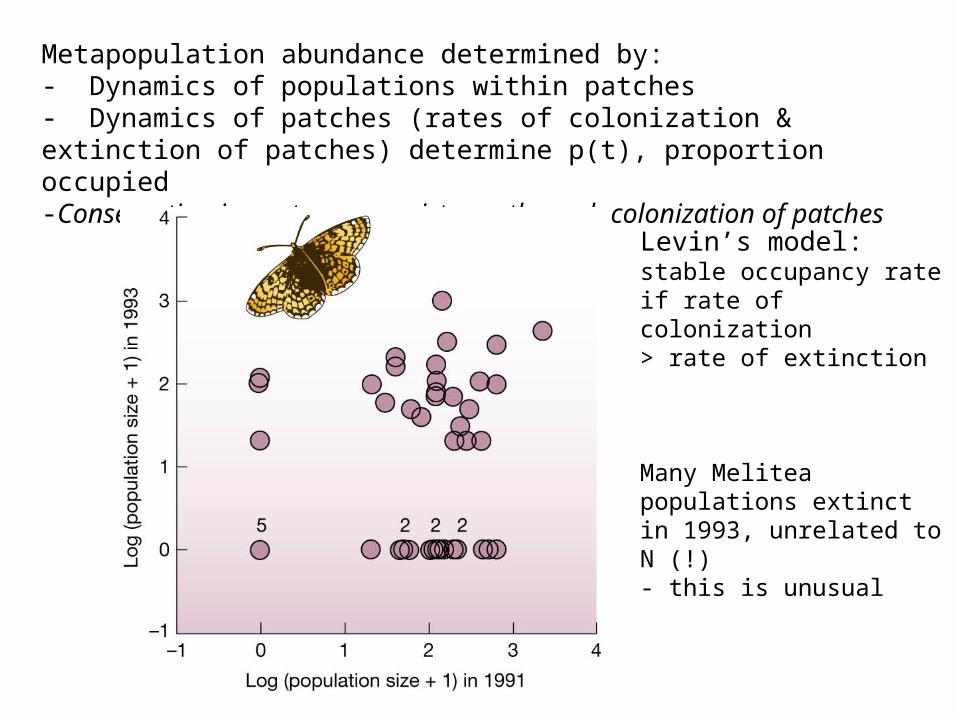
Levin’s model: stable occupancy rate if rate of colonization> rate of extinction
Many Melitea populations extinct in 1993, unrelated to N (!)- this is unusual
Metapopulation abundance determined by:- Dynamics of populations within patches- Dynamics of patches (rates of colonization & extinction of patches) determine p(t), proportion occupied-Conservation importance: persistence through colonization of patches

Persistence in a metapopulation of Pika (Bodie, CA)- some populations are fragmented and subpopulations have different dynamics
a) 3 patch clusters; 4 pop censuses, 1972-91b) computer simulations without colonization c) with colonization between the 3 clusters
North as “source”

Community Ecology
• Temporal patterns in community composition
• Community succession
• Food webs– Direct & indirect effects
– Top down vs. bottom up control
– Community stability
• Is community stability related to food web structure?

Temporal Patterns in Community Composition- patch dynamics: dispersal between patches & changes within patch- patches are “gaps” created by disturbance - two kinds of community organization:1) founder-controlled: competitive lottery for living space species are:- good colonists- similar competitors
Coral reef fish larvae; rainforest shade-tolerant seedlings

2) dominance controlled communities: patch successions- early pioneers are replaced by competitive dominants- predictable sequence: fast-maturing, then longer-lived competitors- final, lower diversity stage of climax species - examples: rocky shoreline algae; rainforest trees

Succession on newly exposed landforms:Primary succession
-lava flows: 100s of yrs
N-fixing Alder colonization facilitated biomass-rich phase
-marine subtidal rocks: a dozen yrs

Primary succession oncoastal sand dunes(Lake Michigan)
- compared 13 ridges of known age (30-400 yrs since formation)
-experimental transplants showedAll can colonize, if arrive, so…
- sequence determined by differences in dispersal, rodent seed predation, and competition

-fugitive annuals - perennials germinate in shade- monolayered->multilayered
Light saturation curves of early, mid & late successional plants:- photosynthetic rate vs.photosynthetically active radiation (PAR)
Secondary succession: example- abandoned agricultural fieldsannual weeds -> perennials->shrubs-> early successional trees->late trees

Early successional species are fugitives that grow fast and reproduce through high rates of photosynthesis… then outcompeted

Old Field Succession in Minnesota (chap. 1.3.2)
- natives replace introduced- perennials replace annuals- N increasesIs convergence due to age or N?
Experiment on 1968, 1957 & 1992 fields
a) 1982-92: 17 g N/m2N addedb) 1 g N/m2-less convergence

Intertidal mussel beds in Brazil -Limpet Collisela colonizes small, peripheral gaps
- barnacle Chthamalus colonizes large gaps > 6 months
- Brachiodontes mussels dominate later
-succession different in small vs. large, & center vs. periphery
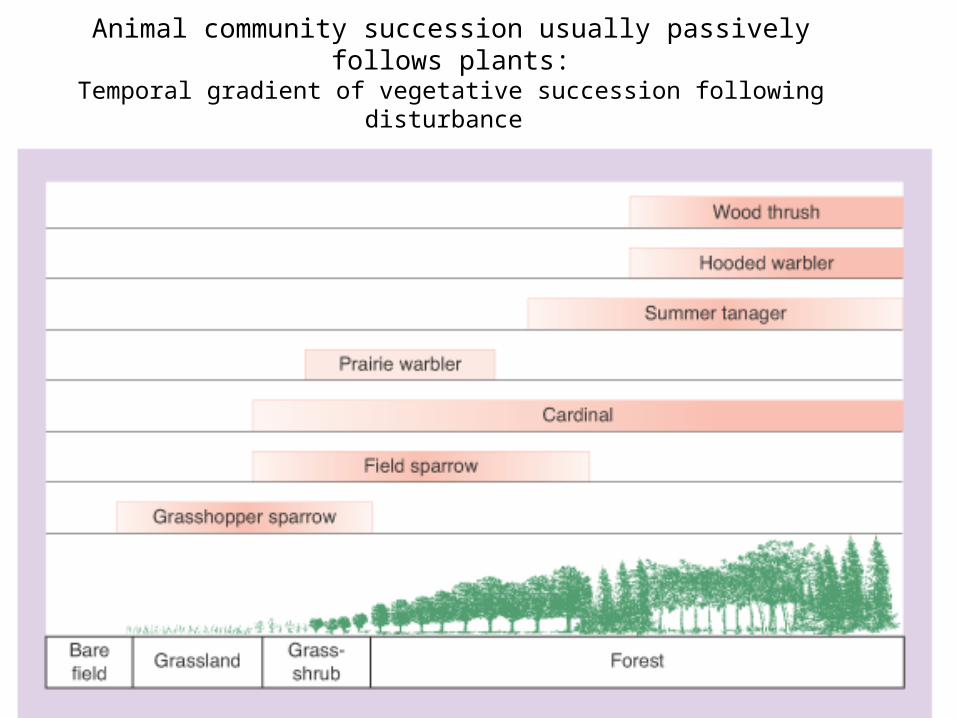
Animal community succession usually passively follows plants:Temporal gradient of vegetative succession following disturbance

However, large animals can have profound effect on succession
Elephant overcrowding drastically reduces tree cover in savanna environments
-- debate over active management
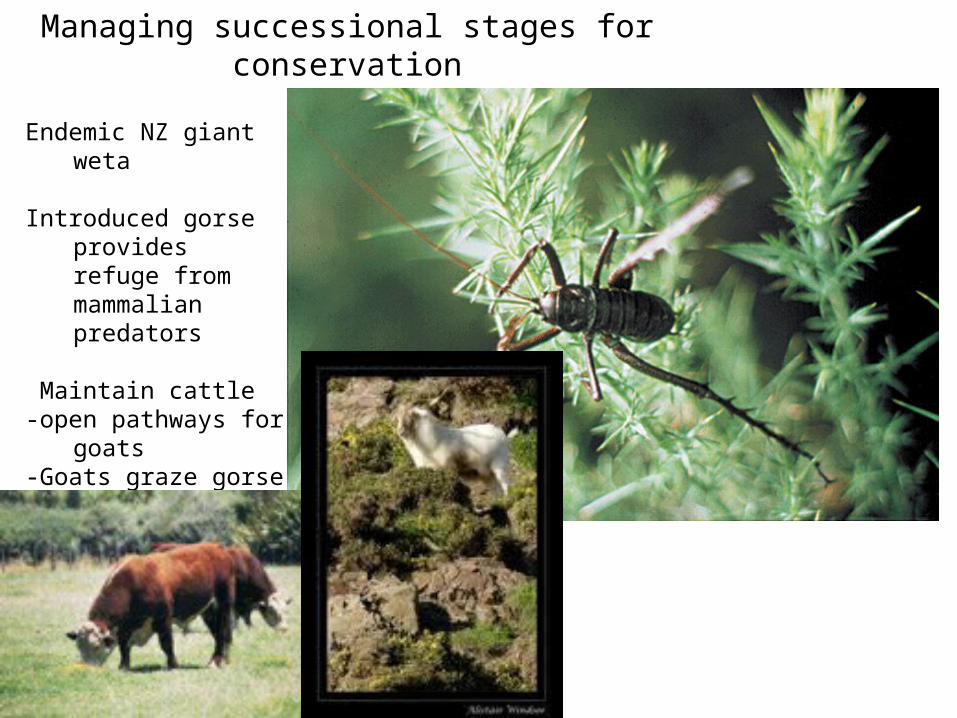
Managing successional stages for conservation
Endemic NZ giant weta
Introduced gorse provides refuge from mammalian predators
Maintain cattle-open pathways for
goats -Goats graze gorse
into dense spiny hedges

Predators
Grazers
Plants
Community matrix of species interactions- predator-prey & competitive relationships
Direct vs. Indirect Effects: - How can adding a competitor increase your abundance? - Can the loss of one of your predators reduce your abundance?
-Trophic cascade: predator reduces prey abundance so that its food resources increase

Food webs: unexpected effects
-If eliminate “superpredator” cats from islands with endangered birds… rats drive prey extinct
… cats control “mesopredator” rats, reducing overall predation on birds

Direct & indirect effects in food webs: trophic cascade in birds, limpets & algae- experimental removals of shorebirds on NW Pacific intertidal community
-Gulls & oystercatchers prefer the limpet L. pelta but L. digitalis increased!-L. strig. is competitively inferior, so declined when birds were excluded by wire cages
-Birds also prefer gooseneck barnacles on which L. digitalis is cryptic, so it increased with > barnacles
-Barnacles outcompete algae for space, so removing birds decreased their cover &diversity
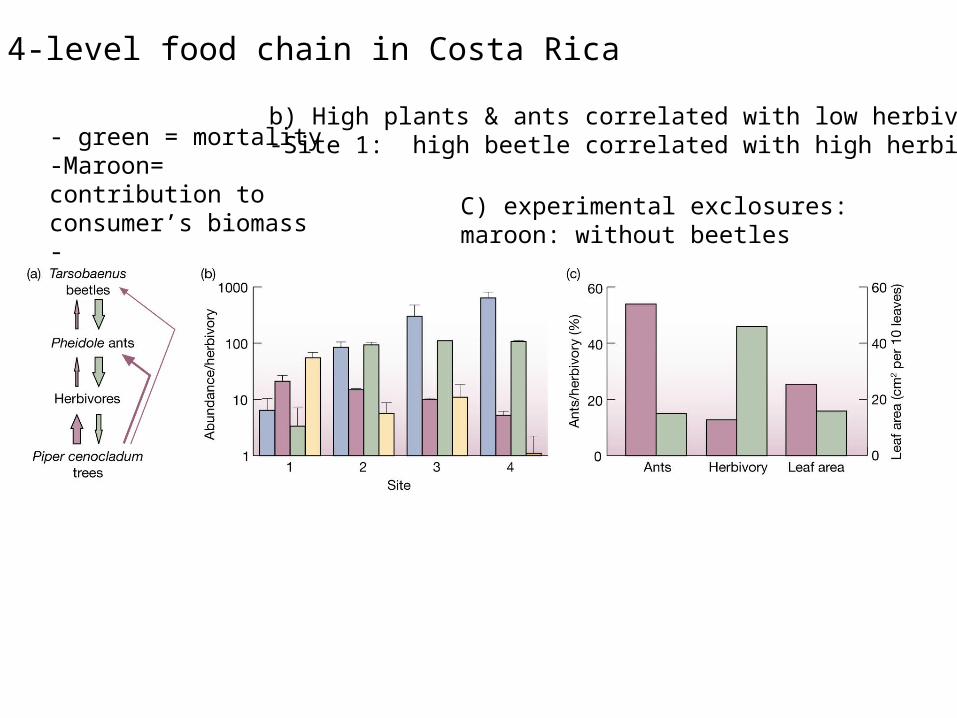
4-level food chain in Costa Rica
- green = mortality-Maroon= contribution to consumer’s biomass -
b) High plants & ants correlated with low herbivory -Site 1: high beetle correlated with high herbiv.
C) experimental exclosures:maroon: without beetles

Keystone Predators:Paine’s Pisaster starfish exclusion experiments
Mytilus mussels outcompeted other space-holding spp, reducing species diversity from 15 -> 8
Starfish prefer to feed on the dominant mussels & barnacles

Top-down or Bottom-up control of Food Webs? Communities with 1, 2, 3 or 4 tropic levels (comp/pred = population dynamics determined by competition or predation)
Control of community structure from:- Below (bottom-up): by nutrient or prey availability, so populations mostly affected by competition, or - Above (top-down): species abundance and number determined mostly by predators controlling prey2-level web:
Aldabra tortoise

A 3-trophic level system: Variation in the Great Salt Lake pelagic system
Decreased salinity in 1985-6 allowed invasion of predatory insect Trichocorixa
… reducing density of the grazer Artemia
… and therefore the grazing rate
…allowing density of phytoplankton to rise (as measured by chlorophyll a)
… thus lowering water transparency (a green soup!)

Variation in four-level food webs by predator intensitya) NA stream community b) Bahamas: Top predators have stronger (weak omnivory or 2-level feeding) effects on herbivores, so functions as 3-level

Top-down or Bottom-up control of Food Webs? Why is the world green?Hairston: top-down control dominates- predators control herbivoresMurdoch: the world (of plants) is prickly and tastes bad!
But control can be switched!
Low nutrients: trophic cascade-Insects> snails& algae dominate
High nutrients:Larger snails dominate but plants high biomass (Murdoch)

Community Stability & Webs• Stable because are either:
– Resilient: returns rapidly to prior structure after disturbance– Resistant: undergoes little change when disturbed
• Are some food web structures more stable than others?• Are some communities more fragile, and more in need of conservation?
• Initial hypothesis: Complexity begets stability– However models unkind: higher species richness decreases pop & comm stability!– Resilience decreases with connectance among pairs of species, & strength of
interactions
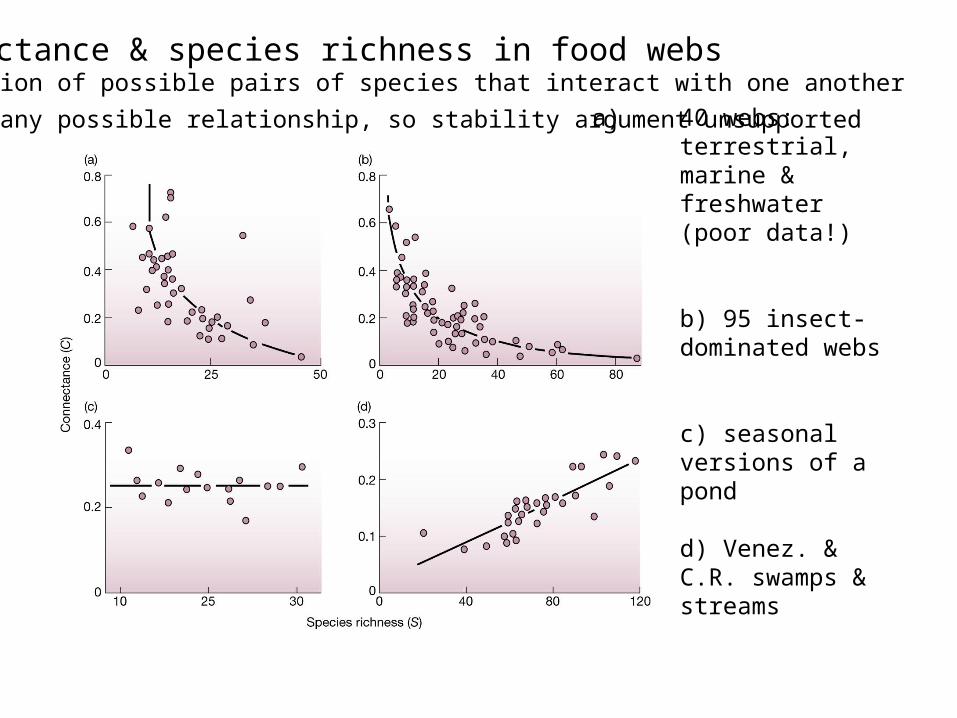
a) 40 webs: terrestrial, marine & freshwater (poor data!) b) 95 insect-dominated webs
c) seasonal versions of a pond
d) Venez. & C.R. swamps & streams
Connectance & species richness in food webs- fraction of possible pairs of species that interact with one another- b-d: any possible relationship, so stability argument unsupported

Natural experiment: more diverse grassland communities resisted drought better (Yellowstone NP, USA)-high R indicates relative abundances & species composition changed little

…and NZ streams with more flow-related disturbance had simpler food webs…- both web size and connectedness decrease with disturbance
But food web theory is poorly developed…-needs more good field studies before any generalizations