scheduling cbr flows: fifo or per-flow queuing and
TRANSCRIPT
Scheduling CBR Flows: FIFO or Per-flow Queuing�
Jasleen Sahni, Pawan Goyal���
and Harrick M. Vin
Distributed Multimedia Computing Laboratory � Ensim CorporationDepartment of Computer Sciences Mountain View, California
University of Texas at Austin
Abstract
In this paper, we study the effect of using FIFO or fair queu-ing on the end-to-end delay and jitter observed by CBR trafficin large-scale networks, where: (1) the bandwidth require-ment and the packet sizes vary considerably across the CBRflows; (2) the class of CBR flows occupy different fractionsof the total link bandwidth; and (3) the class of CBR flowsshare each network link with several other flows with differ-ent packet arrival patterns. Our results provide an empiri-cal basis to evaluate the effectiveness of FIFO and per flowscheduling for CBR flows, as well as guidelines for deploy-ing CBR services in the Internet.
1 Introduction
The Internet has traditionally supported the best-effort servicemodel in which the network offers no assurance about when,or even if, packets will be delivered. This service model hasproved to be adequate for elastic applications (e.g., ftp, tel-net, and http) that tolerate packet delays and losses rathergracefully. With the commercialization of the Internet andthe deployment of inelastic continuous media applications,however, the best-effort service model is increasingly becom-ing inadequate. For example, to meet the timeliness require-ments of digital audio and video playback, most multimediaapplications require greater predictability with respect to end-to-end delay and bandwidth than that offered by the currentbest-effort networks. To facilitate the co-existence of theseemerging applications with conventional elastic applications,there is an increasing need for designing networks that differ-entiate between the services provided to different customersand applications.
One architecture for achieving service differentiation re-quires (1) networks to employ per-flow scheduling algo-rithms [3, 16] and (2) sources and receivers to exchange sig-naling messages that establish packet classification and for-warding state on each router along the path [14]. In this ar-
�This research was supported in part by an AT&T Foundation Award,
IBM Faculty Development Award, Intel, the National Science Foundation(CAREER award CCR-9624757, and Research Infrastructure Award CDA-9624082), Lucent Bell Laboratories, NASA, Mitsubishi Electric ResearchLaboratories (MERL), and Sun Microsystems Inc.�
This work was carried out when the author was with AT&T Labs–Research, Floram Park, New Jersey.
chitecture, however, the amount of state information requiredto be maintained at each router scales in proportion to thenumber of concurrent flows, which can be potentially large onhigh-speed links. To address this scalability requirement, thedifferentiated services architecture has been proposed [12].This architecture achieves scalability by implementing com-plex classification and conditioning functions only at networkboundary routers (which process lower volumes of traffic andlesser numbers of flows), and providing service differentia-tion inside the network for aggregated traffic rather than on aper-flow basis [12].
An example of this philosophy is the Virtual Leased Lineservice model [8, 12]. This service model guarantees a re-served rate to a flow. Flows requesting this service are shapedto constant bit rate (CBR) flows, and the packets of the floware then marked as belonging to a particular service class (ex-pedited forwarding service class in [8]) by appropriately set-ting the Type-of-Service (ToS) byte in the IP header of thepacket [11]. The routers transmit packets belonging to thisservice class in the first-in-first-out (FIFO) order. To ensurethat the rate guarantees of the flows can be met, the routersemploy appropriate scheduling algorithm to ensure that onany given link, the rate available for this service class is atleast the aggregate of the reserved rates of flows that requestthe Virtual Leased Line service. Note that this service doesnot guarantee an upper bound on delay; however, it is ex-pected to closely resemble the service offered by a leased line.
The design of the Virtual Leased Line and other such ser-vice models are based on the following conjecture: If all theflows belonging to that service class are smoothed to CBR atthe source or the ingress routers and if the bandwidth avail-able to the service class is at least as large as the aggregaterate of all the flows, then FIFO scheduling of packets be-longing to the aggregate is sufficient. The validity of thisconjecture is essential for the deployment of many proposedservices; yet, very little is known about: (1) the end-to-enddelay and jitter observed by packets belonging to the CBRflows as they travel through many routers, and (2) the sizes ofbuild-out buffer required at the end-point to restore the CBRnature of the flow prior to delivering the packets to the ap-plications. This problem was investigated in [6]; however,that study assumes equal packet size for all flows. Hence, theconclusions of that study may not apply to the Internet, whichallows variable-size network layer packets. We discuss in de-

tail the related work in Section 6.In this paper, we study—through simulations—the effect
of using FIFO or fair queuing on the end-to-end delay andjitter observed by CBR traffic in large-scale networks, where:(1) the bandwidth requirement and the packet sizes vary con-siderably across the CBR flows; (2) the class of CBR flowsoccupies different fractions of the total link bandwidth; and(3) the class of CBR flows shares each network link withother flows with different packet arrival patterns. We find thatthe difference between the end-to-end performance of CBRflows yielded by FIFO and fair queuing is significant in net-works that service flows with substantially different packetsizes. Since the current Internet allows flows to use differentpacket sizes, our results provide engineering guidelines fordeploying CBR services in the Internet.
The rest of the paper is organized as follows. In Section 2,we provide a context for comparing the performance of FIFOand fair queuing for CBR flows. In Section 3, we describeour experimental setup, selection of experimental parameters,and the metrics for our evaluation. Sections 4 and 5 discussresults of our experiments. Section 6 describes the relatedwork, and finally, Section 7 summarizes our conclusions.
2 Problem Formulation
FIFO is the simplest known discipline for scheduling flowsin a network; it transmits packets in the order of their arrival.The simplicity of FIFO, however, comes at a cost—it is well-known that FIFO does not protect flows from each other; aburst of packet arrival from a flow affects the performance ofall the other flows sharing the network. Thus, in a networkwith bursty traffic, FIFO does not provide end-to-end delayand bandwidth guarantees to flows. Furthermore, it has beenshown that FIFO preserves or increases bunching of packetswithin a flow [4], thus worsening the end-to-end delay andjitter as the size of the network increases.
To address the limitations of FIFO, several different packetscheduling algorithms have been proposed [3, 16]. These al-gorithms maintain a per-flow state and provide bounded end-to-end delay guarantee to a flow regardless of the behavior ofother flows in the network. In particular, it has been shownthat for a leaky bucket flow, a network employing the Guar-anteed Rate (GR) scheduling algorithms [5] guarantees thatthe maximum end-to-end delay is bounded by
������ ������ ����� ��������������
�(1)
where � ,�
, and���
, respectively, denote the burstiness, themaximum packet size, and the bit rate requirement of theflow;
�is the number of hops the flow is traversing; and
��
is a constant that depends on the scheduling algorithm atswitch � . Though this result is applicable for a large class of
algorithms, since it has been shown that fairness is a desir-able property of algorithms [3], we restrict our attention tothe class of fair queuing algorithms in GR.
Now, consider a network where all the flows are smoothedout to CBR at the edge of the network (as is the case in theVirtual Leased Line service model). Since a CBR flow has aburst size of one packet, from (1), we conclude that the end-to-end delay guarantee for a CBR flow in case of fair queuingis: � ������
�������������
��� �! #" � ������������$�
�(2)
where" � �&%')( is the inter-packet spacing for the CBR flows.
FIFO does not provide such a bound. However, it is con-jectured that due to the elimination of traffic bursts at the edgeof the network, the queues at network switches may nevergrow to a significant size; therefore, FIFO may provide worst-case delays that are comparable to the delay bounds guaran-teed by fair queuing algorithms. The main objective of thiswork is to evaluate—through simulations—the validity of thisconjecture in the context of large-scale networks.
3 Experimental Methodology
We have developed a network simulator using CSIM [1] tostudy the effect of using FIFO or fair queuing on the end-to-end performance of CBR traffic in large-scale networks. Inthis section, we describe our simulation environment, the de-sign of our experiments, and the metrics for the performanceevaluation.
3.1 Simulation Environment
3.1.1 Network Topology
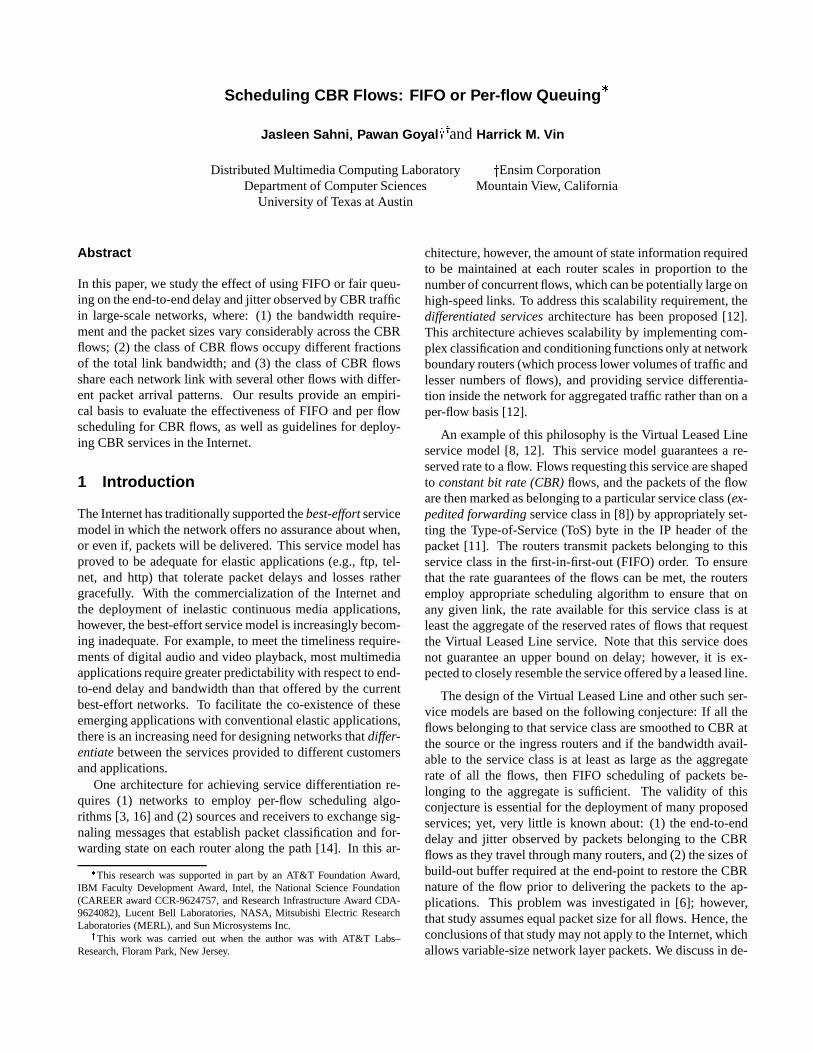
For our experiments, we consider a linear, multi-hop networktopology (see Figure 1(a)). This network model is fairly gen-eral and has been used in literature [7, 9, 10, 15]. Let *�+denote a linear, multi-hop network topology with , routers,and let
� � ( �.-0/ �21 ,43 ) denote the � th router in the topology.Given such a topology, we are interested in the end-to-endperformance of tagged traffic, which refers to the set of CBRflows that enters the network topology at router
� � and tra-verses the multi-hop network topology * + . Specifically, wemeasure how the characteristics of the individual CBR flowsaggregated in the tagged traffic are altered as they interactwith other CBR aggregates (referred to as the cross traffic)that enter and depart the network at each router along the path.
We model each router in this network as having three in-put ports (
" � 15"7621 and"78
) and three output ports ( 9 � 1 9 6:1and 9 8 ). Each input port de-multiplexes 1/3 of its flows toeach of the three output ports (see Figure 1(b)). Using theserouters, we construct the linear, multi-hop network topology* + as follows: * + consists of , routers such that, for all �
Cross trafficentering the tagged path
Cross trafficleaving the tagged path
.. .traffic
Tagged
R1 R2 R3 Rn
...
...
...
1/3
1/3
1/3
1/31/3
1/3
1/3
1/3
1/3O3
O1
O2
I1
I2
I3
DEMUX
DEMUX
DEMUX MUX
MUX
MUX
(a) Network Topology (b) Router Architecture
Figure 1: Simulation environment: network topology and router architecture
(��� � � , � ), the output port 9 6 of router
� � is connectedto the input port
" 6of router
� ����� . Through each router port,an aggregation of CBR flows enters the network. We referto 1/3 of the flows entering port
" 6of router
� � as the taggedtraffic. For each router, the traffic routed to the output port 9 6consists of: (1) The tagged traffic (entering the router fromport
" 6); (2) 1/3 of the flows entering from input port
" � ; and(3) 1/3 of the flows entering from input port
" 8. We refer to
flows entering from ports" � and
" 8that are routed to port9 6 as cross traffic. All of the remaining traffic entering each
router is routed to ports 9 � and 9 8 .The above topology ensures that: (1) the tagged traffic that
enters the network at router� � is routed all the way through
the multi-hop network * + , and (2) the cross traffic enter-ing the network at router
� � ( � - / �:1 ,43 ) interferes with thetransmission of the tagged traffic for a single hop, and leavesthe network at router
� ��� � . This topology facilitates experi-mentation with different compositions of the cross traffic anddifferent network depths.
3.1.2 Modeling Cross Traffic
The extent to which the cross traffic entering each router af-fects the characteristics of the CBR flows in the tagged trafficdepends on the burstiness of the cross traffic. Note that, al-though we have assumed that each flow entering the networkis shaped to CBR at the source, the aggregate cross trafficentering each router may be bursty. This burstiness resultsfrom: (1) the inherent differences in the bit rate requirementsand the phases of the CBR flows, and (2) the traffic distortionsin the network.
To reasonably approximate this burstiness, we model thecross traffic entering at each router in the network as consist-ing of two types of flows: (1) flows that are at the beginningof their routes or have traversed through a small number ofrouters, and (2) flows that are at the end of their routes or havetraversed through a large number of hops. This model closelyapproximates the current Internet—each backbone router is asmall number of hops away from some set of hosts while be-ing far away from some others. Given this model, the inter-esting question in modeling the cross traffic is: what are the
reasonable values for small and large?
To address this question, we conducted an experiment witha seven-hop network topology ( *�� ) with 40Mbps link band-width and fixed size (512 Bytes) packets. The CBR flows en-tering the network were selected from two classes: (1) flowswith bit rates in the range 1.5-5 Mbps, and (2) flows with bitrates in the range 32-95 Kbps. The bit rate for each flow wasselected randomly from the respective ranges. Flows fromeach class were assigned equal share of the link bandwidth.The link utilization was set to 97%. For this experimentalsetup, we measured the burstiness of the tagged traffic ema-nating from port 9 6 of each router in the * � topology. Sinceall the flows have the same packet size, we measure burstinessin terms of index of dispersion for intervals (IDI); IDI mea-sures the variability of packet arrivals at various time scales1.Figure 2 plots the IDI values observed for the tagged traf-fic, assuming that packets are scheduled at the routers usingFIFO and WF
6Q+ . The results indicate that: (1) although
the variability in the inter-packet arrival times for individualflows may increase as CBR flows traverse through a multi-hop network, the IDI values for the aggregate tagged trafficreduces with increase in the hop count; and (2) IDI values forthe aggregate tagged traffic does not change appreciably af-ter 4 hops. Hence, for the rest of this paper, we will assumethat the cross traffic entering port
" � of each router in the net-work has traveled through 1 or 2 network hops, and the trafficentering port
" 8has traveled through 4 hops2.
1The IDI for an inter-arrival process ��� � is formally defined as [6]:
� �������� ����������� "!#%$'&(� �) #�*+-, � !#%$'&.� �) # *
If the process is wide-sense stationary, then� /������� � ����� for all 0 . The
function� ���1� describes the variation in the inter-packet arrival process at
different time scales. Note that for CBR flows,� �������32 , while for a Pois-
son arrival process,� ���1�4�65 for all � .
2Note that our experiment to measure the burstiness of the aggregateflows was conducted for a network with fixed packet size. The conclusionspresented here may change slightly if the above experiment is repeated in adifferent network environment.

0
0.1
0.2
0.3
0.4
0.5
0.6
0.7
0 10 20 30 40 50 60 70 80 90 100
Inde
x of
dis
pers
ion
(FIF
O)
Interval length n
IDI values of the cumulative tagged traffic coming out of Mi topologies
M1 trafficM2 trafficM3 trafficM4 trafficM5 trafficM6 trafficM7 traffic
0
0.1
0.2
0.3
0.4
0.5
0.6
0.7
0 10 20 30 40 50 60 70 80 90 100
Inde
x of
dis
pers
ion
(WF
Q)
Interval length n
IDI values of the cumulative tagged traffic coming out of Mi topologies
M1 trafficM2 trafficM3 trafficM4 trafficM5 trafficM6 trafficM7 traffic
(a) FIFO (b) WF6Q+
Figure 2: IDI values for traffic emanating from router� � ( �$- / �:1�� 3 ) in an * � network topology.
3.2 Design of Experiments
We conduct two sets of experiments; one for the network en-vironment that supports a single class of service (namely theCBR service class), and the other for the network environ-ment that simultaneously supports multiple service classes.
3.2.1 CBR Networks
In this set of experiments, we compare the end-to-end per-formance of CBR flows in networks where each router em-ploys either FIFO or Worst-case Fair Weighted Fair Queuing(WF
6Q+ ) [2] to arbitrate access to link bandwidth, and (1)
all flows are shaped to CBR at the source or at the ingressrouters, and (2) all the flows request the same class of service.We experiment with different compositions of CBR flows anddifferent network configurations.
Experiment 1: A CBR flow � � is characterized by specify-ing its bit rate requirement � � and its packet size � � . Ina large-scale network, such as the Internet, both � � and� � may vary considerably across the CBR flows. In thisexperiment, we systematically evaluate the effect of het-erogeneity along each of these two dimensions on theend-to-end performance of individual CBR flows. Wesimulate the following three network environments.
1. A network environment in which all CBR flowshave different bandwidth requirements, but thepacket size for all the flows is the same. ATM net-works are good examples of such environments.
2. A network environment in which all flows have thesame bandwidth requirement, but the packet sizefor the flows are different.
3. A network environment in which the bit rate re-quirement as well as the packet sizes vary consid-erably across flows. The current Internet is an ex-cellent example of such a network.
Experiment 2: In this experiment, we evaluate the effect ofincreasing the number of hops that the tagged traffic tra-verses through on the end-to-end performance of indi-vidual CBR flows. This allows us to draw conclusionsabout large networks.
Experiment 3: In this experiment, we study the impact ofdifferent network utilization levels on the results of Ex-periment 1 and 2.
We present the results of these experiments in Section 4.
3.2.2 Multi-class Networks
The differentiated services architecture is expected to supportmany different types of end-to-end services. A network canenable the co-existence of these services by employing packetscheduling algorithms to protect application classes from oneanother. Figure 3 depicts such a scheduling framework with�
service classes (denoted by � � 1 � 6:1�����1 �� ). The link band-width available to a service class is proportional to its weight(denoted by � � 1 � 621��� ��1 �� ). The proportionate fair allocationof link bandwidth among classes is achieved by WF
6Q+ ; the
transmission order of packets belonging to a service class isdetermined by a class-specific scheduler.
The objective of this set of experiments is to compare theend-to-end performance of CBR flows in network environ-ments that: (1) supports multiple service classes, (2) usesWF
6Q+ to allocate link bandwidth among the service classes,
and (3) uses either FIFO or WF6Q+ to determine the order for
trasmitting packets belonging to the CBR service class. Weconduct the following experiments.
Experiment 1: Flows that belong to other service classesmay follow different packet arrival processes. In thisexperiment, we study the effect of two different arrivalprocesses—backlogged and on-off—for flows belong-

.
.
.
... FIFOCk
... FIFOC2
... SC1
w1
w2
wk
WF2Q+ O2
C2..Ck: Cross Traffic ClassesC1: CBR Traffic ClassS: FIFO/WF2Q+
Figure 3: Scheduling framework for each output port
ing to other service classes on the end-to-end perfor-mance of CBR flows.
Experiment 2: In this experiment, we evaluate the effect ofsupporting different number of service classes on theend-to-end performance of CBR flows.
Experiment 3: In environments that support multiple ser-vice classes, different fractions of the total link band-width may be available to the CBR service class. In thisexperiment, we determine the effect of allocating differ-ent fractions of the total link bandwidth to the CBR classon the end-to-end performance of individual CBR flows.
We present the results of these experiments in Section 5.
3.3 Performance Measures
We use the following three metrics for our evaluation:
1. End-to-end queueing delay: For each flow � � , we mea-sure the distribution of the end-to-end queueing delay( � � )—the difference between the end-to-end delay andthe propagation latency—suffered by its packets.
2. Normalized inter-packet separation: For each flow, wemeasure the distribution and the variance of the normal-ized inter-packet separation at the destination. The nor-malization is performed with respect to the inter-packetspacing of the CBR flow at the source. This measuresthe extent to which a CBR flow is distorted while it trav-els through multiple routers.
3. Build-out buffer size: This is the size of the buffer re-quired at the destination node to restore the spacing be-tween packets to its initial value at the source. We esti-mate the build-out buffer size as follows.
Let ��� � +� and �������� , respectively, refer to the minimumand the maximum delay suffered by packets of flow � � .Then, all packets that experience the minimum delay
� � � +� have to be buffered at the destination for an inter-val of length
� � ������ � � � +� to reconstruct the nominal
delay � ������ . Since � � denotes the bandwidth requirementfor flow � � , the total build-out buffer (in terms of bytes)can be estimated as:
� �� � � ������ � � � +� ) � ��We determine the build-out buffer required for each flow,and then derive the average build-out buffer requirement.
4 Evaluation of CBR Network
In this set of experiments, we compare the end-to-end per-formance of CBR flows in network environments where eachrouter employs either FIFO or WF
6Q+ to arbitrate access to
link bandwidth, and: (1) the CBR flows have heterogeneousrequirements; (2) CBR flows traverse different number ofhops; and (3) the average network utilization levels are differ-ent. For each of these experiments, we simulate a linear, 20-hop network topology ( * 6 � ), with 40Mbps link bandwidth.
4.1 Heterogeneity in CBR Flows
We experiment with tagged traffic consisting of flows selectedfrom two classes; we vary the ratio of the average packet ar-rival rates of the flows belonging to the two classes from 10to 100. Note that, for a CBR flow, the rate of packet arrivalis given by � ��� � � , where � � and � � , respectively, refer to thebandwidth requirement and packet size for flow � � . Hence,we construct flows that belong to these classes either by ap-propriately controlling � � , � � , or both. We assume that flowsbelonging to each class get an equal share of the link band-width. Moreover, we select flows from each of these twoclasses such that the overall network utilization is 97%.
4.1.1 Heterogeneity in Bandwidth Requirements
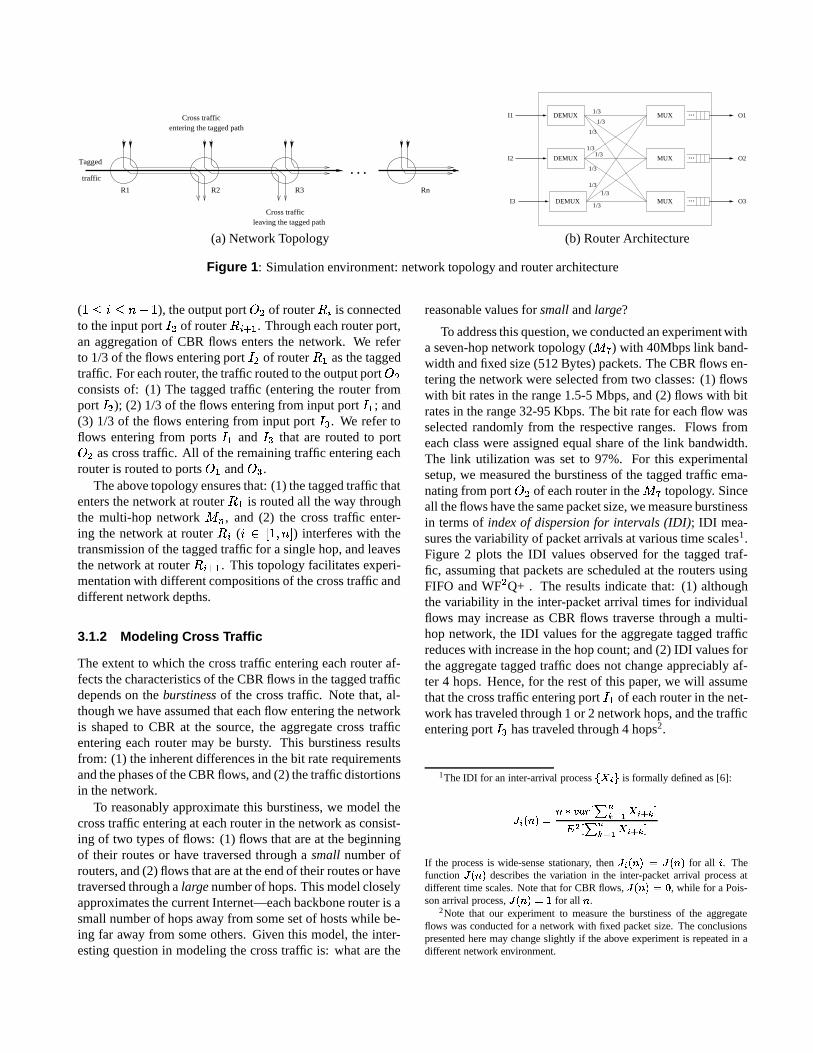
We simulate a network environment where all CBR sourceshave packets of size 512 bytes, but their bandwidth require-ments are selected from intervals such that the ratio of averagebandwidth requirement of flows belonging to the two classesvaries from 10 to 100. Figures 4, 5, and 6 depict the resultsof our simulations. The following conclusions can be derivedfrom these figures.
1. Unlike FIFO, which schedules packets in the order oftheir arrival, WF
6Q+ schedules packets in the increas-
ing order of their finish tags [2]. Since finish tag com-putation is governed by the inverse of the packet arrivalrate, WF
6Q+ provides lower end-to-end queuing delay
to flows with high packet arrival rate while increasingthe end-to-end queuing delay for flows with low packetarrival rates. Figure 4 illustrates this behavior.
0
0.1
0.2
0.3
0.4
0.5
0.6
0.7
0.8
0.9
1
0 0.002 0.004 0.006 0.008 0.01 0.012 0.014 0.016 0.018
Cum
ulat
ive
Dis
trib
utio
n
End-to-end queueing delay (sec)
Variation in distribution of end-to-end queueing delay with maximum ratio of bit rates (high pkt frequency flows)
FIFO: ratio = 11.22FIFO: ratio = 19.78FIFO: ratio = 28.08FIFO: ratio = 35.82FIFO: ratio = 91.47
WF2Q+: ratio = 11.22WF2Q+: ratio = 19.78WF2Q+: ratio = 28.08WF2Q+: ratio = 35.82WF2Q+: ratio = 91.47
0
0.1
0.2
0.3
0.4
0.5
0.6
0.7
0.8
0.9
1
0 0.02 0.04 0.06 0.08 0.1 0.12
Cum
ulat
ive
Dis
trib
utio
n
End-to-end queueing delay (sec)
Variation in distribution of end-to-end queueing delay with maximum ratio of bit rates (low pkt frequency flows)
FIFO: ratio = 11.22FIFO: ratio = 19.78FIFO: ratio = 28.08FIFO: ratio = 35.82FIFO: ratio = 91.47
WF2Q+: ratio = 11.22WF2Q+: ratio = 19.78WF2Q+: ratio = 28.08WF2Q+: ratio = 35.82WF2Q+: ratio = 91.47
(a) High packet frequency flows (b) Low packet frequency flows
Figure 4: Cumulative distribution of absolute end-to-end queuing delay for different ratio of bit rates
0
0.1
0.2
0.3
0.4
0.5
0.6
0.7
0.8
0.9
1
0 0.5 1 1.5 2 2.5 3 3.5
Cum
ulat
ive
Dis
trib
utio
n
Normalized inter-pkt spacing at destination
Variation in distribution of normalized inter-pkt spacing with maximum ratio of bit rates (high pkt frequency flows)
FIFO: ratio = 11.22FIFO: ratio = 19.78FIFO: ratio = 28.08FIFO: ratio = 35.82FIFO: ratio = 91.47
WF2Q+: ratio = 11.22WF2Q+: ratio = 19.78WF2Q+: ratio = 28.08WF2Q+: ratio = 35.82WF2Q+: ratio = 91.47
0
0.1
0.2
0.3
0.4
0.5
0.6
0.7
0.8
0.9
1
0.5 0.6 0.7 0.8 0.9 1 1.1 1.2 1.3 1.4 1.5 1.6
Cum
ulat
ive
Dis
trib
utio
n
Normalized inter-pkt spacing at destination
Variation in distribution of normalized inter-pkt spacing with maximum ratio of bit rates (low pkt frequency flows)
FIFO: ratio = 11.22FIFO: ratio = 19.78FIFO: ratio = 28.08FIFO: ratio = 35.82FIFO: ratio = 91.47
WF2Q+: ratio = 11.22WF2Q+: ratio = 19.78WF2Q+: ratio = 28.08WF2Q+: ratio = 35.82WF2Q+: ratio = 91.47
(a) High packet frequency flows (b) Low packet frequency flows
Figure 5: Cumulative distribution of normalized inter-packet spacing for different ratio of bit rates
0
1000
2000
3000
4000
5000
6000
7000
10 20 30 40 50 60 70 80 90 100
Ave
rage
buf
fer
requ
ired
per
flow
(by
tes)
Maximum ratio of bit rates
Variation in average buffer requirement per flow with maximum ratio of bit rates (high frequency flows)
FIFOWF2Q+
0
20
40
60
80
100
120
140
160
180
200
10 20 30 40 50 60 70 80 90 100
Ave
rage
buf
fer
requ
ired
per
flow
(by
tes)
Maximum ratio of bit rates
Variation in average buffer requirement per flow with maximum ratio of bit rates (low frequency flows)
FIFOWF2Q+
(a) High packet frequency flows (b) Low packet frequency flows
Figure 6: Average buffer space required at destination to rebuild a CBR flow

Perhaps a more interesting observation is that the end-to-end delay distributions do not change significantly withincrease in the ratio of average packet arrival rates of thetwo classes of flows. Since this experiment assumes thatpacket sizes are identical for all flows, Figure 4 suggeststhat FIFO may be adequate for supporting CBR servicesin ATM networks (similar result was also noted in [6]).
2. Figure 5 illustrates that for flows with higher rates ofpacket arrival, the variance in the normalized inter-packet spacing increases with increase in the hetero-geneity of CBR flows. For flows with low rates of packetarrival, on the other hand, the variance for both FIFOand WF
6Q+ does not change appreciably. For FIFO,
the maximum inter-packet spacing at the destination isabout 3 times the corresponding value at the source; forWF
6Q+ , the maximum is about 1.5 times.
3. Figure 6 indicates that the average build-out buffer re-quirements for flows with high arrival rates increase withincrease in in the ratio of average packet arrival rates ofthe two classes of flows. Furthermore, FIFO requiresabout 4 times larger build-out buffer size than WF
6Q+ .
For flows with low arrival rates, on the other hand, thebuild-out buffer size does not depend on the ratio.
Note that, for flows with high rates of packet arrivals,Figure 4 indicate that the maximum and the minimumdelay observed by packets do not appreciably changewith increase in heterogeneity. Hence, the increase inthe build-out buffer size can be attributed predominantlyto the increase in the bandwidth requirement of flows.
4.1.2 Heterogeneity in Packet Sizes
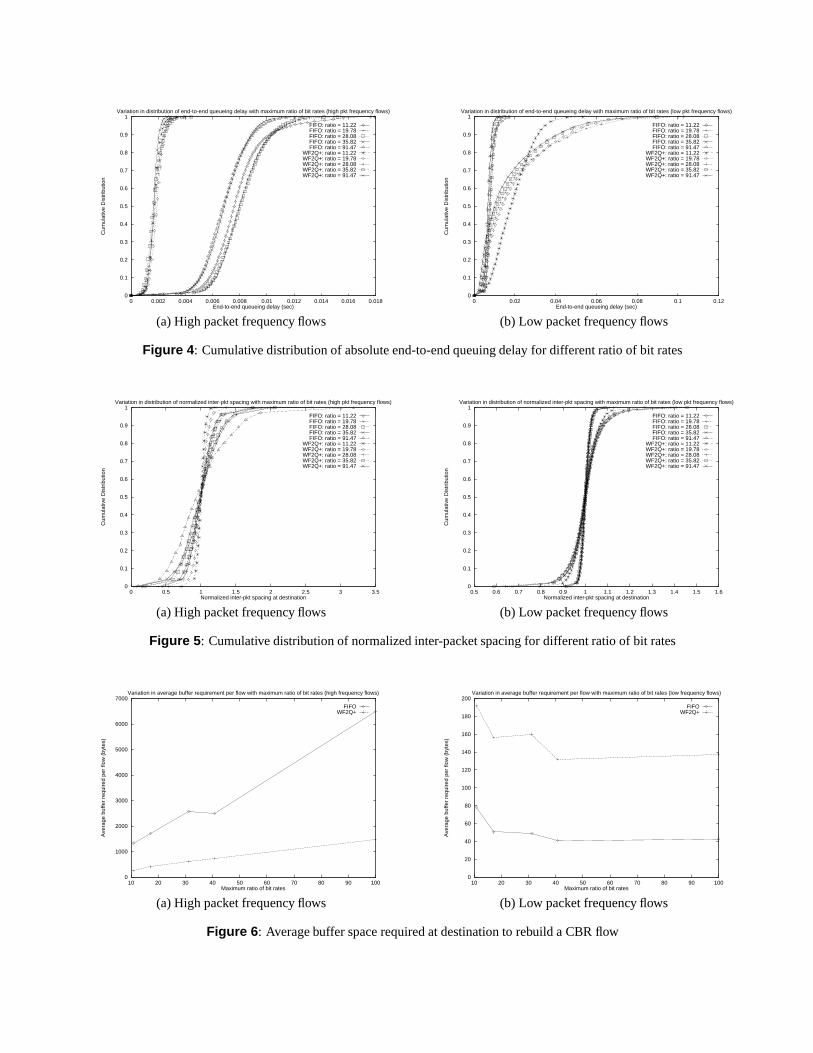
We simulate a network environment where all CBR flowshave the same bandwidth requirement (namely, 113 Kbps),but their packet sizes are selected from intervals such that theratio of average packet sizes of flows belonging to the twoclasses varies from 10 to 100. To obtain this range, we keptthe interval of smaller packet sizes fixed, and changed the in-terval from which larger packet sizes are chosen. Note thatthe larger the packet size, the smaller is the rate of packet ar-rivals. Figures 7, 8, 9, and 10 plot results of our experiments.
1. Figure 7(a) indicates that under WF6Q+ scheduling, the
end-to-end delay suffered by flows with high packet ar-rival rates does not change appreciably; however, withFIFO, the end-to-end delay increases substantially. Fig-ure 7(b) indicates that, with increase in packet size,and hence an increase in the inter-arrival time for pack-ets, flows suffer a larger end-to-end queuing delay withWF
6Q+ . With FIFO, however, the end-to-end queuing
delay does not change appreciably.
Note that since the packet size interval for smaller pack-ets is kept fixed, the packet arrival rate for the corre-
sponding flows remains unchanged. On the contrary,for the flows with smaller packet arrival rates, increas-ing the packet size reduces the arrival rate even further(and thereby increases the inter-arrival time for packets).Hence, to put the results presented in Figure 7 in context,consider Figure 8, which plots 99.9%-percentile of thethe normalized end-to-end queuing delay for each flow;the normalization is done with respect to the inter-arrivaltime at the source of packets for each flow.
Figure 8(a) indicates that the 99.9%-percentile normal-ized end-to-end queuing delay suffered by flows in aclass increases with the increase in the packet sizes forflows in the other class. Furthermore, the flows sufferalmost an order of magnitude higher end-to-end queu-ing delay with FIFO than with WF
6Q+ . Figure 8(b),
on the other hand, indicates that, although the absoluteend-to-end delay for flows with low packet arrival ratesincreases with increase in the heterogeneity in packetsizes, the normalized delay does not change apprecia-bly. This illustrates that the increase in absolute end-to-end queuing delays for these flows is in proportion to theincrease in their packet sizes.
2. Figure 9 indicates that the variance of the normalizedinter-packet separation at the destination increases withincrease in ratio of packet sizes of the flows belongingto the two classes. For flows with a higher frequencyof packet arrivals, the variance increases from 0.05 to0.63 for FIFO, and from 0.004 to 0.21 for WF
6Q+ when
the ratio of average packet sizes for the two classes in-creases from 10 to 100. The variance in the normalizedinter-packet separation at the destination is not signif-icant for flows with low packet arrival frequency. ForFIFO, the maximum inter-packet separation at the desti-nation is about 10 times the corresponding value at thesource; for WF
6Q+ the maximum is about 3 times.
3. Figure 10 indicates that the average build-out buffer re-quirement increases for flows belonging to both classes,which is consistent with the increase in the end-to-endqueuing delay. For flows with higher packet arrival rates,the build-out buffer requirement for FIFO is about anorder of magnitude larger than WF
6Q+ ; on the other
hand, for the other class of flows, WF6Q+ requires twice
as much build-out buffer as FIFO. It is interesting tonote that although the number of packets that need tobe buffered at the destination is dramatically higher forflows with high packet arrival rates than its counterpart,due to the heterogeneity in packet sizes, the maximumbuffer space requirements for the high frequency flowsunder FIFO is similar to that of low frequency flows un-der WF
6Q+ .

0
0.1
0.2
0.3
0.4
0.5
0.6
0.7
0.8
0.9
1
0 0.05 0.1 0.15 0.2 0.25 0.3 0.35
Cum
ulat
ive
Dis
trib
utio
n
End-to-end queueing delay (sec)
Variation in distribution of end-to-end queueing delay with maximum ratio of packet sizes (high pkt frequency flows)
FIFO: ratio = 10.8FIFO: ratio = 26FIFO: ratio = 42FIFO: ratio = 58
FIFO: ratio = 100WF2Q+: ratio = 10.8
WF2Q+: ratio = 26WF2Q+: ratio = 42WF2Q+: ratio = 58
WF2Q+: ratio = 100
0
0.1
0.2
0.3
0.4
0.5
0.6
0.7
0.8
0.9
1
0 0.1 0.2 0.3 0.4 0.5 0.6 0.7
Cum
ulat
ive
Dis
trib
utio
n
End-to-end queueing delay (sec)
Variation in distribution of end-to-end queueing delay with maximum ratio of packet sizes (low pkt frequency flows)
FIFO: ratio = 10.8FIFO: ratio = 26FIFO: ratio = 42FIFO: ratio = 58
FIFO: ratio = 100WF2Q+: ratio = 10.8
WF2Q+: ratio = 26WF2Q+: ratio = 42WF2Q+: ratio = 58
WF2Q+: ratio = 100
(a) High packet frequency flows (b) Low packet frequency flows
Figure 7: Cumulative distribution of absolute end-to-end queuing delay for different ratio of packet sizes
0
5
10
15
20
25
30
35
40
45
10 20 30 40 50 60 70 80 90 100
99.9
% N
orm
aliz
ed E
nd-t
o-E
nd Q
ueue
ing
Del
ay
Maximum ratio of packet sizes
Variation in normalized queueing delay with maximum ratio of packet sizes
FIFO: high frequency packetsWF2Q+: high frequency packets
0
0.1
0.2
0.3
0.4
0.5
0.6
0.7
0.8
0.9
10 20 30 40 50 60 70 80 90 100
99.9
% N
orm
aliz
ed E
nd-t
o-E
nd Q
ueue
ing
Del
ay
Maximum ratio of packet-sizes
Variation in normalized queueing delay with maximum ratio of packet-sizes
FIFO: low frequency packetsWF2Q+: low frequency packets
(a) High packet frequency flows (b) Low packet frequency flows
Figure 8: 99.9%-percentile of the normalized end-to-end queuing delay for different ratio of packet sizes
0
0.1
0.2
0.3
0.4
0.5
0.6
0.7
0.8
0.9
1
0 1 2 3 4 5 6 7 8 9 10
Cum
ulat
ive
Dis
trib
utio
n
Normalized inter-pkt spacing at destination
Variation in distribution of normalized inter-pkt spacing with maximum ratio of packet sizes (high pkt frequency flows)
FIFO: ratio = 10.8FIFO: ratio = 26FIFO: ratio = 42FIFO: ratio = 58
FIFO: ratio = 100WF2Q+: ratio = 10.8
WF2Q+: ratio = 26WF2Q+: ratio = 42WF2Q+: ratio = 58
WF2Q+: ratio = 100
0
0.1
0.2
0.3
0.4
0.5
0.6
0.7
0.8
0.9
1
0.75 0.8 0.85 0.9 0.95 1 1.05 1.1 1.15 1.2 1.25 1.3
Cum
ulat
ive
Dis
trib
utio
n
Normalized inter-pkt spacing at destination
Variation in distribution of normalized inter-pkt spacing with maximum ratio of packet sizes (low pkt frequency flows)
FIFO: ratio = 10.8FIFO: ratio = 26FIFO: ratio = 42FIFO: ratio = 58
FIFO: ratio = 100WF2Q+: ratio = 10.8
WF2Q+: ratio = 26WF2Q+: ratio = 42WF2Q+: ratio = 58
WF2Q+: ratio = 100
(a) High packet frequency flows (b) Low packet frequency flows
Figure 9: Cumulative distribution of normalized inter-packet spacing for different ratio of packet sizes
0
500
1000
1500
2000
2500
3000
3500
4000
4500
5000
10 20 30 40 50 60 70 80 90 100
Ave
rage
buf
fer
requ
ired
per
flow
(by
tes)
Maximum ratio of packet sizes
Variation in average buffer requirement per flow with maximum ratio of packet sizes (high frequency flows)
FIFOWF2Q+
0
500
1000
1500
2000
2500
3000
3500
4000
4500
10 20 30 40 50 60 70 80 90 100
Ave
rage
buf
fer
requ
ired
per
flow
(by
tes)
Maximum ratio of packet sizes
Variation in average buffer requirement per flow with maximum ratio of packet sizes (low frequency flows)
FIFOWF2Q+
(a) High packet frequency flows (b) Low packet frequency flows
Figure 10: Average buffer space required at destination to rebuild a CBR flow
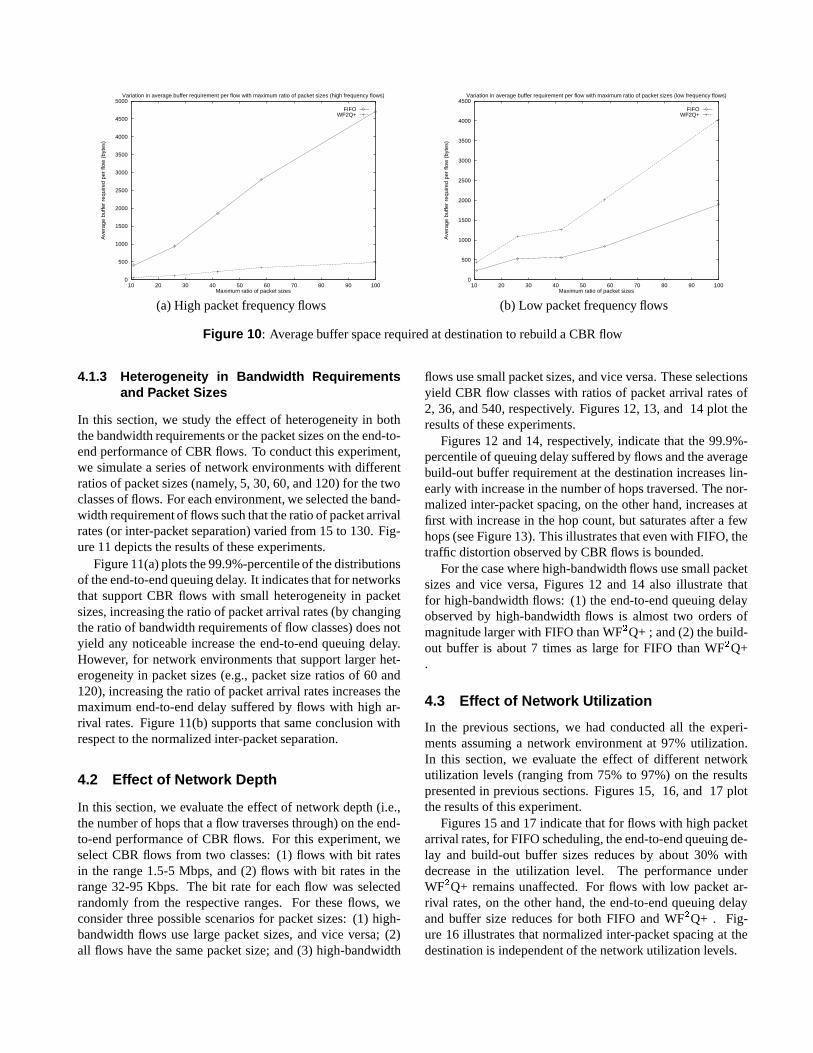
4.1.3 Heterogeneity in Bandwidth Requirementsand Packet Sizes
In this section, we study the effect of heterogeneity in boththe bandwidth requirements or the packet sizes on the end-to-end performance of CBR flows. To conduct this experiment,we simulate a series of network environments with differentratios of packet sizes (namely, 5, 30, 60, and 120) for the twoclasses of flows. For each environment, we selected the band-width requirement of flows such that the ratio of packet arrivalrates (or inter-packet separation) varied from 15 to 130. Fig-ure 11 depicts the results of these experiments.
Figure 11(a) plots the 99.9%-percentile of the distributionsof the end-to-end queuing delay. It indicates that for networksthat support CBR flows with small heterogeneity in packetsizes, increasing the ratio of packet arrival rates (by changingthe ratio of bandwidth requirements of flow classes) does notyield any noticeable increase the end-to-end queuing delay.However, for network environments that support larger het-erogeneity in packet sizes (e.g., packet size ratios of 60 and120), increasing the ratio of packet arrival rates increases themaximum end-to-end delay suffered by flows with high ar-rival rates. Figure 11(b) supports that same conclusion withrespect to the normalized inter-packet separation.
4.2 Effect of Network Depth
In this section, we evaluate the effect of network depth (i.e.,the number of hops that a flow traverses through) on the end-to-end performance of CBR flows. For this experiment, weselect CBR flows from two classes: (1) flows with bit ratesin the range 1.5-5 Mbps, and (2) flows with bit rates in therange 32-95 Kbps. The bit rate for each flow was selectedrandomly from the respective ranges. For these flows, weconsider three possible scenarios for packet sizes: (1) high-bandwidth flows use large packet sizes, and vice versa; (2)all flows have the same packet size; and (3) high-bandwidth
flows use small packet sizes, and vice versa. These selectionsyield CBR flow classes with ratios of packet arrival rates of2, 36, and 540, respectively. Figures 12, 13, and 14 plot theresults of these experiments.
Figures 12 and 14, respectively, indicate that the 99.9%-percentile of queuing delay suffered by flows and the averagebuild-out buffer requirement at the destination increases lin-early with increase in the number of hops traversed. The nor-malized inter-packet spacing, on the other hand, increases atfirst with increase in the hop count, but saturates after a fewhops (see Figure 13). This illustrates that even with FIFO, thetraffic distortion observed by CBR flows is bounded.
For the case where high-bandwidth flows use small packetsizes and vice versa, Figures 12 and 14 also illustrate thatfor high-bandwidth flows: (1) the end-to-end queuing delayobserved by high-bandwidth flows is almost two orders ofmagnitude larger with FIFO than WF
6Q+ ; and (2) the build-
out buffer is about 7 times as large for FIFO than WF6Q+
.
4.3 Effect of Network Utilization
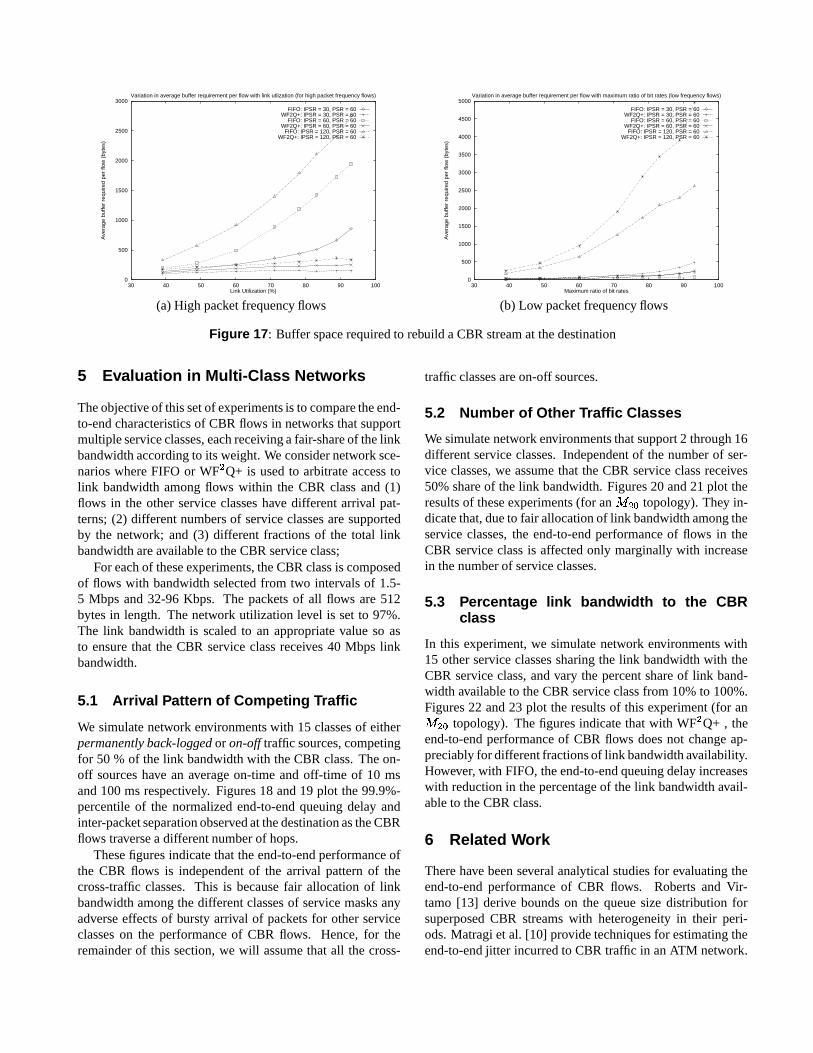
In the previous sections, we had conducted all the experi-ments assuming a network environment at 97% utilization.In this section, we evaluate the effect of different networkutilization levels (ranging from 75% to 97%) on the resultspresented in previous sections. Figures 15, 16, and 17 plotthe results of this experiment.
Figures 15 and 17 indicate that for flows with high packetarrival rates, for FIFO scheduling, the end-to-end queuing de-lay and build-out buffer sizes reduces by about 30% withdecrease in the utilization level. The performance underWF
6Q+ remains unaffected. For flows with low packet ar-
rival rates, on the other hand, the end-to-end queuing delayand buffer size reduces for both FIFO and WF
6Q+ . Fig-
ure 16 illustrates that normalized inter-packet spacing at thedestination is independent of the network utilization levels.

0
0.05
0.1
0.15
0.2
0.25
0.3
0.35
0.4
0.45
0 20 40 60 80 100 120 140
99.9
% E
nd-t
o-en
d qu
euei
ng d
elay
(se
c)
Maximum ratio of inter-packet spacing
Variation in queueing delay of high frequency flows with maximum ratio of inter-packet spacing
FIFO: packet size ratio = 5FIFO: packet size ratio = 30FIFO: packet size ratio = 60
FIFO: packet size ratio = 120WF2Q+: packet size ratio = 5
WF2Q+: packet size ratio = 30WF2Q+: packet size ratio = 60
WF2Q+: packet size ratio = 120
0
1
2
3
4
5
6
7
8
0 20 40 60 80 100 120 140
99.9
% N
orm
aliz
ed In
ter-
pkt S
paci
ng a
t Des
t
Maximum ratio of inter-packet spacing
Variation in normalized inter-pkt spacing of high frequency flows with maximum ratio of inter-packet spacing
FIFO: packet size ratio = 5FIFO: packet size ratio = 30FIFO: packet size ratio = 60
FIFO: packet size ratio = 120WF2Q+: packet size ratio = 5
WF2Q+: packet size ratio = 30WF2Q+: packet size ratio = 60
WF2Q+: packet size ratio = 120
(a) (b)
Figure 11: 99.9%-percentile of (a) end-to-end queuing delay and (b) normalized inter-pkt spacing (for flows with high packetfrequency)
0
20
40
60
80
100
120
0 2 4 6 8 10 12 14 16 18 20
Nor
mal
ized
End
-to-
End
Que
uein
g D
elay
Number of Hops
Variation in normalized delay with hop-count
FIFO: small pkts, high bit-rate flowsWF2Q+: small pkts, high bit-rate flows
FIFO: same pkts, high bit-rate flowsWF2Q+: same pkts, high bit-rate flows
FIFO: large pkts, high bit-rate flowsWF2Q+: large pkts, high bit-rate flows
0
0.2
0.4
0.6
0.8
1
1.2
1.4
1.6
1.8
0 2 4 6 8 10 12 14 16 18 20
Nor
mal
ized
End
-to-
End
Que
uein
g D
elay
Number of Hops
Variation in normalized delay with hop-count
FIFO: large pkts, low bit-rate flowsWF2Q+: large pkts, low bit-rate flows
FIFO: same pkts, low bit-rate flowsWF2Q+: same pkts, low bit-rate flows
FIFO: small pkts, low bit-rate flowsWF2Q+: small pkts, low bit-rate flows
(a) High packet frequency flows (b) Low packet frequency flows
Figure 12: 99.9%-percentile of normalized end-to-end queuing delay
1
2
3
4
5
6
7
8
0 2 4 6 8 10 12 14 16 18 20
Nor
mal
ized
Inte
r-pk
t Spa
cing
at D
est
Number of Hops
Variation in normalized inter-pkt spacing with hop-count
FIFO: small pkts, high bit-rate flowsWF2Q+: small pkts, high bit-rate flows
FIFO: same pkts, high bit-rate flowsWF2Q+: same pkts, high bit-rate flows
FIFO: large pkts, high bit-rate flowsWF2Q+: large pkts, high bit-rate flows
1
1.1
1.2
1.3
1.4
1.5
1.6
0 2 4 6 8 10 12 14 16 18 20
Nor
mal
ized
Inte
r-pk
t Spa
cing
at D
est
Number of Hops
Variation in normalized inter-pkt spacing with hop-count
FIFO: large pkts, low bit-rate flowsWF2Q+: large pkts, low bit-rate flows
FIFO: same pkts, low bit-rate flowsWF2Q+: same pkts, low bit-rate flows
FIFO: small pkts, low bit-rate flowsWF2Q+: small pkts, low bit-rate flows
(a) High packet frequency flows (b) Low packet frequency flows
Figure 13: 99.9%-percentile of normalized inter-packet spacing

0
1000
2000
3000
4000
5000
6000
7000
0 2 4 6 8 10 12 14 16 18 20
Ave
rage
buf
fer
requ
ired
at d
estin
atio
n
Number of Hops
Variation in average buffer required per flow with hop-count
FIFO: small pkts, high bit-rate flowsWF2Q+: small pkts, high bit-rate flows
FIFO: same pkts, high bit-rate flowsWF2Q+: same pkts, high bit-rate flows
FIFO: large pkts, high bit-rate flowsWF2Q+: large pkts, high bit-rate flows
0
50
100
150
200
250
300
350
400
0 2 4 6 8 10 12 14 16 18 20
Ave
rage
buf
fer
requ
ired
at d
estin
atio
n
Number of Hops
Variation in average buffer required per flow with hop-count
FIFO: large pkts, low bit-rate flowsWF2Q+: large pkts, low bit-rate flows
FIFO: same pkts, low bit-rate flowsWF2Q+: same pkts, low bit-rate flows
FIFO: small pkts, low bit-rate flowsWF2Q+: small pkts, low bit-rate flows
(a) High packet frequency flows (b) Low packet frequency flows
Figure 14: Buffer requirement at destination
0
5
10
15
20
25
30
35
30 40 50 60 70 80 90 100
Nor
mal
ized
End
-to-
End
Que
uein
g D
elay
Link utilization
Variation in normalized queueing delay with network link utilization
FIFO: IPSR = 64.77, PSR = 30FIFO: IPSR = 60, PSR = 60
FIFO: IPSR = 55.58, PSR = 120WF2Q+: IPSR = 64.77, PSR = 30
WF2Q+: IPSR = 60, PSR = 60WF2Q+: IPSR = 55.58, PSR = 120
0
0.1
0.2
0.3
0.4
0.5
0.6
0.7
0.8
0.9
30 40 50 60 70 80 90 100
Nor
mal
ized
End
-to-
End
Que
uein
g D
elay
Link utilization
Variation in normalized queueing delay with network link utilization
FIFO: IPSR = 64.77, PSR = 30FIFO: IPSR = 60, PSR = 60
FIFO: IPSR = 55.58, PSR = 120WF2Q+: IPSR = 64.77, PSR = 30
WF2Q+: IPSR = 60, PSR = 60WF2Q+: IPSR = 55.58, PSR = 120
(a) High packet frequency flows (b) Low packet frequency flows
Figure 15: 99.9%-percentile of normalized end-to-end queuing delay
0
1
2
3
4
5
6
30 40 50 60 70 80 90 100
Nor
mal
ized
Inte
r-pk
t Spa
cing
at D
est
Link Utilization
Variation in normalized inter-pkt spacing with link utilization
FIFO: IPSR = 64.77, PSR = 30FIFO: IPSR = 60, PSR = 60
FIFO: IPSR = 55.58, PSR = 120WF2Q+: IPSR = 64.77, PSR = 30
WF2Q+: IPSR = 60, PSR = 60WF2Q+: IPSR = 55.58, PSR = 120
0
0.2
0.4
0.6
0.8
1
1.2
1.4
30 40 50 60 70 80 90 100
Nor
mal
ized
Inte
r-pk
t Spa
cing
at D
est
Link Utilization
Variation in normalized inter-pkt spacing with link utilization
FIFO: IPSR = 64.77, PSR = 30FIFO: IPSR = 60, PSR = 60
FIFO: IPSR = 55.58, PSR = 120WF2Q+: IPSR = 64.77, PSR = 30
WF2Q+: IPSR = 60, PSR = 60WF2Q+: IPSR = 55.58, PSR = 120
(a) High packet frequency flows (b) Low packet frequency flows
Figure 16: 99.9%-percentile of normalized inter-pkt spacing
0
500
1000
1500
2000
2500
3000
30 40 50 60 70 80 90 100
Ave
rage
buf
fer
requ
ired
per
flow
(by
tes)
Link Utilization (%)
Variation in average buffer requirement per flow with link utlization (for high packet frequency flows)
FIFO: IPSR = 30, PSR = 60WF2Q+: IPSR = 30, PSR = 60
FIFO: IPSR = 60, PSR = 60WF2Q+: IPSR = 60, PSR = 60
FIFO: IPSR = 120, PSR = 60WF2Q+: IPSR = 120, PSR = 60
0
500
1000
1500
2000
2500
3000
3500
4000
4500
5000
30 40 50 60 70 80 90 100
Ave
rage
buf
fer
requ
ired
per
flow
(by
tes)
Maximum ratio of bit rates
Variation in average buffer requirement per flow with maximum ratio of bit rates (low frequency flows)
FIFO: IPSR = 30, PSR = 60WF2Q+: IPSR = 30, PSR = 60
FIFO: IPSR = 60, PSR = 60WF2Q+: IPSR = 60, PSR = 60
FIFO: IPSR = 120, PSR = 60WF2Q+: IPSR = 120, PSR = 60
(a) High packet frequency flows (b) Low packet frequency flows
Figure 17: Buffer space required to rebuild a CBR stream at the destination
5 Evaluation in Multi-Class Networks
The objective of this set of experiments is to compare the end-to-end characteristics of CBR flows in networks that supportmultiple service classes, each receiving a fair-share of the linkbandwidth according to its weight. We consider network sce-narios where FIFO or WF
6Q+ is used to arbitrate access to
link bandwidth among flows within the CBR class and (1)flows in the other service classes have different arrival pat-terns; (2) different numbers of service classes are supportedby the network; and (3) different fractions of the total linkbandwidth are available to the CBR service class;
For each of these experiments, the CBR class is composedof flows with bandwidth selected from two intervals of 1.5-5 Mbps and 32-96 Kbps. The packets of all flows are 512bytes in length. The network utilization level is set to 97%.The link bandwidth is scaled to an appropriate value so asto ensure that the CBR service class receives 40 Mbps linkbandwidth.
5.1 Arrival Pattern of Competing Traffic
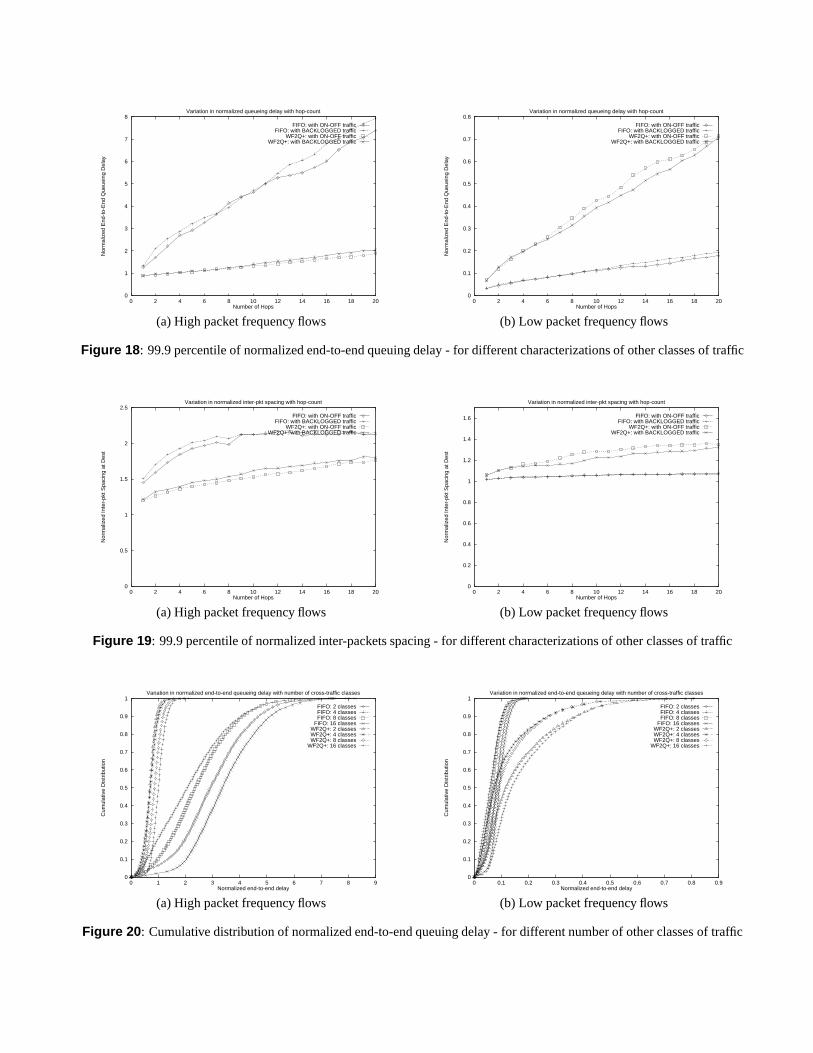
We simulate network environments with 15 classes of eitherpermanently back-logged or on-off traffic sources, competingfor 50 % of the link bandwidth with the CBR class. The on-off sources have an average on-time and off-time of 10 msand 100 ms respectively. Figures 18 and 19 plot the 99.9%-percentile of the normalized end-to-end queuing delay andinter-packet separation observed at the destination as the CBRflows traverse a different number of hops.
These figures indicate that the end-to-end performance ofthe CBR flows is independent of the arrival pattern of thecross-traffic classes. This is because fair allocation of linkbandwidth among the different classes of service masks anyadverse effects of bursty arrival of packets for other serviceclasses on the performance of CBR flows. Hence, for theremainder of this section, we will assume that all the cross-
traffic classes are on-off sources.
5.2 Number of Other Traffic Classes
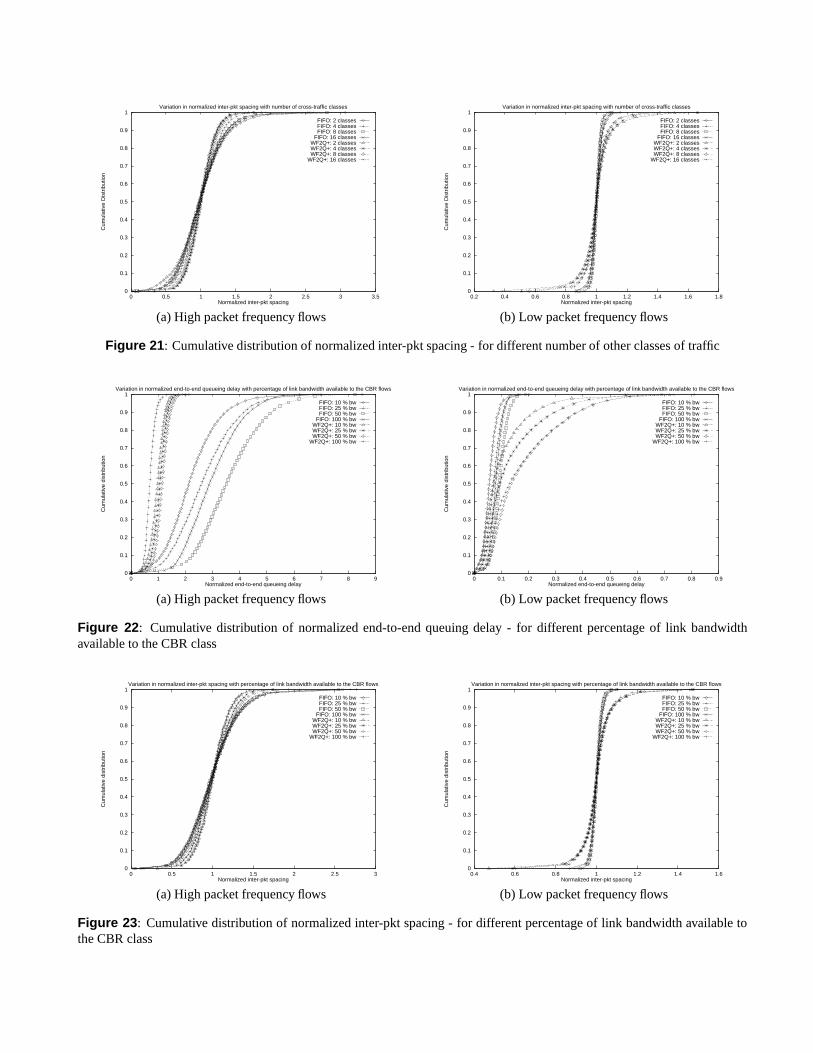
We simulate network environments that support 2 through 16different service classes. Independent of the number of ser-vice classes, we assume that the CBR service class receives50% share of the link bandwidth. Figures 20 and 21 plot theresults of these experiments (for an * 6 � topology). They in-dicate that, due to fair allocation of link bandwidth among theservice classes, the end-to-end performance of flows in theCBR service class is affected only marginally with increasein the number of service classes.
5.3 Percentage link bandwidth to the CBRclass
In this experiment, we simulate network environments with15 other service classes sharing the link bandwidth with theCBR service class, and vary the percent share of link band-width available to the CBR service class from 10% to 100%.Figures 22 and 23 plot the results of this experiment (for an* 6 � topology). The figures indicate that with WF
6Q+ , the
end-to-end performance of CBR flows does not change ap-preciably for different fractions of link bandwidth availability.However, with FIFO, the end-to-end queuing delay increaseswith reduction in the percentage of the link bandwidth avail-able to the CBR class.
6 Related Work
There have been several analytical studies for evaluating theend-to-end performance of CBR flows. Roberts and Vir-tamo [13] derive bounds on the queue size distribution forsuperposed CBR streams with heterogeneity in their peri-ods. Matragi et al. [10] provide techniques for estimating theend-to-end jitter incurred to CBR traffic in an ATM network.
0
1
2
3
4
5
6
7
8
0 2 4 6 8 10 12 14 16 18 20
Nor
mal
ized
End
-to-
End
Que
uein
g D
elay
Number of Hops
Variation in normalized queueing delay with hop-count
FIFO: with ON-OFF trafficFIFO: with BACKLOGGED traffic
WF2Q+: with ON-OFF trafficWF2Q+: with BACKLOGGED traffic
0
0.1
0.2
0.3
0.4
0.5
0.6
0.7
0.8
0 2 4 6 8 10 12 14 16 18 20
Nor
mal
ized
End
-to-
End
Que
uein
g D
elay
Number of Hops
Variation in normalized queueing delay with hop-count
FIFO: with ON-OFF trafficFIFO: with BACKLOGGED traffic
WF2Q+: with ON-OFF trafficWF2Q+: with BACKLOGGED traffic
(a) High packet frequency flows (b) Low packet frequency flows
Figure 18: 99.9 percentile of normalized end-to-end queuing delay - for different characterizations of other classes of traffic
0
0.5
1
1.5
2
2.5
0 2 4 6 8 10 12 14 16 18 20
Nor
mal
ized
Inte
r-pk
t Spa
cing
at D
est
Number of Hops
Variation in normalized inter-pkt spacing with hop-count
FIFO: with ON-OFF trafficFIFO: with BACKLOGGED traffic
WF2Q+: with ON-OFF trafficWF2Q+: with BACKLOGGED traffic
0
0.2
0.4
0.6
0.8
1
1.2
1.4
1.6
0 2 4 6 8 10 12 14 16 18 20
Nor
mal
ized
Inte
r-pk
t Spa
cing
at D
est
Number of Hops
Variation in normalized inter-pkt spacing with hop-count
FIFO: with ON-OFF trafficFIFO: with BACKLOGGED traffic
WF2Q+: with ON-OFF trafficWF2Q+: with BACKLOGGED traffic
(a) High packet frequency flows (b) Low packet frequency flows
Figure 19: 99.9 percentile of normalized inter-packets spacing - for different characterizations of other classes of traffic
0
0.1
0.2
0.3
0.4
0.5
0.6
0.7
0.8
0.9
1
0 1 2 3 4 5 6 7 8 9
Cum
ulat
ive
Dis
trib
utio
n
Normalized end-to-end delay
Variation in normalized end-to-end queueing delay with number of cross-traffic classes
FIFO: 2 classesFIFO: 4 classesFIFO: 8 classes
FIFO: 16 classesWF2Q+: 2 classesWF2Q+: 4 classesWF2Q+: 8 classes
WF2Q+: 16 classes
0
0.1
0.2
0.3
0.4
0.5
0.6
0.7
0.8
0.9
1
0 0.1 0.2 0.3 0.4 0.5 0.6 0.7 0.8 0.9
Cum
ulat
ive
Dis
trib
utio
n
Normalized end-to-end delay
Variation in normalized end-to-end queueing delay with number of cross-traffic classes
FIFO: 2 classesFIFO: 4 classesFIFO: 8 classes
FIFO: 16 classesWF2Q+: 2 classesWF2Q+: 4 classesWF2Q+: 8 classes
WF2Q+: 16 classes
(a) High packet frequency flows (b) Low packet frequency flows
Figure 20: Cumulative distribution of normalized end-to-end queuing delay - for different number of other classes of traffic
0
0.1
0.2
0.3
0.4
0.5
0.6
0.7
0.8
0.9
1
0 0.5 1 1.5 2 2.5 3 3.5
Cum
ulat
ive
Dis
trib
utio
n
Normalized inter-pkt spacing
Variation in normalized inter-pkt spacing with number of cross-traffic classes
FIFO: 2 classesFIFO: 4 classesFIFO: 8 classes
FIFO: 16 classesWF2Q+: 2 classesWF2Q+: 4 classesWF2Q+: 8 classes
WF2Q+: 16 classes
0
0.1
0.2
0.3
0.4
0.5
0.6
0.7
0.8
0.9
1
0.2 0.4 0.6 0.8 1 1.2 1.4 1.6 1.8
Cum
ulat
ive
Dis
trib
utio
n
Normalized inter-pkt spacing
Variation in normalized inter-pkt spacing with number of cross-traffic classes
FIFO: 2 classesFIFO: 4 classesFIFO: 8 classes
FIFO: 16 classesWF2Q+: 2 classesWF2Q+: 4 classesWF2Q+: 8 classes
WF2Q+: 16 classes
(a) High packet frequency flows (b) Low packet frequency flows
Figure 21: Cumulative distribution of normalized inter-pkt spacing - for different number of other classes of traffic
0
0.1
0.2
0.3
0.4
0.5
0.6
0.7
0.8
0.9
1
0 1 2 3 4 5 6 7 8 9
Cum
ulat
ive
dist
ribut
ion
Normalized end-to-end queueing delay
Variation in normalized end-to-end queueing delay with percentage of link bandwidth available to the CBR flows
FIFO: 10 % bwFIFO: 25 % bwFIFO: 50 % bw
FIFO: 100 % bwWF2Q+: 10 % bwWF2Q+: 25 % bwWF2Q+: 50 % bw
WF2Q+: 100 % bw
0
0.1
0.2
0.3
0.4
0.5
0.6
0.7
0.8
0.9
1
0 0.1 0.2 0.3 0.4 0.5 0.6 0.7 0.8 0.9
Cum
ulat
ive
dist
ribut
ion
Normalized end-to-end queueing delay
Variation in normalized end-to-end queueing delay with percentage of link bandwidth available to the CBR flows
FIFO: 10 % bwFIFO: 25 % bwFIFO: 50 % bw
FIFO: 100 % bwWF2Q+: 10 % bwWF2Q+: 25 % bwWF2Q+: 50 % bw
WF2Q+: 100 % bw
(a) High packet frequency flows (b) Low packet frequency flows
Figure 22: Cumulative distribution of normalized end-to-end queuing delay - for different percentage of link bandwidthavailable to the CBR class
0
0.1
0.2
0.3
0.4
0.5
0.6
0.7
0.8
0.9
1
0 0.5 1 1.5 2 2.5 3
Cum
ulat
ive
dist
ribut
ion
Normalized inter-pkt spacing
Variation in normalized inter-pkt spacing with percentage of link bandwidth available to the CBR flows
FIFO: 10 % bwFIFO: 25 % bwFIFO: 50 % bw
FIFO: 100 % bwWF2Q+: 10 % bwWF2Q+: 25 % bwWF2Q+: 50 % bw
WF2Q+: 100 % bw
0
0.1
0.2
0.3
0.4
0.5
0.6
0.7
0.8
0.9
1
0.4 0.6 0.8 1 1.2 1.4 1.6
Cum
ulat
ive
dist
ribut
ion
Normalized inter-pkt spacing
Variation in normalized inter-pkt spacing with percentage of link bandwidth available to the CBR flows
FIFO: 10 % bwFIFO: 25 % bwFIFO: 50 % bw
FIFO: 100 % bwWF2Q+: 10 % bwWF2Q+: 25 % bwWF2Q+: 50 % bw
WF2Q+: 100 % bw
(a) High packet frequency flows (b) Low packet frequency flows
Figure 23: Cumulative distribution of normalized inter-pkt spacing - for different percentage of link bandwidth available tothe CBR class

Their study is thus limited to flows with fixed packet sizes,and they do not talk about the actual end-to-end delay in-curred, or the build-out buffer requirement at the destination.Gruenenfelder [7] studies a connection going through multi-ple hops and observes that the end-to-end delay distributiondepends on the auto-covariance of the cross-traffic sharingthe network links. DeSimone [4] shows that the inter-arrivaltime of packets becomes more bursty in a traffic stream onpassing through networks that carry packets of highly vari-able size. However, this study focusses on non-CBR traffic,and it is not obvious if the same result would hold for CBRnetworks. Furthermore, the analysis is carried out assuminga single cross traffic stream and a small network.
Grossglauser and Keshav [6] present a simulation study ofthe end-to-end delay and jitter observed by CBR flows as theytraverse large networks while interacting with several crosstraffic flows. However, their study assumes fixed packet sizes,making the study applicable to ATM-type networks.
7 Concluding Remarks
In this paper, we studied—through simulations—the effect ofusing FIFO or fair queuing on the performance of CBR traf-fic in the context of large-scale networks, in which: (1) thebandwidth requirement and the packet sizes vary consider-ably across the CBR flows; (2) the class of CBR flows oc-cupy different fractions of the total link bandwidth; and (3)the class of CBR flows share each network link with severalother flows with different packet arrival patterns. Our experi-ments demonstrated that:
1. For networks where all flows have the same packet size,end-to-end queuing delays do not change significantlywith increase in heterogeneity of bandwidth require-ments of CBR flows. Hence, FIFO is adequate to sup-port CBR services in ATM networks.
2. End-to-end delay and build-out buffer size increases lin-early with increase in heterogeneity of packet sizes.Flows can suffer almost an order of magnitude higherend-to-end queuing delay with FIFO than with WF
6Q+
. This result demonstrates the invalidity of the conjec-ture reported in Section 2, and thereby argues that innetworks that service flows with substantially differentpacket sizes, per-flow scheduling techniques will be de-sirable.
3. The end-to-end performance for CBR flows worsens lin-early with increase in the depth of the network.
4. At low-levels of network utilization, the difference be-tween the end-to-end performance of CBR flows yieldedby FIFO and WF
6Q+ reduces.
5. The above results are mostly unaffected by the numberof other service classes that network may support.
References
[1] CSIM18 - The Simulation Engine. http://www.mesquite.com.
[2] J.C.R. Bennett and H. Zhang. Hierarchical Packet Fair Queue-ing Algorithms. IEEE/ACM Transactions on Networking,5(5):675–689, October 1997.
[3] A. Demers, S. Keshav, and S. Shenker. Analysis and Simu-lation of a Fair Queueing Algorithm. In Proceedings of ACMSIGCOMM, pages 1–12, September 1989.
[4] A. DeSimone. Generating Burstiness in Networks: A simula-tion Study of Correlation Effects in Networks of Queues. ACMComputer Communication Review, pages 24–31, 1991.
[5] P. Goyal and H.M. Vin. Generalized Guaranteed Rate Schedul-ing Algorithms: A Framework. IEEE/ACM Transactions onNetworking, 5(4):561–571, August 1997.
[6] M. Grossglauser and S. Keshav. On CBR Service. In Proceed-ings of INFOCOM’96, pages 129–137, March 1996.
[7] R. Gruenenfelder. A Correlation Based End-to-End CellQueueing Delay Characterization in an ATM Network. InProc. Thirteenth International Teletraffic Congress (ITC-13),volume 15, pages 59–64, June 1991.
[8] V. Jacobson, K. Nichols, and K. Poduri. An Expedited For-warding PHB. August 1998. available as IETF draft(draft-ietf-diffserv-phb-ef-00.txt).
[9] J. Kurose. Open Issues and Challenges in Providing Quality ofService Guarantees in High-Speed Networks. ACM ComputerCommunication Review, 23:6–15, January 1993.
[10] W. Matragi, C. Bisdikian, and K. Sohraby. Jitter Calculus inATM Networks: Multiple Node Case. IEEE INFOCOM ’94,June 1994.
[11] K. Nichols, S. Blake, F. Baker, and D. Black. Definition of theDifferentiated Services Field (DS Field) in the IPv4 and IPv6Headers. December 1998. Internet RFC 2474.
[12] K. Nichols, V. Jacobson, and L. Zhang. A Two-bit Differen-tiated Services Architecture for the Internet. November 1997.ftp://ftp.ee.lbl.gov/papers/dsarch.pdf.
[13] J.W. Roberts and J.T. Virtamo. The Superposition of PeriodicCell Arrival Streams in an ATM Multiplexer. IEEE Transac-tions on Communications, 39(2):298–303, February 1991.
[14] S. Shenker and C. Partridge. Specification of GuaranteedQuality of Service. Available via anonymous ftp fromftp://ftp.ietf.cnri.reston.va.us/internet-drafts/draft-ietf-intserv-guaranteed-svc-03.txt, November 1995.
[15] D. Yates, J.F. Kurose, D. Towsley, and M.G. Hluchyj. On per-session end-to-end delay distributions and the call admissionproblem for real-time applications with QOS requirements.In Proceedings of ACM SIGCOMM, pages 160–166, October1993.
[16] H. Zhang and S. Keshav. Comparison of Rate-Based ServiceDisciplines. In Proceedings of ACM SIGCOMM, pages 113–121, August 1991.