scholarly publication and collaboration in brazil: the role of geography
TRANSCRIPT

SCHOLARLY PUBLICATION AND COLLABORATION IN
BRAZIL: THE ROLE OF GEOGRAPHY
Otávio J. G. Sidone
Eduardo A. Haddad
Jesús P. Mena-Chalco
TD Nereus 01-2014
São Paulo
2014

1
Scholarly Publication and Collaboration in Brazil:
The Role of Geography
Otávio J. G. Sidone, Eduardo A. Haddad and Jesús P. Mena-Chalco
Abstract. Brazilian scholarly outputs have had rapid growth that was accompanied by an expansion of
domestic research collaboration. In this paper, we identify spatial patterns of research collaboration in
Brazil, as well as measure the role of geographical proximity in determining the interaction among
Brazilian researchers. Using a database comprised of over one million researchers and seven million
publications registered in the Brazilian Lattes Platform, we collect and consolidate information on inter-
regional research collaboration in terms of scientific co-authorship networks among 4,615 municipalities
over the period between 1992 and 2009, which enabled a range of data analysis unprecedented in
literature. The effects of geographical distance on collaboration are measured for different knowledge
areas under the estimation of spatial interaction models. The main results suggest strong evidence of
geographical deconcentration of collaboration in recent years with an increased participation of authors in
scientifically less traditional regions, such as South and Northeast Brazil. Additionally, the distance still is
significant in determining the intensity of knowledge flows in scientific collaboration networks in Brazil
since the increase of 100 kilometers between two researchers implies the average reduction on 16% of the
probability of collaboration and there is no evidence that its effect has diminished over time, although the
magnitude of such effects varies among networks of different knowledge areas.
1. Introduction
Recent efforts to develop new visualization techniques for spatial maps of scientific
networks among municipalities and research institutes to facilitate the geographic
localization of knowledge flows (Leydesdorff and Persson 2010) evidence the crescent
concern related to the role of geography in scientific activities. Spatial scientometric
analyses have the main purpose of studying the geographical disposition of knowledge
flows (among individuals, organizations, or geographic entities), i.e., of the linkages
among researchers in knowledge creation and diffusion processes (Frenken et al. 2009).
This approach is essential due to the unequal distribution of scientific activity among
countries and throughout their territory, which is usual evidence of localization patterns
characterized by spatial heterogeneity (Grosseti et al. 2013), although scientific
production has other determinant factors (Gantman 2012).
Understanding the relationships among researchers in the knowledge creation process,
especially by means of social relationship networks, has become a recurrent empirical
subject of research in scientometrics, because research collaboration has played a
significant role in fostering knowledge production in modern science, specifically due to
its capacity to promote the transfer of knowledge and skills and to decrease the time
spent and error occurrences (Royal Society 2011). In this context, research collaboration

2
has become a central element of science, technology, and innovation (STI) policies.
Research expenditures may result in different intensities of knowledge flows, depending
on the scientific network structures and integration level, and the articulation of
collaborative networks can exercise a decisive influence over research quality, visibility,
and productivity (Royal Society 2011; Ponds et al. 2007; Sahu and Panda 2014).
In a spatial perspective, the current literature is moving towards an explanation and
interpretation of geography on the interaction among researchers in scientific
collaboration networks. This is an important aspect, because interactions among
researchers are expected to be characterized by spatial localization, with the progress of
research activities usually needing face-to-face interactions through meetings and
discussions between the partners (Pan et al. 2012; Frenken et al. 2009). Nevertheless, a
small body of empirical research has aimed to examine the role of geography in the
inter-regional scientific collaboration networks in some specific places: United
Kingdom (Katz 1994), China (Liang and Zhu 2002; Scherngell and Hu 2011), Sweden
(Danell and Persson 2003), France (Okubo and Zitt 2004), Netherlands (Ponds et al.
2007), United States (Jones et al. 2008), Europe (Hoekman et al. 2010, 2013; Acosta et
al. 2011), Africa (Boshoff 2010), and worldwide (Pan et al. 2012). Such research has
also found evidence that geographical proximity plays an important role in determining
inter-regional collaboration, because such proximity favors relationships among
researchers.
There are practical reasons to incorporate the spatial dimension in scientific
collaboration networks. First, doing so may provide solid information for decisions
related to choosing partners in the academic community to optimize research impact and
visibility. Second, it may purposefully leverage the effects of public policies aimed at
encouraging inter-regional research projects and, thus, the improvement of research
quality (Pan et al. 2012).
The recent evolution of Brazilian science has gained international prominence. On the
one hand, despite its being still far from having the growth pattern of China, Brazil has
acquired an increasing relevance in the international scientific community, with
publication growth substantially above the world average. For instance, Brazil presented
the third highest average annual growth of scientific publication between 1996 and
3
2008. Intensification of this trend of growth took place between 2002 and 2008, when
the growth of Brazilian scholarly publications was approximately 110% (Glänzel et al.
2006; Cruz and Chaimovich 2010; Leta 2011; Royal Society 2011). On the other hand,
the increase of the collaborative profile in modern science occurs in all areas, with
approximately 70% of the currently produced articles worldwide being associated with
authors from different institutions. Among these articles, approximately 44% were
developed in collaborative work among researchers from different countries and about
56% of collaborations were among researchers located within their national territories.
This implies an increasing attention to co-authorship domesticity in China (Wang et al.
2005), Turkey (Gossart and Ozman 2009), Colombia (Buchelli et al. 2012), and Finland
(Puuska et al. 2014). Especially in the case of scientifically emerging countries, such as
China, Brazil, and India, the accelerated growth production is directly associated with
the intensification of domestic collaborative efforts (Royal Society 2011). Because the
size of their country allows some scale advantages related to the existence of specialized
research institutes, national researchers have more opportunities to collaborate with
local partners (Glänzel and Schubert 2005; Chinchilla-Rodríguez et al. 2010).
Beyond the necessities of stimulating spending in research and development (R&D) by
the private sector and promoting the internationalization of universities, one of the
biggest challenges faced by policies of STI in the Brazilian case consist in the necessity
to stimulate the diffusion of scientific excellence from research centers in the Southeast
to research centers in other less privileged regions (Cruz and Chaimovich 2010), as well
as to associate the growth of scientific activity with increasing quality (Helene and
Ribeiro 2011). These challenges could be faced more properly and efficiently by
perceptions that are inextricably linked to the establishment and operation of scientific
collaboration in Brazil. Research collaboration is the main mechanism for dissemination
of knowledge and is closely associated with a higher quality of scientific production.
The importance of geography in knowledge production, primarily its role in mediating
interactions among Brazilian researchers in scientific collaborations, is still an
unexplored topic in the literature. Understanding the functioning of scientific networks
may assist in formulating policies on STI in Brazil, because the functioning of these
networks plays an essential role in the development of incentives regarding the
geographical closeness between innovative firms and the main sources of knowledge

4
production. From this perspective, we analyze the spatial distribution of production
growth and scientific collaboration networks among Brazilian researchers localized in
4,616 municipalities for all areas of knowledge over the period 1992-2009.
Furthermore, we discuss the importance of geographical distance as an impediment
factor to the interactions among researchers in scientific collaboration networks. It is
worth noting that, to our knowledge, this is the first study related with spatial
scientometrics that treats an extremely large amount of data associated with more than
one million Brazilian researchers registered in the Lattes Platform. More specifically,
we aimed to verify some hypothesis about the spatial configuration of scientific
production and collaboration in Brazil:
Hypothesis 1 (H.1): The scientific production growth in Brazil was accompanied by a
geographical deconcentration process and by an expansion of spatial scientific
collaboration networks across the national territory.
Hypothesis 2 (H.2): Geographical proximity still plays an important role in
determining the relationships among Brazilian researchers, but its effect varies among
the networks of different knowledge areas.
Hypothesis 3 (H.3): The recent technological development in transportation and
communication media has implied the decrease of the effects of geographical distance
in Brazilian scientific collaboration networks over time.
Beyond this introduction, the paper begins with a detailed description of data collection
on Brazilian scientific collaboration (section 2). Then we present the main
characteristics of the spatial evolution of knowledge production and scientific
collaboration networks among Brazilian municipalities (section 3). The extent of the
role played by geographical distance in the spatial network configuration is evaluated by
means of a gravity model approach (sections 4 and 5). Finally, some of the main
conclusions are discussed (section 6).
2. Brazilian Scientific Collaboration Database
Among the mechanisms responsible for the articulation of social relationships in the
scientific community, co-authorship networks are particularly significant because they
are indicators of knowledge flows among researchers. However, such networks
5
represent only one facet of collaboration. The collaboration process does not necessarily
result in coauthored publications, due to the possible rejection of the work by the
technical reviewers, to time constraints, or to the cost of submission (Katz and Martin
1997; Hoekman et al. 2010).
Although data relating to accounting for co-authorship in publications are an imperfect
indicator, research on scientific collaboration networks typically use such data as a
quantitative measure of scientific collaboration (Wang et al. 2005). From the
perspective of spatial scientometrics, it becomes necessary to aggregate the co-
authorship among individuals into geographical units. Thus, it is possible to elaborate
inter-regional scientific collaborations, composed of the observed flow amounts among
regions (e.g., municipalities) and measured by counting co-authorship among
researchers located in these regions.
The main purpose of this section is to describe the source of information on scientific
collaboration (co-authorship), the definition of the spatial unit used, and the
characterization of data collecting and accounting procedures, data frequency, and their
main limitations.
Co-authorship data were extracted from some available information of the Lattes
curriculum vitae (CV), a part of the CNPq Lattes Platform, which consists of a Brazilian
information system, deployed and maintained by the Brazilian government to manage
information related to researchers, institutions, and research activities across the country
(CNPq 2012).1 The public availability of curriculum information and research groups
via the web and the utilization of such information by universities stimulate the correct
insertion and veracity of published data, which became the national standard system to
the registry of scientific community academic and professional activities. Therefore, the
establishment of a real incentive mechanism to fill and correctly update information
provided credibility and international recognition to the Lattes system, a successful
model to be internationally followed (Lane 2010).
1 The CV Lattes (CL) system consists of a comprehensive system of curriculum information of researchers, teachers,
students, and professionals from all knowledge areas, and has crucial importance in the planning, management, and
operation of federal funding agencies, the foundations of science support, universities, and research institutions,
mainly to provide reliable information for the analysis of researchers’ merit and competence, evaluation of
postgraduate programs, and analysis of claims for funding (CNPq 2012).

6
The CVs are publicly available on the Lattes platform web portal (CNPq 2012).
However, although access to individual information is immediate, access to a systematic
database is not possible. The effort in gathering information is the main obstacle to the
analysis of a large amount of data, thus making it necessary to automate this process. As
we shall see, the procedure described below enabled the processing of information from
1,131,912 CVs.2
For our purposes, a modified version of ScriptLattes was used to establish links among
researchers if there is a shared scientific production among them publicized in their
CVs. Basically, the procedure is based on a search of similarities from a direct
comparison between the titles of publications registered in the CVs.3 More precisely,
the co-authorship identification and counting were performed from information
contained in only four specific fields of the CV: papers published in journals, papers
published in annals of congresses, published books, and chapters of published books,
amounting to the analysis of 7,351,957 distinct academic material published between
1992 and 2009.
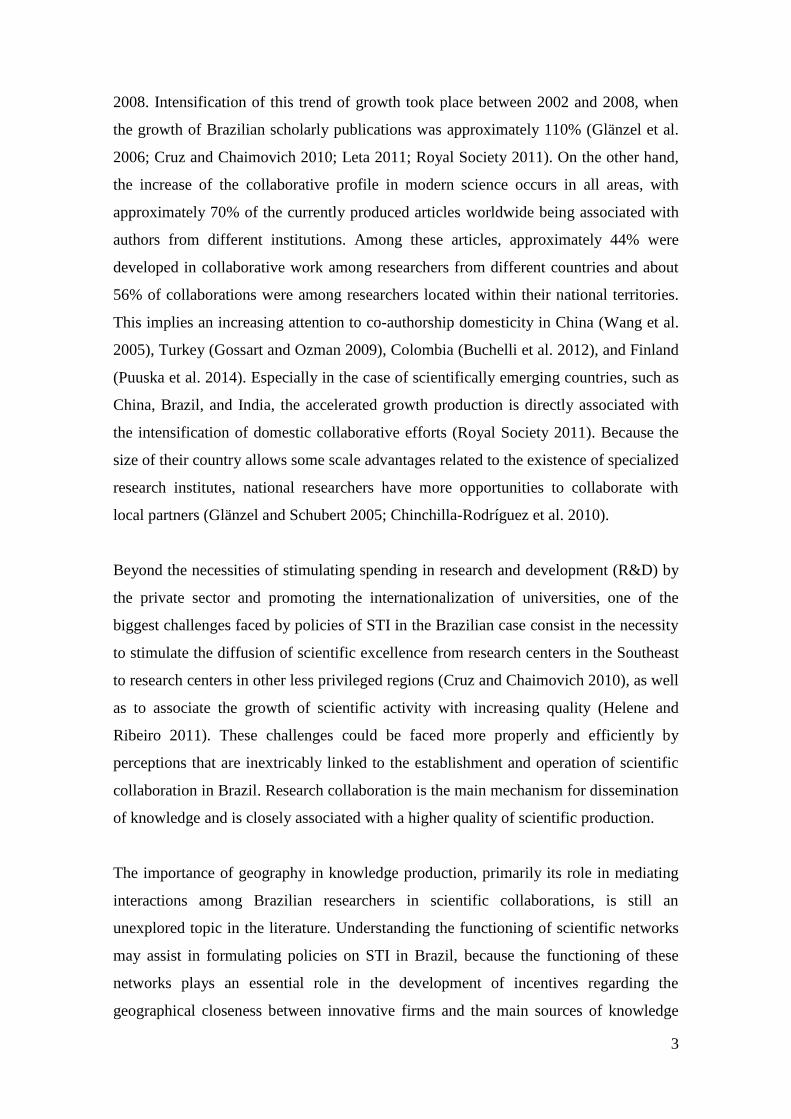
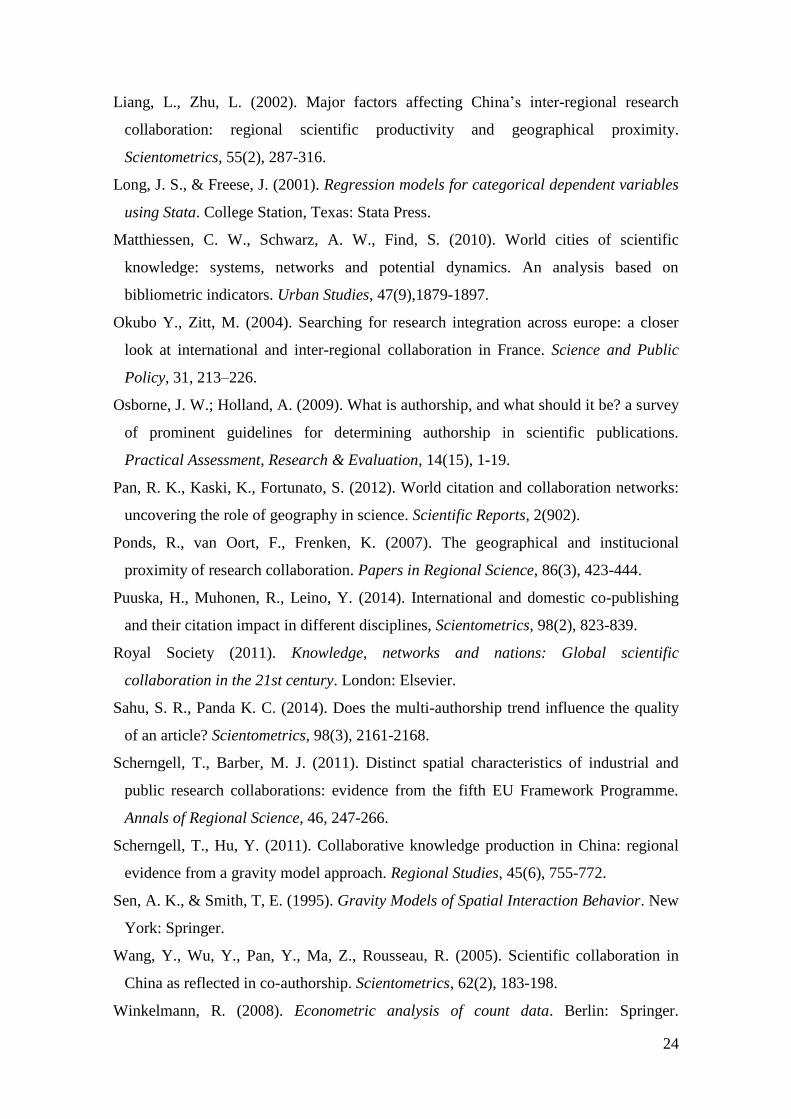
After co-authorship identification, the links among researchers were accounted by
means of the full-counting process, in which each unit of analysis (authors or regions)
receives one unit of collaboration for its participation in publications (Scherngell and
Barber 2011). For instance, for a publication among coauthors I, II, and III, located in
the regions A, A, and B, respectively, the value 1 is given to the pair (A, A) and the
value 2 to the pair (A, B). By symmetry, the pair (B, A) also receives the value 2 (see
Figure 1). Alternatively, the fractional counting method performs a weighted count so
that the values of the connections between the two regions are divided by the number of
connections between the researchers’ regions (the co-authorship credit is divided
proportionally among the coauthors). More common in citation analysis, this method
underestimates the effective impact of inter-regional collaboration, whereas the
complete count method overestimates this count. We chose the method of complete
count, which is usually utilized in empirical studies on scientific collaboration.
2 To achieve a large representation of the database, the CLs were tracked through their identification codes. The
complete procedure of data mining is described in Digiampietri et al. (2011). 3 In the social network analysis, each researcher is represented by a node, and the detection of co-authorship relations
among them is represented by a connection between nodes (edge).
7
<< Insert Figure 1 here >>
Determining the geographic location of researchers is important in spatial
scientometrics and thus deserves special mention.4 We consider the Brazilian
municipalities as our geographical unit of analysis. However, instead of locating the co-
authors from their addresses informed in the publications (or with the aid of
complementary databases), we used the direct information about the professional
addresses of researchers reported in each CV. Initially, a program for the extraction of
information about municipal location in the CVs was developed. However, the
autonomy given to users in filling the field "professional address" created difficulties,
because it revealed problems related to typos, regional abbreviations, and the erroneous
attribution of municipalities to their respective states. Thus, a standardization of the
municipalities’ names and the correct identification of their corresponding states was
required, by which means the relationships among the 4,615 Brazilian municipalities
were determined.5
To allow the differentiation of scientific collaboration patterns, the co-authorship was
identified for each major knowledge area: agricultural sciences (AGR), biological
sciences (BIO), exact and earth sciences (EXT), humanities (HUM), applied social
sciences (SOC), health sciences (SAU), engineering (ENG), and linguistics, letters, and
arts (LLA).6 The extraction of information allowed the association among researchers
and the major knowledge areas they declared. As shown in Table 1, about 76.7% of
identified researchers were associated with a particular area of knowledge.
<< Insert Table 1 here >>
4 The determination of the spatial unit has several methodological problems, since the scientific networks consist of
complex systems of interlacing and rupture of the formal frontiers, and it is hardly a coincidence between the
frontiers perceived by researchers and the official administrative boundaries of countries, states, or municipalities.
Nevertheless, the inherent arbitrariness in any classification makes usual the utilization of the official spatial units
(Frenken et al. 2009). 5 The examined CVs without any geographic localization information were associated to a fictitious municipality
named “undetermined”. 6 In cases of more than one declared knowledge area, we adopted the association between the researcher and all the
declared areas. Beyond the cited knowledge area there also exists another area named "Other" consisting of
knowledge areas not classified among the eight previous areas.
8
The association among the researcher, municipality, and knowledge area allowed the
development of inter-municipal co-authorship matrices: each cell (i, j) has the amount
of co-authorship among researchers from the municipalities i and j, respectively.
The information statement about the publication year (contained in the publication
complete titles) allowed the annual periodization of co-authorship matrices. Therefore,
we consolidated the co-authorship dataset consisting of 210 inter-municipal co-
authorship matrices (associated with the total and each particular area, and with the
years between 1992 and 2009) with a dimension of 4,615, composed of 10,651,420
elements.7 We noted that the CVs were associated with 4,615 municipalities, but 3,268
municipalities had no co-authored publications. The matrices could then be reduced to
the size of 1,347 elements.8
Some characteristics of the data used are worth noting, because they allowed an
overcoming of several problems typically arising from the literature. First, the
comprehensiveness of the sample used must be highlighted, in terms of both the number
of researchers and the extended data collection period, because the volume of data
analyzed is much higher than commonly examined.9
Second, spatial scientometrics deals with the problem that the collected information
about the addresses often refers to research institutes and is not related to authors. This
can lead to erroneous association in the case of publications with multiple addresses,
because the authors may have multiple affiliations or may have eventually moved to
other institutes (Frenken et al. 2009).10
Such problems are to a certain extent contoured,
because the geographical location was obtained from the address information reported
by the authors.
7 For each matrix, the symmetry implies that the total of distinct entries is given by:
. Thus, for n = 4615 we have 10,651,420 distinct entries. 8 For more recent years, it is possible that the accounting is underestimated, because it depends on the latest update of
CL. 9 Scherngell and Hu (2011) accounted 758,682 co-authorships in roughly half of Chinese researchers’ publications in
2007. Hoekman et al. (2010) accounted 524,155 co-authorships among European regions in 2007. 10
Researchers in a temporary visit may choose to register their institutes or the funding organizations instead of the
effective institute where the research is really conducted. Regarding the research institutes and firms, the
headquarters’ locations may be registered instead of the subsidiaries’ locations where the research was actually
executed.

9
Third, the quality of the source data for Brazilian science analysis is noteworthy, in so
far as the vast majority of scientometric studies make use of international databases,
which could lead to two main limitations in our particular case. First, these databases
have a particular bias for covering journals in English. Thus, its utilization requires the
assumption that the journals that are not indexed have only a local or domestic scope
and publish their research in the native language. Second, the scientific production
coverage in social sciences and humanities is quite low (Hoekman et al. 2010). This
situation is due mainly to the intrinsic characteristics of these areas. Their scientific
production occurs predominantly in the form of books and chapters in books, and the
translation to English is often unfeasible because of the difficulty of getting an accurate
translation of specific terms and expressions. Thus, these areas have a bias for
publication in the local language. Therefore, the utilization of international databases
does not allow a complete evaluation of the Brazilian scientific productivity, because in
developing countries the state-of-the-art knowledge is published and publicized by the
local journals, a large number of which do not have an international circulation.
Moreover, although English is the lingua franca of scientific research, the linguistic
universalization process still faces many obstacles, and Portuguese is a predominant
language in Brazilian journals, mainly in the applied social sciences and humanities
areas (Royal Society 2011).
In the face of these peculiarities, the procedure adopted here highlights the
comprehensive coverage of the Brazilian scientific publication enabled by the data
collection of CVs, since it has allowed co-authorship accounting in the articles
published in national circulation journals and scholarly publications under the form of
books and chapters in books chapters, resulting in a better evaluation of scientific
production in the social sciences and humanities areas. Among the limitations of the
procedure, our main restriction is the accounting of domestic co-authorship, i.e., it is not
possible to identify and count the collaborations among Brazilian and foreign
researchers. Thus, a publication produced together with foreign researchers is accounted
only when a collaboration among Brazilian researchers occurs simultaneously.
The inherent nature of the data also imposes some limitations. First, the utilization of
address information for the geographic location of researchers is based on the
assumption that the registers correspond to the effective location where the research was

10
carried out. Second, it is assumed that the observed geographical location is the
researchers’ true location throughout the analyzed period.11
Thus, the data collection
structure does not consider a researcher’s possible migration across the country.
However, these problems do not invalidate our database, because the problems pointed
out are, to some extent, contoured or reduced by the large sample size considered.
3. Geographic Patterns of Brazilian Scholarly Publication and Collaboration
Approximately 43.2% of the analyzed CVs did not have any information about
geographical location. However, such fact should be quantified more accurately by the
relative importance of these researchers in scientific activities, i.e., in terms of the
number of co-authorships.12
As shown in Table 2, the loss of information is not
negligible, but it does not involve a large loss with respect to the structural analysis of
the patterns of scientific production and collaboration.
<< Insert Table 2 here >>
The determination of spatial patterns of scientific activity has as a significant
characteristic the manner by which the product is allocated among the spatial units, a
process frequently permeated by many difficulties, because the association between a
publication and a specific location is not amenable to be determined by a direct and
unique way.13
In our work, we adopted the strategy of measuring co-authorship, instead
of measuring the total number of effective publications. For each publication co-
authored between two researchers from different municipalities, a unit for each
municipality involved was accounted, so that the total (two participations)
overestimated the actual publication (one publication). Thus, the parsed values do not
correspond to total effective publications, but to the absolute total number of
coauthoring in publications by researchers associated with each municipality. Although
11
For instance, the accounting of co-authorship among authors of a publication relating to 1996 is assigned to the
municipalities based on the information about the geographic location of the researchers extracted in 2011. 12
In Brazil, virtually all the people involved in scientific research, both active researchers and graduate students,
have a CL. Whereas the first are the most responsible for scientific publication, there are many cases of CL without
any information of bibliographic production, a typical situation in the case of graduate students who are just
beginning their studies. 13
The main problem in determining municipal scientific production is the existence of co-authorships among
researchers from different municipalities, as it is not possible to directly associate the publication with a single
municipality.

11
fractional accounting14
seems to be a more intuitive choice at first glance (as a result of
maintaining the total number of effective publications), there is consensus that the
ranking of the most productive regions does not depend on the accounting method
chosen and that the regional efforts in collaborative publications are underestimated by
using the fractional accounting method (Osborne and Holland 2009; Grossetti et al.
2013). To improve a spatial analysis of Brazilian scholarly publication (and not a
precise quantification of its evolution), we chose to consider the absolute participation
in publications as an indicator of the municipal scientific production, in so far as its
growth can be associated with an increase in the real production and correlated to an
increase of the collaborative profile.
Despite the inter-municipal co-authorship matrices built for each year between 1992 and
2009, six triennia were considered (according to the period used by CAPES in the
assessment of Brazilian scientific activities): I: 1992-1994; II: 1995-1997; III: 1998-
2000; IV: 2001-2003; V: 2004-2006; VI: 2007-2009. On the one hand, the
determination of the optimal time window in scientometric analysis is a subject of
debate in the literature, and the utilization of periods between two and five years is
predominant. On the other hand, the evaluation model of Brazilian scientific activities in
recent decades has been based on the determination of international standards to be
pursued by the researchers, which operates as a veritable incentive mechanism for them
(Leta 2011).15
Figure 2 shows the share of total scholarly publications and the growth rate for each of
major knowledge areas. Note that the relative contribution of each area to total
production showed no great transformations throughout the period. A rapid growth of
the total production over triennia occurred, but with the area growth rates approaching a
general trend of slowing down of the total production.
<< Insert Figure 2 here >>
14
In this method, the accounting is given by the relative contribution of each author in a particular publication, i.e., in
the case of co-authors from n municipalities is allocated the value (1/n) for every link among the involved
municipalities. 15
In the Brazilian case the choice of the triennial time window seems to be quite reasonable, because there are
incentives for researchers to try to finish their research efforts made in the determined triennium, transforming them
into publications until the end of the period to avoid the situation where the efforts are not valued until the next
assessment period.
12
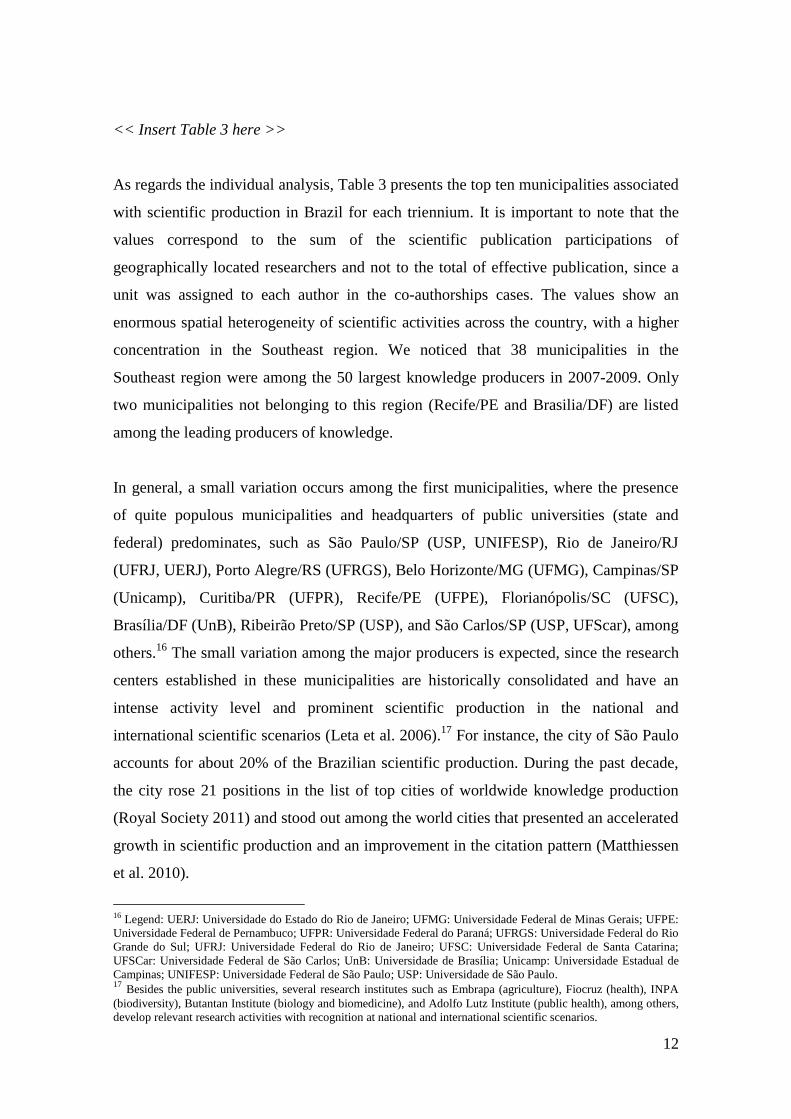
<< Insert Table 3 here >>
As regards the individual analysis, Table 3 presents the top ten municipalities associated
with scientific production in Brazil for each triennium. It is important to note that the
values correspond to the sum of the scientific publication participations of
geographically located researchers and not to the total of effective publication, since a
unit was assigned to each author in the co-authorships cases. The values show an
enormous spatial heterogeneity of scientific activities across the country, with a higher
concentration in the Southeast region. We noticed that 38 municipalities in the
Southeast region were among the 50 largest knowledge producers in 2007-2009. Only
two municipalities not belonging to this region (Recife/PE and Brasilia/DF) are listed
among the leading producers of knowledge.
In general, a small variation occurs among the first municipalities, where the presence
of quite populous municipalities and headquarters of public universities (state and
federal) predominates, such as São Paulo/SP (USP, UNIFESP), Rio de Janeiro/RJ
(UFRJ, UERJ), Porto Alegre/RS (UFRGS), Belo Horizonte/MG (UFMG), Campinas/SP
(Unicamp), Curitiba/PR (UFPR), Recife/PE (UFPE), Florianópolis/SC (UFSC),
Brasília/DF (UnB), Ribeirão Preto/SP (USP), and São Carlos/SP (USP, UFScar), among
others.16
The small variation among the major producers is expected, since the research
centers established in these municipalities are historically consolidated and have an
intense activity level and prominent scientific production in the national and
international scientific scenarios (Leta et al. 2006).17
For instance, the city of São Paulo
accounts for about 20% of the Brazilian scientific production. During the past decade,
the city rose 21 positions in the list of top cities of worldwide knowledge production
(Royal Society 2011) and stood out among the world cities that presented an accelerated
growth in scientific production and an improvement in the citation pattern (Matthiessen
et al. 2010).
16 Legend: UERJ: Universidade do Estado do Rio de Janeiro; UFMG: Universidade Federal de Minas Gerais; UFPE:
Universidade Federal de Pernambuco; UFPR: Universidade Federal do Paraná; UFRGS: Universidade Federal do Rio
Grande do Sul; UFRJ: Universidade Federal do Rio de Janeiro; UFSC: Universidade Federal de Santa Catarina;
UFSCar: Universidade Federal de São Carlos; UnB: Universidade de Brasília; Unicamp: Universidade Estadual de
Campinas; UNIFESP: Universidade Federal de São Paulo; USP: Universidade de São Paulo. 17
Besides the public universities, several research institutes such as Embrapa (agriculture), Fiocruz (health), INPA
(biodiversity), Butantan Institute (biology and biomedicine), and Adolfo Lutz Institute (public health), among others,
develop relevant research activities with recognition at national and international scientific scenarios.
13
The Brazilian spatial heterogeneity highlights the necessity for a geographical
decentralization process of scientific research activities across the country, because this
process may potentiate the regional development of less privileged areas and allows the
targeting of efforts for dealing with important local problems. In this context, it
becomes critical to understand how the growth in Brazilian scholarly publication
occurred in the geographical space.
Figure 3 presents the municipal scholarly publication in the 1992-1994 and 2007-2009
triennia. Observe that knowledge production is better spatially distributed in the second
period.18
For the 2007-2009 triennium, we presented the structure of existing public
university campuses (federal and state) in 2009, where there is a clear association
among their locations and municipal scholarly publication.19
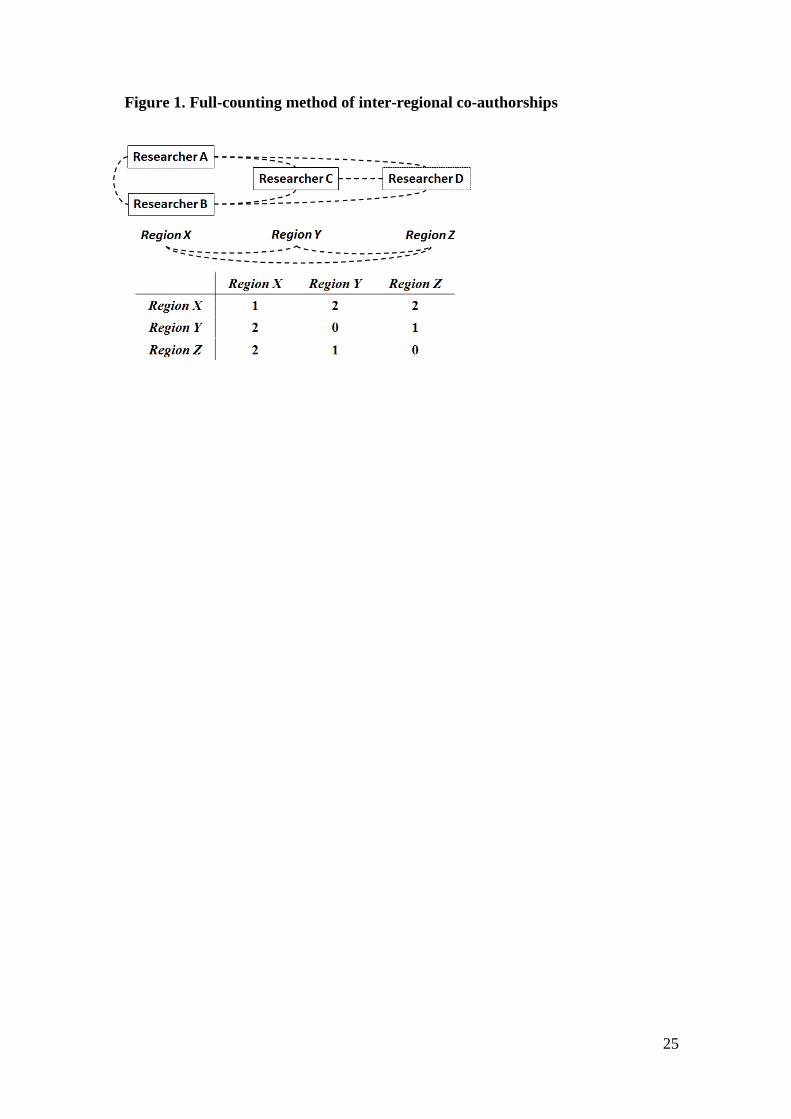
The finding of a systematic process of spatial deconcentration during the period is
confirmed by constructing the localization curves of publication for the 200 most
productive municipalities in each triennium (Figure 4). In 1992-1994, 90% of the
Brazilian publication was concentrated in only 48 municipalities, whereas this same
proportion was distributed in 102 municipalities in 2007-2009. Therefore, according to
our H.1, there is solid evidence of a spatial decentralization process conjoint with
Brazilian publication growth throughout the analyzed period, similar to the pattern
observed in other countries, such as Russia, France, Spain, and China, where the
development of their scientific production systems seems to follow a spatial
deconcentration trend, primarily based on the production growth of the secondary cities,
which are characterized by an intermediate level of scientific production (Grossetti et al.
2013).20
The spatial deconcentration process is common to all knowledge areas, but in
different intensities, as observed by the comparison between the localization curves in
Figure 5.
18
A high number of municipalities have passed from the low production range (11-100) in 1992-1994 to the
intermediate production range (101-10,000) in 2007-2009. 19
Although not shown, we find evidence for spatial deconcentration in the maps of all knowledge areas. 20
It is noteworthy that the observed process of spatial deconcentration of scientific activity is underestimated due to
the accounting of municipal production by means of participation in scientific publications. This method favors the
municipalities of greater production because these are involved in a systematic way in scientific collaboration
networks (Grossetti et al. 2013). We also note that the generalized process of spatial deconcentration occurred in all
knowledge areas until the 2004-2006 triennium, but in the next triennium (2007-2009) there was strong evidence of
the deconcentration process slowing down, even its reversion in the cases of agricultural sciences and biological
sciences.

14
<< Insert Figure 3 here >>
<< Insert Figure 4 here >>
<< Insert Figure 5 here >>
The analysis of the inter-regional co-authorship matrices reveals some general trends
regarding the evolution of the Brazilian scientific collaboration networks. First, there is
a strong upward trend in collaboration, in terms of both the total quantity of inter-
municipal and intra-municipal collaborations and their mean values. The amount of
scientific collaborations, measured by co-authorships, jumped from 547,249 in the
1992-1994 triennium to 9,445,399 in the 2007-2009 triennium (intra-municipal
collaborations increased from 317,810 to 1,037,274; inter-municipal collaborations
increased from 229,439 to 8,408,125). In this growth process, the acceleration period in
the 2001-2003 and 2004-2007 triennia stands out, being substantial evidence of the
primary relevance of domestic collaboration as an engine of the Brazilian publication
growth acceleration over time.
Table 4 presents the evolution of the main inter-municipal knowledge flows in Brazil,
where the highest observed link is the accounting of 76,716 collaborations among
researchers from Campinas/SP and São Paulo/SP in 2007-2009. In general, we observe
a systematic location of flows in the Southeast region (similar to the pattern found in the
spatial analyses of publication), with the main inter-municipal and intra-municipal links
given primarily among the Southeast state capitals and the State of São Paulo
municipalities that host traditional universities. Out of this context, there is an
intensification of intra-municipal collaboration in Recife/PE, Fortaleza/CE,
Goiânia/GO, Brasilia/DF, Viçosa/MG, and Santa Maria/RS, municipalities that also
host traditional public universities.
<< Insert Table 4 here >>
To facilitate the visualization of knowledge flows across the country, Figure 6 shows
maps with the 100 main knowledge flows from the agricultural sciences and health

15
sciences areas for the complete period (1992-2009). The figure highlights the difference
among the geographical patterns of collaboration for each major knowledge area.
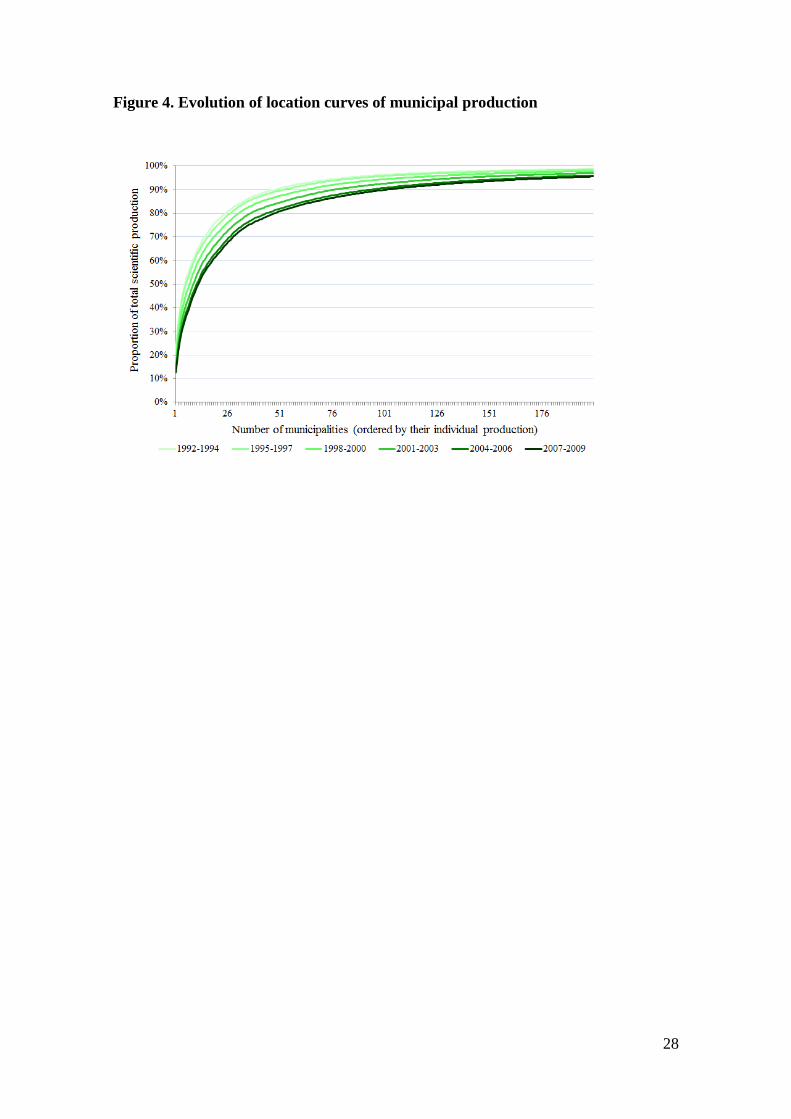
Finally, the analysis of the evolution of scientific collaboration networks global metrics
also allows some interesting results. Figure 7 shows the number of connected
municipalities (network size) and the municipality average degree (network integration)
in the scientific collaboration of each knowledge area. We observe both the expansion
of collaboration networks (with the incorporation of new municipalities to the networks)
and the strengthening of network relationships (growth of the municipality average
degree) over time, which corroborates totally our hypothesis H.1.
<< Insert Figure 6 here >>
<< Insert Figure 7 here >>
4. Spatial Interaction Modeling
The expansion of spatial scientific collaboration networks and the intensification of
their relationships motivate the interesting discussion about the role of geographical
distance in the determination of interactions among researchers along the national
territory.
An accurate evaluation of the effect of a particular proximity form, for instance,
geographic proximity, must be reached more accurately by means of a multivariate
framework due to the possibility of isolation and control of the other dimensions of
proximity effects.21
In this context, we model the spatial structure of scientific
collaboration flows by the spatial interaction model approach,22
a procedure commonly
and properly used in spatial scientometric studies.23
Basically, the spatial interaction
model of the gravity type is characterized by a formal distinction between three kinds of
21
The usual definition of the dimensions of proximity is presented in Boschma (2005). 22
The gravity models are fundamental in identifying the sources of regional disparities in phenomena arising from
human interactions, as these models allow the verification of the hypothesis that geographic distance is the main
responsible or if there are other determinants that explain the observed patterns of interaction. 23
The gravity models were used to explain the intensity of scientific collaborations among regions in the Netherlands
(Ponds et al. 2007), China (Wang et al. 2005; Scherngell and Hu 2011), and Europe (Hoekman et al. 2010).
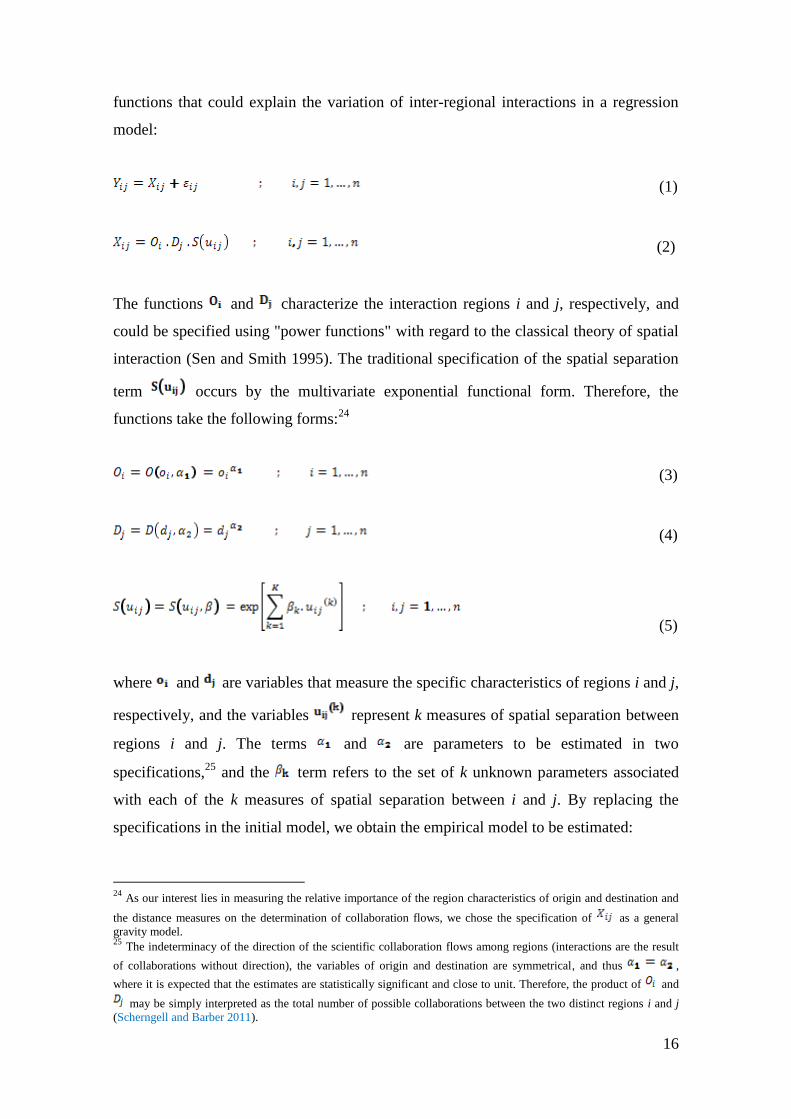
16
functions that could explain the variation of inter-regional interactions in a regression
model:
(1)
(2)
The functions and characterize the interaction regions i and j, respectively, and
could be specified using "power functions" with regard to the classical theory of spatial
interaction (Sen and Smith 1995). The traditional specification of the spatial separation
term occurs by the multivariate exponential functional form. Therefore, the
functions take the following forms:24
(3)
(4)
(5)
where and are variables that measure the specific characteristics of regions i and j,
respectively, and the variables represent k measures of spatial separation between
regions i and j. The terms and are parameters to be estimated in two
specifications,25
and the term refers to the set of k unknown parameters associated
with each of the k measures of spatial separation between i and j. By replacing the
specifications in the initial model, we obtain the empirical model to be estimated:
24
As our interest lies in measuring the relative importance of the region characteristics of origin and destination and
the distance measures on the determination of collaboration flows, we chose the specification of as a general
gravity model. 25
The indeterminacy of the direction of the scientific collaboration flows among regions (interactions are the result
of collaborations without direction), the variables of origin and destination are symmetrical, and thus ,
where it is expected that the estimates are statistically significant and close to unit. Therefore, the product of and
may be simply interpreted as the total number of possible collaborations between the two distinct regions i and j
(Scherngell and Barber 2011).

17
(6)
It is significant to notice the nature of co-authorship data, characterized by integers and
non-negative values, because it makes inappropriate the typical application of a log-
normal specification over the model equation (6) and the subsequent parameter
estimation using the traditional ordinary least squares (OLS) method (Long and Freese
2001).26
However, the deficiencies of the log-normal specification and the strong
assumptions required for an OLS application could be contoured by interpreting the
model as a count data model and assuming that the data generation process produces
only integers and non-negative numbers. From this, it is usual to assume that the
amount of collaborations follows a Poisson distribution, given by the following
expression:27
(7)
where represents the set of dependent variables in the empirical model (6):
(8)
The Poisson distribution function has the statistical property of equidispersion defined
by the equality among the conditionals mean and variance.28
If this hypothesis is not
rejected by the observed data, it is possible to assume that such data are generated from
a Poisson process, and the specified model could be consistently estimated by the
standard maximum likelihood method. Nevertheless, the counting of regional scientific
collaborations may deviate from a standard Poisson data generation, because the
26
Besides the inadequacy of the OLS method, the biggest problem with the previously described procedure is the fact
that the data-generating process is too far from the assumption that the count of co-authorships is generated from a
log-normal distribution around its mean and with a constant variance (Hoekman et al. 2010). 27
In general, the family of Poisson models solves the technical shortcomings of OLS, explicitly recognizes the nature
of integers and non-negative numbers of the dependent variable, and allows the maximum likelihood estimates of the
parameters to be interpreted as elasticities (Winkelmann 2008).
28

18
distribution of these values commonly does not satisfy the equidispersion property,29
a
situation typically occasioned by the problem of unobserved heterogeneity once the
specified independent variables are not completely able to capture the data
heterogeneity by the conditional mean function. The overdispersion leads to biased
estimates of the parameters and the invalidity of the usual hypothesis tests because the
standard errors are underestimated (Winkelmann 2008; Hilbe 2011).
In this context, a typical alternative of empirical studies on scientific collaboration is the
use of a negative binomial model (Hoekman et al. 2010; Scherngell and Barber 2011;
Scherngell and Hu 2011), which is able to deal with unobserved heterogeneity by the
inclusion of an additional parameter (parameter of heterogeneity) that allows the
accommodation of overdispersion on observed data. The expressions of the density of
negative binomial distribution and the conditional variance are as follows:30
(10)
(11)
where Γ (⋅) is the gamma function, and α is the parameter of heterogeneity.31
The Poisson model has a particular specification of the negative binomial model
concerning the state in which the heterogeneity parameter is equal to zero. Thereby the
verification of statistical significance of the parameter heterogeneity estimate
(estimated from the binomial model negative) allows the decision between the two
models (Long and Freese 2001).
29
Unlike other parametric distributions, the disruption of the equidispersion hypothesis is sufficient for violation of
the hypothesis of a Poisson data-generating process. Thus, the verification of the presence of overdispersion
(conditional variance greater than the conditional mean) is usual in empirical analyses on the appropriate choice of
model (Winkelmann 2008; Hilbe 2011). 30
The expression presented refers to Negbin II specification (Winkelmann 2008, p. 134), which is the most
frequently used in empirical research (Hilbe 2011). 31
Note that a more general form of heterogeneity is allowed (alternative to equality between the mean and
conditional variances imposed by the Poisson distribution). Thus, the main element in the specification decision
between the two models is the evaluation of presence of unobserved heterogeneity (Winkelmann 2008).

19
Another problem of specification refers to the excessive number of zeros in the
observed data, which may appear as an additional source of unobserved heterogeneity,
in so far as the occurrence of zero values could be quite superior to that accommodated
by the Poisson and negative binomial models. However, the utilization of the zero-
inflated Poisson model (ZIP) and the zero-inflated negative binomial (ZINB) model
allows correction of this problem by a structure of the conditional mean that
differentiates the zero and positive values (Hilbe 2011).
5. Results
The variables of origin ( ) and destination ( ), described in equation 6, were
measured by the total scientific publications in each municipality. It is expected that the
total of collaborations among researchers of municipalities i and j ( ) positively
depends on the total publications in each municipality, because the higher scientific
production of a municipality must imply a larger probability of collaboration.
Regarding the separation variables, two measures were used. First, we constructed a
matrix of geographical distance measured by a continuous manner where each element
has the calculation of the distance in kilometers (km) between two municipalities
i and j.32
Distance is expected to play an impediment role in the interactions among
researchers, but it is possible that its effect has decreased over time due to the recent
process of communication facilitation. Furthermore, a second separation variable was
introduced with the purpose of measuring the institutional relationship among the
municipalities. Based on the assignment of the value to the municipalities i
and j when both have public university campuses (and zero otherwise), we constructed a
matrix that represents the institutional distance among the municipalities.33
Therefore,
the fact that two municipalities possess public universities is expected to increase the
probability of scientific collaboration among researchers in these municipalities.
32
Due to the absence of consolidated data on the distances between the Brazilian municipalities, we opted to measure
the shortest distance between them by applying the geodesic distance formula to the data latitude and longitude of the
municipality centroids. The intra-municipal distances (the diagonal terms of the distance matrix) were
calculated as a function of the municipality area i ( ), using the formula of Bröcker (1989):
33
The matrix of institutional distance for each triennium results from identification of Brazilian municipalities with
public (state or federal) universities campuses in the first year of each triennium analyzed.

20
A reduced sample of 105 municipalities was utilized for the estimation of the Poisson,
negative binomial, ZIP, and ZINB models (corresponding to the set of municipalities
related to 77.4% and 87.6% of collaboration and production totals, respectively, in
2007-2009), because the complete matrix of collaborations with 1,347 municipalities
presented 97.8% as zero values, an amount as elevated that it would invalidate the
estimates. Therefore, the observation of flow collaboration among 105 counties totaled
11,025 observations. Table 5 shows the estimates of the models. As expected, the
estimates of the mass terms (origin and destination) are statistically significant and close
to 1 for all triennia, an indication of the adequate specification of these models. A
statistically significant and positive sign of estimates related to the institutional distance
over the triennia is also observed. This result was expected and sustains the fact that two
municipalities having public universities increases the probability of scientific
collaboration among researchers in these municipalities.
Although the presented results are significant, our main interest lies in estimating the
effect of geographic distance on the probability of collaboration. It is observed in Table
5 that these estimates are statistically significant and with a negative sign for all selected
triennia, which corroborates the hypothesis that increasing the distance between two
researchers reduces the probability of collaboration between them (H.2). Nevertheless,
the interpretation of the estimates in count models (non-linear) is not as immediate as in
the classical linear regression model. Thus, the value found in 2007-2009 (-0.0017769)
means that an increase in 100 kilometers (km) of distance between two researchers
reduces the probability of collaboration by 16.3% on average. As the effect is not linear,
an increase in 300 (600) km of distance reduces the probability of collaboration by
41.3% (65.6%) on average.34
However, the expected hypothesis (H.3) that the effect of
geographical distance would have diminished over time has not been corroborated by
the results. We obtained cogent evidence that geographical distance still plays a decisive
role in the articulation of Brazilian scientific collaboration networks, similar to the
result found in Hoekman et al. (2010) for Europe.
34
The effect on the dependent variable from an increase in the count explanatory variable, in percentage terms
(keeping constant the other variables), is calculated from the following expression (Long and Freese 2001):

21
Finally, we observe in Figure 8 that the effect of geographic distance on the probability
of collaboration is not proportional to the distance in a linear manner. It varies
considerably among the scientific collaboration networks of different knowledge areas.
For instance, the distancing of 400 km between two researchers reduces by 40% the
probability of collaboration if they work in the linguistics, letters, and arts area, whereas
the impact reaches 65% in the case of agricultural sciences or exact and earth sciences.
According to the figure, distancing two researchers at 100 km causes a 16% reduction
on average of the probability of collaboration. The distancing from 400 km reduces by
almost half (50%) the probability of collaboration. It is also interesting to note that total
proximity (null geographic distance) is associated with verification of 100% probability
of collaboration, i.e., the null distance has no impact on the probability of collaboration.
It is worth noting, however, that the model excludes this situation, because it always
admit some geographical distance between two researchers, even though both are within
a single municipality.
<< Insert Table 5 here >>
<< Insert Figure 8 here >>
6. Final remarks
Understanding the spatial patterns of Brazilian scholarly publication and scientific
collaboration over six triennia (1992-2009) revealed some important issues. First, we
see a swift growth of both production and scientific collaboration in all knowledge
areas, but with evidence of slowing down. Second, the geography of production and
scientific collaboration across the country is characterized by an intense spatial
heterogeneity. There is a systematic concentration of scientific production and
knowledge flows in the Southeast and South regions, with prominence of state capitals
municipalities. Nevertheless, we found strong evidence of geographical deconcentration
associated with the growth process of scientific production.
Considering the role played by geographic distance in articulating scientific
collaboration networks, the results highlight its importance in the interaction among the
Brazilian researchers; an increase of 100 kilometers between two researchers implies an
22
average reduction of 16% on the probability of collaboration. Finally, we found that the
effect of distance varies among the networks of the different major knowledge areas,
and there is no evidence that its effect has diminished over time.
References
Acosta, M., Coronado, D., Ferrándiz, E., León, M. D. (2011). Factors affecting inter-
regional academic scientific collaboration within Europe: the role of economic
distance. Scientometrics, 87(1), 63-74.
Boschma, R. (2005). Proximity and innovation: a critical assessment. Regional Studies,
39(1), 61-74.
Boshoff, N. (2010). South–South research collaboration of countries in the Southern
African Development Community (SADC). Scientometrics, 84(2), 481-503.
Bröcker, J. (1989). Partial Equilibrium Theory of Interregional Trade and the Gravity
Model. Papers in Regional Science, 66(1), 7-18.
Buchelli V. Díaz, A., Calderón, J. P., Lemoine, P., Valdivia, J. A., Villaveces, J. L.,
Zarama, R. (2012). Growth of scientific production in Colombian universities: an
intelectual capital-based approach. Scientometrics, 91(2), 369-382.
Chinchilla-Rodríguez, Z., Vargas-Quesada, B., Hassan-Montero, Y., González-Molina,
A., Moya-Anegón, F. (2010). New approach to the visualization of international
scientific collaboration. Information Visualization, 9(4), 277–287.
CNPq Plataforma Lattes. (2012). http://www.lattes.cnpq.br/. Accessed 25 October 2012.
Cruz, C. H. B., & Chaimovich, H. B. (2010). Brazil In: S. Schneegans (Ed.), UNESCO
Science Report 2010—The Current Status of Science around the World (pp. 103–121).
UNESCO.
Danell, R., Persson, O. (2003). Regional R&D activities and interactions in the Swedish
Triple Helix. Scientometrics, 58(2), 203-218.
Digiampietri, L. A., Mena-Chálco, J., Pérez-Alcázar, J. J., Tuesta, E. F., Delgado, K. V.,
Mugnani, R., Silva, G. S. (2012). Minerando e caracterizando dados de currículos
lattes, 2011. In: Brazilian Workshop on Social Network Analysis and Mining
(BraSNAM), Curitiba (pp.1-12).
Frenken, K., Hardeman, S., Hoekman, J. (2009). Spatial scientometrics: towards a
cumulative research program. Journal of Informetrics, 3, 222-232.

23
Gantman, E. R. (2012). Economic, linguistic, and political factors in the scientific
productivity of countries. Scientometrics, 93(1), 967-985.
Glänzel, W., Leta, J., Thijs, B. (2006). Science in Brazil. Part 1: A macro-level
comparative study. Scientometrics, 67(1), 67-86.
Glänzel, W., Schubert, A. (2005). Analyzing scientific networks through co-autorship.
In: Moed, H. F., Glänzel, W., Schmoch, U. (Eds.), Handbook of Quantitative Science
and Technology Research (pp.257-276). New York: Springer.
Gossart, C., Ozman, M. (2009). Co-authorship networks in social sciences: The case of
Turkey. Scientometrics, 78(2), 67-86.
Grosseti, M., Eckert, D., Gingras, Y., Jégou, L., Larivière, V., Milard, B. (2013). Cities
and the geographical deconcentration of scientific activity: A multilevel analysis of
publications (1987-2007). Urban Studies, 0(0) 1-16.
Helene, A. F., Ribeiro, P. L. (2011). Brazilian scientific production, financial support,
established investigators and doctoral graduates. Scientometrics, 89, 677-686.
Hilbe, J. M. (2011). Negative Binomial Regression. Cambridge: Cambridge University
Press.
Hoekman, J., Scherngell, T., Frenken, K., Tijssen, R. (2012). Acquisition of European
research funds and its effect on international scientific collaboration. Journal of
Economic Geography, 13(1), 23-52.
Hoekman, J., Frenken, K., Tijssen, R. (2010). Research collaboration at a distance:
changing spatial patterns of scientific collaboration within Europe. Research Policy,
39(5), 662-673.
Jones, B. F., Wuchty, S., Uzzi, B. (2008). Multi-University Research Teams: Shifting
Impact, Geography, and Stratification in Science. Science, 322, 1259-1262.
Katz, J. S., Martin, B. R. (1997). What is research collaboration? Research Policy, 26,
1-18.
Lane, J. (2010). Let’s make science metrics more scientific. Nature, 454(25), 488-489.
Leta, J. (2011). Indicadores de desempenho, ciência brasileira e a cobertura das bases
informacionais. Revista USP, 89,72-77.
Leta, J., Glänzel, W., Thijs, B. (2006). Science in Brazil. Part 2: Sectoral and
institucional research profiles. Scientometrics, 67(1), 87-105.
Leydesdorff, L., Persson, O. (2012). Mapping the geography of science: distribution
patterns and networks of relations among cities and institutes. Journal of the American
Society for Information Science and Technology, 61(8), 1622-1634.
24
Liang, L., Zhu, L. (2002). Major factors affecting China’s inter-regional research
collaboration: regional scientific productivity and geographical proximity.
Scientometrics, 55(2), 287-316.
Long, J. S., & Freese, J. (2001). Regression models for categorical dependent variables
using Stata. College Station, Texas: Stata Press.
Matthiessen, C. W., Schwarz, A. W., Find, S. (2010). World cities of scientific
knowledge: systems, networks and potential dynamics. An analysis based on
bibliometric indicators. Urban Studies, 47(9),1879-1897.
Okubo Y., Zitt, M. (2004). Searching for research integration across europe: a closer
look at international and inter-regional collaboration in France. Science and Public
Policy, 31, 213–226.
Osborne, J. W.; Holland, A. (2009). What is authorship, and what should it be? a survey
of prominent guidelines for determining authorship in scientific publications.
Practical Assessment, Research & Evaluation, 14(15), 1-19.
Pan, R. K., Kaski, K., Fortunato, S. (2012). World citation and collaboration networks:
uncovering the role of geography in science. Scientific Reports, 2(902).
Ponds, R., van Oort, F., Frenken, K. (2007). The geographical and institucional
proximity of research collaboration. Papers in Regional Science, 86(3), 423-444.
Puuska, H., Muhonen, R., Leino, Y. (2014). International and domestic co-publishing
and their citation impact in different disciplines, Scientometrics, 98(2), 823-839.
Royal Society (2011). Knowledge, networks and nations: Global scientific
collaboration in the 21st century. London: Elsevier.
Sahu, S. R., Panda K. C. (2014). Does the multi-authorship trend influence the quality
of an article? Scientometrics, 98(3), 2161-2168.
Scherngell, T., Barber, M. J. (2011). Distinct spatial characteristics of industrial and
public research collaborations: evidence from the fifth EU Framework Programme.
Annals of Regional Science, 46, 247-266.
Scherngell, T., Hu, Y. (2011). Collaborative knowledge production in China: regional
evidence from a gravity model approach. Regional Studies, 45(6), 755-772.
Sen, A. K., & Smith, T, E. (1995). Gravity Models of Spatial Interaction Behavior. New
York: Springer.
Wang, Y., Wu, Y., Pan, Y., Ma, Z., Rousseau, R. (2005). Scientific collaboration in
China as reflected in co-authorship. Scientometrics, 62(2), 183-198.
Winkelmann, R. (2008). Econometric analysis of count data. Berlin: Springer.
25
Figure 1. Full-counting method of inter-regional co-authorships

26
Figure 2. Participation and growth rates of scholarly publications of knowledge
areas
Triennia: I: 1992-1994; II: 1995-1997; III: 1998-2000; IV: 2001-2003; V: 2004-2006; VI: 2007-2009

27
Figure 3. Municipal scholarly publication in Brazil in selected triennia
1992-1994
2007-2009
28
Figure 4. Evolution of location curves of municipal production

29
Figure 5. Evolution of location curves of municipal production, by major
knowledge area

30
Figure 6. Main scientific collaboration flows in agricultural sciences and health
sciences: 1992-2009
Agricultural sciences Health Sciences
31
Figure 7. Evolution of the number of municipalities and average degree in
scientific collaboration networks

32
Figure 8. Effect of geographic distance on the probability of scientific collaboration
in 2007-2009
Pro
bab
ilit
yo
fS
cien
tifi
cC
oll
aab
ora
tio
n
Geographic Distance (in Km)

33
Table 1. Number of researchers associated to each major area of knowledge
Total of researchers Researchers associated to a single
major area
AGR 92,927 59,484 (64.0%) BIO 128,104 65,593 (51.2%) ENG 120,993 70,075 (57.9%) EXT 176,114 102,372 (58.1%) HUM 270,149 141,376 (54.2%) LLA 99,129 53,151 (53.6%) SAL 272,783 206,772 (75.8%) SOC 264,230 164,037 (62.1%) Total 1,131,912 868,250 (76.7%)

34
Table 2. Percentage of production and collaboration without municipal location
1992-1994 1995-1997 1998-2000 2001-2003 2004-2006 2007-2009
Production 7.1% 7.0% 7.0% 7.9% 9.2% 10.6%
Collaboration 8.1% 8.0% 8.8% 10.2% 11.9% 13.5%

35
Table 3. Evolution of top municipalities associated to scholarly publication in
Brazil, by all major knowledge areas
Total Total Total
1992-1994 1995-1997 1998-2000
São Paulo/SP 71,013 São Paulo/SP 112,539 São Paulo/SP 161,991
Rio de Janeiro/RJ 37,100 Rio de Janeiro/RJ 64,109 Rio de Janeiro/RJ 102,309 Campinas/SP 20,045 Porto Alegre/RS 32,944 Porto Alegre/RS 52,446
Porto Alegre/RS 18,228 Campinas/SP 31,283 Campinas/SP 47,949
Belo Horizonte/MG 14,420 Belo Horizonte/MG 25,432 Belo Horizonte/MG 44,633 Ribeirão Preto/SP 10,388 São Carlos/SP 18,501 São Carlos/SP 28,430
São Carlos/SP 9,034 Florianópolis/SC 15,077 Brasília/DF 25,925 Brasília/DF 8,540 Brasília/DF 15,054 Florianópolis/SC 25,713
Recife/PE 7,583 Ribeirão Preto/SP 14,925 Recife/PE 24,500
Florianópolis/SC 7,334 Recife/PE 14,035 Curitiba/PR 24,253
2001-2003 2004-2006 2007-2009
São Paulo/SP 226,688 São Paulo/SP 313,910 São Paulo/SP 352,541
Rio de Janeiro/RJ 146,139 Rio de Janeiro/RJ 193,348 Rio de Janeiro/RJ 215,550
Porto Alegre/RS 82,101 Porto Alegre/RS 115,614 Porto Alegre/RS 132,622 Belo Horizonte/MG 64,294 Campinas/SP 90,575 Belo Horizonte/MG 113,487
Campinas/SP 64,194 Belo Horizonte/MG 89,293 Campinas/SP 95,089 Brasília/DF 43,711 Curitiba/PR 61,462 Curitiba/PR 75,125
Curitiba/PR 41,102 Brasília/DF 61,003 Recife/PE 72,119 São Carlos/SP 40,628 Recife/PE 56,519 Florianópolis/SC 70,322
Recife/PE 38,781 São Carlos/SP 56,372 Brasília/DF 65,963
Florianópolis/SC 37,763 Florianópolis/SC 54,094 Ribeirão Preto/SP 65,252

36
Table 4. Top inter-municipal scientific collaboration links in Brazil
1992-1994 1995-1997
Campinas/SP – São Paulo/SP 5,682 Campinas/SP – São Paulo/SP 9,890
Rio de Janeiro/RJ – São Paulo/SP 3,883 Rio de Janeiro/RJ – São Paulo/SP 9,500 Niterói/RJ – Rio de Janeiro/RJ 3,793 Niterói/RJ – Rio de Janeiro/RJ 7,199
Ribeirão Preto/SP – São Paulo/SP 2,607 Porto Alegre/RS – São Paulo/SP 4,682
Florianópolis/SC – São Paulo/SP 2,107 Ribeirão Preto/SP – São Paulo/SP 4,097 Araraquara/SP – São Paulo/SP 1,971 Belo Horizonte/MG – São Paulo/SP 4,085
Belo Horizonte/MG – São Paulo/SP 1,765 São Carlos/SP – São Paulo/SP 3,984 Porto Alegre/RS – São Paulo/SP 1,597 Curitiba/PR – São Paulo/SP 3,738
Botucatu/SP – São Paulo/SP 1,457 S, J, dos Campos/SP – São Paulo/SP 3,643
1998-2000 2001-2003
Ribeirão Preto/SP – São Paulo/SP 40,727 Ribeirão Preto/SP – São Paulo/SP 48,657 Campinas/SP – São Paulo/SP 30,672 Campinas/SP – São Paulo/SP 41,538
Botucatu/SP – São Paulo/SP 22,587 Goiânia/GO – Brasília/DF 37,518
Rio de Janeiro/RJ – São Paulo/SP 15,839 Rio de Janeiro/RJ – São Paulo/SP 36,168 Piracicaba/SP – São Paulo/SP 14,249 Niterói/RJ – Rio de Janeiro/RJ 26,363
Niterói/RJ – Rio de Janeiro/RJ 12,563 São Carlos/SP – São Paulo/SP 22,649 Porto Alegre/RS – São Paulo/SP 10,139 Botucatu/SP – São Paulo/SP 20,108
São Carlos/SP – São Paulo/SP 9,532 Santa Maria/RS – Porto Alegre/RS 17,987 Belo Horizonte/MG – São Paulo/SP 9,173 Porto Alegre/RS – São Paulo/SP 17,057
2004-2006 2007-2009
Campinas/SP – São Paulo/SP 72,698 Campinas/SP – São Paulo/SP 76,716 Ribeirão Preto/SP – São Paulo/SP 72,375 Ribeirão Preto/SP – São Paulo/SP 74,078 Rio de Janeiro/RJ – São Paulo/SP 56,346 Niterói/RJ – Rio de Janeiro/RJ 75,224 Niterói/RJ – Rio de Janeiro/RJ 41,536 Rio de Janeiro/RJ – São Paulo/SP 72,500
Goiânia/GO – Brasília/DF 35,948 Seropédica/RJ – Rio de Janeiro/RJ 65,348 Porto Alegre/RS – São Paulo/SP 33,655 Porto Alegre/RS – São Paulo/SP 47,343 Botucatu/SP – São Paulo/SP 31,152 Santa Maria/RS – Porto Alegre/RS 39,252 Santa Maria/RS – Porto Alegre/RS 30,151 Santo André/SP – São Paulo/SP 35,694 São Carlos/SP – São Paulo/SP 26,444 Curitiba/PR – São Paulo/SP 32,692

37
Table 5. Estimates of Poisson, Negative Binomial, ZIP and ZINB, by major
knowledge areas
1992-1994 1995-1997 1998-2000 2001-2003 2004-2006 2007-2009
Po
isso
n
Origin – Destination ( ) 0.82127*** 0.77950*** 0.82201*** 0.78581*** 0.79731*** 0.78859***
(0.07994) (0.06784) (0.06838) (0.0579629) (0.0544) (0.05789)
Geographic Distance ( ) -0.00195*** -0.00192*** -0.00174*** -0.00153*** -0.00154*** -0.00177***
(0.0003065) (0.00025) (0.00020) (0.00016) (0.00015) (0.00017)
Institucional Distance ( ) 0.36443*** 0.41621*** 0.16094*** 0.31369*** 0.29401*** 0.42871***
(0.1769) (0.14363) (0.12549) (0.10611) (0.10686) (0.11636)
Constant ( ) -7.8571*** -7.2514*** -7.8745*** -7.3404*** -7.5977*** -7.3564***
(1.3045) (1.1495) (1.2150) (1.0601) (1.0349) (1.1167)
Neg
ati
ve B
ino
mia
l
Origin – Destination ( ) 0.85214*** 0.81110*** 0.74925*** 0.72744*** 0.73588*** 0.64376***
(0.02546) (0.02155) (0.02520) (0.02193) (0.02193) (0.2798)
Geographic Distance ( ) -0.00080*** -0.00086*** -0.00077*** -0.00077*** -0.00083*** -0.00088***
(0.00006) (0.00004) (0.00003) (0.00001) (0.0004) (0.0003)
Institucional Distance ( ) 0.20469*** 0.1340*** 0.25959*** 0.18238*** 0.07382*** 0.20527***
(0.09759) (0.07653) (0.06870) (0.06341) (0.05982) (0.05890)
Constant ( ) -8.8486*** -8.2565*** -7.2966*** -6.7090*** -6.8110*** -5.0248***
(0.25238) (0.24356) (0.3405) (0.27935) (0.31460) (0.45363)
Heterogeneity ( ) 6.082* 5.0892* 4.5624* 3.8480* 3.6189* 3.7508*
(0.19144) (0.1167) (0.09137) (0.06647) (0.06441) (0.06666)
ZIP
Origin – Destination ( ) 0.78074*** 0.75185*** 0.80186*** 0.76963*** 0.7812*** 0.77849***
(0.00092) (0.0006) (0.00041) (0.00030) (0.00023) (0.00020)
Geographic Distance ( ) -0.0019*** -0.00188*** -0.00172*** -0.00152*** -0.00153*** -0.00176***
(4.00. ) (2.59. ) (1.51. ) (9.39. ) (7.19. ) (6.51. )
Institucional Distance ( ) 0.35437*** 0.39968*** 0.15269*** 0.30125*** 0.28582*** 0.41281***
(0.00334) (0.00231) (0.00139) (0.00100) (0.00359) (0.00064)
Constant ( ) -7.0511*** -6.0088*** -7.4462*** -6.9826*** -7.300*** -7.1203***
(0.01261) (0.0088) (0.00612) (0.00449) (0.00359) (0.00315)
Vuong (ZIP x Poisson) 17.29*** 17.07*** 20.38*** 20.45*** 22.92*** 23.29***
ZIN
B
Origin – Destination ( ) 0.53245*** 0.56452*** 0.57718*** 0.59961*** 0.62453*** 0.56556***
(0.1361) (0.01171) (0.01119) (0.01128) (0.01146) (0.01171)
Geographic Distance ( ) -0.00068*** -0.00075*** -0.00071*** -0.00073*** -0.00077*** -0.00083***
(0.00002) (0.00002) (0.00002) (0.00002) (0.00010) (0.00002)
Institucional Distance ( ) 0.06398*** 0.03475*** 0.13497*** 0.09068*** 0.02596*** 0.12313**
(0.04710) (0.04102) (0.03725) (0.03516) (0.03403) (0.03586)
Constant ( ) -3.4376*** -3.8969*** -4.0241*** -4.2271*** -4.5902*** -3.3780***
(0.14343) (0.13169) (0.13119) (0.13833) (0.14309) (0.14616)
Heterogeneity ( ) 1.6661* 1.7251* 1.8355* 1.8653* 1.8665* 2.0805
(0.03434) (0.02983) (0.02733) (0.02503) (0.02419) (0.02615)
Vuong (ZINB x Bin. Neg.) 83.05*** 99.67*** 92.65*** 73.58*** 61.97*** 53.86***
Likelihood Ratio ZINB*** ZINB*** ZINB*** ZINB*** ZINB*** ZINB***
Notes: i) =11,025 observations; ii) standard errors are within parentheses; iii) ***, ** and * refer to statistically
significant estimates of significance levels of 0.001, 0.01 e 0.05, respectively