scholars in an increasingly digital and open world: how do ... · pdf filescholars in an...
TRANSCRIPT

Internet and Higher Education 30 (2016) 1–10
Contents lists available at ScienceDirect
Internet and Higher Education
Scholars in an increasingly open and digital world: How do educationprofessors and students use Twitter?
George Veletsianos a,⁎, Royce Kimmons b
a School of Education and Technology, Royal Roads University, Victoria, BC, Canadab Instructional Psychology & Technology Department, Bringham Young University, Provo, UT, United States
⁎ Corresponding author.
http://dx.doi.org/10.1016/j.iheduc.2016.02.0021096-7516/© 2016 Elsevier Inc. All rights reserved.
a b s t r a c t
a r t i c l e i n f oArticle history:Received 1 August 2015Received in revised form 10 February 2016Accepted 13 February 2016Available online 15 February 2016
There has been a lack of large-scale research examining education scholars' (professors' and doctoral students') so-cialmedia participation.We address thisweakness in the literature by using dataminingmethods to capture a largedata set of scholars' participation on Twitter (232 students, 237 professors, 74,814 unique hashtags, and 645,579tweets).We report howeducation scholars use Twitter,whichhashtags they contribute to, andwhat factors predictTwitter follower counts.We also examine differences between professors and graduate students. Results (a) revealsignificant variation in how education scholars participate on Twitter, (b) question purported egalitarian structuresof social media use for scholarship, and (c) suggest that by focusing on the use of social media for scholarship re-searchers have only examined a fragment of scholars' online activities, possibly ignoring other areas of online pres-ence. Implications of this study lead us to consider (a) the meaningfulness of alternative metrics for determiningscholarly impact, (b) the impact that power structures have upon role-based differences in use (e.g. professor vs.student), and (c) the richness of scholarly identity as a construct that extends beyond formal research agendas.
© 2016 Elsevier Inc. All rights reserved.
Keywords:Social mediaNetworked scholarshipDigital scholarshipTwitterFaculty members' use of online networksOnline participation
1. Introduction
Research on emergent forms of technology-infused scholarship andsocial media use by scholars has explored the relationship between tech-nology and scholarly practice and the impact and implications of technol-ogy in the work and life of scholars. Such research, however, has rarelyfocused on scholars in the field of education or differentiated betweenfaculty members and doctoral students and typically has depended onsurveys, interviews, or small-scale naturalistic observations of socialmedia practices. In other words, while existing empirical research froma variety of disciplines may yield some insights into education scholars'activities online, there has been a lack of large-scale research examiningsocial media participation. Research in this area is necessary becausemany researchers have claimed that digital practices in general, and so-cial media activities in particular, have the potential to transform theways in which education scholarship is conducted and disseminated(Burbules & Bruce, 1995; Fetterman, 1998; Greenhow, Robelia, &Hughes, 2009; Yettick, 2015). For instance, social media may foster par-ticipatory learning and expand the reach of research. Yet, such advocacyoften rests on claims rather than empirical evidence (Kimmons, 2014)anduses of socialmedia have led to tensions and conundrums in scholars'professional lives (Veletsianos, 2016; Veletsianos&Kimmons, 2013). Thisdichotomy suggests that we need to better understand how social mediaare being used in scholarship as well as the implications of their use. Tohelpfill that gap, this study analyzes a large data set of education scholars'
activities on Twitter, one of the most popular social media platformsamong academics (Lupton, 2014). Using these data, we examine theways inwhich doctoral students and professors in education use Twitter,the hashtags that they contribute to, and the factors that predict their fol-lower counts. By doing so, we hope to provide greater insight into educa-tion scholars' online participation.
2. Literature review
Proponents of open, digital, and social scholarship have arguedthat scholarly use of social media can “enhance the impact and reachof scholarship” and “foster the development ofmore equitable, effective,efficient, and transparent scholarly and educational processes”(Veletsianos & Kimmons, 2012, pp. 166). As a result, universities are in-creasingly encouraging researchers and educators to expand their on-line presence (Mewburn & Thomson, 2013). Advocates for greaterincorporation of digital technology into scholarly practice have focusedon the societal benefits of these emergent forms of scholarship(e.g., broadening access to education and scholarship for the commongood), but Scheliga and Friesike (2014) have found that scholars faceboth individual and systemic barriers that may prevent them from en-gaging in these practices despite understanding their potential at a sys-temic level. Similarly, Esposito (2013) found that scholars' use of digitaland open practices may largely serve functional purposes and be drivenby a desire to achieve efficiencies instead of an aspiration to re-imaginescholarly practices.

2 G. Veletsianos, R. Kimmons / Internet and Higher Education 30 (2016) 1–10
Twitter is a popular social media platform for scholars (Lupton,2014; Van Noorden, 2014), and prior research on Twitter has foundthat scholars use it to share information, resources, and mediapertaining to their teaching and research practice. For instance, scholarshave been shown to use Twitter to request and offer assistance to others(Veletsianos, 2012), critique the work of other scholars (Mandavilli,2011), contribute to conferences via hashtags (Li & Greenhow, 2015;Mahrt, Weller, & Peters, 2014; Ross, Terras, Warwick, & Welsh, 2011),implement engaging pedagogies (Junco, Heiberger, & Loken, 2011),and share and comment upon preprint and published articles(Eysenbach, 2011). Although several studies have examined disciplin-ary differences in the use of Twitter (Holmberg & Thelwall, 2014;Rowlands, Nicholas, Russell, Canty, & Watkinson, 2011), other thanthe research reported by Li and Greenhow, we were unable to identifystudies that specifically examined its use by education scholars.
Researchers have also argued that attending to alternative metrics,such as examining references to the scholarly literature in tweets, canextend scholars' impact beyond citations in peer-reviewed journals(Priem & Hemminger, 2010). For instance, some have found that thefrequency of article mentions via Twitter appears to correlate with sub-sequent downloads and citations (Shuai, Pepe, & Bollen, 2012; Thelwall,Haustein, Larivière, & Sugimoto, 2013), although the correlation be-tween tweets and citations in all fields is unclear (Haustein, Peters,Sugimoto, Thelwall, & Larivière, 2013) and in some cases appears tobe weakly associated (de Winter, 2014). On the other hand, Hall(2014) warns that researchers may lose sight of valuable scholarly met-rics (e.g., citation indices) in favor of popularity metrics like Twitter fol-lowers. By examining a large sample of education scholars' onlinepractices, we can begin to better understand social media metrics andthus contribute to the conversation of whether social media metricscan be used to better understand a scholar's impact.
While researchers are able to say with increasing confidence whatscholars do on social media, it is somewhat unclear how scholars partici-pate on Twitter and how online activities relate to academic identity.Greenhowet al. (2009) argued that socialmedia support the developmentof scholars' digital identities, and others found that both professors(Veletsianos & Kimmons, 2013) and students (Kimmons & Veletsianos,2014) intentionally refine or limit their online participation so that it canbe scrutinized by others. One study examined education scholars' Twitterparticipation during the American Educational Research Association(AERA) 2014 conference and described commonalities and differences be-tween facultymembers and students (Li &Greenhow, 2015). In that study,facultymembers reported that Twitter supported their professional digitalidentity, while students reported that Twitter served other purposes forthem that were unrelated to identity (e.g., access to the research commu-nity). Li andGreenhow's study supports findings fromother literature thatshowed that faculty and student perceptions of popular social media devi-ate (e.g., Roblyer, McDaniel, Webb, Herman, &Witty, 2010).
The existing research suffers from three weaknesses that this studyattempts to remedy. First, very little research has examined educationscholars' activities on social media, and even less has compared educa-tion professors' activities with students' activities. Second, while educa-tion student and faculty use of social media has been examined via self-reported means (e.g., Kimmons & Veletsianos, 2014; Li & Greenhow,2015), no research has examined such differences by examining natu-ralistic data trails at any scale. Third, current research onwhat mediateseducation scholars' participation on social media has been mostlyexploratory, thus preventing scholars from developing inferentialmodels. This study addresses all theseweaknesses by using dataminingmethods to capture and analyze a large data set to illuminate scholars'participation on Twitter.
3. Theoretical framework
This study is situated in the digital networked practices of scholars,and in particular on Networked Participatory Scholarship (NPS). NPS
refers to scholars' use of “online social networks to share, reflect upon,critique, improve, validate, and otherwise develop their scholarship”(Veletsianos & Kimmons, 2012, p. 768). The networked spaces thatscholars use (e.g., Twitter, blogs) can be described as fluid organization-al structures that impose little restrictions on membership and enableloosely-connected and tightly-knit distributed individuals to connectwith one another (Dron & Anderson, 2009). Social learning theory un-derpins networked participation on social media. In this perspective,learning and knowledge in networked spaces are facilitated, negotiated,and co-constructed individually as well as socially (cf. Brown, Collins, &Duguid, 1989; Lave & Wenger, 1991; Wenger, 1998). Thus, learning inonline networks becomes a situated activity that takes the form ofparticipation in the socio-cultural practice of scholarship, and asVeletsianos (2012, p. 337) argues, online social networks serve as“emerging and evolving network[s] of scholar–learners where scholarlypractices may be created, refined, performed, shared, discussed, andnegotiated.”
4. Methods
The research focuses on Twitter as a platform for scholarly pur-poses, because it is widely used for scholarship (Lupton, 2014). Twit-ter is a free microblogging platform that allows users to post contentin the form of “tweets” that may also contain links to online content.Tweets are limited to 140 characters of text and may be hashtaggedwith keywords (e.g., #education) or may mention other users byusername (e.g., @BarackObama). A hashtag refers to a “#” symbolfollowed by a short phrase. Through hashtags and mentions, userscan find others that are tweeting on similar topics, share informationin an organized manner, and form networks around shared interests.About one-third of tweets include mentions (boyd, Golder, & Lotan,2010), most of which may be conversational in nature (Honeycutt& Herring, 2009). Users can also retweet a tweet to share contentposted by someone else with all of their followers. By default, allsharing on Twitter is publicly visible, meaning each user can go toanother user's profile page, see all of that user's tweets, and “follow”that user to have new tweets provided directly to them. Each user'sprofile page also provides some general metrics about use and popu-larity, including that user's number of tweets and followers.
This study collected the most recent 3500 tweets for each user whoused the official hashtag of the 2014American Educational ResearchAs-sociation conference (#aera14). Contributors to the hashtagwere a sub-section of education scholars, and by gathering a list of contributors wewere able to examine education scholars' Twitter participation. We se-lected this particular hashtag as away to identify education scholars be-cause the AERA annual meeting is one of the largest gatherings ofeducation scholars worldwide, includes a broad array of education re-searchers (as opposed to a content- or methods-focused conference),and the 2014 conference was the latest AERA conference at the timeof writing. Thus, the #aera14 hashtag served as a vehicle to locate alarge and diverse sample of education scholars. In other words, thedata in our sample are not limited to the AERA conference – the confer-ence only served as a way to identify education scholars. While someusers may have used other hashtags in relation to this conference(e.g., #aera2014), we limited our identification of scholars by examin-ing the profiles of those who posted using the official hashtag. As a re-sult, our sample excludes scholars who did not use the official hashtag.
4.1. Research questions
To better understand education scholars' uses of Twitter, we askedthe following three research questions:
RQ1 How do scholars in the education field use Twitter?RQ2 Which hashtags do education scholars contribute to?RQ3 What factors predict participants' follower counts?

3G. Veletsianos, R. Kimmons / Internet and Higher Education 30 (2016) 1–10
For each of these questions, we also examined possible differencesbetween professors and graduate students because prior research sug-gests that students and faculty hold different perceptions about theuse of socialmedia in education. One study found that students believedsocial media could be more convenient than did faculty, while facultywere more likely to believe that such media were not appropriate forclasswork (Roblyer et al., 2010). In interviews of education scholars con-tributing to #aera14, Li and Greenhow (2015) similarly reported thatthese groups differed in how they viewed Twitter. Based on these find-ings we anticipated observable participation differences between grad-uate students and professors.
The first question addressed the scholarly uses of Twitter specificallyamong education scholars to better understand how this technology isused. The second was intended to uncover what intellectual and socialonline communities education scholars participate in and how diverseor homogenous those communities happen to be to better understandthe scope or multi-facetedness of scholarly online identities. The thirdwas intended to examine the factors that may predict scholars' followernumbers and shed light on the claim that social media metrics can en-rich our understanding of scholars' impact.
4.2. Data collection
Twitter's application programming interface (API) allows re-searchers to systematically retrieve large amounts of public user data.We used the #aera14 Twitter feed and the Twitter API to collect data.First, we developed a series of PHP/REST/JSON scripts to use the TwitterAPI to extract information for all of the identified #aera14 tweets, in-cluding tweet text, metadata (e.g., creation date, retweet count), andauthor information (e.g., ID, name, tweet count, description). Tweet,user, hashtag, and mention data were also stored in the database andidentifiers were included to maintain relationships between objects(e.g., tweets and their authors, hashtags and their tweets).
Second, we developed another series of web scripts for the TwitterAPI to extract the most recent tweets from each user identified in theprevious step, which allowed us to collect user tweets that were not la-beled with the #aera14 hashtag. A Twitter API restriction though, limit-ed our access to only the most recent 3500 tweets for each user. Tweetdata began being collected six months following the AERA 2014 confer-ence and continued for several months. Thus, collected tweets includetweets prior to, during, and after the conference.
Finally, we programmatically generated basic descriptives foreach tweet (e.g., number of hashtags, number of mentions), user(e.g., lifespan), and hashtag (e.g., unique uses), and generated binarydescriptive variables (e.g., hashtagged, mentioned).
4.3. Data analysis
We identified 1629 users. Next, we read each user's profile informa-tion (bio, location, username) and using this information we coded thecollected users as graduate students, professors, or other. Accounts thatcould not be readily identified from this information as either graduatestudent or professor accounts (e.g., unclear, corporate, multiauthor, oranonymous accounts) were excluded from analysis, and the final dataset included an almost equal number of graduate students (232) andprofessors (237) for a total number of 469. By identifying accounts inthis way, it is possible that student or professor accounts might havebeen excluded from analysis if they did not self-identify as such. This,however, is an intentional delimitation of the study, as we did not feelit to be appropriate to label accounts in amanner thatwas not reflectiveof self-descriptions. Furthermore, if the goal of this study is to under-stand scholars' participation in social media, then it seems to makesense to focus our attention on social media use which users connectto their identities as scholars.
All datawere then exported from the database and imported to SPSSfor statistical analysis. Separate variables were analyzed for three datasets.
4.3.1. Tweet data setThis dataset included unique identifiers, retweets (the number of
times the tweet had been retweeted), and retweet (a binary variablereflecting whether the tweet was original or a retweet).
4.3.2. Hashtag data setThis dataset included unique hashtags and the number of times each
was used. Hashtag counts were calculated to determine communities(e.g., phdchat), conferences (e.g., aera13), and topics (e.g., immigration)that were identified in tweets. Hashtag use varied by user, and somehashtags were widely used while others were used by only one or twousers. Hashtags that were used by more than 50 unique users in thedata set (roughly 10% of users) were marked as viral. We used 50 usersto demarcate viral and non-viral hashtags because the number of usersusing a hashtag fell dramatically from that point onwards, indicatinglow uptake.
4.3.3. User data setThis dataset included raw and percentage participation factors. Per-
centage factors were used to represent each user's overall twitter activ-ities, counteracting skewing that would have resulted from highlydifferential numbers of tweets. Participation factors were:
• professor — Whether the participant self-identified as a professor(non-exclusive to student).
• student — Whether the participant self-identified as a student (non-exclusive to professor).
• followers (dependent)— The number of other Twitter users who “fol-low” the user.
• following (independent) — The number of other Twitter users whomthe user “follows.”
• listed (correlate/independent)— The number of Twitter lists onwhichthe user appears.
• tweets (independent) — The number of tweets the user has posted.• lifespan (independent)— The number of years (in decimal form) sincethe Twitter user accountwasfirst created, calculated as lifespan= cur-rent date − creation date.
• frequency (independent) — The number of tweets the user posts in aday, calculated as number of tweets ÷ (last tweet date − first tweetdate).
• mentioning (independent) — The percentage of tweets in which theuser mentions another user, calculated as user tweets withmentions ÷ tweets.
• hashtagging (independent) — The percentage of tweets in which theuser includes a hashtag, calculated as user tweets withhashtags÷ tweets.
• linking (independent) — The percentage of tweets in which the userincludes a URL, as calculated by user tweets with links÷ tweets.
• retweeting (independent) — The percentage of tweets that areretweets (i.e., non-original), calculated as user retweets÷ tweets.
• replying (independent)— The percentage of tweets that are replies toother Twitter users or tweets, calculated as user replies ÷ tweets.
5. Results
After data cleaning, identification of users by role, and exclusion ofparticipants who could not be identified as students or professors, theuser data set included 469 users (232 students and 237 professors),the hashtag data set included 74,814 unique hashtags that were used427,930 times, and the tweet data set included 645,579 tweets (48%from students and 52% from professors).

Table 2Followers (popularity) and Tweets (activity) of scholars by percentile groups.
Percentile group Followers Tweets Avg. followers
Top 1% 21% 7% 15,059Top 5% 43% 29% 4385Top 10% 57% 45% 1389Top 50% 91% 90% 140Bottom 99% 79% 93% 164Bottom 50% 9% 10% 22
4 G. Veletsianos, R. Kimmons / Internet and Higher Education 30 (2016) 1–10
5.1. RQ1: how do graduate students and professors in the education fielduse Twitter?
The descriptive statistics of student and professor use of Twitter re-vealed thatmore than half of the tweets (55.2%)mentioned other users,while only about a quarter (22.8%) were replies to others. Further, morethan 30% of tweets were retweets, 37% included a hashtag, and morethan 31% included a hyperlink. Results also showed considerable vari-ance between individual users with a positive skew on most non-normalized factors. For instance, the standard deviation of followers, fol-lowing, listed, and tweets exceeded each factor's mean, and the medianwas far below the mean. Those participants who were more active(i.e., posted more tweets) or more popular (i.e., gained more followers)exponentially exceeded their counterparts (Table 1).
Table 2 provides an overview of activity and popularity by percentilegroups. Comparing the popularity of the top 50%with that of the bottom50% of scholars suggests that popularity is roughly equivalent to activityor the efforts of the individual in terms number of tweets posted. As weconsider the top percentile groups however, participation becomesmore and more unequal: the top 5% garner 43% of all followers (thoughthey provide 29% of all tweets) and the top 1% command 21% of all fol-lowers (though they only provide 7% of all tweets). Themost popular 1%scholars have an average follower base nearly 100 times that of scholarsin the lower 99% and 700 times those in the bottom 50%.
To determine if any factors were attributable to participant roles aseither student or professor, a multivariate analysis of variance(MANOVA) with user descriptives as the dependent variables and roleas the independent variable yielded significant overall effects (Wilks'λ = .92, p b .001, partial eta squared = .08, observed power = 1).Given the significance of the overall test, univariate main effects wereexamined, and significant effects were detected for followers, F(1) =10.14, p b .01, partial eta squared = .02, observed power = .89; listed,F(1) = 11.64, p b .01, partial eta squared = .02, observed power =.93; and linking, F(1)= 4.71, p b .05, partial eta squared= .01, observedpower= .58. Estimatedmarginalmeans for each dependent variable byrole (Table 3) revealed that:
1. Professors had more followers than students (MD = 557).2. Professors were listed more often than students (MD = 36).3. Professors included links in their tweets more often than did stu-
dents (MD = 4%).
5.2. RQ2: which hashtags do education scholars contribute to?
Other than #aera14, which was the hashtag that all these scholarscontributed to, what hashtags did they use? Our analysis revealed thatboth graduate students and professors hashtagged 37% of their tweets.In total, 74,814 unique hashtags were used, with around 25 uniquehashtags used per user, but just 136 unique hashtags (0.18%) were con-sidered viral. The average hashtag was used by only 1.95 users an aver-age of 2.39 times, suggestinghigh variability. Though non-viral hashtags
Table 1Descriptive results of students' and professors' Twitter use.
Mean SD Median Min Max
Followers 756.8 1913.2 298 4 24,611Following 564.2 674.7 362 7 8404Listed 31.8 86.2 10 0 1201Tweets 3676 8752 1010 4 82,690Lifespan 3.9 1.8 3.8 0.84 7.9Frequency 2.4 4.8 0.76 0 41.3Mentioning 55.2 22.6 0.59 0.47 94.8Hashtagging 37.01 20.1 0.36 0.15 1Linking 31.3 19.9 0.29 0 88.9Retweeting 30.5 17.6 0.28 0 92.9Replying 22.8 13.7 0.15 0 81.9
accounted for 99.82% of all hashtags, they were present in about half(51.81%) of all tweets.
The 136 viral hashtags were present in 14.48% of all tweets,reflecting that some hashtags were important to a large number ofparticipants. As shown in Table 4, these hastags were related to educa-tion (e.g., edchat, highered, edreform), civil rights or advocacy(e.g., Ferguson, BlackLivesMatter), or general Internet culture (e.g., FFfor Follow Friday, TBT for Throwback Thursday).
We created viral hashtag scatter plots of participation and use fre-quencies to better understand differences between groups and detecteda strong, positive linear relationship for participation between groups(R2 = .79) as expressed in the following equation: student participa-tion= .03+ (.81× professor participation) (Fig. 1), and amoderate, pos-itive power law relationship for hashtag frequency between groups(R2 = .51), as expressed in the following equation: student frequency=1.49 × professor frequency.68 (Fig. 2). These relationships reveal that stu-dents were somewhat less likely to participate in each viral hashtagthan professors and that the frequency in which professors participatein these hashtags is exponentially greater than that of students.
5.3. RQ3: what factors predict participants' follower counts?
We had anticipated that several measurable participation factorsmight influence follower counts, including tweets, following, role, andlifespan. Visual inspection of initial scatterplots and curve estimationtests revealed potential power law relationships between most factors,so values of scale variables were recoded logarithmically to allow forfurther analysis that assumed linearity. Visual inspection of logarithmicscatterplots revealed linearity, and bivariate correlation results of rawvalues were compared to results of logarithmic values to ensure thatdata recoding improved correlations in data. In all cases, correlationsin the data were improved as a result of the logarithmic recoding ofscale variables (Table 5).
First, a logarithmic scatter plot of followers to following (Fig. 3) re-vealed a strong, positive linear relationship between the two variables(R2 = .62;, as expressed in the following equation: lg(followers) =.98 × lg(following). This reveals that by following more people, partici-pants will receivemore followers but that this rate decreases. For exam-ple, if one user follows 10 people, another follows 100, and a thirdfollows 1000, the first will receive a number of followers representing95% of those followed, the second would receive 91%, the third 87%,and so forth. The scatterplot also revealed the possibility of outliers,which needed to be considered in later analysis.
Next, a logarithmic scatter plot of followers to tweets (Fig. 4) revealeda strong, positive linear relationship between the two variables (R2 =.67), as expressed in the following equation: lg(followers) =.63+ (.62× lg(tweets)). This reveals that by tweetingmore, participants
Table 3Estimated marginal means and medians of role-based Twitter differences.
Professors Graduate students
E.M. mean Std. error Median E.M. mean Std. error Median
Followers 1032.4 123.1 367 475.2 124.4 219Listed 45.1 5.5 14 18.3 5.6 7Linking .33 .01 .31 .29 .01 .28

Table 4Top hashtags by user role.
tnedutSProfessor
Hashtag % of users Tweets per user Hashtag % of users Tweets per user
education 66.7 9.2 education 64.2 7.3
highered 62.5 30.2 edchat 59.9 20.9
edchat 62.0 32.3 highered 54.7 32.6
edtech 48.1 40.2 Ferguson 46.6 20.8
Ferguson 41.8 18.3 edtech 45.7 19.4
FF 38.8 4.5 research 33.2 3.8
research 38.0 3.3 phdchat 32.8 11.4
AERA13 35.4 17.9 teachers 32.0 3.6
STEM 34.6 7.9 edreform 32.0 5.5
teachers 34.2 4.6 FF 32.0 4.5
5G. Veletsianos, R. Kimmons / Internet and Higher Education 30 (2016) 1–10
will receive more followers but that this rate decreases. For example, ifone user posts 10 tweets, another posts 100, and a third posts 1000, thefirst would gain 1.78 followers per tweet, the secondwould gain .74, thethird .31, and so forth.
And third, a logarithmic scatter plot of followers to lifespan (Fig. 5) re-vealed a weak, positive linear relationship between the two variables(R2 = .17) as expressed in the following equation: lg(followers) =1.94 + (.98 × lg(lifespan)). This reveals that mere time in the mediumproduces followers but that the rate of return on followers per time in-terval decreases. For example, a user's first year would garner 87.1 fol-lowers, first four years would garner 84.7 followers per year, firsteight years would garner 83.6 per year, and so forth.
Multiple linear regression was utilized to test whether any of theparticipation factors significantly predicted users' follower counts. Theresults of the stepwise linear regression indicated that a model of fourpredictors explained 78% of the user variance (R2 = .78, F[4468] =411.04, p b .001), but casewise diagnostics identified nine outliers
Fig. 1. Plot of linear relationship between hasht
exceeding three standard deviations from predicted values. Of these,seven identified themselves in their profiles as belonging to elite univer-sities, including Harvard, Princeton, University of Pennsylvania, andUniversity of Toronto. This suggested that outlier status may be influ-enced by self-identifying factors as either elite or otherwise. To testthis, participant data was coded with two new variables based uponwhether the user identified a university in their profile and if so, wheth-er this was an elite university, where elite university was considered tobe any university that the Carnegie classification system was describedas “very high research university.” ANOVA comparisons of followersbased on these new factors did not reveal significant results. Outlierswere therefore excluded from the analysis.
Upon exclusion of these nine cases, the strength of the predictivemodel increased to 83% (R2 = .83, F[4459] = 571.42, p b .001). It wasfound that following (B = .58, p b .001), tweets (B = .32, p b .001), role(B= .16, p b .01), and lifespan (B = .12, p b .01) significantly predictedfollowers. Those scholars who follow more users, have tweeted more,signal themselves as professors, and have been on Twitter longer willhave more followers (Table 6). This relationship may be expressed inthe following equation:
lg followersð Þ ¼ :58� lg followingð Þð Þ þ :32� lg tweetsð Þð Þ þ :16� roleð Þþ :12� lg lifespanð Þð Þ−:27:
6. Discussion and implications
The results presented in this study reaffirm a number of previous re-search findings and contribute new insights to current knowledge re-garding four aspects of the research questions: participation equity,role differences, scholars' online participation, and scholarly influence.
ag participation of students and professors.

Fig. 2. Plot of power law relationship between hashtag frequency of students and professors.
6 G. Veletsianos, R. Kimmons / Internet and Higher Education 30 (2016) 1–10
6.1. Participation equity
Findings for RQ1 reveal significant variation in how educationscholars participate on Twitter and the benefits received fromparticipa-tion. As scholars became more active (i.e., increase their number oftweets) and popular (i.e., increase their number of followers) on Twit-ter, they did so exponentially. For instance, the most followed 1% gar-nered 21% of all followers and had an average follower base nearly100 times larger than that of other scholars, while providing only 7%of all tweets. This leads us to ask whether the use of social media forscholarly work necessarily leads to new andmore egalitarian structuresfor scholarly dissemination or if it reflects existing, or fosters new, non-egalitarian structures of scholarly practice. Results for RQ3 show thatbeing widely followed on social media is impacted by many factorsthat may have little to do with the actual quality of scholarly work (i.e.following count, tweet count, role, lifespan) and suggests that participa-tion and popularity may be impacted by a number of additional factorsunrelated to scholarly merit (e.g., wit, controversy, longevity).
Results for RQ3 should lead us to question whether social mediametrics can and should be used as proxies for scholarly value, as hasbeen argued by proponents of alternative metrics (e.g., Priem &
Table 5Bivariate correlations of factors with raw values vs. logarithmic values.
tweets following lifespan role
followers .43⁎⁎ .42⁎⁎ .24⁎⁎ .15⁎⁎
lg(tweets) lg(following) lg(lifespan) role
lg(followers) .82⁎⁎ .79⁎⁎ .41⁎⁎ .22⁎⁎
⁎⁎ Denotes significance at the p b .01 level.
Hemminger, 2010) and to recognize that a scholar's power to dissemi-nate meaningful work in a digitally connected culture is mediated(and therefore can bemanipulated) by effective social media strategies.Exponential increases in activity and popularity lend empirical supportto earlier claims that some individuals may be more capable ofexploiting the commons than others (Veletsianos & Kimmons, 2012)and suggests that Twitter and similar technologies may not necessarilybe the democratizing forces they are sometimes claimed to be.
Therefore, we recommend future research comparing traditionalmeasures of scholarly outputs (e.g., number of journal articles or cita-tions) to Twitter impact metrics to determine to what extent theymay or may not be connected. Similar research has been conducted inother disciplines (Eysenbach, 2011; Shuai et al., 2012; Thelwall et al.,2013), but none has heretofore been done in the field of education. Al-though it may be that measuring social media activity may help deter-mine impact in a manner more relevant to today's society, the factthat participation patterns predict follower counts (as shown in thispaper) should elicit questions as to what follower counts actuallymean in these contexts. This should lead us to consider what other fac-torsmay influence scholars' abilities to share their work in ameaningfulmanner and to examine what metrics may be meaningful to inspect.
6.2. Role differences
Results for RQ3also revealed that although participant role impactedfollower counts, listed counts, and linking, this distinction accounted foronly a very small percent of variation (2% or less) in each of those fac-tors, suggesting that the social capital traditionally associated with pro-fessorial status may not provide much influence on Twitter. Yet, resultsfor RQ2 reveal that viral hashtag use did skew toward professors, andour analysis also indicates that there may be some qualitative differ-ences between hashtags based on role. Based on our scatter plots

Fig. 3. Plot of users' linear relationship between logarithmic follower and following counts.
Fig. 4. Plot of users' linear relationship between logarithmic follower and tweet counts.
7G. Veletsianos, R. Kimmons / Internet and Higher Education 30 (2016) 1–10
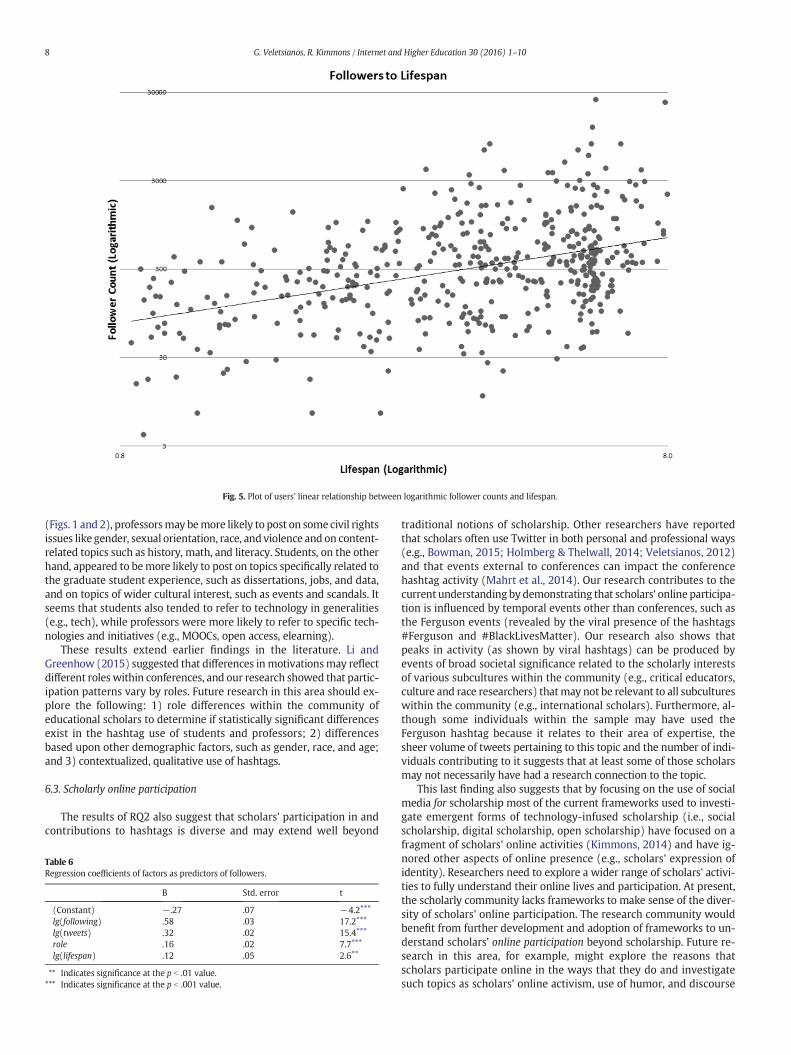
Fig. 5. Plot of users' linear relationship between logarithmic follower counts and lifespan.
8 G. Veletsianos, R. Kimmons / Internet and Higher Education 30 (2016) 1–10
(Figs. 1 and 2), professorsmay bemore likely to post on some civil rightsissues like gender, sexual orientation, race, and violence and on content-related topics such as history, math, and literacy. Students, on the otherhand, appeared to bemore likely to post on topics specifically related tothe graduate student experience, such as dissertations, jobs, and data,and on topics of wider cultural interest, such as events and scandals. Itseems that students also tended to refer to technology in generalities(e.g., tech), while professors were more likely to refer to specific tech-nologies and initiatives (e.g., MOOCs, open access, elearning).
These results extend earlier findings in the literature. Li andGreenhow (2015) suggested that differences inmotivationsmay reflectdifferent roles within conferences, and our research showed that partic-ipation patterns vary by roles. Future research in this area should ex-plore the following: 1) role differences within the community ofeducational scholars to determine if statistically significant differencesexist in the hashtag use of students and professors; 2) differencesbased upon other demographic factors, such as gender, race, and age;and 3) contextualized, qualitative use of hashtags.
6.3. Scholarly online participation
The results of RQ2 also suggest that scholars' participation in andcontributions to hashtags is diverse and may extend well beyond
Table 6Regression coefficients of factors as predictors of followers.
B Std. error t
(Constant) −.27 .07 −4.2⁎⁎⁎
lg(following) .58 .03 17.2⁎⁎⁎
lg(tweets) .32 .02 15.4⁎⁎⁎
role .16 .02 7.7⁎⁎⁎
lg(lifespan) .12 .05 2.6⁎⁎
⁎⁎ Indicates significance at the p b .01 value.⁎⁎⁎ Indicates significance at the p b .001 value.
traditional notions of scholarship. Other researchers have reportedthat scholars often use Twitter in both personal and professional ways(e.g., Bowman, 2015; Holmberg & Thelwall, 2014; Veletsianos, 2012)and that events external to conferences can impact the conferencehashtag activity (Mahrt et al., 2014). Our research contributes to thecurrent understanding by demonstrating that scholars' online participa-tion is influenced by temporal events other than conferences, such asthe Ferguson events (revealed by the viral presence of the hashtags#Ferguson and #BlackLivesMatter). Our research also shows thatpeaks in activity (as shown by viral hashtags) can be produced byevents of broad societal significance related to the scholarly interestsof various subcultures within the community (e.g., critical educators,culture and race researchers) thatmay not be relevant to all subcultureswithin the community (e.g., international scholars). Furthermore, al-though some individuals within the sample may have used theFerguson hashtag because it relates to their area of expertise, thesheer volume of tweets pertaining to this topic and the number of indi-viduals contributing to it suggests that at least some of those scholarsmay not necessarily have had a research connection to the topic.
This last finding also suggests that by focusing on the use of socialmedia for scholarship most of the current frameworks used to investi-gate emergent forms of technology-infused scholarship (i.e., socialscholarship, digital scholarship, open scholarship) have focused on afragment of scholars' online activities (Kimmons, 2014) and have ig-nored other aspects of online presence (e.g., scholars' expression ofidentity). Researchers need to explore a wider range of scholars' activi-ties to fully understand their online lives and participation. At present,the scholarly community lacks frameworks to make sense of the diver-sity of scholars' online participation. The research community wouldbenefit from further development and adoption of frameworks to un-derstand scholars’ online participation beyond scholarship. Future re-search in this area, for example, might explore the reasons thatscholars participate online in the ways that they do and investigatesuch topics as scholars' online activism, use of humor, and discourse

9G. Veletsianos, R. Kimmons / Internet and Higher Education 30 (2016) 1–10
surrounding academic life. In summary, future research should examinethe substance of education scholars' tweets qualitatively in order to gaina more in-depth look at how scholars are using Twitter.
6.4. Scholarly influence
Given that many scholars use Twitter to share their work with abroader audience, it has been suggested that follower counts might bea useful metric of success in this regard (cf. Marwick & boyd, 2011). Re-gardless of whether Twitter and similar technologies are equalizingforces, our findings for RQ3 offer several practical suggestions forscholars who would like to increase their followership: (a) tweet often,(b) follow many other users, (c) self-identify as a professor if accurate,and (d) continue using Twitter over an extended period. Whether oneviews this advice as gaming the system or legitimate participation inthe community may depend on one's own assumptions about themedi-um. However, if follower counts are considered a metric of impact, onehas to question it further, as our results show that education scholars' fol-lowership is most strongly predicted by the number of tweets postedand number of people followed. A wide range of variables might impactthe number of tweets posted: Extroverts might tweet more than intro-verts and scholars with family responsibilities might have less time totweet than those without.
7. Limitations and future research
One major limitation of this study is that results will not necessarilytransfer to other online social networks used by scholars likeResearchGate, Facebook or Academia.edu (Tufecki, 2014). Another isthat participants were selected based upon their use of the #aera14hashtag and this decision led to the exclusion of education scholarswho did not use the hashtag. As a result of this choice, wemay bemissingnuanced scholarly social media use that might lead education scholars toelect not to participate in popular conference hashtags even though theymight have a Twitter account. Future research can address these two lim-itations by examining scholars' participation on other social media plat-forms, and by conducting analyses similar to the ones reported hereusing additional hashtags as vehicles to identify education scholars. Thelatter approach, would enable researchers to broaden the data source toinclude professors and students who participated in other education-focused conferences/communities. Additionally, other areas of future re-search mentioned previously include:
• The comparison of traditional scholarly output measures to Twitterimpact metrics;
• The analysis of role, gender, race, and age differences regardinghashtag use;
• And the qualitative analysis of scholars' tweets to determine moresubstantial meanings of use.
8. Conclusion
This research used a large-scale data set to examine educationscholars' participation on Twitter. It examined theways inwhich doctor-al students andprofessors used Twitter, the hashtags that they contribut-ed to, and what factors predicted their follower counts. Expandingopportunities to interact with diverse audiences in online settings andthe potential of online networks to increase citations, reach, and impacthave ledmany scholars to use socialmedia and online social networks aspart of their scholarly activities.
Yet, the results of this study indicate that significant variation existsin education scholars' networked participation. While one of the antici-pated outcomes of social media use is the democratization of knowledgesharing and participation, the results of this research question such pur-ported egalitarian structures of socialmedia use. Significantly, the resultsreported herein caution researchers and practitioners that theoretical
frameworks that focus exclusively on scholarship and overlook the di-verse activities that scholars enact online, ignore significant aspects ofwho scholars are whey they are online. The richness and complexity ofnetworked scholarship, coupled with the findings reported here, pro-vides a fertile ground for further research on the topic.
Acknowledgments
This studywas partially funded by a grant from the Canada ResearchChairs program and the J.A. & Kathryn Albertson Foundation.
References
Bowman, T.D. (2015). Differences in personal and professional tweets of scholars. AslibJournal of Information Management, 67(3), 356–371.
Brown, J., Collins, A., & Duguid, P. (1989). Situated cognition and the culture of learning.Educational Researcher, 18(1), 32–41.
Burbules, N.C., & Bruce, B.C. (1995). This is not a paper. Educational Researcher, 24(8),12–18.
boyd, D., Golder, S., & Lotan, G. (2010). Tweet, tweet, retweet: Conversational aspects ofretweeting on Twitter. Proceedings of the 43rd Hawaii International Conference on SystemSciences 2010 (Retrieved from http://www.danah.org/papers/TweetTweetRetweet.pdf).
Dron, J., & Anderson, T. (2009). How the crowd can teach. In S. Hatzipanagos, & S.Warburton (Eds.), Handbook of research on social software and developing communityontologies (pp. 1–17). Hershey, PA: IGI Global Information Science.
Esposito, A. (2013). Neither digital or open. Just researchers. Views on digital/open schol-arship practices in an Italian university. First Monday, 18(sss).
Eysenbach, G. (2011). Can tweets predict citations? Metrics of social impact based onTwitter and correlation with traditional metrics of scientific impact. Journal ofMedical Internet Research, 13(4).
Fetterman, D.M. (1998). Webs of meaning: Computer and Internet resources for educa-tional research and instruction. Educational Researcher, 27(3), 22–30.
Greenhow, C., Robelia, B., & Hughes, J.E. (2009). Learning, teaching, and scholarship in adigital age: Web 2.0 and classroom research: What path should we take now?Educational Researcher, 38(4), 246–259.
Hall, N. (2014). The Kardashian index: A measure of discrepant social media profile forscientists. Genome Biology, 15(7), 424.
Haustein, S., Peters, I., Sugimoto, C., Thelwall, M., & Larivière, V. (2013). Tweeting biomed-icine: An analysis of tweets and citations in the biomedical literature. Journal of theAssociation for Information Science and Technology, 65(4), 656–669.
Holmberg, K., & Thelwall, M. (2014). Disciplinary differences in Twitter scholarly commu-nication. Scientometrics, 101, 1027–1042.
Honeycutt, C., & Herring, S.C. (2009). Beyondmicroblogging: Conversation and collabora-tion via Twitter. Proceedings of the 42nd Hawaii International Conference on System Sci-ences (Retrieved from http://ella.slis.indiana.edu/*herring/honeycutt.herring.2009.pdf).
Junco, R., Heiberger, G., & Loken, E. (2011). The effect of Twitter on college student en-gagement and grades. Journal of Computer Assisted Learning, 27(2), 119–132.
Kimmons, R. (2014). Emergent forms of technology-influenced scholarship. In M. Khosrow-Pour (Ed.), Encyclopedia of information science and technology (pp. 2481–2488) (3rded.). IGI Global.
Kimmons, R., & Veletsianos, G. (2014). The fragmented educator 2.0: Social networkingsites, acceptable identity fragments, and the identity constellation. Computers &Education, 72, 292–301.
Lave, J., & Wenger, E. (1991). Situated learning: Legitimate peripheral participation. Cam-bridge, UK: Cambridge University Press.
Li, J., & Greenhow, C. (2015). Scholars and social media: Tweeting in the conferencebackchannel for professional learning. Educational Media International, 52(1), 1–14.
Lupton, D.A. (2014). Feeling better connected': Academics' use of social media. Canberra:news & media research centre (Retrieved on November 2014 from http://www.canberra.edu.au/about-uc/faculties/arts-design/attachments2/pdf/n-and-mrc/Feeling-Better-Connected-report-final.pdf).
Mahrt, M.,Weller, K., & Peters, I. (2014). Twitter in scholarly communication. In K.Weller, A.Bruns, J. Burgess, M. Mahrt, & C. Puschmann (Eds.), Twitter and society (pp. 399–410).New York, NY: Peter Lang.
Mandavilli, A. (2011). Peer review: Trial by Twitter. Nature, 469, 286–287.Marwick, A., & boyd, d. (2011). To see and be seen: Celebrity practice on Twitter.
Convergence, 17(2), 139–158.Mewburn, I., & Thomson, P. (2013). Why do academics blog? An analysis of audiences,
purposes and challenges. Studies in Higher Education, 38(8), 1105–1119.Priem, J., & Hemminger, B. (2010). Scientometrics 2.0: Newmetrics of scholarly impact on
the social web. First Monday, 15(7).Roblyer, M.D., McDaniel, M., Webb, M., Herman, J., & Witty, J.V. (2010). Findings on
Facebook in higher education: A comparison of college faculty and student usesand perceptions of social networking sites. The Internet and Higher Education, 13(3),134–140.
Ross, C., Terras, M., Warwick, C., & Welsh, A. (2011). Enabled backchannel: ConferenceTwitter use by digital humanists. Journal of Documentation, 67(2), 214–237.
Rowlands, I., Nicholas, D., Russell, B., Canty, N., & Watkinson, A. (2011). Social media usein the research workflow. Learned Publishing, 24(3), 183–195.

10 G. Veletsianos, R. Kimmons / Internet and Higher Education 30 (2016) 1–10
Scheliga, K., & Friesike, S. (2014). Putting open science into practice: A social dilemma?First Monday, 19(9), 1–16.
Shuai, X., Pepe, A., & Bollen, J. (2012). How the scientific community reacts to newly sub-mitted preprints: Article downloads, Twitter mentions, and citations. PloS One, 7(11).
Thelwall,M., Haustein, S., Larivière, V., & Sugimoto, C. (2013). Do altmetricswork? Twitterand ten other social web services. PloS One, 8(5).
Tufecki, Z. (2014). Big questions for social media big data: Representativeness, validityand other methodological pitfalls. Proceedings of the Eight International AAAI Confer-ence on Weblogs and Social Media. MI: Ann Arbor.
Van Noorden, R. (2014). Online collaboration: Scientists and the social network. Nature,512(7513), 126–129.
Veletsianos (2016). Social media in Academia: Networked scholars. New York, NY:Routledge.
Veletsianos, G. (2012). Higher education scholars' participation and practices on Twitter.Journal of Computer Assisted Learning, 28(4), 336–349.
Veletsianos, G., & Kimmons, R. (2012). Assumptions and challenges of open scholarship.The International Review Of Research In Open And Distance Learning, 13(4), 166–189.
Veletsianos, G., & Kimmons, R. (2013). Scholars and faculty members lived experiences inonline social networks. The Internet and Higher Education, 16(1), 43–50.
Wenger, E. (1998). Communities of practice. Learning, meaning and identity. Cambridge,UK: Cambridge University Press.
de Winter, J.C.F. (2014). The relationship between tweets, citations, and article views forPLOS ONE articles. Scientometrics, 102(2), 1773–1779.
Yettick, H. (2015). One small droplet: News media coverage of peer-reviewed anduniversity-based education research and academic expertise. Educational Researcher,44(3), 173–184.