school absenteeism and its association with food ... · school absenteeism and its association with...
TRANSCRIPT
School absenteeism and its association with food
insecurity among School Adolescents in Jimma Zone,
Ethiopia
(PhD)
Conference place: Dessalegn Hotel

Contents
• Introduction
• Objectives
• Methods and materials
• Results and Discussion
• Conclusion
Introduction
• Poor health and nutrition in school adolescents are major barriers to
educational access and achievement in low-income countries which poses
a serious challenge for the effort towards the MDG(1, 2).
• Studies showed that problems of food insecure households are increased
risk of academic and socio-economical difficulties.
• Food-insecure children are more likely to suffer from illnesses like
stomachaches, headaches and colds when they reach preschool age (1, 3).
• Household food insecurity results when food is not available, cannot be
accessed with certainty in socially acceptable ways
…cont’d• A wide variety of research has demonstrated the positive correlation
between health and learning (2, 3, 4).
• Children from food insufficient households had a low grade score and were more likely to repeat a grade than their food sufficient peers.
• Children who are born in poor family receive a little mental stimulation and they are far more likely than their richer peers .
• Adolescence is a transition from child to adulthood characterized by psycho-social changes, not only physiological change.

Objectives
• To assess the association of food insecurity and school absenteeism
in Jimma Zone, Southwest of Ethiopia.
Methods and Materials
Study Setting and Sampling
• A school based cross-sectional from Oct. - Nov, 2013.
• Jimma Zone is one of the 20 administrative zones in Oromia
• Located at 350 km from Addis Ababa to southwest.
• Has a total population of 2.5 million, majority (94%) live in rural
…cont’d
• The study area was stratified into urban and rural schools
• Then from each school, sections were selected
• A total of 1000 students were randomly selected.
• The inclusion criteria were
– students who were attending the school and
– permanent resident of selected kebeles
Data Collection
• Structured questionnaires were used
• Based on a pretest, additional adjustment was made on terminologies
• Data collectors were selected from local people
• Data collectors were blinded of the study objective to avoid bias.

Data Analysis
• Data were checked for missing values and outliers
• Regression analyses were used to see the strength of association
between independent and dependent variable using odds ratios
• Multicollinearity among independent variables was detected. The SE
<2.0, a familiar cutoff value, showed there was no multicollinearity.
• Variables that have p=0.28 with school absenteeism and food security
in the bivariate analyses were entered in a multivariable regression
Measurements
• AFS is assessed by asking the respondents 5 questions
(1) the respondent worried about not having enough food
(2) reduced food intake because of food shortage or money
(3) went to school without eating food because of food shortage or money
(4) asked outside the home for food due to food shortage or money
(5) the variety of food was reduced
• HFS index was created by summing the responses of respondents after
coding to zero and one.
…cont’d
• School absenteeism was any illegitimate absence for at least a day
withinthelastsemesterwhich don’t includeformal schoolclosure days.
• This study was done after getting official permission from an ethical
clearance committee of Jimma University.
• Each respondent was informed about objective of the study and
privacy during the interview.
• Informed verbal consent was obtained from each study participants.

Result and Discussion
• Among eligible participants, 990 (99%) gave complete response.
• Bivariate analysis showed school absenteeism was significantlyassociated with
household head(P<0.001)
gender(P<0.001)
residence(P<0.05)
paternal education(P<0.001)
paternal occupation (P<0.001) and
students’ age(P<0.01)
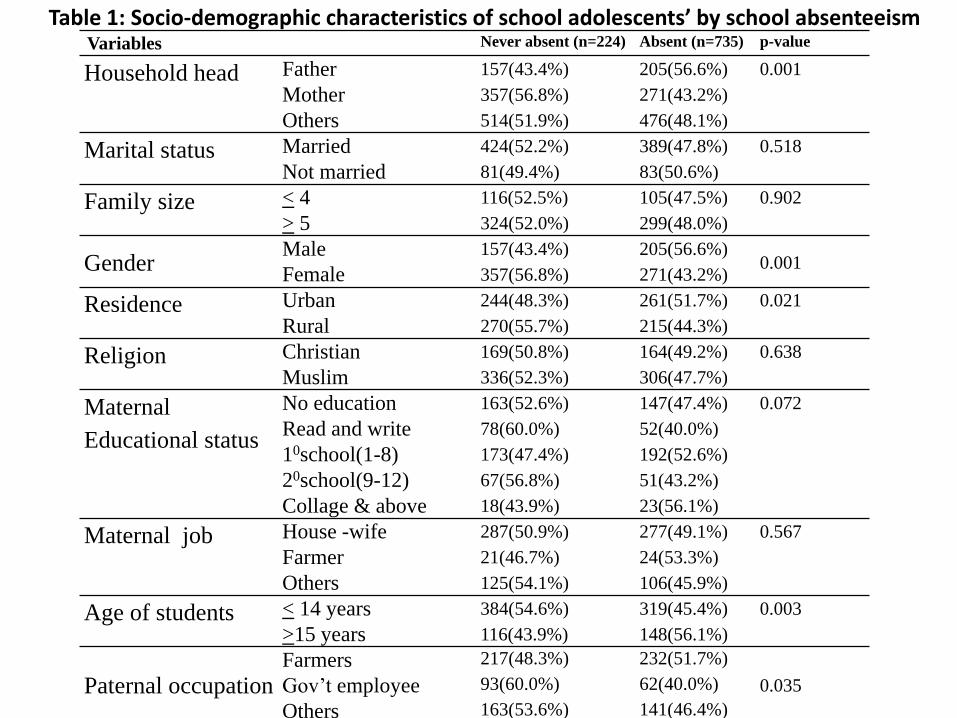
Variables Never absent (n=224) Absent (n=735) p-value
Household head Father 157(43.4%) 205(56.6%) 0.001
Mother 357(56.8%) 271(43.2%)
Others 514(51.9%) 476(48.1%)
Marital status Married 424(52.2%) 389(47.8%) 0.518
Not married 81(49.4%) 83(50.6%)
Family size < 4 116(52.5%) 105(47.5%) 0.902
> 5 324(52.0%) 299(48.0%)
Gender Male
Female
157(43.4%)
357(56.8%)
205(56.6%)
271(43.2%)0.001
Residence Urban 244(48.3%) 261(51.7%) 0.021
Rural 270(55.7%) 215(44.3%)
Religion Christian 169(50.8%) 164(49.2%) 0.638
Muslim 336(52.3%) 306(47.7%)
Maternal
Educational status
No education 163(52.6%) 147(47.4%) 0.072
Read and write 78(60.0%) 52(40.0%)
10school(1-8) 173(47.4%) 192(52.6%)
20school(9-12) 67(56.8%) 51(43.2%)
Collage & above 18(43.9%) 23(56.1%)
Maternal job House -wife 287(50.9%) 277(49.1%) 0.567
Farmer 21(46.7%) 24(53.3%)
Others 125(54.1%) 106(45.9%)
Age of students < 14 years 384(54.6%) 319(45.4%) 0.003
>15 years 116(43.9%) 148(56.1%)
Paternal occupation Farmers 217(48.3%) 232(51.7%)
Gov’t employee 93(60.0%) 62(40.0%) 0.035
Others 163(53.6%) 141(46.4%)
Table 1: Socio-demographic characteristics of school adolescents’ by school absenteeism
…cont’d
• Frequency of school absenteeism is significantly high among food
insecure when compared to food secure adolescents (<0.001) (Fig.1).
• Studies from Venezuela and others also showed food insecurity
affects school activity and academic performance which are the
common predictors of school absenteeism (9, 10).
• A large proportion (56.06%) of food secure adolescent were never
absent compared to 40.49% of food insecure adolescents.

40.49
50.20
9.31
56.06
37.89
6.06
0
10
20
30
40
50
60
Never absent 1-3 weeks 4 weeks & above
Number of school absenteeism
Food insecure
Food secure
Fig.1: Frequency of school absenteeism by food insecurity among school adolescents in
Jimma zone, Ethiopia
…cont’d
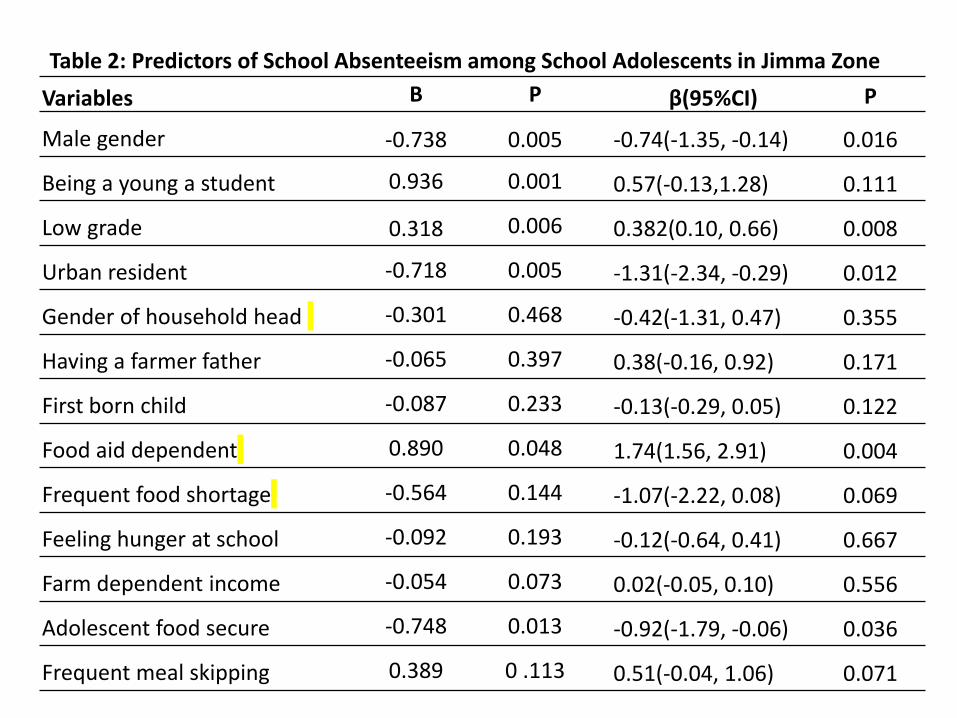
• Bivariate linear regression models showed being a male (p<0.001), urban residence (p<0.01) and household food secure (p<0.01) was negatively associated with school absenteeism.
• However, being a young a student (p<0.01), low grade (p<0.01) and food aid dependency (p<0.05) was positively associated with school absenteeism.
…cont’d• Males are less absent [-0.74(-1.35, -0.14), p=0.016]
– This might due to cultural constraints which enforced the females to take responsibilities of house work and child care.
• Compared to rural, urban adolescent were less absent [-1.31(-2.34, -0.29), p=0.012]
– This might be due to gender-based violence and wrong perception of about disabled children and females.
• Adolescent those were food secure [-0.92(-1.79, -0.06), p=0.036] were less absent compared to food insecure one
– Similar studies in Jimma zone showed there is strong relationship b/n food security and school absenteeism

…cont’d
• Young and low grade students had more records of school absenteeism than their counterparties[0.382(0.10, 0.66), p=0.008]
– Studies from US and UK also showed food-insufficient teenagers have been more suspended from school compared to food secure students(9, 10) .
Variables B P β(95%CI) P
Male gender -0.738 0.005 -0.74(-1.35, -0.14) 0.016
Being a young a student 0.936 0.001 0.57(-0.13,1.28) 0.111
Low grade 0.318 0.006 0.382(0.10, 0.66) 0.008
Urban resident -0.718 0.005 -1.31(-2.34, -0.29) 0.012
Gender of household head -0.301 0.468 -0.42(-1.31, 0.47) 0.355
Having a farmer father -0.065 0.397 0.38(-0.16, 0.92) 0.171
First born child -0.087 0.233 -0.13(-0.29, 0.05) 0.122
Food aid dependent 0.890 0.048 1.74(1.56, 2.91) 0.004
Frequent food shortage -0.564 0.144 -1.07(-2.22, 0.08) 0.069
Feeling hunger at school -0.092 0.193 -0.12(-0.64, 0.41) 0.667
Farm dependent income -0.054 0.073 0.02(-0.05, 0.10) 0.556
Adolescent food secure -0.748 0.013 -0.92(-1.79, -0.06) 0.036
Frequent meal skipping 0.389 0 .113 0.51(-0.04, 1.06) 0.071
Table 2: Predictors of School Absenteeism among School Adolescents in Jimma Zone

…cont’d
• Compared to who are living with their family, adolescents who are living separately were more food insecure [AOR=3.35(1.89, 5.94)].
– Studies from Kenya also showed children who have no family were more vulnerable to food insecurity than non-orphans (10).
• Adolescents whose family had livestock were 80% [AOR=0.20 (0.06, 0.70)] less food insecure compared to those who had no livestock.
– The study from Pakistan Haiti showed the incidence of poverty is less among those who have livestock (8, 9).

…cont’d• Poor economic status was also significantly associated [AOR=1.46
(1.21, 1.98)] with adolescent food insecurity.
– Studies showed food consumption results from a multi-factorial behaviour influenced by availability and affordability of the food and eating habits (5, 6).
• Adolescent whose mothers had no education were 96% more food insecure [AOR=5.96(1.04, 16.67)] compared to whose mothers attended college and above.
– Studies from Nigeria & many African countries showed maternal education have strong relationship with food security (6, 7).
– Educational status of women clearly has an essential element to reduce rural food insecurity.

Table 3: Factors associated with food insecurity among school adolescents in Jimma zone, Ethiopia
Variables
Food Security Status
Food insecure Food secure
COR( 95% CI ) P value AOR( 95% CI ) P-value
Household head Father 1.24(.660, 2.28) 0.217 0.57(0.16, 2.06) 0.387
Mother 0.84(0.42, 1.69) 0.122 0.47(0.13, 1.89) 0.287
Others 1 1
Type of life Not with family 2.84(2.09, 3.86) 0.001 3.35(1.89, 5.94) 0.001
Live with family 1 1
Having livestock Yes 0.73(0.54, 0.98) 0.039 0.20(0.06, 0.70) 0.001
No 1 1
Life situation Family support 0.06(0.03, 0.10) 0.001 0.13(0.01, 0.06) 0.001
Self-support 1 1
Maternal education
No education 0.95 (0.53, 0.29) 0.032 5.96(1.04, 16.67) 0.001
Can read and write 1.53 (0.83, 0.45) 0.153 5.16(1.38, 25.70) 0.001
Primary school(1-8) 1.56 (0.93, 0.55) 0.770 5.18(1.49, 22.33) 0.001
Secondary school (9-12) 2.07 (1.15, 0.63) 0.650 5.15(1.41, 24.32) 0.01
Collage and above 1 1
Maternal occupation
Farmers 1.18(.83, 1.68) 0.364 1.21(0.62, 2.37) 0.574
Government employee 0.61(.31, 1.19) 0.145 2.20(0.60, 8.06) 0.233
Others 1 1
Family size < 4 0.78(0.55, 1.10) 0.152 0.98(0.54, 1.77) 0.945
> 5 1 1
Frequent illness Yes 1.98(1.45, 2.70) 0.001 1.43(0.82,2.49) 0.213
No 1 1
Type of house
Self-build house 1.81(1.13, 2.90) 0.014 1.60(0.57, 4.55) 0.374
Government house 1.31(0.74, 2.31) 0.350 1.39(0.48, 4.03) 0.550
Rented from individual 1 1
Gender Male 0.94 (0.69, 1.26) 0.116 1.09(0.65, 1.84) 0.744
Female 1 1
Residence Urban 0.95(0.71, 1.27) 0.114 2.50(0.64, 9.79), 0.194
Rural 1 1
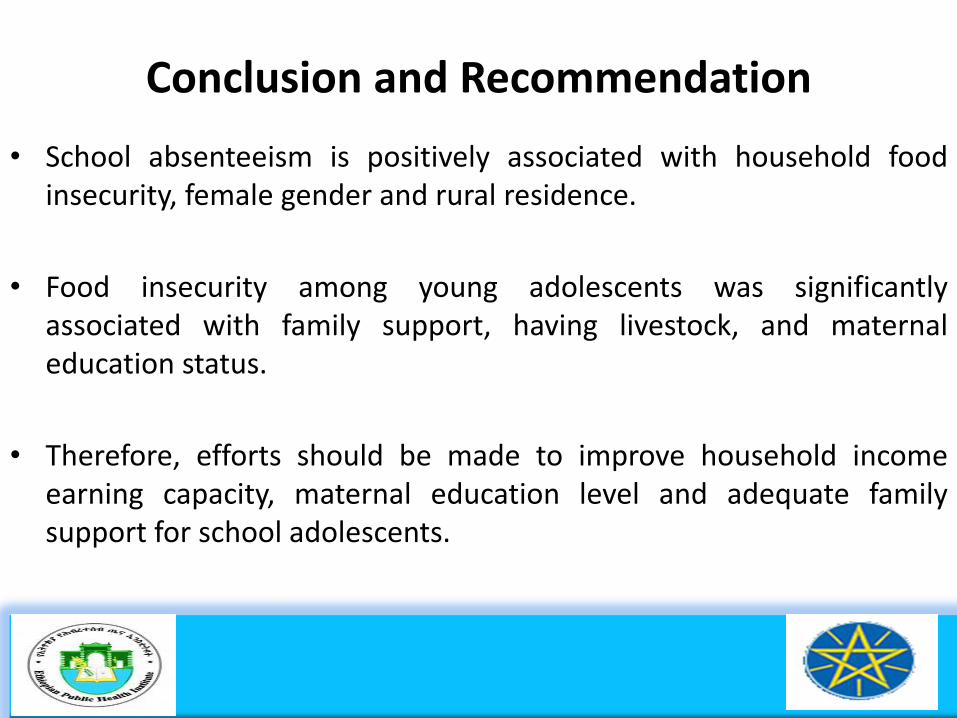
Conclusion and Recommendation
• School absenteeism is positively associated with household foodinsecurity, female gender and rural residence.
• Food insecurity among young adolescents was significantlyassociated with family support, having livestock, and maternaleducation status.
• Therefore, efforts should be made to improve household incomeearning capacity, maternal education level and adequate familysupport for school adolescents.
References 1. FAO.2013. The State of Food Insecurity in the World: The multiple dimensions of food
security, Rome
2. Levinger B. 1992. Nutrition, health, and learning: Current issues and trends. School Nutrition and Health Network Monograph Series, #1.
3. Winicki J, Jemison K. 2003. Food insecurity and hunger in the kindergarten classroom: Its effects on learning and growth. Cont. Eco. Policy 21(2):145-157.
4. Hadley C. et al. Rapidly rising food prices and the experience of food insecurity in urban Ethiopia: Impacts on health and well-being. SocSci Med. 2012 Sep 26.
5. WHO. 2013. The Status of Poverty and Food Security in Egypt: Analysis and Policy Recommendations, Cairo, Egypt
6. UN Economic and Social Council. 2012. Status of Food Security in Africa, Addis Ababa
7. Ajao et al. 2010. Influence of Family Size, Household Food Security Status, and Child Care Practices on the Nutritional Status of U5. Nigeria Africa5. Jour. of Repro. Health 14(4):123
8. A. Ali and M. A. Khan. 2013. Livestock Ownership in Ensuring Rural Household Food Security in Pakistan. The Jour of Animal & Plant Sciences, 23(1): 313-318
9. Christelle et al. 2010. Food Insecurity: Could school food supplementation help break cycles of intergenerational transmission of social inequalities? Ped.;126:1174–1181
10. Diana F et al. 2005.Food Insecurity Affects School Children’s Academic Performance, Weight Gain, and Social Skills. J. Nutr. 135: 2831–2839

Acknowledgement
• The authors would like to express their sincere gratitude to the Jimma University and Ethiopian Public Health Institute for facilitating the study
• Study participants for their diligence and dedication in collecting and inputting a high quality data used for the study.