school culture and leadership: teacher perceptions of
TRANSCRIPT

East Tennessee State UniversityDigital Commons @ East
Tennessee State University
Electronic Theses and Dissertations Student Works
5-2013
School Culture and Leadership: TeacherPerceptions of Title I and Non-Title I SchoolsKrista R. CrumEast Tennessee State University
Follow this and additional works at: https://dc.etsu.edu/etd
Part of the Education Commons
This Dissertation - Open Access is brought to you for free and open access by the Student Works at Digital Commons @ East Tennessee StateUniversity. It has been accepted for inclusion in Electronic Theses and Dissertations by an authorized administrator of Digital Commons @ EastTennessee State University. For more information, please contact [email protected].
Recommended CitationCrum, Krista R., "School Culture and Leadership: Teacher Perceptions of Title I and Non-Title I Schools" (2013). Electronic Thesesand Dissertations. Paper 1153. https://dc.etsu.edu/etd/1153

School Culture and Leadership: Teacher Perceptions in Title I and Non-Title I Schools
______________________________
A dissertation
presented to
the faculty of the Department of Educational Leadership and Policy Analysis
East Tennessee State University
In partial fulfillment
of the requirements for the degree
Doctor of Education in
Educational Leadership
______________________________
by
Krista Galea Rose Crum
May 2013
______________________________
Dr. Virginia Foley, Chair
Dr. Cecil Blankenship
Dr. Donald Good
Dr. Pamela Scott
Keywords: Leadership, Morale, Non-Title I, Poverty, School Culture, Title I

2
ABSTRACT
School Culture and Leadership: Teacher Perceptions of Title I and Non-Title I Schools
by
Krista Galea Rose Crum
This study was conducted to see if teachers perceive a significant difference in school
culture and leadership in Title I and non-Title I schools. Specifically, this researcher
considered the possibility that teachers working in Title I schools have lower perceptions
of their school’s culture and leadership than teachers working in non-Title I schools. A
quantitative study was used to find the perceived differences between school culture
and leadership in Title I and non-Title I schools. A quasi-experimental design was
selected because preexisting data were collected on teachers in an upper East
Tennessee region. The data were collected from the TELL Tennessee survey
conducted in 2011 by the Tennessee Department of Education. The TDOE contracted
with the New Teacher Center (NTC) to conduct the state’s survey. The NTC is a
national organization that has administered surveys in several states and is dedicated to
developing and supporting a quality teaching force. The TDOE compiled 8 constructs or
focus indicator areas for the survey, and 5 of the 8 indicators were used to determine
school culture and leadership. School culture indicators were compiled from the focus
questions of facilities and resources and community support. Leadership indicators
were compiled from focus questions of student conduct, school leadership, and

3
instructional practices and support. The population included teachers who taught in
public schools, Pre Kindergarten through 12th grade during the 2010 through 2011
school year. This study showed no significant difference in regard to teacher
perceptions of leadership in Title I and non-Title I schools in an upper East Tennessee
region. However the study did find a significant difference in regard to teacher
perceptions of school culture in Title I and non-Title I schools in the area of facilities and
resources. An examination of the group means indicates that Title I schools (M = .845,
SD = .120) had a significantly more positive perception of facilities and resources than
teachers in non-Title I schools (M = .786, SD = .149).

4
DEDICATION
Jeff, I thank you for always standing beside me, for your support, love and
encouragement that motivated me to continue this long arduous journey. I have loved
you since the first day I saw you and no other person could set a better example of
honor, honesty, and respect. Thank you for the laughter that I have enjoyed and the
irreplaceable memories.
To Rachel and Aaron who have endured having a mother who was a student
during your entire childhood, I say thank you for cheering me through all five degrees
that we as a family earned together. I love you both and pray that I have set an
example for you to continue to improve your lives with knowledge and determination.
To my mother, Connie Rose, thank you for showing me your strength. I have
grown up with the most wonderful memories a girl could have and will be forever
grateful to you for making me feel loved every day of my life. Although Dad is not here
to see me graduate, I cherish the thought that he would be proud. I am so blessed to
have called you both my parents and consider it an honor to be your daughter.
To Delbert and Linda Crum, I appreciate the love and support that you provided
throughout my education. Thank you for the car to drive to class, encouraging me, and
allowing me to be a part of your family.

5
ACKNOWLEDGEMENTS
I would like to acknowledge the time and efforts of my graduate committee
members: Dr. Virginia Foley, Dr. Pamela Scott, Dr. Donald Good, and Dr. Cecil
Blankenship. Dr. Foley, I especially thank you for throwing me a rope when I had fallen
into a deep dark pit with my writing. I have come to appreciate the amount of time and
dedication that it takes for you to assist a student through this process. You make me
proud to be a part of the East Tennessee State University family.
I would also like to acknowledge the Hamblen County Cohort members: Janet
Dalton, Kim Dyke, Amy Hall, Christy Hogan-Young, Jeff “Math Man” Kinsler, Tony
Dalton, and joining for the finish line, Paula Davis and B.J. Lowe. I am thankful for your
encouragement, accountability, and the laughs we shared through this journey.
I would also like to acknowledge the support that I received from the Hamblen
County Director of Schools, Dr. Dale Lynch, for making this a priority on my list of goals
as an administrator. To Dr. Brenda Dean, Assistant Director of Schools in Hamblen
County, thank you for supporting me as a leader and encouraging me to keep writing.
To Mr. Hugh Clement, Assistant Director of Schools and all of my Hamblen County
family, I sincerely appreciate that you were in my balcony.
To Bill Harrison, I would like to acknowledge and say thank you for taking a
chance on a coal miner’s daughter so many years ago and for training me to be a
competent leader. You have built a legacy of fine administrators in Hamblen County
and I am so thankful that you were there to encourage me to reach my potential so that
I could be included in the legacy.

6
I would also like to acknowledge the first Dissertation Boot Camp team that
volunteered their time to reenergize those of us who were ready to quit the race. The
encouragement and workshops were just what was needed to help me to cross the
finish line.
Finally, I would like to thank the bountiful number of students I have had the
pleasure to work with during my educational career. I have learned so much from you;
please know that you have been the illumination in my career.

7
TABLE OF CONTENTS
Page
ABSTRACT …………………………………………………………………………....... . 2
DEDICATION ......................................................................................................... 4
ACKNOWLEDGMENTS ………………………………………………………………… 5
LIST OF FIGURES ................................................................................................. 10
Chapter
1. INTRODUCTION ............................................................................................. 11
Statement of the Problem ............................................................................. 15
Research Questions ..................................................................................... 16
Significance of the Study .............................................................................. 16
Limitations .................................................................................................... 17
Definition of Terms ....................................................................................... 18
Overview of the Study .................................................................................. 19
2. LITERATURE REVIEW .................................................................................. 21
Introduction ................................................................................................... 21
School Culture …………………………………………………………………… 23
Leadership……………………………………………………………………….. . 28
Poverty………………………………………………………………………….. ... 33
Summary ………………………………………………………………………… 37
3. RESEARCH METHODOLOGY ....................................................................... 38
Introduction .................................................................................................. 38
Research Questions and Null Hypotheses ................................................... 38
Research Question #1 ............................................................................ 39
Research Question #2 ............................................................................ 39

8
Research Question #3 ............................................................................ 39
Research Question #4 ……………………………………………………… 39
Research Question #5 ............................................................................ 40
Population .................................................................................................... 40
Instrumentation ............................................................................................. 40
Data Collection ............................................................................................. 42
Data Analysis ................................................................................................ 42
Summary ...................................................................................................... 42
4. ANALYSIS OF DATA ...................................................................................... 44
Analysis of Research Data .......................................................................... 44
Research Question #1 ........................................................................... 44
Research Question #2 ............................................................................ 46
Research Question #3 ............................................................................ 47
Research Question #4 ............................................................................ 49
Research Question #5 ............................................................................ 50
Summary ...................................................................................................... 52
5. SUMMARY, CONCLUSIONS, AND RECOMMENDATIONS FOR FURTHER
RESEARCH .................................................................................................... 53
Summary of Results .................................................................................... 53
Research Questions and Findings .......................................................... 54
Research Question #1 ........................................................................... 54
Research Question #2 ............................................................................ 54
Research Question #3 ............................................................................ 55
Research Question #4 ............................................................................ 55
Research Question #5 ............................................................................ 56
Conclusions .................................................................................................. 56
Recommendations for Practice ..................................................................... 57

9
Recommendations for Further Research ...................................................... 59
Summary ...................................................................................................... 59
REFERENCES ........................................................................................................ 61
APPENDICES ......................................................................................................... 67
Appendix A: IRB Form ................................................................................. 67
Appendix B: IRB Approval ………….. ........................................................... 69
Appendix C: TELL Tennessee Survey Questions Determining Teacher
Perceptions in Regard to Facilities and Resources ..................................... 70
Appendix D: TELL Tennessee Survey Questions Determining Teacher
Perceptions of School Culture in Regard to Community Support and
Involvement .................................................................................................. 71
Appendix E: TELL Tennessee Survey Questions Determining Teacher
Perceptions of School Culture in Regard to Managing Student Conduct ..... 72
Appendix F: TELL Tennessee Survey Questions Determining Teacher
Perceptions of Leadership in Regard to School Leadership ......................... 73
Appendix G: TELL Tennessee Survey Questions Determining Teacher
Perceptions of Leadership in Regard to Instructional Practices and Support 74
VITA ……………………………………………………………………………………… 75

10
LIST OF FIGURES
Figure Page
1. 95% Confidence Intervals for Teacher Perceptions of Student Behavior
Management………………………………………………………………… 45
2. 95% Confidence Intervals for Teacher Perceptions of School Leadership… 47
3. 95% Confidence Intervals for Teacher Perceptions of Instructional Practices
and Support ……………………………………………………………………… 49
4. 95% Confidence Intervals for Teacher Perceptions of Facilities and
Resource ………………………………………………………………………… 51
5. 95% Confidence Intervals for Teacher Perceptions of Community Support and
Involvement …………………………………………………………………………. 52

11
CHAPTER 1
INTRODUCTION
An extremely dark room with no windows can be changed in a short time when a
sliver of light filters through a small crack creating a magnificent illumination. The same
can be relative when examining school culture and leadership. A teacher’s perception
may depend on the darkness of the school’s culture or how well the leadership
illuminates. Perception is built on prior experiences and the words a leader says is very
important to understanding. What people feel is the truth is what people perceive
(Whitaker, 2009). Studies have been conducted in an effort to determine the secret to
improving school culture and leadership, but few can be found that probe into
comparing the two in schools based on poverty levels.
Teachers working in Title I or non-Title I school situations are subject to the same
pressures of demanding teacher evaluations, raising test scores, and changes in state
standards. The United States Department of Education recognizes a school as Title I if
75% or more of the students receive free or reduced priced lunches. A school would not
be eligible for Title I status and considered Non-Title I if 35% or fewer students receive
free or reduced priced lunch (Gil, 2008). A family of four with earnings of $23,550 would
be considered as living in poverty. High poverty schools are eligible for additional
assistance from the government’s Title I Improving the Academic Achievement of the
Disadvantaged program. President Lyndon B. Johnson signed the Elementary and
Secondary Education Act (ESEA) on April 9, 1965 in an effort to combat the war on
poverty. In Section 1001 of an amendment to the ESEA, one purpose of Title I is to
meet the educational needs of low achieving children in our country’s highest poverty

12
schools, children who are neglected, migratory, limited English proficient, have
disabilities, Indian children, and children in need of reading assistance (U.S.
Department of Education, 2004). The purpose of ESEA was better educational services
that would improve academic performance for students from low socioeconomic status
(SES) families and lift the poor from poverty. The ESEA has been reauthorized nine
times, the most recent when President George W. Bush signed the No Child Left
Behind Act (NCLB) on January 8, 2002. The NCLB focused on closing the achievement
gap and additional accountability, choice, and flexibility, leaving “no child behind.” NCLB
stipulates that Adequate Yearly Progress (AYP) must be made on standardized tests in
all subgroups. If Title I schools do not meet AYP for 2 years in regard to the NCLB
stipulations, the school is placed in a priority status of school improvement.
Teachers working in Title I schools deal with many children who come to school
hungry. Hungry children are in a survival mode that prioritizes a meal as more important
than schoolwork. Teachers in low poverty, non-Title I schools may have more students
arriving at school ready to learn because there are more support and resources at
home. Therefore, teachers in schools that are low poverty or non-Title I face different
obstacles than teachers in high poverty or Title I schools. Educators are challenged to
be insistent, supportive, and expect more without excuse in order to promote successful
students. Education and relationships are the two avenues out of poverty, and students
need to be taught to find those avenues (Payne, 2005). These extra challenges are
additional strains on a school’s culture as well as the administration. Influences of
poverty can weigh heavily on an administrator and the mood of a school, thus,

13
leadership and school culture must be considered when piecing together the puzzle of
school reform.
A change in school culture and leadership often comes on the heels of
educational reform. Change in the public educational system of Tennessee was
impacted when the state was awarded a large sum of money with the Race to the Top
(RTTT) grant. The United States Department of Education, as part of the American
Recovery and Reinvestment Act of 2009, awarded the states of Tennessee and
Delaware the first two grants in the four billion dollar RTTT grant in March 2010. The
grant was based on four key areas: preparing students for success from college to
career, developing data systems that aptly measure student success and how to
improve performance, recruiting and retaining the best teachers and principals and
placing them where they are needed most, and turning around the lowest performing
schools. Tennessee was awarded 501 million dollars for the competition and Governor
Bill Haslam publically announced the new motto for the state as “First to the Top” (FTT)
(ED.gov.2012). The grant brought additional funds to the state in hopes of moving
Tennessee closer to the top in the national education quality rankings. The FTT
program has completed a year of implementation, from 2010 to 2011, and has shown
improvement. Tennessee moved in national ranking of educational quality from 23 in
2011 to 21 in 2012, according to a report from the Education Research Center (Hardy,
2012).
The RTTT grant could be seen as another attempt to reform education.
Understanding the requirements of RTTT could bring educators new challenges such as
a change in teacher evaluations and prompt return of test scores to schools.

14
Administrators must evaluate all teachers a minimum of four times, pre- and
postconference with teachers about performance and do a professionalism evaluation
during the last 6 weeks of the school year. The state developed a rubric to gauge
teacher performance. Numbers of 1 to 5 with 5 showing above expectations are
assigned to the teacher. Pretenured teachers must score an overall of 4 or 5 to
maintain tenure. Distrust and fear has frustrated educators, potentially damaging the
morale and atmosphere in schools. This frustration influenced changes in the second
year of the new process and the state now allows sections of the evaluation to be
combined (Winerip, 2011). Kevin S. Huffman, Tennessee’s education commissioner,
and Governor Haslam continue to review policies and listen to feedback. Teachers and
administrators were surveyed and the feedback used to improve policies. The Teaching,
Empowering, Leading, and Learning (TELL) Tennessee survey was conducted in 2011
to give an opportunity for educators to be heard and to measure the current learning
conditions, environment, support, and resources. The TELL Tennessee survey was
developed as part of Tennessee’s First to the Top initiative. The survey will be used
collect data from Tennessee educators again in 2013 (Haslam, 2011). Critics of the
grant and survey may posit that the responses were gathered too early in the
implementation of Race to the Top and the second round of questions may prove to be
more realistic. In either instance this survey, unique to Tennessee, could prove to be
valuable to school districts for planning school improvement and assessing school
culture and leadership effectiveness.
15
Statement of the Problem
The purpose of this quantitative study was to determine whether a significant
difference in teacher perceptions of school culture and leadership exists between
teachers working in high poverty Title I schools and those working in low poverty non-
Title I schools. The study was an examination of the results of the TELL Tennessee
Survey from an upper East Tennessee region to determine if significant differences
existed in teacher perceptions of leadership and school culture in Title I and non-Title I
schools.
Prior studies have indicated that high poverty schools are perceived as having
ineffective leadership, and depending upon where the school is located, views
surrounding school culture may assume that many students are working below grade
level (Collins, 2001). Anthropologists may categorize this as ethnocentrism.
Ethnocentrism is one type of perception where the culture of others is seen as less
important or not as natural as the culture the person observing (Northouse, 2007). Other
studies support the notion that dedicated teachers have strong personal feelings about
working in high poverty schools and are loyal, dedicated, and invested in supporting the
school’s leadership and continuously improving the school’s culture. School culture,
leadership, and poverty were reviewed to determine if a significant difference existed in
the perception of teachers working in Title I schools and non-Title I schools.

16
Research Questions
1. Is there a significant difference in teacher perceptions of student conduct
management as measured by the TELL Tennessee Survey between Title I and
non-Title I schools?
2. Is there a significant difference in teacher perceptions of school leadership as
determined by the TELL Tennessee Survey in the areas between Title I schools
and non-Title I schools?
3. Is there a significant difference in teacher perceptions of instructional practices
and support as determined by the TELL Tennessee Survey between Title I and
non-Title I schools?
4. Is there a significant difference in teacher perceptions of facilities and resources
as determined by the TELL Tennessee Survey between Title I and non-Title I
schools?
5. Is there a significant difference in teacher perceptions of community support and
involvement as determined by the TELL Tennessee Survey between Title I and
non-Title I schools?
Significance of the Study
Historically, the teaching profession was one of respect. Changes in family
dynamics, the economy, and educational reform may have lessened that perception.
Human nature indicates a need to feel valued and respected in society. The face of a
school’s culture often depends upon how it is observed. To an outsider or someone not
in the business of education, the perception of a school’s culture may be based on

17
location, facilities, and available resources. A school located in a high poverty area may
appear less effective than one located in an affluent neighborhood. Educators know
that schools are ever changing with each attempt to reform public schools and that
affects school culture and leadership. School administrators know that in order to
maintain a positive perception of a school there must be a healthy school culture while
lending support to the faculty with managing student conduct, instructional practices,
and strong school leadership. Therefore, faculty and administration must collaborate to
identify the most challenging issues bearing down on cultural change (Delaney, 2012).
Society and stakeholders need to understand the impact of poverty on student
outcomes and the influence of school culture and leadership when making decisions of
how to support education. It is vital that school administrators are aware of the
connections among poverty, school culture, and their personal leadership. As noted
earlier, several researchers have explored school culture and leadership. However,
more in-depth exploration of school culture and leadership in Title I and non-Title I
schools may be helpful in shaping future school reform.
Limitations
This study has limitations that are considered for future researchers. The original
design of the TELL Tennessee survey was intended to seek perceptions of teachers in
all public schools in the state of Tennessee. This study was a comparison of the
perceptions of teachers in Title I schools and non-Title I schools in an upper East
Tennessee region.

18
1. A potential limitation of this study is a lack of data collected on this
topic. The TELL Tennessee Survey required at least 51% of each
school’s faculty to respond before results were included in the data and
only one survey exists at the time of this study. Therefore, one survey
limits the data available to researchers.
2. The number of years of experience in a Title I school or non-Title I
school was not known, which may have impacted results.
Definition of Terms
The following terms or phrases were defined to assist the reader in a better
understanding of this dissertation.
1. Leadership
Process whereby an individual influences a group of individuals to achieve a
common goal (Northouse, 2007).
2. Morale
The mental and emotional conditions with regard to a task or goal to be
accomplished. A sense of common purpose with respect to a group or the
degree of mental or moral confidence of a person or group; spirit of optimism
(Merriam-Webster Dictionary, 2007).
3. Non-Title I
Schools where 35% or fewer students receive free or reduced priced lunches
(Gil, 2008).

19
4. Poverty
A certain level of income relative to a family size. A family of four earning less
than $28,665 would be considered at poverty level and students would be eligible
for free meals (Parrett & Budge, 2012).
5. School Culture
The shared beliefs and priorities that drive the thinking and actions of
stakeholders within a school community (Dorsey, 2008).
6. TELL Tennessee Survey
The Teaching, Empowering, Leading, and Learning Survey is an online survey
conducted in the state of Tennessee that measures the perceptions of teachers
in public schools of their working environment.
7. Title I
A classification based on the number of students who receive free or reduced
priced lunches. Requirements vary from state to state (Gil, 2008).
Overview of the Study
This quantitative study analyzed the differences between Title I and non-Title I
schools of teacher perceptions on school culture and leadership. Chapter 1 presents
the introduction to the dissertation topic, the purpose of the study, and the research
questions.
Chapter 2 is a review of the current literature on differences in Title I schools and
non-Title I schools. The literature covers topics relevant to the dissertation. Topics
include leadership, school culture, and poverty.

20
Chapter 3 provides the methodology for the research. The methodology includes
research questions, the source of the data, the collection method used for the data, data
analysis method, and ethical considerations. The methodology included gathering data
from an upper East Tennessee school region that included 155 schools from 17 school
districts. There were 115 Title I schools and 40 non-Title I schools. There were 5,361
teachers responding to the survey in the upper East Tennessee school region.
Chapter 4 presents the analysis of data. Chapter 5 summarizes the findings and
offers recommendations for practice and additional research.
This study addressed the teacher perceptions of school culture and leadership in
Title I and non-Title I schools. Comparisons were made in regard to facilities and
resources, community support, management of student conduct, and school leadership.

21
CHAPTER 2
LITERATURE REVIEW
Introduction
Leadership and school culture are recognized as two of the most important
factors in schools regardless of poverty level. Leaders must light the fire and the
passion within the staff in a school. Teachers who have an excitement about their jobs
and school and consider it an invigorating place to practice their chosen profession build
a strong school culture (Whitaker, 2009). Leadership in any type of school is one of the
most important aspects. In the 21st century principals must analyze more data, be a
master of management, face new discipline problems that relate to technology and
social media, and repair teacher morale issues because of the demands of more
rigorous teacher evaluation models (Price, 2012). Hoy and Miskel (2008) deducted
from leadership studies through the years that certain traits and skills are associated
with effective leadership. A leader who builds relationships may be the most effective.
Seifert and Vornberg (2003) submitted that school culture is "the interaction
among the following factors: attitudes and beliefs held by stakeholders inside and
outside the organization; cultural norms of the school; and the relationships among
individuals in the school" (p. 86). The culture of an organization shapes and molds
assumptions and perceptions that are essential to comprehending what it means to be
an educator (Owens, 2004). Stakeholders have a responsibility to uphold the values of
education.

22
Historically, school culture and leadership have been examined using several
theoretical views. Smith and Riley (2009) surmised that school culture embodies
leadership, environmental conditions, and morale. In the earliest years culture referred
to cultivating crops or animals, or religious worship, hence the term cult. After the 16th
and into the 19th century, culture became more about the improvement of the human
mind and personal life. Later it evolved into a more spiritual improvement. The term
was often used to describe those with higher moral stature. Smith and Riley reported
the scrutiny of culture by theorists such as Karl Marx and Max Weber. Marx rebelled
against idealism and connected culture to economic life and power. Weber embraced
idealism and consented that life was about freedom, replacing life’s sense of purpose
trapping people in an iron cage of bureaucracy and rationalism. John Dewey related
that the body is born into an environment that is cultured or civilized and becomes so
due to educational talents as a transitional process (as cited in Alexander, 1987). More
recently school culture has surfaced as an important area to be included in research.
With the transitional phase of national educational standards, some believe that a global
school culture in the future with world standards (Anderson-Levitt, 2003).
Leadership has been a staple of historical theories. Leadership involves
influence. Leadership is not about coercion but about those who influence a group of
individuals to move to a common goal. Leadership is often confused with management,
which emerged during the advent of industrialized society around the turn of the 20th
century (Hoy & Miskel, 2008). Hoy and Miskel noted that leadership can be traced back
to Aristotle. They also conceptualize that leadership can be examined from viewpoints
of power relationships, as a transformational process, or from a skills perspective.

23
Fleishman and Hunt (1973) maintained that in 60 years there have been 65 different
classifications of leadership. Gill upheld that one definition of leadership from the 1920s
maintains that it is an ability to sway others into obedient and loyal cooperation and
continues that this definition is not viable in today’s view of leadership (Gill, 2011).
School culture and leadership are enveloped by morale. Morale as a word
entered English usage in the 1830s and mainly focused on aspects of honor and
discipline in the military. There were factors involving morale issues and determining
origins of internal or external, positive and negative effects of morale (Corvisier, 1994).
In 2008 Watson questioned what constituted morale during The Great War. He
researched a soldier’s resilience and combat motivation and found that soldiers with an
innate ability to endure hardship were more likely to not become a casualty or combat-
ineffective. An outcome of either was detrimental to the war effort. Soldiers who rob the
dead or loot from abandoned homes in the name of war commit unethical actions.
Unethical behaviors breed mistrust and have an effect on morale. Soldiers, companies,
and educators have similarities found in the historical aspects of morale. Losing a war,
life savings, or having test scores that are low are variables that may damage the
perceived morale of a soldier, company employee, or teacher.
School Culture
School culture is multifaceted in nature and has the ability to influence all aspects
of the organization. Teachers need to feel included and supported. Teacher job
satisfaction improves when the culture of the school supports active involvement and
decision making. Reeves stated, "Meaningful school improvement begins with cultural

24
change and cultural change begins with the school leader" (as cited in Ebolt & Fulton,
2008 p. 92). Today's principals are active change agents in light of accountability
standards. Principals must ensure that schools' goals align with the mission for school
improvement. Changing school culture, especially in high poverty schools, is a difficult
task and requires teachers and leaders to change their mindset (Parrett & Budge,
2012). School culture is built on trust and good training. If the staff knows what is
expected and how to do it, then a sense of freedom and innovation is released, trust
develops and the school’s culture is stronger (Gray & Streshly, 2008). In Native
American reservations, hostile cultural attitudes toward education are seen as a way to
erase or subsume indigenous cultural values. The history of our inner cities, our
treatment of minorities and the poor, leads to a deficit of trust in mainstream cultural
institutions. This is a major hurdle for educators (Kain, 2011).
According to Gladwell (2008), there are many outliers that could have an impact
on outcome and one could be culture. He suggested that a prediction could be made
as to which countries are best in math ability by knowing which ones place the highest
emphasis on hard work and effort. Gladwell listed five countries that have in common a
culture shaped by meaningful hard work and wet-rice agriculture, China (Taiwan), Hong
Kong, Japan, Singapore, and South Korea. Students with the ability to concentrate and
sit still long enough to answer more than 100 tedious test questions are the ones who
do the best job with solving math problems. Northouse (2007) reported that the
research done by Hofstede on the dimensions of culture are the most referenced. He
states the five major dimensions on which culture differs identified by Hofstede as
power distance, uncertainty avoidance, institutional collectivism, masculinity-femininity,

25
and long- and short-term orientation. Power distance creates levels between people
based on power, authority, and possessions. Uncertainty avoidance is the degree that
groups rely on norms, procedures, or rituals in order to avoid uncertainty. Institutional
collectivism is how society encourages the broader interests of society instead of
individual accomplishments. The dimension of masculinity-femininity is a measurement
of how concerned society is with how biological sex determines the roles of members in
a household, organization, or community. Long-term and short-term orientation refers to
the extent to which people delay gratification, plan, or prepare for the future. In the
school culture setting, the dimension of masculinity-femininity can be seen in the sex of
the school leader or teacher leaders and the roles of leadership that emerge and
influence the school’s environment.
Maintaining a positive school culture by investing in human capital is a top priority
when leaders are asked to improve low performing schools, teacher morale, and do
more with less (Delaney, 2012). Protheroe (2006) suggested that maintaining high
teacher morale requires a principal’s support of high student learning and nurturing the
school environment. Without the proper school culture, even teachers who have an
admirable dedication may experience burnout. For educators who choose to stay and
teach in high poverty conditions, the job becomes both a liability and an asset when
they consider it extremely rewarding and deeply personal (Parrett & Budge, 2012).
Corporations that deceive the public, like Enron, can destroy faith and confidence.
Employee morale is based on the employees’ role in the workplace and how the
company is perceived. Although changing perceptions can be difficult, it can be
accomplished. Reality is not so easily changed. Any situation will find unhappy people

26
as well as those who exude eternal sunshine (Bramble, 2012). Low morale is
expensive (Fink, 2012). Fink reported that approximately 22 million employees are
disengaged from the American economy and are costing as much as $350 billion
dollars per year in lost productivity when considering absenteeism and other workplace
problems due to unhappy employees.
The education system has become very data driven. Technology brings into play
instant results of right and wrong answers for assessments. A recent study by MetLife
(2012) showed a marked decline in teacher morale nationwide that may be linked to
results on display from test scores and evaluations. Teachers who are behind in the
knowledge and use of technology may not embrace the colorful pie charts and rankings
that are available with the click of a mouse. The data force accountability from
individuals to whole districts in a state and could have an effect on morale. Teachers
may allow the low test scores to have a negative impact on their morale instead of using
those as an incentive to improve. The attitude about failure should be to look at it as a
detour to a much better outcome than could ever have been imagined (Gordon, 2011).
Effective teachers create a positive atmosphere in their schools and classrooms and
take a positive approach 10 days out of 10 (Whitaker, 2004).
Facilities and resources are important to teachers. The past 2 decades have
seen an increase in the use of technology in teaching practices and student academic
use. The primary use of technology in schools has shifted from teachers using a
computer to type lesson plans, class rosters, and notes home to parents to integrating
technology with curriculum and student interactive learning. The speed of the Internet
has gone from extremely slow dial up connection to high speed digital internet (Stronge,

27
2008). Effective school leaders realize the importance of providing the best technology
and resources available. Research confirms that a majority of teachers indicate that
technology affects their teaching (Ascione, 2005). Successful school leaders will
assess surroundings and support teachers by doing whatever is needed to make their
jobs easier and supply them with the proper resources (Green, 2009). Technology is
helpful to a teacher, but the actual facility is just as important to a teacher. Inventories
for assessing the school facilities would be useful to school leaders. Teachers spend a
great deal of time in the school building and have a better attitude about the workplace if
it is appealing and inviting (Whitaker, 2010). Schools in poor neighborhoods are often
lacking operable bathroom stalls, have dirty, roach infested buildings with outdated
learning materials, larger class sizes, and unhealthy conditions (Gorski, 2008). A
school leader is supportive to teachers by providing a clean, safe, and attractive
environment (Schmidt, 2002).
Another area important to a school’s culture is community support and
involvement. Schools that are supported by the community correlate with higher
grades, improved parent and teacher relationships, and student success (National
Education Association, 2008). Benefits of schools partnering with the surrounding
community can have a lasting impact. Valued community partners engage students in
future job opportunities, teach them how to be an active member of the community,
raise self-esteem, and connect schools with parents in a relaxed setting
(Afterschoolalliance.org, 2007). Community involvement is so important to schools that
serve urban and poor students. Together, schools and communities create a positive
and successful future for students. Tough areas are often disconnected and isolated

28
from current development and need the schools to provide the connection. A great
school is not enough to ensure success for a student (Jehl, 2007).
Leadership
A common perception of leadership denotes that it involves a social influence
process where an individual places intentional influence over others in order to build
activities or relationships in an organization or group, according to Hoy and Miskel
(2008). Hoy and Miskel also conceded that leadership should promote desired
outcomes, individual motivation, and shared orientations. Leadership requires impact
on others. Washington (2006) maintained that a leader may never know who will be
touched or impacted or how important an example of leadership will be to someone
else.
The ability of a leader to be competent in developing and maintaining a highly
effective team is important to prevent employee morale issues. Improving and
maintaining high employee morale is key to organizational success (Fink, 2012). Two
functions of leadership, sharing and distributing, reveal a spirit of reciprocity and
maintain a constant focus on the learning environment and learning. Fostering caring
relationships among peers, providing a safe and orderly workplace, and building a bond
between school and students creates leadership capacity (Parrett & Budge, 2012).
The change process developed by Kotter (1990) is a bridge into Transformational
Leadership. A new administrator placed in a position to bring about change may
implement the change with support from the staff. Kotter suggests that leaders create a
sense of urgency. A leader would need to have charisma in order to build a community

29
of trust and relay the importance of a task that has a deadline. A new administrator
could build trust by building relationships, showing concern and interest in the personal
aspects of a school team. Creating a vision for change is important. Painting a mental
picture would be a way to sell the idea. Share and build on the vision with everyone in
the organization, then find any shortcomings in the plan. A principal who needs to
improve math scores in the eighth grade finds the best math teacher in the building who
can motivate and inspire students to achieve. When change begins to occur and the
small goals are met, a leader will celebrate success. This forms a continuum for
motivation within the school and perseverance prevails to take the group to the finish
line.
Fullan (2006) encourages leaders not to get caught up in the vision. Over
planning can cause one to lose sight of the end. Leaders cannot forget their morals and
values. Leadership requires characteristics that can motivate change, invest in
relationships with followers, delegate jobs while factoring in strengths and weaknesses,
inspire followers with charisma and encouragement, and lead them through the process
with morals and values that build trust. Fullan’s secrets of change are to love them,
connect peers with a purpose, build capacity, be nonjudgmental, learn and work, be
transparent, and learn to get comfortable with being uncomfortable. Kotter (2012)
contradicts Fullan with the illustration of the importance of vision. He maintains that
vision is key to producing change. Kotter states that, “Without an appropriate vision, a
transformation effort can easily dissolve into a list of confusing, incompatible, and time
consuming projects that go in the wrong direction or nowhere at all (p.8).”

30
Transformational leadership changes and transforms people and finds a place in
hearts of great leaders. The influence that is required to change and transform people
must come from a charismatic person who is willing to go the distance for the greater
good of the people. Transformational leaders lead with kindness and encouragement. A
certain amount of faith is injected into the change process. Personal beliefs in the
vision would help to sell followers on a vision. Bennis and Thomas (2002) highlighted
the changes that occur in transformational leaders as crucibles. A crucible can be an
event, tragic or wonderful, that defines leaders. “Leaders create meaning out of events
and relationships that devastate non leaders” (p.17). Leaders do not see a life-
changing event as uncontrollable; they see it as a challenge or goal that must be
reached. “The crucible makes the individual see the world in a new light” (p. 107).
Other researchers maintained that it takes more than one event to determine
leadership. Leaders are most often developed by traits and skills (Hoy & Miskel, 2008).
Five personality traits are associated with effective leadership; self-confidence, stress
tolerance, emotional maturity, integrity, and extroversion. Self-confident leaders face
adversity with persistence and are more likely to set high goals for their followers and
themselves. A leader tolerant to stress tends to stay calm and makes good decisions.
Emotionally mature leaders are oriented to self-improvement, maintain cooperative
relationships with peers and subordinates, and have an accurate awareness of
shortcomings and strengths. Leaders with integrity are honest, responsible, and ethical.
Extroverted leaders are social, outgoing, and comfortable in groups. According to Hoy
and Miskel, approaching leadership from a trait perspective has a very effective record.
The skills approach of leadership demonstrates that technical, interpersonal, and

31
conceptual skills are most valuable for effective leaders. Technical skills may include
knowing the rules of the school, having the ability to manage budgets, interpreting test
results, and supervising. Interpersonal skills embody sensitivity, understanding attitudes
and feelings of others, and being considerate. Conceptual skills are cognitive skills that
involve understanding the organizational change process, thinking logically, and
communicating a vision for the organization. A case could be established for leaders
that are born with the innate ability to lead. Gladwell (2008) discusses the possibility
surrounding the Matthew Effect that is based on Matthew 25:29 in the Bible. He dispels
the notion that we deserve greatness and cling to an idea that success is due to
individual merit. Maxwell (2004) suggested that individuals look in the mirror and get to
know themselves, know that the most important relationship that can be established is
with one’s self, and realize that what is seen in the mirror is what others see.
Qualities that teachers expect in a leader are the ability to manage student
conduct and facilitating a school with high professional standards of instructional
practices and support. Research stresses that teachers want supportive leaders that
maintain affective discipline in a school and if discipline is not enforced a hostile feeling
arises (Kelly, 2012). The common thought of leaders concentrating on instruction and
not discipline is a myth and teachers should be supported with consistent discipline.
Students who are disruptive should be removed from the learning area and teachers
should be trained on correct procedures with handling discipline (Boyd, 2012).
Maximizing instruction in a classroom includes fewer discipline issues and having
support from school leaders. Classroom management is one of the most cited reasons
for teacher burnout and new teacher retention. Teachers are more confident and more

32
effective with classroom management if school leaders support them with professional
development and clear expectations of rules and procedures (Kratochwill, 2013).
Leaders who facilitate a school with instructional knowledge support the high
professional standards that are expected from quality teachers. Strong leaders are
effective organizational managers with the skills to raise student achievement,
challenge teachers to grow professionally, and remove or provide support to ineffective
teachers. Many school leaders spend around one third of their day dealing with
discipline and paperwork and must have the vision to fit the expanded version of an
instructional leader and leave behind the traditional leader (Horng & Loeb, 2010).
Leadership is a challenge and a responsibility. Anything that happens in a school has
accountability and responsibility. Stakeholders have responsibilities, but a principal is
held accountable for everything that occurs in the school setting. The 2013 MetLife
Survey of 1,000 teachers and 500 principals found 9 out of 10 principals and 74% of
teachers say that a principal should be held accountable for anything that happens in a
school. Chenoweth and Theokas (2013) observed leaders in high achieving schools
with a large number of students in poverty and found that the leaders shared four
common characteristics. First, the leaders shared a belief in their students’ capabilities
and having rigorous performance standards help to distinguish mediocre from
outstanding teachers. Second, leaders put instruction at the center of their duties.
School-wide routines are established to deter discipline issues and maintain a focus on
instruction. Leaders expect teachers to expect more from their students. Third, leaders
focus on building the capacity of teachers. Teachers who are knowledgeable and
prepared get better results. Working together to build knowledge and develop

33
professionally strengthens teacher capacity. Fourth, the leaders want to see evidence
of what leads to success and what can be learned from failure. Instead of blame there
are solutions. Increasing knowledge, resources, sound policies, and strategies are key
to building capacity (Fullan, Cuttress, & Kilcher, 2005). Capacity must be continuous
and evident in everyday practice.
Poverty
Poverty is a challenge for society. For many decades, poverty has been on the
discussion table for politicians. Welfare, medical care, and education of the poor remain
hot topics on the news with little resolution to the issues. Poverty can affect student
learning and a teacher’s classroom in various ways. A student who lives in stressful
conditions such as poverty or high crime areas may lack the necessary sleep for the
brain to properly function (Jensen, 2000). Research done by Phillips (as cited in
Travernise, 2012), showed that before the age of 6, affluent children spend 1,300 more
hours outside their homes than low income children. The more affluent children have
opportunities to go to places such as day care centers, shopping malls, museums, or
schools. When high income children start school, they have spent about 400 hours
more than poor children in literacy activities. This could mean that students from
affluent families are starting school with around 57 extra school days than poor
students. Put vernacularly, poor students begin the race to success a lap or two
behind, which means teachers in high poverty schools may have to work harder to help
the students achieve goals. Students who arrive at school tired and anxious may lead to
behavior problems in the classroom and extra stress for a teacher.

34
Research shows that students in poverty do not arrive at the school door on
equal footing with students above the line of poverty may never catch up academically,
and many drop out of school as early as grade 9 (Arrighi & Maume, 2007). Teachers
who are educated about poverty know that the students of poverty need hope, poverty
is not indicative of personality, and practice may not improve just because they know
more about poverty (Books, 2004). In contrast, another study suggested that poor and
minority students’s achievement gap is not due to family surroundings or poverty but to
teacher quality (Wong & Wong, 2009). Some students thrive in spite of poverty. One
student expresses her experience that she found an escape or outlet from her poverty
stricken life in doing well in school and became an avid reader (Espinoza, 2012).
Students with a special talent or ability may rise above the ashes of poverty and excel in
life. Gifted students from disadvantaged backgrounds tend to have traits of resilience
(Niehart, Reis, Robinson, & Moon, 2002). Abraham Lincoln rose to fame from poverty
through his own achievements. He was aware of his uncultured background in his
journeys, but he overcame by pressing forward toward his goals (Thomas, 2008).
Students who are poor and attend a school that is equal in quality as students
who are more fortunate will likely have lower average achievement due to
disadvantages (Rothstein, 2008). There are many disadvantages explored by Rothstein.
He suggests that there are more school absences possibly due to illnesses such as
asthma and anemia and lack of routine medical care. Families in poverty often fall
behind in their bills and children must move schools and lose instructional continuity.
Low paying jobs result in frequent job changes and this could cause stress to families,
creating arguments, discipline issues, and students home alone after school. Rothstein

35
further contends those students with greater socioeconomic disadvantage often live in
neighborhoods with higher crime rate, drugs, single-parent families, fewer adult role
models, and less access to zoos, museums, and organized sports. In spite of the
inequalities, some students who are disadvantaged always outperform typical middle
class students due to natural human variability. Rothstein promotes combining school
improvement with reform and stopping the unfair condemnation of schools and teachers
to fully close achievement gaps. The culture of poverty arises from several compiled
stereotypes (Gorski, 2008). There are several myths explored by Gorski surrounding
poverty that have become commonplace in mainstream thinking. One myth is that poor
people are lazy and have poor work ethics. The National Center for Children in Poverty
(2004) data shows 83% of children in low income families have at least one employed
parent and many work more than one job. Jobs that require parents to work evenings
and have unpaid leave restricts access to school involvement and creates the myth that
poor parents do not value education. Other myths are that poor people are deficient
linguistically and tend to abuse drugs and alcohol. The reality is that language that is
assumed to be deficient, such as Appalachian English, is just as sophisticated as other
vernaculars with complex grammatical rules, and drug use is as prevalent in middle
class and wealthy communities but more visible in poor neighborhoods. Educators
must be willing to ignore the myths and attempt to quell the negative classism one
classroom at a time.
Innovative solutions are often required to find funding to provide basic needs for
students to keep them healthier and in school, which is an important factor in closing
achievement gaps. One solution to improving high poverty schools in urban areas is to

36
look outside of the school. Some school districts are finding it necessary to support
families by offering health and dental care, mentoring programs, mental health
counseling, and preschool in an effort to narrow the achievement gaps (Kenning, 2011).
Schools that promote readiness by encouraging activities outside of academics have
shown to make a difference in low income students (Ferfuson, Bovaird, & Mueller,
2007). Activities such as athletics and arts increased a student’s school readiness
despite the level of poverty.
Schools in areas of high poverty are not always in urban settings. In rural
Appalachia there are isolated communities that struggle with poverty. Students in
poverty have a chance to succeed if they have strong community support and an
administrator who has a desire for students to excel. Low income students are able to
learn as well or better than upper class students. There are many people who assume
that students who are in urban or rural areas of poverty cannot compete with suburban
schools (Thomas, 2009).
Summary
Chapter 2 presented a discussion of the literature related to the perceptions of
teachers in Title I and non-Title I schools while examining school culture and leadership.
The TDOE compiled eight constructs or focus indicator areas for the survey, and five of
the eight indicators were researched surrounding school culture and leadership. School
culture indicators were compiled from the focus questions of facilities and resources and
community support. Leadership indicators were researched from focus questions of
student conduct, school leadership, and instructional practices and support. The

37
aspects of school culture and leadership will continue to intrigue researchers with the
revolving door of school reform. The literature review is a valuable tool providing insight
into the findings of past researchers.

38
CHAPTER 3
RESEARCH METHODOLOGY
Introduction
This study was an examination of the difference in teacher perceptions in Title I
and non-Title I schools related to school culture, and leadership. The purpose of this
study was to determine whether a significant difference in perceptions exist between
teachers working in high poverty Title I schools and those working in non-Title I schools
and whether school culture or leadership of a school influences teacher perceptions.
A quantitative framework was used to compare significant differences in
perceptions between teachers in Title I and non-Title I schools. Included in this chapter
are: The Research Design, Population, Instrumentation, Data Collection, Data Analysis,
and Research Questions. A quantitative framework was used to examine the possible
relationships among poverty, school culture, and leadership. A quasi-experimental
design was selected because the data already existed and collecting additional data
was unnecessary.
Research Questions and Null Hypotheses
The following research questions and null hypotheses were considered during
the study. The independent variables in question were Title I schools and non-Title I
schools. The dependent variable in each question were perceptions of teachers who
worked in a Title I or non-Title I school.

39
Research Question #1
Is there a significant difference in teacher perceptions of student conduct
management as measured by the TELL Tennessee Survey between Title I and non-
Title I schools?
H0: There is no significant difference in teacher perceptions of student conduct
management as measured by the TELL Tennessee Survey between Title I
schools and non-Title I schools.
Research Question #2
Is there a significant difference in teacher perceptions of school leadership as
determined by the TELL Tennessee Survey in the areas between Title I schools and
non-Title I schools?
H0: There is no significant difference in teacher perceptions of school leadership
between Title I schools and non-Title I schools.
Research Question #3
Is there a significant difference in teacher perceptions of instructional
practices and support as determined by the TELL Tennessee Survey between
Title I and non-Title I schools?
H0: There is no significant difference in teacher perceptions of instructional
practices and support between Title I schools and non-Title I schools.
Research Question #4
Is there a significant difference in teacher perceptions of facilities and resources
as determined by the TELL Tennessee Survey between Title I and non-Title I schools?

40
H0: There is a significant difference in teacher perceptions of facilities and
resources between Title I schools and non-Title I schools.
Research Question #5
Is there a significant difference in teacher perceptions of community
support and involvement as determined by the TELL Tennessee Survey between
Title I and non-Title I schools?
H0: There is no significant difference in teacher perceptions of community
support and involvement between Title I schools and non-Title I schools.
Population
The population was comprised of teachers who teach in an upper East
Tennessee region in Pre-Kindergarten through 12th grades during the 2010 through
2011 school year. The number of teachers invited to participate in those grades in the
upper East Tennessee region was 7,168 during the 2010 through 2011 school year.
There were 5,361 educators in the upper East Tennessee region who responded to the
TELL Tennessee survey. The upper East Tennessee region contained 115 Title I
schools and 40 non-Title I schools at the time of the survey. In each school 51% of the
educators were required to respond to the TELL Tennessee survey in order to be
considered in the results.
Instrumentation
The data for this study were collected from the TELL Tennessee Survey
conducted in 2011 by the Tennessee Department of Education (TDOE). The TDOE

41
revealed the survey to Tennessee public educators in March of 2011 with the purpose
of supporting sound educational policies and practices. The results were based on the
views and perceptions of certified educators in public schools in Tennessee. The TDOE
contracted with the New Teacher Center (NTC) to conduct the state’s survey. The NTC
is a national organization that has administered surveys in several states and is
dedicated to developing and supporting a quality teaching force. The TDOE compiled
eight constructs or focus indicator areas for the survey, and five of the eight indicators
were used to determine school culture and leadership. School culture indicators were
compiled from the focus questions of facilities and resources and community support.
Leadership indicators were compiled from focus questions of student conduct, school
leadership, and instructional practices and support.
The TDOE ensures that the analyses presented were based on responses to a
survey instrument based on the North Carolina Teacher Working Conditions Survey, but
customized for the TELL Tennessee Survey by the TELL Tennessee Coalition of
Partners and is valid and reliable. The state tested the eight constructs; time, facilities
and resources, community support and involvement, managing student conduct,
teacher leadership, school leadership, professional development, and instructional
practices and support, of their survey by calculating Cronbach’s alphas and all eight
construct are reliable with alphas above 0.830. Alphas above a 0.70 are considered as
good. An acceptable range of reliability for most instruments is .70 to .90 (McMillan,
2006).

42
Data Collection
I submitted a request to the Institutional Review Board (IRB) for approval to collect
data from an upper East Tennessee region. The IRB determined that my proposed
collection activity did not meet the FDA or the DHHS definition of research involving
human subjects; therefore it did not fall under the scope of the East Tennessee State
University IRB. The survey data were collected from the Tennessee Department of
Education’s TELL Tennessee website where the information is public.
The research did not contain any information that could be traced to a particular
person. Names were not used in the study. The study met ethical standards and
shielded individuals from any consequences resulting from the conclusions of the study.
Data Analysis
Independent t tests were used to evaluate the differences in teacher perceptions
of school culture and leadership in Title I and non-Title I schools. The population of the
study was teachers in grades Pre-Kindergarten through 12th grade in an upper East
Tennessee region responding to the TELL Tennessee survey in 2010 through 2011.
The survey is the first of its kind in the state and the Tennessee Department of
Education will conduct a second survey in 2013. The data were analyzed and provided
a statistical analysis of the differences between Title I and non-Title I schools.
Summary
This chapter included data from the TELL Tennessee survey surrounding teacher
perceptions of school culture and leadership in Title I and non-Title I schools that were

43
analyzed and presented. The data were gathered from an upper east Tennessee region
consisting of 17 districts and 150 schools. An independent-samples t-test analysis was
conducted to evaluate the differences in teachers’ perceptions of five different variables
affecting school culture between Title I schools and non-Title I schools.

44
CHAPTER 4
ANALYSIS OF DATA
The results of the analysis of the research questions identified in Chapters 1 and
3 are presented in Chapter 4. The study was conducted to determine if a significant
difference existed in the perceptions of teachers in the areas of 1) managing student
conduct, 2) school leadership, 3) instructional practices, 4) school culture, and 5)
community support and involvement as measured by the TELL Tennessee Survey.
Analysis of Research Data
Research Question #1
Is there a significant difference in teacher perceptions of student conduct
management as measured by the TELL Tennessee Survey between Title I and non-
Title I schools?
H01: There is no significant difference in teacher perceptions of student conduct
management in Title I schools and non-Title I schools.
An independent-samples t-test was conducted to evaluate whether teacher
perceptions of student conduct management differed significantly between Title I and
non-Title I schools. The test was not significant, t(153) = .21, p = .837, ns. Therefore the
null hypothesis was retained. Cohen’s d was calculated to be .04 which indicated a
small effect size. The 95% confidence intervals for the average perception score ranged
from -.065 to .080. An examination of the group means indicated that in general
teachers in non-Title I schools (M = .770, SD = .195) had a slightly, but not significantly,

45
more positive perception of student conduct management than teachers in Title I
schools (M = .762, SD = .208). Figure 1 shows the 95% confidence intervals for teacher
perception of student behavior management. In general a school’s title status did not
influence teacher perceptions of student conduct management.
Figure 1. 95% Confidence Intervals for Teacher Perceptions of Student Behavior
Management

46
Research Question #2
Is there a significant difference in teacher perceptions of school leadership
as determined by the TELL Tennessee Survey in the areas between Title I
schools and non-Title I schools?
H02: There is no significant difference in teacher perceptions of school leadership
in Title I schools and non-Title I schools.
An independent-samples t-test was conducted to evaluate whether teacher
perceptions of school leadership differed significantly between Title I and non-Title I
schools. The test was not significant, t(153) = -.25, p = .806, ns. Therefore the null
hypothesis was retained. Cohen’s d was calculated to be .04 which indicated a small
effect size. The 95% confidence intervals for the average perception score ranged from
-.044 to .034. An examination of the group means indicated that teachers’ perceptions
of school leadership Title I schools (M = .893, SD = .108) were slightly, but not
significantly, more positive than teachers in non-Title I schools (M = .888, SD = .113).
Figure 2 shows the 95% confidence intervals for teacher perceptions of school
leadership. In general a school’s title status did not influence teachers’ perceptions of
school leadership.

47
Figure 2. 95% Confidence Intervals for Teacher Perceptions of School Leadership
Research Question #3
Is there a significant difference in teacher perceptions of instructional
practices and support as determined by the TELL Tennessee Survey between
Title I and non-Title I schools?
H03: There is no significant difference in teacher perceptions of instructional
practices and support in Title I schools and non-Title I schools.
An independent-samples t-test was conducted to evaluate whether teacher
perceptions of instructional practices and support differed significantly in Title I and non-

48
Title I schools. The test was not significant, t(153) = -1.13, p = .261, ns. Therefore the
null hypothesis was retained. Cohen’s d was calculated to be .18 which indicated a
small effect size. The 95% confidence intervals for the average perception score ranged
from -.091 to .025. An examination of the group means indicates that teachers in Title I
schools (M = .721, SD = .166) had a more positive perception of instructional practices
and support than teachers in non-Title I schools (M = .688, SD = .149). Figure 3 shows
the 95% confidence intervals for teacher perception of instructional practices and
support. In general a school’s title status did not influence teachers’ perceptions of
instructional practices and support than teachers.
Figure 3. 95% Confidence Intervals for Teacher Perceptions of Instructional Practices
and Support

49
Research Question #4
Is there a significant difference in teacher perceptions of facilities and resources
as determined by the TELL Tennessee Survey between Title I and non-Title I schools?
H04: There is no significant difference in teacher perceptions of facilities and
resources in Title I schools and non-Title I schools.
An independent-samples t-test was conducted to evaluate whether teacher
perceptions of facilities and resources differed significantly in Title I and non-Title I
schools. The test was significant, t(153) = -2.54, p = .012. Therefore the null hypothesis
was rejected. Cohen’s d was calculated to be .04 which indicated a small effect size.
The 95% confidence intervals for the average perception score ranged from -.105 to
.013. An examination of the group means indicates that teachers in Title I schools (M =
.845, SD = .120) had a significantly more positive perception of facilities and resources
than teachers in non-Title I schools (M = .786, SD = .149). Figure 4 shows the 95%
confidence intervals for teacher perception of instructional practices and support. In
general Title I teachers had a significantly more positive perception of facilities and
resources than teachers in non-Title I schools.

50
Figure 4. 95% Confidence Intervals for Teacher Perceptions of Facilities and Resources
Research Question #5
Is there a significant difference in teacher perceptions of community
support and involvement as determined by the TELL Tennessee Survey between
Title I and non-Title I schools?
H05: There is no significant difference in teacher perceptions of community
support and involvement in Title I schools and non-Title I schools.
An independent-samples t-test was conducted to evaluate whether teacher
perceptions of community support and involvement differed significantly in Title I and
non-Title I schools. The test was not significant, t(153) = .339, p = .735, ns. Therefore
the null hypothesis was retained. Cohen’s d was calculated to be .06 which indicated a

51
small effect size. The 95% confidence intervals for the average perception score ranged
from -.043 to .060. An examination of the group means indicates that teachers in non-
Title I schools (M = .870, SD = .141) had a more positive perception of community
support and involvement than teachers in Title I schools (M = .861, SD = .144). Figure 5
shows the 95% confidence intervals for teacher perception of community support and
involvement. In general a school’s title status did not influence teacher perceptions of
community support and involvement.
Figure 5. 95% Confidence Intervals for Teacher Perceptions of Community Support and
Involvement

52
Summary
A series of independent-samples t tests was conducted to evaluate the
differences in teachers’ perceptions of five different variables affecting school culture
between Title I schools and non-Title I schools. A statistically significant difference was
found in teacher perception of facilities and resources. Teachers in Title I schools had a
significantly more positive perception of facilities and resources than teachers in non-
Title I schools. No other differences were significant.

53
CHAPTER 5
SUMMARY, CONCLUSIONS, AND RECOMMENDATIONS FOR PRACTICE AND
FURTHER RESEARCH
Summary of Results
The purpose of this chapter is to summarize and explain the results of this study
in relation to teacher perceptions of school culture and leadership in Title I and non-Title
I schools and to make recommendations for future practice and research. Schools have
a culture that is unique to each individual building and the leadership in the school
contributes to its success or shortcomings. Some leaders with the courage to motivate
dramatic transformation are placed in low performing schools to change the culture and
raise test scores (Hassel, 2009). Changing the culture in a school is changing the very
heart and soul of the group. Leaders often meet resistance to the challenges of cultural
change when it means added work for the group. The improvement of a school often
involves improving the culture and that means changing the way things are done in a
school (Whitaker, 2010). Positive teacher perceptions mean finding good leadership to
develop school culture. This includes ensuring that facilities and resources such as
current technology and a pleasing school environment are adequate for teachers. The
community is involved and supportive. School leaders support teachers and have a
shared vision with instructional practices, encouraging teachers to try new things, and
have autonomy to make decisions. The TELL survey is a way of guiding this balance
by gathering information that will lead to school improvement, better conversations
about positive teaching and learning conditions in Tennessee (TDOE, 2011).

54
Research Questions and Findings
This study was conducted to determine if a significant difference existed in the
perceptions of teachers in the areas of 1) managing student conduct, 2) school
leadership, 3) instructional practices, 4) school culture, and 5) community support and
involvement. All of the variables were measured by the TELL Tennessee Survey.
Research Question #1
Management of Student Conduct
Is there a significant difference in teacher perceptions of student conduct
management as measured by the TELL Tennessee Survey between Title I and non-
Title I schools?
An independent-samples t-test was conducted to evaluate whether teacher
perceptions of student conduct management differed significantly between Title I and
non-Title I schools. The test was not significant. Non-Title I teachers had a slightly, but
not significantly, more positive perception of student conduct management than
teachers in Title I schools.
Research Question #2
School Leadership
Is there a significant difference in teacher perceptions of school leadership as
determined by the TELL Tennessee Survey between Title I schools and non-Title I
schools?

55
An independent-samples t-test was conducted to evaluate whether teacher
perceptions of school leadership differed significantly between Title I and non-Title I
schools. There was no significant difference. Teacher perceptions in Title I schools were
slightly, but not significantly, more positive than teacher perceptions in non-Title I
schools regarding school leadership.
Research Question #3
Instructional Practices and Support
Is there a significant difference in teacher perceptions of instructional practices
and support as determined by the TELL Tennessee Survey between Title I and non-
Title I schools?
An independent-samples t-test was conducted to evaluate whether teacher
perceptions of instructional practices and support differed significantly between Title I
and non-Title I schools. The test was not significant. Teacher perceptions in Title I
schools were slightly, but not significantly, more positive than non-Title I schools in
regard to instructional practices and support.
Research Question #4
Facilities and Resources
Is there a significant difference in teacher perceptions of facilities and resources
as determined by the TELL Tennessee Survey between Title I and non-Title I schools?
An independent-samples t-test was conducted to evaluate whether teacher perceptions
of facilities and resources differed significantly between Title I and non-Title I schools.

56
The test was significant. Teacher perceptions in non-Title I schools were significantly
more positive than Title I schools in regard to facilities and resources.
Research Question #5
Community Support and Involvement
Is there a significant difference in teacher perceptions of community support and
involvement as determined by the TELL Tennessee Survey between Title I and non-
Title I schools?
An independent-samples t-test was conducted to evaluate whether teacher
perceptions of community support and involvement differed significantly between Title I
and non-Title I schools. The test was not significant. Teacher perceptions of community
support and involvement in Title I schools were slightly, but not significantly, more
positive than in non-Title I schools.
Conclusions
Based on the data analyzed during this study, it is possible to identify teacher
perceptions between Title I schools and non-Title I schools in regard to school culture
and leadership in an upper East Tennessee region. The region consists of 155 schools.
There were 115 Title I schools and 40 non-Title I schools. The following conclusions
were obtained from this study.
Teacher perceptions were not significantly different in Title I schools and non-
Title I schools regarding to leadership in the areas of management of student conduct,
school leadership, or instructional practices and support, suggesting that teachers

57
working in schools with a high rate of poverty are generally as satisfied with the
leadership practices in handling student conduct, evaluating consistently, and
supporting instructional practices as the teachers working in low poverty schools. A
leader who is a successful principal in a high poverty school may be just as capable of
leading a low poverty school with success due to transformational qualities.
Researchers contend that leaders with transformational qualities or flexibility adapt to
the needs of the current situation and have the ability to accept the responsibility of
discipline, protect teachers from undue distractions during instructional time, and are
supportive of teaching practices (Marzano, 2005).
Teacher perceptions of school culture were not significantly different in the area
of community support between Title I and non-Title I schools. Teachers and school
leaders may have a sense of pride in developing parent and community relationships by
building partnerships, promoting school pride, and informing parents or guardians about
the school (Wagner, 2006). However, there was a significant difference in teacher
perceptions of school culture in the area of facilities and resources in Title I schools and
non-Title I schools. Teachers working in Title I schools were significantly more positive
than teachers working in non-Title I schools in relation to facilities and resources. One
factor that may explain the significant difference is that Title I schools receive additional
funding for materials, supplies, and technology (U.S. Department of Education, 2004).

58
Recommendations for Practice
The following recommendations are presented for consideration to teachers and
school leaders regarding teacher perceptions of school culture and leadership in Title I
schools and non-Title I schools.
1. School improvement teams and professional learning communities should
consider the information surrounding teacher perceptions in this study to
monitor school culture and effective leadership in individual schools
(Delaney, 2012).
2. A school should be inviting and inspire teachers to do their best work
(Whitaker, 2009). Teachers and school leaders in Title I and non-Title I
schools should be aware of and maintain a high level of staff morale within a
building by ensuring that adequate and current facilities and resources are
maintained. A thorough analysis of the TELL Tennessee Survey could
provide baseline data for schools on teacher perceptions of facilities and
resources.
3. Build community and public perception by offering adult learning and giving
back to the community (Parrett & Budge, 2012). School leaders and teachers
should use the results provided by the TELL Tennessee survey to build a
positive school culture by improving instructional and community support.

59
Recommendations for Future Research
As a result of the findings in this research I make the following recommendations
for future research to those interested in teacher perceptions pertaining to school
culture and leadership.
1. Compare the 2013 TELL Tennessee survey results to the original survey
results used in this study to discover if there are significant changes in
teacher perceptions that would improve school leadership and culture.
2. Future studies done on this topic should include TELL Tennessee survey
results from all school districts in Tennessee.
3. Compare urban Title I schools to rural Title I schools to examine differences
in the two.
4. Consider comparisons of teacher perceptions in districts with the highest
rates of poverty to districts with the lowest rates of poverty.
5. Compare teacher perceptions of males to females to see if there is a
significant difference.
6. Determine the relationship between TELL Survey factors and student
achievement.
Summary
School reform will continue to be addressed by researchers and policy makers
striving to improve student success and academic achievement. Teacher perceptions
are important to continue researching to monitor the progress of reform. Attention to
leadership and culture is important. This study may raise awareness about school

60
culture and leadership between Title I schools and non-Title I schools. The value in
comparing teacher perceptions of school culture and leadership in Title I schools and
non-Title I schools is in finding if support and working conditions in a high poverty
school adds pressure to school leaders to raise morale, expectations, and show more
academic growth than those in low poverty schools (Marzano, 2005). The findings in
this study are similar to Chenoweth’s (2010) research on leaders in high poverty
schools across the United States. She found that teachers who were supported with
respect, discipline, decision making, and expectations were generally satisfied with
working in these types of schools and could help their students achieve. Chenoweth
concedes that in general, schools with challenging student bodies are low achieving, but
there are schools that offer hope and a fair start.
Twenty-six years ago when I lived in a small coal mining town of approximately
800 people diversity only applied to income and not color, there was only one color of
skin. Most of the community struggled with poverty but were proud and did not consider
it a problem. Times have changed and so have I during my career as an educator both
personally and professionally. The realization that leadership is a balance of natural
ability and learned behavior encouraged my drive to become an administrator. Working
in schools that were very high poverty as well as very affluent sparked my interest in
researching Title I and non-Title I schools. I am dedicated to advocating for high
poverty schools. Through this research I have found that school culture and leadership
are important to the success of students and retaining great teachers. School reform
will not happen without leaders and teachers who are able to recognize and use their
strengths. A leader who finds and uses strengths within the organization has collected a

61
treasure. I plan to continue to search for the resources within my school to fit strengths
to jobs and to consider each situation as it comes in order to lead with purpose.

62
REFERENCES
Adams, C. (2012). One million students homeless. ScholasticAdministrator.Com, (Winter), February 16, 2012-40-45.
Afterschoolalliance.org. (2007, November). Afterschool: The bridge connecting schools and communities. Washington, DC, US: Metlife Foundation Afterschool Foundation Alert Issue Brief.
Alexander, T. M. (1987). John dewey's theory of art, experience, and nature: The horizons of feeling. Albany, NY: State University of New York.
Anderson-Levitt, K. M. (2003). Local meanings, global schooling: Anthropology and world culture. New York, NY: Palgrave McMillan.
Arrighi, B. A., & Maume, D. J. (2007). Child poverty in America today: The promise of education (3rd ed.). Westport, CT: Praeger.
As threatened, TN department of education withholds $3.4M from metro schools | Nashville city paper Retrieved 10/21/2012, 2012, from http://nashvillecitypaper.com/content/city-news/threatened-tn-department-education-withholds-34m-metro-schools
Ascione, L. (2005, September). Teachers’ tech use on the rise. Retrieved February 25, 2013, from http://www.eschoolnews.com/
Bass, B., Avolio, B., & Atwater, L. (1996). The transformational and transactional leadership behavior of men and women. International Review of Applied Psychology, 45: 5-34.
Books, S. (2004). Poverty and schooling in the U.S.; Contexts and consequences. Mahwah, NJ. Lawrence Erlbaum.
Boyd, L. (2012). Five myths about student discipline. Educational Leadership, 70(2), 62-66.
Bramble, L. (2012). Unethical behavior and employee morale. Retrieved September 21, 2012, 2012, from http://www.ehow.com/about_6466822_unethical-behavior-employee-morale.html
Chenoweth, K. (2010). Leaving nothing to chance. Educational Leadership. 68(3),16-21.
Chenoweth, K., & Theokas, C. (2013). How high poverty schools are getting it done. Educational Leadership,70(7), 56-59.

63
Collins, J. (2001). Good to great: Why some companies make the leap and others don’t. New York, NY. HarperCollins.
Collins, W., & Sons. (2012). Dictionary.com. Retrieved November 7, 2012, from http://dictionary.reference.com/browse/morale
Corvisier, A. (. (Ed.). (1994). A dictionary of military history (Blackwell Reference Online. 22 ed.) Blackwell.
Devaney, L. (2011). Principals share secrets to positive school culture. ESchool News. Retrieved November 21, 2012 from http://www.eschoolnews.com/2011/12/13/principals-share-secrets-to-positive-school-culture/
DuFour, R. (2007). In praise of top-down leadership. School Administrator, 64(10), 38-39-42.
Elbot, C., & Fulton, D. (2008). Building an intentional school culture. Thousand Oaks, CA: Corwin Press.
ED.gov. (2012). Retrieved November 21, 2012, from http://www2.ed.gov/programs/racetothetop/index.html
Espinoza, R. (2012). Finding pivotal moments. Educational Leadership, 69(7), 58-59. Ferfuson, H., Bovaird, S., & Mueller, M. (2007). The impact of poverty on educational outcomes for children. J Paediatr Child Health, 12(8), 701-706. Fink, E., & Resnick, L.B. (2001). Developing principals as instructional
leaders. Phi Delta Kappan. 82, 598-610.
Fleishman, E. A., & Hunt, J. G. (1973). Current developments in the study of leadership; a centennial event symposium held at the University of Southern Illinois at Carbondale. Carbondale, IL: Southern Illinois University Press.
Fullan, M. (2008). What’s worth fighting for in the principalship?, (2nd ed.). New York, NY: Teachers College.
Fullan, M., Cuttress, C., Kilcher, A. (2005, Fall). 8 Forces for leaders of change. National Staff Development Council, 54-64. Retrieved February 20, 2013, from http://www.michaelfullan.com/media/13396067650.pdf
Gil, B., McCombs, J., Naftel, S., Ross, K., Song, M., Harmon, J., Vernes, G. (2008). State and local implementation of the No Child Left Behind Act. Jessup, MD: U.S. Department of Education.

64
Gill, R. (2011). Theory and practice of leadership (2nd ed.). Thousand Oaks, CA: SAGE.
Gorski, P. (2008, April). The myth of the culture of poverty. Educational Leadership, 32-36. Retrieved March 8, 2013 from http://www.ascd.org/publications/educational-leadership/apr08/vol65/num07/The-Myth-of-the-Culture-of-Poverty.aspx
Gladwell, M. (2008). Outliers: The story of success (1st ed.). New York, NY: Little, Brown.
Gordon, J. (2011). Fallling forward. Retrieved 03/29/2011, 2011, from http://www.jongordon.com/newsletter-032811-failing-forward.html
Gray, S. P., & Streshly, W. A. (2008). From good schools to great schools: What their principals do well. Thousand Oaks, CA: Corwin Press.
Green, T. (2009). Your first year as principal. Ocala, FL: Atlantic.
Hardy, K. (2012, January 13, 2012). Tennessee and Georgia climb in education quality ranking. Message posted to http://www.timesfreepress.com/news/2012/jan/13/tennessee-and-georgia-climb-education-quality-rank/
Harris Interactive. (2013). The MetLife Survey of the American Teacher: challenges for school leadership. New York, NY: MetLife Foundation.
Haslam, B. (2011). New teacher center. Retrieved Novermber 16, 2012, from www.telltennessee.org
Hassel, E. A., & Hassel B. (2009). The big u-turn. Education Next (Winter), 21-27. Retrieved March 8, 2013 from http://educationnext.org/the-big-uturn/
Loeb, S., & Horng, E. (2010). New thinking about instructional leadership. Phi Delta Kappan, 92, 66-69.
Hoy, W. K., & Miskel, C. G. (2008). Educational administration: Theory, research, and practice (8thed.). New York, NY: McGraw-Hill.
Hoy, W. K., & DiPaola, M. F. (2008). In Hoy W. K., DiPaola M. F. (Eds.), Improving schools: Studies in leadership and culture. Charlotte, NC: Information Age.
Jehl, J. (2007). Connecting schools, families, communities. Baltimore, MD: The Annie E. Casey Foundation.
Jensen, E. (2000). Brain-based learning: The new science of teaching & training (Revised ed.). San Diego, CA: The Brain Store.

65
Kain, E. (2011). Education, poverty and culture. Forbes. Retrieved March 8, 2013 from http://www.forbes.com/sites/erikkain/2011/06/03/education-poverty-and-culture/
Kelly, J. (2012). Effective schoolwide discipline. Principal Leadership, 12-16. Retrieved March 8, 2013 from http://www.nasponline.org/resources/principals/Schoolwide_Discipline_NASSP_February2012.pdf
Kenning, C. (2011). Solutions to high-poverty schools. The Courrier-Journal. Retrieved February 20, 2013 from http://www.courier- journal.com/article/20110423/NEWS010503/304240063/Solutions-high-poverty-schools-may-lie-outside-classroom
Kotter, J. P. (1990). Force for change: How leadership differs from management. New York, NY: The Free Press.
Kotter, J. P. (2012). Leading change. Cambridge, MA: Harvard Business Review.
Kratochwill, T. (2013). Classroom management. Washington, DC: American Psychological Association.
Marzano, R. J. (2005). School leadership that works. Alexandria , VA: ASCD.
Maxwell, J. C. (2004). Winning with people. Nashville, TN: Thomas Nelson.
McMillan, J.H. (2006). Research in education (6th ed.). Boston, MA: Pearson.
Merriam-Webster’s Collegiate Dictionary. (2007). (11th ed.). Springfield, MA. Merriam-Webster.
National Education Association. (2008). Parent, family, community involvement in education. Washington, DC: Center for Great Public Schools.
Niehart, M., Reis, S. M., Robinson, N. M., & Moon, S. M. (2002). The social and emotional development of gifted children: What do we know?. Waco, TX: Prutrock Press.
Northouse, P. G. (2007). Leadership theory and practice (4th ed.). Thousand Oaks, CA: Sage.
Owens, R. (2004). Organizational behavior in education: Adaptive leadership and school reform. (8th ed.). Charlottesville, VA., Pearson/A and B.
Parrett, W. H., & Budge, K. M. (2012). Turning high-poverty schools into high-performing schools. Alexandria, VA: ASCD.

66
Payne, R. K. (2005). A framework for understanding poverty (4th ed.). Highlands, TX: aha! Process.
Price, J. J. (2012). Collaboration: The old, new idea. Tennessee Educational Leadership 39(1), 34.
Protheroe, N. (2006). Maintaining high teacher morale. Principal (Reston, Va.), 85(3), 46-49. Retrieved from http://search.ebscohost.com/login.aspx?direct=true&db=eft&AN=507853728&site=ehost-live
Rothstein, R. (2008). Whose problem is poverty? Educational Leadership, 65.
Schmidt, L. (2002). Gardening in the minefield: A survival guide for school administrators. 126-133. Portsmouth, NH: Heineman.
Schmoker, M. (2011). Focus: Elevating the essentials to radically improve student learning. Alexandria, VA: ASCD.
Seifert, E. H., & Vornberg, J. A. (2003). The new school leader for the 21st century: The principal. Lanham, MD: Rowman & Littlefield.
Smith, P., & Riley, A. (2008). Cultural theory: An introduction (2nd ed.). Malden, MA: Blackwell.
Strauss, V. (September, 2012). Tennessee punishing Nashville for refusing to open charter school - the answer sheet - the Washington Post Retrieved 10/21/2012, 2012, from http://www.washingtonpost.com/blogs/answer-sheet/post/tennessee-punishing-nashville-for-refusing-to-open-charter-school/2012/09/18/7b2f5548-01eb-11e2-b257-e1c2b3548a4a_blog.html
Stronge, J. H. (2008). Qualities of effective principals. Alexandria, VA: ASCD.
Thomas, B. P. (2008). Abraham Lincoln: A biography. Carbondale, IL: Southern Illinois University Press.
Thomas, O. (2009). A miracle in the mountains. The School Administrator, 26-29. Retrieved March 8, 2013 from http://www.aasa.org/SchoolAdministratorArticle.aspx?id=8456
Title I-- improving the academic achievement of the disadvantaged, Title IU.S.C. SEC 1001, USDE (2004).

67
Travernise, S. (2012). Education gap grows between rich and poor, studies say. The New York Times. Retrieved February 23, 2013 from http://www.nytimes.com/2012/02/10/education/education-gap-grows-between-rich-and-poor-studies-show.html?pagewanted=all&_r=0
U.S. Department of Education. (2004). Part A- Improving basic programs operated by local educational agencies. Sec. 1111 (B). ED.gov
Valiant, B. (1996). Turn on the lights! Using what we know about the brain and learning to design learning environments. (CEFPI Issue Track No. EF-005-146). The Council of Educational Facility Planners.
Wagner, C. R. (2006). The school leader's tool for assessing and improving school culture. Principal Leadership, 41-47. Retrieved March 23, 2013 from http://www.tn.gov/education/cte/ad/rubric/doc/sch_culture_triage.pdf
Washington, D. (2006). A hand to guide me (1st ed.). Des Moines, IA: Meridith Books.
Watson, A. (2008). Enduring the Great War: Combat, morale and collapse in the German and British armies, 1914-1918. Cambridge, MA: Cambridge University Press.
Whitaker, T. (2003). What great principals do differently; Fifteen things that matter most. Larchmont, NY: Eye On Education.
Whitaker, T. (2004). What great teachers do differently: 14 things that matter most (1st ed.). Larchmont, NY: Eye On Education.
Whitaker, T. (2010). The ball. Bloomington, IN. Triple Nickel.
Whitaker, T. (2010). Leading school change. Larchmont, NY: Eye On Education.
Whitaker, T., Whitaker, B., & Lumpa, D. (2009). Motivating & inspiring teachers: The educational leader's guide for building staff morale (2nd ed.). Larchmont, NY: Eye on Education.
Winerip, M. (2011). In Tennessee, following the rules for evaluations off a cliff. The New York Times, Retrieved November 21, 2012 from http://www.tn.gov/education/cte/ad/rubric/doc/sch_culture_triage.pdf
Wong, H. K., & Wong, R. T. (2009). The first days of school: How to be an effective teacher. Mountain View, CA: Harry K. Wong.

68
APPENDICES
APPENDIX A: IRB Form

69

70
Appendix B: IRB Approval

71
Appendix C: TELL Tennessee Survey Questions for Determining Teacher Perceptions
in Regard to Facilities and Resources

72
Appendix D: TELL Tennessee Survey Questions for Determining Teacher Perceptions
in Regard to Community Support and Involvement
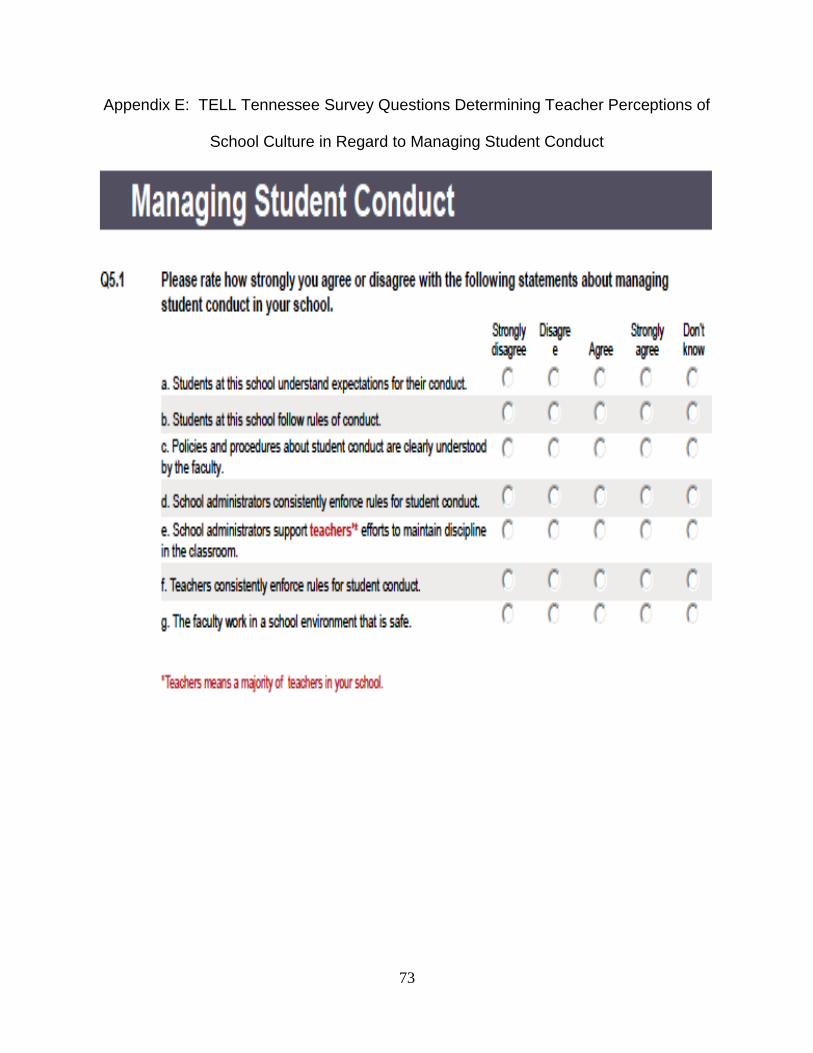
73
Appendix E: TELL Tennessee Survey Questions Determining Teacher Perceptions of
School Culture in Regard to Managing Student Conduct

74
Appendix F: TELL Tennessee Survey Questions Determining Teacher Perceptions of
Leadership in Regard to School Leadership
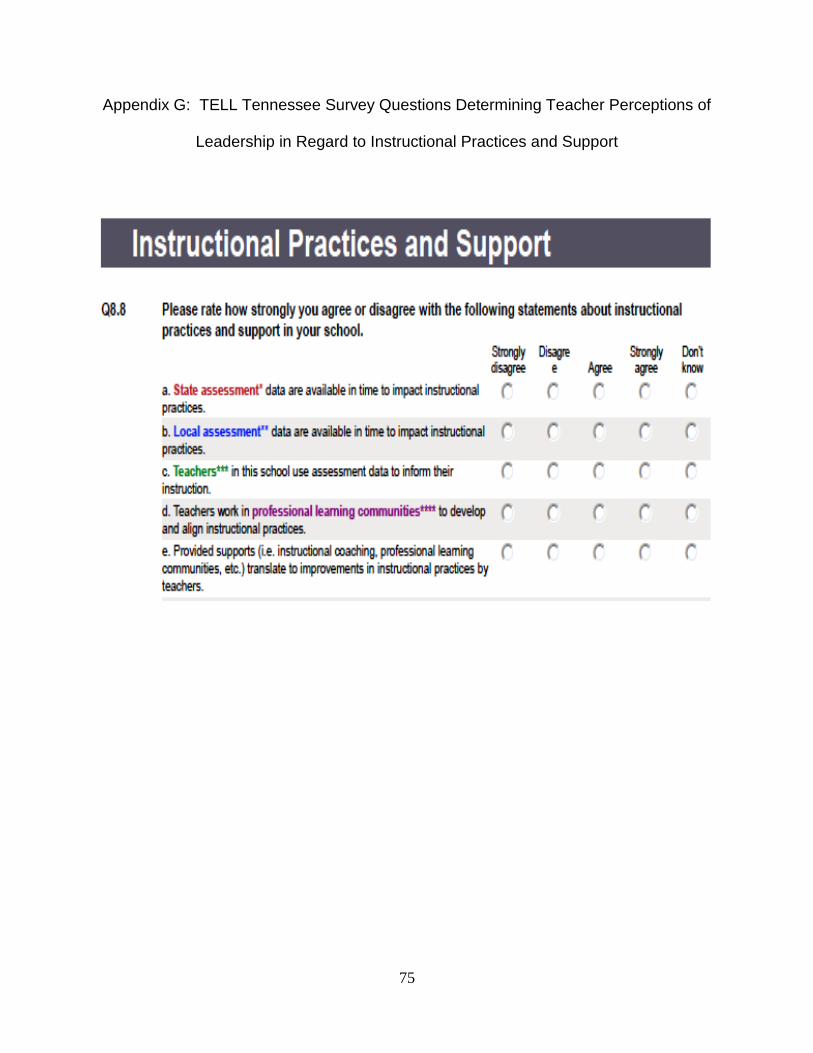
75
Appendix G: TELL Tennessee Survey Questions Determining Teacher Perceptions of
Leadership in Regard to Instructional Practices and Support

76
VITA
KRISTA GALEA ROSE CRUM
Personal Data: Date of Birth: November 25, 1964
Place of Birth: Pikeville, Kentucky
Marital Status: Married
Education: Public Schools, Elkhorn City, Kentucky
A.S. Education, Walters State Community College, Morristown,
Tennessee, 1990
B.S. Elementary Education, Carson Newman College, Jefferson
City, Tennessee, 1993
M.Ed. Curriculum and Instruction, Carson Newman College,
Jefferson City, Tennessee, 2004
Ed.S. Lincoln Memorial University, Harrogate, Tennessee, 2006
Ed.D. East Tennessee State University, Johnson City, Tennessee,
2013
Professional Experience: Teacher, All Saints’ Episcopal Day School, Morristown,
Tennessee, 1994-1995.
Teacher, West Elementary School, Morristown, Tennessee, 1995-
2006
Title I Coordinator, West Elementary School, Morristown,
Tennessee, 2006-2009
Assistant Principal, West View Middle School, Morristown,
Tennessee, 2009-2010
Assistant Principal, Lincoln Heights Middle School, Morristown,
Tennessee, 2010-2011
Principal, West Elementary, Morristown, Tennessee, 2011-2013
Honors and Awards West Elementary Teacher of the Year
Tennessee School Board Association Award for video production
of Beyond the Doors- showcasing industry
Vice President of Delta Kappa Gamma