school feeding baseline survey training manual - … training manual.pdf · school feeding baseline...
TRANSCRIPT

School Feeding Baseline Survey Training Manual School Feeding Support Unit
“It is virtually impossible to overestimate the importance of giving a young child the opportunity to spend even a few years in school.” Catherine Bertini “Our goal is to be feeding at least 30 million school children by the year 2007.” James T. Morris


Baseline Survey Manual
1
Table of Contents Part I. Introduction........................................... 3 Using the manual ...................................................... 4 Setting the scene for surveying .............................. 5 An historic perspective ............................................. 5 The rationale behind School Feeding ....................... 6 The rationale behind baseline studies, monitoring and evaluation........................................................... 9
Definitions .....................................................................9 Purpose of baselines, monitoring and evaluation..........9 Project and M&E design .............................................10 Project Cycle Management..........................................10 The selection of indicators...........................................11 Indicator data requirements ........................................12 Data Sources ...............................................................12 Stratification and desegregation of data......................12
Part II. The School Feeding baseline survey .. 13 Definitions .............................................................. 13
Determining Grade Level and Relevant Age ...............13 School Feeding Indicators ...................................... 13 Generic Logical Framework for WFP assisted School Feeding projects.......................................... 15 Part III. Information on Survey Sampling ...... 22 Definitions .............................................................. 22 Defining the sample frame ..................................... 22 Choosing a sampling method ................................. 22 Determining sample size ........................................ 23
Identifying the sample units .........................................25 Generation of Random Numbers with Excel................26
Summary on sampling ............................................ 26 Part IV. Information on Survey implementation ..................................................... 29 Generic Terms of Reference................................... 29 Preparation of the Field Work ................................ 31 Part V. Quality Control ................................... 33 Data Quality Control Checklist .............................. 33
Quick overview ............................................................33 Specific Issues and Questions......................................33


Baseline Survey Manual
3
Part I. Introduction
The World Food Programme (WFP) has been providing support for School Feeding activities for more than forty years. In 2001, WFP assisted with school feeding in 57 countries, benefiting more than 15 million children. The Operations Department (OD) and the School Feeding Support Unit (SPF) in the Strategy and Policy Division (SP) are responsible for backstopping Country Offices (COs) implementing WFP’s school feeding activities. This Manual has been designed by SPF to support COs and their partners in conducting school feeding baseline and evaluation surveys, with the objective to contribute to improved results based management. Like many other aid agencies, WFP is increasingly focusing on results based management (RBM), which requires that impact of aid programmes be assessed and reported against development outcomes. In mid 2001, WFP began conducting baseline surveys of School Feeding projects in 23 countries. Since then evaluation surveys have been conducted in almost all of these 23 countries, additional 21 countries have been trained on the survey tools and are now implementing baselines. Furthermore, lessons learnt from this exercise are being used for similar surveys in WFP operations other than school feeding. In 2001, SPF developed a standardized school feeding baseline survey template and database, and it coordinated the first round of baseline surveys in 23 countries that had received resources from the US funded Global Food for Education Initiative (GFEI). The surveys were designed to produce reliable and useful information to meet two objectives. First, provision of monitoring and management information contributing to improving project quality; and second, to provide information for reporting project outcomes to donors. The first round of field level data collection was completed by the of end 2001. Following data entry and
analysis at HQ/SPF, preliminary baseline survey results were made available in April 2002. These efforts were successful largely due to the dedicated inputs of selected country offices in collaboration with SPF. The survey methods and instruments were further refined throughout 2002 in the context of Food for Education (FFE) activities in WFP’s emergency programme in Afghanistan, and in preparation for follow-up evaluation surveys and new baselines in additional countries where school feeding is taking place. In 2002, evaluation surveys were initiated in those countries that had implemented baseline surveys in 2001. Data from those surveys are now being processed in SPF and reports on survey results, comparing baseline with evaluation survey data, will be available by mid-2003. In addition, 21 new countries were trained on the survey tools in December 2002. Those countries plan to implement baseline surveys during the 2002/2003 school year. The survey software, which was developed for school feeding activities, has in the meantime been used also for a baseline survey on the FFE component of the Afghanistan emergency operation and for a baseline on de-worming activities of the same operation. It will also be used for a baseline on WFP’s Enhanced Commitments to Women. And it is being discussed in WFP headquarters how the approach and software used in school feeding can be applied in other WFP operations to contribute to RBM. This School Feeding Baseline Survey Manual is the cumulative result of these efforts and includes input from COs and numerous individuals, throughout 2001, 2002 and the first months of 2003. It aims to provide some practical assistance in implementing the baseline survey and follow up evaluation surveys for WFP-assisted school feeding projects. It does not intend to be complete, but rather has been designed to serve as a useful reference guide during the process of survey preparation, field level data collection and subsequent quality control at COs. SPF plans to ultimately include all guidance material on the standardized school feeding baseline and evaluation surveys in WFP’s Project Design Manual (PDM). For this, it will need to be modified and made self-explanatory. Any feedback from you on how this can best be accomplished and how the material included in this Manual can be further improved is most welcome and will benefit countries that will use the tools in the future.

Baseline Survey Manual
4
Using the manual The following manual is divided into four main sections: I. Introductions II. Setting the scene for surveying III. Information on survey sampling IV. Information on survey implementation V. Quality control Part I is a general introductory section on the activities that the School Feeding Unit has undertaken over the past years. Part II provides a more in-depth historical perspective as well as some insights into the rationale behind school feeding as a powerful means to supporting the global commitment to providing primary education to all. It also provides background and rationale for baseline surveys, monitoring and evaluation in the context of WFP operations. Part III provides detailed information on how samples have been identified for the baseline surveys conducted in 2001. Part IV provides information and guidelines on survey implementation as collected through past experiences and incorporating comments, advice and recommendations provided by the various Country Offices which have already carried out the surveys. Part V describes some common quality control issues that may surface when questionnaires are returned to the Country Office, and intends solely to provide some suggestions to assist the survey monitor is forwarding completed questionnaires to the Headquarters office in Rome.
Looking forward to continued successful collaboration with all participating COs. Katrin von der Mosel, Programme Adviser School Feeding Support Unit Strategy and Policy Division WFP Rome Dominique De Bonis, Consultant School Feeding Support Unit Strategy and Policy Division WFP Rome Anna Shotton, Programme Officer WFP Somalia 24 March, 2003

Baseline Survey Manual
5
Setting the scene for surveying An historic perspective This section intends to provide a brief overview of the social, cultural and political events that have given rise to the now global commitment to ensuring universal primary education. 1948 In 1948, through the Universal Declaration of Human Rights, the United Nations General Assembly proclaimed that all nations should strive, through teaching and education, to promote respect for the equal and inalienable rights of all members of the human family, that are the foundation of freedom, justice and peace in the world. Among these, is the right to elementary and fundamental education1. 1990 Despite global commitment and efforts, in 1990, more than 100 million children, including at least 60 million girls, still had no access to primary schooling, and more than 960 million adults, two-thirds of whom were women, were illiterate. The World Conference on Education for All in Jomtien, Thailand (5-9 March 1990) adjourned with a resolution to universalise primary education and massively reduce illiteracy before the end of the decade through the World Declaration on Education for All2. The Jomtien Declaration went beyond restating a global commitment. It outlined the numerous focus areas that were, and continue to be today, fundamental for sustainable education initiatives. Article VI, on Enhancing the Environment for learning, states: “Learning does not take place in isolation. Societies, therefore, must ensure that all learners receive the nutrition, health care, and general physical and emotional support they need in order to participate actively in and benefit from their education.” Articles VII, VIII and IX proceed to state the importance of wide-spread support for education through partnerships, policy and resource mobilisation: “… When we speak of "an expanded vision and a renewed commitment", partnerships are at the heart of it.” (Art. VII)
“If the basic learning needs of all are to be met it will be essential to mobilize existing and new financial and human resources, public, private and voluntary.” (Art. IX) 1996 Within six years an estimated fifty million more children were enrolled in primary school, and the number of out-of-school children had declined by 20 million3. The Mid-Decade Conference held in Amman Jordan in 1996, noted the achievements, but raised awareness with regards to the necessity for accurate, detailed reporting on results. This lead to the launching of a global exercise in 1998 that was the most comprehensive study ever made of basic education. Later called the EFA 2000 Assessment, it involved over 180 countries worldwide, and was carried out by ten regional advisory groups, comprising UN agencies the World Bank, bilateral donor agencies, development banks and inter-governmental organizations. Assessment objectives were geared at evaluating progress in the six Education for All “target dimensions” set forth in the Jomtien Framework for Action to Meet Basic Learning Needs, which may be summarised as follows: • Expansion of early childhood care and
developmental activities; • Universal access to primary schooling by the
year 2000 – simultaneously ensuring the possibility of completing it;
• Improvement in learning achievement; • Reduction of adult illiteracy, emphasising
female literacy to significantly reduce gender disparity in illiteracy rates;
• Expansion of provision of basic education and training in other essential skills;
• Increased acquisition by individuals and families of the knowledge, skills and values required for better living and sound and sustainable development.
The assessment revealed that while the number of children in school soared (from 599 million in 1990 to 681 million in 1998) and many countries were approaching full primary school enrolment for the first time, some 113 million children were still out of school, discrimination against girls was widespread, and nearly a billion adults – mostly women – were illiterate, demonstrating that the lack of qualified teachers and learning materials was a reality for too many schools4.

Baseline Survey Manual
6
2000 With the turn of the millennium, the continuing commitment to global education as the most powerful means of improving livelihoods grew to unprecedented levels. In February 2000, U.S. Ambassador to the UN Food and Agricultural Agencies in Rome, Mr. George McGovern launched the proposition that all children worldwide should receive lunch at school. The Dakar Framework for Action, adopted by the World Education Forum (Dakar, Senegal, 26-28 April 2000) restated a collective commitment to the basic EFA targets, and established that the international community would act to achieve them by launching a global initiative aimed at supporting national efforts. The initiative would include, inter alia: • increasing external finance for basic education; • ensuring greater predictability in the flow of
external assistance; • facilitating more effective donor coordination; • strengthening sector-wide approaches; • providing broader debt relief and/or
cancellation for poverty reduction, with a strong commitment to basic education;
• undertaking more effective and regular monitoring of progress towards EFA goals and targets.
In July, building on Ambassador McGovern’s ideas, as well as those of former Senator Bob Dole, U.S. President Bill Clinton announced the birth of the Global Food for Education Initiative (GFEI), coupled with a commitment by the USDA’s Commodity Credit Corporation, of $300 million for U.S. commodities, transportation, and administrative expenses. Under the initiative, implemented in fiscal years 2001 and 2002, with completion expected in fiscal year 2003, the United States Department of Agriculture (USDA) donated surplus U.S. agricultural commodities to USDA-approved school-feeding and pre-school nutrition programs in developing countries. These programmes were carried out by the United Nations World Food Programme (WFP), private voluntary organizations, and eligible foreign governments5. Forty-eight percent of the total commitment was dedicated to WFP6 for distribution through its School Feeding (SF) programmes in twenty-three countries, as part of WFP’s Global School Feeding Campaign (GSFC). In 2000, in September, the 191 Member States of the United Nations approved, and pledged to meet,
the eight Millennium Development Goals – the first of which is to eradicate extreme poverty and hunger, the second of which is to achieve universal primary education – defined in order to provide a framework for the entire UN system to work coherently together towards a common end. 2001 In September 2001, as part of its monitoring and evaluation programme, WFP began conducting baseline surveys for the GFEI/GSFC SF programme, the results of which are the scope of this report. 2002 Continued United States’ efforts to encourage a global commitment to school feeding and child nutrition have resulted in the Farm Security and Rural Investment Act of 2002 authorising $100 million in Commodity Credit Corporation funds to launch the McGovern-Dole International Food for Education and Child Nutrition Program (FFE program). The funds will be administered by the U.S. Department of Agriculture’s Foreign Agricultural Service and will continue to support education, child development, and food security for some of the world’s poorest children. Funds potentially dedicated to the WFP will continue to support those SF programmes initiated during the GFEI in 2000.
The rationale behind School Feeding7 The previous section briefly illustrated the historical context that has defined global interest and commitment to ensuring primary school education for children around the world. This section aims to describe the importance school feeding can have, and has had, on encouraging and sustaining primary education. While an empirical relationship is hard to define given the context, widespread research on school feeding has yielded positive results. Research over the past couple of decades has clearly highlighted that having basic education positively influences opportunities for improved economic and living conditions across a number of dimensions. Worldwide and historic agreement on the importance of education in poverty reduction is, and remains, unwavering. Nonetheless, improving enrolment and regular attendance has proven to be a challenging task, making it hard to meet the deadlines regularly posed for global education-related objectives.

Baseline Survey Manual
7
As early as the 1980’s, various research efforts have attempted to identify and investigate the recurring, underlying difficulties behind increasing primary school enrolment and retention. While numerous economic and socio-cultural factors have been seen to decrease enrolment and attendance, when present, school feeding programmes have frequently run parallel with increases in both. The theoretical base and justification for school feeding is complex, but it does exist, and is probably most easily appreciated if placed in the context of school-feeding study results. For the sake of objectivity, it must be said that studies addressing the effects of school feeding are frequently characterised by design difficulties as the variables affecting enrolment, attendance and retention are numerous, embedded in the socio-economic realities of the children, and difficult to isolate. Some studies, particularly those addressing the impact of school feeding on achievement and learning, have not clearly revealed a positive relationship between the presence of school feeding programmes and children’s performance. However, numerous researchers agree that this lack of causal identification is probably due to study design flaws and not to a lack of feeding programme impact. At the same time, a widespread lack of relevant baseline data has hampered accurate measuring efforts. Having said that, the following are brief summaries of only some of the results available, that demonstrate the influence of school feeding on, inter alia, enrolment, attendance, retention, achievement and health. These brief summaries by no means intend to be an exhaustive and conclusive statement as to the validity of school feeding programmes in positively affecting children in education. Studies span decades - with results addressing thousands of schools, millions of children and a multitude of countries: School feeding works to reduce short-term hunger Research has indicated that providing Jamaican primary school students with breakfast significantly increased attendance and arithmetic scores. Wasted, stunted or previously malnourished children benefited most. (D.T. Simeon and Sally Grantham-McGregor, “Effects of Missing Breakfast on Cognitive Functions of School Children of Different Nutritional Status”, American Journal of Clinical Nutrition (49), 1989) The author reviewed studies in North America and Jamaica comparing cognitive functions of children who did and children who did not have breakfast.
The results indicate that temporary hunger caused children to be more easily distracted and inattentive in class. (Ernesto Pollitt, “Malnutrition and Infection in the Classroom”, UNESCO, 1990) “Many children arrive at school without breakfast and/or after a long walk to school. Often these children suffer from short-term hunger. Short-term hunger can affect children who are well nourished and those who are not. A number of studies confirm that short-term hunger mitigation, via a breakfast or nutritional morning snack, can improve children’s cognition, short-term memory, verbal fluency and ability to concentrate (cites Pollitt 1990, WFP 1995, and Levinger 1994). These improvements are most significant among children who are malnourished. Therefore, school feeding activities that address short-term hunger and target under-nourished children can positively affect children’s short-term learning capacity.” (Cornelia Janke, “Food and Education: Background Considerations for Policy and Programming”, Education Development Center, Inc. for Catholic Relief Services, 1996) School feeding works to address specific micronutrient deficiencies “Remediation of iron deficiency through supplementation has eliminated the differences in school performance and IQ scores between schoolchildren previously deficient in iron and those without iron deficiencies.” (Seshadri and Gopaldas, “Impact of Iron Supplementation on Cognitive Function of Pre-School and School-age Children: The Indian Experience”, Journal of Clinical Nutrition (50) 19898) “An evaluation of a school breakfast program in Peru that included an iron-fortified ration showed that the program significantly increased dietary intakes of energy by 25%, protein by 28% and iron by 46%” (R.E. Jacoby, S. Cueto and E. Pollit, “Benefits of a School Breakfast Program among Andean Children in Huarez Peru”, Food and Nutrition Bulletin, 1996. 17(1)./ii). School feeding (and take-home rations) work to increase enrolment and attendance and to reduce drop-out rates, especially those of girls and vulnerable children in food-insecure areas “In India, a school feeding program attracted more girls to school and improved the attendance of those already in school.” --R.P. Devadas, “The Honorable Chief Minister’s Nutritious Meal Program for Children of Tamil Nadu, Ciombatore, India”, 1983/ii
Baseline Survey Manual
8
“In Bangladesh a program of school-based food distribution increased enrolment by 20% versus a 2% decline in non-participating schools” —A.U. Ahmed and K. Billah, “Food for Education Program in Bangladesh: An Early Assessment”, International Food Policy Research Institute, Bangladesh Food Policy Project, 1994/ii School feeding (particularly meals provided early in the day) improve students’ cognitive functions, in-class behaviour, ability to concentrate, and academic performance “Providing breakfast to primary school students significantly increased attendance and arithmetic scores”—D.T. Simeon and Sally Grantham-McGregor, “Effects of missing breakfast on the cognitive functions of school children of differing nutritional status”, American Journal of Clinical Nutrition/57, 1989/ii “Several Studies in the classroom have suggested that immediate improvements may occur in children’s behaviour following receipt of a snack or drink”—summary referring to studies by Laird et al., Keiser, and Benton et al., as cited in “The Effects of Breakfast on the School Performance and Growth of Children”, UNESCO, 1990 “Up to 25% of children—especially children from rural areas and girls—dropped out of school during a period without a school feeding program.”—J. King, “ Evaluation of School Feeding in the Dominican Republic”, CARE, 1990/i The study showed that in Burkina Faso, students—especially girls—who received school meals, had higher passing rates for the national exams.—E. Moore, “ Evaluation of the Burkina Faso School Feeding Program”, Catholic Relief Services consultant report (unpublished), 1994/i School feeding and take-home rations add to the food baskets of participating families Beneficiary families of primary school students in Bangladesh received 30 Kg of wheat per month. This food supplement to the families effectively raised the enrolment and attendance and reduced the dropout rates of these children of low-income families.—A.U. Ahmed and K. Billah, “Food for Education Program in Bangladesh: An Early Assessment”, International Food Policy Research Institute, Bangladesh Food Policy Project, 1994/ii “Food-assisted education aims to have both short-term and long-term food security impacts. Short-term impact is achieved simply by providing food to hungry beneficiaries. Long-term food security impact is based on the widely supported
recognition that an educated populace has more capacity and opportunity to ensure food security for itself and for the society as a whole.” –Cornelia Janke, “Food and Education: Background Considerations for Policy and Programming”, Education Development Center, Inc. for Catholic Relief Services, 1996 School feeding and take-home rations alleviate some of the costs of children’s education “Many children from poor families in Bangladesh do not attend school either because their families cannot afford expenses such as books or supplies, or because the children contribute to their family’s livelihood and cannot be spared. Under the Food for Schooling program, a free monthly ration of foodgrains becomes an income entitlement enabling a child from a poor family to go to school. The family can consume the grain, thus reducing its food budget, or it can sell the grain and use the cash to meet other expenses. —U. Ahmed Akhter and Carlo de Ninno, 2001, “Food for Education Program in Bangladesh: An Evaluation of its Impact on Educational Attainment and Food Security”, International Food Policy Research Institute, 2001 “Food for Education boosts demand: Parents or children feel that…costs to attend are too high…(etc.) Use food to offset costs. Use food to get parents involved in school. Use food to build links between home and school…”--Beryl Levinger, “School Feeding, School Reform and Food Security: Connecting the Dots”, Education Development Center, June 2002 School feeding acts as a catalyst for community participation, complementary education, and other needed inputs Levinger’s report says that parent committees traditionally manage the food or prepare meals for school feeding programs; the committees can lead to parents and others in the communities being more involved in other local school matters. ---Beryl Levinger, “School Feeding Programs in Developing Countries: An Analysis of Actual and Potential Impact, U.S. Agency for International Development Evaluation Special Study No. 30, 1986 “Most parents even in the poorest communities are willing to provide whatever resources they can spare to support programs for their children, especially when those programs meet a need they recognize and value.”—E. Young, “Integrated Early Childhood Development: Challenges and Opportunities”, World Bank, 1995
Baseline Survey Manual
9
“Traditionally, stakeholder participation in school feeding programs consisted of community (parent) volunteers to cook the food, parental contributions of condiments, containers or cooking utensils, and teacher (with some parental participation) oversight of food storage, distribution and record-keeping….Because of the important incentive/reward function performed by food, food-assisted education programs have a particular opportunity and responsibility to emphasize stakeholder involvement in education change activities, and herein lies an opportunity.” – Cornelia Janke, “Food and Education: Background Considerations for Policy and Programming”, Education Development Center, Inc. for Catholic Relief Services, 1996 “On-site feeding…is also a model that can invite or require community participation.” Joy Miller Del Rosso, in “School Feeding Programs: Improving effectiveness and increasing the benefit to education”, The Partnership for Child Development 1999
The rationale behind baseline studies, monitoring and evaluation9 The previous section briefly described selected study results that illustrate the value of school feeding in initiatives supporting primary education. It also raised some of the issues affecting impact assessment of school feeding programmes. This section aims to outline the rationale behind a comprehensive approach, that if carefully implemented, can greatly assist in accurately assessing the impact of programme activities over time: the use of Baseline studies, followed by rationalised Monitoring and Evaluation exercises.
Definitions All aid programmes exist with a mandate to improve select conditions in a target area and/or population. Such improvement will take the form of different degrees of change in those conditions over time. That expression of change “indicates” how the programme is proceeding – and is called an indicator of programme performance. Baseline surveys collects data prior to – or in the earliest phases – of programme implementation to identify a starting level for all indicators of interest, against which future measurements can be compared. (Baseline surveys may also be used to collect benchmark information on selected indicators at a certain point of time - this is the appropriate definition in the case of the surveys conducted in 2001).
Monitoring and Evaluation, very frequently mentioned together in the same breath, actually refer to two different exercises and scopes. As with many concepts there are no single "true" definitions but these are the most widely accepted. Monitoring is a continuous assessment both of the functioning of the project activities in the context of implementation schedules and of the use of project inputs by targeted populations in the context of design expectations. It is an internal project activity, an essential part of good management practice, and therefore an integral part of day-to-day management.(Casley and Kumar (a)) Evaluation is a periodic assessment of the relevance, performance, efficiency, and impact of the project in the context of its stated objectives. It usually involves comparisons requiring information from outside the project - in time, area, or population.(Casley and Kumar (a))
Monitoring and evaluation form part of a cyclical process which follows the life, and after-life of a project. Baseline studies precede both and identify conditions as the moment of “birth” of a project, and serve to identify the starting point against which all subsequent measured results may be compared.
Purpose of baselines, monitoring and evaluation A monitoring and evaluation system, based on baseline information, feed back information to project managers to enable them to undertake the basic managerial functions; planning, directing, and decision-making. Together, monitoring and evaluation have two objectives: • to promote efficient and effective
implementation and operation of development projects and programmes; and
• to provide lessons for the planning and design of future projects, and to contribute to a review of a wider strategy on development and, in the case of WFP, food aid.
In attaining these objectives there needs to be an assessment in three areas: • how is the plan being implemented? On
schedule? To budget? • are the plan's objectives being achieved? • are the objectives appropriate? Is it the right
plan? Monitored information, which indicates inadequate operation, shortfall in performance or discrepancy between projected targets and those achieved, provides the basis for decisions and action by

Baseline Survey Manual
10
project management to bring the project back into line. Following further investigation and collection of more detailed information if necessary it is important that objectives are formulated from sound research, planning and lessons from past projects in order to validate this method of control. Although project managers are the main users of the monitoring and evaluation system other stakeholders, including donors and beneficiaries, have an interest in the project's progress.
Project and M&E design Project objectives: Long-term objectives Immediate objectives Inputs: Human, physical and financial resources used in the operation of the project (e.g. amount of food being delivered, government contribution of personnel, operating expenses). Outputs: Inputs of the desired quantity and quality are generally used within the project to produce outputs in the form of either goods or services or both, for example: forestation areas, number of people receiving food aid, number of clinics staffed and functioning. Outcome (Effects): If beneficiaries respond positively to project activities their actions will give rise to direct effects upon the project beneficiaries and the project area. For example: increased local school attendance, improved nutritional status. Effects are not only dependent upon the project outputs, but also the action of the beneficiaries in response to the existence of the project. Local school attendance will only increase if the beneficiaries choose to send their children to a newly built school. The effects of a project are therefore sometimes difficult to anticipate and measure as they are determined by more than one influence, making clear attribution to the project activities almost impossible. Impact: The sum of each of these individual effects will have an overall impact on the project area and population. Along with any other complementary projects there is likely to be a combined impact on the regional or national economy, for example: children's health, adult literacy rates.
Project Cycle Management
Inputs
Accounts, administrative reports, monitoring
Outputs Monitoring
Outcome Effects
On-going evaluation
Impact
���� ���� ����
���� ����
���� ����
���� ����
���� ���� ����
Impact Assessment / Ex-
or post evaluation The Logical Framework Approach (LFA) is used to ensure that all of the factors, linkages and causal relationships associated with the project and its environment (social, political, economic, cultural, geographical and ecological) are taken into consideration in project planning, appraisal and evaluation. As the principles of LFA are very simple it can be applied to many different projects, making it a valuable project management tool. Some agencies use the LFA as a tool for brainstorming a new project design, others complete one as a succinct summary after planning. It uses the continuum within the hierarchy of objectives to show linkages between each level by assuming that if there are certain inputs there will be certain predictable outputs. These outputs will then lead to certain effects, and these effects will have certain impacts overall. This would only be true, however, if the project environment were stable. To account for this the LFA includes assumptions, which must hold true if the planned linkages are to occur. As a basis for baseline surveys, monitoring and evaluation there is provision to specify quantified and time-bound indicators and targets, and measures of performance, by which the degree of success in achieving the objectives can be verified. It is set out in matrix form, as below.

Baseline Survey Manual
11
Logical Framework Matrix Logical Framework Hierarchy Performance
Indicators Means of justification (Monitoring & Evaluation)
Assumptions and Risks
Goal: The higher objective to which an operation, along with others, is intended to contribute
Impact indicators: Indicators (increasingly standardized) to measure programme performance.
The programme evaluation system
Risk regarding strategic impact.
Purpose: The outcome of an operation. The change in beneficiary behavior, systems or institutional performance because of the combined output strategy and key assumptions.
Outcome indicators: Measures that describe the accomplishment of the Purpose. The value, benefit and return on the investment.
People, events, processes, sources of data for organizing the operation's evaluation system.
(Purpose to Goal) Risk regarding programme level impact
Outputs: The actual deliverables. What the operation can be held accountable for.
Output indicators that measure the products, goods and services, which result from a WFP operation.
People, events, processes, sources of data - supervision and monitoring system for validating operation design.
(Output to Purpose) Risk regarding design effectiveness
Activities: The main activity clusters that must be undertaken in order to accomplish the Outputs.
Inputs / Resources Budget by activity; monetary, physical, & human resources required to produce the Outputs.
People, events, processes, sources of data - monitoring system for validating implementation progress.
(Activity to Output) Risk regarding implementation and efficiency.
When taken together, these core concepts provide an organizational framework for summarizing the fundamentals of programme/project cycle management. The Log Frame does not replace or substitute for traditional analytical tools and methods. Instead, it provides a structure for using these productively and collaboratively.
The selection of indicators The selection of indicators is perhaps the most important, and in some cases the most difficult, aspect of designing baseline, monitoring and evaluation activities. The selection process needs to involve the project or activity manager who may benefit from advice from a monitoring specialist. Indicators cannot be selected from a guidebook, but instead must be directly related to a particular project. An indicator is an item of information, which conveys a change or result expected at each level of the project hierarchy in order to demonstrate progress. An indicator may be either direct or indirect (proxy) but should be such that reasonable independent observers would agree that progress has or has not been made as planned. A target is an explicit statement of results desired for a particular indicator over a specified time period. It is the planned performance standard against which actual performance may be subsequently compared and measured. Targets should be specified in terms of magnitude, target area (or recipients) and time. Target values can be
set in relation to norms, such as height for age or weight for age measures in human populations, or in relation to criteria such as the desired number of women participating in a day nursery scheme. Appropriate indicators should be defined as part of project design. Initial ideas may need to be reviewed from time to time as experience of managing a project often leads to the need for changes or refinements at a later stage. There are certain rules of thumb that can be applied to their selection. All indicators should be: valid measure what they are supposed to
measure; reliable verifiable or objective; relevant to project objectives; sensitive to changes in the situation being
observed; specific adapted to a particular project
objective; timely the data can be collected and
reported in a timely fashion; attainable the required data can actually be
collected; and cost effective worth the time and money it costs
to collect the data. Indicators should be selected at each level of the objective hierarchy: inputs, outputs, effects and impacts. In general, the emphasis should be on the selection of key indicators from a list of potential ones. An excessive number of identified indicators is likely to be an indication of incomplete planning, and may mean that the indicators are unrelated to specific objectives or outputs. Although indicators

Baseline Survey Manual
12
are used for monitoring within the project time frame they must also support future evaluation data requirements. Some objectives, particularly impact objectives, are difficult to monitor. In these cases it is necessary to select 'proxy' or indirect indicators which are easier to measure: "The effectiveness of a child health programme may best be measured by mortality rates but these are difficult to determine over short periods. Hence a proxy indicator, such as the percentage of births which are attended by trained health personnel and the availability of and frequency of health facilities may be used."
Clayton The use of proxy indicators requires attention to be paid to the relationships assumed between the ideal and proxy variables. Selection of effective indicators is one of the keys to successful monitoring and evaluation, and requires careful consideration by management of all factors influencing a project.
Indicator data requirements Depending on the indicator, the required data may be of quantitative or qualitative nature, where the first reflect tangible, verifiable, or numeric information, and the second reflect perceptions and quality of, as well as opinions about, a particular experience or condition as its beneficiaries view it. Quantitative data are normally collected via closed-ended questions and/or questions with limited response options (e.g., multiple choice from lists of options). Qualitative data is usually collected through a more participatory approach, usually through open-ended questions that allow respondents to enter into discussion towards issues that they find important.
Data Sources Data may be obtained from primary or secondary sources. Primary data are obtained through direct contact with respondents and entail face-to-face information sharing between the surveyor and the representatives of the population under survey. Secondary data simply means information that has already been collected by others –i.e., routine data collected by institutions participating in an activity (e.g. schools, health centres). Making use of solid secondary data (accurate collection methodology and verification of validity) is very resource-effective.
Stratification and desegregation of data Common variables for stratification are geographic location, gender, age groups, school grades, etc., and should be selected on the basis of the analytic needs of the operation. The best practice is to list the factors for stratification in the indicators. This ensures that critical pre-stratification needs are considered prior to choosing a sample. It also ensures that post-stratification (or disaggregating) occurs during analysis.

Baseline Survey Manual
13
Part II. The School Feeding baseline survey Definitions Enrolment 1. Enrolment (E): This figure is the official figure recorded at the beginning of the school year. There is usually an enrolment period at the beginning of the school year. After the enrolment period has closed children may still enroll or leave. The official figure for the year nevertheless remains the same as recorded at the end of the enrolment period. 2. School enrolment: Same as “enrolment”. 3. Absolute enrolment rate: The actual number of children enrolled in a school. 4. Gross enrolment rate: Considers all children enrolled in a school, regardless of their age. 5. Gross enrolment: Same as “gross enrolment rate”. 6. Gross enrolment ratio (GER): Total number of children enrolled at a specific level of education regardless of age, expressed as percentage of the official school age population corresponding to the same level of education in a given school year. Note: the GER may exceed 100.
Formula: (Total enrolment / catchment area) / 100 7. Net-enrolment rate: Percentage of primary school-age children in a school catchment area who are enrolled in primary school - excludes children who fall outside the primary school age group (according to the national/local definition of school-age group). 8. Net-enrolment: Same as “net enrolment rate”. 9. Net enrolment ratio (NER): Number of children in the official age group enrolled at a given level of education, divided by the total number of children of that age in a given school year. Note: the NER may not exceed 100. Formula: ((Enrolment - over and under age children)
/ catchment area) / 100
10. School Catchment Area: Area surrounding a school where primary school-age/potential school-going children reside. Attendance 11. Attendance Ratio (AR): Number of different measures are subsumed within this indicator. The usual is the Average Monthly Attendance Ratio – the cumulative total of the number of students present during the month divided by the total number of school days during that month expressed as a percentage of total enrolment. Sampling 12. Sample Frame: Total number of schools from which the sample should be taken 13. Sample (size): Actual number of schools to be evaluated
Determining Grade Level and Relevant Age International Standard Classification of Education (ISCED) used by UNESCO 1. First-level: PRIMARY
• starts between 5 and 7 years of age and last four to six years
2. Second-level: SECONDARY (including lower and upper secondary)
• Lower Secondary: begins between ages 10 and 12 and last 2 to 3 years
• Upper Secondary: begins between ages 13 and 15 and lasts 3 to 5 years
3. Third-level: HIGHER EDUCATION, and including that which does not lead to a degree or equivalent
• begins between ages 17 and 19 years and lasts for 3 or 4 years
School Feeding Indicators 1. Percentage of children by (gender and by
age group) enrolled in school - Net Enrolment Rate
Numerator: number of girls or boys of primary school age enrolled this year
Denominator: number of girls or boys of primary school age
2. Enrolment of children by gender and age
group - Enrolment

Baseline Survey Manual
14
Number of children enrolled 3. Ratio of children (by gender) enrolled in
grade six to the number enrolled in grade one
Numerator: number of boys and girls enrolled in grade/standard six
Denominator: number of girls or boys enrolled in grade/standard one
4. Monthly attendance rate of school children
(boys or girls) enrolled in each grade by gender Numerator: sum of total number of girls and boys present each school day of the month
Denominator: number of girls or boys of primary school age enrolled this month x number of school days in the month
5. Percentage of children (by gender) in sixth
grade continuing into first year high school Numerator: number of girls or boys enrolled
last year in grade six who enrolled in secondary school this year
Denominator: number of girls or boys of primary school age enrolled and completing grade six last year
6. Significance of the relief of short-term
hunger (by gender and age group) to alleviating children's difficulties in maintaining attention Scaling: significance of short-term hunger (for all children) to children's difficulties in maintaining attention
7. Ratio of number of full time teaching staff to
number of students (by gender and grade) Numerator: number of full time teaching staff
equivalent by gender/grade this year Denominator: number of girls or boys of
primary school age enrolled in each grade this year
8. Ratio of number of pupils to number of
classrooms Numerator: number of pupils this year Denominator: number of classrooms this year 9. Rate of teaching staff involvement in feeding
programme Numerator: number of male and female
teaching staff involved in school feeding programme
Denominator: number of male and female teachers at school
10. Ratio of number of PTA and community
members involved in feeding programme to total number of teachers and employees
involved in the feeding programme (by gender)
Numerator: number of PTA and community members involved in the feeding programme
Denominator: number of teachers and employees involved in school feeding programme
11. Ranking of household/family commitments
as reason for absence of enrolled children (by gender) Ranking: ranked reasons for absence of enrolled children
12. Ranking of household/family commitments
as reason for non-enrolment of children (by gender) Ranking: ranked reasons for non- enrolment of children
13. Percentage of schools where pupils are
involved in the management of the school and/or the feeding programme
Numerator: number of schools where pupils are involved
Denominator: total number of schools 14. Monthly attendance rate of teachers (by
gender and pupils’ grade module) Numerator: sum of total number of male and
female teachers present each school day of this month
Denominator: number of male and female teachers employed this month x number of school days in the month.
The following pages present the Generic Logical Framework for WFP assisted School Feeding projects that was designed as a basis for the ensuing Baseline studies. It lists the rationale, the objectives, inputs, outputs and related indicators (mentioned above).

Baseline Survey Manual
15
Generic Logical Framework for WFP assisted School Feeding projects
Narrative summary Objectively Verifiable Indicator
Means of Verification
Implications for Base-line Survey
Goal: promoting basic education in alleviating poverty and hunger and improving people's lives
Rationale: School Feeding Projects (food for education FFE) encourage enrolment and attendance, help prevent 'drop-out' and stimulate learning. They contribute to the long term goal of promoting basic education in alleviating poverty and hunger and improving people's lives. Refer to: World Conference on Education for All (Jomtien, Thailand 1990), World Summit for Social Development (Copenhagen, Denmark 1995), Fourth World Conference on Women (Beijing, China 1995), World Education Forum (Dakar, Senegal, 2000). Education and increased awareness are catalysts for a range of improvements in economic and social well-being. Education equips individuals for continued learning, critical thinking and social awareness, better access to information, more informed choices and the exercise of their civil rights.
Macro-economic and social indicators. Benefits that might be measured include: - self-employment; increased productivity; increased incomes; more equal distribution of incomes; more informed choices on health and reproductive health; environmental awareness; social cohesion.
Modelling and compilation of national statistics undertaken by government partners and international agencies. Possible to conduct in-depth HH surveys in defined target areas.
Assessment of such goal impacts is beyond the remit of the base-line survey. The base-line is limited to calibrating indicators of changes (outcomes) over which WFP has a high degree of influence or direct control. Baseline can thus contribute to Results Based Management. It is acknowledged that many impacts at this level simply may be attributed, in part, to WFP activity. Information on goal indicators may be reviewed during design studies and appraisal missions and reassessed during evaluations.
School feeding programmes also have an immediate dietary impact. Providing school meals to satisfy immediate hunger and thus help children to concentrate and assimilate knowledge treats an immediate symptom. School meals may counterbalance to some degree, deficiencies in the regular diet, especially with respect to micro-nutrients. WFP school feeding programmes are designed also to address underlying causes in the long term. The benefits of school meals programmes are maximized when integrated into comprehensive school education and health interventions, in particular, when relevant, with intestinal helminth control programmes. In EMOPs and PRROs nutritional and dietary objectives may be more prominent along with efforts to maintain education services. FFE also may be integrated with other services addressing the needs of traumatised school children and particular needs in situations where orphaned children may be heads of households.
Practical collaboration with other agencies in the field. Integration with other WFP interventions in-country. Community support and involvement in individual school feeding programmes.
Programme identification missions. Project Design Studies (including VAM surveys and identification of feeding regimes and rations etc). Project Proposal documents, Project Appraisal Reports, Baseline surveys, Evaluation Reports, Special surveys.
Included in the base-line survey are issues pertaining to an integrated strategy: provide a healthy school environment (type of school, presence of PTA or equivalent, community - and women's - involvement, school water source, school sanitation); link with other agencies (other donor activity at school); targeted and flexible programme (nature of WFP feeding program at school - ration, feeding days, records).
Strategy: Ideally FFE programmes are combined with other education resources to enhance educational outcomes through integrated programming with governments and other UN agencies and NGOs. A healthy school environment, school health education, school health services (including de-worming), school meals and the mobilization of parents and communities are elements of integrated approaches. In addition programmes are targeted to the most vulnerable and poor, emphasize internal links within WFP and retain flexibility to respond to changing circumstances.
Practical collaboration with other agencies in the field. Integration with other WFP interventions in-country. Community support and involvement in individual school feeding programmes.
Programme identification missions. Project Design Studies (including VAM surveys and identification of feeding regimes and rations etc). Project Proposal documents, Project Appraisal Reports, Baseline surveys, Evaluation Reports, Special surveys.
Do not include issues on dietary impact in base line surveys. Too complex and such issues more properly part of project identification and implementation output monitoring.
Purpose: Increase access to basic education for boys and girls from poor families
To increase access to basic education for boys and girls by facilitating access to education for people living in poverty by providing meals as an incentive for families to keep children in school
There is a need to define beneficiaries (not simply those who are fed) in the context of school feeding projects. For example the beneficiaries of programmes supplying take-home rations are those girls that are enabled

Baseline Survey Manual
16
Generic Logical Framework for WFP assisted School Feeding projects
Narrative summary Objectively Verifiable Indicator
Means of Verification
Implications for Base-line Survey
to attend school. Whether as a result of the income transfer or changing cultural values and mores is difficult to measure.
Interventions: Programme/project identification and definition is based upon an analysis of particular problems and their cause during project design missions, at appraisal and as a result of baseline studies. A key to the theoretical underpinning for school feeding programmes is the principle of 'plausible inference'; if it has been demonstrated (eg in a research study or previous project) that an intervention, carried out under specific conditions, produces a certain effect, it can be assumed that the same intervention will always produce the same effect provided it is carried out under similar conditions. Most school feeding interventions will have been determined through assessments made of food security, the degree to which low enrolment and attendance results from poverty, cultural factors and the income transfer value of the proposed ration. The efficiacy and appropriateness of the proposed ration will also have been carefully determined. Interventions may be linked with others associated with the
1. How many (proportion of children of school age) enrolled at school because of school feeding?;
2. How many continue to be enrolled from year to year;
3. Have attendance rates increased (at particular times of year) as a result of school feeding?;
4. Are they learning? Of particular interest is what percentage of new learners are girls?
5. If children are not attending school then why not?
6. And if not enrolled in school then why not ?
Surveys and monitoring. Evaluation reports
Indicators to be calibrated by base-line surveys. Key outcome (purpose) indicators are quantifiable, easily measurable, specific and report on results directly attributable to the WFP activity. The outcome 'livelihoods improved' is not only a too broad a category but also beyond WFP's capability in the medium term. In using logical framework analysis to determine indicators care must be exercised to allow for consideration of the unpredicted and the unexpected. LFA assumes a logical progression to predicted outcomes and impacts. This is not always so. What is important is to establish and monitor 'trends and directions' and through a continual base-line monitoring programme to try and identify and assess the project outcomes (expected and unexpected) as they emerge. Survey should include indicators that examine the reasons why the project is 'missing' some families. Difficult to identify indicators of change in community attitudes and and cultural mores.
Cross-cutting issues - Gender, sustainability and participation. It is important to note that sustainability should not be related simply to continuing school feeding per se but to the lasting impact of the behaviour changes brought about (attitudes to education etc, decisions on resource allocation within households that facilitate children, especially girls, to attend school).
Measurement Focus Indicator
Description
Definition numerator denominator
Issues/Questions
Specific objective; contribute to increasing enrolment of girls and boys. Contribute to increasing enrolment of girls and boys (food aid provided to day students, and boarding students as incentive for enrolment in the form of school meals or take home rations) (SFHB: 196)
Indicator 1 Percentage of primary school-age children by gender (in each age group) enrolled in school at a particular date at the beginning of the school year - net enrolment rate
This indicator defines the proportion of primary school-age children (in each age group) who are enrolled in school. The net enrolment rate
Number of primary school-age girls or boys (in each age group) enrolled in school
Total number of primary school-age boys or girls (in each age group) in the school catchment (as defined)
Indicator 2 Number of children enrolled (by gender and by grade/standard) - absolute enrolment
This indicator simply registers the number of children enrolled in each grade/standard at school
Number of children enrolled in each grade in school
1. Measures those enrolled as a proportion of total age group at beginning of the year only, for measuring between year variation over a period of a number of years. The numerator provides the denominator for other indicators. ('Attendance' measures the within year variation). 2. Identify the 'key' explanatory variables for the indicator for the school in question. These indicators also measured - see 9 and 10 3. Rate of change in absolute enrolment is a simpler indicator and is to be collected through ARGOS. 4. Net enrolment and enrolment are

Baseline Survey Manual
17
Measurement Focus Indicator
Description
Definition numerator denominator
Issues/Questions
Indicator 1 is recommended by the FANTA Indicator Guide. This indicator is not included in the WFP Indicator Menus. In the School Feeding Handbook it is not recommended (SFHB p 239) and the simple absolute enrolment figure (Indicator 2) is used (also in the FANTA Guideline). Is a UPE benchmark (Dakar 2000)
essential indicators. The pilot and the first round of the B'line survey showed they were very difficult to collect in many countries. They must be distinguished from'beneficiaries'.
Purpose: These indicators assesses the degree to which families are enrolling girls and boys in school and thus investing in future opportunities. The net enrolment ratio indicator includes girls and boys of a particular age enrolled in school at whatever grade. The indicators reflect a range of conditions influencing child education in a particular area which are expected to be 'offset' in the medium term by the provision of school feeding.
School records. Also recorded by ARGOS. The Country Profile Baseline provides a check
Catchment must be defined - Ministry of Education or from school; community mapping with school students; census records.
Both indicators difficult to collect. Must be distinguished from 'beneficiaries'. Changing enrolment and net enrolment are cruciak indicators. Monitoring systems need to be established to accurately record these measures.
Further baseline study for a sample of schools: 1. record location of school and access (is it isolated - measure of govt support etc?); 2 Distances travelled by pupils and mode of travel to school (time taken); 3. Map variation in enrolment across the catchment; 4. Community profiling across the catchment (PRA and appropriate sampling) hh incomes etc, hh calendar (seasons), parental attitudes, opportunity cost of schooling.
Constructing a baseline profile of the school and the community it serves provides some explanatory information for the net enrolment rate. The key factors may then be monitored if useful. The suggested baseline data to be collected complements that included in Sections 5 and 6 in Part III of the School Feeding Handbook.
Methods and data sources: school records, PRA mapping exercises, community profiling, hh surveys and interviews/focus groups etc with parents. Changes are long term and may not be noticeable in the short to medium term. However information gathered may support more appropriate targeting.
The degree to which these factors are addressed (and change positively) gives an indication of the long term sustainability of the increases in school enrolment stimulated by the school feeding programme. Some factors reflect government commitment to education for all. Some factors reflect parental/community attitudes. Reasons for no-enrolment should be used to more clearly focus and target school feeding and associated interventions.
Specific objective: contribute to the continued enrolment from year to year of girls and boys. Contribute to stable attendance and prevent drop-out of girls and boys (food aid provided to day students as incentive for enrolment in the form of school meals or take home rations) (SFHB: 196)
Indicator 3 Ratio of children (by gender) enrolled in grade six to the number enrolled in grade one
This indicator shows the ratio of boys or girls in grade six to those in grade one (is a crude measure of rentention)
The number of boys or girls enrolled in grade six at the beginning of the school year
The number of boys or girls enrolled in grade one at the beginning of the school year
Retention of girls in the school system is an indicator of changing attitudes to marriage etc. Trained personnel may be able to calculate drop-out rates from the grade disaggregated enrolment data (is complex).
Retention rates are recommended by the FANTA Indicator Guide. Retention rates are also included in the WFP Indicator Menus (monitoring indicator). The SFHB monitoring forms do not collect by grad and recommend a simple drop-out rate as an indicator. Completion rate is a UPE benchmark (Dakar 2000).
Purpose: This indicator measures the retention rate over time of girls and thus may reflect the ability of families to make continued commitments to educate their children. Factors affecting the family's ability may be within its control but others may be beyond its control. The indicator reflects the degree to which a range of conditions influencing longer term commitment to child education in a particular area continue to be 'offset' in the medium term by the provision of school feeding.
School records School records
Baseline Survey Manual
18
Measurement Focus Indicator
Description
Definition numerator denominator
Issues/Questions
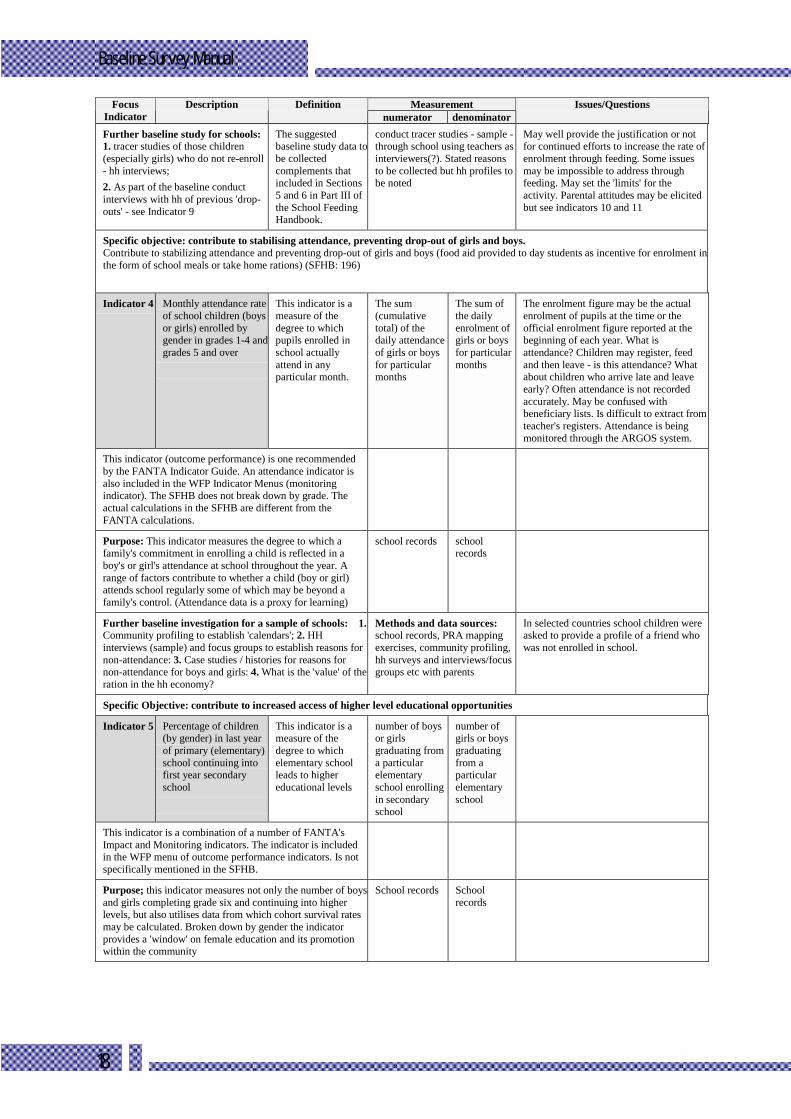
Further baseline study for schools: 1. tracer studies of those children (especially girls) who do not re-enroll - hh interviews; 2. As part of the baseline conduct interviews with hh of previous 'drop-outs' - see Indicator 9
The suggested baseline study data tobe collected complements that included in Sections 5 and 6 in Part III of the School Feeding Handbook.
conduct tracer studies - sample -through school using teachers as interviewers(?). Stated reasons to be collected but hh profiles to be noted
May well provide the justification or not for continued efforts to increase the rate of enrolment through feeding. Some issues may be impossible to address through feeding. May set the 'limits' for the activity. Parental attitudes may be elicited but see indicators 10 and 11
Specific objective: contribute to stabilising attendance, preventing drop-out of girls and boys. Contribute to stabilizing attendance and preventing drop-out of girls and boys (food aid provided to day students as incentive for enrolment in the form of school meals or take home rations) (SFHB: 196)
Indicator 4 Monthly attendance rate of school children (boys or girls) enrolled by gender in grades 1-4 andgrades 5 and over
This indicator is a measure of the degree to which pupils enrolled in school actually attend in any particular month.
The sum (cumulative total) of the daily attendance of girls or boys for particular months
The sum of the daily enrolment of girls or boys for particular months
The enrolment figure may be the actual enrolment of pupils at the time or the official enrolment figure reported at the beginning of each year. What is attendance? Children may register, feed and then leave - is this attendance? What about children who arrive late and leave early? Often attendance is not recorded accurately. May be confused with beneficiary lists. Is difficult to extract from teacher's registers. Attendance is being monitored through the ARGOS system.
This indicator (outcome performance) is one recommended by the FANTA Indicator Guide. An attendance indicator is also included in the WFP Indicator Menus (monitoring indicator). The SFHB does not break down by grade. The actual calculations in the SFHB are different from the FANTA calculations.
Purpose: This indicator measures the degree to which a family's commitment in enrolling a child is reflected in a boy's or girl's attendance at school throughout the year. A range of factors contribute to whether a child (boy or girl) attends school regularly some of which may be beyond a family's control. (Attendance data is a proxy for learning)
school records school records
Further baseline investigation for a sample of schools: 1.Community profiling to establish 'calendars'; 2. HH interviews (sample) and focus groups to establish reasons for non-attendance: 3. Case studies / histories for reasons for non-attendance for boys and girls: 4. What is the 'value' of the ration in the hh economy?
Methods and data sources: school records, PRA mapping exercises, community profiling, hh surveys and interviews/focus groups etc with parents
In selected countries school children were asked to provide a profile of a friend who was not enrolled in school.
Specific Objective: contribute to increased access of higher level educational opportunities
Indicator 5 Percentage of children (by gender) in last year of primary (elementary) school continuing into first year secondary school
This indicator is a measure of the degree to which elementary school leads to higher educational levels
number of boys or girls graduating from a particular elementary school enrolling in secondary school
number of girls or boys graduating from a particular elementary school
This indicator is a combination of a number of FANTA's Impact and Monitoring indicators. The indicator is included in the WFP menu of outcome performance indicators. Is not specifically mentioned in the SFHB.
Purpose; this indicator measures not only the number of boys and girls completing grade six and continuing into higher levels, but also utilises data from which cohort survival rates may be calculated. Broken down by gender the indicator provides a 'window' on female education and its promotion within the community
School records School records
Baseline Survey Manual
19
Measurement Focus Indicator
Description
Definition numerator denominator
Issues/Questions
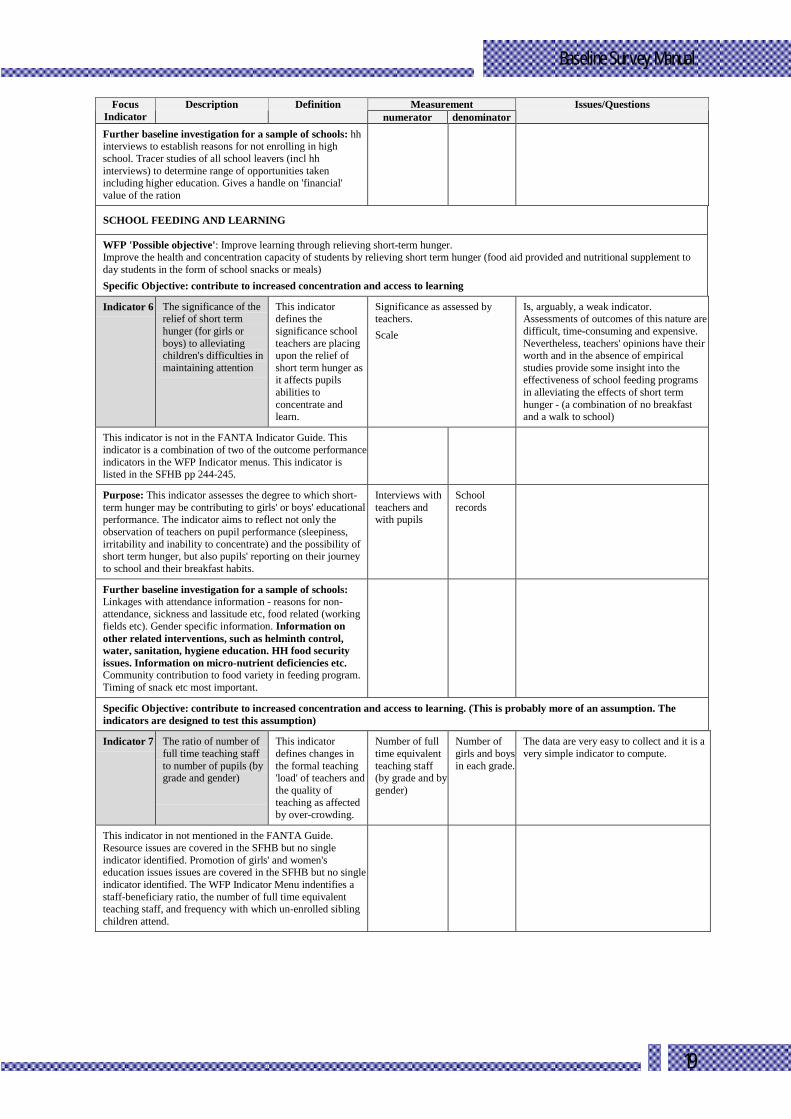
Further baseline investigation for a sample of schools: hh interviews to establish reasons for not enrolling in high school. Tracer studies of all school leavers (incl hh interviews) to determine range of opportunities taken including higher education. Gives a handle on 'financial' value of the ration
SCHOOL FEEDING AND LEARNING
WFP 'Possible objective': Improve learning through relieving short-term hunger. Improve the health and concentration capacity of students by relieving short term hunger (food aid provided and nutritional supplement to day students in the form of school snacks or meals) Specific Objective: contribute to increased concentration and access to learning
Indicator 6 The significance of the relief of short term hunger (for girls or boys) to alleviating children's difficulties in maintaining attention
This indicator defines the significance school teachers are placing upon the relief of short term hunger as it affects pupils abilities to concentrate and learn.
Significance as assessed by teachers. Scale
Is, arguably, a weak indicator. Assessments of outcomes of this nature are difficult, time-consuming and expensive. Nevertheless, teachers' opinions have their worth and in the absence of empirical studies provide some insight into the effectiveness of school feeding programs in alleviating the effects of short term hunger - (a combination of no breakfast and a walk to school)
This indicator is not in the FANTA Indicator Guide. This indicator is a combination of two of the outcome performance indicators in the WFP Indicator menus. This indicator is listed in the SFHB pp 244-245.
Purpose: This indicator assesses the degree to which short-term hunger may be contributing to girls' or boys' educational performance. The indicator aims to reflect not only the observation of teachers on pupil performance (sleepiness, irritability and inability to concentrate) and the possibility of short term hunger, but also pupils' reporting on their journey to school and their breakfast habits.
Interviews with teachers and with pupils
School records
Further baseline investigation for a sample of schools: Linkages with attendance information - reasons for non-attendance, sickness and lassitude etc, food related (working fields etc). Gender specific information. Information on other related interventions, such as helminth control, water, sanitation, hygiene education. HH food security issues. Information on micro-nutrient deficiencies etc. Community contribution to food variety in feeding program. Timing of snack etc most important.
Specific Objective: contribute to increased concentration and access to learning. (This is probably more of an assumption. The indicators are designed to test this assumption)
Indicator 7 The ratio of number of full time teaching staff to number of pupils (by grade and gender)
This indicator defines changes in the formal teaching 'load' of teachers and the quality of teaching as affected by over-crowding.
Number of full time equivalent teaching staff (by grade and by gender)
Number of girls and boys in each grade.
The data are very easy to collect and it is a very simple indicator to compute.
This indicator in not mentioned in the FANTA Guide. Resource issues are covered in the SFHB but no single indicator identified. Promotion of girls' and women's education issues issues are covered in the SFHB but no single indicator identified. The WFP Indicator Menu indentifies a staff-beneficiary ratio, the number of full time equivalent teaching staff, and frequency with which un-enrolled sibling children attend.
Baseline Survey Manual
20
Measurement Focus Indicator
Description
Definition numerator denominator
Issues/Questions
Purpose: this indicator is a simple measure of the resources invested to provide and maintain the quality of education provided in schools (tests an assumption). It is also a measure of the dissonance between encouraging school enrolment and attendance and the ability of the education system to absorb such increases. Disaggregating by gender may provide an insight into education issues for girls (women teachers as role models is a simple example).
School records School records
Further baseline study: other activties in the area contributing to provision of education and allowing access to the education system - teacher training, in-service training, schools inspection, provision of materials, curriculum development, adult education, non-formal education, vocational, adult literacy classes etc. The importance of child-friendly schools must be recognised.
Specific Objective: contribute to increased concentration and access to learning
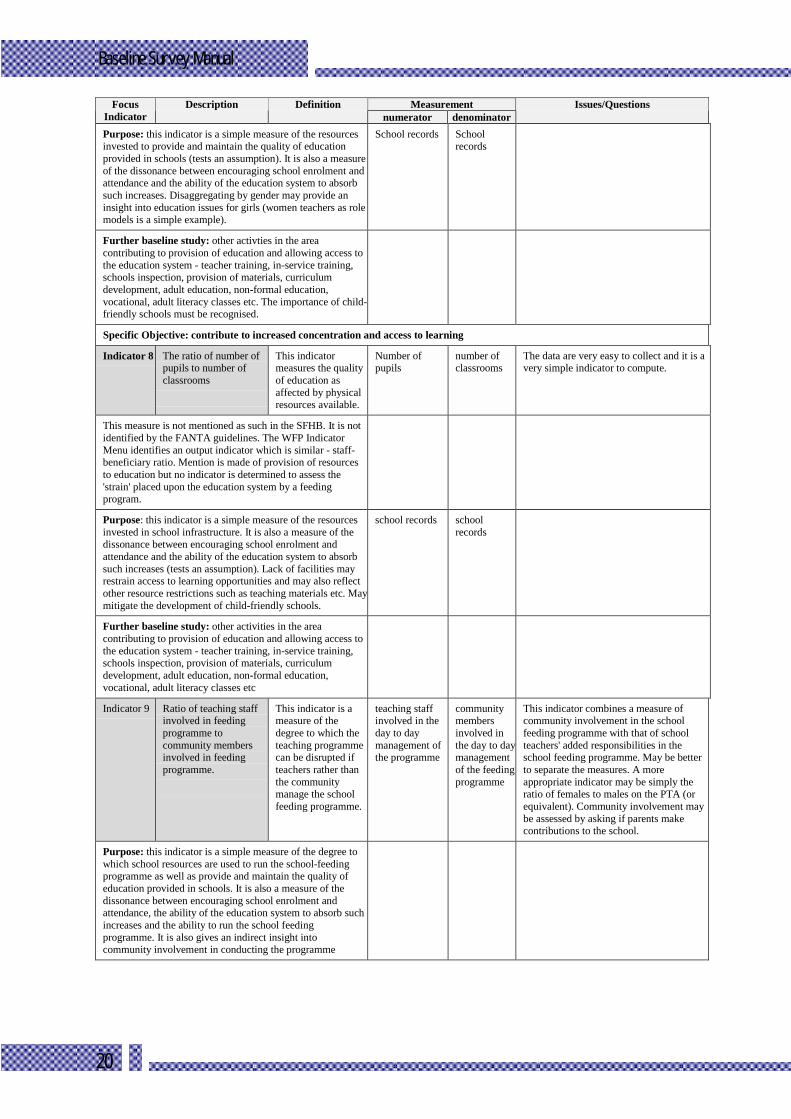
Indicator 8 The ratio of number of pupils to number of classrooms
This indicator measures the quality of education as affected by physical resources available.
Number of pupils
number of classrooms
The data are very easy to collect and it is a very simple indicator to compute.
This measure is not mentioned as such in the SFHB. It is not identified by the FANTA guidelines. The WFP Indicator Menu identifies an output indicator which is similar - staff-beneficiary ratio. Mention is made of provision of resources to education but no indicator is determined to assess the 'strain' placed upon the education system by a feeding program.
Purpose: this indicator is a simple measure of the resources invested in school infrastructure. It is also a measure of the dissonance between encouraging school enrolment and attendance and the ability of the education system to absorb such increases (tests an assumption). Lack of facilities may restrain access to learning opportunities and may also reflect other resource restrictions such as teaching materials etc. May mitigate the development of child-friendly schools.
school records school records
Further baseline study: other activities in the area contributing to provision of education and allowing access to the education system - teacher training, in-service training, schools inspection, provision of materials, curriculum development, adult education, non-formal education, vocational, adult literacy classes etc
Indicator 9 Ratio of teaching staff involved in feeding programme to community members involved in feeding programme.
This indicator is a measure of the degree to which the teaching programme can be disrupted if teachers rather than the community manage the school feeding programme.
teaching staff involved in the day to day management of the programme
community members involved in the day to day management of the feeding programme
This indicator combines a measure of community involvement in the school feeding programme with that of school teachers' added responsibilities in the school feeding programme. May be better to separate the measures. A more appropriate indicator may be simply the ratio of females to males on the PTA (or equivalent). Community involvement may be assessed by asking if parents make contributions to the school.
Purpose: this indicator is a simple measure of the degree to which school resources are used to run the school-feeding programme as well as provide and maintain the quality of education provided in schools. It is also a measure of the dissonance between encouraging school enrolment and attendance, the ability of the education system to absorb such increases and the ability to run the school feeding programme. It is also gives an indirect insight into community involvement in conducting the programme

Baseline Survey Manual
21
Measurement Focus Indicator
Description
Definition numerator denominator
Issues/Questions
Further baseline study: other activities in the area contributing to provision of education and allowing access to the education system - teacher training, in-service training, schools inspection, provision of materials, curriculum development, adult education, non-formal education, vocational, adult literacy classes etc
SCHOOL FEEDING AND COMMUNITY DEVELOPMENT
The indirect impacts arising from the income transfer effect. However, must be those elements which might be realistically changed by the project activity.
Indicator 10
Ranking of 'household/family/farming commitments' as reason for absence of enrolled children (by gender)
This indicator measures the proportion of those children absent from school who are prevented from attending school because of 'household/family/farming commitments'
Rank as assessed by teachers and PTA
Total categories identified
Has implications for the targeting of projects and the degree to which projects are flexible in order to achieve the stated developmental impacts. This information may be collected from teachers, parents or school children in saparate focus groups. Individaul school children can also be asked to provide details of friends not enrolled in school and the reason why.
Purpose: by focussing on non-attendees and the reasons for non-attendance this indicator reflects the opportunity cost of sending children to school all year round and tests the degree to which school feeding is providing an income transfer effect. The indicator may point to those communities and households which depend upon child labour at particular times of the year and which a particular programme is not reaching. In disaggregating by gender the indicator reflects something of the project's impact on family attitudes to investment in girls' education etc
Focus group interviews with school staff and PTA members
Focus group interviews with school staff and PTA members
Indicator 11
Ranking of 'household/family/farming commitments' as reason for non-enrolment of children (by gender)
This indicator measures the degree to which 'household/family commitments' prevents children from being enrolled in school
Rank as assessed by teachers and PTA
Total categories identified
Has implications for the targeting of projects and the degree to which projects are flexible in order to achieve the stated developmental impacts
Purpose: by focussing on the non-enrolled and the reasons for non-enrolment, this indicator reflects the opportunity cost of sending children to school and tests the degree to which school feeding is providing an income transfer effect to particular families. The indicator may point to those communities and households which are the most disadvantaged and which a particular programme is not reaching. In disaggregating by gender the indicator may reflect something of the project's impact on family attitudes toinvestment in girls' education etc
Focus group interviews with school staff and PTA members
Focus group interviews with school staff and PTA members
Access to education - other issues; 1. tracer studies of school leavers (profile of opportunities taken by school leavers at whatever age grade) and in particular, girls; 2. highest education level attained by members of adult pop (profile of education level in the community) especially of women

Baseline Survey Manual
22
Part III. Information on Survey Sampling Definitions The sample frame refers to the total population under assessment. The sample refers to the smaller group that is selected from the sample frame that will actually be surveyed, while the survey unit refers to the individual unit in the sample that will provide the majority of the information required to yield the indicators that will measure programme results over time.
Defining the sample frame The sample frame identified for the School Feeding Baseline Survey is the entire population of schools in a given country, that receive (or will receive in the immediate future) WFP school feeding assistance. Schools that have already been receiving WFP school feeding assistance for more than one year will fall into a sub-sample frame that has been called, for the sake of simplicity, “Existing” (referring to existing school feeding programmes). Schools that have not yet begun to receive WFP school feeding assistance but are scheduled to receive it in the immediate future, or have only begun to receive it within the year of survey, will fall into a sub-sample frame that has been called, for the sake of simplicity, “New” (referring to new school feeding programmes).
Entire population of schools that do/will receive WFP school feeding assistance
Existing Programmes
School x
New Programmes
School x
The survey unit for School Feeding Baseline surveys is the school. The Control group Standard practice in social research would simultaneously call for a control group to be defined and to be randomly drawn from the same population from which the sample to by surveyed is drawn. However, in the case of the School Feeding Baseline Survey a control group for the
samples identified above would consist of those schools not benefiting from WFP school feeding assistance. As WFP targets all schools in a particular geographic area for school feeding, the control group (those not to receive school feeding) would have to be drawn from outside the area. This would naturally introduce characteristics (e.g. geographical conditions etc) that would no longer render the control group a sound basis for comparison for the sample groups and would not represent a true control group. Even if it were considered possible (or ethical), to draw and survey a control group sample, because of the impossibility of controlling all factors, it would not contribute greatly to the level of confidence in the results of the overall survey. It would not contribute significantly to the interpretation of the results, and would not justify the additional cost. Far better to ensure that the before and after samples are of adequate size10.
Choosing a sampling method There are two ways to evaluate the impact of a variable on a given population: • measure the related effects on the entire
population, or • measure the related effects on a smaller group
(sample) of the entire population. Cleary the first would be ideal, but it is understandably close to impossible. For this reason sampling techniques have been developed to allow the identification of smaller groups whose survey results are likely to be representative of the larger population they belong to. There are two factors that affect how this is done (a) the method used to select the group from the larger population (how), and (b) the number of survey units in the larger population go into the group (how many). The first point may be done using probability and non-probability sampling methods, while the second is done using appropriate mathematical formulae that take a number of factors into consideration (discussed in the following section). Probability sampling involves any method of sampling that utilizes some form of random selection. Probability sampling allows for statistical inference and is almost exclusively used with quantitative data collection methods. The most common types of non-probability sampling methods are: • Simple random sampling (choosing respondents
using a random selection process to ensure that all members of the larger population have an equal chance of being included in the sample).

Baseline Survey Manual
23
• Stratified random sampling (sometimes called proportional or quota random sampling, entails creating a simple random sample from a set of subgroups created based on specific, non-overlapping criteria (e.g., gender, grade, etc.)).
• Systematic Random Sampling (similar to the simple random sample, it simply entails systematically selecting items from a list of randomly presented sample id numbers. E.g., listing numbers and selecting every nth item in the list).
• Cluster (Area) Random Sampling (entails identifying geographic areas or clusters of individuals and surveying every single representative, instead of attempting to access a random sample across a much wider area).
• Multi-Stage Sampling (entails various combinations of the various methods above and is usually used in applied social research).
Non-probability sampling involves any method of sampling that does not involve random selection. Non-probability sampling is almost always used for qualitative data collection methods and can be used for quantitative methods for which statistical inference is not desired. The most common types of non-probability sampling methods are: • Purposive sampling (choosing respondents
based on the fact that they are likely to give the best picture of the phenomena you are investigating).
• Opportunistic or accidental sampling (simply choosing respondents based on their availability to participate at the moment you arrive to collect data).
Which one should be used? Which is used is defined by: (a) the data type and collection method being used
in primary data collection (quantitative, qualitative and collection means); and
(b) the degree of statistical rigour needed for extrapolating the sample estimate to the larger study population.
Sampling method, and ultimately sample size then, will be largely determined by what is ultimately desired of the data. Sample size must accommodate representatives of all subpopulations in the large population, and the stratification (identification of internal sub-group characteristics) should take the factors the affect the variable(s) of interest in the study into consideration.
Determining sample size Once the sample frame has been identified and the sampling methodology has been appropriately
selected, the number of survey units to be surveyed – the sample – must be calculated. There are a number of variables that affect the sample size: • the size of the population being assessed (the
people to whom the data being collected refer); • the initial level of a chosen indicator to be
assessed; • the minimum degree of change in the selected
indicator that one wants to be able to detect; • the level of confidence that one wants to have
that any changes observed in the indicator are not the result of chance (statistical significance);
• the level of confidence that one wants to have that any changes in the indicator will be captured, and will not slip by unnoticed (statistical power).
The first two fundamentally relate to the population of survey, while the last three are values determined by the survey designer. The chosen indicator In determining sample size, the survey designer must select one of the indicators the survey will assess as a reference point for sample size calculation. At the same time, the current (or assumed current) value of the indicator is determined. Why is this important? Depending on the current level of the indicator, and the foreseen level of change that it is desired to see, the number of respondents required to reveal such a change will vary. The sample size is inversely related to the size of the change that the survey intends to capture –i.e., the smaller the change one wishes to see, the larger the sample size required to capture it. In the school feeding baseline surveys For the School Feeding Baseline surveys the indicator selected was the Net Enrolment Rate indicator. In many countries the current level of net-enrolment is not known, nor is it always clear what the level of expected change in the enrolment will be. In countries where the current level of gross or net-enrolment in the project area was not accurately known, it was not clear what was the level of expected change in the enrolment as a consequence of the school feeding programme. In these cases the following assumptions were made in calculating the sample size: • current level of enrolment: 50%11 • expected increase in enrolment: a 20% change of
the net-enrolment to 70% (i.e. a 40% relative increase)

Baseline Survey Manual
24
In some cases the current levels of enrolment were known, and the expected increase in enrolment relative to the existing enrolment was estimated and was detailed in the project documentation. Where figures were available they were used to calculate the sample sizes12. In cases of ongoing school feeding programmes it was assumed there would not be large increases in the level of enrolment/attendance as a result of the (continued) project implementation. Continued feeding would simply maintain the current enrolment/attendance levels. In order to calculate the sample size in such cases it was assumed that the school feeding programme would prevent a drop of an estimated 20% (40% relative) in net-enrolment. Therefore the size of the current sample was calculated so that results could be compared with those from a sample taken in the future in order to show with a high degree of confidence that enrolment was, indeed, not significantly different. The assumptions made were the same as for new schools, but in reverse: • current level of enrolment (i.e. net-enrolment):
70% • expected decrease in enrolment should school
feeding discontinue: 20% of the net-enrolment (i.e. approximately 30% relative decrease)
Statistical significance The statistical significance takes into consideration the fact that in reality, pure chance may also generate changes in the indicator that the survey intends to measure. These changes however, cannot truly be evaluated in the context of the causal effect of the variables whose impact the survey intends to monitor. Therefore, when the sample size is determined, a sufficient number of survey units must be included in order to accommodate the likelihood of these “false positive” values. In the school feeding baseline surveys In the School Feeding baseline surveys, the statistical significance was set at a probability of 0.95. This practically means that only in one case out of 20, the value obtained by measuring the sample would not be representative for the entire population. Statistical power The statistical power takes into consideration the fact that in reality some changes in the indicator that could be evaluated in the context of the causal effect of the variables being monitored may actually occur, but the changes may not be significant enough to be picked up by the survey activities and risk going unnoticed. If the chances
of this happening are not accounted for when the sample size is determined, survey results risk displaying “false negatives” when instead the variables being monitored have actually had impact. In the school feeding baseline surveys In the School Feeding baseline surveys, the statistical power was determined by the expected impact of the school feeding project on the enrolment. A higher level of statistical power will require a larger sample size. Once the above factors have been determined, the following equation may be used to determined the sample size for each cluster. n = D [(Z1 + Z2)² * (P1 (1 - P1) + P2(1 - P2)) /(P2 - P1)²] where: n Required minimum sample size per survey
round or comparison group D Design effect (assumed in the following
equations to be the default value of 2) P1 The estimated level of an indicator
measured as a proportion at the time of the first survey or for the control area
P2 The expected level of the indicator either at some future date or for the project area such that the quantity (P2 – P1) is the size of the magnitude of change it is desired to be able to detect
Z1 the level of statistical significance: the Z-score corresponding to the degree of confidence with which it is desired to be able to conclude that an observed change of size (P2 – P1) would not have occurred by chance.
Z2 The statistical power: z-score corresponding to the degree of confidence with which it is desired to be certain of detecting a change of size (P2 – P1) if one actually occurred.
“Z” values are standard values that are associated to the level of confidence, expresses as a percentage:
Reliability / Statistical
Significance
Z score Detectability / Statistical
power
Z score
0.90 1.282 0.80 0.840 0.95 1.645 0.90 1.282 0.975 1.960 0.95 1.645 0.99 2.326 0.975 1.960
0.999 2.320
The following is a practical example: Suppose an increase of 20 percentage points in the net enrolment rate. Assume that at the time of the first survey,

Baseline Survey Manual
25
the net enrolment rate is about 50, therefore P1=0.50 and P2=0.60. Use standard parameters of 95 percent level of significance (Z value = 1.645) and 80 percent power (Z value = 0.840). Inserting these values in the formula yields the following results:
n = D [(Z1 + Z2)² * (P1 (1 - P1) + P2(1 - P2)) /(P2 - P1)²]
n = 2[(1.645+0.840)2 * ((0.5)(0.5)+(0.6)(0.4))]/(0.6-0.5)2
n = 2[(6.175 * 0.49) / 0.102 ]
n = 2[(3.02575) / 0.01 ] = 2 (302.575) = 605.15
n = 606 sample size
It should be noted that the above formula refers to infinite populations. When instead the population being surveyed is finite and relatively small, a correction can be applied. The formula for this is:
nf = n / [1 + (n/N)] with:
nf Adjusted sample size for small (finite) populations
N Population size (the finite population size) n Sample size for large (infinite)
populations The following is a practical example: Suppose the above n = 606 sample size needs to be applied to a total population of schools that numbers 800. The correction for the finite sample would be as follows:
nf = n / [1 + (n/N)]
nf = 606 / [1 + (606/800)] = 344.8 = 345
For a total population of schools that numbers 600, the correction would be: nf = 606 / [1 + (606/600)] = 301.49 = 302 In the school feeding baseline surveys For the school feeding baseline surveys, populations larger than 1,000 schools are considered to be infinite. For those populations smaller than 1,000, the above correction was applied. The table “Sample Size for Indicators Expressed as Proportions” reproduced on page 27, gives the required sample size based on the estimated current level and expected future level for both a 10 percent and a 20 percent statistical power (precision level), for the 0.95 statistical significance level. Allowance for non-response and quality control Efforts should be made to minimize the level of non-response, nevertheless, there will always be a certain level of non-response in surveys. To take
this into account, the sample size is normally increased by a non-response insurance factor. This can vary from setting to setting, though an allowance of 10 percent should prove adequate in most situations. It can further be expected that a number of survey forms will turn out to have unreliable data that cannot be included when processing the data. Some margin of safety should also be taken into consideration to allow for a certain percentage of questionable data. For these surveys no fixed level of non-response and quality control allowance is used, but rather an intuition is to be used as to how to adjust the calculated sample size. Sample size requirement for evaluation surveys The procedures for determining survey sample size described above are designed to take into account the requirements for a follow-up survey round. In some cases, the sample size will need to be enlarged in the evaluation/follow-up survey. This can occur for instance when the indicators observed in the baseline survey showed different levels from those that were used when calculating the required sample sizes prior to the baseline survey. This would mean that the sample size used in the baseline survey would be too small to satisfy the precision requirements for the evaluation effort if used for the follow-up survey. Such correction can be made by computing a revised estimate of the sample size requirement using the same basic equation for indicators expressed as proportions, taking into account the results obtained in the baseline survey. One then compensates for any shortcoming in sample size in the baseline survey by further increasing the sample size for the follow-up survey.
Identifying the sample units Once the sample size has been determined, the surveyor may go back to the sample frame and depending on size (and other variables that are likely to have some impact on survey implementation –i.e., costs, time, etc), identify the most appropriate method for selecting the individual survey units for inclusion in the sample. In the school feeding baseline surveys In the School Feeding baseline surveys, the survey units were selected randomly. Below are the steps to be followed in order to do this: • (determine sample size) • list the complete sample frame (all schools of
interest) and number them sequentially. The number becomes the Sample ID of each school.

Baseline Survey Manual
26
• Using Microsoft Excel, generate a table of numbers between 1 and the sample size inclusive (see below on how to do this).
• Select the first “n” number of sample id’s from the list, ensuring that any duplicates are not considered.
Generation of Random Numbers with Excel To use Microsoft Excel to generate random numbers, open a new workbook and type the following into the first empty cell:
=INT(RAND()*(n-1)+1) where “n” is the number of schools in the School Feeding Programme. If there are 630 schools the n is equal to 630. For this example, sample size will be 150. Therefore:
=INT(RAND()*(630-1)+1) Copy the formula to about twice as many cells as the sample size (e.g., 300 cells). Randomly selected numbers will appear in each of the cells. Record the first 150 numbers (ignore zeros and duplicates). These are the ID numbers of the schools to be visited. Example: In this example “n” (your sample frame) is equal to 630 which is the total number of schools in the feeding programme. Your sample size is 150. Ignore duplicate numbers.
1 2 3 4 5 6 7 8 9 10 1 63 348 513 311 403 519 272 462 598 3412 7 516 348 428 447 378 341 238 279 6283 297 106 606 525 560 250 247 214 401 2974 500 373 284 339 584 260 104 397 536 775 148 45 17 283 82 310 408 6 162 136 438 165 320 523 364 97 91 583 361 4097 130 271 567 105 39 501 54 270 8 4258 296 301 68 537 61 377 424 241 396 1009 446 581 566 161 155 330 192 40 330 135
10 135 143 496 174 475 182 599 534 460 21311 573 595 590 342 116 92 24 470 405 21412 398 284 103 284 51 175 199 392 131 18813 276 20 579 285 195 107 326 169 509 18314 143 41 62 512 413 332 339 407 151 39715 134 268 425 192 150 526 596 330 527 19716 507 416 230 455 396 499 310 291 344 14617 101 628 355 596 192 602 129 562 186 48918 619 477 31 493 201 361 14 143 420 50219 222 466 493 57 609 397 127 242 274 44420 206 436 249 268 9 13 202 95 330 47
Summary on sampling 1. identify survey unit 2. identify sample frame/s 3. identify sampling method 4. determine sample size 5. select survey units from sample frame

Baseline Survey Manual
27
Sample Size for Indicators Expressed as Proportions Sample Size for Indicators Expressed as Proportions with a probability of 0.95 or larger
For infinite populations
For finite populations For finite populations Net Enrolment
10% 20% 10% precision 20% precision Cur.
Level Exp. level
Sample Size
SampleSize
Population size (N)
Population size (N)
P1 P2 n n 100 200 300 400 500 600 700 800 900 1000 100 200 300 400 500 600 700 800 900 10000.1 0.1 n/a n/a n/a n/a n/a n/a n/a n/a n/a n/a n/a n/a n/a n/a n/a n/a n/a n/a n/a n/a n/a n/a0.1 0.2 428 309 81 136 176 207 231 250 266 279 290 300 76 121 152 174 191 204 214 223 230 2360.1 0.3 129 93 56 78 90 97 102 106 109 111 112 114 48 63 71 75 78 80 82 83 84 850.1 0.4 63 45 39 48 52 54 56 57 58 58 59 59 31 37 39 41 42 42 43 43 43 430.1 0.5 36 26 27 31 32 33 34 34 35 35 35 35 21 23 24 25 25 25 25 25 26 260.1 0.6 23 16 18 20 21 21 22 22 22 22 22 22 14 15 15 16 16 16 16 16 16 160.1 0.7 14 10 12 13 14 14 14 14 14 14 14 14 9 10 10 10 10 10 10 10 10 100.1 0.8 9 6 8 8 8 9 9 9 9 9 9 9 6 6 6 6 6 6 6 6 6 60.1 0.9 5 3 5 5 5 5 5 5 5 5 5 5 3 3 3 3 3 3 3 3 3 30.1 1.0 2 1 2 2 2 2 2 2 2 2 2 2 1 1 1 1 1 1 1 1 1 10.2 0.1 428 309 81 136 176 207 231 250 266 279 290 300 76 121 152 174 191 204 214 223 230 2360.2 0.2 n/a n/a n/a n/a n/a n/a n/a n/a n/a n/a n/a n/a n/a n/a n/a n/a n/a n/a n/a n/a n/a n/a0.2 0.3 634 457 86 152 204 245 280 308 333 354 372 388 82 139 181 213 239 259 276 291 303 3140.2 0.4 171 124 63 92 109 120 128 133 138 141 144 146 55 76 87 94 99 102 105 107 109 1100.2 0.5 78 56 44 56 62 65 68 69 70 71 72 72 36 44 47 49 51 51 52 53 53 530.2 0.6 43 31 30 35 37 39 39 40 40 41 41 41 24 27 28 29 29 29 30 30 30 300.2 0.7 25 18 20 23 23 24 24 24 24 25 25 25 15 17 17 17 18 18 18 18 18 180.2 0.8 15 11 13 14 14 15 15 15 15 15 15 15 10 10 11 11 11 11 11 11 11 110.2 0.9 9 6 8 8 8 9 9 9 9 9 9 9 6 6 6 6 6 6 6 6 6 60.2 1.0 4 3 4 4 4 4 4 4 4 4 4 4 3 3 3 3 3 3 3 3 3 30.3 0.1 129 93 56 78 90 97 102 106 109 111 112 114 48 63 71 75 78 80 82 83 84 850.3 0.2 634 457 86 152 204 245 280 308 333 354 372 388 82 139 181 213 239 259 276 291 303 3140.3 0.3 n/a n/a n/a n/a n/a n/a n/a n/a n/a n/a n/a n/a n/a n/a n/a n/a n/a n/a n/a n/a n/a n/a0.3 0.4 771 556 89 159 216 263 303 337 367 393 415 435 85 147 195 233 263 289 310 328 344 3570.3 0.5 197 142 66 99 119 132 141 148 154 158 162 165 59 83 96 105 111 115 118 121 123 1240.3 0.6 86 62 46 60 67 71 73 75 76 77 78 79 38 47 51 53 55 56 57 57 58 580.3 0.7 45 32 31 37 39 40 41 42 42 43 43 43 24 28 29 30 30 31 31 31 31 310.3 0.8 25 18 20 23 23 24 24 24 24 25 25 25 15 17 17 17 18 18 18 18 18 180.3 0.9 14 10 12 13 14 14 14 14 14 14 14 14 9 10 10 10 10 10 10 10 10 100.3 1.0 7 5 7 7 7 7 7 7 7 7 7 7 5 5 5 5 5 5 5 5 5 50.4 0.1 63 45 39 48 52 54 56 57 58 58 59 59 31 37 39 41 42 42 43 43 43 430.4 0.2 171 124 63 92 109 120 128 133 138 141 144 146 55 76 87 94 99 102 105 107 109 1100.4 0.3 771 556 89 159 216 263 303 337 367 393 415 435 85 147 195 233 263 289 310 328 344 3570.4 0.4 n/a n/a n/a n/a n/a n/a n/a n/a n/a n/a n/a n/a n/a n/a n/a n/a n/a n/a n/a n/a n/a n/a0.4 0.5 840 605 89 162 221 271 313 350 382 410 434 456 86 150 201 241 274 301 325 345 362 3770.4 0.6 206 148 67 101 122 136 146 153 159 164 167 171 60 85 99 108 114 119 122 125 127 1290.4 0.7 86 62 46 60 67 71 73 75 76 77 78 79 38 47 51 53 55 56 57 57 58 580.4 0.8 43 31 30 35 37 39 39 40 40 41 41 41 24 27 28 29 29 29 30 30 30 300.4 0.9 23 16 18 20 21 21 22 22 22 22 22 22 14 15 15 16 16 16 16 16 16 160.4 1.0 11 8 10 11 11 11 11 11 11 11 11 11 8 8 8 8 8 8 8 8 8 80.5 0.1 36 26 27 31 32 33 34 34 35 35 35 35 21 23 24 25 25 25 25 25 26 260.5 0.2 78 56 44 56 62 65 68 69 70 71 72 72 36 44 47 49 51 51 52 53 53 530.5 0.3 197 142 66 99 119 132 141 148 154 158 162 165 59 83 96 105 111 115 118 121 123 1240.5 0.4 840 605 89 162 221 271 313 350 382 410 434 456 86 150 201 241 274 301 325 345 362 3770.5 0.5 n/a n/a n/a n/a n/a n/a n/a n/a n/a n/a n/a n/a n/a n/a n/a n/a n/a n/a n/a n/a n/a n/a0.5 0.6 840 605 89 162 221 271 313 350 382 410 434 456 86 150 201 241 274 301 325 345 362 3770.5 0.7 197 142 66 99 119 132 141 148 154 158 162 165 59 83 96 105 111 115 118 121 123 1240.5 0.8 78 56 44 56 62 65 68 69 70 71 72 72 36 44 47 49 51 51 52 53 53 530.5 0.9 36 26 27 31 32 33 34 34 35 35 35 35 21 23 24 25 25 25 25 25 26 260.5 1.0 17 12 15 16 16 16 17 17 17 17 17 17 11 12 12 12 12 12 12 12 12 120.6 0.1 23 16 18 20 21 21 22 22 22 22 22 22 14 15 15 16 16 16 16 16 16 160.6 0.2 43 31 30 35 37 39 39 40 40 41 41 41 24 27 28 29 29 29 30 30 30 300.6 0.3 86 62 46 60 67 71 73 75 76 77 78 79 38 47 51 53 55 56 57 57 58 580.6 0.4 206 148 67 101 122 136 146 153 159 164 167 171 60 85 99 108 114 119 122 125 127 1290.6 0.5 840 605 89 162 221 271 313 350 382 410 434 456 86 150 201 241 274 301 325 345 362 3770.6 0.6 n/a n/a n/a n/a n/a n/a n/a n/a n/a n/a n/a n/a n/a n/a n/a n/a n/a n/a n/a n/a n/a n/a0.6 0.7 771 556 89 159 216 263 303 337 367 393 415 435 85 147 195 233 263 289 310 328 344 3570.6 0.8 171 124 63 92 109 120 128 133 138 141 144 146 55 76 87 94 99 102 105 107 109 1100.6 0.9 63 45 39 48 52 54 56 57 58 58 59 59 31 37 39 41 42 42 43 43 43 430.6 1.0 26 19 20 23 24 24 24 25 25 25 25 25 16 17 17 18 18 18 18 18 18 180.7 0.1 14 10 12 13 14 14 14 14 14 14 14 14 9 10 10 10 10 10 10 10 10 100.7 0.2 25 18 20 23 23 24 24 24 24 25 25 25 15 17 17 17 18 18 18 18 18 180.7 0.3 45 32 31 37 39 40 41 42 42 43 43 43 24 28 29 30 30 31 31 31 31 310.7 0.4 86 62 46 60 67 71 73 75 76 77 78 79 38 47 51 53 55 56 57 57 58 580.7 0.5 197 142 66 99 119 132 141 148 154 158 162 165 59 83 96 105 111 115 118 121 123 124

Baseline Survey Manual
28
For infinite populations
For finite populations For finite populations Net Enrolment
10% 20% 10% precision 20% precision Cur.
Level Exp. level
Sample Size
SampleSize
Population size (N)
Population size (N)
P1 P2 n n 100 200 300 400 500 600 700 800 900 1000 100 200 300 400 500 600 700 800 900 10000.7 0.6 771 556 89 159 216 263 303 337 367 393 415 435 85 147 195 233 263 289 310 328 344 3570.7 0.7 n/a n/a n/a n/a n/a n/a n/a n/a n/a n/a n/a n/a n/a n/a n/a n/a n/a n/a n/a n/a n/a n/a0.7 0.8 634 457 86 152 204 245 280 308 333 354 372 388 82 139 181 213 239 259 276 291 303 3140.7 0.9 129 93 56 78 90 97 102 106 109 111 112 114 48 63 71 75 78 80 82 83 84 850.7 1.0 40 29 29 33 35 36 37 37 38 38 38 38 22 25 26 27 27 27 28 28 28 280.8 0.1 9 6 8 8 8 9 9 9 9 9 9 9 6 6 6 6 6 6 6 6 6 60.8 0.2 15 11 13 14 14 15 15 15 15 15 15 15 10 10 11 11 11 11 11 11 11 110.8 0.3 25 18 20 23 23 24 24 24 24 25 25 25 15 17 17 17 18 18 18 18 18 180.8 0.4 43 31 30 35 37 39 39 40 40 41 41 41 24 27 28 29 29 29 30 30 30 300.8 0.5 78 56 44 56 62 65 68 69 70 71 72 72 36 44 47 49 51 51 52 53 53 530.8 0.6 171 124 63 92 109 120 128 133 138 141 144 146 55 76 87 94 99 102 105 107 109 1100.8 0.7 634 457 86 152 204 245 280 308 333 354 372 388 82 139 181 213 239 259 276 291 303 3140.8 0.8 n/a n/a n/a n/a n/a n/a n/a n/a n/a n/a n/a n/a n/a n/a n/a n/a n/a n/a n/a n/a n/a n/a0.8 0.9 428 309 81 136 176 207 231 250 266 279 290 300 76 121 152 174 191 204 214 223 230 2360.8 1.0 69 49 41 51 56 59 60 62 62 63 64 64 33 40 42 44 45 46 46 47 47 470.9 0.1 5 3 5 5 5 5 5 5 5 5 5 5 3 3 3 3 3 3 3 3 3 30.9 0.2 9 6 8 8 8 9 9 9 9 9 9 9 6 6 6 6 6 6 6 6 6 60.9 0.3 14 10 12 13 14 14 14 14 14 14 14 14 9 10 10 10 10 10 10 10 10 100.9 0.4 23 16 18 20 21 21 22 22 22 22 22 22 14 15 15 16 16 16 16 16 16 160.9 0.5 36 26 27 31 32 33 34 34 35 35 35 35 21 23 24 25 25 25 25 25 26 260.9 0.6 63 45 39 48 52 54 56 57 58 58 59 59 31 37 39 41 42 42 43 43 43 430.9 0.7 129 93 56 78 90 97 102 106 109 111 112 114 48 63 71 75 78 80 82 83 84 850.9 0.8 428 309 81 136 176 207 231 250 266 279 290 300 76 121 152 174 191 204 214 223 230 2360.9 0.9 n/a n/a n/a n/a n/a n/a n/a n/a n/a n/a n/a n/a n/a n/a n/a n/a n/a n/a n/a n/a n/a n/a0.9 1.0 154 111 61 87 102 111 118 123 126 129 132 134 53 71 81 87 91 94 96 98 99 1001.0 0.1 2 1 2 2 2 2 2 2 2 2 2 2 1 1 1 1 1 1 1 1 1 11.0 0.2 4 3 4 4 4 4 4 4 4 4 4 4 3 3 3 3 3 3 3 3 3 31.0 0.3 7 5 7 7 7 7 7 7 7 7 7 7 5 5 5 5 5 5 5 5 5 51.0 0.4 11 8 10 11 11 11 11 11 11 11 11 11 8 8 8 8 8 8 8 8 8 81.0 0.5 17 12 15 16 16 16 17 17 17 17 17 17 11 12 12 12 12 12 12 12 12 121.0 0.6 26 19 20 23 24 24 24 25 25 25 25 25 16 17 17 18 18 18 18 18 18 181.0 0.7 40 29 29 33 35 36 37 37 38 38 38 38 22 25 26 27 27 27 28 28 28 281.0 0.8 69 49 41 51 56 59 60 62 62 63 64 64 33 40 42 44 45 46 46 47 47 471.0 0.9 154 111 61 87 102 111 118 123 126 129 132 134 53 71 81 87 91 94 96 98 99 1001.0 1.0 n/a n/a n/a n/a n/a n/a n/a n/a n/a n/a n/a n/a n/a n/a n/a n/a n/a n/a n/a n/a n/a n/a

Baseline Survey Manual
29
Part IV. Information on Survey implementation Generic Terms of Reference School Feeding Baseline / Evaluation Field Survey in _________(Country) (word in italics indicate information should be inserted by the Country Office) 1. Background (Background information on school feeding programme in country to be added.) The key outcomes expected from the school feeding programmes are: • increased enrolment of children • increased attending (and learning) of school by children • reduction in the imbalances between girls and boys in taking opportunities for education • if more, please add. 2. Further Information on the SF Programme Including geographical distribution/location of schools. 3. Ongoing Monitoring and Evaluation of the SF Programme Output data regularly reported includes: • number of schools where school feeding takes place • current school enrolment / beneficiaries broken down by gender Point out where other information is available. 4. Objectives of Baseline Survey The objective of the baseline survey is to provide baseline data for assessing the impact in [country] of the food assistance provided by WFP. The key indicators to be assessed are: • number of children enrolled in the schools in receipt of WFP resources • number of children attending school regularly (and learning) • difference for those indicators between boys and girls The baseline survey also includes a range of other questions soliciting information on other factors. Information on these other factors will allow changes to be tracked in indicators such as: • Staff/student ratio • Classroom/student ratio • Reasons for non-attendance • Reasons for non-enrolment • Drop-out rates • Community participation and support The baseline survey will build upon information already collected by project monitoring systems. Monitoring the indicators and an evaluation survey will provide information on the outcomes resulting from the food assistance. It is expected that as a result of the baseline survey the monitoring systems for SF programmes will be strengthened to focus upon the regular and routine collection of data on the key outcome indicators.

Baseline Survey Manual
30
5. Scope of Survey A standardized survey questionnaire should be used. On average it takes some three hours per school to fill in the survey form. The WFP country office has - through random sampling - determined the schools to be surveyed. This list cannot be changed 6. Conduct of Survey The ______ will be contracted for the organizing and the conducting of the school feeding baseline survey in [country] under the overall supervision of the _____ [unit] of the WFP [country] Country Office using the list of schools to be surveyed. The ______ will be responsible for: 1. The identification of a sufficient and suitable number of enumerators to carry out the survey. All
enumerators should be fluent in written [English/French] as the forms have to be filled in using this language.
2. The training of the enumerator teams:
2.1. Ensure that all enumerator teams have a complete and homogenous understanding of the questions in the survey form
2.2. Conduct together with the enumerator teams a minimum of two school surveys in non-sample schools, in order to assess their comprehension of the conducting of the survey. If needed, more trial surveys can be conducted to improve the quality of the data collection.
2.3. Train the enumerators in the ways to conduct the survey (including amongst others, focus group discussions, interviewing, observation, verification of records).
2.4. Care shall be taken to ensure that the enumerators understand that the form is not a simple questionnaire and that an appropriate combination of approaches/methods should be used to complete the form. This will also entail determining in what sequence the various parts of the form should be completed.
2.5. WFP staff will provide assistance in the technical aspects of the training of the enumerators.
3. Ensure that all logistical preparations are made for the smooth conduct of the survey. Including amongst others: 3.1. Organizing transport and the supply of fuel 3.2. Organizing overnight facilities for the survey teams 3.3. Organizing communication means 3.4. Replication of the survey forms and distribution in sufficient numbers to the teams
4. Provide a schedule of the schools to be surveyed so that WFP can inform the schools accordingly. 5. Provide a time frame during which the survey will be conducted. 6. Ensure the security of the survey teams during the conducting of the survey by obtaining the necessary
permits. When required, WFP will assist in this. 7. Conduct primary quality control on the data collection by the enumerators. Further quality control will be
conducted by WFP on a random basis and without prior notification. Collect the completed survey forms and return them to the Country Office in a timely matter. Each completed survey form must bear the unique identification number for the school. This identification number is that which was used when drawing the sample
Baseline Survey Manual
31
Preparation of the Field Work 1. Select the sample. Remember the sample size is determined on the basis of accuracy and precision, not on original population size. 2. Prepare questionnaires with any information that may be provided prior to beginning field work: • Attendance section: identify the four months
for which attendance data will be collected. In some circumstances different months may be selected for different parts of the country. This will depend upon, amongst other things the seasonal calendar (agriculture cycle) of the area. Please note in the margin of the form some justification/clarification as to why these months were selected.
3. Select the Enumerators: Determine if they will be WFP staff or outsourced to a company or university (or other). (An assessment of last year’s baseline surveys showed that the cost of data collection varied significantly from country to country - with an average price of $106 per school surveyed and the lowest being $20 per school. Clearly, the most cost-efficient way was when WFP worked in collaboration with government and NGO counterpart staff, rather than outsourcing to a consulting company. This approach also had very positive capacity building effects. Data collection for the Baseline and Evaluation surveys can be part of regular monitoring, and it can be stretched over a couple of months). 4. Training Enumerators: • Ensure all enumerators are thoroughly familiar
with (a) the questionnaire, (b) terms and definitions, and (c) questionnaire guidelines.
• Ensure all enumerators are aware of how to deal with ‘not available’ or dubious data etc. as well as with questions that may not be relevant in particular circumstances. These issues are discussed in the guidelines included in the questionnaire
• Ensure all enumerators know what to do if a school is not “ready” when the team gets there.
• Ensure that all enumerators have the opportunity to visit a few schools during the training and jointly discuss the experience afterwards.
• Ensure that a clear schedule is defined for each field survey team so that travel related decisions do not have to be made in the field.
5. Set up of a logistics plan for the conduct of the survey.
• Determine the number of teams of enumerators needed to complete the survey in the time available. The number of enumerators per team will depend on their experience. Keep in mind that one team can complete at least two questionnaires per day (including travel), but may be able to do three or four.
• Determine the transport needs of the enumerator teams. If the distribution of the selected schools permits, vehicles can serve more than one team.
• Set up a daily schedule for each team and list the schools to be visited (the enumerators should not do this). Keep possible contingencies in mind to overcome events that could slow the teams down. Monitor progress and ensure that all schools to be visited are actually visited.
• Keep security in mind when setting up schedule –i.e., verify if security clearance is required or if permission from other authorities is required.
• Determine whether it is useful to notify schools of the day they will be visited. If appropriate, local offices of partner agencies may also be notified. The benefit of pre-notification is that schools may prepare the proposed participants – school children, parents and school staff – for on-site, quick focus group discussions. The downside is that this may create a “non-realistic” snapshot of the respondents, e.g., it may alter attendance of both students and teachers. Head-counts during unannounced visits are a good method of getting “real” numbers.
• Whether through pre-notification or upon arrival at the school, advise the schools of which records will be needed. Use best judgement as to which records best provide the needed information. Wherever possible cross-check with local/district offices of WFP’s partner agencies the following information: - school feeding days for last 3 years - official enrolment at present and last 3 years - number of teachers at school last 3 years - continuation of studies through higher
education - school catchment - school attendance
• Set up a communication schedule/system with survey teams.
• Identify local (regional) co-ordinators for survey (sub-office, travelling co-ordinator) for larger countries.
• Organise the replication of survey forms plus some spares for each team.
Notes on training enumerators WFP staff trained on school feeding baseline/evaluation survey should be in charge of organizing and implementing the survey, including training of enumerators, monitoring and supervision of the fieldwork, as well as data cleaning.

Baseline Survey Manual
32
Training of enumerators should cover a minimum of three days. It should include fieldwork and practical completion of at least one questionnaire at a school. After the fieldwork one day of training should be calculated to discuss issues that arose during the completion of the questionnaire. During the training, each question should be reviewed individually and it should be discussed how the questions are handled during data collection. Experience has shown that although the survey appears to be straightforward, there are numerous difficulties that can come up during school visits. When facing unexpected challenges, enumerators tend to make up answers or leave items blank instead of explaining the circumstances. This is very problematic for the country office when data cleaning is carried out before sending the questionnaires to Headquarters. The most critical factors in preventing time-consuming data cleaning after data collection are: • thorough training of enumerators (at least
three days) including a trial run at local, non-sampled schools
• extensive field level monitoring during data collection throughout the survey to correct mistakes before they become endemic.
Survey Schedule/Timeline The schedule below lists the main activity headings that will take place during survey implementation. Of course individual countries will have their individual time frames depending upon local circumstances. The following simply provides a starting point:
ACTIVITY WEEK 1 2 3 4 5 6 1. Hiring of enumerators 2. Design of schedule 3. Organizing of transport 4. Notification of schools 5. Arranging of permits 6. Multiplication of forms 7. Training of enumerators
including try-out
8. Actual survey 9. Collecting/duplication
of forms
10. Forwarding of forms to processing unit (CO or HQ)
Processing of Collected Information 1. Data cleaning should be done centrally, possibly
by the WFP Country Office. Quality control prior to sending the questionnaire forms to SPF/HQ is extremely important and should be done carefully. (Quality control issues are discussed in the following section).
2. Photocopies of all original questionnaires should
be made and kept at the Country Office for at least five years.
3. The original questionnaire forms are to be
forwarded to the School Feeding Unit in Headquarters in Rome by express service (DHL, FedEx). Do not use pouch service as documents have been lost in the past. Forms should be sent to the following address: Arlene Mitchel l / K atrin von der Mosel School Feeding Support Unit Strategy and Pol icy Divi s ion Roo ms 2Y14/ 2Y06 World Food Progra mme Via Cesare Giul io Viola, 68 /70 Parco de Medici , 00148 Ro me Italy
4. Please notify the School Feeding Unit when the survey questionnaires have been dispatched so that SF may follow up on their arrival.
For any questions on any of the above, please contact the School Feeding Support Unit:
Katrin von der Mosel (tel. +39 06 6513 2664), or
Dominique De Bonis (tel. +39 06 6513 2196) or
Marina Garcia Real (tel. +39 06 6513 2653).
Additional Information The questionnaire developed by the WFP School Feeding Support Unit (SPF) is a standardized one. However, countries/programmes may add additional questions or modules, but only in consultation and agreement with SPF. School Feeding is also interested in recommending suitable interns who could assist Country Offices with further analysis of the data collected, and in preparing country-reports. Any Country Office interested in this opportunity, is kindly requested to contact the School Feeding Unit as early as possible, so that the Unit has sufficient time to get in touch with partner universities and identify a suitable candidate.

Baseline Survey Manual
33
Part V. Quality Control Data Quality Control Checklist As mentioned in the previous section, thorough enumerator training and careful field level monitoring during data collection are precious preventive measure to avoid time-consuming quality control once questionnaires are returned to the Country Office. The following section briefly outlines some of the most common and evident issues that can arise, and offers some guidelines as to what the survey monitor should check - on each and every completed questionnaire received.
Quick overview Format. The survey monitor should check : • the number of pages in the completed
questionnaire, and make sure they correspond to the number of pages in the original;
• That the cover page is carefully completed; • That the ID/sample number is present and
correctly completed; • That all questions have an answer. There
should be no empty response fields (checkboxes, lines, etc.) ;
• That Yes/No questions, and questions with NR/NK options have only one of the options selected at all times;
• That if the answer to a question soliciting a numeric response is “0”, that a “0” has been indicated (Zero is not the same as “nothing”) ;
• That extremely high or low numbers, compared to the averages (outliers) reported in the questionnaire, are justified, and are not mistakes.
Text, Names and Spelling. The survey monitor should ensure that : • The official names of locations and schools
have been used, and that locations/names are spelled consistently across questionnaires;
• There are no general spelling errors; • The answers provided are written legibly. If
they are not clear, the monitor should verify and write the answer clearly next to the originally unclear response;
• the Telephone and Fax information (if relevant) is correctly stated : Country Code + Area Code + Number;
• the Email address (if relevant) is correctly stated: [email protected];
• a full translation of text answers is provided for languages other than the WFP official languages. When and where possible, a full translation of text answers provided in Spanish, French and Arabic would also be greatly appreciated;
• Answers provided for questions allowing for additional information are clearly written in the space provided. If no additional information has been provided, and the issue is not relevant then tick or enter NR (Not Relevant).
Specific Issues and Questions There are many ways to check if the information reported in a questionnaire is reliable. Surveys frequently include cross-checking questions as a process of internal verification. This means that the same information is collected by asking the same question in different ways. If the results to the different question formats are the same, it can be assumed that they are reliable. Questions on grades In general, verify that information provided for grades is consistently provided throughout the survey. If for example the school has four grades (Grades 1, 2, 3 and 4), check that answers have been provided for all four grades for grade specific questions –i.e., questions on feeding per grade, teachers per grade, classrooms per grade, etc should all have answers for grades 1 through 4. Ensure also that there are no responses for grades that are not included in the school, e.g., Grades 5 and above in this example. School Physical Assets • The answer to the question “Number of
classrooms this year” should be equal to the sum of all the answers provided for questions on the number of classroom used by all grades for this year.
For example: Number of classrooms this year 5 . . How many classrooms were used by Grade 1 this year 1 How many classrooms were used by Grade 2 this year 2 How many classrooms were used by Grade 3 this year 2 How many classrooms were used by Grade 4 this year 0 . .
Type of water source at the school • Ensure that if the answer to the question “Is
there a water source inside the school compound?” is NO, that the question “If there is

Baseline Survey Manual
34
a water source, does it provide potable water?” is coherently answered (--i.e., NR)
Summary of enrolment • The answer to the question “Boys enrolled this
year” should be equal to the sum of all the answers provided for questions on boys enrolled this year in specific grades.
For example: Boys enrolled this year 47 . . Boys enrolled in Grade 1 this year 15 Boys enrolled in Grade 2 this year 19 Boys enrolled in Grade 3 this year 13 Boys enrolled in Grade 4 this year 0 Boys enrolled in Grade 5 this year 0
• Check for outliers: values that are
significantly different from the average set of values provided in a specific context. For example:
Enrolment of boys for grade 1: 23 Enrolment of boys for grade 2: 253 Enrolment of boys for grade 3: 19 Enrolment of boys for grade 4: 22 253 is an outlier and needs to be verified.
Nature of WFP programme at school • Please ensure that the answer to the question
“Please indicate the year the WFP programme first started at school:” is consistent with the sample frame the school has be registered in (new or existing school feeding programme). If upon verification it is not, please make a note of this on the questionnaire.
Higher Education • The answer to the question “Boys enrolling in
higher education”(number) cannot be greater than the number of boys enrolled in the highest grade covered in the school. (The same is valid for girls).
For example: Boys enrolling in higher education 23 . . Boys enrolled in Grade 5 27
Attendance • All responses to questions on total monthly
attendance should be the results of the calculation:
[Number of boys enrolled for Month A in Grade X] * [Number of school days in Month A]
Drop out rate • Ensure that the answer to the question “Most
recent complete school year for which late enrolments and transfer data is valid:” is the same as the answer to the questions “Most recent complete school year for which attendance data is valid:” in the Attendance section. The same academic year must be used to source both sets.
Teaching staff at school • The total number of male and female teachers
should be equal to the sum of the numbers of male and female certified and uncertified teachers respectively.
• The total number of teachers should be equal to the sum of the total male and female teachers, as well as the sum of all certified and uncertified male and female teachers.
For example: Certified male teachers this year 5 Uncertified male teachers this year 3 Certified female teachers this year 2 Uncertified female teachers this year 3 . . Total male teacher this year 8 Total female teachers this year 5 . . Total teachers this year 13
Teacher attendance • Ensure that the number of teachers marked for
any of the questions in this section is not greater that the total number of teachers in the school as reported in the Teaching Staff at School section.
Absenteeism and Non-Enrolment • Ensure that all items have been ranked and that
those that have not been ranked, have been marked as NR if they are not relevant to the context. Evaluate the hierarchy of rankings to ensure that “1” has effectively been used to represent the highest (most important) item.

Baseline Survey Manual
35
Endnotes to text
1 Universal Declaration of Human Rights, Adopted and proclaimed by General Assembly resolution 217 A (III) of 10 December 1948 2 World Declaration on Education For All, The World Conference on Education for All, Jomtien, Thailand, 5-9 March 1990 3 Education for all: Achieving the goal, The Amman Affirmation, Mid-Decade Meeting of the International
Consultative Forum on Education for All, Amman, Jordan, 16-19 June 1996 4 “Education for All”, UNESCO EFA Website, Internet access at http://www.unesco.org/education/efa/ed_for_all/index.shtml 5 “Global Food for Education Pilot Initiative”, FASOnline Web site, Internet access at: http://www.fas.usda.gov/excredits/gffei.html 6 School Feeding Initiative, Policy Issues, Agenda Item 4, Executive Board First Regular Session, Rome, 13-16 February 2001 7 Information in this section extracted from the School Feeding Handbook, “The importance of food aid for education. The case of school feeding.”, World Food Programme, UNESCO, World Health Organisation, Rome, 1999 8 As cited in Whitman et al, 2000 9 Excerpts from WFP M&E Guidelines and WFP Project Design Manual. 10 Report on the Methodology used in the Baseline Surveys (September – October 2001) for WFP’s School Feeding Campaign, Dr. Robert Crittenden, School Feeding Support Unit, WFP, 2001 11 For a few countries in Latin America where enrollment figures tend to be higher, an estimated net-enrollment of 70% to 80% was assumed. 12 Of course if the expected increases were very small – in some project documents 2% increases were expected in enrollment - then the sample sizes to accurately detect them would be extremely large. The reason to measure such small changes would not justify the cost of doing so.