school improvement plan - richmond community schools intermediate sip 2016-17.pdf · ii 2016-2017...
TRANSCRIPT

ii
2016-2017
Julia E. Test Intermediate School
Richmond Community Schools
Submitted
School Improvement Plan

Table of Contents
I. INTRODUCTION
A. Narrative description of the community, school corporation, and school
B. Description and location of the curriculum
C. Titles, descriptions, and plan for implementation of assessment instruments
1. Assessment tools
2. Impact of assessment program
3. Implementation plan
D. Opportunities for teachers to be included in decision-making
related to the use of academic assessment results
E. Commitment to highly qualified teachers and paraprofessionals
II. STATEMENT OF VISION, MISSION, AND BELIEFS
A. Richmond Community Schools
B. Test Intermediate School
III. SUMMARY OF DATA
A. Analysis of Data from the A-F Accountability Model
B. ISTEP+ Performance
C. Reading Data
D. Attendance rate
D. Other performance indicators
E. Educational programming and the learning environment
1. Safe and disciplined learning environment
2. Implementation of school-wide reform strategies that
provide opportunities for all children to meet proficient
and advanced levels of academic achievement and which
use effective scientifically based research methods and
instructional practices
3. Educational programs, increasing the amount of learning
time, and activities to ensure that students having difficult
mastering proficient and advanced academic achievement
are provided with effective, timely additional assistance
4. Plans for assisting children in transition
IV. SUMMARY OF COMPREHENSIVE NEEDS ASSESSMENT AND GOALS
A. Focus Area: Highest Student Achievement
Target Area: Reading - Strengths and challenges noted from
comprehensive needs assessment, including information about how
the school’s curriculum and instructional strategies support the
achievement of Indiana’s academic standards
B. Focus Area: Highest Student Achievement
Target Area: English/Language Arts - Strengths and challenges noted from

comprehensive needs assessment, including information about how
the school’s curriculum and instructional strategies support the
achievement of Indiana’s academic standards
C. Focus Area: Highest Student Achievement
Target Area: Mathematics - Strengths and challenges noted from
comprehensive needs assessment, including information about how
the school’s curriculum and instructional strategies support the
achievement of Indiana’s academic standards.
D. Focus Area: Highest Student Achievement
Target Area: Graduation Rate - Strengths and challenges noted from
comprehensive needs assessment, including information about how
the school’s curriculum and instructional strategies support the
achievement of Indiana’s academic standards
E. Focus Area: Safe and Orderly Learning Environment
Target Area: Responsible Behavior - Strengths and challenges noted from
comprehensive needs assessment, including information about how
the school’s curriculum and instructional strategies support the
achievement of Indiana’s academic standards
F. Parental involvement
1. Strategies to increase parental involvement
2. Description of how school provides individual academic
results to parents
3. Strategies to involve parents in planning, review, and
improvement of school-wide plan
G. Technology as a learning tool
H. Impact of professional development
I. Cultural competency
V. STUDENT ACHIEVEMENT OBJECTIVES
A. Highest Student Achievement - Reading
B. Highest Student Achievement – English/Language Arts
C. Highest Student Achievement – Mathematics
D. Highest Student Achievement – Graduation Rate
E. Safe and Orderly Learning Environment
1. Responsible Behavior
2. Attendance
F. Areas where improvement is needed immediately
VI. BENCHMARKS FOR PROGRESS
VII. PROPOSED INTERVENTIONS BASED ON SCHOOL IMPROVEMENT GOALS
VIII. PROFESSIONAL DEVELOPMENT PLAN

IX. ACADEMIC HONORS DIPLOMA AND CORE 40 (for secondary schools)
A. Provisions to offer courses that allow all students to become
eligible to earn the Academic Honors Diploma
B. Provisions to encourage all students to earn an Academic
Honors Diploma or complete the Core 40 curriculum
X. SUBMISSION OF SCHOOL IMPROVEMENT PLAN TO GOVERNING BODY
A. Statutes and rules the school wishes to have suspended
from operation
B. Coordination and integration of federal, state, and local funds
C. A list of programs that will be consolidated under school-wide plan
XI. APPENDICES
A. Richmond Community Schools Strategic Plan
B. District Assessment Calendar
C. If your school is in School Improvement Status, the following is required:
1. Teacher Mentoring Program
2. LEA Title I Funds Assurance
3. Written Notice to Parents
4. Responsiblities of school, LEA, and SEA
*An item in italics indicates a Title I Schoolwide Plan/School Improvement Plan requirement

2
I. INTRODUCTION
A. Narrative Description of the Community, School Corporation, and School
1. The Community and the School Corporation
Richmond is the county seat of Wayne County, located in East Central Indiana, approximately
seventy miles east of the state capital, Indianapolis. Like many other areas in the Midwest,
Wayne County has lost a good deal of its manufacturing base over the last 30 years. As a result
of this loss of employment opportunity, the overall economic climate in Wayne County has
declined. The erosion of the tax base has had a significant impact on governmental services,
including law enforcement, mental health services, and school support services. While many
vibrant community organizations and agencies are working toward economic growth, economic
stress, unemployment, and poverty are seen as challenges to the community at large as well as
our school.
As the largest school district in Wayne County, Richmond Community Schools (RCS) serves a
population of 42,104 citizens (U.S. Census Bureau, 2010). During school year 2014-2015, RCS
educated 5,000 students in grades Kindergarten through twelve. An additional 300 children,
ages three through five, were served in early childhood education classrooms throughout the
district.
The student population of RCS is becoming increasingly diverse. While the majority of students
(70%) are identified as white, 12.6% are identified as multiracial, 9.2% as black, 6.8% as
Hispanic, and 1.2% as Asian.
According to the U.S. Census Bureau in 2012, 21.8% of the total Richmond population lives in
poverty. That many of these families are raising children is supported by the fact that 75.6% of
the RCS student population is eligible for free or reduced-price meals.
In response to these challenges, and to improve fiscal efficiency while maintaining positive
student outcomes, RCS embarked on a master planning process during the 2011-2012 school
year. As a result of this planning, RCS now operates six PK-4 elementary buildings, two 5-8
intermediate buildings, and one 9-12 high school. There is also a 5-8 special programs building,
as well as a K-12 alternative education site.
Despite these challenges, Richmond Community Schools is committed to graduating students
who are college and career-ready. With over 120 community partnerships to provide students
with needed supports and connections, RCS is providing students with the educational
foundation needed for future success.
2. The School
Julia E. Test Intermediate School is one of Richmond Community Schools’ two intermediate
schools that serve fifth through eighth grades. Test was significantly impacted by the RCS
Master Planning process when three elementary schools were closed and 5th
and 6th
grades were
3
moved to the intermediate school. The enrollment at Test for the 2014-2015 school year was
722 students. Additionally Test supports two off site programs at the Hibberd building; the
LOGOS program includes 110 High Ability students and the Lifeskills program serving 35
Intermediate school students with severe and profound disabilities bringing our total student
count to 722. While the ethnic makeup of the student body is fairly diverse (66.0% Caucasian,
15.1% multiracial, 8.6% black, 2.2% Asian, and 7.9% Hispanic), the economic status is fairly
consistent, with 75.3% of the Test student body eligible for free or reduced-price lunch. Test
qualifies as a school-wide Title I program. Our population includes 25% students identified with
special needs.
Julia E. Test was opened in September of 1922. The building, which is located at 33 North 22nd
Street in Richmond, is named for a long time dedicated teacher in the Richmond community.
The building was originally built as a high school. Since that time it has been a junior high
school, a middle school for grades 6-8, a middle school for grades 7-8 and is now, one of two
public intermediate schools grades 5-8, that serve the Richmond community.
As a part of the RCS Master Planning process, the Test district was adjusted, and now includes
an area bordered by the state line on the east, the county line on the south, to the river on the
north and 9th
street on the west.
The faculty at Test Intermediate consists of a principal, an assistant principal, a library/media
specialist, a counselor, an instructional coach, two interventionists, and 42 certified teachers,
including 6 special needs teachers. All are currently employed by Richmond Community
Schools. Through a contracted services arrangement, a school social worker is available 12
hours per week. In addition to the certified staff, instructional support is provided through highly
qualified paraprofessionals, including 7 special education paraprofessionals and 6 Title I
paraprofessionals. Also employed at Test Intermediate School are a school secretary, a clerical, -
3 environmental services staff members, and 6 cafeteria employees. Support staff also includes a
Communities in Schools Site Coordinator, an In-School Restriction liaison, an Administrative
Assistant for Student Discipline, a School Resource Officer, a behavioral consultant, a part-time
nurse, a full-time CNA, and a part-time athletic director. Altogether, Test Intermediate School
employs 77 certified and non-certified staff members who contribute to the learning process at
our school.
In addition to regular core subjects, fine arts, physical education, library, and special needs
classes, the following programs and/or services are provided: after school tutoring, mixed
musical after school activities, gardening club. Various academic and sport-related activities are
offered after school. Breakfast and lunch are served daily.
Technology at Test Intermediate is providing its students with up-to-date technological
opportunities, which engage students in the instructional process and allow them to become a
global learning community. Test has an interactive website that provides information on school
events, accomplishments, links to individual teacher websites, and other school information. The
learning center in the library has the capability to show multiple educational programs for
classrooms from a central location and a scan/computer software system effectively monitors all
book check in/check out procedures and provides web contacts for book related subjects. All
4
classrooms have a teacher workstation, which is connected to the network. Test also has
interactive e-Instruction units and handheld chalkboards available for classes to utilize on a daily
basis. 14 classrooms are equipped with an interactive SmartBoard to support instruction. Test
has five computer labs which are available for student use. Richmond Community Schools has
also purchased student licenses for a number of educational support programs to be used to
supplement instruction in grades 5-8, and Rosetta Stone is available for our ESL population.
Assessments (NWEA, CogAT, ISTEP+) are completed online as well.
Every Tuesday the student day ends at 2:49 in order for the staff to participate in a 55 minute
staff development opportunity. Staff development activities have a data-driven focus and
activities to facilitate student learning with emphasis on our English/ Language Arts, Math and
Behavior goals. Additional Staff development activities or implementation/reflection occurs
each Thursday in Professional Learning Communities as a follow-up to Tuesday professional
development meetings.
The school earned a grade of “B” in 2014 based on the Indiana A-F School Accountability
model. This grade was carried forward to 2015 by the State of Indiana due to a change in
standards and testing vendors. The school receives assistance from Title I as a Schoolwide
Program school, which allows services to be provided to all students at Test intermediate School.
B. Description and Location of the Curriculum
Richmond Community Schools’ written curriculum is based on the Indiana Academic Standards
for grades 2-12. Each teacher has access to a digital copy of the standards. Additionally, district
curriculum maps are being created for English/Language Arts and Mathematics for grades K-8.
Curriculum in the Richmond Community Schools is:
1. Aligned with State Standards: Upon the adoption of the 2014 Indiana Academic
Standards, curriculum maps were revised to reflect the new standards. Building
administrators have taken an active role in communicating with teachers, parents, and
students in explaining the curriculum and how curriculum objectives are being met in
their schools. They observe instruction to ensure that the curriculum is being
implemented and that learning is evident by reviewing student work, classroom displays,
and assessment data.
2. Aligned with Instruction and Assessment: Curriculum drives instruction and assessment,
and standards-based formative assessments drive instruction.
3. Rigorous and Challenging for all Students: In all content areas and grade levels, the
curriculum goes beyond basic skills and reflects higher order thinking.
4. Relevant and Meaningful to Students: In all content areas and grade levels of instruction,
the curriculum is relevant and meaningful to the lives of the students. Teachers and
students are encouraged to make connections to other disciplines and to real life.
5
Students are expected to be able to explain what they are learning and why it is important
to learn that particular skill or concept.
5. Appropriate to the Learner: In all content areas and at all levels of instruction,
curriculum is instructed to accommodate the diverse groups of learners who have
different readiness levels, learning styles, and interests. Teachers implement a variety of
instructional strategies, assessments, resources, and flexible grouping patterns to meet the
needs of all learners.
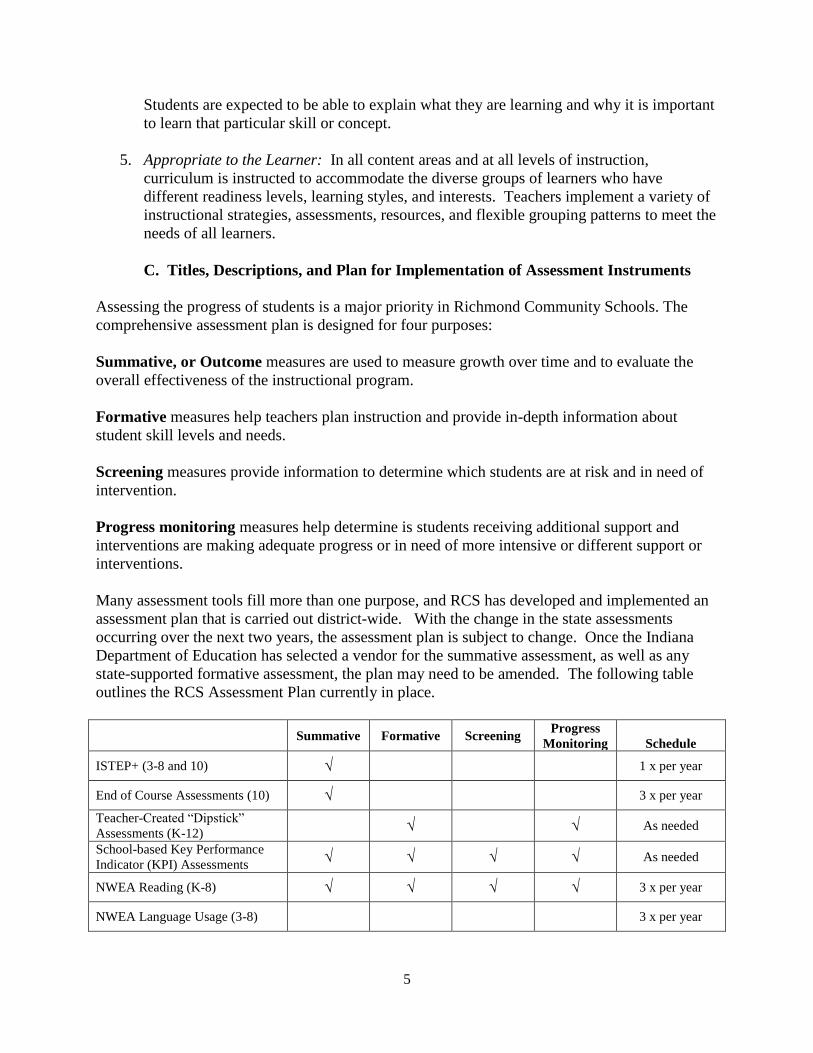
C. Titles, Descriptions, and Plan for Implementation of Assessment Instruments
Assessing the progress of students is a major priority in Richmond Community Schools. The
comprehensive assessment plan is designed for four purposes:
Summative, or Outcome measures are used to measure growth over time and to evaluate the
overall effectiveness of the instructional program.
Formative measures help teachers plan instruction and provide in-depth information about
student skill levels and needs.
Screening measures provide information to determine which students are at risk and in need of
intervention.
Progress monitoring measures help determine is students receiving additional support and
interventions are making adequate progress or in need of more intensive or different support or
interventions.
Many assessment tools fill more than one purpose, and RCS has developed and implemented an
assessment plan that is carried out district-wide. With the change in the state assessments
occurring over the next two years, the assessment plan is subject to change. Once the Indiana
Department of Education has selected a vendor for the summative assessment, as well as any
state-supported formative assessment, the plan may need to be amended. The following table
outlines the RCS Assessment Plan currently in place.
Summative
Formative
Screening Progress
Monitoring
Schedule
ISTEP+ (3-8 and 10) √ 1 x per year
End of Course Assessments (10) √ 3 x per year
Teacher-Created “Dipstick”
Assessments (K-12) √ √ As needed
School-based Key Performance
Indicator (KPI) Assessments √ √ √ √ As needed
NWEA Reading (K-8) √ √ √ √ 3 x per year
NWEA Language Usage (3-8) 3 x per year

6
NWEA Math (K-8) √ √ √ √ 3 x per year
Math Facts Fluency (K-8) √ √ 3 x per year
D. Opportunities for Teachers to Be Included in Decision-making Related to the
Use of Academic Assessment Results
Every teacher uses data from the district assessments, as well as a variety of classroom
assessments to evaluate the learning growth of his/her students. The information gleaned from
careful analysis of the assessment results guides instruction. Teachers receive training on
accessing and interpreting the data through their Tuesday afternoon professional development
sessions, and grade level teams meet regularly to review the data and plan their instructional
response. Aside from ISTEP+, the assessment tools provide real-time data, and all teachers have
access to the data from their teacher workstations. Assessment results are used to create data
walls to ensure that every student’s progress is tracked, and appropriate instructional strategies
are implemented. Through a process of tiered interventions, teachers are intensely involved in
the decision-making process related to the use of assessment data.
E. Commitment to Highly Qualified Teachers and Paraprofessionals
All RCS teachers are deemed to be highly qualified, and all paraprofessionals in Title I buildings
are deemed to be highly qualified. Teachers may be highly qualified as demonstrated by
successful completion of the National Teacher Examination or the HOUSSE Rubric, while
paraprofessionals may be deemed highly qualified through completion of 60 college credit hours
or successful completion of the PRAXIS Examination. All staff credentials are available in the
Human Resources Office of Richmond Community Schools.
Richmond Community Schools is fortunate to attract and hire the very best professionals
available to staff our schools. Richmond Community Schools, along with Test intermediate
School, have many strategies in place to ensure that highly qualified individuals are employed.
Human resources personnel and school administrators visit college recruitment days, and
maintain direct contact with local colleges and universities. Richmond Community Schools
maintains an attractive and user-friendly website where vacancies are publicized and applications
can be completed online. Employment opportunities are also posted on the Indiana Department
of Education website (www.doe.in.gov) Additionally, Richmond Community Schools works
closely with colleges and universities in the placement and supervision of student teachers,
where potential employees can be observed over a period of time.
II. STATEMENT OF MISSION, VISION, AND BELIEFS
A. Richmond Community Schools
Test Intermediate School is a part of the Richmond Community Schools Corporation. As

7
a member school, it is aligned with the Board of School Trustees’ Vision, Mission, Goals, and
Belief Statements.
1. RCS Board Vision
Richmond Community Schools: A community nurturing mind, body, and spirit to prepare
students for lives of choice, purpose, and service.
2. RCS Mission Statement
Richmond Community Schools guides students on pathways of learning to a future of limitless
possibilities.
3. Board Goals
Richmond Community Schools will increase opportunities for student and stakeholder
engagement.
Richmond Community Schools will assure student growth through measures of
academic, social, physical, and emotional successes.
Richmond Community Schools will maximize resources to provide the highest quality
educational opportunities for students in Wayne County.
. 3. Belief Statements
Meaningful learning occurs in the presence of meaningful relationships.
Schools should provide a safe and secure environment for learners of all ages.
In an environment where a student can err without being judged, risk-taking creates
resilient thinkers and learners.
Education is an enjoyable process when learners are engaged through discovery,
exploration, and focus.
The unique learning needs of every child should be addressed through appropriate and
diverse instructional methods.
Through education, students realize their strengths and weaknesses and develop
confidence to become creative builders of their future.
A measure of school and student success should be a balance of student assessment and
other indicators of student growth.
Learning is most productive when there is collaboration among students, parents, staff,
and community partners.
Citizenship is developed through student-directed, teacher-facilitated, and family-
supported experiences that prepare students for life’s demands.

8
Learning is priceless and worthy of continuous community investment; a robust public
education is essential for citizenship, democracy, and the common good.
B. The School
1. School Mission
Test Intermediate School provides a caring, challenging environment where dedicated educators
strive to prepare students academically, physically, socially, and emotionally to be productive
members of society.
2. School Vision
Test Intermediate School students will become lifelong learners who are goal-oriented, self-
aware, successful, problem solvers who have a positive impact on society through creative
collaboration with caring stakeholders in a positive, safe, stimulating environment.
3. School Belief Statements
An education for young adolescents must be:
Developmentally Responsive - using the nature of young adolescents as the foundation
on which all decisions are made,
Challenging - recognizing that every student can learn and everyone is held to high
expectations,
Empowering - providing all students with the knowledge and skills they need to take
control of their lives, and
Equitable – advocating for every student’s right to learn and providing challenging and
relevant learning opportunities.
A successful school for young adolescents should exemplify these characteristics:
Curriculum, Instruction, and Assessment
o Value young adolescents
o Active learning
o Challenging curriculum
o Multiple learning approaches
o Varied assessments
Leadership and Organization
o Shared vision
o Committed leaders
o Courageous and collaborative leaders
o Professional development
9
o Organizational structures
Culture and Community
o Positive school environment
o Adult advocates
o Guidance services
o Health and wellness
o Family involvement
o Community and business partners
From “This We Believe”, by the Association for Middle Level
Education, (AMLE/NMSA, 2010).
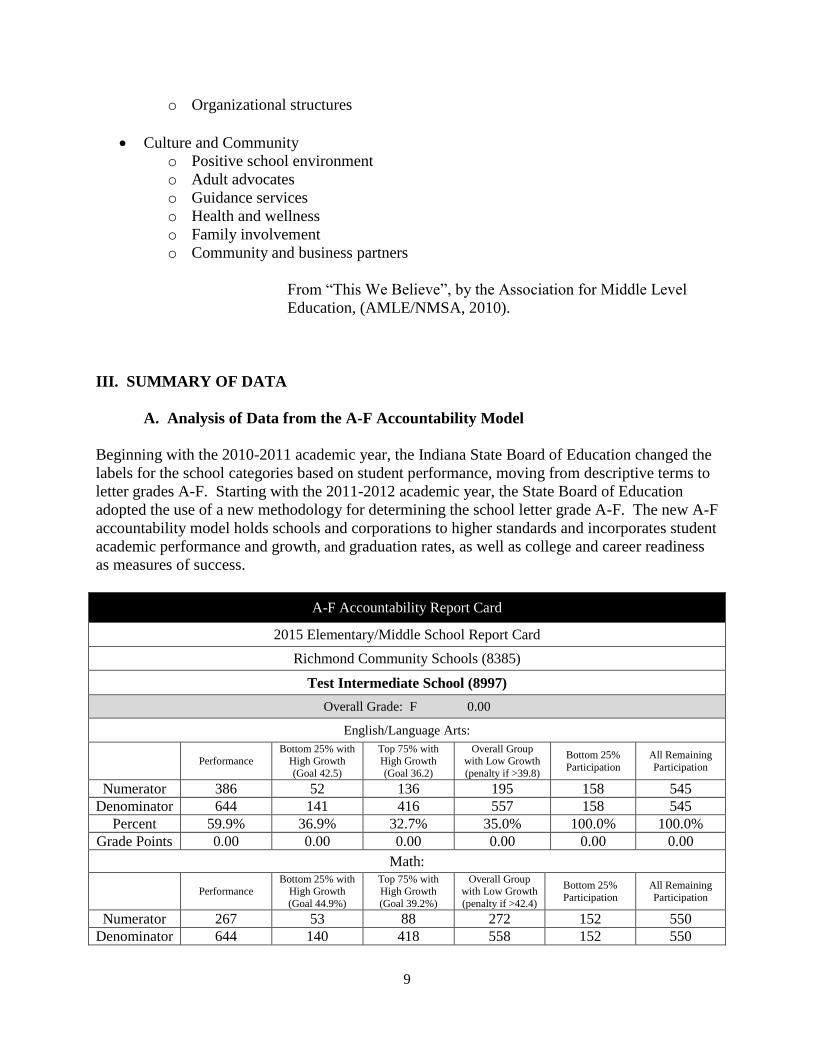
III. SUMMARY OF DATA
A. Analysis of Data from the A-F Accountability Model
Beginning with the 2010-2011 academic year, the Indiana State Board of Education changed the
labels for the school categories based on student performance, moving from descriptive terms to
letter grades A-F. Starting with the 2011-2012 academic year, the State Board of Education
adopted the use of a new methodology for determining the school letter grade A-F. The new A-F
accountability model holds schools and corporations to higher standards and incorporates student
academic performance and growth, and graduation rates, as well as college and career readiness
as measures of success.
A-F Accountability Report Card
2015 Elementary/Middle School Report Card
Richmond Community Schools (8385)
Test Intermediate School (8997)
Overall Grade: F 0.00
English/Language Arts:
Performance Bottom 25% with
High Growth
(Goal 42.5)
Top 75% with High Growth
(Goal 36.2)
Overall Group with Low Growth
(penalty if >39.8)
Bottom 25%
Participation
All Remaining
Participation
Numerator 386 52 136 195 158 545
Denominator 644 141 416 557 158 545
Percent 59.9% 36.9% 32.7% 35.0% 100.0% 100.0%
Grade Points 0.00 0.00 0.00 0.00 0.00 0.00
Math:
Performance Bottom 25% with
High Growth
(Goal 44.9%)
Top 75% with High Growth
(Goal 39.2%)
Overall Group with Low Growth
(penalty if >42.4)
Bottom 25%
Participation
All Remaining
Participation
Numerator 267 53 88 272 152 550
Denominator 644 140 418 558 152 550
10
Percent 41.5% 37.9% 21.1% 48.7% 100.0% 100.0%
Grade Points 0.00 0.00 0.00 -1.00 0.00 0.00
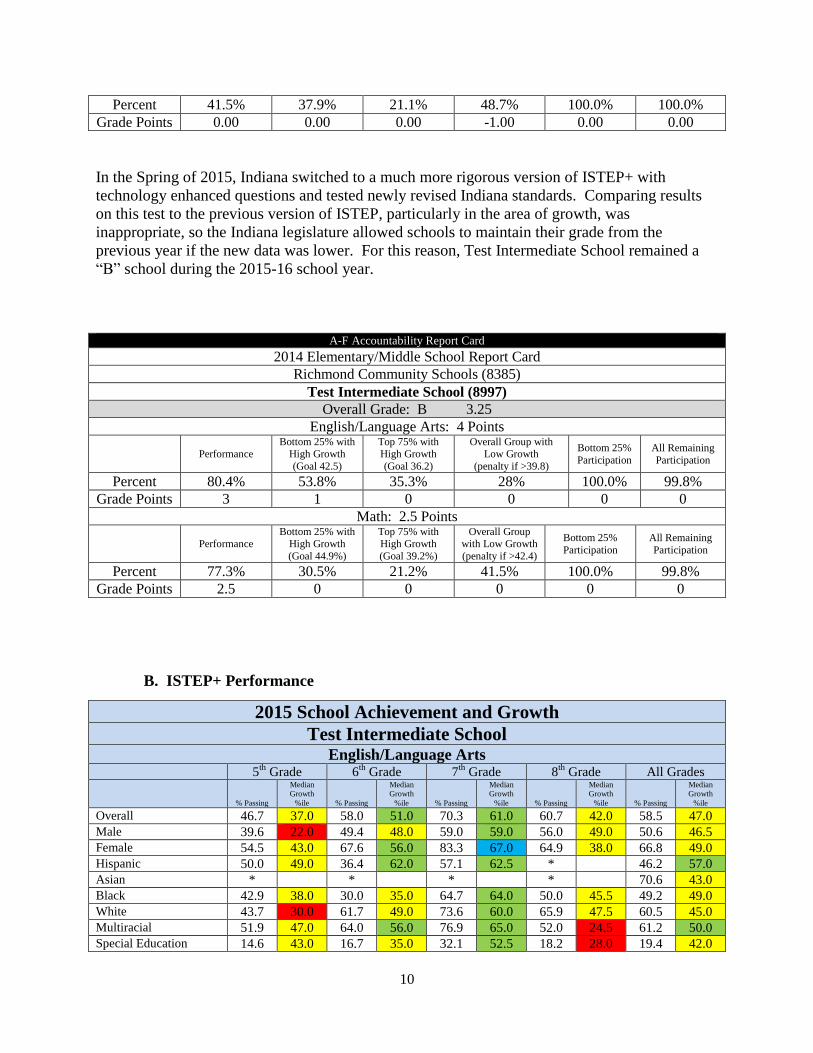
In the Spring of 2015, Indiana switched to a much more rigorous version of ISTEP+ with
technology enhanced questions and tested newly revised Indiana standards. Comparing results
on this test to the previous version of ISTEP, particularly in the area of growth, was
inappropriate, so the Indiana legislature allowed schools to maintain their grade from the
previous year if the new data was lower. For this reason, Test Intermediate School remained a
“B” school during the 2015-16 school year.
A-F Accountability Report Card
2014 Elementary/Middle School Report Card
Richmond Community Schools (8385)
Test Intermediate School (8997)
Overall Grade: B 3.25
English/Language Arts: 4 Points
Performance Bottom 25% with
High Growth
(Goal 42.5)
Top 75% with High Growth
(Goal 36.2)
Overall Group with Low Growth
(penalty if >39.8)
Bottom 25%
Participation
All Remaining
Participation
Percent 80.4% 53.8% 35.3% 28% 100.0% 99.8%
Grade Points 3 1 0 0 0 0
Math: 2.5 Points
Performance Bottom 25% with
High Growth
(Goal 44.9%)
Top 75% with High Growth
(Goal 39.2%)
Overall Group with Low Growth
(penalty if >42.4)
Bottom 25%
Participation
All Remaining
Participation
Percent 77.3% 30.5% 21.2% 41.5% 100.0% 99.8%
Grade Points 2.5 0 0 0 0 0
B. ISTEP+ Performance
2015 School Achievement and Growth
Test Intermediate School English/Language Arts
5th
Grade 6th
Grade 7th
Grade 8th
Grade All Grades
% Passing
Median
Growth
%ile % Passing
Median
Growth
%ile % Passing
Median
Growth
%ile % Passing
Median
Growth
%ile % Passing
Median
Growth
%ile
Overall 46.7 37.0 58.0 51.0 70.3 61.0 60.7 42.0 58.5 47.0
Male 39.6 22.0 49.4 48.0 59.0 59.0 56.0 49.0 50.6 46.5
Female 54.5 43.0 67.6 56.0 83.3 67.0 64.9 38.0 66.8 49.0
Hispanic 50.0 49.0 36.4 62.0 57.1 62.5 * 46.2 57.0
Asian * * * * 70.6 43.0
Black 42.9 38.0 30.0 35.0 64.7 64.0 50.0 45.5 49.2 49.0
White 43.7 30.0 61.7 49.0 73.6 60.0 65.9 47.5 60.5 45.0
Multiracial 51.9 47.0 64.0 56.0 76.9 65.0 52.0 24.5 61.2 50.0
Special Education 14.6 43.0 16.7 35.0 32.1 52.5 18.2 28.0 19.4 42.0

11
General Education 58.1 36.0 70.2 54.0 78.7 63.0 66.7 48.0 68.1 49.0
Free/Reduced Lunch 38.0 41.0 52.7 53.0 63.9 62.0 51.2 38.0 50.6 48.0
Paid Lunch 72.3 25.0 71.1 51.0 85.1 60.0 81.8 49.0 77.8 46.0
English Language
Learners 47.6 43.0 25.0 57.0 53.3 62.5 40.0 47.0 43.1 52.0
Non English Language
Learners 46.6 34.0 60.7 51.0 72.1 61.0 61.9 41.5 59.9 47.0
Prior Year Bottom 25% 4.9 41.0 18.2 50.0 29.4 59.0 12.8 47.0 15.6 48.0
Prior Year Top 75% 63.3 32.0 76.5 53.0 89.5 62.0 79.7 41.0 76.6 47.0
Low Growth Typical <50%ile Typical >50%ile High Growth
In English/Language Arts, Test Intermediate School’s 2015 ISTEP results indicate low levels of
growth in every subgroup at the 5th
and 8th
grade levels. Both 6th
and 7th
grade achieved growth
at or above the 50th
percentile with none fall below the 35th
percentile. This suggests a need to
reevaluate programs and/or instructional strategies at these levels.
Math
5th
Grade 6th
Grade 7th
Grade 8th
Grade All Grades
5th
Grade % Passing
Median
Growth
%ile % Passing
Median
Growth
%ile % Passing
Median
Growth
%ile % Passing
Median
Growth
%ile % Passing
Median
Growth
%ile
Overall 34.2 17.0 32.7 20.5 47.1 57.0 50.6 55.0 41.2 34.0
Male 40.2 14.0 32.5 19.5 37.3 56.0 52.4 45.0 41.7 41.0
Female 27.6 19.5 32.9 20.5 58.3 56.0 48.9 61.5 40.6 28.0
Hispanic 22.2 23.0 18.2 17.5 35.7 39.5 * 28.8 34.5
Asian * * * * 64.7 28.0
Black 20.0 38.0 10.0 27.0 29.4 62.5 5.6 69.0 16.7 53.0
White 37.3 14.0 34.6 18.0 52.7 53.0 59.3 55.0 46.0 32.0
Multiracial 29.6 12.0 37.5 24.5 42.3 76.0 44.0 36.5 38.2 34.0
Special Education 14.3 14.5 14.3 16.0 28.6 58.0 31.8 84.5 20.1 34.5
General Education 41.5 18.0 38.0 20.5 51.2 57.0 53.2 53.0 46.4 34.0
Free/Reduced Lunch 24.8 17.0 22.5 21.0 39.8 57.0 42.3 55.5 32.2 35.0
Paid Lunch 61.7 16.0 57.8 19.5 63.8 57.0 69.1 55.0 63.4 33.0
English Language
Learners 38.1 26.5 16.7 24.0 40.0 45.0 30.0 70.0 32.8 33.0
Non English Language
Learners 33.7 15.5 34.0 20.0 47.9 58.0 51.8 55.0 42.0 35.0
Prior Year Bottom 25% 2.4 22.0 0.0 24.0 5.9 70.5 2.6 75.0 2.7 44.0
Prior Year Top 75% 46.9 14.0 47.5 20.0 62.6 51.0 69.7 49.5 56.8 32.0
Low Growth Typical <50%ile Typical >50%ile High Growth
In mathematics, Spring 2015 ISTEP+ results show extremely low levels of growth with almost every
subgroup in both 5th
and 6th
grade. However, growth is significantly higher with every subgroup at
the 7th
and 8th
grade levels. Again, this suggests a need to reevaluate programs and/or instructional
strategies at these levels. Successful strategies being used in 7th
and 8th
grade need to be
implemented in both 5th
and 6th
grade mathematics classes.
Looking closer at the differences between subgroup scores and the overall grade level averages
show a trend of significant achievement gaps in several areas.
Language Arts 2012-13 2013-14 2014-15
% Passing Ach. Gaps % Passing Ach. Gaps % Passing Ach. Gaps
General Education 5 75.2 5 91.4 4.2 58.1 11.4
General Education 6 76.7 2 82.8 4 70.2 12

12
General Education 7 71 6.9 84.4 4.4 78.7 8.4
General Education 8 77 4.8 83.4 7 66.7 6
Special Education 5 29.4 -40.8 60 -27.2 14.6 -32.1
Special Education 6 53.8 -21 50 -29 16.7 -41
Special Education 7 25.9 -38.2 44.4 -35.6 32.1 -38.2
Special Education 8 33.3 -38.9 37 -39.4 18.2 -42.5
Mathematics % Passing Ach. Gaps % Passing Ach. Gaps % Passing Ach. Gaps
General Education 5 88.3 5.2 87.5 2.4 41.5 7.3
General Education 6 78.8 2 77.6 4 38.0 5
General Education 7 74.8 3.6 77.7 3.2 51.2 4.1
General Education 8 85.5 4.9 77.5 2.9 53.2 2.6
Special Education 5 47.4 -35.7 70 -15.1 14.3 -19.9
Special Education 6 58.3 -19 50 -24 14.3 -18
Special Education 7 51.9 -19.3 47.1 -27.4 28.6 -18.5
Special Education 8 40 -40.6 57.7 -16.9 31.8 -18.8
ISTEP+ data from 2012-2015 show that Special education students at all grade levels consistently
show achievement levels significantly lower than the whole-group average in both English/language
arts and mathematics. This suggests a need to evaluate and make adjustments to special education
programs and services currently in place to better meet the needs of these students.
Language Arts 2012-13 2013-14 2014-15
% Passing Ach. Gaps % Passing Ach. Gaps % Passing Ach. Gaps
Free/Reduced Lunch 5 63.4 -6.8 83.3 -3.9 41 -5.7
Free/Reduced Lunch 6 70.5 -5 74.1 -5 52.7 -5
Free/Reduced Lunch 7 57 -7.1 75 -5 63.9 -6.4
Free/Reduced Lunch 8 65.8 -6.4 70.3 -6.1 51.2 -9.5
Paid Lunch 5 82.6 12.4 97.5 10.3 72.3 25.6
Paid Lunch 6 86 11 90.9 12 71.1 13
Paid Lunch 7 80 15.9 91.8 11.8 85.1 14.8
Paid Lunch 8 83.3 11.1 88.3 11.9 81.8 21.1
Mathematics % Passing Ach. Gaps % Passing Ach. Gaps % Passing Ach. Gaps
Free/Reduced Lunch 5 77.7 -5.4 82.4 -2.7 24.8 -9.4
Free/Reduced Lunch 6 71.3 -6 66.4 -8 22.5 -10
Free/Reduced Lunch 7 68.6 -2.6 67.2 -7.3 39.8 -7.3
Free/Reduced Lunch 8 76.5 -4.1 67.5 -7.1 42.3 -8.3
Paid Lunch 5 93.5 10.4 92.5 7.4 61.7 27.5
Paid Lunch 6 92 15 93.2 19 57.8 25
Paid Lunch 7 88.3 17.1 91.8 17.3 63.8 16.7
Paid Lunch 8 87.9 7.3 88.3 13.7 69.1 18.5
ISTEP+ results from 2012-2015 also show a trend when considering socio-economic status.
Students who qualify for free or reduced-price lunches (75% of the student population)
consistently score lower than the whole-group average while paid lunch students (25% of
enrollment) score significantly higher than the whole-group average in both English/language
arts and Mathematics. This indicates a need to consider professional development with an
emphasis on the impact of poverty on learning and successful strategies for reaching students
living in poverty.
13
Language Arts 2012-13 2013-14 2014-15
% Passing Ach. Gaps % Passing Ach. Gaps % Passing Ach. Gaps
Black 5 64.3 -5.9 78.6 -8.6 42.9 -3.8
Black 6 57.9 -17 66.7 -12 30 -28
Black 7 50 -14.1 70.6 -9.4 64.7 -5.6
Black 8 55 -17.2 61.1 -15.3 50 -10.7
Hispanic 5 54.5 -15.7 36.4 -50.8 50 3.3
Hispanic 6 60 -15 75 -4 36.4 -22
Hispanic 7 83.3 19.2 57.1 -13.2
Hispanic 8 43.8 -28.4
White 5 71.8 1.6 92.2 5 43.7 -3
White 6 79.5 5 82 3 61.7 4
White 7 66.7 2.6 83.6 3.6 73.6 3.3
White 8 80.8 8.6 80.5 4.1 65.9 5.2
Multiracial 5 72 1.8 100 12.8 51.9 5.2
Multiracial 6 69.6 -5 81.5 3 64 6
Multiracial 7 51.9 -12.2 70 -10 76.9 6.6
Multiracial 8 52.4 -19.8 65.4 -11 52 -8.7
Mathematics % Passing Ach. Gaps % Passing Ach. Gaps % Passing Ach. Gaps
Black 5 71.4 -11.7 84.6 -0.5 20 -14.2
Black 6 52.6 -25 57.1 -17 10 -23
Black 7 50 -21.2 58.8 -15.7 29.4 -17.7
Black 8 80 -0.6 52.9 -21.7 5.6 -45
Hispanic 5 81.8 -1.3 63.6 -21.5 22.2 -12
Hispanic 6 50 -27 75 1 18.2 -15
Hispanic 7 75 3.8 -74.5 35.7 -11.4
Hispanic 8 56.3 -24.3 -74.6 -50.6
White 5 86 2.9 86.4 1.3 37.8 3.6
White 6 86.6 9 80.2 6 34.6 2
White 7 76.4 5.2 75.9 1.4 52.7 5.6
White 8 84 3.4 78.9 4.3 59.3 8.7
Multiracial 5 80 -3.1 94.4 9.3 29.6 -4.6
Multiracial 6 69.6 -8 64.3 -10 37.5 5
Multiracial 7 59.3 -11.9 85 10.5 42.3 -4.8
Multiracial 8 75 -5.6 65.4 -9.2 44 -6.6
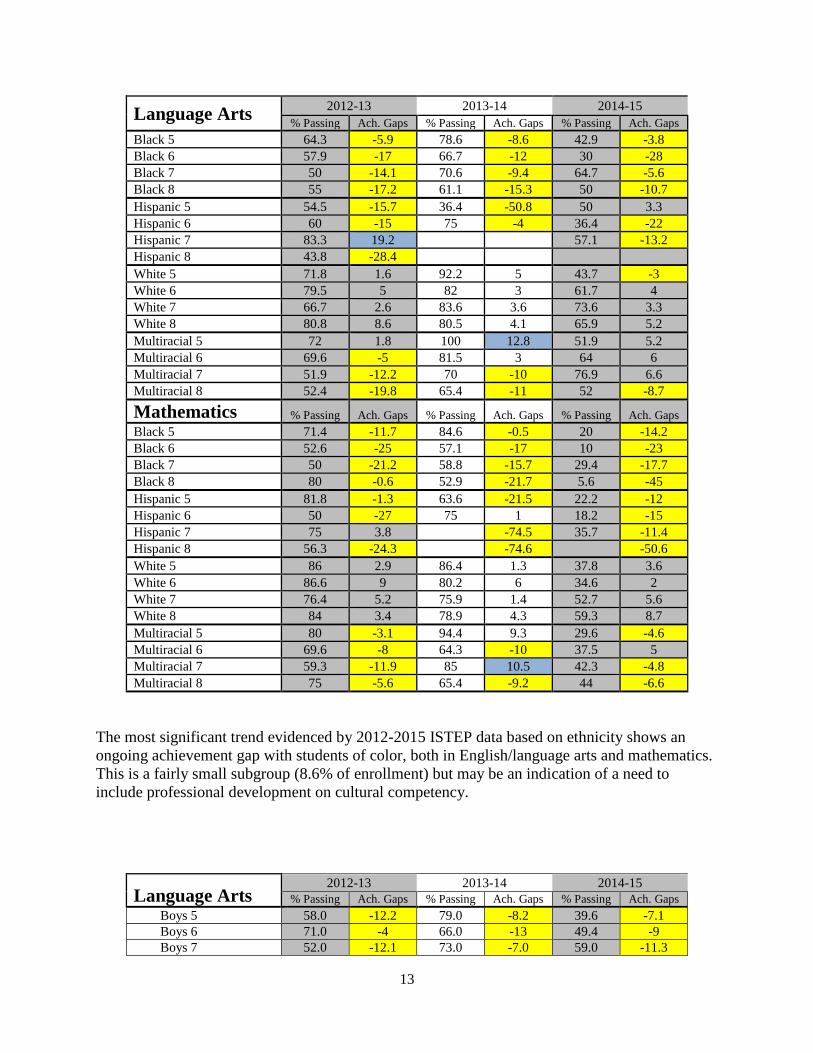
The most significant trend evidenced by 2012-2015 ISTEP data based on ethnicity shows an
ongoing achievement gap with students of color, both in English/language arts and mathematics.
This is a fairly small subgroup (8.6% of enrollment) but may be an indication of a need to
include professional development on cultural competency.
Language Arts 2012-13 2013-14 2014-15
% Passing Ach. Gaps % Passing Ach. Gaps % Passing Ach. Gaps
Boys 5 58.0 -12.2 79.0 -8.2 39.6 -7.1
Boys 6 71.0 -4 66.0 -13 49.4 -9
Boys 7 52.0 -12.1 73.0 -7.0 59.0 -11.3
14
Boys 8 60.0 -12.2 69.0 -7.4 56.0 -4.7
Girls 5 78.0 7.8 91.0 3.8 54.5 7.8
Girls 6 76.0 1.0 87.0 8.0 67.6 10
Girls 7 69.0 4.9 80.0 0.0 83.3 13.0
Girls 8 77.0 4.8 80.0 3.6 64.9 4.2
Mathematics % Passing Ach. Gaps % Passing Ach. Gaps % Passing Ach. Gaps
Boys 5 78.0 -5.1 81.0 -4.1 40.2 6.0
Boys 6 77.0 0 65.0 -9 32.5 0
Boys 7 69.0 -2.2 75.0 0.5 37.3 -9.8
Boys 8 71.0 -9.6 72.0 -2.6 52.4 1.8
Girls 5 83.0 -0.1 84.0 -1.1 27.6 -6.6
Girls 6 73.0 -4 80.0 6 32.9 0
Girls 7 67.0 -4.2 67.0 -7.5 58.3 11.2
Girls 8 81.0 0.4 73.0 -1.6 48.9 -1.7
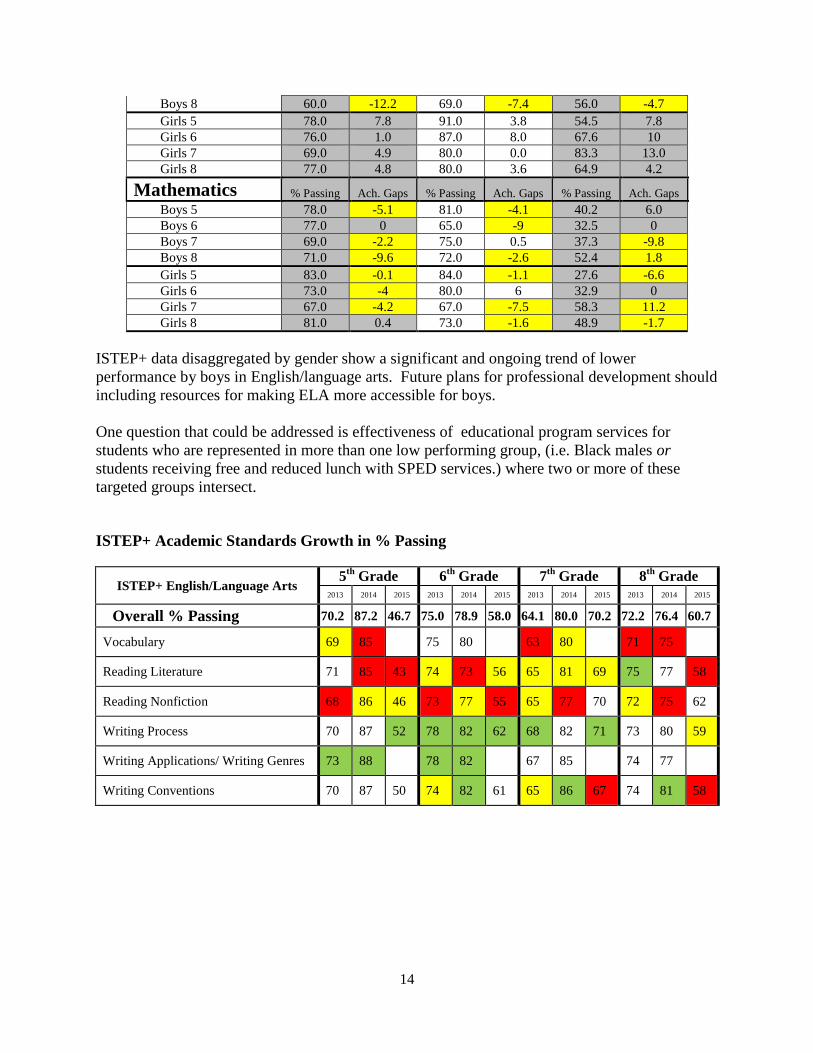
ISTEP+ data disaggregated by gender show a significant and ongoing trend of lower
performance by boys in English/language arts. Future plans for professional development should
including resources for making ELA more accessible for boys.
One question that could be addressed is effectiveness of educational program services for
students who are represented in more than one low performing group, (i.e. Black males or
students receiving free and reduced lunch with SPED services.) where two or more of these
targeted groups intersect.
ISTEP+ Academic Standards Growth in % Passing
ISTEP+ English/Language Arts 5
th Grade 6
th Grade 7
th Grade 8
th Grade
2013 2014 2015 2013 2014 2015 2013 2014 2015 2013 2014 2015
Overall % Passing 70.2 87.2 46.7 75.0 78.9 58.0 64.1 80.0 70.2 72.2 76.4 60.7
Vocabulary 69 85 75 80 63 80 71 75
Reading Literature 71 85 43 74 73 56 65 81 69 75 77 58
Reading Nonfiction 68 86 46 73 77 55 65 77 70 72 75 62
Writing Process 70 87 52 78 82 62 68 82 71 73 80 59
Writing Applications/ Writing Genres 73 88 78 82 67 85 74 77
Writing Conventions 70 87 50 74 82 61 65 86 67 74 81 58

15
ISTEP+ Mathematics 5th
Grade 6th
Grade 7th
Grade 8th
Grade
2013 2014 2015 2013 2014 2015 2013 2014 2015 2013 2014 2015
Overall % Passing 83.1 85.1 34.2 77.3 74.0 32.7 71.2 74.5 47.1 80.6 74.6 50.
6
Number Sense 82 88 36 76 74 31 74 73 44 86 78 51
Computation 85 87 38 77 78 30 70 75 49 76 72 53
Algebra & Functions/
Algebraic Thinking 84 85 36 78 72 34 73 77 44 88 76 48
Geometry 79 84 39
76 69 29
71 70 44
74 70 51
Measurement 77 82 76 71 73 76 79 73
Data Analysis &
Probability 76 83 76 73 68 70 73 67
Problem Solving 79 86 76 75 70 73 75 73
When considering historical ISTEP+ data by standard, several areas of ongoing concern appear.
In English/Language Arts, the lowest scores, at all grade levels, and across all three years, almost
always occur in vocabulary and reading comprehension (both literature and nonfiction). Writing
process and applications are usually the standards with the highest scores. This suggest a need
for in increased focus with professional development to improve the quality of instruction in
reading comprehension and a need to provide more time, at school, for students to engage in real
reading to practice these skills.
In Mathematics, it is clear that, at all grade levels, students are showing lower levels of mastery
in the areas of Geometry, Measurement, Data Analysis & Probability, and Problem Solving.
These are all topics that are generally addressed closer to the end of each school year and with
less emphasis, in traditional mathematics curricula. This suggests that there is a need to focus on
these skills regularly, throughout the school year, and to revisit/review to maintain these skills
when they are not the area of focus in the classroom instruction.
D. IREAD-3 Performance (N/A)
E. Formative Assessment Data
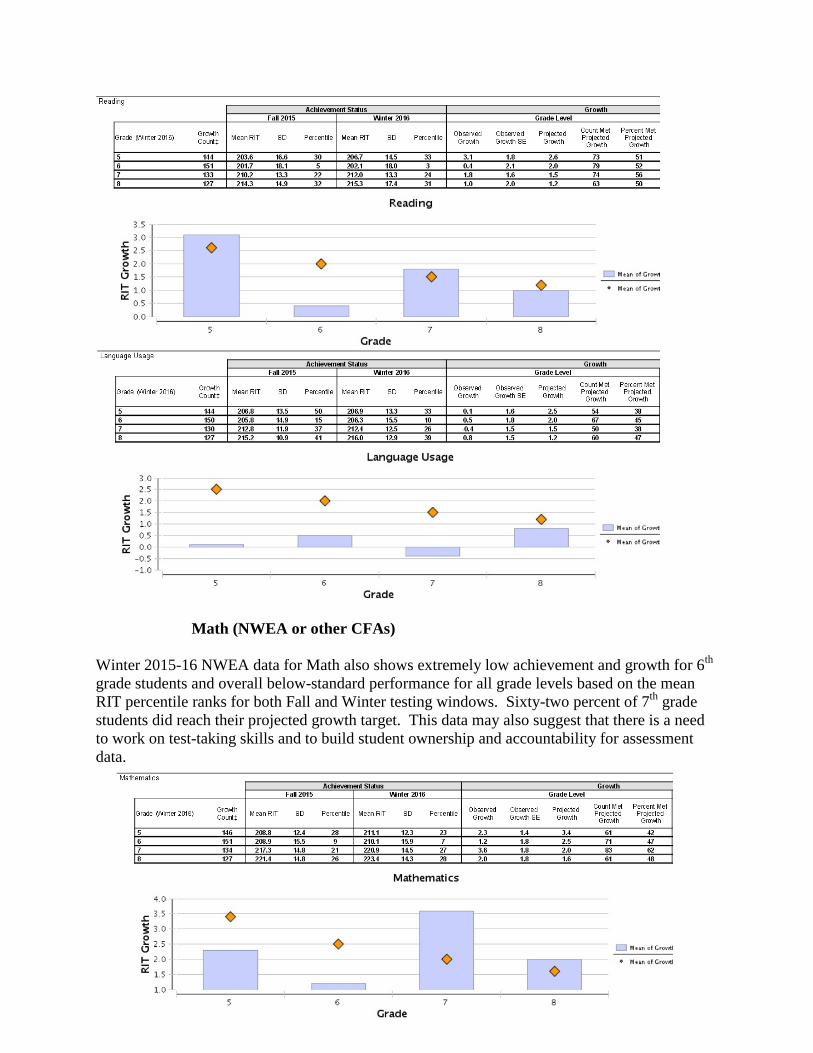
Reading (NWEA or other CFAs)
Winter 2015-16 NWEA data for Reading show that the mean percentile rank increased for grades 5 and 7
and dropped for grades 6 and 8. At the 6th grade level, mean RIT scores fell at the 5
th percentile in the fall
and dropped to the 3rd
percentile in the winter. Projected growth was attained by 50-56% of students .
In Language Usage, all grade levels dropped from the Fall to Winter testing and 38-47% of students met
their projected growth targets. At the 6th grade level, mean RIT scores fell at the 15
th percentile in the fall
and dropped to the 10th percentile in the winter.
16
Math (NWEA or other CFAs)
Winter 2015-16 NWEA data for Math also shows extremely low achievement and growth for 6th
grade students and overall below-standard performance for all grade levels based on the mean
RIT percentile ranks for both Fall and Winter testing windows. Sixty-two percent of 7th
grade
students did reach their projected growth target. This data may also suggest that there is a need
to work on test-taking skills and to build student ownership and accountability for assessment
data.
17
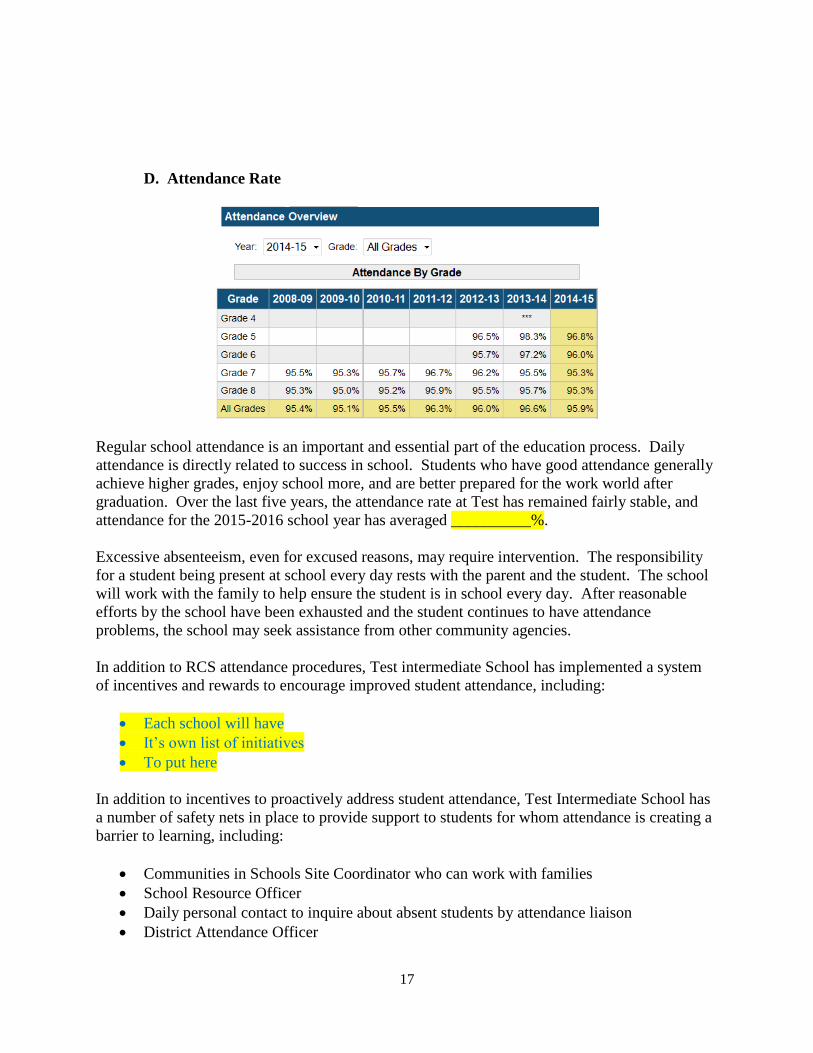
D. Attendance Rate
Regular school attendance is an important and essential part of the education process. Daily
attendance is directly related to success in school. Students who have good attendance generally
achieve higher grades, enjoy school more, and are better prepared for the work world after
graduation. Over the last five years, the attendance rate at Test has remained fairly stable, and
attendance for the 2015-2016 school year has averaged __________%.
Excessive absenteeism, even for excused reasons, may require intervention. The responsibility
for a student being present at school every day rests with the parent and the student. The school
will work with the family to help ensure the student is in school every day. After reasonable
efforts by the school have been exhausted and the student continues to have attendance
problems, the school may seek assistance from other community agencies.
In addition to RCS attendance procedures, Test intermediate School has implemented a system
of incentives and rewards to encourage improved student attendance, including:
Each school will have
It’s own list of initiatives
To put here
In addition to incentives to proactively address student attendance, Test Intermediate School has
a number of safety nets in place to provide support to students for whom attendance is creating a
barrier to learning, including:
Communities in Schools Site Coordinator who can work with families
School Resource Officer
Daily personal contact to inquire about absent students by attendance liaison
District Attendance Officer

18
E. Other Performance Indicators
Test Intermediate Response to Intervention (RTI)
Enrollment ELA Tier 2 ELA Tier 3 Math Tier 2 Math Tier 3
5th Grade 157 16 10% 13 8% 16 10% 9 6%
6th Grade 151 18 12% 14 9% 13 9% 14 9%
7th Grade 133 15 11% 10 8% 7 5% 13 10%
8th Grade 130 18 14% 8 6% 5 4% 7 5%
Total 571 67 12% 45 8% 41 7% 43 8%
F. Educational Programming and the Learning Environment
1. Safe and Disciplined Learning Environment
Richmond Community Schools has implemented Positive Behavior Intervention and Supports
(PBIS) district-wide. PBIS is a proactive approach based on a three-tiered model of prevention
and intervention aimed at creating safe and effective schools. Emphasis is placed on teaching
and reinforcing important social skills and data-based problem-solving to address existing
behavioral concerns.
19
Test Intermediate School also follows the Richmond Community Schools Uniform Code of
Student Conduct. A copy of the Code is distributed and portions are reviewed with all students
at the beginning of the year. In addition, the RCS Code of Conduct is reviewed with students
who have been referred to the office. Copies of the RCS Code of Conduct are available in the
front office of the School and online. It is also expected that teachers create and review

20
classroom procedures on a regular basis.
Test Intermediate School has a Safety Committee whose role is to perform an annual safety audit
and make recommendations for improvement. The safety committee also conducts a yearly
review of the Test Intermediate School emergency Plan. The monthly meetings are comprised of
an administrator, teachers, a custodian, the School Resource Officer and paraprofessionals.
2. Implementation of Schoolwide Reform Strategies
The process for continuous school improvement is guided by the 8-Step Model. Building-based
8-Step teams are have been learning this process during the 2015-16 school year and will work
toward full implementation during the 2016-17 school year. The 8-Step Process includes the
following:
1. Buy-In Building staff consensus for change.
2. Data Disaggregation Using student test scores to identify instructional groups
and identify weak and strong objective areas.
3. Instructional
Calendar
A timeline that encompasses all academic standards and
is a pacing guide for instruction based on the neds of the
student group and the weight of the objective.
4. Instructional Focus Using the timeline, deliver instructional lessons that
target specific needs of students.
5. Assessment After the instructional focus has been taught, administer
an assessment to identify mastery and nonmastery
students. Teachers meet to group students for reteaching
or enrichment.
6. Tutorials/Enrichment Provide tutorial time to reteach nonmastered target
areas. Provide enrichment opportunities for mastery
students.
7. Maintenance Provide ongoing maintenance and reteaching.
8. Monitor Continuously monitor and evaluate the process and
progress of students.
The school improvement plan, through a prescribed process, is reviewed and updated annually
by the school improvement team. Administrative and teacher data review at regular intervals
ensures appropriate response to the data to enhance student academic achievement. There are
ongoing data conversations at the district, school, and grade levels, and there is an expectation
that those discussions will guide instructional decisions. In addition to providing valuable
information at the student level, the data also provide information for evaluation of instructional
strategies across the school and district. Richmond Community Schools adheres to the
responsibility to implement strategies which are scientifically research-based, and thus likely to
deliver results; the data provide information at the district and school level to determine whether
those results are being realized with our students.
21
3. Educational Programs
At the heart of a school are its educational programs. Due to the high mobility rate of students in
the RCS district, many of the educational programs are consistent across all schools. First and
foremost, educational programming in Richmond Community Schools is designed to ensure that
all students have the opportunity to meet proficient and advanced levels of academic
achievement. Given our diverse population of learners, it is acknowledged that some students
may require more instructional time or effective, timely assistance in order to meet these
proficient and advanced levels of academic achievement. In order to ensure a reliable process
for providing every child the needed assistance, all schools in the Richmond Community Schools
district have implemented Response to Instruction. Response to Instruction is a process of
implementing high-quality, scientifically validated instructional practices based on learner needs,
monitoring student progress, and adjusting instruction based on student’s responses. At Tier I,
all students are instructed in the core instructional curriculum, with the teacher responding to
individual student needs within the core instruction. Tier 2 is comprised of the core instructional
program and the addition of supplemental instructional resources. Tier 3 continues instruction in
the core instructional program with the addition of intensive resources. A complete explanation
of the RTI procedures and forms is available in the school office. Teams meet regularly to
discuss the progress of individual students and make instructional decisions in response to
progress monitoring data at decision point meetings.
In addition to providing supports for struggling learners through the RTI process, Richmond
Community Schools provides a continuum of special education services for those students found
eligible through the identification process outlined in Article 7. At Test Intermediate School, 48
English Language Learners receive support through the use of assistive technology – Rosetta
Stone, in/after school tutoring, and access to an interpreter for parent communication.
Student identified as demonstrating strong academic potential and/or achievement are eligible for
differentiated instructional programs.
4. High Ability Programming
Richmond Community Schools provides a range of services to meet the needs of our high ability
students in language and math. Using a multi-faceted identification process including measures
of potential and achievement, combined with observational tools of student behaviors, we
identify students who are ready for instruction with increased complexity and depth.
During the 2014-2015 school year we expanded upon the additional learning opportunities for
our high ability students, incorporating 6th
grade students into this plan as well. Students that
had formerly participated in the Learning Blade program worked in Khan Academy and
participated in writing computer code. These students also have access to math classes at a
higher grade level. High Ability students in 7-8th
grade are able to participate in Honors English.
In the 2013-14 school year, students identified as high ability participated in Learning Blade
during the 6th
period time designated for differentiated activities as well as have access to math
classes at a higher grade. High Ability students in 7-8th
grade are able to participate in Honors
English.
22
The LOGOS LAB, a program for identified high ability students, is part of the Test community
housed at the Hibberd building. One hundred 5-8th graders participate in the non-graded, project
based program. The students spend the majority of their day with 6 G/T teachers where they are
in small learning groups for project groups (two researched projects per year), humanities,
French culture and language, and science. Eighth grade French students may earn high school
credit upon successful completion of the course and the end of course assessment. Algebra
instruction is also part of the curriculum. During the 2nd
period of the day the LOGOS students
may participate in band, orchestra, and PE at Test Intermediate School.
4. Transitions
a. Preschool to Elementary School Transition – N/A
b. Elementary to Intermediate School Transition
Fourth grade students visit the Intermediate school to see classes in session and begin to
learn their way around the building. Students are matched with 5th
grade “Student
Ambassadors”. The principals, counselor, and other school personnel speak to the
students about intermediate school expectations and answer any questions students might
have. Students identified as “high-risk” attend an additional tour opportunity and meet
and greet of office staff and other school personnel to help familiarize those students with
the staff at Test.
Parent/family orientation opportunities are offered at several different times to provide
families with a chance to tour the intermediate school building, and hear an overview of
intermediate school expectations and procedures from the principal and school
leadership. This is followed by a question and answer period.
Fifth grade students attend ½ day before 6-8 grade students begin school in August as an
orientation.
Families are encouraged to seek additional support through meetings with the principal
and school counselor.
c. Intermediate to High School Transition
Parents are invited to participate in an orientation meeting in January of their student’s 8th
grade year.
Eighth grade students meet individually with the intermediate school counselor to
complete high school scheduling
Parents may meet with the counselor to complete high school scheduling
Special Education Teacher from RHS attends case conferences to coordinate schedules
and services for incoming 8th
grade special education students
Students visit the RHS Career Center
Students visit RHS in small groups during their 8th
grade year
An activity fair is held to introduce students to RHS extracurricular opportunities
23
Support personnel (CIS Coordinator/Centerstone/Special Education Teachers) meet with
RHS representatives to ensure continuation of services
Kick-off mentors from RHS introduced to incoming freshman in the spring of their 8th
grade year
First day of school activities at RHS prior to 10-12 grade students begin school in August
as an orientation
24
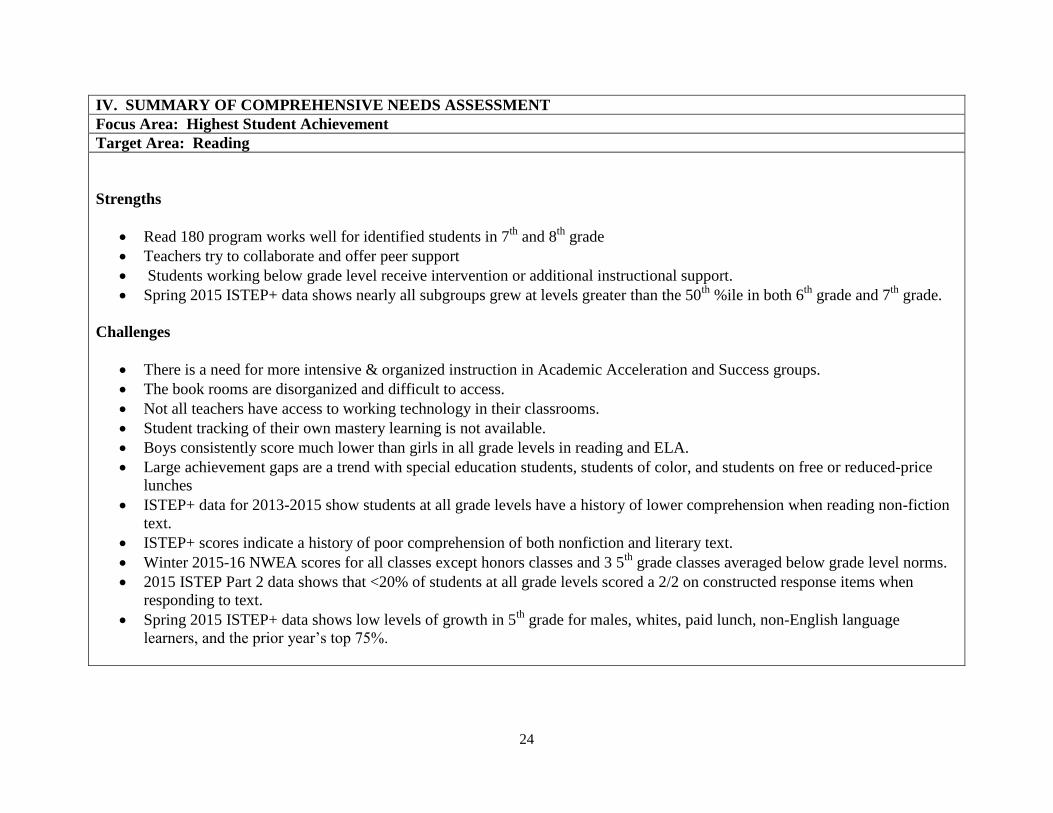
IV. SUMMARY OF COMPREHENSIVE NEEDS ASSESSMENT
Focus Area: Highest Student Achievement
Target Area: Reading
Strengths
Read 180 program works well for identified students in 7th
and 8th
grade
Teachers try to collaborate and offer peer support
Students working below grade level receive intervention or additional instructional support.
Spring 2015 ISTEP+ data shows nearly all subgroups grew at levels greater than the 50th
%ile in both 6th
grade and 7th
grade.
Challenges
There is a need for more intensive & organized instruction in Academic Acceleration and Success groups.
The book rooms are disorganized and difficult to access.
Not all teachers have access to working technology in their classrooms.
Student tracking of their own mastery learning is not available.
Boys consistently score much lower than girls in all grade levels in reading and ELA.
Large achievement gaps are a trend with special education students, students of color, and students on free or reduced-price
lunches
ISTEP+ data for 2013-2015 show students at all grade levels have a history of lower comprehension when reading non-fiction
text.
ISTEP+ scores indicate a history of poor comprehension of both nonfiction and literary text.
Winter 2015-16 NWEA scores for all classes except honors classes and 3 5th
grade classes averaged below grade level norms.
2015 ISTEP Part 2 data shows that <20% of students at all grade levels scored a 2/2 on constructed response items when
responding to text.
Spring 2015 ISTEP+ data shows low levels of growth in 5th
grade for males, whites, paid lunch, non-English language
learners, and the prior year’s top 75%.

25
IV. SUMMARY OF COMPREHENSIVE NEEDS ASSESSMENT
Focus Area: Highest Student Achievement
Target Area: English/Language Arts
Strengths
Use of the Yes MA’AM model in writing to cite evidence from texts is being used in all classes and grade levels.
Teachers have a good working knowledge of the new Indiana standards.
ISTEP+ indicates that students are improving with the writing process and writing applications.
2015 ISTEP+ data shows that students did well with writing conventions on Part 1 writing tasks (62%-70% scored 4/4) at all
grade levels.
Challenges
There is no written curriculum to follow or common assessments to use for data for writing. Teachers need a common format
for assessing writing.
It is difficult for teachers to communicate with each other by grade level and within departments.
There is a need for more targeted PD to improve the use of best practices.
ELA teachers have 1 class period to teach all reading, writing, and language standards.
Winter 2015-16 NWEA data shows no classes exhibited high growth in writing, grammar, or mechanics.
Teachers do not have a common format for assessing writing and using assessment data to drive instruction.
2015 ISTEP Part 2 data shows that <20% of students at all grade levels scored a 2/2 on constructed response items when
responding to text.

26
IV. SUMMARY OF COMPREHENSIVE NEEDS ASSESSMENT
Focus Area: Highest Student Achievement
Target Area: Mathematics
Strengths
Problem solving has improved
Teachers are using common math steps and vocabulary.
Students are exhibiting stronger problem-solving skills.
Spring 2015 ISTEP+ data show high growth %iles for 7th
and 8th
grade classes, most notably with special education students
and the prior year’s bottom 25%.
Challenges
Students exhibit poor test-taking skills.
Motivation is a concern.
ESL students do not have adequate resources available.
There is a lack of home support.
Winter 2015-16 NWEA data shows that, schoolwide, scores are lower in Algebraic Thinking and Measurement.
Teachers do not have common instructional materials or a common curriculum map to follow.
Spring 2015 ISTEP+ results show that large achievement gaps are a trend with special education students, students of color,
and students on free or reduced-price lunches.
Spring 2015 ISTEP+ results show low growth levels in all subgroups except one in both 5th
grade and 6th
grade.
27
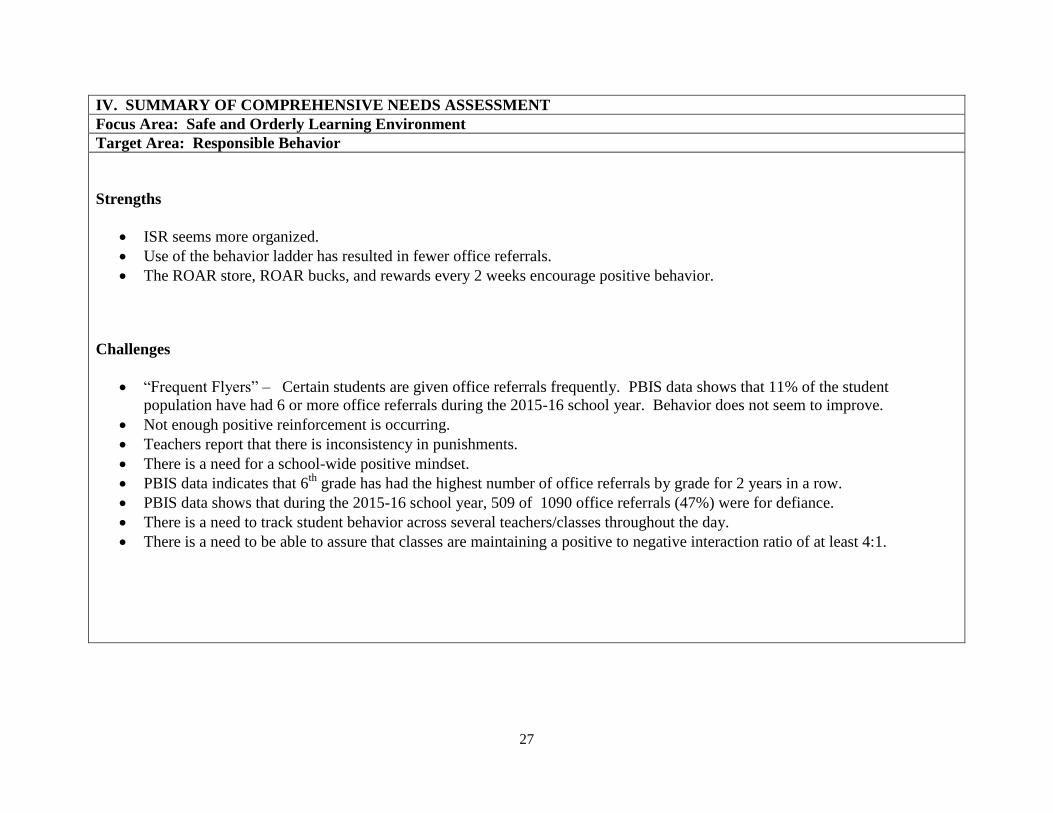
IV. SUMMARY OF COMPREHENSIVE NEEDS ASSESSMENT
Focus Area: Safe and Orderly Learning Environment
Target Area: Responsible Behavior
Strengths
ISR seems more organized.
Use of the behavior ladder has resulted in fewer office referrals.
The ROAR store, ROAR bucks, and rewards every 2 weeks encourage positive behavior.
Challenges
“Frequent Flyers” – Certain students are given office referrals frequently. PBIS data shows that 11% of the student
population have had 6 or more office referrals during the 2015-16 school year. Behavior does not seem to improve.
Not enough positive reinforcement is occurring.
Teachers report that there is inconsistency in punishments.
There is a need for a school-wide positive mindset.
PBIS data indicates that 6th
grade has had the highest number of office referrals by grade for 2 years in a row.
PBIS data shows that during the 2015-16 school year, 509 of 1090 office referrals (47%) were for defiance.
There is a need to track student behavior across several teachers/classes throughout the day.
There is a need to be able to assure that classes are maintaining a positive to negative interaction ratio of at least 4:1.
28
F. Parental Involvement
1. Strategies to increase parental involvement
Parents are encouraged to participate in their child’s education in the following ways:
Attending Back to School night to meet teachers
Attendance and participation in the annual Test Expo held in April accompanied by a literacy
component that includes a free book give-away for all ages.
Attending PTO meetings and volunteering at various school activities.
Attending Parent/Teacher conferences
Attend the parent leadership group with the superintendent
Becoming part of the School Improvement Team
Mentoring
Attendance at the Test Expo has been very strong. Families are able to see examples of the type of work and
projects students have been doing throughout the year.
Communities in Schools, the PowerSchool Parent Portal, Parent Teacher Organization, Study Buddies, West
End Bank, the Test Intermediate Facebook page, and the RCS Test intermediate webpage are all areas that have
a large impact on parent involvement, participation, and inclusion. The Communities in Schools Site
Coordinator works with families daily to provide services and resources in times of hardship. Currently she is
serving students and their families at Test with Level 2 services (Comprehensive Intervention) in a variety of
ways, from finding dress code appropriate clothing, to providing information for the food bank or utility
reconnections, after school tutoring and programming, attendance monitoring, transportation to and from
events, including Parent Teacher Conferences. These are just some of the ways she is providing services to our
students and families in need.
The PTO is a large involved group of parents who support Test Intermediate in a multitude of ways. Many are
regular volunteers in the building during the school day, but are visible at most all events whether through
participation or leadership. They work closely with the principal and staff to create a climate of connectedness
within the Test community.
Regular communication with parents is shared through Parent Teacher Conferences, mid-term reports, Report
Cards, case conferences, phone, e-mail and One Call messages.
2. Provision of Individual Academic Results to Parents
Parents at Test Intermediate School receive information about their student’s individual academic results in a
variety of ways. Through the PowerSchool Parent Portal, parents may view their student’s classroom
performance on a daily basis, and may elect to receive email updates on a regular schedule.
Report cards are mailed home at the end of every trimester, and parents may meet with teachers by appointment
throughout the year. Parent-teacher conferences are held two times per year.
A copy of the results of standardized assessments are provided to each student’s family by mail.
3. Strategies to involve parents in planning, review, and improvement of schoolwide program
29
Each year, as the School Improvement Team is formed, parents are invited to participate in the planning
process, with invitations being sent via newsletter, website, and personal contact.
G. Technology as a Learning Tool
Test students have the opportunity to work with a variety of technology including but not limited to computers,
internet, PowerPoint presentations, virtual labs, digital cameras, scanners, document cameras, video/filming, as
well as a variety of software. Teachers use technology to enhance the curriculum in a variety of ways such as:
• Research
• As a teaching tool to improve technology skills
• Use of appropriate software in reading, math, science, and social studies
• Providing extended learning opportunities to expand a student’s interests
• As a means of personal staff development in order to enhance integration into the classroom
• ISTEP+, Schoolnet, SRI and NWEA Assessments
• Mobi/clickers for math and science classes to increase student engagement and collect formative
assessment data
• Smart Board Technology in all classrooms grade 5-6 and Read 180 classrooms
• FACS Lab
• Rosetta Stone is employed by our ENL students
• Technology elective classes 5-8 gr.
• Integrated TV/Computer for Decision Point Meetings and Case Conferences
• Two laptop carts
• Tech Ed Computer Lab
• Two iPad Carts
• Two smaller iPad Carts
• Teachers equipped iPADS
Our building is equipped with distance learning capabilities, video networking, and video retrieval. We also
have three 30 station computer labs. In addition, we currently have ceiling mounted LCD/AVIO projectors, 3
free standing LCD projectors, and 2 scanners. All classrooms are equipped with overhead LCD projectors or
SmartBoards. The library has automated check-out programs for all students. Our trained e-learning specialist
conducts professional development opportunities throughout the year as needed, and is available at Test
Intermediate School one day a week to aid teachers in implementing technology in the curriculum.
H. Impact of Professional Development
Professional development is an ongoing process. Richmond Community Schools provides secondary schools
45 minutes per week for professional development of staff by dismissing students 35 minutes early every
Tuesday to accomplish the goals of continuous improvement of student achievement. Test teachers have
focused their staff development in the areas of PBIS, teacher evaluations and its impact on instruction, data-
driven instruction, and differentiation. Test Intermediate School currently has an Instructional Coach who
facilitates half-day professional development for English and Math teachers. In addition, the Instructional
Coach is also instrumental in providing staff development during Tuesday professional development. The
Instructional Coach also helps individual teachers disaggregate and plan for use of classroom data.
The Test Intermediate School Professional Development Plan complies with the following core principles:
1. Is school based and collaboratively designed, and encourages participants to work
collaboratively.
2. Has a primary focus on state and local academic standards

30
3. Enables teachers to improve expertise in subject knowledge and teaching strategies, uses of
technologies, and other essential elements in teaching to high standards.
4. Furthers the alignment of standards, curriculum, and assessment.
5. Includes measurement activities to ensure the transfer of new knowledge and skills to classroom
instruction.
I. Cultural Competency
Each school in the RCS district has an instructional coach who participates in ongoing professional
development, including training in cultural competency. District and school leadership are charged with
viewing all school decisions through the eyes of cultural competency to ensure that all perspectives are
considered in the decision-making process.
V. STUDENT ACHIEVEMENT OBJECTIVES
A. Attendance Rate
It is the goal of Richmond Community Schools that each student maintains an attendance rate of
95% or better. Attendance has been included as a primary goal at Test Intermediate School to
ensure that the average attendance rate continually improves with a minimum target of 95%.
Current attendance rate is 96.06%.
B. ISTEP+ Performance
The goal of Richmond Community Schools is that by 2020, 90% of all students show proficiency
on state and local standards. Currently, 58.5% of Test Intermediate School students received a
score of Pass or Pass+ on the ISTEP+ E/LA Assessment, and 41.2% of Test Intermediate School
students received a score of Pass or Pass+ on the ISTEP+ Mathematics Assessment. Our goal for
the 2016-2017 school year is that 83% of our students will receive a score of Pass or Pass+ on
the ISTEP+ ELA and 80% of our students will receive a score of Pass or Pass+ on the ISTEP+
Mathematics assessments.
D. Areas Where Improvement is Needed Immediately
Based on the comprehensive needs assessment, all of the areas identified as areas of weakness
are included in this plan for immediate improvement.
Language Arts
Vocabulary
Reading comprehension (literature and nonfiction)
Growth – all subgroups, particularly in grades 5 and 8
Special Education (AA and Success Groups)
Achievement for students living in poverty and children of color
Achievement for boys
Opportunities for grade level and department collaboration and communication
Common format for writing assessment across the curriculum
Written responses when responding to text

31
Math
Problem Solving
Geometry and Measurement
Data Analysis and Probability
Growth – all subgroups, particularly in grades 5 and 6
Special Education and Intervention (AA and Success Groups)
Achievement for students living in poverty and children of color
Test-taking skills and building student ownership and accountability
Opportunities for grade level and department collaboration and communication
Behavior
Reduction in office referrals
Increased, consistent, positive reinforcement
Consistent, school-wide implementation of expectations, incentives, and consequences
Student engagement and motivation

32
School: Test Intermediate School
Focus Area: Highest Student Achievement
Target Area: Reading
V. Student Achievement Objectives
Goal: 90% of students will meet Indiana Academic Standards in Language Arts as measured by ISTEP+ or ECA assessments.
VI. Benchmarks for Progress: Current Performance: Spring 2014, 80.4% of Test Intermediate School students received a score of Pass or Pass+ on the ISTEP+ E/LA Assessment
Year 1: By Spring 2015, 83% of students will receive a score of Pass or Pass+ on the ISTEP+ Language Arts Assessment
Year 2: By Spring 2016, 86% of students will receive a score of Pass or Pass+ on the ISTEP+ Language Arts Assessment
Year 3: By Spring of 2017, 90% of students will receive a score of Pass or pass+ on the End of Year Language Arts Assessment
VII. Proposed Interventions VIII. Professional Development
Begin
Date
Action Steps
Responsible
Party
Begin
Date
Professional Development Responsible
Party
Evidence of
Implementation
Evidence
of Impact
Fall
2016
Implementation
of new RCS
Curriculum Maps
and CFAs
Teachers
Instructional
Coach
Administrators
August,
2016
Teachers will be on how to use the
new maps and administer CFA
checks
Instructional
Coach
Teachers
Teachers will follow
the maps and give
monthly CFAs to
measure mastery of
core standards
Student
academic
progress as
evidence by
data
August,
2016
Teachers will be provided support
in the delivery of core and
intervention programs and
supplementing based on the
curriculum maps.
Instructional
Coach
Teachers
Daily classroom
practice
Student
academic
progress as
evidenced
by data
September,
2016
Teachers will be guided through the
process of analyzing CFA data to
create Success Groups
Instructional
Coach
Administrators
Use of CFA data to
reflect on teaching and
to form new success
groups
Student
academic
progress as
evidenced
by data
Fall
2016
Focus on
diagnostic
assessment and
and interventions
designed to meet
the needs of
students reading
well below grade
level
All Staff August,
2016
Teachers and interventionists will
be training in how to use diagnostic
interventions to identify needed
interventions.
Interventionists
Teachers
Instructional
Coach
Daily intervention
program and Success
groups in addition to
regular ELA classes
Student
academic
progress as
evidenced
by data

33
Begin
Date
Action Steps
Responsible
Party
Begin
Date
Professional Development Responsible
Party
Evidence of
Implementation
Evidence
of Impact
November,
2016
Teachers will be provided
professional development on how
boys and girls learn differently, and
specifically how to support boys in
ELA
Instructional
Coach
Administrators
Daily classroom
practice
Student
academic
progress as
evidenced
by data
Fall,
2016
Provide time for
students to
practice reading
and writing every
day and in every
class.
August,
2016
Teachers will be provided
professional development on
guided reading, independent
reading, and writing in response to
reading.
All Staff Daily classroom
practice
Student
academic
progress as
evidenced
by data
Fall,
2016
Implement
maintenance of
skills with daily
bellwork.
Teachers August,
2016
Teachers will be given resources to
use or support in developing daily
bellwork activities to practices
previously taught skills.
Teachers
Instructional
Coach
Daily classroom
practice
Student
academic
progress as
evidenced
by data
Fall,
2016
Organize
resources so that
teachers have
access to leveled
text.
Instructional
Coach
Teachers
October,
2016
The book rooms will be
reorganized and catalogued for
efficient teacher use.
Instructional
Coach
Teachers
Reorganized book
rooms
Student
academic
progress as
evidenced
by data Staff members will be trained in
proper use of the book rooms. Use of book rooms

34
School: Test Intermediate School
Focus Area: Highest Student Achievement
Target Area: English/Language Arts
V. Student Achievement Objectives
Goal: 90% of Test students will meet Indiana Academic Standards in Language Arts as measured by ISTEP+ assessments.
VI. Benchmarks for Progress: Current Performance: Spring 2014, 80.4% of Test Intermediate School students received a score of Pass or Pass+ on the ISTEP+ E/LA Assessment
Year 1: By Spring 2015, 83% of students will receive a score of Pass or Pass+ on the ISTEP+ Language Arts Assessment
Year 2: By Spring 2016, 86% of students will receive a score of Pass or Pass+ on the ISTEP+ Language Arts Assessment
Year 3: By Spring of 2017, 90% of students will receive a score of Pass or pass+ on the End of Year Language Arts Assessment
VII. Proposed Interventions VIII. Professional Development
Begin
Date
Action Steps
Responsible
Party
Begin
Date Professional Development
Responsible
Party
Evidence of
Implementation
Evidence of
Impact
Fall,
2016
Implementation
of new RCS
Curriculum Maps
and CFAs
Teachers
Instructional
Coach
Administrators
August,
2016
Teachers will be on how to use the
new maps and administer CFA
checks
Instructional
Coach
Teachers
Teachers will follow
the maps and give
monthly CFAs to
measure mastery of
core standards
Student academic
progress as
evidenced by
data
August,
2016
Teachers will be provided support
in the delivery of core and
intervention programs and
supplementing based on the
curriculum maps.
Instructional
Coach
Teachers
Daily classroom
practice
Student academic
progress as
evidenced by
data
September,
2016
Teachers will be guided through the
process of analyzing CFA data
Instructional
Coach
Administrator
s
Use of CFA data to
reflect on teaching
& drive instruction
Student academic
progress as
evidenced by
data
Fall,
2016
Target increased
writing
opportunities
across the
curriculum,
including writing
in response to
reading.
Teachers will be provided
professional development on
writing across the curriculum and
writing in response to reading.
(Writing in Science - Fulwiler,
Everyday Editing – Anderson,
Nonfiction Notebooks – Buckner,
Spelling in Use – Laminack & Ray,
Writing About Reading – Angelillo,
Write Like This: Teaching Real-
World Writing - Gallagher)
All Staff Use of assessment
data in planning,
instruction, and
interventions
Student academic
progress as
evidenced by
data.

35
Begin
Date
Action Steps
Responsible
Party
Begin
Date Professional Development
Responsible
Party
Evidence of
Implementation
Evidence of
Impact
Fall,
2016
Begin to develop
common tools for
writing
assessment across
the curriculum.
Teachers
Instructional
Coach
September,
2016
Grade level teams will evaluate
writing assessment models and
select a common tool to use school-
wide.
Teachers
Instructional
Coach
All classes’ writing
is assessed using a
common tool.
Student academic
progress as
evidenced by
data.
Winter,
2016
Develop
strategies for
raising
achievement of
students living in
poverty and
students of color
Teachers
Instructional
Coach
Administrators
November,
2016
Teachers will be given professional
development in cultural
competency and the unique needs
of students living in poverty.
Increased
differentiation and
use of activities
which target the
unique needs of
students in poverty
or of color.
Student academic
progress as
evidenced by
data.
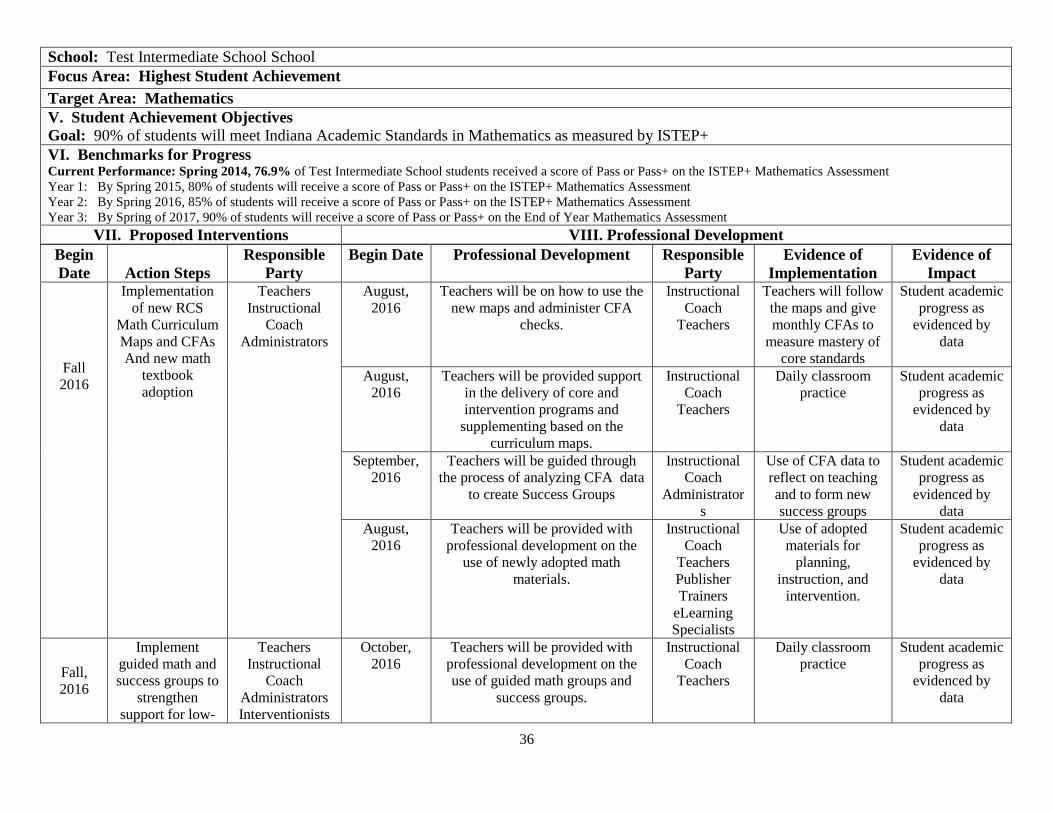
36
School: Test Intermediate School School
Focus Area: Highest Student Achievement
Target Area: Mathematics
V. Student Achievement Objectives
Goal: 90% of students will meet Indiana Academic Standards in Mathematics as measured by ISTEP+
VI. Benchmarks for Progress Current Performance: Spring 2014, 76.9% of Test Intermediate School students received a score of Pass or Pass+ on the ISTEP+ Mathematics Assessment
Year 1: By Spring 2015, 80% of students will receive a score of Pass or Pass+ on the ISTEP+ Mathematics Assessment
Year 2: By Spring 2016, 85% of students will receive a score of Pass or Pass+ on the ISTEP+ Mathematics Assessment
Year 3: By Spring of 2017, 90% of students will receive a score of Pass or Pass+ on the End of Year Mathematics Assessment
VII. Proposed Interventions VIII. Professional Development
Begin
Date
Action Steps
Responsible
Party
Begin Date Professional Development Responsible
Party
Evidence of
Implementation
Evidence of
Impact
Fall
2016
Implementation
of new RCS
Math Curriculum
Maps and CFAs
And new math
textbook
adoption
Teachers
Instructional
Coach
Administrators
August,
2016
Teachers will be on how to use the
new maps and administer CFA
checks.
Instructional
Coach
Teachers
Teachers will follow
the maps and give
monthly CFAs to
measure mastery of
core standards
Student academic
progress as
evidenced by
data
August,
2016
Teachers will be provided support
in the delivery of core and
intervention programs and
supplementing based on the
curriculum maps.
Instructional
Coach
Teachers
Daily classroom
practice
Student academic
progress as
evidenced by
data
September,
2016
Teachers will be guided through
the process of analyzing CFA data
to create Success Groups
Instructional
Coach
Administrator
s
Use of CFA data to
reflect on teaching
and to form new
success groups
Student academic
progress as
evidenced by
data
August,
2016
Teachers will be provided with
professional development on the
use of newly adopted math
materials.
Instructional
Coach
Teachers
Publisher
Trainers
eLearning
Specialists
Use of adopted
materials for
planning,
instruction, and
intervention.
Student academic
progress as
evidenced by
data
Fall,
2016
Implement
guided math and
success groups to
strengthen
support for low-
Teachers
Instructional
Coach
Administrators
Interventionists
October,
2016
Teachers will be provided with
professional development on the
use of guided math groups and
success groups.
Instructional
Coach
Teachers
Daily classroom
practice
Student academic
progress as
evidenced by
data

37
Begin
Date
Action Steps
Responsible
Party
Begin Date Professional Development Responsible
Party
Evidence of
Implementation
Evidence of
Impact performing
students and
subgroups in
skills, fluency,
and problem
solving.
Fall
2016
Focus on
diagnostic
assessment and
and interventions
designed to meet
the needs of
students reading
well below grade
level
All Staff August,
2016
Teachers and interventionists will
be training in how to use
diagnostic interventions to identify
needed interventions.
Interventionist
s
Teachers
Daily intervention
program and
Success groups in
addition to regular
Math classes
Student academic
progress as
evidenced by
data
Fall,
2016
Implement
maintenance of
skills with daily
bellwork.
Teachers August,
2016
Teachers will be given resources to
use or support in developing daily
bellwork activities to practices
previously taught skills.
Teachers
Instructional
Coach
Daily classroom
practice
Student academic
progress as
evidenced by
data
Teachers will work together to
ensure that maintenance of skills,
particularly is the areas of
geometry, measurement, data
analysis, and probability, occur on
a regular basis.
Teachers Daily classroom
practice
Student academic
progress as
evidenced by
data

38
School: Test Intermediate School
Focus Area: Safe and Orderly Learning Environment
Target Area: Responsible Behavior
V. Student Achievement Objectives
Goal: Ensure that 98% of * School students demonstrate responsible behavior on a daily basis.
VI. Benchmarks for Progress:
Year 1: By Spring 2014, **% of students will demonstrate responsible behavior on a daily basis.
Year 2: By Spring 2015, **% of students will demonstrate responsible behavior on a daily basis.
Year 3: By Spring 2016, **% of students will demonstrate responsible behavior on a daily basis.
VII. Proposed Interventions VIII. Professional Development
Begin
Date
Action Steps
Responsible
Party
Begin Date Professional Development Responsible
Party
Evidence of
Implementation
Evidence of
Impact
Fall,
2016
Implement the
CHAMPS model
for teaching and
reinforcing
expectations and
procedures
building-wide.
PBIS Team
Administrators
Instructional
Coach
August,
2016
Teachers will be provided with
professional development on the
CHAMPS model.
PBIS Team
Behavior
Specialist
Administrators
Instructional
Coach
Use of the
CHAMPS model
and expectations
posted school-wide.
A decrease in the
number of office
referrals.
Fall,
2016
Continue to
support the use of
the Second Steps
curriculum in
grades 5/6
Instructional
Coach
Teachers
September,
2016
Provide professional development
as needed to maintain program
integrity.
Teachers
Behavior
Specialist
Instructional
Coach
Classroom practice A decrease in
bullying
incidence reports.
Fall,
2016
Implement
LiveSchool as a
tool for
monitoring
behavior across
class and to
provide
consistent,
positive
reinforcement.
All Staff August,
2016
Provide professional development
on how to use the program
effectively.
Instructional
Coach
Teacher Team
Classroom use of
LiveSchool.
Students earn
paychecks and
can spend
earnings on
rewards.
Parents receive
information via
apps & weekly
reports.

39
Begin
Date
Action Steps
Responsible
Party
Begin Date Professional Development Responsible
Party
Evidence of
Implementation
Evidence of
Impact
Fall,
2016
Focus on
improving
classroom
engagement and
student
motivation.
Teachers
Instructional
Coach
Administrators
September,
2016
Teachers will be given
professional development in the
areas of classroom engagement
and student motivation.
Teachers
Instructional
Coach
Administrators
Classroom practice Improve
engagement in
classrooms and
decreased
discipline
incidents.

40
IX. ACADEMIC HONORS DIPLOMA AND CORE 40 (N/A)
X. SUBMISSION OF SCHOOL IMPROVEMENT PLAN TO GOVERNING BODY
The objective of the School Improvement Team is to lead the development of a school
improvement plan that addresses student achievement needs, to monitor the implementation of
the plan, and to revise the plan as needed. Members of the School Improvement Team
collaborate throughout the year to evaluate and amend the School Improvement Plan as
appropriate. The plan is submitted to the RCS Board of School Trustees in the spring, and is
available for viewing on Test Intermediate School webpage once approved.
A. Statutes and Rules the School Wishes to have Suspended from Operation
At this time, Test Intermediate School is not applying for any waivers.
B. Coordination and integration of federal, state, and local funds
There is district and building coordination of funding for programs and services to support
student learning. While funds are not consolidated, each of the individual funding sources is
used to create a system of educational programs and services designed to improve student
academic achievement. Title 1 funds are used to provide programs to supplement the core
curriculum, including an Instructional Coach. Title II funds provide support for building and
district level professional development. Title III funds support staff and supplies to meet the
needs of our English-language learners. Special education funds provide staff and supplies to
meet the needs of students identified as eligible for special education services. Test intermediate
School coordinates program efforts, but does not choose to consolidate funds.
C. List of programs consolidated under school-wide plan:
Professional Development funded through Title II Part A and Title I resources
Technology resources purchased through Title II Part D
Intervention programs funded from the General Fund and Title I
Response to Intervention Process funded through IDEA
Special Education programming funded through Individuals with Disabilities Educational
Act
Instructional Coach funded through Title I
Communities in Schools funded through the Safe Schools/Healthy Students Grant, General
Fund, and Title I
Behavior Coaches funded Title II and the Individuals with Disabilities Educational Act
School-based Mental Health Workers funded through the Safe Schools/Healthy Students
Grant and General Fund
41
Appendix

42
43