school library media centers - nces.ed.gov report provides an overview of the current state of...
TRANSCRIPT

School Library MediaCenters:Selected Results From theEducation LongitudinalStudy of 2002 (ELS:2002)
E.D. TABU.S. Department of EducationInstitute of Education SciencesNCES 2005–302

School Library MediaCenters:Selected Results From theEducation LongitudinalStudy of 2002 (ELS:2002)
E.D. TAB
December 2004
Leslie ScottEducation StatisticsServices Institute
Jeffrey OwingsProject OfficerNational Center forEducation Statistics
U.S. Department of EducationInstitute of Education SciencesNCES 2005–302
U.S. Department of Education Rod Paige Secretary
Institute of Education Sciences Grover J. Whitehurst Director
National Center for Education Statistics Jeffrey Owings Associate Commissioner
The National Center for Education Statistics (NCES) is the primary federal entity for collecting, analyzing, and reporting data related to education in the United States and other nations. It fulfills a congressional mandate to collect, collate, analyze, and report full and complete statistics on the condition of education in the United States; conduct and publish reports and specialized analyses of the meaning and significance of such statistics; assist state and local education agencies in improving their statistical systems; and review and report on education activities in foreign countries.
NCES activities are designed to address high priority education data needs; provide consistent, reliable, complete, and accurate indicators of education status and trends; and report timely, useful, and high quality data to the U.S. Department of Education, the Congress, the states, other education policymakers, practitioners, data users, and the general public.
We strive to make our products available in a variety of formats and in language that is appropriate to a variety of audiences. You, as our customer, are the best judge of our success in communicating information effectively. If you have any comments or suggestions about this or any other NCES product or report, we would like to hear from you. Please direct your comments to:
National Center for Education Statistics Institute of Education Sciences U.S. Department of Education 1990 K Street NW Washington, DC 20006�5651
January 2005
The NCES World Wide Web Home Page address is http://nces.ed.gov The NCES World Wide Web Electronic Catalog is http://nces.ed.gov/pubsearch
Suggested Citation Scott, L. (2004). School Library Media Centers: Selected Results From the Education Longitudinal Study of 2002 (ELS:2002) (NCES 2005-302). U.S. Department of Education, National Center for Education Statistics. Washington, DC: U.S. Government Printing Office.
For ordering information on this report, write: U.S. Department of Education ED Pubs P.O. Box 1398 Jessup, MD 20794�1398
Call toll free 1�877�4ED�Pubs; or order online at http://www.edpubs.org
Contact: Jeffrey Owings, Project Officer (202) 502-7423 [email protected]

iii
Executive Summary Introduction
School libraries play an important role in making information available to students and in teaching students how to obtain and use that information. The constant improvement in the quality and affordability of personal computers, particularly when coupled with the increase in the availability of electronically stored information of all kinds, means that today�s school libraries have become far more than simple repositories of books. One scholar suggests that, in order to meet the needs of today�s students, school library media specialists �need to develop high-tech environments to provide the types of learning experiences that employers will require of their employees. Electronic access to local and remote online networks, in-house use of CD-ROM databases, and interactive media are necessary for all library media centers� (Craver 1995).
This report provides an overview of the current state of school library media centers1 that
serve U.S. 10th-graders. The National Center for Education Statistics (NCES) Education Longitudinal Study of 2002 (ELS:2002) provides comprehensive data from multiple sources on school library media centers that served 10th-graders in 2002. ELS:2002 is a longitudinal study of a nationally representative sample of 15,5252 10th-graders in 752 schools in the United States in 2002. The students will likely be followed until about age 30, with the first follow-up in 2004, when most of the students will be in the 12th grade. During the high school years, ELS:2002 is a multilevel study, involving multiple respondent populations, including students, their parents, their teachers, and their schools (from which data are collected from the school principal, the school librarian, and a facilities checklist). Obtaining data from multiple respondents provides a more comprehensive picture of the home, community, and school environment and the influences they have on the student.
The ELS:2002 library media center survey, administered primarily to school librarians,
examined various aspects of school libraries�their space, organization, collections, resources, staffing, and use. In addition, 10th-graders provided information on their use of and opinions about their school libraries. Key Findings This E.D. TAB summarizes findings for all ELS:2002 schools and students about library media centers. Findings for schools are presented by the following school characteristics: school sector, school urbanicity, school region, grade span, school enrollment, and the percentage of students receiving free or reduced-price lunch in grade 10. Findings for students are presented by the following student characteristics: sex, race/ethnicity, socioeconomic status (SES), composite achievement test score in grade 10, student�s school sector, student�s school urbanicity, and student�s school region. Comparisons by these school and student characteristics
1 The terms �school library� and �school library media center� are used interchangeably. 2 This sample size (15,525) includes 163 students who were unable to complete the student questionnaire and cognitive tests due to disability, language barriers, etc. However, contextual data are available for these students on the ELS:2002 restricted-use data file. They are not on the public-use data file (where the sample size is 15,362).
iv
have been tested for statistical significance (at the .05 level). This executive summary presents highlights of findings from the ELS:2002 library media center survey and student survey.
School library media centers: Who has them, and their organization All participating ELS:2002 schools were asked if they had a school library media center, defined as follows: ��an organized collection of printed and/or audiovisual and/or computer resources which is administered as a unit, is located in a designated place or places, and makes resources and services available to students, teachers, and administrators. A library media center may also be called a library, media center, resource center, information center, instructional materials center, learning resource center, or some other name.� Schools that answered yes were then asked to complete a school library media center survey. In approximately three-quarters of the cases, the survey was completed by the school library media specialist; others were completed by the school principal or other school administrator.3
School library media centers are almost universally available. In 2002, 96 percent of schools had a library media center (table 1). Ninety-three percent of these school library media centers were centrally organized (one area in one building), while 7 percent were decentralized (collections or services located in more than one location) (table 2). Library resources, staffing, and circulation
The library media center questionnaire asked numerous questions about the availability of library resources and services. The types of technology and equipment that many libraries had (and the percentage that had them) were Internet access (96 percent), personal computer (94 percent), VCR (91 percent), audio equipment (89 percent), telephone (88 percent), and automated book circulation system (74 percent) (table 5a). Few libraries had these resources: electronic book reader (2 percent), technology for persons with disabilities (16 percent), and video conferencing equipment (20 percent).
Of the database services that ELS:2002 asked school librarians about, 88 percent of school libraries had reference/bibliography databases, 82 percent had general articles and news databases, 62 percent had college and career databases, and 56 percent had academic subject databases (table 6).
Sixty-two percent of school library media centers participated in some type of interlibrary loan (ILL) program with other libraries (table 7). School libraries were more likely to have an ILL program with public libraries in the area (43 percent) and area high schools (42 percent) than with colleges/universities (31 percent), the state library (30 percent), or other high schools in the state (25 percent). Public schools and schools in the Northeast were more likely to participate in ILL programs than Catholic and other private schools, and schools in the South and West. 3 Seventy-three percent of library media center questionnaire respondents were certified librarians/media specialists, 4 percent were principals or other school administrators, and 23 percent were other.

v
Seventy-six percent of school library media centers had a state-certified librarian on staff
(table 9). Combined elementary/secondary schools (schools with grades PK, K, 1, 2, 3, 4, or 5 through 12) and smaller schools (schools with 1�399 students) were less likely to have a state-certified librarian on staff than schools with other grade spans and larger student enrollments.
Seventy-five percent of school library media centers had fewer than 16,000 books (table
4).4 An average of 280 library materials (books, etc.) circulated from school libraries during a typical week (table 16). On average, about 1 book (or other library material) per student circulated from school libraries each week. Students� self-reported use and opinions of their school libraries The ELS:2002 student survey contained several questions about students� use of and opinions about their schools� libraries. Students reported using the school library sometimes or often for research papers (54 percent), in-school projects (53 percent), Internet access (41 percent), and assignments (41 percent) (table 18). Females used the school library more often than males for assignments, in-school projects, homework, research papers, and to read books for fun. Students from different SES backgrounds used school libraries for different reasons. Students from high-SES families were more likely than students from middle- or low-SES backgrounds to use the library sometimes or often for assignments and in-school projects. Students from low-SES families were more likely than students from middle or high-SES families to use the school library sometimes or often for homework, leisure reading, to read magazines or newspapers, to read books for fun, and for interests outside of school. Students with different test scores also used the library for different purposes. Students with high test scores were more likely than students with low or middle scores to use the library for assignments, in-school projects, and research papers. Students with low test scores were more likely than students with high or middle test scores to use the library for homework, leisure reading, to read magazines or newspapers, to read books for fun, and for interests outside of school. The majority of students reported that their school library�s reference materials were useful (58 percent reported they were useful and 22 percent reported they were very useful) (table 19). The majority of students also reported that school library staff were helpful with different tasks. For example, 79 percent of students reported that library staff were helpful or very helpful with finding research resources, such as books, magazines, and newspaper articles, on a research topic (table 20).
4 We recognize that a better measure would have been number of books per student, but the ELS:2002 variable for library holdings is not available as a continuous measure. Library book holdings is correlated with school size. For example, schools with the smallest enrollment size (1�399 students) were more likely than schools with larger enrollment sizes (400�799, 800�1,199, 1,200�1,599, 1,600 or more) to have fewer than 8,000 books. Likewise, the largest schools (1,600 or more students) were more likely than schools with fewer students to have 24,000 or more books in the library (table 7).

vi
Acknowledgments
The authors would like to thank the many individuals who contributed to this E.D. TAB. Jennifer Thompson, formerly of the Education Statistics Services Institute (ESSI), was the initial author and analyst. Denise Davis of the American Library Association commented on drafts of the report and provided information on previous research of school library media centers. Adrienne Chute of the National Center for Education Statistics (NCES) contributed to the analytical design of the report. Jeffrey Owings, Associate Commissioner at NCES, provided direction and feedback on many aspects of the report.
The NCES staff who reviewed the report and provided valuable suggestions include
Marilyn Seastrom, Barbara Holton, and Jeffrey Williams. From ESSI, Mike Planty provided technical review for this report and Deven Carlson provided additional review and table formatting.
The authors also thank Steven Ingels of RTI for providing the technical appendix. The
technical appendix was taken from A Profile of the American High School Sophomore in 2002 (NCES 2004-396) and modified slightly to suit this report.

vii
Table of Contents Section Page Executive Summary .............................................................................................................. iii Acknowledgments................................................................................................................. vi List of Tables ........................................................................................................................ ix Introduction.............................................................................................................................1 Selected Findings ....................................................................................................................5
Profile of School Library Media Centers.......................................................................5 Which schools have school library media centers?..........................................5 What do school library media centers look like?.............................................6 School Library Media Center Resources .......................................................................7 Collections ......................................................................................................7 Equipment and technology .............................................................................7 Services ...........................................................................................................9 Expenditures ................................................................................................................11 Staffing.........................................................................................................................11 Librarians� Collaboration with School Teachers .........................................................12 Use of School Library Media Centers .........................................................................13
When students may use library ........................................................................13 How often library is used for various purposes ...............................................13 How many students visit during a typical week ..............................................13 Maximum books allowed out by students .......................................................14 Circulation of library materials........................................................................14 What materials may be taken out of the library...............................................14
Student Report of School Library Use.........................................................................16 Student Attitudes Toward School Library ...................................................................16 References................................................................................................................................17

viii
Table of Contents (Continued) Section Page Appendix A: Technical Notes and Glossary......................................................................... A-1 Appendix B: Standard Error Tables.......................................................................................B-1 Appendix C: ELS:2002 Library Media Center Questionnaire ..............................................C-1
ix
Table of Contents (Continued)
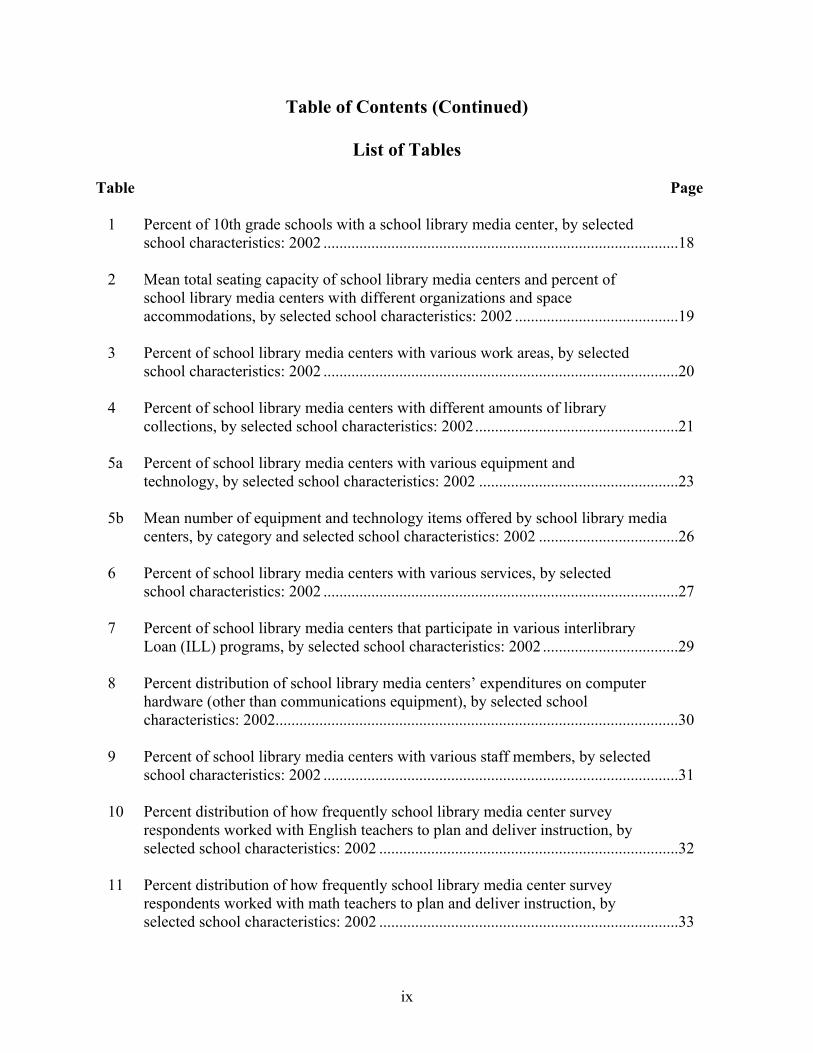
List of Tables Table Page
1 Percent of 10th grade schools with a school library media center, by selected
school characteristics: 2002 .........................................................................................18
2 Mean total seating capacity of school library media centers and percent of school library media centers with different organizations and space accommodations, by selected school characteristics: 2002 .........................................19
3 Percent of school library media centers with various work areas, by selected
school characteristics: 2002 .........................................................................................20
4 Percent of school library media centers with different amounts of library collections, by selected school characteristics: 2002...................................................21
5a Percent of school library media centers with various equipment and
technology, by selected school characteristics: 2002 ..................................................23
5b Mean number of equipment and technology items offered by school library media centers, by category and selected school characteristics: 2002 ...................................26
6 Percent of school library media centers with various services, by selected
school characteristics: 2002 .........................................................................................27 7 Percent of school library media centers that participate in various interlibrary
Loan (ILL) programs, by selected school characteristics: 2002 ..................................29 8 Percent distribution of school library media centers� expenditures on computer
hardware (other than communications equipment), by selected school characteristics: 2002.....................................................................................................30
9 Percent of school library media centers with various staff members, by selected
school characteristics: 2002 .........................................................................................31 10 Percent distribution of how frequently school library media center survey
respondents worked with English teachers to plan and deliver instruction, by selected school characteristics: 2002 ...........................................................................32
11 Percent distribution of how frequently school library media center survey
respondents worked with math teachers to plan and deliver instruction, by selected school characteristics: 2002 ...........................................................................33

x
Table of Contents (Continued)
List of Tables (Continued) Table Page
12 Percent distribution of when students may use school library media centers on their own, by selected school characteristics: 2002 .....................................................34
13 Mean number of times during a typical week the school library media center is
used by various groups, during school and non-school hours, by selected school characteristics: 2002.....................................................................................................35
14 Percent distribution of schools with different amounts of student usage of school
library during a typical week, during school and non-school hours, by selected school characteristics: 2002 .........................................................................................36
15 Percent of schools with different maximum number of books that a student may
check out of the school library at one time, by selected school characteristics: 2002..............................................................................................................................37
16 Mean total circulation of library materials (books, etc.) checked out from the
library media center during a typical week, and per student, by selected school characteristics: 2002.....................................................................................................38
17 Percent distribution of schools allowing certain materials to be taken out of the
school library, by selected school characteristics: 2002 ..............................................39 18 Percent of students who reported �sometimes� or �often� for use of school
library media center for various purposes, for students whose schools have library media centers, by selected student characteristics: 2002 .................................40
19 Percent distribution of student attitudes about reported usefulness of school
library reference materials in helping with class assignments and research, for students whose schools have library media centers, by selected student characteristics: 2002.....................................................................................................41
20 Percent of students who reported �very helpful� or �helpful� for questions about
helpfulness of library staff with various tasks, for students whose schools have library media centers, by selected student characteristics: 2002 .................................42

xi
Table of Contents (Continued)
List of Tables in Appendix
Table Page
A-1 Percent distribution of 10th grade schools, by selected school characteristics: 2002........................................................................................................................... A-6
A-2 Percent distribution of 10th grade schools, by school sector and selected school characteristics: 2002 ...................................................................................... A-7
A-3 Percent distribution of 2002 sophomores, by selected student characteristics: 2002........................................................................................................................... A-8 A-4 Unweighted school sampling, eligibility, and participation by sampling stratum:
2002......................................................................................................................... A-11 A-5 Summary of ELS:2002 base year completion and coverage rates: 2002 ............... A-11 A-6 Weighted responses rates for unimputed variables: 2002 ...................................... A-11 A-7 ELS:2002 imputation variables: Weighted proportion missing and imputed ........ A-14

xii
Table of Contents (Continued)
List of Standard Error Tables Table Page
B-1 Standard errors for Table 1: Percent of 10th grade schools with a school library media center, by selected school characteristics: 2002..............................................B-2
B-2 Standard errors for Table 2: Mean total seating capacity of school library media
centers and percent of school library media centers with different organizations and space accommodations, by selected school characteristics: 2002 ......................B-3
B-3 Standard errors for Table 3: Percent of school library media centers with various
work areas, by selected school characteristics: 2002.................................................B-4
B-4 Standard errors for Table 4: Percent of school library media centers with different amounts of library collections, by selected school characteristics: 2002....B-5
B-5a Standard errors for Table 5a: Percent of school library media centers with various
equipment and technology, by selected school characteristics: 2002........................B-7 B-5b Standard errors for Table 5b: Mean number of equipment and technology items offered by school library media centers, by selected category and selected school characteristics .................................................................................................B-9
B-6 Standard errors for Table 6: Percent of school library media centers with various
services, by selected school characteristics: 2002 ...................................................B-10
B-7 Standard errors for Table 7: Percent of school library media centers that participate in various interlibrary loan (ILL) programs, by selected school characteristics: 2002.................................................................................................B-12
B-8 Standard errors for Table 8: Percent distribution of school library media
centers� expenditures on computer hardware (other than communications equipment), by selected school characteristics: 2002 ..............................................B-13
B-9 Standard errors for Table 9: Percent of school library media centers with
various staff members, by selected school characteristics: 2002.............................B-14
B-10 Standard errors for Table 10: Percent distribution of how frequently school library media center survey respondents worked with English teachers to plan and deliver instruction, by selected school characteristics: 2002 ............................B-15

xiii
Table of Contents (Continued)
List of Standard Error Tables (Continued) Table Page
B-11 Standard errors for Table 11: Percent distribution of how frequently school library media center survey respondents worked with math teachers to plan and deliver instruction, by selected school characteristics: 2002 ...................................B-16
B-12 Standard errors for Table 12: Percent distribution of when students may use
school library media centers on their own, by selected school characteristics: 2002..........................................................................................................................B-17
B-13 Standard errors for Table 13: Mean number of times during a typical week the
school library media center is used by various groups, during school and non-school hours, by selected school characteristics: 2002.....................................B-18
B-14 Standard errors for Table 14: Percent distribution of schools with different
amounts of student usage of school library during a typical week, during school and non-school hours, by selected school characteristics: 2002..............................B-19
B-15 Standard errors for Table 15: Percent of schools with different maximum
number of books that a student may check out of the school library at one time, by selected school characteristics: 2002 ..................................................................B-20
B-16 Standard errors for Table 16: Mean total circulation of library materials
(books, etc.) checked out from the library media center during a typical week, and per student, by selected school characteristics: 2002........................................B-21
B-17 Standard errors for Table 17: Percent distribution of schools allowing certain
materials to be taken out of school library, by selected school characteristics: 2002..........................................................................................................................B-22
B-18 Standard errors for Table 18: Percent of students who reported �sometimes� or
�often� for use of school library media center for various purposes, for students whose schools have library media centers, by selected student characteristics: 2002..........................................................................................................................B-23
B-19 Standard errors for Table 19: Percent distribution of student attitudes about
reported usefulness of school library reference materials in helping with class assignments and research, for students whose schools have library media centers, by selected student characteristics: 2002 .................................................................B-24
xiv
Table of Contents (Continued)
List of Standard Error Tables (Continued) Table Page
B-20 Standard errors for Table 20: Percent of students who reported �very helpful� or �helpful� for questions about helpfulness of library staff with various tasks, for students whose schools have library media centers, by selected student characteristics: 2002.................................................................................................B-25

1
Introduction School libraries play an important role in making information available to students and in teaching students how to obtain and use that information. The constant improvement in the quality and affordability of personal computers, particularly when coupled with the increase in the availability of electronically stored information of all kinds, means that today�s school libraries have become far more than simple repositories of books. One scholar suggests that, in order to meet the needs of today�s students, school library media specialists �need to develop high-tech environments to provide the types of learning experiences that employers will require of their employees. Electronic access to local and remote online networks, in-house use of CD-ROM databases, and interactive media are necessary for all library media centers� (Craver 1995). Some empirical evidence exists in support of the positive benefits of high-tech school library media centers. Hamilton-Pennell et al. (2000) found that school library media centers with a full-time library media specialist, support staff, and a strong computer network were associated with higher student achievement, regardless of social and economic factors in the community. The federal role in the development of school library media centers changed greatly in the last 40 years. The National Defense Education Act (NDEA) of 1958 provided funds for purchasing books in mathematics, science, and foreign languages, with funds for books in the humanities added in later years. The Elementary and Secondary Education Act of 1965, Title II, made grants available for acquiring library books, textbooks, and other instructional material as well as for demonstration projects and training for library media specialists. This legislation led to considerable growth in the establishment of school library media centers (Bard and Sakadi 1981).
The National Center for Education Statistics (NCES) is involved in research on libraries, formally establishing a library statistics program in 1989 and conducting surveys on academic libraries, public libraries, school library media centers, and state library agencies. The Education Longitudinal Study of 2002 (ELS:2002) is NCES�s most recent longitudinal survey on secondary school education in the United States ELS:2002 is a longitudinal study of a nationally representative sample of 15,5255 10th-graders in 752 schools in the United States in 2002.6 The students will likely be followed until about age 30, with the first follow-up in 2004, when most of the students will be in the 12th-grade. During the high school years, ELS:2002 is a multilevel study, involving multiple respondent populations, including students, their parents, their teachers, and their schools (from which data is collected from the school principal, school librarian, and from a facilities checklist). These multiple respondents provide a more comprehensive picture than would a single respondent of characteristics of students and of their home, community, and school environments. This E.D. TAB provides an overview of the current state of school library media centers that serve 10th-graders.
5 This sample size (15,525) includes 163 students who were unable to complete the student questionnaire and cognitive tests due to disability, language barriers, etc. However, contextual data are available for these students on the ELS:2002 restricted-use data file. They are not on the public-use data file (reducing the sample size to 15,362). 6 See the technical appendix for information on response rates.
2
While the focus of ELS:2002 is on the students (10th-graders in 2002), ELS:2002 also provides a unique perspective on school library media centers. Information on school library media centers that serve 10th-graders can be obtained from multiple sources in ELS:2002 � from school librarians and from students. In the base year (2002), school librarians at schools that ELS:2002 10th-graders attended completed a questionnaire on the library in their school. The survey covered a range of topics, including library resources (books, technology, equipment, services, etc.), staffing, circulation, and use of school libraries (when used, rules about use, etc.). In addition, the student survey in ELS:2002 asked 10th-graders about their use of and attitudes toward their school libraries. Traditional, as well as recent, research on school libraries has concentrated on the views of librarians and teachers and has largely ignored the views of students (Phtiaka 1994). In ELS:2002, students were asked how often they used the school library for different purposes, and their opinions about library resources and staff. These sources together contribute to a more complete picture of school library media centers than studies that do not gather data from multiple sources, particularly the library user. These base-year (2002) data can also be linked to future student outcomes in high school and beyond when follow-up survey data become available.
In ELS:2002, of 1,221 eligible contacted schools, 752 participated in the study, for an
overall weighted school participation rate of approximately 68 percent (62 percent unweighted). Of 17,591 selected eligible students, 15,362 participated, for an overall weighted student response rate of approximately 87 percent. School and student unit nonresponse bias analyses were performed, as well as an item nonresponse bias analysis for the questionnaires.7 The school-level bias due to nonresponse prior to computing weights and after computing weights was estimated based on the data collected from both respondents and nonrespondents, as well as sampling frame data. At the unit level (but not the item level), weighting techniques were employed to reduce detected bias, and after final nonresponse adjustments, the remaining relative bias ranged from 0 to 0.2 percent for schools and from 0 to 0.07 for students. For details of the bias analyses, see the Education Longitudinal Study of 2002: Base Year Data File User�s Manual. Of the 752 ELS:2002 participating schools, 710 schools had a school library media center and completed the library media center questionnaire, 8 did not have a school library media center and thus did not complete the questionnaire, and 34 did not complete the questionnaire and it was unknown whether they had a library or not (nonrespondents). Thus, the unit response rate for the library media center survey was 95.4 percent (unweighted). This E.D. TAB provides an overview of school library media centers in 2002. The report presents data on school library media centers from two sources � school librarians and students. Specifically, this report provides information on the following topics:
• description of ELS:2002 schools and students; • which schools have a school library media center; • what school library media centers look like � their capacity, organization, space; • resources � collections, equipment and technology, services; • expenditures;
7 Nonresponse bias analysis was not performed on the library media center questionnaire as the response rates were generally high and did not fall below the designated threshold.

3
• staffing; • librarians� collaboration with school teachers; • use of school library media centers � when students may use the library, how often
the library is used for various purposes, maximum books allowed out by students, circulation of library materials, when materials may be taken out of the library;
• student use of school library; and • student attitudes toward school library.
The data provided on each of these topics is further examined by selected school and
student characteristics. This is another advantage of the ELS:2002 data in understanding school libraries; information on the libraries can be examined for different types of schools and different types of students. School libraries are examined by the following school characteristics:
• school sector (public, Catholic, other private); • school urbanicity (urban, suburban, rural); • school region (Northeast, Midwest, South, West); • grade span (grades PK, K, 1, 2, 3, 4, or 5 through 12; grades 6,7, or 8 through 12;
grades 9 through 10, 11, or 12; grades 10 through 11 or 12); • school enrollment (1�399, 400�799, 800�1,199, 1,200�1,599, 1,600 or more
students); and • percent of 10th-grade students that receives free or reduced-price lunch (0�5 percent,
6�20 percent, 21�50 percent, and 51�100 percent). The student characteristics examined in this report with the student-level library data
include the following: • sex; • race/ethnicity (American Indian/Alaska Native, non-Hispanic; Asian, Hawaii/Pacific
Islander, non-Hispanic; Black or African-American, non-Hispanic; Hispanic (combined no race specified, and race specified); Multiracial, non-Hispanic; and White, non-Hispanic);
• socioeconomic status (lowest quartile, middle two quartiles, highest quartile); • composite achievement test score in grade 10 (lowest quarter, middle two quarters,
highest quarter); • student�s school sector (public, Catholic, other private); • student�s school urbanicity (urban, suburban, rural); and • student�s school region (Northeast, Midwest, South, West). Comparisons by these school and student characteristics are only discussed in this report
where significant differences were detected. All specific statements of comparisons made in this report have been tested for statistical significance using t tests. Comparison statements are significant at the alpha level of .05. The reader is referred to the technical appendix for further details on the statistical methods used and on the school and student characteristics variables listed here.
4
It is important to note that many of the variables examined in this report are related to one another, and more complex interactions and relationships have not been taken into account. The purpose of an E.D. TAB is to introduce new NCES surveys and data through the presentation of selected descriptive information in tabular format. More complex analyses are addressed in other types of NCES reports, such as the Statistical Analysis Report series, or left to other researchers whose curiosity to dig deeper has been piqued by the associations reported here.

5
Selected Findings
This E.D. TAB presents national data on school library media centers that serve 10th-graders. The data were collected as part of the Education Longitudinal Study of 2002 (ELS:2002). In particular, this report examines results from the ELS:2002 school library media center survey, completed primarily by a certified librarian/media specialist8 at the schools that 2002 10th-graders attended. In addition, ELS:2002 10th-graders were asked about their use and opinions of their school library media center. The report provides basic information on schools that have a library media center, their physical space, and information on library resources, staffing, usage, and attitudes about school library media centers. These aspects are further examined by a number of school and student characteristics.9 Profile of School Library Media Centers Which schools have school library media centers?
School library media centers are almost universally available to 10th-grade students. Ninety-six percent of schools enrolling 10th-grade students reported that they had a school library media center (table 1).10 The definition of a school library media center in the ELS:2002 questionnaire was consistent with the definition used in the NCES School Library Media Center Survey. Library media center was defined as an
�organized collection of printed and/or audiovisual and/or computer resources which is
administered as a unit, is located in a designated place or places, and makes resources and services available to students, teachers, and administrators. A library media center may also be called a library, media center, resource center, information center, instructional materials center, learning resource center, or some other name.�
The following results were found in examining the presence of a library media center by selected school characteristics:
• Other private schools were less likely to have libraries than public and Catholic schools (81 percent vs. 100 percent, respectively).
• Combined elementary/secondary schools (those schools whose enrollments began with grades PK, K, 1, 2, 3, 4, or 5 and also included 6 through 12) were also less likely to have libraries than schools with other grade spans (those with grades 6, 7, or 8 and 9 through 12; grades 9 through 10, 11, or 12; grades 10 through 11 or 12).11
8 Seventy-three percent of library media center questionnaire respondents were certified librarians/media specialists, 4 percent were principals or other school administrators, and 23 percent were other. 9 See the technical appendix for details on the construction of these school and student variables. 10 This percentage excludes those who did not complete the library media center questionnaire, and for whom we do not know if they had a school library media center or not. See the technical appendix for more details. Four percent of schools did not complete the library media center questionnaire, 4 percent of schools reported that they did not have a school library media center, and 92 percent of schools completed the library media center questionnaire. 11 Only schools with 10th-grade classes were included in the survey. The four grade span categories take into account the many possible configurations of schools offering 10th-grade classes.
6
• Small schools (1�399 students) were less likely to have libraries than schools with larger student enrollments12 (93 versus 100 percent).
• Schools with a low percentage (0–5 percent) of 10th-graders receiving free or reduced-price lunches were less likely to have libraries than those with higher percentages of such students 13 (88 vs. 99 or 100 percent).
What do school library media centers look like?14
A number of library media center questions addressed issues of capacity, organization, and space in the school library and the activities that could be accommodated in that space. Results include
• The mean total seating capacity of school library media centers was 69 students (table 2). The mean varied by school enrollment; smaller schools had a smaller mean seating capacity than larger schools.15 Rural schools had a smaller seating capacity than urban and suburban schools (an average of 60 seats vs. 79 and 73 seats, respectively). Schools enrolling both upper and lower grade students had a smaller seating capacity than schools enrolling only the upper grades.16 Other private schools had a smaller seating capacity than public schools (52 vs. 73 seats, respectively).
• Ninety-three percent of school library media centers were centrally organized (one area in one building), while 7 percent were decentralized (collections or services available in more than one location on campus or in another building) (table 2). Other private schools� libraries were less likely than public and Catholic schools� libraries to be centrally organized. Larger school libraries that served 400 or more students were less likely than small school libraries that served 1�399 students to be decentralized.
• Ninety percent of school library media centers could accommodate a full class of students at one time (table 2). Eighty-one percent could serve a full class and another activity (such as production activities, conferences, small group work, individual browsing) at the same time.
• Eighty percent of school library media centers had large group activity areas (areas for more than 5 persons for viewing or listening), 66 percent had small group activity areas (areas for 5 persons or less for viewing or listening), and 65 percent had
12 Larger student enrollments were those with 400�799, 800�1,199, 1,200�1,599, and 1,600 or more students. 13 Higher percentages were those with 6�20 percent, 21�50 percent, or 51�100 percent of 10th-graders receiving free or reduced-price lunches. 14 For the remainder of the report, percentages are based on all schools with library media centers. 15 Schools with 1,600+ students had a higher average seating capacity than schools with 1,200�1,599 students, 800�1,199 students, 400�799 students, and 1�399 students. Schools with 1,200�1,599 students had a higher average seating capacity than schools with 800�1,199 students, 400�799 students, and 1�399 students. Schools with 800�1,199 students had a higher average seating capacity than schools with 400�799 students and schools with 1�399 students. Finally, schools with 400�799 students had a higher average seating capacity than schools with 1�399 students. 16 Schools whose grade span included 5th-grade or lower had a lower mean seating capacity than schools that enrolled students higher than 5th-grade. Schools whose grade span included 8th grade or lower had a lower mean seating capacity than those that enrolled students higher than 8th grade. Schools whose grade span included lower than 10th grade had a lower mean seating capacity than those that enrolled students 10th-grade and higher.

7
individual activity areas (areas for individual reading, viewing, and listening) (table 3).
• Ninety-seven percent of school library media centers had a computer access area or lab, 82 percent had a staff work area (where library staff order, label, etc.), and 32 percent had a conference room (table 3).
School Library Media Center Resources Collections
The primary library resources are, of course, library books and similar materials. Several items in the ELS:2002 school library questionnaire asked about collections in the school library (only those collections administered by the media center). These included the number of library holdings at the end of the 2000�2001 school year of books (all copies), video materials (tape, DVD, or laser disc titles; not duplicates), periodical subscriptions (current print or microform subscriptions), and electronic database subscriptions (online, CD-ROM, electronic journals, electronic books; not duplicates) (table 4).17 Some findings were
• Seventy-five percent of schools had fewer than 16,000 books in 2001. Six percent had 24,000 or more books; these schools tended to be large high schools.
• Sixty-one percent of schools had fewer than 250 videos; 31 percent had 250�999 videos; 7 percent had 1,000�1,749; and 1 percent had 1,750 or more videos.
• Forty-two percent of schools had fewer than 25 periodical subscriptions in 2001; 36 percent had 25�49 subscriptions; 12 percent had 50�74 subscriptions, and 10 percent had 75 or more.
• Twenty-five percent of schools had no electronic database subscriptions; 44 percent had 1�3 subscriptions; 14 percent had 4�6 subscriptions and 17 percent had 7 or more.
Equipment and technology
ELS:2002 library media center survey extensively covered what resources were available in school library media centers. The survey addressed whether school library media centers had various sorts of equipment and technology, including the following items: telephone, fax machine, photocopier, VCR, laser disc player, DVD player, electronic book reader (e.g., rocket ebooks), CD-ROM reader (external or built in drive), personal computer (PC), automated book circulation system, Internet access capability (e.g., dial-up connection, cable modem, ISDN, dedicated line), cable TV, closed-circuit TV, video camera, satellite TV hook-up, audio equipment (e.g., video cassette recorder/player, record player), video conferencing equipment, scanner (for images and text), LCD panel or other projection device (for projecting images directly from a computer), and technology to assist students or teachers with disabilities (e.g., TDD, specially equipped workstations, CCTV, screen readers, keyboard alternatives). Table 5a reports the percentages of schools having these items by selected school characteristics. Given 17 Ideally, data on collections should be reported as a uniform books (videos, periodicals, databases) per student measure. However, the number of collections and holding of libraries were collected as categorical (i.e., range) variables only; thus, such a measure could not be constructed.
8
the extensive list of equipment, table 5b shows the mean number of items school libraries own in three categories. The first category is office equipment which comprises three items: telephone, fax machine, and photocopier. The second category is audio-visual equipment which consists of 8 items: audio equipment, LDC panel, VCR, video camera, videoconferencing equipment, cable television, closed-circuit television, and satellite TV hook-up. The third category is electronic equipment with 6 items: personal computer, CD-ROM reader, DVD player, laser disk player, scanner, and electronic book reader. The following results pertain to which equipment and technology school libraries had, and which libraries were more likely to have certain kinds of equipment and technology:
• The mean number of office equipment owned by school library media centers is 1.8 (out of 3 pieces of equipment). The mean number of audiovisual equipment owned by libraries is 4.5 (out of 8 possible items). The mean number of electronic equipment (out of 6) that libraries have is 2.8 (table 5b).
• Private schools have less office equipment, on average, in their library media centers than public and Catholic schools. Private and Catholic schools have less audiovisual equipment, on average, than public schools. Public schools have more electronic equipment in their school libraries than private schools (table 5b).
• Regarding the equipment owned by school library media centers of various size enrollments, a discernable pattern appears to emerge between schools with fewer than 800 students and schools with 800 or more students. Smaller schools (fewer than 800 students) own less audiovisual and electronic equipment, on average, than larger schools (800 or more students) (table 5b).
• Schools in which a moderate number of students, relatively speaking, are receiving free and reduced-price lunch, 6 to 20 percent, are better equipped in terms of office, audiovisual, and electronic equipment than schools in which a small number of students are receiving free and reduced-price lunch, 0-5 percent. For two of the equipment categories, office and electronic equipment, schools of moderate numbers of free and reduced-priced lunch students also have more equipment than schools in which 21 to 50 percent of their students are receiving free and reduced-price lunch (table 5b).
At the more detailed level (see table 5a)
• Most school library media centers responded as having the following items: Internet access (96 percent), personal computer (94 percent), VCR (91 percent), audio equipment (89 percent), telephone (88 percent), and automated book circulation system (74 percent).
• Few school library media centers responded as having these items: electronic book reader (2 percent), technology for persons with disabilities (16 percent), and video conferencing equipment (20 percent).
• Schools with larger student enrollments tended to have more types of equipment and technology than smaller schools. For instance, schools with 1�399 students were less likely to have a telephone, photocopier, laser disc player, automated book circulation system, cable TV, closed circuit TV, video camera, and LCD panel than schools with more students (400�799, 800�1,199, 1,200�1,599, and 1,600 or more students).

9
• In general, other private school libraries had fewer types of equipment and technological items than public school libraries, and for some items, fewer than Catholic school libraries. Other private school libraries were less likely to have a telephone, fax machine, laser disc player, automated book circulation system, Internet access, cable TV, closed circuit TV, video camera, satellite TV hook-up, scanner, LCD panel, and technology for disabled compared to public schools. The one exception to this pattern was that other private schools were more likely to have a personal computer in the library than public schools (although this percentage was greater than 90 percent for all types of schools). Catholic schools were more likely than other private schools to have a telephone, photocopier, laser disc player, and closed circuit TV.
• Overall, suburban school libraries had more types of resources in the form of equipment and technology than urban schools, and more than rural school libraries. Suburban school libraries were more likely to have a laser disc player, cable TV, closed circuit TV, video camera, satellite TV, and video conferencing equipment than urban school libraries. Suburban schools were more likely than rural schools to have a photocopier, laser disc player, DVD player, and closed circuit TV in their library.
• Generally, combination elementary/secondary schools (grade spans of PK, K, 1, 2, 3, 4, or 5 through 12) had fewer types of equipment and technological resources than schools with other grade spans, especially schools serving grades 9 through 10, 11, or 12 or grades 10 through 11 or 12. Elementary/secondary school libraries were less likely to have a telephone, fax machine, photocopier, laser disc player, automated book circulation system, closed circuit TV, and video camera compared to libraries in schools with grades 9 through 10, 11, or 12 and schools with grades 10 through 11 or 12.
Services
In addition to equipment and technology, the library media center survey also asked school library respondents about various electronic services and software. These included the availability of: online catalogs, other libraries� online catalogs, Internet access, e-mail or chat room access, reference and bibliography databases (e.g., encyclopedia, dictionary), general articles and news databases, college and career databases, academic subject databases (education, business/management, humanities, science/engineering/math, or English databases�e.g., ERIC or Science Direct), electronic full-text books, journals, references, or magazines, educational software (e.g., CD-ROMs, Math Blasters), and multimedia production facility (i.e., a studio containing a computer and equipment using text, full-color images and graphics, video, animation, and sound) (table 6). Some of the findings include
• Most schools reported having the following services: Internet access (96 percent), reference/bibliography database (88 percent), and general articles/news database (82 percent). Sixty-two percent of schools reported having college and career databases and 56 percent had academic subject databases.
• Few schools reported having a multimedia production facility (18 percent). • Other private schools, particularly compared to public schools, had the fewest
services of the ones listed above in their school libraries. Other private schools were

10
less likely than public schools to have an online catalog, Internet access, reference/bibliography database, general articles/news database, college/career database, academic subject database, and electronic books, journals, references, and magazines. Other private schools were also less likely than Catholic schools to have an online catalog, general articles/news database, and college/career database.
• Rural schools tended to have more services than urban schools, and in a couple of instances, more than suburban schools. Rural schools were more likely than urban schools to have a reference/bibliography database, a general articles/news database, and electronic books, journals, references, and magazines; rural schools were also more likely than suburban schools to have reference/bibliography and general articles/news databases.
• Compared to school in the Midwest, schools in the western region of the U.S. reported fewer types of library services. Schools in the West were less likely than schools in the Midwest to have a reference/bibliography database, general articles/news database, academic subject database, educational software, and multimedia production facility.
• Smaller schools tended to have fewer types of library services than schools with larger enrollments. For example, the smallest schools (enrollments of 1�399 students) were less likely than schools with enrollments of 800�1,199, 1,200�1,599, and 1,600 or more students to have an online catalog, other libraries� online catalogs, reference/bibliography database, and an academic subject database.
The ELS:2002 library media center questionnaire also asked about six different
interlibrary loan (ILL) programs (with area high schools, with other high schools in the state, with public libraries in the area, with the state library, with colleges and universities, and other ILL programs) (table 7). The results showed
• Sixty-two percent of school library media centers participated in any type of ILL program. School libraries were more likely to be in a loan agreement with area public libraries and high schools, than other types of ILL programs. Forty-three percent of schools had ILL programs with public libraries in the area; 42 percent did with area high schools; compared to 31 percent with colleges and universities; 30 percent with the state library; and 25 percent with other high schools in the state.
• Public schools were more likely than Catholic schools and other private schools to participate in any type of ILL program (70 percent vs. 50 and 28 percent, respectively), and were more likely to participate in each specified ILL program (except other ILL programs, not specified). Catholic schools were more likely than other private schools to participate in ILL programs with area high schools, public libraries in the area, the state library, and colleges and universities.
• Suburban and rural schools were considerably more likely than urban schools to participate in ILL programs with other high schools in the state, public libraries in the area, and the state library. About half of rural schools (52 percent) and 44 percent of suburban schools participated in ILL programs with public libraries compared to a quarter (25 percent) of urban schools.
• More than half of schools in the Northeast and Midwest regions of the United States participated in any kind of ILL program. Schools in the Northeast region were more

11
likely than schools in any other region (Midwest, South, and West) to participate in ILL programs with area high schools, other high schools in state, and the state library. Schools in the Northeast were also more likely than schools in the South and West to participate in ILL programs with public libraries in the area and colleges and universities.
Expenditures
The ELS:2002 library media center questionnaire asked about the total expenditure for computer hardware (other than communications equipment) during the 2000�2001 school year (table 8).18
• About 21 percent of schools reported no expenditures on computer hardware during the 2000�2001 school year. Thirty-six percent reported spending $1�2,499; 13 percent reported spending $2,500�4,999; 10 percent reported spending $5,000�9,999; and 20 percent reported spending $10,000 or more.
Staffing
A number of questions in the ELS:2002 library media center questionnaire asked about the composition of the school library media center staff, including their certification status. Questions specifically asked whether librarians, teachers, other professionals, aides, and volunteers were on the school library staff (table 9). Some of the findings include
• Seventy-six percent of school library media centers had a state-certified librarian on staff. Thirty-five percent of schools had state-certified teachers on their library staff. Twenty-three percent of schools had non-certified professionals on the library staff. Fifty-one percent of schools had paid library aides on staff, and 49 percent had volunteers who provided library services.
• The smallest schools (enrollments of 1�399) were less likely than schools with larger enrollments to have state-certified librarians on staff. Larger schools tended to have more paid library aides on staff as well.19
• Public schools were more likely than Catholic and other private schools to have state-certified librarians on staff (87 percent vs. 66 and 33 percent, respectively). Catholic schools were more likely than other private schools to have state-certified librarians on staff.
• Public schools were more likely than Catholic or other private schools to have paid library aides on staff (57 vs. 34 and 30 percent, respectively), whereas other private and Catholic schools were more likely than public schools to have non-certified professionals on staff (49 and 40 percent vs. 15 percent, respectively).
18 This includes expenditures for purchase, rental, and/or lease. 19 The smallest schools (1�399 students) were less likely than schools with any other size enrollment to have paid library aides. Schools with 400�799 students and 800�1,199 students were less likely than schools with 1,200�1,599 students and 1,600 or more students to have paid library aides on staff.

12
• Compared to suburban and rural schools, urban schools were less likely to have state-certified teachers on their library staff (20 percent vs. 39 and 40 percent, respectively). Urban schools were more likely than suburban and rural schools to have non-certified professionals on their library staff (43 percent vs. 23 and 10 percent, respectively). Suburban schools were more likely than rural schools to have non-certified professionals.
• High schools (grade spans 9 through 10, 11, or 12, or grades 10 through 11 or 12) and middle school/high schools (grades 6, 7, or 8 through 12) were more likely to have state-certified librarians on staff than combined elementary/secondary schools (grades PK, K, 1, 2, 3, 4, or 5 through 12). Combined elementary/secondary schools were more likely to have non-certified professionals on library staff than middle school/high schools and high schools with grades 10 through 11 or 12.
Librarians� Collaboration with School Teachers
The ELS:2002 library media center questionnaire asked library media center respondents how frequently they worked with English and math teachers to plan and deliver instruction during the 2001�2002 academic year (tables 10 and 11).20 Responses included: never, once during the year, once or twice a semester/term, monthly, weekly, or more than once a week. Results showed that
• Many school librarians worked with English teachers at least once a month during the 2001�2002 school year. Eighteen percent of school librarians worked with English teachers more than once a week during the 2001�2002 school year; 17 percent worked with English teachers weekly and 24 percent monthly. In contrast, 16 percent never worked with English teachers during the 2001�2002 school year.
• Librarians worked less frequently with math teachers. One percent of school librarians worked with math teachers more than once a week during the 2001�2002 school year; 2 percent worked with them weekly, and 8 percent monthly. In contrast, 49 percent of school librarians never worked with math teachers during the school year.
• School librarians in combined elementary/secondary schools (grade spans of PK, K, 1, 2, 3, 4, or 5 through 12) were more likely than librarians in schools with other grade spans to have never worked with English and math teachers during the 2001�2002 school year. School librarians in the smallest schools (1�399 students) were similarly more likely to have never worked with English and math teachers than were those in schools with larger school enrollments.
20 Note that these questions about collaboration with teachers were asked only of the library media center questionnaire respondent about his or her own effort, and do not include any work that other library staff might engage in with math and English teachers.

13
Use of School Library Media Centers
ELS:2002 examined use of school library media centers from both the school librarians� and the students� perspectives. Librarians were asked about when students were allowed to use the school library in their school, how often the library was used for various purposes, and the circulation of library materials. When students may use library (table 12)
• Sixty-seven percent of schools allowed students to use their school library media center on their own at anytime. Students in public schools were more likely to have this privilege than students in other private schools (71 percent versus 52 percent); students in suburban schools were more likely to be able to use their school library at anytime independently than students in urban schools (70 percent versus 55 percent).21
• Of those schools with scheduled periods for when students may use the library independently, 75 percent allowed students to use the library on their own during specific times throughout the day and 70 percent of schools permitted students to use the library before or after school.
How often library is used for various purposes (table 13)
• On average, school libraries were used (during school and non-school hours): 5 times per week for groups of two or more classes at the same time; 11 times per week for one class only; 18 times per week for small groups (less than a full class); and 5 times per week by groups for non-library-related activities.
• Public school libraries were used more times per week for two or more classes at the same time and for one class only than Catholic schools and other private schools. Public school libraries were also used more often for small groups than other private schools� libraries.
• Overall, larger schools� libraries were used more often each week for two or more classes at the same time, one class only, and small groups than smaller schools. For example, the average number of times per week the library was used for the described activities was lower in schools with enrollments of 1�399 students compared to schools with 1,200 or more students.
How many students visit during a typical week (table 14)
• Thirty-one percent of school library media centers reported receiving 100 to 249 student visits (as individuals or groups) during a typical school week; 25 percent of school libraries reported student visits of 250 to 499 students per week; 19 percent of school libraries experienced 500 to 999 student visits during a typical school week; 11 percent of school libraries reported student visits of over 1000 students per week; and 15 percent of school library media centers reported receiving less than 100 student visits during a typical school week.
21 The apparent difference between rural and urban schools was not statistically significant.
14
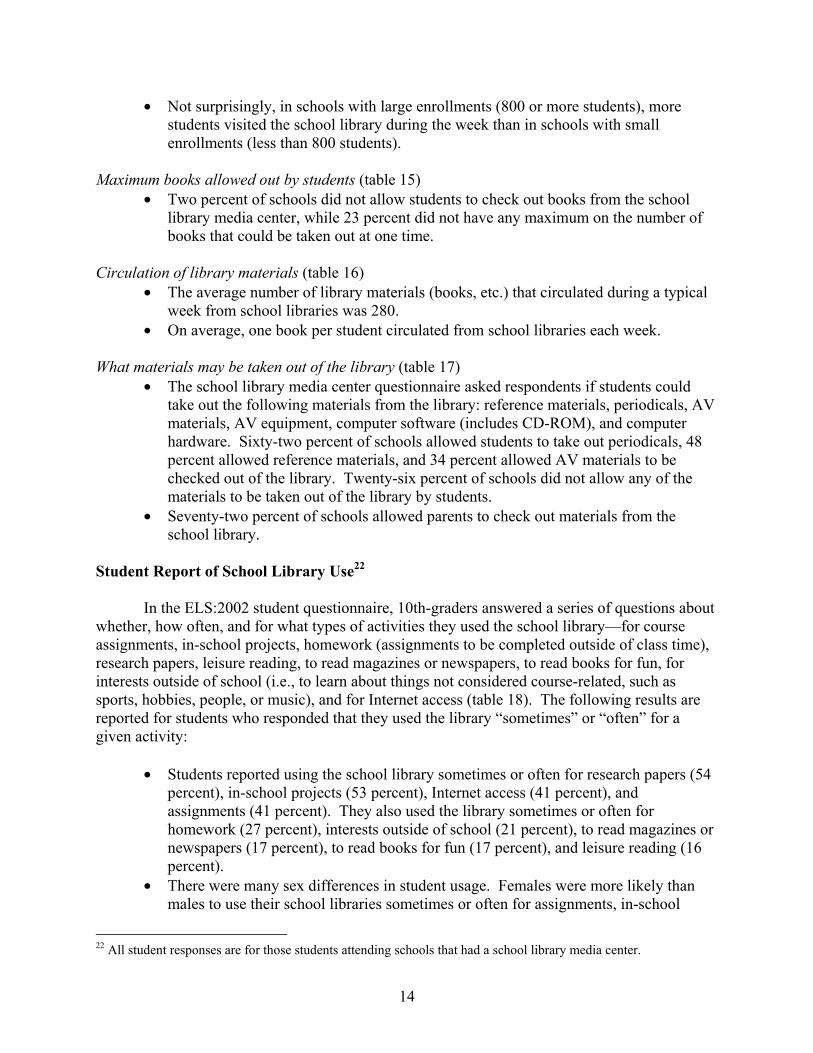
• Not surprisingly, in schools with large enrollments (800 or more students), more students visited the school library during the week than in schools with small enrollments (less than 800 students).
Maximum books allowed out by students (table 15)
• Two percent of schools did not allow students to check out books from the school library media center, while 23 percent did not have any maximum on the number of books that could be taken out at one time.
Circulation of library materials (table 16)
• The average number of library materials (books, etc.) that circulated during a typical week from school libraries was 280.
• On average, one book per student circulated from school libraries each week. What materials may be taken out of the library (table 17)
• The school library media center questionnaire asked respondents if students could take out the following materials from the library: reference materials, periodicals, AV materials, AV equipment, computer software (includes CD-ROM), and computer hardware. Sixty-two percent of schools allowed students to take out periodicals, 48 percent allowed reference materials, and 34 percent allowed AV materials to be checked out of the library. Twenty-six percent of schools did not allow any of the materials to be taken out of the library by students.
• Seventy-two percent of schools allowed parents to check out materials from the school library.
Student Report of School Library Use22
In the ELS:2002 student questionnaire, 10th-graders answered a series of questions about whether, how often, and for what types of activities they used the school library�for course assignments, in-school projects, homework (assignments to be completed outside of class time), research papers, leisure reading, to read magazines or newspapers, to read books for fun, for interests outside of school (i.e., to learn about things not considered course-related, such as sports, hobbies, people, or music), and for Internet access (table 18). The following results are reported for students who responded that they used the library �sometimes� or �often� for a given activity:
• Students reported using the school library sometimes or often for research papers (54 percent), in-school projects (53 percent), Internet access (41 percent), and assignments (41 percent). They also used the library sometimes or often for homework (27 percent), interests outside of school (21 percent), to read magazines or newspapers (17 percent), to read books for fun (17 percent), and leisure reading (16 percent).
• There were many sex differences in student usage. Females were more likely than males to use their school libraries sometimes or often for assignments, in-school
22 All student responses are for those students attending schools that had a school library media center.

15
projects, homework, research papers, and to read books for fun. Males were more likely than females to use the library sometimes or often for interests outside of school.
• Racial and ethnic differences in student usage were also apparent. American Indians, Asians, Blacks, Hispanics, and those who identified as Multiracial were more likely than Whites to use the school library sometimes or often for leisure reading and outside interests. American Indians, Blacks, and Hispanics were more likely than Asians to use the school library sometimes or often for outside interests. Asians, Blacks, Hispanics, and those who identified as Multiracial were also more likely than Whites to use the school library to read magazines or newspapers and to read books for fun. Asians, Hispanics, and Blacks were more likely than Whites to use the library for homework. Blacks were more likely than Whites and Hispanics to use the library for Internet access. Asians and Blacks were more likely than Hispanics to use the school library sometimes or often for in-school projects.
• Students from different socioeconomic (SES) backgrounds used school libraries for different reasons. Students from higher SES families were more likely to report using the school library sometimes or often for assignments and in-school projects than students from lower SES backgrounds.23 Students from lower SES families were more likely than those from higher SES families to use the school library sometimes or often for: leisure reading, to read magazines or newspapers, to read books for fun, and for interests outside of school. 24 Students from low-SES backgrounds were also more likely to use the library for homework than students from middle- or high-SES backgrounds.
• Students with different test scores also used the school library for different purposes. Students with higher tests scores were more likely than students with lower test scores to use the library sometimes or often for assignments, in-school projects, and research papers. 25 Students with lower test scores were more likely than students with higher test scores to use the library for homework, leisure reading, to read magazines or newspapers, and for outside interests. 26 In addition, students with low test scores were more likely than students with middle or high test scores to use the library to read books for fun.
• Students in other private schools reported greater usage of the school library sometimes or often for homework, leisure reading, and to read magazines or newspapers than students in public or Catholic schools. In addition, students in other private schools report greater usage of their school library than students in public schools for assignments and Internet access.
23 Household socioeconomic status (SES) was divided into three categories�high, middle, and low. See the notes in appendix A for details on variable construction. Students from high-SES families were more likely to use the library for assignments than students from middle- or low-SES families; students from middle-SES families were more likely to use the library for assignments than students from low-SES families. Students from high-SES families were more likely to use the library for in-school projects than students from middle- and low-SES families. 24 Low-SES students more than middle- and high-SES students; middle-SES students more than high-SES students. 25 Test scores are a composite of reading and math scores in 10th grade. Test scores were divided into three categories�high, middle, and low. See appendix A for details on variable construction. Here, students with high tests more than students with middle or low tests; students with middle tests more than students with low tests. 26 Students with low test scores more than students with middle or high test scores; students with middle test scores more than students with high test scores.
16
Student Attitudes Toward School Library
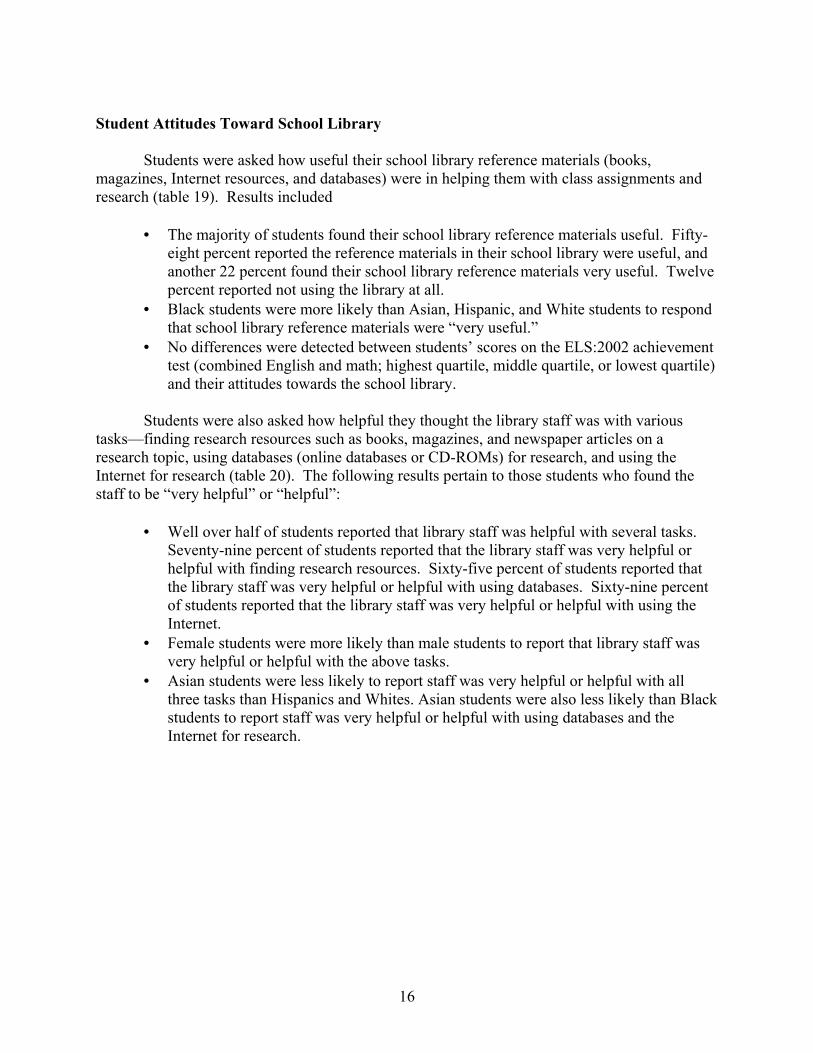
Students were asked how useful their school library reference materials (books, magazines, Internet resources, and databases) were in helping them with class assignments and research (table 19). Results included
• The majority of students found their school library reference materials useful. Fifty-eight percent reported the reference materials in their school library were useful, and another 22 percent found their school library reference materials very useful. Twelve percent reported not using the library at all.
• Black students were more likely than Asian, Hispanic, and White students to respond that school library reference materials were �very useful.�
• No differences were detected between students� scores on the ELS:2002 achievement test (combined English and math; highest quartile, middle quartile, or lowest quartile) and their attitudes towards the school library.
Students were also asked how helpful they thought the library staff was with various
tasks�finding research resources such as books, magazines, and newspaper articles on a research topic, using databases (online databases or CD-ROMs) for research, and using the Internet for research (table 20). The following results pertain to those students who found the staff to be �very helpful� or �helpful�:
• Well over half of students reported that library staff was helpful with several tasks. Seventy-nine percent of students reported that the library staff was very helpful or helpful with finding research resources. Sixty-five percent of students reported that the library staff was very helpful or helpful with using databases. Sixty-nine percent of students reported that the library staff was very helpful or helpful with using the Internet.
• Female students were more likely than male students to report that library staff was very helpful or helpful with the above tasks.
• Asian students were less likely to report staff was very helpful or helpful with all three tasks than Hispanics and Whites. Asian students were also less likely than Black students to report staff was very helpful or helpful with using databases and the Internet for research.

17
References
Bard, T.B., and Sakadi, E. (1981). School Libraries in the United States Since 1945. In M. Jackson (Ed.), International Handbook of Contemporary Developments in Librarianship (pp. 547-557). Westport, CT: Greenwood Press.
Chaney, B. (1998). School Library Media Centers: 1993-94 (NCES 98-282). U.S. Department of Education, National Center for Education Statistics. Washington, DC: U.S. Government Printing Office.
Craver, K.W. (1995). Shaping our Future : The Role of School Library Media Centers. School Library Media Quarterly, 24(1): 13-18.
Hamilton-Pennell, C., Lance, K.C., Rodney, M.J., and Hainer, E. (2000). Dick and Jane Go To the Head of the Class. School Library Journal, 46(4): 44-48.
Ingels, S.J., Pratt, D.J., Rogers, J., Siegel, P.H., and Stutts, E.S. (2004). Education Longitudinal Study of 2002: Base Year Data File User's Manual (NCES 2004�405). U.S. Department of Education. Washington, DC: National Center for Education Statistics.
Ingels, S.J., Burns, L.J., Charleston, S., Xianglei, C., and Cataldi, E.F. (forthcoming). A Profile of the American High School Sophomore (NCES 2005-338). U.S. Department of Education. Washington, DC: National Center for Education Statistics.
Lee, V.E. (2000). School Size and the Organization of Secondary Schools. In M.T. Hallinan (Ed.), Handbook of the Sociology of Education (pp. 327-344). New York: Kluwer Academic/Plenum Publishers.
Lemke, M., Lippman, L., Bairu, G., Calsyn, C., Kruger, T., Jocelyn, L., Kastberg, D., Liu, Y., Roey, S., and Williams, T. (2001). Outcomes of Learning: Results from the 2000 Program for International Student Assessment of 15-Year-Olds in Reading, Mathematics, and Science Literacy (NCES 2002�115). U.S. Department of Education, National Center for Education Statistics. Washington, DC: U.S. Government Printing Office.
Phtiaka, H. (1994). School Library: The Pupil View. Education Review, 46(3): 309-323. Seastrom, Marilyn. (2002). NCES Statistical Standards (NCES 2003-601). U.S. Department of
Education, National Center for Education Statistics. Washington, DC: U.S. Government Printing Office.

18
School characteristicPercentage with a school
library media center
Total 96.1 School sector Public 100.0 Catholic 100.0 Other private 80.8
School urbanicity Urban 99.1 Suburban 93.1 Rural 98.0
School region Northeast 95.0 Midwest 97.7 South 94.3 West 98.2
Grade span PK, K, 1, 2, 3, 4, or 5�12 87.6 6, 7, or 8�12 100.0 9�10, 11, 12 99.7 10�11, 12 100.0
School enrollment 1�399 92.6 400�799 100.0 800�1,199 100.0 1,200�1,599 100.0 1,600+ 100.0
Grade 10 percent free lunch1
0�5 percent 87.9 6�20 percent 100.0 21�50 percent 99.4 51�100 percent 100.0
NOTE: Detail may not sum to totals because of rounding.
Table 1. Percent of 10th-grade schools with a school library dd.dddddmedia center, by selected school characteristics: 2002
1Percentage of a school�s 10th-grade students that receive free or reduced-price lunch.
SOURCE: U.S. Department of Education, National Center for Education Statistics, Education Longitudinal Study of 2002 (ELS:2002), �Base Year, School Survey, 2002.�

19
Mean total seating capacity
(seats)
Centralized (one area in one
building) (percent)
Decentralized (collections or
services located in more than one
location) (percent)
Media center can accommodate full
class of students at one time (percent)
Media center can serve full class and
other activity1 at once (percent)
Total 69.2 92.6 7.4 89.6 80.5
School sector Public 73.3 96.4 3.6 94.2 83.2 Catholic 63.7 94.9 5.1 93.1 70.3 Other private 51.7 74.7 25.3 67.5 67.8
School urbanicity Urban 78.7 95.4 4.6 78.2 81.9 Suburban 72.7 94.9 5.1 92.8 81.4 Rural 59.6 88.3 11.7 92.6 78.8
School region Northeast 67.5 92.3 7.7 98.9 71.4 Midwest 66.7 90.4 9.6 89.5 78.6 South 72.8 91.8 8.2 87.1 87.5 West 66.9 97.4 2.6 87.0 78.5
Grade span PK, K, 1, 2, 3, 4, or 5� 12 49.1 85.7 14.3 72.3 88.7 6, 7, or 8�12 56.3 92.7 7.3 99.1 72.8 9�10, 11, 12 82.1 95.8 4.2 95.1 84.8 10�11, 12 99.8 98.3 1.7 100.0 94.2
School enrollment 1�399 46.0 85.0 15.0 81.2 70.5 400�799 62.9 98.4 1.6 97.7 79.5 800�1,199 88.5 98.6 1.4 88.8 92.0 1,200�1,599 111.0 97.3 2.7 100.0 96.0 1,600+ 128.4 96.0 4.0 98.9 97.4
Grade 10 percent free lunch2
0�5 percent 64.8 83.2 16.8 84.2 74.9 6�20 percent 76.6 95.2 4.8 95.9 91.2 21�50 percent 67.6 95.4 4.6 89.7 79.9 51�100 percent 64.9 97.4 2.6 85.0 73.31 Such as production activities, conferences, small group work, individual browsing.2 Percentage of a school�s 10th-grade students that receive free or reduced-price lunch.NOTE: Detail may not sum to totals because of rounding.
Library organization Space accommodations
Table 2. Mean total seating capacity of school library media centers and percent of school library media centers with ddddddd.different organizations and space accommodations, by selected school characteristics: 2002
SOURCE: U.S. Department of Education, National Center for Education Statistics, Education Longitudinal Study of 2002 (ELS:2002), �Base Year, Library Media Center Survey, 2002.�
School characteristic

20
Table 3. Percent of school library media centers with various work areas, by selected school characteristics: 2002
School characteristic Individual activity areas1
Small group activity areas2
Large group activity areas3
Staff work area4
Conference room
Computer access area or
lab
Total 65.3 65.7 80.1 81.9 31.6 96.8
School sector Public 65.1 67.2 81.4 86.8 35.4 98.1 Catholic 58.4 64.4 81.8 86.0 30.0 94.7 Other private 68.5 59.4 73.7 58.5 15.0 92.0
School urbanicity Urban 62.2 66.3 77.7 72.2 37.7 90.5 Suburban 64.7 63.3 83.1 88.9 31.4 97.9 Rural 67.9 68.1 78.0 79.6 28.3 99.4
School region Northeast 70.0 63.1 81.2 83.6 33.9 94.1 Midwest 63.2 61.4 77.1 83.6 31.0 99.4 South 67.8 72.5 81.7 84.2 30.5 96.2 West 60.2 61.1 80.2 74.1 32.7 96.8
Grade span PK, K, 1, 2, 3, 4, or 5�12 65.2 62.0 71.2 65.6 15.2 95.0 6, 7, or 8�12 55.6 63.0 82.9 78.8 27.7 96.0 9�10, 11, 12 68.2 68.5 83.3 90.6 40.4 97.9 10�11, 12 67.3 61.4 90.6 96.0 51.5 100
School enrollment 1�399 57.6 59.2 73.2 73.2 18.0 93.8 400�799 66.1 66.8 79.5 80.6 30.6 98.7 800�1,199 76.7 70.5 84.5 88.3 38.1 99.7 1,200�1,599 73.5 81.3 89.3 97.4 62.4 98.6 1,600+ 75.4 75.5 92.2 95.5 52.1 99.8
Grade 10 percent free lunch5
0�5 percent 69.7 62.0 76.8 71.8 29.1 94.0 6�20 percent 68.8 72.9 90.5 90.4 33.7 98.7 21�50 percent 67.0 66.7 76.2 82.6 32.0 100.0 51�100 percent 48.8 59.5 77.1 79.0 34.0 95.41 Area for individual reading, viewing, and listening.2 Area for five persons or less for viewing or listening.3 Area for more than five persons for viewing or listening.4 Area where staff order, label, etc.5 Percentage of a school�s 10th-grade students that receive free or reduced-price lunch.SOURCE: U.S. Department of Education, National Center for Education Statistics, Education Longitudinal Study of 2002 (ELS:2002), �Base Year, Library Media Center Survey, 2002.�

21
Fewer than 8,000
8,000�15,999
16,000�23,999
24,000 or more
Fewer than 250 250�999
1,000�1,749
1,750 or more
Total 38.8 36.1 18.9 6.2 60.5 31.1 7.1 1.3
School sector Public 32.4 39.0 22.3 6.3 56.1 34.7 7.7 1.5 Catholic 32.0 50.4 14.3 3.3 62.7 32.5 4.8 # Other private 69.5 18.8 4.7 7.0 79.1 14.8 5.2 0.8
School urbanicity Urban 42.6 28.3 18.1 11.0 56.0 31.4 10.3 2.3 Suburban 31.9 37.1 24.8 6.2 56.5 31.9 9.8 1.8 Rural 44.4 39.6 12.5 3.5 67.3 30.0 2.4 0.2
School region Northeast 31.1 34.4 26.6 7.9 60.0 32.5 6.1 1.4 Midwest 31.2 43.5 18.5 6.9 62.1 30.1 6.7 1.1 South 43.2 34.8 16.9 5.1 49.8 38.2 10.5 1.4 West 47.1 29.7 16.9 6.3 77.7 18.6 2.4 1.3
Grade span PK, K, 1, 2, 3, 4, or 5�12 58.2 25.8 12.5 3.5 77.8 16.5 5.2 0.5 6, 7, or 8�12 46.8 41.8 9.0 2.3 60.3 34.7 4.5 0.5 9�10, 11, 12 27.9 38.9 24.7 8.5 51.6 37.8 8.9 1.7 10�11, 12 6.1 56.7 24.1 13.2 53.5 30.7 7.9 7.9
School enrollment 1�399 60.1 28.8 8.6 2.5 77.8 21.1 1.1 # 400�799 32.5 46.1 18.5 2.9 54.8 37.7 7.5 # 800�1,199 18.2 53.7 23.1 5.0 38.7 44.6 14.3 2.4 1,200�1,599 3.9 40.0 43.0 13.1 41.2 42.5 16.3 # 1,600+ 1.1 29.3 41.6 28 35.3 31.6 22.1 11.0
Grade 10 percent free lunch1
0�5 percent 44.8 33.7 11.8 9.7 68.0 24.6 6.6 0.8 6�20 percent 38.5 32.9 22.4 6.2 55.0 38.2 3.9 2.9 21�50 percent 29.3 41.5 24.8 4.4 61.8 31.5 5.7 0.9 51�100 percent 49.4 34.1 12.8 3.7 61.7 28.5 8.4 1.4See notes at end of table.
2001 holdings�books (all copies)2001 holdings�video materials (tape,
DVD, or laser disc titles; not duplicates)School characteristic
Table 4. Percent of school library media centers with different amounts of library collections, by selected ddddddd.school characteristics: 2002

22
Fewer than 25 25�49 50�74 75 or more None 1�3 4�6 7 or more
Total 42.3 35.8 12.3 9.6 25.0 44.1 14.3 16.5
School sector Public 34.8 40.6 14.2 10.4 20.2 45.3 16.0 18.6 Catholic 49.8 29.6 14.8 5.9 37.1 28.1 18.8 16.0 Other private 73.6 16.2 3.1 7.0 42.8 44.0 5.7 7.6
School urbanicity Urban 46.2 29.2 12.3 12.3 29.6 38.6 14.4 17.4 Suburban 37.8 36.5 14.4 11.3 27.0 34.4 19.0 19.5 Rural 45.3 38.9 9.9 5.9 20.1 58.6 8.8 12.5
School region Northeast 34.3 39.6 12.7 13.5 17.2 35.3 21.3 26.3 Midwest 36.1 36.8 15.2 11.8 22.8 43.3 19.2 14.7 South 44.1 35.0 12.6 8.3 31.2 39.4 10.3 19.1 West 53.4 33.1 7.7 5.8 22.8 59.7 9.9 7.5
Grade span PK, K, 1, 2, 3, 4, or 5�12 64.8 31.2 1.4 2.7 30.9 54.2 5.2 9.7 6, 7, or 8�12 36.9 47.2 11.3 4.6 32.1 31.3 18.4 18.2 9�10, 11, 12 33.2 34.4 18.1 14.3 21.0 42.2 17.0 19.8 10�11, 12 34.2 45.7 8.2 11.9 # 55.3 34.9 9.8
School enrollment 1�399 59.3 30.4 6.4 3.9 36.3 46.4 10.1 7.2 400�799 35.1 45.5 11.5 7.8 22.0 44.1 14.0 19.9 800�1,199 27.0 42.2 13.6 17.2 16.0 43.4 16.9 23.7 1,200�1,599 19.6 34.2 26.5 19.7 4.3 38.9 26.7 30.1 1,600+ 19.7 33.7 24.7 21.9 6.1 42.6 22.9 28.5
Grade 10 percent free lunch1
0�5 percent 50.3 31.1 10.2 8.4 34.4 34.7 15.4 15.5 6�20 percent 37.2 33.2 15.1 14.5 15.3 49.4 13.1 22.3 21�50 percent 35.4 44.1 12.1 8.3 20.0 54.4 10.9 14.7 51�100 percent 42.4 40.0 10.9 6.7 36.2 34.0 14.1 15.6# Rounds to zero.1 Percentage of a school�s 10th-grade students that receive free or reduced-price lunch.NOTE: Detail may not sum to totals because of rounding.
Table 4. Percent of school library media centers with different amounts of library collections, by selected ddddddd.school characteristics: 2002�Continued
SOURCE: U.S. Department of Education, National Center for Education Statistics, Education Longitudinal Study of 2002 (ELS:2002), �Base Year, Library Media Center Survey, 2002.�
2001 holdings�periodical subscriptions (current print or microform subscriptions)
2001 holdings�electronic database subscriptions (online, CD-ROM, electronic journals, electronic books; not duplicates)School characteristic
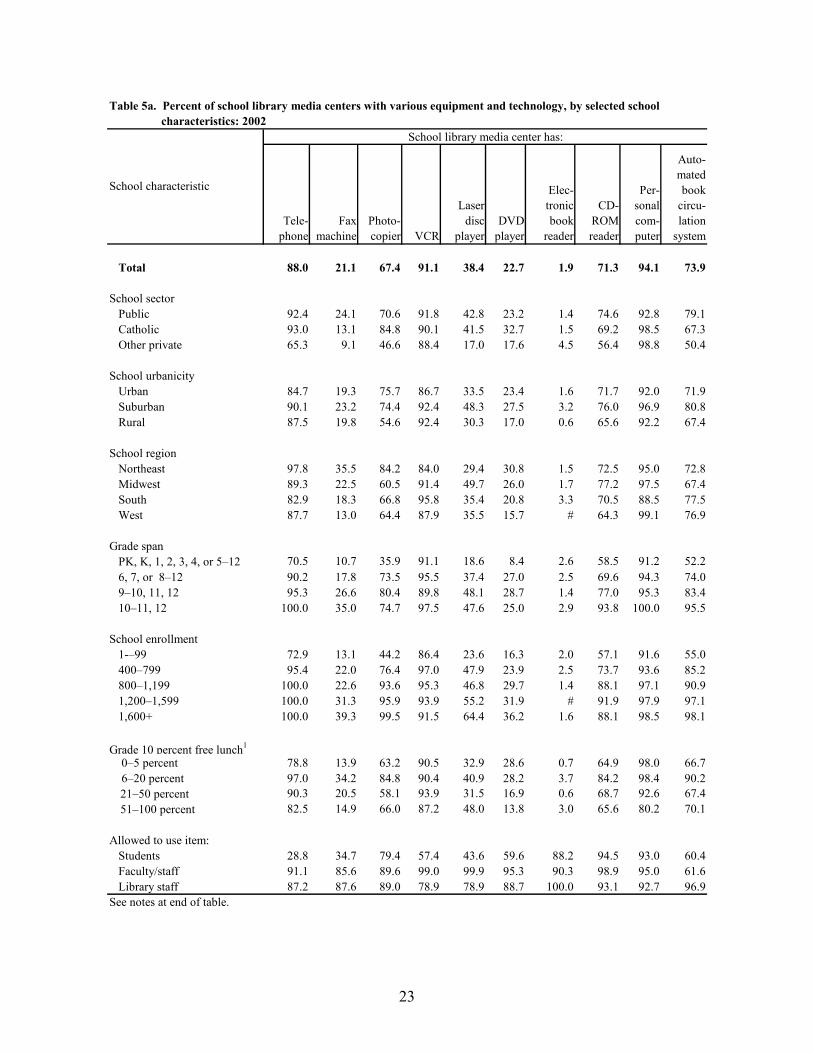
23
Tele-phone
Fax machine
Photo-copier VCR
Laser disc
playerDVD
player
Elec-tronic book
reader
CD-ROM reader
Per-sonal com-puter
Auto-mated book
circu-lation
system
Total 88.0 21.1 67.4 91.1 38.4 22.7 1.9 71.3 94.1 73.9
School sector Public 92.4 24.1 70.6 91.8 42.8 23.2 1.4 74.6 92.8 79.1 Catholic 93.0 13.1 84.8 90.1 41.5 32.7 1.5 69.2 98.5 67.3 Other private 65.3 9.1 46.6 88.4 17.0 17.6 4.5 56.4 98.8 50.4
School urbanicity Urban 84.7 19.3 75.7 86.7 33.5 23.4 1.6 71.7 92.0 71.9 Suburban 90.1 23.2 74.4 92.4 48.3 27.5 3.2 76.0 96.9 80.8 Rural 87.5 19.8 54.6 92.4 30.3 17.0 0.6 65.6 92.2 67.4
School region Northeast 97.8 35.5 84.2 84.0 29.4 30.8 1.5 72.5 95.0 72.8 Midwest 89.3 22.5 60.5 91.4 49.7 26.0 1.7 77.2 97.5 67.4 South 82.9 18.3 66.8 95.8 35.4 20.8 3.3 70.5 88.5 77.5 West 87.7 13.0 64.4 87.9 35.5 15.7 # 64.3 99.1 76.9
Grade span PK, K, 1, 2, 3, 4, or 5�12 70.5 10.7 35.9 91.1 18.6 8.4 2.6 58.5 91.2 52.2 6, 7, or 8�12 90.2 17.8 73.5 95.5 37.4 27.0 2.5 69.6 94.3 74.0 9�10, 11, 12 95.3 26.6 80.4 89.8 48.1 28.7 1.4 77.0 95.3 83.4 10�11, 12 100.0 35.0 74.7 97.5 47.6 25.0 2.9 93.8 100.0 95.5
School enrollment 1-�99 72.9 13.1 44.2 86.4 23.6 16.3 2.0 57.1 91.6 55.0 400�799 95.4 22.0 76.4 97.0 47.9 23.9 2.5 73.7 93.6 85.2 800�1,199 100.0 22.6 93.6 95.3 46.8 29.7 1.4 88.1 97.1 90.9 1,200�1,599 100.0 31.3 95.9 93.9 55.2 31.9 # 91.9 97.9 97.1 1,600+ 100.0 39.3 99.5 91.5 64.4 36.2 1.6 88.1 98.5 98.1
Grade 10 percent free lunch1
0�5 percent 78.8 13.9 63.2 90.5 32.9 28.6 0.7 64.9 98.0 66.7 6�20 percent 97.0 34.2 84.8 90.4 40.9 28.2 3.7 84.2 98.4 90.2
21�50 percent 90.3 20.5 58.1 93.9 31.5 16.9 0.6 68.7 92.6 67.451�100 percent 82.5 14.9 66.0 87.2 48.0 13.8 3.0 65.6 80.2 70.1
Allowed to use item: Students 28.8 34.7 79.4 57.4 43.6 59.6 88.2 94.5 93.0 60.4 Faculty/staff 91.1 85.6 89.6 99.0 99.9 95.3 90.3 98.9 95.0 61.6 Library staff 87.2 87.6 89.0 78.9 78.9 88.7 100.0 93.1 92.7 96.9See notes at end of table.
School library media center has:
School characteristic
Table 5a. Percent of school library media centers with various equipment and technology, by selected school dddddd.d characteristics: 2002
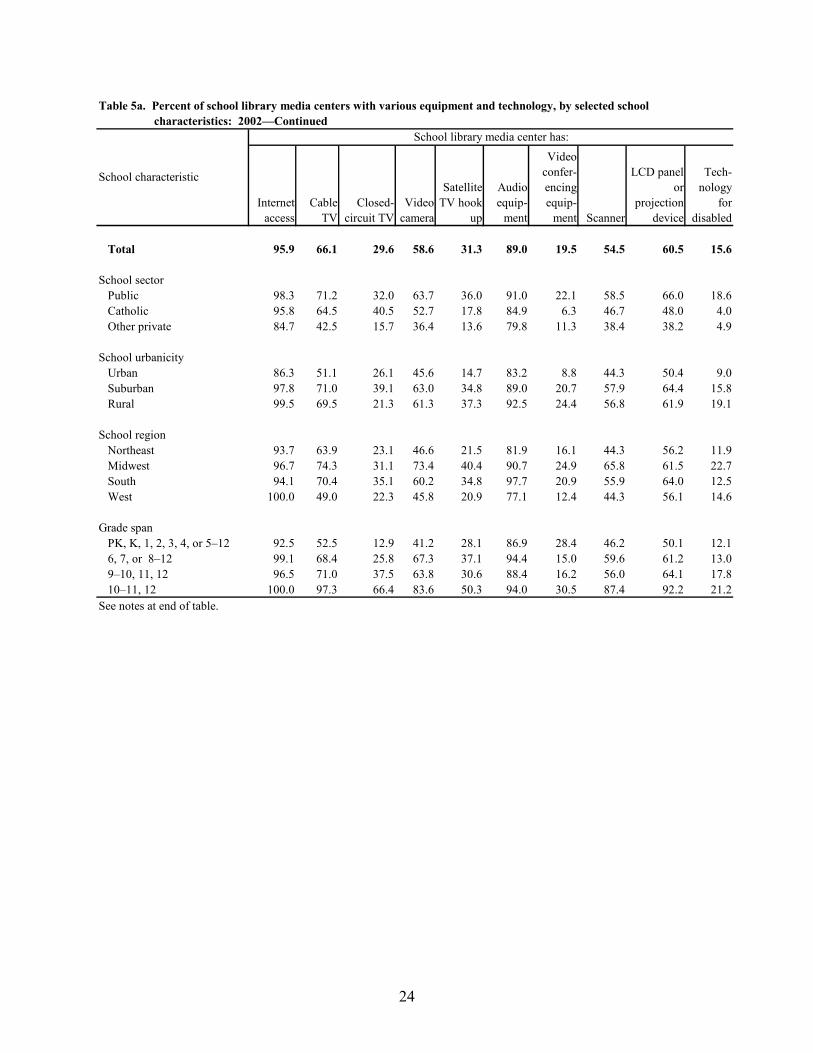
24
Total 95.9 66.1 29.6 58.6 31.3 89.0 19.5 54.5 60.5 15.6
School sector Public 98.3 71.2 32.0 63.7 36.0 91.0 22.1 58.5 66.0 18.6 Catholic 95.8 64.5 40.5 52.7 17.8 84.9 6.3 46.7 48.0 4.0 Other private 84.7 42.5 15.7 36.4 13.6 79.8 11.3 38.4 38.2 4.9
School urbanicity Urban 86.3 51.1 26.1 45.6 14.7 83.2 8.8 44.3 50.4 9.0 Suburban 97.8 71.0 39.1 63.0 34.8 89.0 20.7 57.9 64.4 15.8 Rural 99.5 69.5 21.3 61.3 37.3 92.5 24.4 56.8 61.9 19.1
School region Northeast 93.7 63.9 23.1 46.6 21.5 81.9 16.1 44.3 56.2 11.9 Midwest 96.7 74.3 31.1 73.4 40.4 90.7 24.9 65.8 61.5 22.7 South 94.1 70.4 35.1 60.2 34.8 97.7 20.9 55.9 64.0 12.5 West 100.0 49.0 22.3 45.8 20.9 77.1 12.4 44.3 56.1 14.6
Grade span PK, K, 1, 2, 3, 4, or 5�12 92.5 52.5 12.9 41.2 28.1 86.9 28.4 46.2 50.1 12.1 6, 7, or 8�12 99.1 68.4 25.8 67.3 37.1 94.4 15.0 59.6 61.2 13.0 9�10, 11, 12 96.5 71.0 37.5 63.8 30.6 88.4 16.2 56.0 64.1 17.8 10�11, 12 100.0 97.3 66.4 83.6 50.3 94.0 30.5 87.4 92.2 21.2See notes at end of table.
Table 5a. Percent of school library media centers with various equipment and technology, by selected school dddddd.d dddddddd.characteristics: 2002�Continued
School library media center has:
Internet access
Cable TV
Closed-circuit TV
Video camera
Satellite TV hook-
up
Audio equip-
ment
Video confer-encing equip-
ment Scanner
Tech-nology
for disabled
LCD panel or
projection device
School characteristic
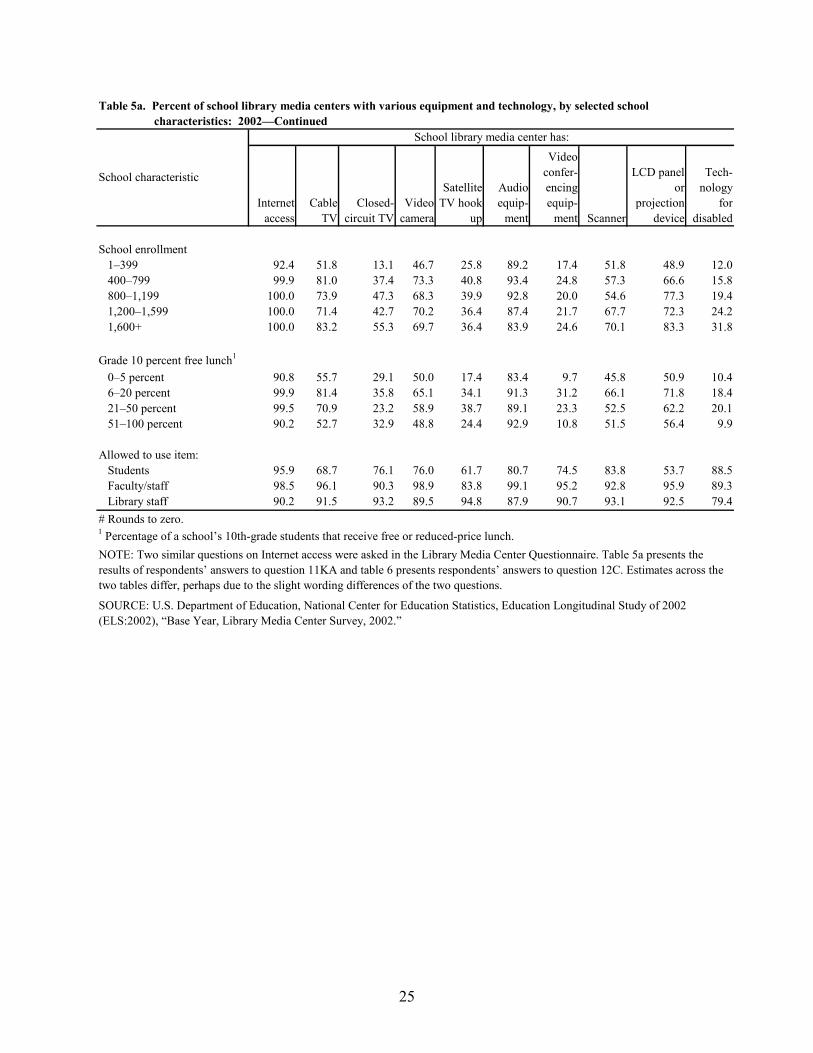
25
School enrollment 1�399 92.4 51.8 13.1 46.7 25.8 89.2 17.4 51.8 48.9 12.0 400�799 99.9 81.0 37.4 73.3 40.8 93.4 24.8 57.3 66.6 15.8 800�1,199 100.0 73.9 47.3 68.3 39.9 92.8 20.0 54.6 77.3 19.4 1,200�1,599 100.0 71.4 42.7 70.2 36.4 87.4 21.7 67.7 72.3 24.2 1,600+ 100.0 83.2 55.3 69.7 36.4 83.9 24.6 70.1 83.3 31.8
Grade 10 percent free lunch1
0�5 percent 90.8 55.7 29.1 50.0 17.4 83.4 9.7 45.8 50.9 10.4 6�20 percent 99.9 81.4 35.8 65.1 34.1 91.3 31.2 66.1 71.8 18.4 21�50 percent 99.5 70.9 23.2 58.9 38.7 89.1 23.3 52.5 62.2 20.1 51�100 percent 90.2 52.7 32.9 48.8 24.4 92.9 10.8 51.5 56.4 9.9
Allowed to use item: Students 95.9 68.7 76.1 76.0 61.7 80.7 74.5 83.8 53.7 88.5 Faculty/staff 98.5 96.1 90.3 98.9 83.8 99.1 95.2 92.8 95.9 89.3 Library staff 90.2 91.5 93.2 89.5 94.8 87.9 90.7 93.1 92.5 79.4# Rounds to zero.1 Percentage of a school�s 10th-grade students that receive free or reduced-price lunch.
Table 5a. Percent of school library media centers with various equipment and technology, by selected school dddddd.d dddddddd.characteristics: 2002�Continued
School characteristic
School library media center has:
Internet access
Cable TV
Closed-circuit TV
Video camera
Satellite TV hook-
up
Audio equip-
ment
Video confer-encing equip-
ment
NOTE: Two similar questions on Internet access were asked in the Library Media Center Questionnaire. Table 5a presents the results of respondents� answers to question 11KA and table 6 presents respondents� answers to question 12C. Estimates across the two tables differ, perhaps due to the slight wording differences of the two questions.
SOURCE: U.S. Department of Education, National Center for Education Statistics, Education Longitudinal Study of 2002 (ELS:2002), �Base Year, Library Media Center Survey, 2002.�
Scanner
LCD panel or
projection device
Tech-nology
for disabled
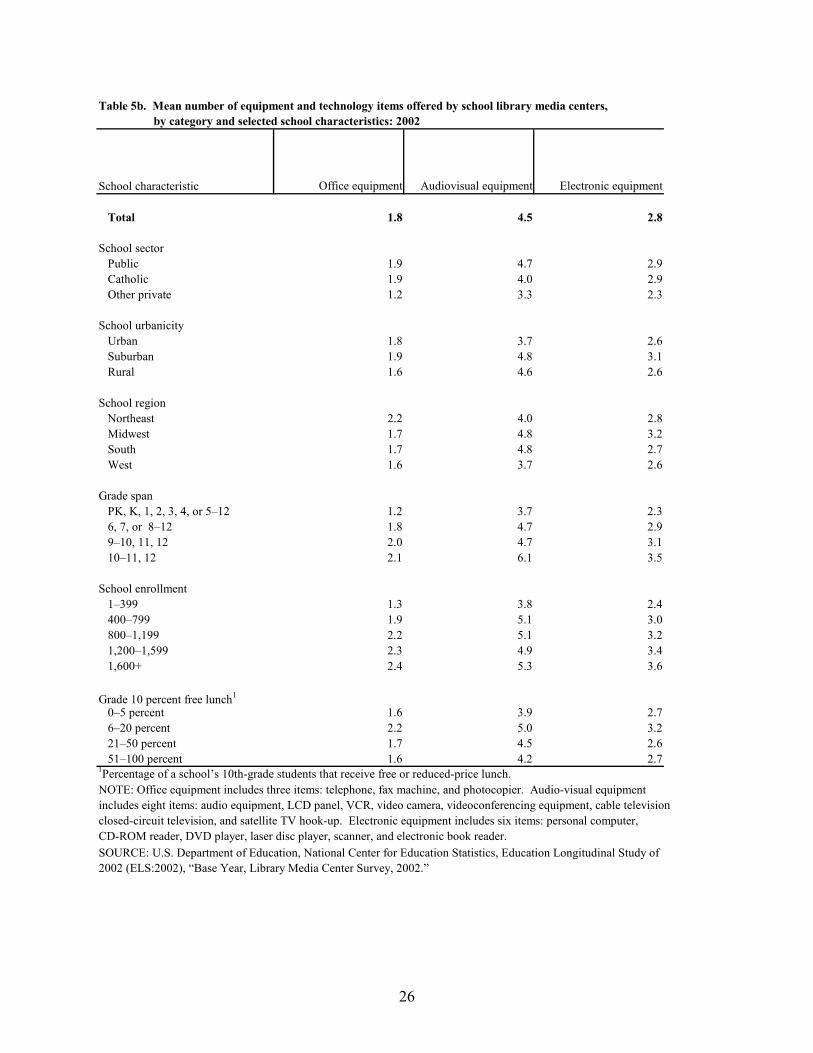
26
Office equipment Audiovisual equipment Electronic equipment
Total 1.8 4.5 2.8
School sector Public 1.9 4.7 2.9 Catholic 1.9 4.0 2.9 Other private 1.2 3.3 2.3
School urbanicity Urban 1.8 3.7 2.6 Suburban 1.9 4.8 3.1 Rural 1.6 4.6 2.6
School region Northeast 2.2 4.0 2.8 Midwest 1.7 4.8 3.2 South 1.7 4.8 2.7 West 1.6 3.7 2.6
Grade span PK, K, 1, 2, 3, 4, or 5�12 1.2 3.7 2.3 6, 7, or 8�12 1.8 4.7 2.9 9�10, 11, 12 2.0 4.7 3.1 10�11, 12 2.1 6.1 3.5
School enrollment 1�399 1.3 3.8 2.4 400�799 1.9 5.1 3.0 800�1,199 2.2 5.1 3.2 1,200�1,599 2.3 4.9 3.4 1,600+ 2.4 5.3 3.6
Grade 10 percent free lunch1
0�5 percent 1.6 3.9 2.7 6�20 percent 2.2 5.0 3.2 21�50 percent 1.7 4.5 2.6 51�100 percent 1.6 4.2 2.71Percentage of a school�s 10th-grade students that receive free or reduced-price lunch.
School characteristic
Table 5b. Mean number of equipment and technology items offered by school library media centers, ddddddd.. by category and selected school characteristics: 2002
SOURCE: U.S. Department of Education, National Center for Education Statistics, Education Longitudinal Study of 2002 (ELS:2002), �Base Year, Library Media Center Survey, 2002.�
includes eight items: audio equipment, LCD panel, VCR, video camera, videoconferencing equipment, cable televisionclosed-circuit television, and satellite TV hook-up. Electronic equipment includes six items: personal computer, CD-ROM reader, DVD player, laser disc player, scanner, and electronic book reader.
NOTE: Office equipment includes three items: telephone, fax machine, and photocopier. Audio-visual equipment

27
Table 6. Percent of school library media centers with various services, by selected school characteristics: 2002
Online catalog
Other libraries�
online catalogs
Internet access
Email or chat room access
Educational software1
Multimedia production
facility2
Total 69.2 60.5 96.0 67.8 70.2 17.6
School sector Public 76.2 62.4 99.4 68.2 69.8 19.3 Catholic 67.3 66.2 95.7 58.4 72.3 19.6 Other private 36.5 49.9 79.7 69.0 71.6 8.8
School urbanicity Urban 66.2 62.1 92.3 65.5 65.0 11.0 Suburban 76.7 57.2 95.7 66.0 72.2 18.5 Rural 62.5 63.4 98.5 71.4 71.1 20.5
School region Northeast 78.7 76.2 93.7 63.4 65.8 15.7 Midwest 68.5 68.9 96.8 65.5 78.4 23.1 South 71.6 54.8 96.4 70.8 76.0 18.6 West 58.4 47.8 96.0 69.1 52.5 9.4
Grade span PK, K, 1, 2, 3, 4, or 5�12 41.1 47.4 89.5 69.6 78.0 22.9 6, 7, or 8�12 67.1 66.9 96.8 62.0 66.4 15.0 9�10, 11, 12 83.4 65.0 98.8 68.8 67.3 15.3 10�11, 12 68.2 65.4 100.0 62.7 77.3 34.5
School enrollment 1�399 48.7 47.9 93.7 68.5 69.8 16.4 400�799 75.2 61.8 98.3 61.6 67.1 18.0 800�1,199 84.6 71.8 99.3 86.1 78.7 21.4 1,200�1,599 91.4 79.7 100.0 60.2 76.0 18.4 1,600+ 97.1 76.2 100.0 68.7 75.5 26.0
Grade 10 percent free lunch5
0�5 percent 61.0 60.6 87.9 65.8 72.2 9.4 6�20 percent 86.0 84.3 99.9 56.7 67.9 29.8 21�50 percent 65.5 54.4 99.5 73.9 74.6 17.7 51�100 percent 63.1 41.0 99.0 80.2 57.6 12.5See notes at end of table.
School library media center has:
School characteristic

28
Total 88.1 82.1 62.1 56.0 62.0
School sector Public 92.5 87.9 67.6 59.4 66.7 Catholic 84.3 78.8 60.8 54.6 46.1 Other private 69.0 55.4 36.5 40.4 44.7
School urbanicity Urban 78.5 71.0 53.9 54.2 51.2 Suburban 85.2 77.2 62.9 55.8 59.2 Rural 97.0 94.1 66.0 57.2 71.7
School region Northeast 87.6 85.1 56.9 67.1 66.0 Midwest 94.7 89.2 71.4 63.2 64.4 South 86.8 80.8 60.8 57.4 58.5 West 82.0 72.7 56.2 35.3 62.1
Grade spanPK, K, 1, 2, 3, 4, or 5�12 80.3 73.4 50.4 46.5 46.5
6, 7, or 8�12 89.4 79.8 72.4 50.5 65.5 9�10, 11, 12 91.0 86.3 64.1 61.5 67.7 10�11, 12 97.4 100.0 81.7 77.7 72.9
School enrollment 1�399 86.2 76.2 55.6 42.4 49.8 400�799 85.2 83.8 63.4 59.0 69.9 800�1,199 97.3 89.9 74.3 78.5 67.7 1,200�1,599 96.8 96.8 69.5 75.7 80.2 1,600+ 96.2 97.7 76.6 70.1 80.7
Grade 10 percent free lunch5
0�5 percent 79.4 73.0 49.0 52.5 53.3 6�20 percent 92.2 90.6 66.1 77.4 81.1 21�50 percent 97.0 93.0 67.7 50.5 63.2 51�100 percent 80.7 70.2 63.4 48.8 48.11Examples include CD-ROMs and Math Blasters.
3 Examples include encyclopedias and dictionaries.4 Education, business/management, humanities, science/engineering/math, or English databases (e.g., ERIC, Science Direct).5 Percentage of a school�s 10th-grade students that receive free or reduced-price lunch.
Table 6. Percent of school library media centers with various services, by selected school characteristics: ddddddd.2002�Continued
2 A multimedia production facility is a studio containing a computers and equipment using text, full-color images and graphics, video, animation, and
School library media center has:
General articles and news databases
College and career databases
Academic subject databases4
Electronic full-text books,
journals, references, or
magazines
NOTE: Two similar questions on Internet access were asked in the Library Media Center Questionnaire. Table 5a presents the results of respondents� answers to question 11KA and table 6 presents respondents� answers to question 12C. Estimates across the two tables differ, perhaps due to the slight wording differences of the two questions.
School characteristic Reference and bibliography
database3
SOURCE: U.S. Department of Education, National Center for Education Statistics, Education Longitudinal Study of 2002 (ELS:2002), �Base Year, Library Media Center Survey, 2002.�
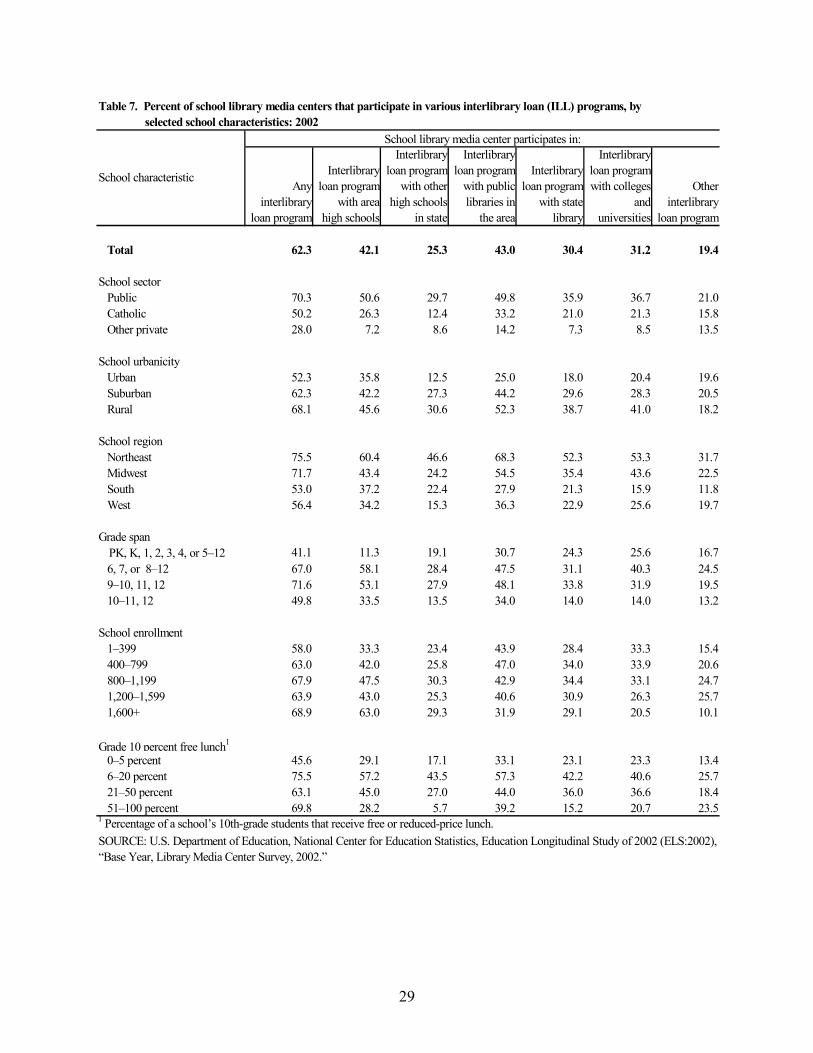
29
Total 62.3 42.1 25.3 43.0 30.4 31.2 19.4
School sector Public 70.3 50.6 29.7 49.8 35.9 36.7 21.0 Catholic 50.2 26.3 12.4 33.2 21.0 21.3 15.8 Other private 28.0 7.2 8.6 14.2 7.3 8.5 13.5
School urbanicity Urban 52.3 35.8 12.5 25.0 18.0 20.4 19.6 Suburban 62.3 42.2 27.3 44.2 29.6 28.3 20.5 Rural 68.1 45.6 30.6 52.3 38.7 41.0 18.2
School region Northeast 75.5 60.4 46.6 68.3 52.3 53.3 31.7 Midwest 71.7 43.4 24.2 54.5 35.4 43.6 22.5 South 53.0 37.2 22.4 27.9 21.3 15.9 11.8 West 56.4 34.2 15.3 36.3 22.9 25.6 19.7
Grade spanPK, K, 1, 2, 3, 4, or 5�12 41.1 11.3 19.1 30.7 24.3 25.6 16.7
6, 7, or 8�12 67.0 58.1 28.4 47.5 31.1 40.3 24.5 9�10, 11, 12 71.6 53.1 27.9 48.1 33.8 31.9 19.5 10�11, 12 49.8 33.5 13.5 34.0 14.0 14.0 13.2
School enrollment 1�399 58.0 33.3 23.4 43.9 28.4 33.3 15.4 400�799 63.0 42.0 25.8 47.0 34.0 33.9 20.6 800�1,199 67.9 47.5 30.3 42.9 34.4 33.1 24.7 1,200�1,599 63.9 43.0 25.3 40.6 30.9 26.3 25.7 1,600+ 68.9 63.0 29.3 31.9 29.1 20.5 10.1
Grade 10 percent free lunch1
0�5 percent 45.6 29.1 17.1 33.1 23.1 23.3 13.4 6�20 percent 75.5 57.2 43.5 57.3 42.2 40.6 25.7 21�50 percent 63.1 45.0 27.0 44.0 36.0 36.6 18.4 51�100 percent 69.8 28.2 5.7 39.2 15.2 20.7 23.51 Percentage of a school�s 10th-grade students that receive free or reduced-price lunch.
Table 7. Percent of school library media centers that participate in various interlibrary loan (ILL) programs, by ddddddd.selected school characteristics: 2002
Interlibrary loan program with colleges
and universities
School characteristic
SOURCE: U.S. Department of Education, National Center for Education Statistics, Education Longitudinal Study of 2002 (ELS:2002), �Base Year, Library Media Center Survey, 2002.�
School library media center participates in:
Any interlibrary
loan program
Interlibrary loan program
with area high schools
Interlibrary loan program
with other high schools
in state
Interlibrary loan program
with public libraries in
the area
Interlibrary loan program
with state library
Other interlibrary
loan program

30
None $1�$2,499 $2,500�$4,999 $5,000�$9,999 $10,000 or more
Total 20.9 36.1 13.4 10.1 19.5
School sector Public 20.6 34.8 12.5 10.6 21.5 Catholic 18.0 31.8 22.0 14.0 14.2 Other private 22.7 42.7 14.9 7.0 12.6
School urbanicity Urban 26.2 32.5 12.3 12.4 16.6 Suburban 24.8 31.2 15.1 10.0 18.9 Rural 12.9 44.2 12.1 8.8 22.0
School region Northeast 30.4 32.6 8.1 6.9 22.0 Midwest 18.6 29.7 20.9 9.2 21.6 South 16.9 41.7 12.1 11.3 18.0 West 23.5 37.4 9.9 11.7 17.5
Grade span PK, K, 1, 2, 3, 4, or 5�12 16.1 39.1 10.6 7.3 26.9 6, 7, or 8�12 36.0 36.0 7.7 10.2 10.0 9�10, 11, 12 19.5 34.5 16.6 11.6 17.9 10�11, 12 6.2 40.8 10.6 4.5 37.9
School enrollment 1�399 20.3 40.9 14.0 6.7 18.0 400�799 27.0 38.9 12.3 7.6 14.1 800�1,199 19.6 31.0 13.2 16.0 20.1 1,200�1,599 19.8 21.4 13.3 16.6 28.9 1,600+ 9.3 19.9 16.8 17.1 36.9
Grade 10 percent free lunch1
0�5 percent 20.6 40.7 14.3 6.7 17.7 6�20 percent 16.7 35.2 14.3 11.1 22.7 21�50 percent 15.1 38.8 12.7 7.4 26.0 51�100 percent 30.1 30.6 6.9 21.6 10.91 Percentage of a school�s 10th-grade students that receive free or reduced-price lunch.NOTE: Detail may not sum to totals because of rounding.
Total spent on computer hardware during 2000�2001 school yearSchool characteristic
Table 8. Percent distribution of school library media centers� expenditures on computer hardware (other ddddddd.than communications equipment), by selected school characteristics: 2002
SOURCE: U.S. Department of Education, National Center for Education Statistics, Education Longitudinal Study of 2002 (ELS:2002), �Base Year, Library Media Center Survey, 2002.�

31
School characteristic Staff includes state-certified
librarians
Library staff includes state-
certified teachers
Library staff includes non-
certified professionals
Staff includes paid library
aides
Volunteers provide library
services
Total 76.4 35.3 22.6 51.1 48.7
School sector Public 86.5 35.7 15.2 57.0 45.4 Catholic 66.3 30.4 40.1 33.6 54.2 Other private 33.1 34.9 49.3 30.2 61.5
School urbanicity Urban 65.8 19.8 43.0 49.8 51.3 Suburban 77.4 38.8 22.8 51.6 54.7 Rural 81.3 40.1 9.8 51.4 39.8
School region Northeast 80.8 35.7 19.9 54.2 44.5 Midwest 72.8 44.5 20.4 61.3 50.6 South 85.7 28.3 21.8 39.7 39.0 West 60.7 34.5 29.0 55.2 68.3
Grade span PK, K, 1, 2, 3, 4, or 5�12 51.7 43.2 31.6 45.1 54.1 6, 7, or 8�12 84.6 28.3 5.4 39.1 43.2 9�10, 11, 12 85.4 33.8 23.8 57.0 47.4 10�11, 12 100.0 23.0 8.9 75.5 59.6
School enrollment 1�399 60.5 38.4 26.4 36.9 45.3 400�799 89.1 29.6 12.6 58.4 45.3 800�1,199 89.4 35.2 21.5 58.9 50.8 1,200�1,599 93.3 32.7 21.3 75.7 58.9 1,600+ 96.0 38.5 16.8 83.9 51.4
Grade 10 percent free lunch1
0�5 percent 60.2 33.6 36.5 46.1 55.7 6�20 percent 90.0 30.2 13.3 62.7 43.4 21�50 percent 78.3 44.3 14.2 56.6 41.7 51�100 percent 72.7 31.2 29.6 36.0 50.71 Percentage of a school�s 10th-grade students that receive free or reduced-price lunch.SOURCE: U.S. Department of Education, National Center for Education Statistics, Education Longitudinal Study of 2002 (ELS:2002), �Base Year, Library Media Center Survey, 2002.�
Table 9. Percent of school library media centers with various staff members, by selected school dddddd.rcharacteristics: 2002

32
NeverOnce during
the year
Once or twice a semester or
term Monthly WeeklyMore than
once a week
Total 15.6 1.3 24.3 24.0 17.1 17.8
School sector Public 11.1 1.5 24.9 26.9 19.2 16.3 Catholic 13.0 0.9 29.2 31.0 16.2 9.7 Other private 39.7 # 19.1 6.3 6.5 28.3
School urbanicity Urban 15.0 0.2 21.2 23.3 19.6 20.7 Suburban 11.2 0.6 20.7 23.7 21.1 22.8 Rural 20.8 2.6 29.9 24.6 11.3 10.8
School region Northeast 3.7 # 20.1 29.8 27.9 18.5 Midwest 10.8 1.4 24.1 31.2 14.3 18.2 South 17.3 1.7 23.2 19.0 19.7 19.1 West 29.2 1.1 30.0 17.8 7.6 14.3
Grade span PK, K, 1, 2, 3, 4, or 5�12 46.7 1.3 14.8 13.8 4.7 18.6 6, 7, or 8�12 3.8 3.5 29.6 36.2 10.8 16.2 9�10, 11, 12 4.1 0.6 27.4 25.1 25.3 17.6 10�11, 12 # # 23.3 36.2 14.6 25.9
School enrollment 1�399 30.2 1.5 35.5 16.6 5.8 10.5 400�799 9.1 1.4 20.0 33.8 21.8 13.9 800�1,199 1.2 1.0 15.7 24.5 30.5 27.1 1,200�1,599 0.6 0.7 19.9 29.2 27.0 22.7 1,600+ 1.7 1.5 12.1 21.4 25.3 37.9
Grade 10 percent free lunch1
0�5 percent 24.0 0.2 17.9 20.9 18.3 18.6 6�20 percent 10.7 0.2 25.0 25.4 18.6 20.0 21�50 percent 15.8 1.5 23.2 32.8 13.1 13.6 51�100 percent # 1.2 39.5 12.6 21.0 25.6# Rounds to zero.1 Percentage of a school�s 10th-grade students that receive free or reduced-price lunch.NOTE: Detail may not sum to totals because of rounding.
How frequently worked with English teachers during the 2001�2002 school year
School characteristic
SOURCE: U.S. Department of Education, National Center for Education Statistics, Education Longitudinal Study of 2002 (ELS:2002), �Base Year, Library Media Center Survey, 2002.�
Table 10. Percent distribution of how frequently school library media center survey respondents worked with dd.rdddddEnglish teachers to plan and deliver instruction, by selected school characteristics: 2002

33
NeverOnce during
the year
Once or twice a semester or
term Monthly WeeklyMore than
once a week
Total 49.1 13.7 26.4 7.8 1.7 1.3
School sector Public 46.2 15.2 28.7 8.0 1.4 0.4 Catholic 51.9 16.0 24.0 5.5 2.7 # Other private 63.5 5.0 15.2 7.8 2.6 5.9
School urbanicity Urban 42.7 17.8 22.9 8.2 3.9 4.6 Suburban 40.3 17.4 31.8 8.7 1.2 0.7 Rural 61.8 7.7 22.5 6.7 1.1 0.1
School region Northeast 35.6 23.4 30.5 10.3 # 0.2 Midwest 50.8 11.4 31.1 4.6 2.1 # South 46.3 11.3 29.3 10.4 2.5 0.1 West 62.4 14.3 11.0 5.6 0.7 6.0
Grade span PK, K, 1, 2, 3, 4, or 5�12 70.8 5.5 13.7 6.7 # 3.3 6, 7, or 8�12 38.9 16.1 30.4 13.3 1.3 # 9�10, 11, 12 42.0 16.8 31.2 6.8 2.5 0.7 10�11, 12 29.6 18.9 39.0 7.6 5.0 #
School enrollment 1�399 70.6 3.6 19.1 5.4 1.4 # 400�799 43.7 13.2 30.0 10.0 2.0 1.1 800�1,199 35.7 25.9 26.3 2.5 1.5 8.1 1,200�1,599 25.1 30.2 27.0 14.5 3.2 # 1,600+ 27.4 17.5 43.5 9.8 1.4 0.5
Grade 10 percent free lunch1
0�5 percent 51.3 16.8 24.4 5.3 2.2 # 6�20 percent 44.7 15.3 27.0 10.3 1.6 1.2 21�50 percent 53.3 6.4 28.7 9.9 1.4 0.3 51�100 percent 38.8 20.4 24.8 4.6 2.9 8.6# Rounds to zero.1 Percentage of a school�s 10th-grade students that receive free or reduced-price lunch.NOTE: Detail may not sum to totals because of rounding.
How frequently worked with math teachers during the 2001�2002 school year
SOURCE: U.S. Department of Education, National Center for Education Statistics, Education Longitudinal Study of 2002 (ELS:2002), �Base Year, Library Media Center Survey, 2002.�
School characteristic
Table 11. Percent distribution of how frequently school library media center survey respondents worked ddddddddwith math teachers to plan and deliver instruction, by selected school characteristics: 2002

34
During scheduled
periods/set times Anytime
Students may use
library on own before
or after school
Students may use
library on own during lunch break
Students may use
library on own during
set times throughout
the day
Students may use
library on own between
classes or during recess
Students may use
library on own at other
time
Total 32.6 67.4 69.9 59.2 75.2 52.1 24.3
School sector Public 29.0 71.0 80.0 66.3 77.4 64.1 21.4 Catholic 34.1 65.9 66.3 70.6 79.5 42.9 30.8 Other private 48.0 52.0 42.0 36.5 68.3 20.0 31.1
School urbanicity Urban 45.2 54.8 55.9 42.4 75.2 35.5 24.9 Suburban 30.0 70.0 68.9 59.1 71.9 51.8 39.3 Rural 28.1 71.9 83.4 74.0 79.2 67.1 6.3
School region Northeast 30.6 69.4 78.0 76.5 81.9 34.6 14.9 Midwest 30.1 69.9 85.7 58.1 87.8 65.1 16.7 South 30.1 69.9 56.4 50.8 64.4 41.9 32.1 West 42.0 58.0 66.2 61.2 72.3 61.7 27.3
Grade span PK, K, 1, 2, 3, 4, or 5�12 43.6 56.4 65.3 52.0 79.0 42.7 19.8 6, 7, or 8�12 19.0 81.0 60.2 63.2 95.0 73.9 24.4 9�10, 11, 12 31.0 69.0 73.7 62.5 68.6 53.7 26.0 10�11, 12 37.0 63.0 100.0 85.4 83.2 83.6 60.3
School enrollment 1�399 38.9 61.1 53.7 41.1 71.5 42.7 23.0 400�799 23.1 76.9 92.3 77.1 84.0 73.9 26.3 800�1,199 24.4 75.6 67.3 58.7 77.1 37.4 27.8 1,200�1,599 33.6 66.4 97.0 91.3 74.5 58.7 30.8 1,600+ 33.4 66.6 98.0 91.8 55.2 79.8 35.2
Grade 10 percent free lunch1
0�5 percent 33.6 66.4 51.0 55.4 68.1 33.0 25.2 6�20 percent 24.9 75.1 95.6 62.7 74.5 62.2 48.2 21�50 percent 35.5 64.5 94.2 72.2 85.4 75.3 7.5 51�100 percent 46.0 54.0 33.5 32.2 70.7 29.0 29.01 Percentage of a school�s 10th-grade students that receive free or reduced-price lunch.NOTE: Detail may not sum to totals because of rounding.
When students may use library on own Of those schools with set times for students� use of library on own:
Table 12. Percent distribution of when students may use school library media centers on their own, by selected dddddddr.school characteristics: 2002
SOURCE: U.S. Department of Education, National Center for Education Statistics, Education Longitudinal Study of 2002 (ELS:2002), �Base Year, Library Media Center Survey, 2002.�
School characteristic

35
Two or more classes at same time One class only
Small groups (less than a full class)
Groups for non-library related
activities
Total 5.0 10.5 17.7 4.9
School sector Public 5.7 11.5 19.0 4.8 Catholic 2.0 6.5 16.2 4.8 Other private 2.4 6.8 12.5 5.5
School urbanicity Urban 4.9 9.3 17.4 5.7 Suburban 6.0 11.2 19.2 4.8 Rural 3.9 10.5 16.3 4.7
School region Northeast 5.5 10.6 15.9 5.1 Midwest 5.3 11.8 19.9 4.2 South 4.8 9.7 16.1 4.5 West 4.3 10.2 19.3 6.8
Grade span PK, K, 1, 2, 3, 4, or 5�12 3.8 9.5 14.3 4.8 6, 7, or 8�12 3.1 9.8 16.3 4.4 9�10, 11, 12 6.0 11.1 19.6 5.2 10�11, 12 7.9 13.2 21.2 4.7
School enrollment 1�399 2.3 7.7 14.4 4.9 400�799 4.5 10.8 15.8 4.4 800�1,199 6.1 11.9 19.4 5.2 1,200�1,599 10.5 15.0 22.5 6.0 1,600+ 10.7 15.4 28.7 5.4
Grade 10 percent free lunch1
0�5 percent 3.8 9.0 16.1 5.6 6�20 percent 6.8 11.8 19.1 3.9 21�50 percent 5.1 11.4 18.3 5.8 51�100 percent 3.8 8.1 15.0 3.71 Percentage of a school�s 10th-grade students that receive free or reduced-price lunch.
Mean number of times per week the library is used by:
School characteristic
Table 13. Mean number of times during a typical week the school library media center is used by dddddddd.various groups, during school and non-school hours, by selected school characteristics: 2002
SOURCE: U.S. Department of Education, National Center for Education Statistics, Education Longitudinal Study of 2002 (ELS:2002), �Base Year, Library Media Center Survey, 2002.�

36
Fewer than 100 100�249 250�499 500�999 1000 or more
Total 14.6 30.8 24.9 18.5 11.2
School sector Public 11.0 28.3 26.5 21.4 12.8 Catholic 14.9 32.1 25.2 13.8 14.0 Other private 30.5 42.0 17.6 6.8 3.0
School urbanicity Urban 21.6 22.9 19.8 21.1 14.5 Suburban 15.0 21.4 24.9 24.4 14.3 Rural 9.9 46.4 27.8 10.2 5.7
School region Northeast 17.7 24.8 16.8 29.1 11.5 Midwest 3.6 36.2 23.8 21.8 14.6 South 18.2 27.5 31.8 13.2 9.3 West 20.5 34.1 20.0 15.4 9.9
Grade span PK, K, 1, 2, 3, 4, or 5�12 17.8 51.7 19.0 3.9 7.6 6, 7, or 8�12 18.2 31.1 29.9 16.3 4.5 9�10, 11, 12 12.4 20.6 26.8 25.6 14.7 10�11, 12 # 27.1 16.0 42.3 14.7
School enrollment 1�399 28.2 46.7 15.5 6.6 3.0 400�799 3.5 27.2 45.8 14.7 8.8 800�1,199 7.0 16.1 32.3 33.1 11.5 1,200�1,599 # 7.8 20.8 38.1 33.3 1,600+ # 4.6 15.0 40.2 40.2
Grade 10 percent free lunch1
0�5 percent 17.2 29.9 24.2 18.7 10.1 6�20 percent 10.0 23.5 30.8 22.0 13.7 21�50 percent 4.3 48.6 22.1 15.1 9.9 51�100 percent 35.0 17.8 21.5 18.9 6.7# Rounds to zero.1 Percentage of a school�s 10th-grade students that receive free or reduced-price lunch.
Number of students who use library during a typical weekSchool characteristic
Table 14. Percent distribution of schools with different amounts of student usage of school library during a ddddd.dddtypical week, during school and non-school hours, by selected school characteristics: 2002
SOURCE: U.S. Department of Education, National Center for Education Statistics, Education Longitudinal Study of 2002 (ELS:2002), �Base Year, Library Media Center Survey, 2002.�
NOTE: This table provides estimates on the number of student visits per a typical week. Students may visit the library multiple times during a single week. This is why some libraries report more student visits per week than students enrolled in the school. Detail may not sum to totals because of rounding.

37
0 1�2 3�5 6 or moreVaries by
grade levelNo
maximum
Total 1.6 20.3 38.3 6.1 10.4 23.3
School sector Public 2.0 17.9 42.6 6.1 8.7 22.6 Catholic # 9.8 23.6 14.2 3.9 48.4 Other private # 34.8 22.8 3.0 20.7 18.8
School urbanicity Urban 6.3 24.1 30.5 7.5 11.1 20.5 Suburban 0.6 15.9 41.3 7.5 7.6 27.0 Rural # 23.2 39.3 3.5 13.3 20.7
School region Northeast # 17.9 29.0 6.4 3.3 43.5 Midwest # 14.9 36.0 6.4 13.1 29.7 South 3.6 33.0 35.0 4.1 10.9 13.4 West 1.3 6.2 55.4 9.0 11.3 16.8
Grade span PK, K, 1, 2, 3, 4, or 5�12 # 36.6 27.6 1.0 30.6 4.2 6, 7, or 8�12 # 13.5 41.5 2.1 9.2 33.6 9�10, 11, 12 2.9 14.3 42.4 9.4 1.2 29.9 10�11, 12 # 18.9 46.4 13.7 # 21.1
School enrollment 1�399 3.3 25.1 34.8 2.6 12.9 21.3 400�799 1.1 17.7 41.5 6.0 13.4 20.3 800�1,199 # 22.5 32.0 11.3 6.3 27.9 1,200�1,599 # 11.8 46.1 12.5 # 29.6 1,600+ # 8.9 56.2 11.1 # 23.8
Grade 10 percent free lunch1
0�5 percent # 22.7 28.4 7.6 11.2 30.1 6�20 percent # 6.8 46.5 5.9 5.4 35.3 21�50 percent 0.9 24 42.8 5.9 12.6 13.9 51�100 percent 9.4 34.0 31.0 2.2 9.6 13.8# Rounds to zero.1 Percentage of a school�s 10th-grade students that receive free or reduced-price lunch.NOTE: Detail may not sum to totals because of rounding.
Maximum number of books student may take out of library at a time
School characteristic
Table 15. Percent of schools with different maximum number of books that a student may check out ddddddddof the school library at one time, by selected school characteristics: 2002
SOURCE: U.S. Department of Education, National Center for Education Statistics, Education Longitudinal Study of 2002 (ELS:2002), �Base Year, Library Media Center Survey, 2002.�

38
School characteristicMean circulation per week
Mean circulation per student, per week
Total 279.5 0.7
School sector Public 277.6 0.6 Catholic 82.3 0.2 Other private 359.0 1.0
School urbanicity Urban 291.8 0.3 Suburban 231.8 0.4 Rural 330.2 1.2
School region Northeast 191.3 0.3 Midwest 323.0 1.0 South 249.0 0.5 West 343.0 0.8
Grade span PK, K, 1, 2, 3, 4, or 5�12 423.9 1.3 6, 7, or 8�12 185.5 0.4 9�10, 11, 12 237.0 0.4 10�11, 12 209.4 0.2
School enrollment 1�399 252.5 1.1 400�799 264.5 0.5 800�1,199 314.9 0.3 1,200�1,599 323.6 0.2 1,600+ 453.2 0.2
Grade 10 percent free lunch1
0�5 percent 251.8 0.7 6�20 percent 265.9 0.6 21�50 percent 305.7 0.8 51�100 percent 268.2 0.51 Percentage of a school�s 10th-grade students that receive free or reduced-price lunch.SOURCE: U.S. Department of Education, National Center for Education Statistics, Education Longitudinal Study of 2002 (ELS:2002), �Base Year, Library Media Center Survey, 2002.�
Table 16. Mean total circulation of library materials (books, etc.) checked out dddd.ddddfrom the library media center during a typical week, and per student, dddd.ddddby selected school characteristics: 2002
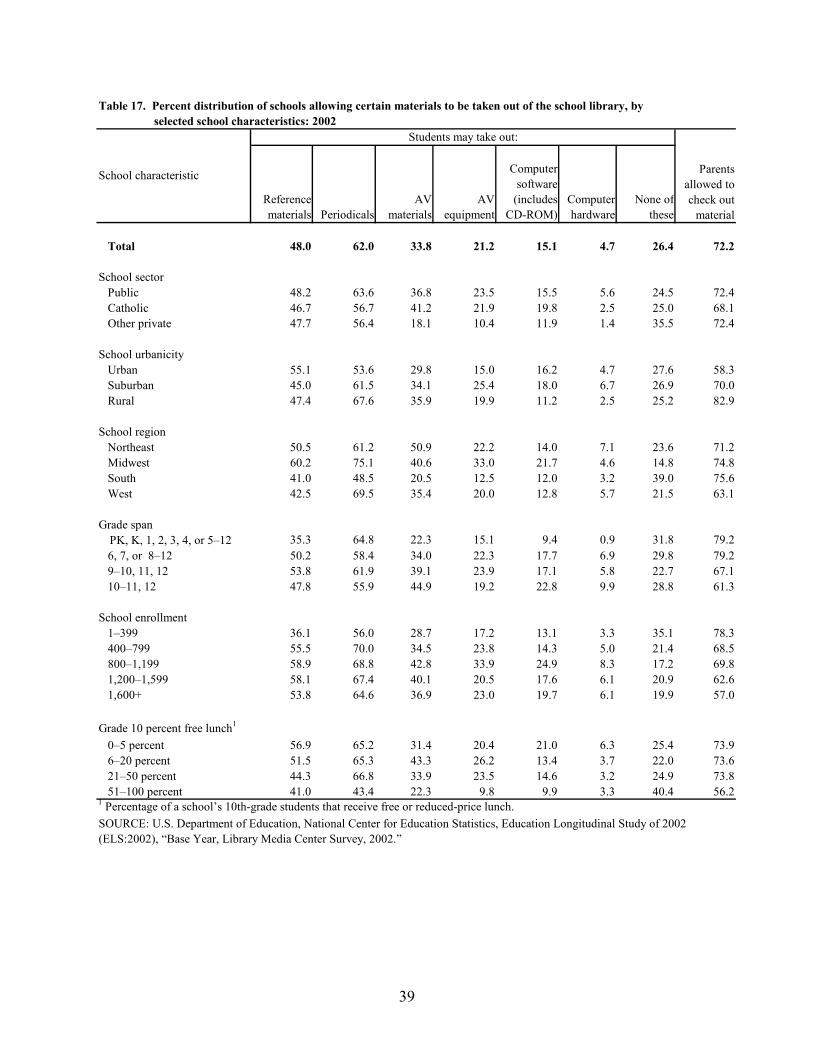
39
Reference materials Periodicals
AV materials
AV equipment
Computer software
(includes CD-ROM)
Computer hardware
None of these
Total 48.0 62.0 33.8 21.2 15.1 4.7 26.4 72.2
School sector Public 48.2 63.6 36.8 23.5 15.5 5.6 24.5 72.4 Catholic 46.7 56.7 41.2 21.9 19.8 2.5 25.0 68.1 Other private 47.7 56.4 18.1 10.4 11.9 1.4 35.5 72.4
School urbanicity Urban 55.1 53.6 29.8 15.0 16.2 4.7 27.6 58.3 Suburban 45.0 61.5 34.1 25.4 18.0 6.7 26.9 70.0 Rural 47.4 67.6 35.9 19.9 11.2 2.5 25.2 82.9
School region Northeast 50.5 61.2 50.9 22.2 14.0 7.1 23.6 71.2 Midwest 60.2 75.1 40.6 33.0 21.7 4.6 14.8 74.8 South 41.0 48.5 20.5 12.5 12.0 3.2 39.0 75.6 West 42.5 69.5 35.4 20.0 12.8 5.7 21.5 63.1
Grade spanPK, K, 1, 2, 3, 4, or 5�12 35.3 64.8 22.3 15.1 9.4 0.9 31.8 79.2
6, 7, or 8�12 50.2 58.4 34.0 22.3 17.7 6.9 29.8 79.2 9�10, 11, 12 53.8 61.9 39.1 23.9 17.1 5.8 22.7 67.1 10�11, 12 47.8 55.9 44.9 19.2 22.8 9.9 28.8 61.3
School enrollment 1�399 36.1 56.0 28.7 17.2 13.1 3.3 35.1 78.3 400�799 55.5 70.0 34.5 23.8 14.3 5.0 21.4 68.5 800�1,199 58.9 68.8 42.8 33.9 24.9 8.3 17.2 69.8 1,200�1,599 58.1 67.4 40.1 20.5 17.6 6.1 20.9 62.6 1,600+ 53.8 64.6 36.9 23.0 19.7 6.1 19.9 57.0
Grade 10 percent free lunch1
0�5 percent 56.9 65.2 31.4 20.4 21.0 6.3 25.4 73.9 6�20 percent 51.5 65.3 43.3 26.2 13.4 3.7 22.0 73.6 21�50 percent 44.3 66.8 33.9 23.5 14.6 3.2 24.9 73.8 51�100 percent 41.0 43.4 22.3 9.8 9.9 3.3 40.4 56.21 Percentage of a school�s 10th-grade students that receive free or reduced-price lunch.SOURCE: U.S. Department of Education, National Center for Education Statistics, Education Longitudinal Study of 2002 (ELS:2002), �Base Year, Library Media Center Survey, 2002.�
Students may take out:
School characteristic
Table 17. Percent distribution of schools allowing certain materials to be taken out of the school library, by dddddd.ddselected school characteristics: 2002
Parents allowed to check out
material

40
Assign-ments
In-school
projects Home-
workResearch
papersLeisure reading
To read magazines
or news-papers
To read books for
fun
Interests outside of
schoolInternet
access
Total 40.8 52.7 26.9 54.1 15.6 16.7 16.6 20.8 41.1
Sex Male 36.0 46.2 24.5 48.2 14.9 17.4 14.5 24.1 40.0 Female 45.4 58.9 29.1 59.8 16.4 16.1 18.6 17.8 42.1
Race/ethnicityAmerican Indian/Alaska Native, non-Hispanic 42.0 50.8 29.6 57.3 24.1 23.6 21.0 31.7 42.3Asian, Hawaii/Pacific Islander, non-Hispanic 42.0 55.7 31.4 51.6 17.4 20.0 19.3 20.9 41.9Black or African-American, non-Hispanic 44.4 55.0 32.7 54.9 19.4 21.6 22.2 28.9 45.1Hispanic 36.8 49.5 30.6 50.6 17.8 18.9 21.0 25.5 38.8Multiracial, non-Hispanic 41.2 51.8 27.1 53.1 22.8 19.8 22.2 24.0 44.0White, non-Hispanic 40.9 52.9 24.3 55.0 13.5 14.6 13.7 17.5 40.4
Socioeconomic status Lowest quartile 37.4 49.9 30.3 52.6 19.3 20.9 21.4 25.9 42.5 Middle two quartiles 40.8 52.2 25.7 54.6 15.2 16.3 16.2 20.7 40.1 Highest quartile 43.9 56.4 25.9 54.5 13.2 13.6 13.0 16.4 41.7
Composite achievement test score in grade 10 Lowest quartile 34.2 46.3 31.1 48.5 20.8 23.3 22.7 28.1 41.3 Middle two quartiles 40.8 53.2 26.6 54.7 14.9 16.3 15.3 20.5 41.6 Highest quartile 46.7 57.5 23.6 58.0 12.5 11.8 13.8 15.0 39.8
School sector Public 40.3 52.4 26.1 53.9 15.8 16.7 17.0 21.0 40.5 Catholic 42.9 54.8 32.5 52.5 10.3 15.0 8.4 17.7 46.2 Other private 51.4 60.1 40.5 63.2 19.6 21.3 18.4 21.5 50.1
School urbanicity Urban 38.2 50.9 27.3 49.9 15.9 17.5 17.8 21.3 37.9 Suburban 41.9 53.3 26.0 55.3 15.1 14.9 15.7 20.2 41.4 Rural 41.8 54.0 28.5 57.4 16.8 20.5 17.1 21.8 44.8
School region Northeast 45.5 57.2 28.2 56.8 14.5 16.0 15.3 20.4 42.6 Midwest 44.5 56.4 30.6 59.4 17.9 19.7 17.4 22.4 47.1 South 39.0 50.0 22.9 51.7 14.5 16.0 16.5 20.5 39.3 West 35.7 49.2 27.8 50.0 15.9 15.2 17.1 20.0 36.1
Percent of students who reported �sometimes� or �often� to use of school library for these purposes:
Table 18. Percent of students who reported �sometimes� or �often� for use of school library media center for various ddddddddpurposes, for students whose schools have library media centers, by selected student characteristics: 2002
Student characteristic
SOURCE: U.S. Department of Education, National Center for Education Statistics, Education Longitudinal Study of 2002 (ELS:2002), �Base Year, Student Survey, 2002.�

41
Very useful Useful Not usefulDon�t use the school library
Total 22.4 58.3 7.3 12.1
Sex Male 21.5 57.2 8.7 12.5 Female 23.2 59.3 5.9 11.6
Race/ethnicityAmerican Indian/ Alaska Native, non-Hispanic 30.0 48.4 10.1 11.4Asian, Hawaii/Pacific Islander, non-Hispanic 18.5 59.8 7.8 13.8Black or African-American, non-Hispanic 26.6 52.9 5.9 14.6Hispanic 22.8 57.3 6.5 13.3Multiracial, non-Hispanic 23.9 57.9 6.8 11.4White, non-Hispanic 21.4 59.8 7.7 11.1
Socioeconomic status Lowest quartile 24.2 57.4 6.4 12.0 Middle two quartiles 21.9 59.0 7.3 11.8 Highest quartile 21.8 57.6 8.0 12.6
Composite achievement test score in grade 10 Lowest quartile 23.7 56.1 8.1 12.1 Middle two quartiles 22.2 58.8 6.9 12.1 Highest quartile 21.6 59.2 7.2 12.0
School sector Public 22.2 58.6 7.2 12.0 Catholic 23.1 56.2 7.4 13.2 Other private 27.7 50.6 9.9 11.7
School urbanicity Urban 23.2 55.2 7.0 14.6 Suburban 22.8 58.1 7.2 12.0 Rural 20.1 63.2 8.0 8.6
School region Northeast 24.7 55.9 6.7 12.7 Midwest 22.3 59.9 7.6 10.2 South 22.9 57.4 7.6 12.2 West 19.8 59.9 7.0 13.3NOTE: Detail may not sum to totals because of rounding.
Table 19. Percent distribution of student attitudes about reported usefulness of school library ddddr.dddreference materials in helping with class assignments and research, for students whose dddr.ddddschools have library media centers, by selected student characteristics: 2002
How useful are school library reference materials Student characteristic
SOURCE: U.S. Department of Education, National Center for Education Statistics, Education Longitudinal Study of 2002 (ELS:2002), �Base Year, Student Survey, 2002.�

42
Finding research resources (books, magazines,
newspaper articles) on a research topic
Using online databases or CD-ROMs for research
Using the Internet for research
Total 78.5 65.0 69.3
Sex Male 76.2 62.8 66.5 Female 80.7 67.0 72.0
Race/ethnicityAmerican Indian/Alaska Native, non-Hispanic 82.5 65.3 73.8Asian, Hawaii/Pacific Islander, non-Hispanic 74.1 57.5 62.9Black or African-American, non-Hispanic 78.1 66.8 73.2Hispanic 78.7 62.8 69.1Multiracial, non-Hispanic 78.1 62.2 67.2White, non-Hispanic 78.9 65.8 69.0
Socioeconomic status Lowest quartile 79.7 65.2 72.0 Middle two quartiles 79.0 65.8 69.6 Highest quartile 76.5 63.0 66.3
Composite achievement test score in grade 10 Lowest quartile 78.6 66.6 72.9 Middle two quartiles 78.7 65.1 69.8 Highest quartile 78.1 63.3 65.2
School sector Public 78.7 65.2 69.7 Catholic 76.6 64.6 67.1 Other private 74.5 59.5 61.3
School urbanicity Urban 77.0 63.8 68.3 Suburban 78.9 65.5 69.2 Rural 79.8 65.4 71.1
School region Northeast 80.4 67.1 70.4 Midwest 80.1 67.0 71.2 South 77.4 64.7 69.5 West 77.1 61.5 66.1
Percent of students who reported �very helpful� or �helpful� to questions regarding helpfulness of library staff with various tasks:
Student characteristic
Table 20. Percent of students who reported �very helpful� or �helpful� for questions about helpfulness of dddddr.ddlibrary staff with various tasks, for students whose schools have library media centers, by selected ddddr.dddstudent characteristics: 2002
SOURCE: U.S. Department of Education, National Center for Education Statistics, Education Longitudinal Study of 2002 (ELS:2002), �Base Year, Student Survey, 2000.

A-1
Appendix A: Technical Notes and Glossary A.1 Overview of the Technical Appendix
The National Center for Education Statistics (NCES) of the U.S. Department of Education has collected longitudinal data for more than 30 years. Starting in 1972 with the National Longitudinal Study of the High School Class of 1972 (NLS-72), and continuing to the most recent study, the Education Longitudinal Study of 2002 (ELS:2002), NCES has provided longitudinal and trend data to education policymakers and researchers that link secondary school educational achievement and experiences with important downstream outcomes, such as entry into the labor market and postsecondary educational access and attainment.
The base-year of ELS:2002 represents the first stage of a major effort designed to provide data about critical transitions experienced by students as they proceed through high school and into postsecondary education or their careers. The 2002 sophomore cohort will be followed, initially at 2-year intervals, to collect policy-relevant data about educational processes and outcomes, especially as such data pertain to student learning, predictors of dropping out, and high school effects on students� access to, and success in, postsecondary education and the work force.
The first section of this appendix details ELS:2002 study objectives; lists some of the major research and policy issues that the study addresses. This section is followed by discussions of base-year sampling, weighting, response rates, standard errors, and electronic codebooks. Next, an account is provided of the statistical procedures employed. Finally, a glossary is provided that documents the specific variables used in the analyses in this report.
A.2 Overview of ELS:2002 A.2.1 Study Objectives
ELS:2002 is a longitudinal study in which the same units are surveyed repeatedly over time. Individual students will be followed until about age 30; the base-year schools will be surveyed twice (they were surveyed in 2002 and will be surveyed again in 2004). In the high school years, ELS:2002 is an integrated multilevel study, involving multiple respondent populations, including students, their parents, their teachers, and their schools (from which data are collected at three levels: from the principal, the librarian, and from a facilities checklist). This multilevel focus will supply researchers with a comprehensive picture of the home, community, and school environments and their influences on the student. This multiple-respondent perspective is unified by the fact that, for most purposes, the student is the basic unit of analysis.1
1 Base-year school administrator, library media center, and facilities data can be used to report on the nation�s schools with 10th-grades in the 2001�02 school year. However, the primary use of the school-level data (and the purpose of parent and teacher surveys) is to provide further contextual information on the student.

A-2
Key elements in the ELS:2002 longitudinal design are summarized by wave below.
Base-Year (2002)
• Baseline survey of high school sophomores completed in spring term 2002. • Cognitive tests in reading and mathematics completed. • Surveys of parents, English teachers, and math teachers completed. School
administrator questionnaires also collected. • Additional components for this study included a school facilities checklist and
a media center (library) questionnaire. • Sample sizes of approximately 750 schools and over 17,000 students. Schools
were the first-stage unit of selection, with sophomores randomly selected within schools.
• Oversampling of Asians and private schools. • Design linkages with the Program for International Student Assessment
(PISA) and the National Assessment of Educational Progress (NAEP) and score reporting linkages to the prior longitudinal studies.
First Follow-up (2004)
• Follow-up in 2004, when most sample members are seniors, but some are dropouts or in other grades.
• Student questionnaire, dropout questionnaire, assessment in mathematics, and school administrator questionnaire to be administered.
• Return to the same schools, but separately follow transfer students. • Freshening for a 2004 senior cohort. • High school transcript component in 2004 (coursetaking records for grades 9�
12 at minimum).
Second Follow-up (2006)
• Post-high-school follow-ups using computer-assisted telephone interviews (CATI).
Further Follow-ups
• Number of (and dates for) further CATI follow-ups to be determined.
A.2.2 ELS:2002 Research and Policy Issues
Apart from helping to describe the status of high school students and their schools, ELS:2002 will provide information to help address a number of key policy and research questions. The study is intended to produce a comprehensive data set for the development and evaluation of educational policy at all government levels. Part of its aim is to inform decisionmakers, educational practitioners, and parents about the changes in the operation of the educational system over time and the effects of various elements
A-3
of the system on the lives of the individuals who pass through it. Issues that can be addressed with data collected in the high school years include the following:
• students� academic growth in mathematics;
• the process of dropping out of high school;
• the relationships between family background and the home education support system and students� educational success;
• the features of effective schools (e.g., school structural or organizational features or practices associated with higher levels of achievement gain, after controls have been imposed for student background and other factors);
• the relationship between coursetaking choices and success in high school (and thereafter);
• the equitable distribution of educational opportunities as registered in the distinctive school experiences and performance of students from various policy-relevant subgroups, such as
− students in public and private high schools;
− language minority students;
− students with disabilities;
− students in urban, suburban, and rural settings;
− students in different regions of the country;
− students from upper, middle, and lower socioeconomic status levels;
− male and female high school students; and
− students from different racial or ethnic groups; and
• steps taken to facilitate the transition from high school to postsecondary education or the world of work.
After ELS:2002 students have completed high school, a new set of issues can be examined. These issues include
• the later educational and labor market activities of high school dropouts;
• the transition of those who do not go directly on to postsecondary education or to the world of work;
• access to, and choice of, undergraduate and graduate educational institutions;
• persistence in attaining postsecondary educational goals;
• rate of progress through the postsecondary curriculum;
• degree attainment;
• barriers to persistence and attainment;
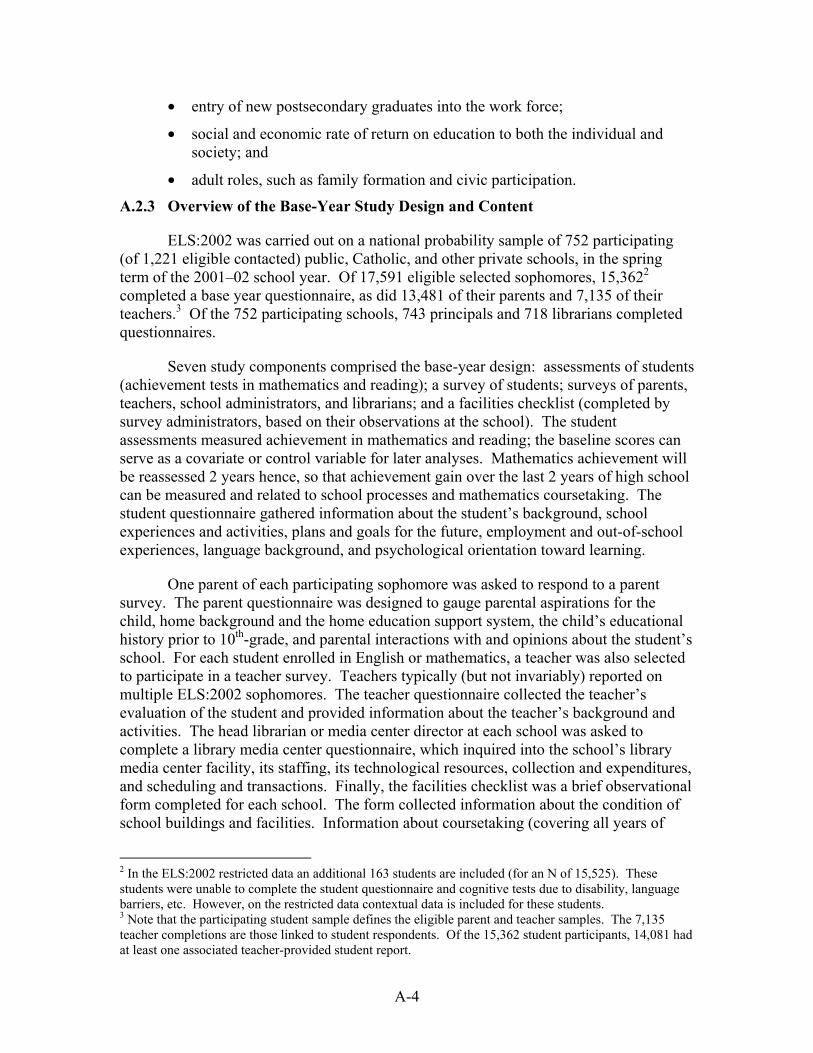
A-4
• entry of new postsecondary graduates into the work force;
• social and economic rate of return on education to both the individual and society; and
• adult roles, such as family formation and civic participation.
A.2.3 Overview of the Base-Year Study Design and Content
ELS:2002 was carried out on a national probability sample of 752 participating (of 1,221 eligible contacted) public, Catholic, and other private schools, in the spring term of the 2001�02 school year. Of 17,591 eligible selected sophomores, 15,3622 completed a base year questionnaire, as did 13,481 of their parents and 7,135 of their teachers.3 Of the 752 participating schools, 743 principals and 718 librarians completed questionnaires.
Seven study components comprised the base-year design: assessments of students (achievement tests in mathematics and reading); a survey of students; surveys of parents, teachers, school administrators, and librarians; and a facilities checklist (completed by survey administrators, based on their observations at the school). The student assessments measured achievement in mathematics and reading; the baseline scores can serve as a covariate or control variable for later analyses. Mathematics achievement will be reassessed 2 years hence, so that achievement gain over the last 2 years of high school can be measured and related to school processes and mathematics coursetaking. The student questionnaire gathered information about the student�s background, school experiences and activities, plans and goals for the future, employment and out-of-school experiences, language background, and psychological orientation toward learning.
One parent of each participating sophomore was asked to respond to a parent survey. The parent questionnaire was designed to gauge parental aspirations for the child, home background and the home education support system, the child�s educational history prior to 10th-grade, and parental interactions with and opinions about the student�s school. For each student enrolled in English or mathematics, a teacher was also selected to participate in a teacher survey. Teachers typically (but not invariably) reported on multiple ELS:2002 sophomores. The teacher questionnaire collected the teacher�s evaluation of the student and provided information about the teacher�s background and activities. The head librarian or media center director at each school was asked to complete a library media center questionnaire, which inquired into the school�s library media center facility, its staffing, its technological resources, collection and expenditures, and scheduling and transactions. Finally, the facilities checklist was a brief observational form completed for each school. The form collected information about the condition of school buildings and facilities. Information about coursetaking (covering all years of
2 In the ELS:2002 restricted data an additional 163 students are included (for an N of 15,525). These students were unable to complete the student questionnaire and cognitive tests due to disability, language barriers, etc. However, on the restricted data contextual data is included for these students. 3 Note that the participating student sample defines the eligible parent and teacher samples. The 7,135 teacher completions are those linked to student respondents. Of the 15,362 student participants, 14,081 had at least one associated teacher-provided student report.
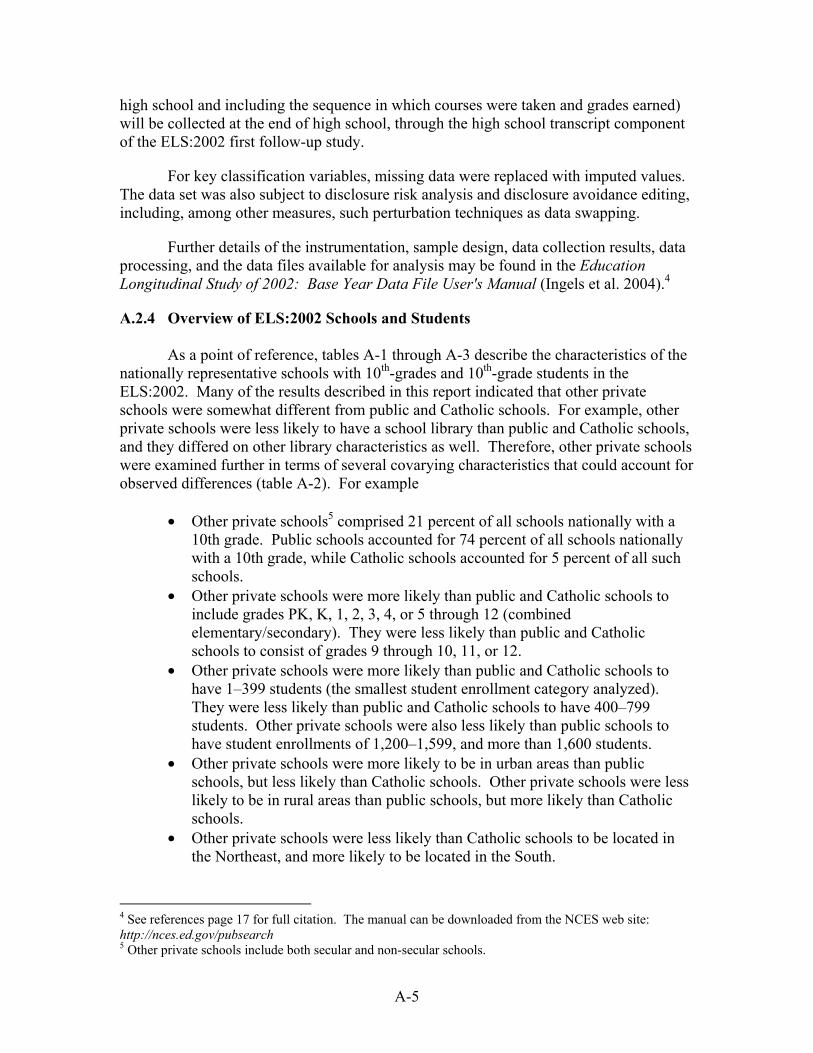
A-5
high school and including the sequence in which courses were taken and grades earned) will be collected at the end of high school, through the high school transcript component of the ELS:2002 first follow-up study.
For key classification variables, missing data were replaced with imputed values. The data set was also subject to disclosure risk analysis and disclosure avoidance editing, including, among other measures, such perturbation techniques as data swapping.
Further details of the instrumentation, sample design, data collection results, data processing, and the data files available for analysis may be found in the Education Longitudinal Study of 2002: Base Year Data File User's Manual (Ingels et al. 2004).4
A.2.4 Overview of ELS:2002 Schools and Students
As a point of reference, tables A-1 through A-3 describe the characteristics of the nationally representative schools with 10th-grades and 10th-grade students in the ELS:2002. Many of the results described in this report indicated that other private schools were somewhat different from public and Catholic schools. For example, other private schools were less likely to have a school library than public and Catholic schools, and they differed on other library characteristics as well. Therefore, other private schools were examined further in terms of several covarying characteristics that could account for observed differences (table A-2). For example
• Other private schools5 comprised 21 percent of all schools nationally with a 10th grade. Public schools accounted for 74 percent of all schools nationally with a 10th grade, while Catholic schools accounted for 5 percent of all such schools.
• Other private schools were more likely than public and Catholic schools to include grades PK, K, 1, 2, 3, 4, or 5 through 12 (combined elementary/secondary). They were less likely than public and Catholic schools to consist of grades 9 through 10, 11, or 12.
• Other private schools were more likely than public and Catholic schools to have 1�399 students (the smallest student enrollment category analyzed). They were less likely than public and Catholic schools to have 400�799 students. Other private schools were also less likely than public schools to have student enrollments of 1,200�1,599, and more than 1,600 students.
• Other private schools were more likely to be in urban areas than public schools, but less likely than Catholic schools. Other private schools were less likely to be in rural areas than public schools, but more likely than Catholic schools.
• Other private schools were less likely than Catholic schools to be located in the Northeast, and more likely to be located in the South.
4 See references page 17 for full citation. The manual can be downloaded from the NCES web site: http://nces.ed.gov/pubsearch 5 Other private schools include both secular and non-secular schools.

A-6
Table A-1. Percent distribution of 10th-grade schools, by selected school characteristics: 2002School characteristic Percentage
Total 100.0
School sector Public 73.7 Catholic 5.1 Other private 21.3
School urbanicity Urban 21.4 Suburban 42.4 Rural 36.2
School region Northeast 16.5 Midwest 27.3 South 36.3 West 19.9
Grade span PK, K, 1, 2, 3, 4, or 5�12 30.1 6, 7, or 8�12 14.8 9 -�10, 11, 12 53.3 10�11, 12 1.8
School enrollment 1�399 47.4 400�799 25.3 800�1,199 12.5 1,200�1,599 7.2 1,600+ 7.7
Grade 10 percent free lunch1
0�5 percent 33.4 6�20 percent 21.5 21�50 percent 30.1 51�100 percent 15.0
Charter schools Yes 2.2 No 97.81 Percentage of a school�s 10th-grade students that receive free or reduced-price lunch.NOTE: Detail may not sum to totals because of rounding.SOURCE: U.S. Department of Education, National Center for Education Statistics, EducationLongitudinal Study of 2002 (ELS:2002), �Base Year, School Survey, 2002.�

A-7
School characteristic Total Public schoolsCatholic schools
Other private schools
Total 100.0 73.7 5.1 21.3
Total (column) 100.0 100.0 100.0 100.0School urbanicity Urban 21.4 15.2 51.9 35.5 Suburban 42.4 41.4 44.6 45.3 Rural 36.2 43.4 3.5 19.2
School region Northeast 16.5 15.0 31.5 18.3 Midwest 27.3 28.3 32.2 22.5 South 36.3 36.1 24.5 39.7 West 19.9 20.6 11.9 19.5
Grade span PK,K,1,2,3,4, or 5 � 12 30.1 17.4 3.5 82.2 6,7, or 8 � 12 14.8 16.6 13.8 8.7 9 � 10,11,12 53.3 63.6 82.7 9.0 10 � 11,12 1.8 2.4 # #
School enrollment 1-399 47.4 39.5 39.6 78.4 400-799 25.3 28.5 39.5 10.3 800-1,199 12.5 12.9 17.5 9.8 1,200-1,599 7.2 9.0 3.3 1.4 1,600+ 7.7 10.2 # #
Grade 10 percent free lunch1
0-5 percent 33.4 12.0 85.5 90.1 6-20 percent 21.5 27.8 8.5 4.2 21-50 percent 30.1 40.9 2.8 1.5 51-100 percent 15.0 19.2 3.2 4.2
Charter schools Yes 2.2 3.0 # 0.2 No 97.8 97.0 100.0 99.8# Rounds to zero.1 Percentage of a school�s 10th-grade students that receive free or reduced-price lunch.NOTE: Detail may not sum to totals because of rounding.SOURCE: U.S. Department of Education, National Center for Education Statistics, Education Longitudinal Study of 2002 (ELS:2002), �Base Year, School Survey, 2002.�
Table A-2. Percent distribution of 10th-grade schools, by school sector and selected dddddddddschool characteristics: 2002

A-8
Table A-3. Percent distribution of 2002 sophomores, by selected student characteristics: 2002Student characteristic Percent
Total 100.0
Sex Male 50.5 Female 49.5
Race/ethnicity American Indian/Alaska Native, non-Hispanic 1.0 Asian, Hawaii/Pacific Islander, non-Hispanic 4.2 Black or African American, non-Hispanic 14.4 Hispanic 15.9 Multiracial, non-Hispanic 4.3 White, non-Hispanic 60.3
Socioeconomic status in grade 10 Lowest quartile 25.0 Middle two quartiles 50.1 Highest quartile 25.0
Composite achievement test score in grade 10 Lowest quartile 25.0 Middle two quartiles 50.0 Highest quartile 25.0
School sector grade 10 Public 92.4 Catholic 4.2 Other private 3.4
School urbanicity grade 10 Urban 30.2 Suburban 50.3 Rural 19.6
School region grade 10 Northeast 18.5 Midwest 24.1 South 34.3 West 23.0
School grade span PK, K, 1, 2, 3, 4, or 5�12 5.1 6, 7, or 8�12 7.0 9�10, 11, 12 83.2 10�11, 12 4.7
School enrollment 1�399 9.8 400�799 17.6 800�1,199 19.4 1,200�1,599 19.3 1,600+ 33.8
Grade 10 percent free lunch1
0�5 percent 23.4 6�20 percent 30.3 21�50 percent 31.6 51�100 percent 14.71 Percentage of a school�s 10th-grade students that receive free or reduced-price lunch.NOTE: Detail may not sum to totals because of rounding.SOURCE: U.S. Department of Education, National Center for Education Statistics, Education Longitudinal Study of 2002 (ELS:2002), �Base Year, Student Survey, 2002.�

A-9
A.2.5 Overview of School Library Media Center Questionnaire The purpose of the ELS:2002 library media center questionnaire and the library items on the student questionnaire was to learn more about the nature and scope of school libraries. Further, information on school libraries could be linked to student data, including student achievement, thus allowing for more research on the links between the two. The questionnaires covered a range of topics on school libraries. The major topics covered in the library media center questionnaire include library space, resources, equipment and technology, library services, staffing, and use. The student questionnaire includes items on use of the library for different purposes, and attitudes about resources and staff. Some possible issues to keep in mind and limitations of the library data include the following. The library media center questionnaire was not completed by about 4 percent of respondents. Thus, we do not know whether these schools do or do not have a school library media center. These schools, along with those schools that explicitly said they did not have a school library, are not included in any of the analyses of library characteristics. In approximately three-quarters of the cases, the person who completed the library media center questionnaire was the school library media center specialist (73 percent). Four percent of respondents were the school principal and other school administrator. The remaining 23 percent were �other;� we do not know who these respondents were. Finally, some of the items in the library questionnaire were categorical, where ideally we would want continuous responses (such as book and other holdings). Continuous variables would allow for the construction of variables per student (i.e., books per student). These and other limitations are noted throughout the report. A.3 Sample Design, Weighting, Response Rates, Standard Errors, and Electronic Codebook A.3.1 Sampling
The ELS:2002 base year sample design began with a nationally representative, two-stage stratified probability sample. The preliminary 1999-2000 Common Core of Data (CCD) and the provisional 1999-2000 Private School Survey (PSS) data files of public and private schools, respectively, were used as the sampling frames. The first stage of selection was schools; schools were selected with probability proportional to size (PPS). The public school sample was stratified by the nine U.S. Census divisions, and by urbanicity (metropolitan status of urban, suburban, or rural). Private schools (Catholic and other private) were stratified by four levels of geography (Census region) and urbanicity; private schools were oversampled. The target sample size was 800 schools. Of the 1,268 sampled schools, cooperation was sought from 1,221 eligible selections. The realized sample comprised 752 participating 10th-grade schools. The second stage of selection was students. Approximately 26 students per school were selected from 10th grade enrollment lists. Of the 19,218 students sampled, 17,591 students were selected (eligible) and 15,362 students participated. Some groups (e.g., Asians) were oversampled.

A-10
A.3.2 Weighting
The general purpose of the weighting scheme was to compensate for unequal probabilities of selection of schools and students into the base-year sample and to adjust for the fact that not all schools and students selected into the sample actually participated. Three sets of weights were computed: a school weight, a weight for student questionnaire completion, and a contextual data weight for the �expanded� sample of questionnaire-eligible and questionnaire-ineligible students.6 Schools and students were adjusted for nonresponse, and these adjustments were designed to significantly reduce or eliminate nonresponse bias for data elements known for most respondents and nonrespondents. In addition, school weights were poststratified to known population totals. The estimates in this report were produced using BYSCHWT, a cross-sectional weight that generalizes to the population of all regular high schools with 10th-grades in the United States in the spring term of the 2001�02 school year, and BYSTUWT, a cross-sectional weight that generalizes to the population of 10th-graders in regular U.S. high schools in the spring term of the 2001�02 school year.
A.3.3 Response Rates
Of 1,221 eligible contacted schools, 752 participated in the study, for an overall weighted school participation rate of approximately 68 percent (62 percent unweighted). Of 17,591 selected eligible students, 15,362 participated, for an overall weighted student response rate of approximately 87 percent. School and student unit nonresponse bias analyses were performed, as well as an item nonresponse bias analysis for the questionnaires.7 The school-level bias due to nonresponse prior to computing weights and after computing weights was estimated based on the data collected from both respondents and nonrespondents, as well as sampling frame data. At the unit level (but not the item level), weighting techniques were employed to reduce detected bias, and after final nonresponse adjustments, the remaining relative bias ranged from 0 to 0.2 percent for schools and from 0 to 0.07 for students. For details of the bias analyses, see the Education Longitudinal Study of 2002: Base Year Data File User�s Manual. Unweighted school-level response by stratum is summarized in table A-4. Second-stage unit response rates by component are summarized in table A-5; weighted item response rates for all unimputed analysis variables used in this report are shown in table A-6; the weighted proportions for missing data that were imputed are shown in table A-7. Only items judged as critical on the student questionnaire were imputed. See the Education Longitudinal Study of 2002: Base Year Data File User�s Manual (Ingels et al. forthcoming) for a list of critical items. All response rates were calculated according to NCES Statistical Standards (Seastrom 2003).
6 The expanded sample weight generalizes to the population of all sophomores, regardless of whether they were capable of completing the questionnaire. The regular student questionnaire weight (BYSTUWT) generalizes only to the population of students who were eligible to complete the student questionnaire, (i.e., those who were not judged incapable of participation by virtue of a severe disability or lack of proficiency in the English language). 7 Nonresponse bias analysis was not performed on the library media center questionnaire as the response rates were generally high and did not fall below the designated threshold.

A-11
Table A-4. Unweighted school sampling, eligibility, and participation by sampling stratum: 2002
Number Percent1 Number Percent2 Number Percent3
Total 1,268 1221 96.3 752 61.6Public 953 75.2 926 97.2 580 62.6Catholic 140 11.0 140 100.0 95 67.9Other private 175 13.8 155 88.6 77 49.7Urban 434 34.2 414 95.4 250 60.4Suburban 630 49.7 609 96.7 361 59.3Rural 204 16.1 198 97.1 141 71.21 Percent is based on overall total within column. Details may not sum to 100 percent because of rounding.2 Percent is based on number sampled within row.3 Percent is based on number eligible within row.
Participating schools
SOURCE: U.S. Department of Education, National Center for Education Statistics, Education Longitudinal Study of 2002 (ELS:2002).
School sampling stratumSampled schools Eligible schools
Table A�5. Summary of ELS:2002 base year completion and coverage rates: 2002
Instrument Selected ParticipatedWeighted
percentUnweighted
percentStudent questionnaire 17,591 15,362 87.3 87.3Student assessment1 15,362 14,543 95.1 94.7Parent questionnaire2 15,362 13,488 87.5 87.8Teacher ratings of students3 15,362 14,081 91.6 91.7School administrator questionnaire 752 743 98.5 98.8Library media center questionnaire 752 718 95.9 95.5Facilities checklist 752 752 100.0 100.0
3Indicates a coverage rate: ratings obtained from at least one teacher.
1Percentage of cases for which a student questionnaire was obtained for which a cognitive test was also obtained. Note that test scores have been imputed where missing so that test scores are available for all 15,362 questionnaire completers.2Indicates a coverage rate, the proportion of participating students with a parent report. More parents participated; these completion rates reflect the number of records in the public-use data file, where parent (and teacher) data were excluded for students who did not complete a base year student questionnaire.
SOURCE: U.S. Department of Education, National Center for Education Statistics, Education Longitudinal Study of 2002 (ELS:2002). Table A-6. Weighted response rates for unimputed variables: 2002Source Variable label Variable Response rate, percentLibrarian How library is organized BYL01 92.0Librarian Library�s total seating capacity BYL02 88.7Librarian Library has individual activity areas BYL03A 92.0Librarian Library has small group activity areas BYL03B 91.0See notes at end of table.
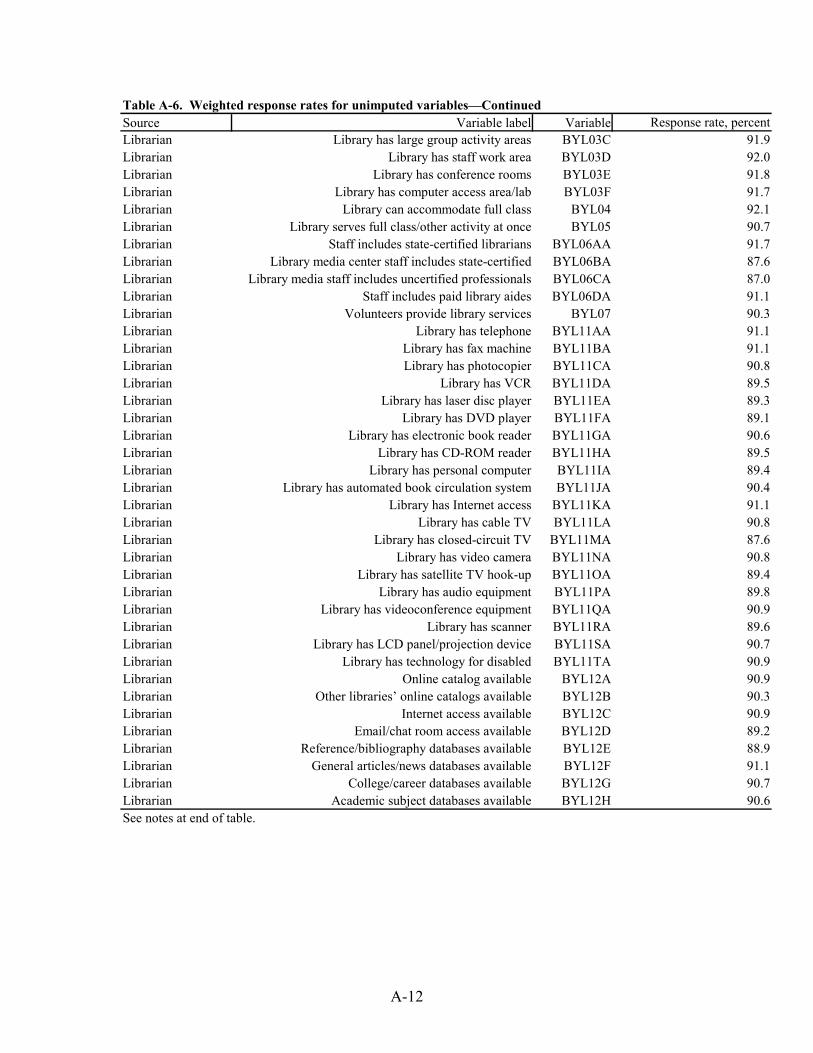
A-12
Source Variable label Variable Response rate, percentLibrarian Library has large group activity areas BYL03C 91.9Librarian Library has staff work area BYL03D 92.0Librarian Library has conference rooms BYL03E 91.8Librarian Library has computer access area/lab BYL03F 91.7Librarian Library can accommodate full class BYL04 92.1Librarian Library serves full class/other activity at once BYL05 90.7Librarian Staff includes state-certified librarians BYL06AA 91.7Librarian Library media center staff includes state-certified BYL06BA 87.6Librarian Library media staff includes uncertified professionals BYL06CA 87.0Librarian Staff includes paid library aides BYL06DA 91.1Librarian Volunteers provide library services BYL07 90.3Librarian Library has telephone BYL11AA 91.1Librarian Library has fax machine BYL11BA 91.1Librarian Library has photocopier BYL11CA 90.8Librarian Library has VCR BYL11DA 89.5Librarian Library has laser disc player BYL11EA 89.3Librarian Library has DVD player BYL11FA 89.1Librarian Library has electronic book reader BYL11GA 90.6Librarian Library has CD-ROM reader BYL11HA 89.5Librarian Library has personal computer BYL11IA 89.4Librarian Library has automated book circulation system BYL11JA 90.4Librarian Library has Internet access BYL11KA 91.1Librarian Library has cable TV BYL11LA 90.8Librarian Library has closed-circuit TV BYL11MA 87.6Librarian Library has video camera BYL11NA 90.8Librarian Library has satellite TV hook-up BYL11OA 89.4Librarian Library has audio equipment BYL11PA 89.8Librarian Library has videoconference equipment BYL11QA 90.9Librarian Library has scanner BYL11RA 89.6Librarian Library has LCD panel/projection device BYL11SA 90.7Librarian Library has technology for disabled BYL11TA 90.9Librarian Online catalog available BYL12A 90.9Librarian Other libraries� online catalogs available BYL12B 90.3Librarian Internet access available BYL12C 90.9Librarian Email/chat room access available BYL12D 89.2Librarian Reference/bibliography databases available BYL12E 88.9Librarian General articles/news databases available BYL12F 91.1Librarian College/career databases available BYL12G 90.7Librarian Academic subject databases available BYL12H 90.6
Table A-6. Weighted response rates for unimputed variables�Continued
See notes at end of table.
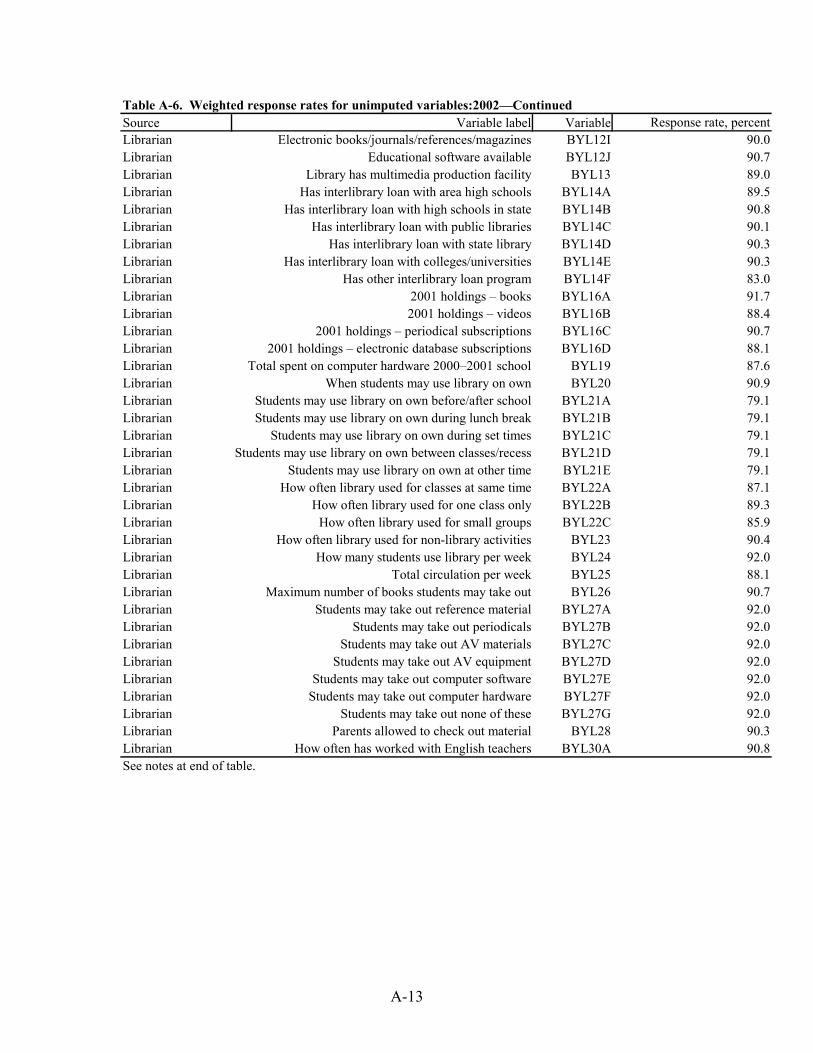
A-13
Source Variable label Variable Response rate, percentLibrarian Electronic books/journals/references/magazines BYL12I 90.0Librarian Educational software available BYL12J 90.7Librarian Library has multimedia production facility BYL13 89.0Librarian Has interlibrary loan with area high schools BYL14A 89.5Librarian Has interlibrary loan with high schools in state BYL14B 90.8Librarian Has interlibrary loan with public libraries BYL14C 90.1Librarian Has interlibrary loan with state library BYL14D 90.3Librarian Has interlibrary loan with colleges/universities BYL14E 90.3Librarian Has other interlibrary loan program BYL14F 83.0Librarian 2001 holdings � books BYL16A 91.7Librarian 2001 holdings � videos BYL16B 88.4Librarian 2001 holdings � periodical subscriptions BYL16C 90.7Librarian 2001 holdings � electronic database subscriptions BYL16D 88.1Librarian Total spent on computer hardware 2000�2001 school BYL19 87.6Librarian When students may use library on own BYL20 90.9Librarian Students may use library on own before/after school BYL21A 79.1Librarian Students may use library on own during lunch break BYL21B 79.1Librarian Students may use library on own during set times BYL21C 79.1Librarian Students may use library on own between classes/recess BYL21D 79.1Librarian Students may use library on own at other time BYL21E 79.1Librarian How often library used for classes at same time BYL22A 87.1Librarian How often library used for one class only BYL22B 89.3Librarian How often library used for small groups BYL22C 85.9Librarian How often library used for non-library activities BYL23 90.4Librarian How many students use library per week BYL24 92.0Librarian Total circulation per week BYL25 88.1Librarian Maximum number of books students may take out BYL26 90.7Librarian Students may take out reference material BYL27A 92.0Librarian Students may take out periodicals BYL27B 92.0Librarian Students may take out AV materials BYL27C 92.0Librarian Students may take out AV equipment BYL27D 92.0Librarian Students may take out computer software BYL27E 92.0Librarian Students may take out computer hardware BYL27F 92.0Librarian Students may take out none of these BYL27G 92.0Librarian Parents allowed to check out material BYL28 90.3Librarian How often has worked with English teachers BYL30A 90.8
Table A-6. Weighted response rates for unimputed variables:2002�Continued
See notes at end of table.
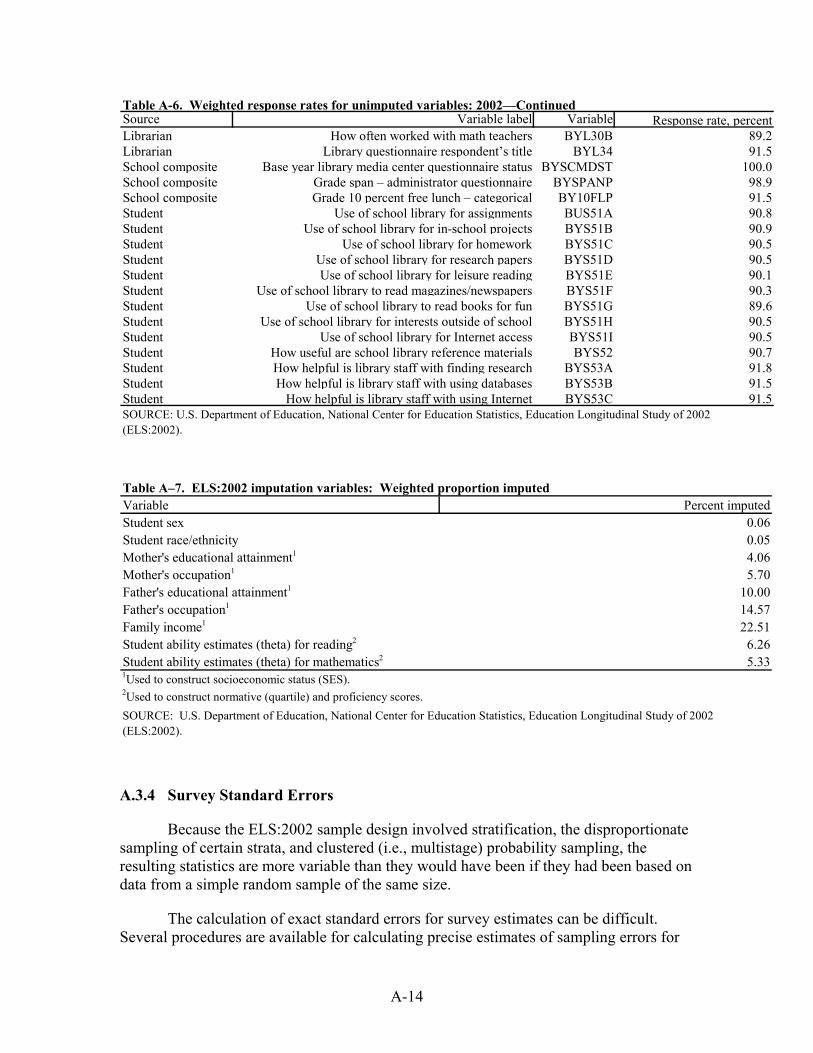
A-14
Source Variable label Variable Response rate, percentLibrarian How often worked with math teachers BYL30B 89.2Librarian Library questionnaire respondent�s title BYL34 91.5School composite Base year library media center questionnaire status BYSCMDST 100.0School composite Grade span � administrator questionnaire BYSPANP 98.9School composite Grade 10 percent free lunch � categorical BY10FLP 91.5Student Use of school library for assignments BUS51A 90.8Student Use of school library for in-school projects BYS51B 90.9Student Use of school library for homework BYS51C 90.5Student Use of school library for research papers BYS51D 90.5Student Use of school library for leisure reading BYS51E 90.1Student Use of school library to read magazines/newspapers BYS51F 90.3Student Use of school library to read books for fun BYS51G 89.6Student Use of school library for interests outside of school BYS51H 90.5Student Use of school library for Internet access BYS51I 90.5Student How useful are school library reference materials BYS52 90.7Student How helpful is library staff with finding research BYS53A 91.8Student How helpful is library staff with using databases BYS53B 91.5Student How helpful is library staff with using Internet BYS53C 91.5
Table A-6. Weighted response rates for unimputed variables: 2002�Continued
SOURCE: U.S. Department of Education, National Center for Education Statistics, Education Longitudinal Study of 2002 (ELS:2002).
Table A�7. ELS:2002 imputation variables: Weighted proportion imputed Variable Percent imputedStudent sex 0.06Student race/ethnicity 0.05Mother's educational attainment1 4.06Mother's occupation1 5.70Father's educational attainment1 10.00Father's occupation1 14.57Family income1 22.51Student ability estimates (theta) for reading2 6.26Student ability estimates (theta) for mathematics2 5.331Used to construct socioeconomic status (SES). 2Used to construct normative (quartile) and proficiency scores.SOURCE: U.S. Department of Education, National Center for Education Statistics, Education Longitudinal Study of 2002 (ELS:2002).
A.3.4 Survey Standard Errors
Because the ELS:2002 sample design involved stratification, the disproportionate sampling of certain strata, and clustered (i.e., multistage) probability sampling, the resulting statistics are more variable than they would have been if they had been based on data from a simple random sample of the same size.
The calculation of exact standard errors for survey estimates can be difficult. Several procedures are available for calculating precise estimates of sampling errors for
A-15
complex samples. Procedures such as Taylor Series approximations, Balanced Repeated Replication (BRR), and Jackknife Repeated Replication (JRR), which can be found in advanced statistical programs such as SUDAAN, AM, or WESVAR, produce similar results. The ELS:2002 analyses included in this report used AM (http://am.air.org) and the Taylor Series procedure to calculate standard errors.
A.4 Statistical Procedures A.4.1 Student t Statistics
Comparisons that have been drawn in the text of this report have been tested for statistical significance to ensure that the differences are larger than those that might be expected due to sampling variation. The statistical comparisons in this report were based on the t statistic. Whether the statistical test is considered significant or not is determined by calculating a t value for the difference between a pair of means or proportions and comparing this value to published tables of values, called critical values (cv). The alpha level is an a priori statement of the probability that a difference exists in fact rather than by chance.
The t statistic between estimates from various subgroups presented in the tables can be computed by using the following formula:
( )22
21
21
SESE
xxt+
−=
where x1 and x2 are the estimates to be compared (e.g., the means of sample members in two groups), and SE1 and SE2 are their corresponding standard errors.
A.5 Glossary�Description of Variables Used Each row variable used in the analyses for this report is described below, separately for the school and student-level analyses. Restricted data from the ELS:2002 restricted ECB were used in this report, though most of the variables can also be found on the public-use ELS:2002 ECB.
SCHOOL CHARACTERISTICS
SECTOR/TYPE (BYSCTRL): Type of school: Public, Catholic, or Other Private.
URBANICITY/LOCATION (BYURBAN): Metropolitan status of the school: Urban, Suburban, or Rural. Taken from the source data for school sampling: the Common Core of Data (CCD) 1999-2000 and the Private School Survey (PSS) 1999-2000.
REGION (BYREGION): Geographic region in which the school is located: Northeast (CT, ME, MA, NH, NJ, NY, PA, RI, and VT); Midwest (IL, IN, IA, KS, MI, MN, MO, ND, NE, OH, SD, and WI); South (AL, AR, DC, DE, FL, GA, KY, LA, MD,

A-16
MS, NC, OK, SC, TN, TX, VA, and WV); and West (AK, AZ, CA, CO, HI, ID, MT, NV, NM, OR, UT, WA, and WY).
GRADE SPAN (BYSPANP): Grade span of 10th grade school: PK, K, 1, 2, 3, 4, or 5 through 12; 6, 7, or 8 through 12; 9 through 10, 11, or 12; 10 through 11 or 12.
SCHOOL ENROLLMENT (BYSCENP): Total school enrollment from school questionnaire (categorical). Response categories were collapsed as follows to create five categories: (1) 1�399; (2) 400�599 and 600�799; (3) 800�999 and 1,000�1,199; (4) 1,200�1,599; (5) 1,600�1,999 and 2,000�2,499 and 2,500+ students. These categories are based on previous research on the effects of school size (Lee 2000).
GRADE 10 PERCENT FREE LUNCH (BY10FLP): Percent of 10th-graders receiving free or reduced price lunch (categorical). Responses categories were collapsed as follows to create four categories: (1) 0�5 percent; (2) 6�10 percent and 11�20 percent; (3) 21�30 percent and 31�50 percent; (4) 51�75 percent and 76�100 percent. Collapsing the response categories in this way approximates a quartile distribution, based on weighted frequencies. It is also similar to categorizations in previous reports (e.g., Chaney 1998).
STUDENT CHARACTERISTICS
SEX (SEX): This variable was constructed from BYS14 on the base year student questionnaire or, where missing, from (in order of preference) the school roster, logical imputation based on first name, or statistical imputation.
RACE/ETHNICITY (RACE): The race/ethnicity variable for this report is based on RACE with one simplification: �Hispanic/Latino, race specified� and �Hispanic/Latino, no race specified� are combined into one category, �Hispanic or Latino.� The resulting categories are: 1) American Indian or Alaska Native; 2) Asian or Pacific Islander, including Native Hawaiian; 3) Black, non-Hispanic, including African American; 4) Hispanic or Latino; 5) More than one race or Multiracial; and 6) White, non-Hispanic. All race categories exclude individuals of Hispanic ethnicity.
RACE reflects new federal standards for collecting race and ethnicity data that allow respondents to mark more than one choice for race. RACE was obtained from the student questionnaire (BYS15, BYS17A, BYS17B, BYS17C, BYS17D, and BYS17E) when available or from (in order of preference) the sampling roster, the parent questionnaire if the parent respondent was a biological parent, or logical imputation based on other questionnaire items (e.g., surname, native language).
SOCIOECONOMIC STATUS (SES2QU): The socioeconomic status (SES) variable used in this report combines the middle two categories of the SES2QU variable, which divides SES2 into quartiles based on the weighted marginal distribution. Three categories result: 1) lowest quartile of SES2 (i.e., students below the 25th percentile rank for SES); 2) middle two quartiles of SES2 (i.e., students whose SES percentile rank was

A-17
at least 25th and below 75th); and 3) highest quartile of SES2 (i.e., students whose SES percentile rank was at least 75th).
SES2 is a composite variable constructed from parent questionnaire data when available, and from imputation or student substitutions when not. SES is based on five equally weighted, standardized components: father�s/guardian�s education (FATHED), mother�s/guardian�s education (MOTHED), family income (INCOME), father�s/guardian�s occupational prestige score (from OCCUFATH), and mother�s/guardian�s occupational prestige score (from OCCUMOTH).
TESTED ACHIEVEMENT (BYTXCQU): This is the standardized test composite score (reading and mathematics) quartile. The composite score is the average of the math (BYTXMSTD) and reading (BYTXRSTD) standardized scores, restandardized to a national mean of 50.0 and standard deviation of 10.0. Some students had scores for only the math test or reading test, but not both. For students who did not have both scores, the composite is based on the single score that was available. The standardized T score provides a norm-referenced measurement of achievement, that is, an estimate of achievement relative to the population (spring 2002 10th-graders) as a whole. It provides information on status compared to peers (as distinguished from the IRT-estimated number-right score, which represents status with respect to achievement on a particular criterion set of test items). The quartile score divides the weighted (population estimate) achievement distributions into four equal groups. The middle two groups were combined for the analyses in this report, resulting in three categories: the lowest quartile, the middle two quartiles, and the highest quartile.
Please note at a point in time when this report was in a late stage of preparation, an error was found in the reading scores of a subset of the base year student sample. An investigation of the impact of the error established that estimates based on the erroneous scores differed by very little from corrected estimates (where there was an effect at all, it was generally in the low tenths of one percent range) and affected no conclusions of this or other NCES reports then being drafted or reviewed. Nonetheless, because the base year error has now been corrected, data users employing the corrected files will find that they cannot replicate precisely the reading score estimates in this report.
SECTOR/TYPE (BYSCTRL): Type of school for each student: Public, Catholic, or Other Private.
URBANICITY/LOCATION (BYURBAN): Metropolitan status of the school for each student: Urban, Suburban, or Rural. Taken from the source data for school sampling: the Common Core of Data (CCD) 1999-2000 and the Private School Survey (PSS) 1999-2000.
REGION (BYREGION): Geographic region in which the school is located for each student: Northeast (CT, ME, MA, NH, NJ, NY, PA, RI, and VT); Midwest (IL, IN, IA, KS, MI, MN, MO, ND, NE, OH, SD, and WI); South (AL, AR, DC, DE, FL, GA, KY, LA, MD, MS, NC, OK, SC, TN, TX, VA, and WV); and West (AK, AZ, CA, CO, HI, ID, MT, NV, NM, OR, UT, WA, and WY).

A-18
One library variable was created from multiple variables. Circulation per student, per week was created by dividing circulation per week (BYL25) by total student enrollment (BYA01). Both were continuous variables (see table 16).
All library variables used in the analyses in this report are listed in table A-6. In the analyses, only non-missing responses were used for these variables. Percent of schools with a library media center was calculated using the school-level variable, base year library media center questionnaire status (BYSCMDST). Schools that did not complete the questionnaire were excluded (thus we don�t know whether they do or do not have a library media center). The remainder either completed the questionnaire (and thus had a school library), or responded that the school did not have a library media center. Some variable response categories were combined for analysis. In tables 18 and 20, responses �sometimes� and �often� were combined for student questions about use of school library (BYS51A-I); responses �helpful� and �very helpful� were combined for student questions about helpfulness of library staff (BYS53A-C).

B-1
Appendix B: Standard Error Tables

B-2
School characteristicPercentage with a school
library media center
Total 1.57 School sector Public � Catholic � Other private 7.26
School urbanicity Urban 0.89 Suburban 3.42 Rural 1.03
School region Northeast 4.84 Midwest 1.85 South 3.21 West 1.79
Grade span PK, K, 1, 2, 3, 4, or 5�12 5.20 6, 7, or 8�12 � 9�10, 11, 12 0.34 10�11, 12 �
School enrollment 1�399 3.23 400�799 � 800�1,199 � 1,200�1,599 � 1,600+ �
Grade 10 percent free lunch1
0�5 percent 4.88 6�20 percent � 21�50 percent 0.64 51�100 percent �� Not applicable.
Table B-1. Standard errors for Table 1: Percent of 10th-grade ddddddd.dschools with a school library media center, by dddddd.ddselected school characteristics: 2002
SOURCE: U.S. Department of Education, National Center for Education Statistics, Education Longitudinal Study of 2002 (ELS:2002), �Base Year, School Survey, 2002.�
1 Percentage of a school�s 10th-grade students that receive free or reduced-price lunch.
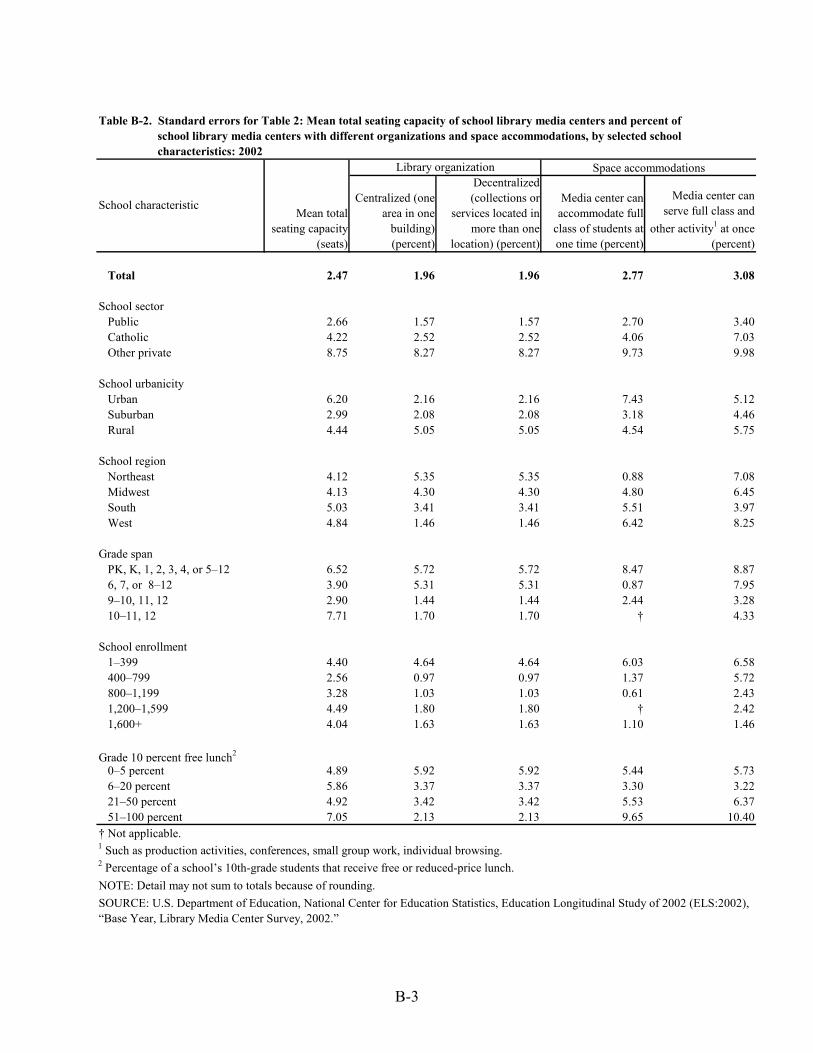
B-3
Mean total seating capacity
(seats)
Centralized (one area in one
building) (percent)
Decentralized (collections or
services located in more than one
location) (percent)
Media center can accommodate full
class of students at one time (percent)
Media center can serve full class and
other activity1 at once (percent)
Total 2.47 1.96 1.96 2.77 3.08
School sector Public 2.66 1.57 1.57 2.70 3.40 Catholic 4.22 2.52 2.52 4.06 7.03 Other private 8.75 8.27 8.27 9.73 9.98
School urbanicity Urban 6.20 2.16 2.16 7.43 5.12 Suburban 2.99 2.08 2.08 3.18 4.46 Rural 4.44 5.05 5.05 4.54 5.75
School region Northeast 4.12 5.35 5.35 0.88 7.08 Midwest 4.13 4.30 4.30 4.80 6.45 South 5.03 3.41 3.41 5.51 3.97 West 4.84 1.46 1.46 6.42 8.25
Grade span PK, K, 1, 2, 3, 4, or 5�12 6.52 5.72 5.72 8.47 8.87 6, 7, or 8�12 3.90 5.31 5.31 0.87 7.95 9�10, 11, 12 2.90 1.44 1.44 2.44 3.28 10�11, 12 7.71 1.70 1.70 � 4.33
School enrollment 1�399 4.40 4.64 4.64 6.03 6.58 400�799 2.56 0.97 0.97 1.37 5.72 800�1,199 3.28 1.03 1.03 0.61 2.43 1,200�1,599 4.49 1.80 1.80 � 2.42 1,600+ 4.04 1.63 1.63 1.10 1.46
Grade 10 percent free lunch2
0�5 percent 4.89 5.92 5.92 5.44 5.73 6�20 percent 5.86 3.37 3.37 3.30 3.22 21�50 percent 4.92 3.42 3.42 5.53 6.37 51�100 percent 7.05 2.13 2.13 9.65 10.40� Not applicable.1 Such as production activities, conferences, small group work, individual browsing.2 Percentage of a school�s 10th-grade students that receive free or reduced-price lunch.NOTE: Detail may not sum to totals because of rounding.SOURCE: U.S. Department of Education, National Center for Education Statistics, Education Longitudinal Study of 2002 (ELS:2002), �Base Year, Library Media Center Survey, 2002.�
Library organization Space accommodations
Table B-2. Standard errors for Table 2: Mean total seating capacity of school library media centers and percent of dddddddddschool library media centers with different organizations and space accommodations, by selected school dddddddddcharacteristics: 2002
School characteristic
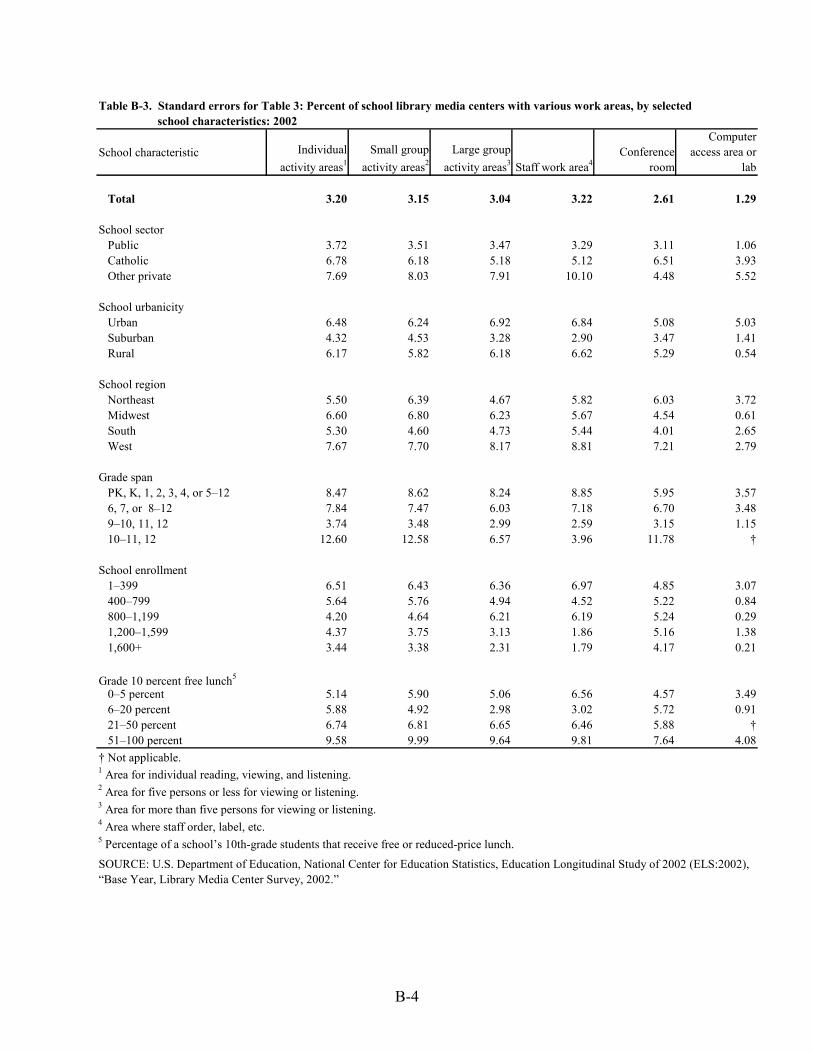
B-4
School characteristic Individual activity areas1
Small group activity areas2
Large group activity areas3 Staff work area4
Conference room
Computer access area or
lab
Total 3.20 3.15 3.04 3.22 2.61 1.29
School sector Public 3.72 3.51 3.47 3.29 3.11 1.06 Catholic 6.78 6.18 5.18 5.12 6.51 3.93 Other private 7.69 8.03 7.91 10.10 4.48 5.52
School urbanicity Urban 6.48 6.24 6.92 6.84 5.08 5.03 Suburban 4.32 4.53 3.28 2.90 3.47 1.41 Rural 6.17 5.82 6.18 6.62 5.29 0.54
School region Northeast 5.50 6.39 4.67 5.82 6.03 3.72 Midwest 6.60 6.80 6.23 5.67 4.54 0.61 South 5.30 4.60 4.73 5.44 4.01 2.65 West 7.67 7.70 8.17 8.81 7.21 2.79
Grade span PK, K, 1, 2, 3, 4, or 5�12 8.47 8.62 8.24 8.85 5.95 3.57 6, 7, or 8�12 7.84 7.47 6.03 7.18 6.70 3.48 9�10, 11, 12 3.74 3.48 2.99 2.59 3.15 1.15 10�11, 12 12.60 12.58 6.57 3.96 11.78 �
School enrollment 1�399 6.51 6.43 6.36 6.97 4.85 3.07 400�799 5.64 5.76 4.94 4.52 5.22 0.84 800�1,199 4.20 4.64 6.21 6.19 5.24 0.29 1,200�1,599 4.37 3.75 3.13 1.86 5.16 1.38 1,600+ 3.44 3.38 2.31 1.79 4.17 0.21
Grade 10 percent free lunch5
0�5 percent 5.14 5.90 5.06 6.56 4.57 3.49 6�20 percent 5.88 4.92 2.98 3.02 5.72 0.91 21�50 percent 6.74 6.81 6.65 6.46 5.88 � 51�100 percent 9.58 9.99 9.64 9.81 7.64 4.08� Not applicable.1 Area for individual reading, viewing, and listening.2 Area for five persons or less for viewing or listening.3 Area for more than five persons for viewing or listening.4 Area where staff order, label, etc.5 Percentage of a school�s 10th-grade students that receive free or reduced-price lunch.
SOURCE: U.S. Department of Education, National Center for Education Statistics, Education Longitudinal Study of 2002 (ELS:2002), �Base Year, Library Media Center Survey, 2002.�
Table B-3. Standard errors for Table 3: Percent of school library media centers with various work areas, by selected dddddddddschool characteristics: 2002

B-5
Fewer than 8,000
8,000�15,999
16,000�23,999
24,000 or more
Fewer than 250 250�999 1,000�1,749
1,750 or more
Total 3.52 3.09 2.10 0.93 2.88 2.72 1.22 0.32
School sector Public 4.09 3.69 2.61 1.04 3.49 3.33 1.48 0.36 Catholic 6.74 6.85 4.09 2.21 6.15 6.04 1.83 � Other private 6.64 5.30 2.12 2.58 4.72 4.12 2.32 0.84
School urbanicity Urban 6.66 4.48 2.95 2.18 5.00 4.27 2.53 0.96 Suburban 4.72 3.96 3.24 1.15 3.93 3.48 2.40 0.57 Rural 7.14 6.72 3.95 1.77 5.76 5.77 1.07 0.17
School region Northeast 5.84 5.33 4.62 1.99 5.91 5.76 2.59 0.79 Midwest 6.03 6.30 4.17 2.48 5.10 4.91 1.76 0.62 South 5.54 4.66 3.77 1.21 5.64 5.27 2.81 0.54 West 9.71 7.72 4.02 1.52 5.15 4.98 0.96 0.63
Grade span PK, K, 1, 2, 3, 4, or 5�12 8.75 7.39 5.67 1.66 6.70 5.99 3.40 0.52 6, 7, or 8�12 7.41 7.55 3.38 1.46 7.74 7.62 2.01 0.46 9�10, 11, 12 3.68 3.18 2.50 1.40 3.17 2.98 1.25 0.47 10�11, 12 5.94 10.85 8.41 6.46 11.21 9.27 6.23 4.32
School enrollment 1�399 6.54 5.98 3.45 1.56 5.42 5.39 0.80 � 400�799 5.15 5.74 5.37 1.49 5.86 5.49 3.97 � 800�1,199 6.59 6.02 4.21 2.56 6.15 5.60 3.95 1.48 1,200�1,599 1.93 5.36 5.47 3.83 5.29 5.40 4.23 � 1,600+ 0.77 3.81 4.19 3.49 4.31 4.25 3.03 2.76
Grade 10 percent free lunch1
0�5 percent 5.97 4.65 2.46 2.63 4.21 3.66 1.83 0.55 6�20 percent 7.19 6.11 4.65 1.64 6.74 6.28 1.17 1.04 21�50 percent 7.45 6.60 5.27 1.27 6.15 5.84 1.46 0.47 51�100 percent 9.84 8.76 3.86 1.28 8.35 7.71 3.34 0.80See notes at end of table.
2001 holdings � books (all copies)2001 holdings � video materials (tape, DVD,
or laser disc titles; not duplicates)School characteristic
Table B-4. Standard errors for Table 4: Percent of school library media centers with different amounts of dddddddddlibrary collections, by selected school characteristics: 2002

B-6
Fewer than 25 25�49 50�74 75 or more None 1�3 4�6 7 or more
Total 3.40 3.23 1.55 1.31 3.02 3.28 1.81 1.94
School sector Public 3.98 3.93 1.94 1.62 3.28 3.68 2.23 2.40 Catholic 7.29 5.79 4.41 1.84 7.60 5.17 4.85 4.53 Other private 5.40 4.15 1.49 2.15 8.99 9.18 2.42 2.49
School urbanicity Urban 6.36 4.79 2.57 2.21 5.93 5.78 2.69 3.18 Suburban 4.13 4.05 2.23 1.85 4.38 4.13 2.72 2.96 Rural 7.29 7.15 3.05 2.63 5.35 6.28 3.41 3.52
School region Northeast 5.85 6.06 3.09 3.43 5.14 7.15 4.71 5.28 Midwest 6.54 6.71 3.56 2.88 5.23 6.06 4.23 3.42 South 5.55 4.77 2.65 2.24 5.42 5.64 2.37 3.83 West 8.99 8.82 2.53 1.70 7.49 7.74 3.42 2.12
Grade span PK, K, 1, 2, 3, 4, or 5�12 8.26 8.03 0.86 1.28 8.13 9.02 3.59 4.43 6, 7, or 8�12 7.79 7.72 5.00 1.92 7.66 7.87 6.13 6.10 9�10, 11, 12 3.11 3.37 2.21 2.13 3.09 3.42 1.89 2.25 10�11, 12 12.49 11.00 4.74 5.85 � 11.69 12.27 3.44
School enrollment 1�399 6.70 6.53 2.57 2.26 6.56 6.85 3.58 2.44 400�799 5.40 6.07 3.11 2.49 4.64 5.94 3.18 5.38 800�1,199 6.37 5.50 3.16 3.72 3.47 6.10 3.72 4.37 1,200�1,599 4.42 5.48 4.85 4.20 2.29 5.56 5.18 4.91 1,600+ 3.08 4.00 4.08 3.39 2.14 4.54 3.73 4.10
Grade 10 percent free lunch1
0�5 percent 5.60 4.46 2.20 2.36 5.97 6.35 2.96 2.83 6�20 percent 7.24 5.46 3.69 4.09 4.34 6.77 2.84 4.98 21�50 percent 7.16 6.99 3.17 2.00 5.88 6.85 2.97 4.27 51�100 percent 9.53 9.73 4.29 2.46 9.71 8.10 7.12 6.06� Not applicable.1 Percentage of a school�s 10th-grade students that receive free or reduced-price lunch.
Table B-4. Standard errors for Table 4: Percent of school library media centers with different amounts of dddddddddlibrary collections, by selected school characteristics: 2002�Continued
SOURCE: U.S. Department of Education, National Center for Education Statistics, Education Longitudinal Study of 2002 (ELS:2002), �Base Year, Library Media Center Survey, 2002.�
2001 holdings � periodical subscriptions (current print or microform subscriptions)
2001 holdings � electronic database subscriptions (online, CD-ROM, electronic journals, electronic books; not duplicates)School characteristic

B-7
Tele-phone
Fax machine
Photo-copier VCR
Laser disc
playerDVD
playerElectronic
book reader
CD-ROM reader
Personal computer
Automated book
circulation system
Total 3.02 2.21 3.86 2.22 2.96 2.27 0.83 3.56 2.12 3.49
School sector Public 3.00 2.58 4.40 2.58 3.54 2.55 0.55 4.03 2.68 4.00 Catholic 4.18 3.94 5.56 4.39 6.77 6.41 1.53 5.98 1.44 6.75 Other private 10.08 5.10 9.88 5.33 5.58 5.96 4.34 9.41 0.92 8.60
School urbanicity Urban 6.84 3.35 7.35 5.83 4.71 4.41 0.98 6.96 5.79 6.95 Suburban 3.18 3.17 4.50 2.44 4.32 3.20 1.84 4.42 1.48 4.41 Rural 6.06 4.24 7.41 4.03 5.17 3.91 0.49 7.14 4.24 7.18
School region Northeast 2.16 4.62 5.60 4.31 5.89 5.77 1.47 5.63 2.62 5.71 Midwest 4.99 4.50 6.86 4.47 6.24 4.38 0.94 5.96 1.63 6.26 South 5.68 3.89 6.38 3.50 4.44 3.90 2.06 6.48 5.24 5.85 West 7.91 4.08 10.36 5.95 7.66 3.95 � 8.64 0.58 9.70
Grade span PK, K, 1, 2, 3, 4, or 5�12 8.90 5.55 8.65 5.17 6.35 3.48 2.65 9.53 5.51 9.05 6, 7, or 8�12 4.92 4.09 7.45 2.63 7.88 6.86 1.83 7.69 3.37 7.27 9�10, 11, 12 2.43 2.78 3.77 2.87 3.27 2.63 0.59 3.83 2.51 3.60 10�11, 12 � 10.43 12.81 2.54 11.80 7.76 2.20 4.37 � 4.44
School enrollment 1�99 6.97 4.25 7.04 5.24 5.44 4.21 1.80 7.06 4.76 7.17 400�799 2.10 4.91 5.26 1.58 6.03 4.52 1.43 5.46 3.22 4.82 800�1,199 � 4.15 2.34 1.89 5.52 4.86 1.26 3.68 2.80 3.63 1,200�1,599 � 5.17 2.11 2.26 5.56 5.15 � 2.86 1.58 1.65 1,600+ � 4.30 0.47 2.55 4.25 4.15 0.82 2.85 1.24 1.12
Grade 10 percent free lunch1
0�5 percent 6.51 3.27 6.65 3.49 4.83 4.55 0.38 6.11 1.21 6.11 6�20 percent 2.19 5.73 7.52 4.13 6.04 5.11 3.24 4.88 1.24 4.12
21�50 percent 5.84 4.88 7.21 3.93 5.20 3.78 0.65 7.28 4.79 7.2451�100 percent 9.22 4.56 10.97 8.98 9.70 5.25 2.06 10.63 9.64 11.30
Allowed to use item: Students 3.09 6.22 3.24 3.73 4.21 5.02 10.20 1.37 1.95 3.38 Faculty/staff 2.03 3.98 1.81 0.43 0.08 2.59 9.75 0.39 1.72 3.44 Library staff 2.52 5.53 2.93 3.81 4.79 3.44 � 2.14 1.66 1.23See notes at end of table.
School library media center has:
School characteristic
Table B-5a. Standard errors for Table 5: Percent of school library media centers with various equipment and dddddddddd. Ddddd.dddd technology, by selected school characteristics: 2002

B-8
Total 1.73 3.29 2.55 3.65 3.12 2.10 2.79 3.34 3.31 2.14
School sector Public 1.65 3.64 2.88 4.22 3.65 2.12 3.23 3.67 3.55 2.55 Catholic 3.67 6.50 5.45 6.11 4.73 5.70 2.78 7.22 6.93 2.30 Other private 6.73 9.42 6.70 8.99 6.91 7.67 6.61 9.55 9.17 4.82
School urbanicity Urban 6.94 6.11 3.95 5.76 2.46 4.33 1.88 5.89 6.29 1.93 Suburban 1.18 4.19 3.60 4.24 4.17 2.53 3.68 4.02 4.49 2.89 Rural 0.53 6.18 4.38 7.74 6.63 4.29 5.95 6.62 6.02 4.69
School region Northeast 3.38 6.57 4.80 7.14 4.55 4.42 3.70 7.26 6.79 3.77 Midwest 2.49 5.57 5.45 5.72 6.17 3.56 5.81 5.96 5.84 5.31 South 4.01 5.86 4.44 6.55 5.06 0.90 5.34 5.96 5.99 2.63 West � 7.97 5.62 8.75 8.06 7.94 4.50 7.20 7.69 5.19
Grade span PK, K, 1, 2, 3, 4, or 5�12 4.15 8.95 5.69 8.64 8.89 6.82 8.88 9.11 9.42 5.46 6, 7, or 8�12 0.87 7.49 6.96 7.26 8.09 2.77 4.51 7.67 7.69 5.17 9�10, 11, 12 2.40 3.39 2.59 3.63 2.61 1.62 2.12 3.36 3.70 2.37 10�11, 12 � 2.67 9.99 7.03 12.13 4.24 10.04 5.70 4.60 7.91
School enrollment 1�399 3.93 6.94 3.94 7.28 6.38 4.60 5.88 6.92 6.95 4.34 400�799 0.12 4.05 5.55 4.85 5.89 1.94 5.64 5.71 5.25 4.81 800�1,199 � 6.29 5.41 6.12 5.14 2.23 4.14 6.02 6.16 4.40 1,200�1,599 � 4.93 5.66 4.63 5.17 3.32 4.23 4.77 4.68 4.69 1,600+ � 3.32 4.23 4.06 3.93 3.39 3.76 3.85 3.48 4.08
Grade 10 percent free lunch1
0�5 percent 4.17 6.33 4.63 5.90 3.79 4.66 3.33 5.85 5.98 3.54 6�20 percent 0.13 4.85 5.85 7.45 5.84 2.61 7.29 5.86 5.44 4.39 21�50 percent 0.50 6.98 4.75 7.00 6.83 4.85 5.61 6.72 6.96 4.95 51�100 percent 8.68 9.83 7.41 9.67 6.87 2.95 3.68 9.32 10.30 3.66
Allowed to use item: Students 1.90 3.66 3.35 3.68 4.85 3.20 5.68 2.64 3.91 4.69 Faculty/staff 0.93 1.26 2.64 0.64 3.67 0.51 2.52 2.07 1.51 4.13 Library staff 2.63 2.32 1.75 2.83 1.35 2.87 3.35 2.68 2.18 6.53� Not applicable.1 Percentage of a school�s 10th-grade students that receive free or reduced-price lunch.
Table B-5a. Standard errors for Table 5: Percent of school library media centers with various equipment and technology, ddddddddd dddddd.ddd by selected school characteristics: 2002�Continued
School library media center has:
Internet access
Cable TV
Closed-circuit TV
Video camera
Satellite TV hook-
upAudio
equipment
conferenc-ing
equipment Scanner
SOURCE: U.S. Department of Education, National Center for Education Statistics, Education Longitudinal Study of 2002 (ELS:2002), �Base Year, Library Media Center Survey, 2002.�
Tech-nology for
disabled
LCD panel or projection
deviceSchool characteristic

B-9
Office equipment Audiovisual equipment Electronic equipment
Total 0.07 0.14 0.11
School sector Public 0.07 0.15 0.12 Catholic 0.09 0.29 0.21 Other private 0.21 0.42 0.28
School urbanicity Urban 0.15 0.26 0.22 Suburban 0.08 0.19 0.10 Rural 0.13 0.23 0.20
School region Northeast 0.09 0.31 0.15 Midwest 0.12 0.28 0.17 South 0.13 0.25 0.21 West 0.18 0.25 0.02
Grade span PK, K, 1, 2, 3, 4, or 5�12 0.18 0.40 0.25 6, 7, or 8�12 0.10 0.25 0.22 9�10, 11, 12 0.07 0.14 0.11 10�11, 12 0.20 0.03 0.19
School enrollment 1�399 0.14 0.26 0.22 400�799 0.09 0.22 0.12 800�1,199 0.05 0.27 0.14 1,200�1,599 0.06 0.20 0.11 1,600+ 0.04 0.15 0.12
Grade 10 percent free lunch1
0�5 percent 0.14 0.24 0.15 6�20 percent 0.12 0.24 0.13 21�50 percent 0.13 0.30 0.21 51�100 percent 0.20 0.43 0.361Percentage of a school�s 10th-grade students that receive free or reduced-price lunch.
School characteristic
Table B-5b. Standard errors for Table 5b: Mean number of equipment and technology items offered ddddddddd. by school library media centers, by category and selected school characteristics: 2002
SOURCE: U.S. Department of Education, National Center for Education Statistics, Education Longitudinal Study of 2002 (ELS:2002), �Base Year, Library Media Center Survey, 2002.�
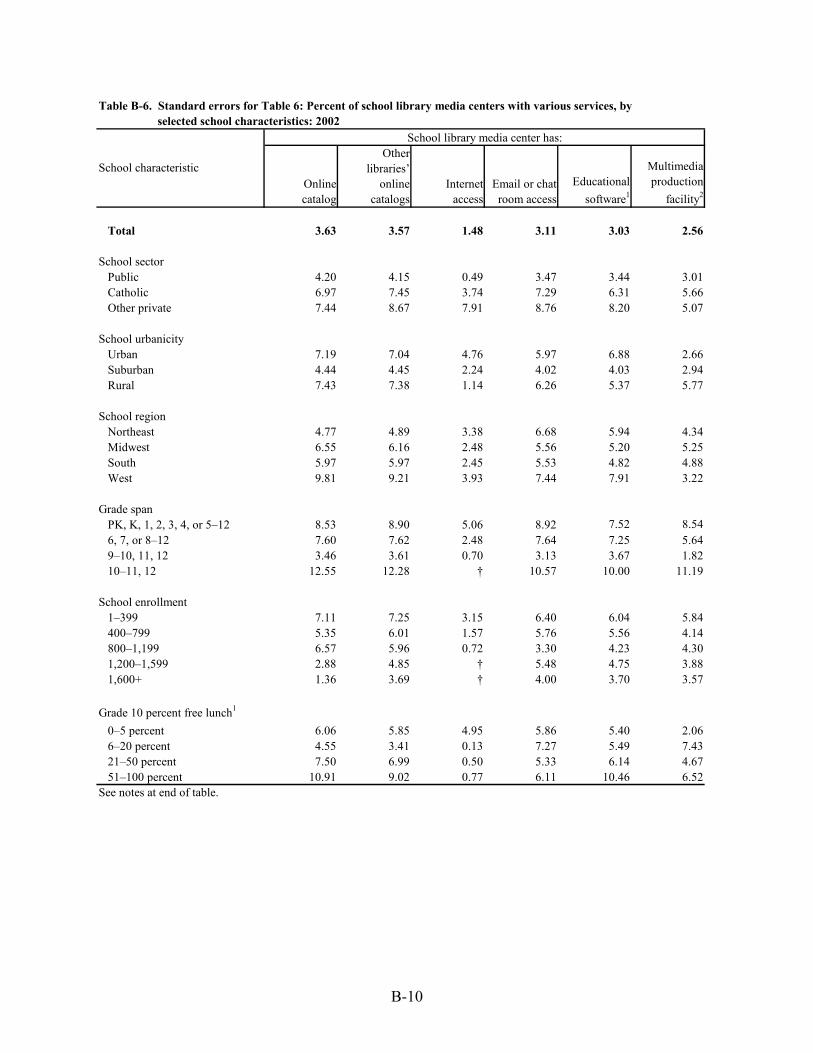
B-10
Online catalog
Other libraries�
online catalogs
Internet access
Email or chat room access
Educational software1
Multimedia production
facility2
Total 3.63 3.57 1.48 3.11 3.03 2.56
School sector Public 4.20 4.15 0.49 3.47 3.44 3.01 Catholic 6.97 7.45 3.74 7.29 6.31 5.66 Other private 7.44 8.67 7.91 8.76 8.20 5.07
School urbanicity Urban 7.19 7.04 4.76 5.97 6.88 2.66 Suburban 4.44 4.45 2.24 4.02 4.03 2.94 Rural 7.43 7.38 1.14 6.26 5.37 5.77
School region Northeast 4.77 4.89 3.38 6.68 5.94 4.34 Midwest 6.55 6.16 2.48 5.56 5.20 5.25 South 5.97 5.97 2.45 5.53 4.82 4.88 West 9.81 9.21 3.93 7.44 7.91 3.22
Grade span PK, K, 1, 2, 3, 4, or 5�12 8.53 8.90 5.06 8.92 7.52 8.54 6, 7, or 8�12 7.60 7.62 2.48 7.64 7.25 5.64 9�10, 11, 12 3.46 3.61 0.70 3.13 3.67 1.82 10�11, 12 12.55 12.28 � 10.57 10.00 11.19
School enrollment 1�399 7.11 7.25 3.15 6.40 6.04 5.84 400�799 5.35 6.01 1.57 5.76 5.56 4.14 800�1,199 6.57 5.96 0.72 3.30 4.23 4.30 1,200�1,599 2.88 4.85 � 5.48 4.75 3.88 1,600+ 1.36 3.69 � 4.00 3.70 3.57
Grade 10 percent free lunch1
0�5 percent 6.06 5.85 4.95 5.86 5.40 2.06 6�20 percent 4.55 3.41 0.13 7.27 5.49 7.43 21�50 percent 7.50 6.99 0.50 5.33 6.14 4.67 51�100 percent 10.91 9.02 0.77 6.11 10.46 6.52See notes at end of table.
School library media center has:
Table B-6. Standard errors for Table 6: Percent of school library media centers with various services, by dddddddddselected school characteristics: 2002
School characteristic
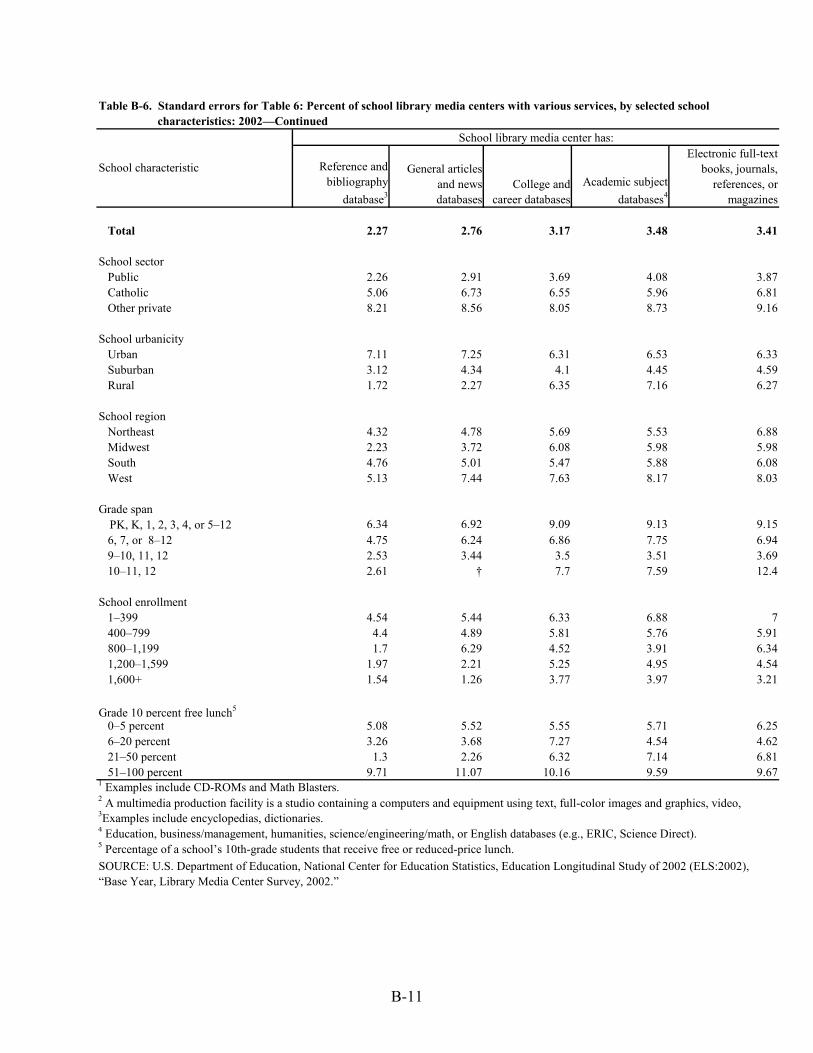
B-11
Total 2.27 2.76 3.17 3.48 3.41
School sector Public 2.26 2.91 3.69 4.08 3.87 Catholic 5.06 6.73 6.55 5.96 6.81 Other private 8.21 8.56 8.05 8.73 9.16
School urbanicity Urban 7.11 7.25 6.31 6.53 6.33 Suburban 3.12 4.34 4.1 4.45 4.59 Rural 1.72 2.27 6.35 7.16 6.27
School region Northeast 4.32 4.78 5.69 5.53 6.88 Midwest 2.23 3.72 6.08 5.98 5.98 South 4.76 5.01 5.47 5.88 6.08 West 5.13 7.44 7.63 8.17 8.03
Grade spanPK, K, 1, 2, 3, 4, or 5�12 6.34 6.92 9.09 9.13 9.15
6, 7, or 8�12 4.75 6.24 6.86 7.75 6.94 9�10, 11, 12 2.53 3.44 3.5 3.51 3.69 10�11, 12 2.61 � 7.7 7.59 12.4
School enrollment 1�399 4.54 5.44 6.33 6.88 7 400�799 4.4 4.89 5.81 5.76 5.91 800�1,199 1.7 6.29 4.52 3.91 6.34 1,200�1,599 1.97 2.21 5.25 4.95 4.54 1,600+ 1.54 1.26 3.77 3.97 3.21
Grade 10 percent free lunch5
0�5 percent 5.08 5.52 5.55 5.71 6.25 6�20 percent 3.26 3.68 7.27 4.54 4.62 21�50 percent 1.3 2.26 6.32 7.14 6.81 51�100 percent 9.71 11.07 10.16 9.59 9.671 Examples include CD-ROMs and Math Blasters.
3Examples include encyclopedias, dictionaries.4 Education, business/management, humanities, science/engineering/math, or English databases (e.g., ERIC, Science Direct).5 Percentage of a school�s 10th-grade students that receive free or reduced-price lunch.
School characteristic Reference and bibliography
database3
SOURCE: U.S. Department of Education, National Center for Education Statistics, Education Longitudinal Study of 2002 (ELS:2002), �Base Year, Library Media Center Survey, 2002.�
Table B-6. Standard errors for Table 6: Percent of school library media centers with various services, by selected school dddddddddcharacteristics: 2002�Continued
2 A multimedia production facility is a studio containing a computers and equipment using text, full-color images and graphics, video,
School library media center has:
General articles and news databases
College and career databases
Academic subject databases4
Electronic full-text books, journals,
references, or magazines
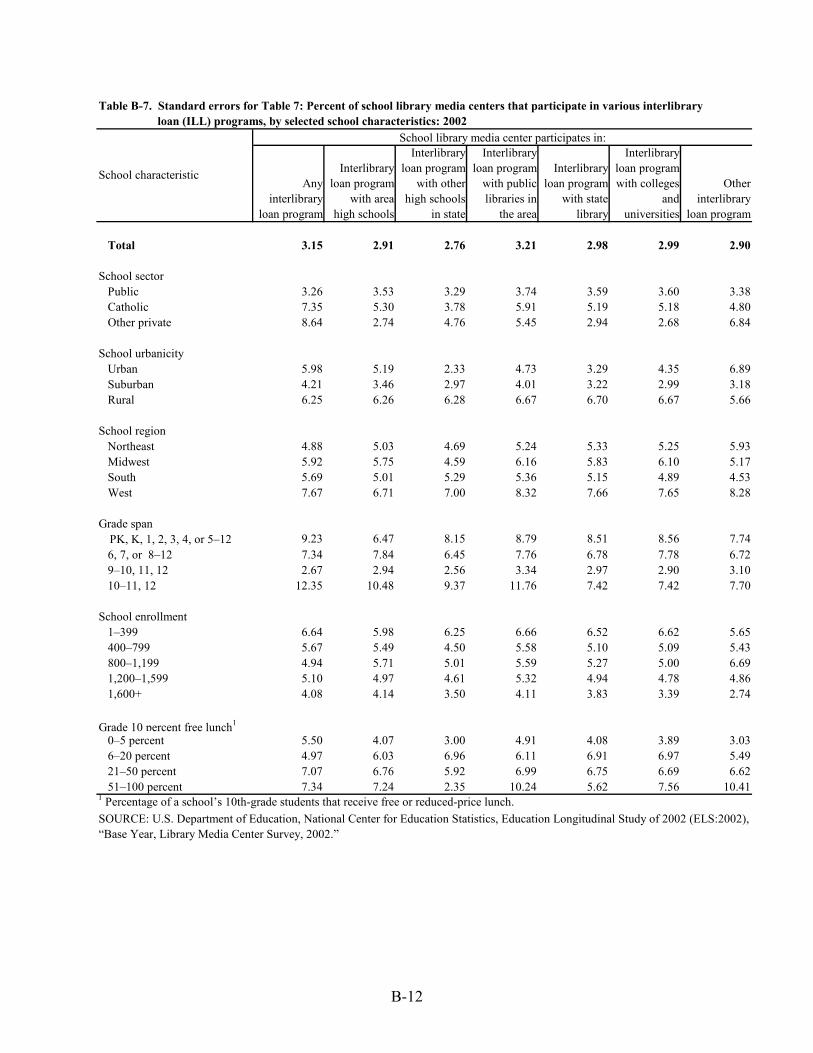
B-12
Total 3.15 2.91 2.76 3.21 2.98 2.99 2.90
School sector Public 3.26 3.53 3.29 3.74 3.59 3.60 3.38 Catholic 7.35 5.30 3.78 5.91 5.19 5.18 4.80 Other private 8.64 2.74 4.76 5.45 2.94 2.68 6.84
School urbanicity Urban 5.98 5.19 2.33 4.73 3.29 4.35 6.89 Suburban 4.21 3.46 2.97 4.01 3.22 2.99 3.18 Rural 6.25 6.26 6.28 6.67 6.70 6.67 5.66
School region Northeast 4.88 5.03 4.69 5.24 5.33 5.25 5.93 Midwest 5.92 5.75 4.59 6.16 5.83 6.10 5.17 South 5.69 5.01 5.29 5.36 5.15 4.89 4.53 West 7.67 6.71 7.00 8.32 7.66 7.65 8.28
Grade spanPK, K, 1, 2, 3, 4, or 5�12 9.23 6.47 8.15 8.79 8.51 8.56 7.74
6, 7, or 8�12 7.34 7.84 6.45 7.76 6.78 7.78 6.72 9�10, 11, 12 2.67 2.94 2.56 3.34 2.97 2.90 3.10 10�11, 12 12.35 10.48 9.37 11.76 7.42 7.42 7.70
School enrollment 1�399 6.64 5.98 6.25 6.66 6.52 6.62 5.65 400�799 5.67 5.49 4.50 5.58 5.10 5.09 5.43 800�1,199 4.94 5.71 5.01 5.59 5.27 5.00 6.69 1,200�1,599 5.10 4.97 4.61 5.32 4.94 4.78 4.86 1,600+ 4.08 4.14 3.50 4.11 3.83 3.39 2.74
Grade 10 percent free lunch1
0�5 percent 5.50 4.07 3.00 4.91 4.08 3.89 3.03 6�20 percent 4.97 6.03 6.96 6.11 6.91 6.97 5.49 21�50 percent 7.07 6.76 5.92 6.99 6.75 6.69 6.62 51�100 percent 7.34 7.24 2.35 10.24 5.62 7.56 10.411 Percentage of a school�s 10th-grade students that receive free or reduced-price lunch.SOURCE: U.S. Department of Education, National Center for Education Statistics, Education Longitudinal Study of 2002 (ELS:2002), �Base Year, Library Media Center Survey, 2002.�
School library media center participates in:
Any interlibrary
loan program
Interlibrary loan program
with area high schools
Interlibrary loan program
with other high schools
in state
Interlibrary loan program
with public libraries in
the area
Interlibrary loan program
with state library
Other interlibrary
loan program
Table B-7. Standard errors for Table 7: Percent of school library media centers that participate in various interlibrary dddddddddloan (ILL) programs, by selected school characteristics: 2002
Interlibrary loan program with colleges
and universities
School characteristic
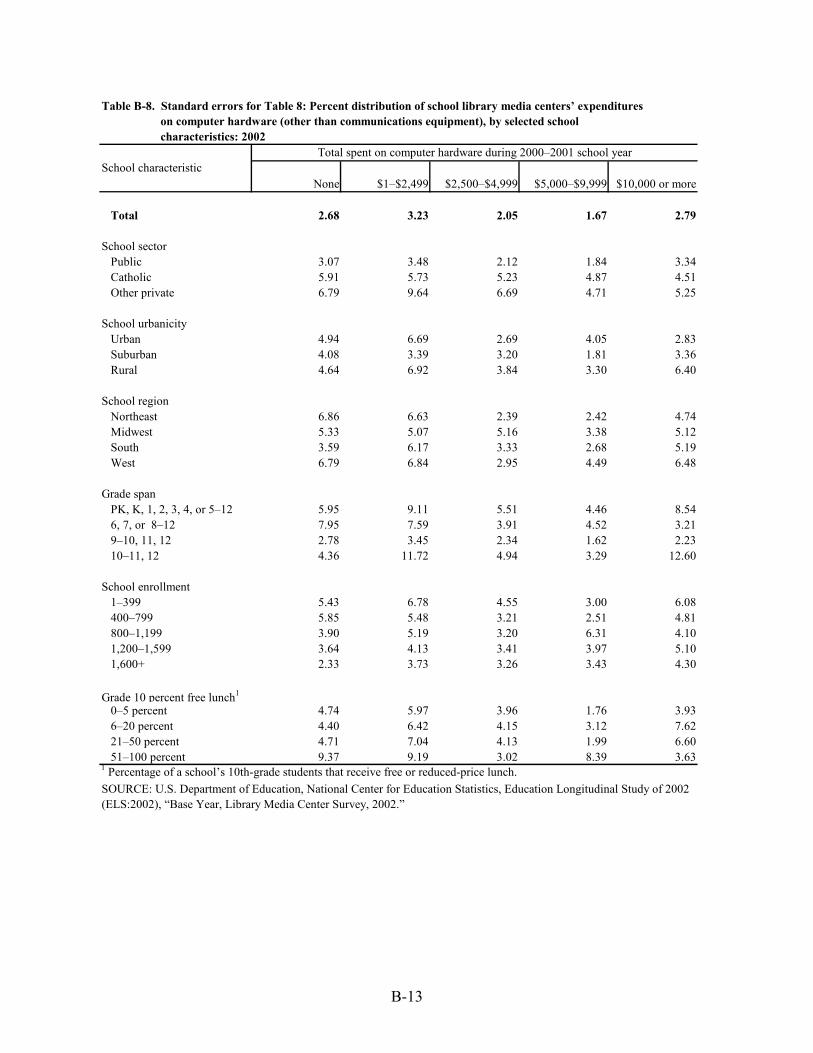
B-13
None $1�$2,499 $2,500�$4,999 $5,000�$9,999 $10,000 or more
Total 2.68 3.23 2.05 1.67 2.79
School sector Public 3.07 3.48 2.12 1.84 3.34 Catholic 5.91 5.73 5.23 4.87 4.51 Other private 6.79 9.64 6.69 4.71 5.25
School urbanicity Urban 4.94 6.69 2.69 4.05 2.83 Suburban 4.08 3.39 3.20 1.81 3.36 Rural 4.64 6.92 3.84 3.30 6.40
School region Northeast 6.86 6.63 2.39 2.42 4.74 Midwest 5.33 5.07 5.16 3.38 5.12 South 3.59 6.17 3.33 2.68 5.19 West 6.79 6.84 2.95 4.49 6.48
Grade span PK, K, 1, 2, 3, 4, or 5�12 5.95 9.11 5.51 4.46 8.54 6, 7, or 8�12 7.95 7.59 3.91 4.52 3.21 9�10, 11, 12 2.78 3.45 2.34 1.62 2.23 10�11, 12 4.36 11.72 4.94 3.29 12.60
School enrollment 1�399 5.43 6.78 4.55 3.00 6.08 400�799 5.85 5.48 3.21 2.51 4.81 800�1,199 3.90 5.19 3.20 6.31 4.10 1,200�1,599 3.64 4.13 3.41 3.97 5.10 1,600+ 2.33 3.73 3.26 3.43 4.30
Grade 10 percent free lunch1
0�5 percent 4.74 5.97 3.96 1.76 3.93 6�20 percent 4.40 6.42 4.15 3.12 7.62 21�50 percent 4.71 7.04 4.13 1.99 6.60 51�100 percent 9.37 9.19 3.02 8.39 3.631 Percentage of a school�s 10th-grade students that receive free or reduced-price lunch.
Total spent on computer hardware during 2000�2001 school yearSchool characteristic
Table B-8. Standard errors for Table 8: Percent distribution of school library media centers� expenditures dddddddddon computer hardware (other than communications equipment), by selected school dddddddddcharacteristics: 2002
SOURCE: U.S. Department of Education, National Center for Education Statistics, Education Longitudinal Study of 2002 (ELS:2002), �Base Year, Library Media Center Survey, 2002.�
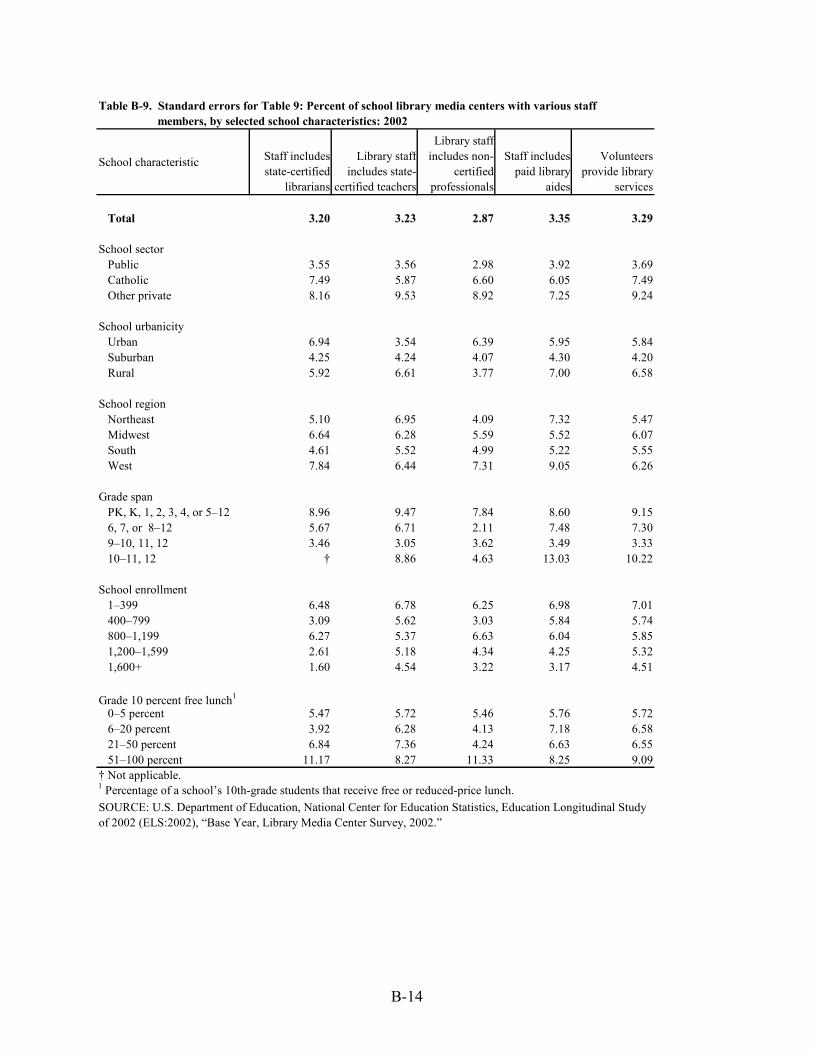
B-14
School characteristic Staff includes state-certified
librarians
Library staff includes state-
certified teachers
Library staff includes non-
certified professionals
Staff includes paid library
aides
Volunteers provide library
services
Total 3.20 3.23 2.87 3.35 3.29
School sector Public 3.55 3.56 2.98 3.92 3.69 Catholic 7.49 5.87 6.60 6.05 7.49 Other private 8.16 9.53 8.92 7.25 9.24
School urbanicity Urban 6.94 3.54 6.39 5.95 5.84 Suburban 4.25 4.24 4.07 4.30 4.20 Rural 5.92 6.61 3.77 7.00 6.58
School region Northeast 5.10 6.95 4.09 7.32 5.47 Midwest 6.64 6.28 5.59 5.52 6.07 South 4.61 5.52 4.99 5.22 5.55 West 7.84 6.44 7.31 9.05 6.26
Grade span PK, K, 1, 2, 3, 4, or 5�12 8.96 9.47 7.84 8.60 9.15 6, 7, or 8�12 5.67 6.71 2.11 7.48 7.30 9�10, 11, 12 3.46 3.05 3.62 3.49 3.33 10�11, 12 � 8.86 4.63 13.03 10.22
School enrollment 1�399 6.48 6.78 6.25 6.98 7.01 400�799 3.09 5.62 3.03 5.84 5.74 800�1,199 6.27 5.37 6.63 6.04 5.85 1,200�1,599 2.61 5.18 4.34 4.25 5.32 1,600+ 1.60 4.54 3.22 3.17 4.51
Grade 10 percent free lunch1
0�5 percent 5.47 5.72 5.46 5.76 5.72 6�20 percent 3.92 6.28 4.13 7.18 6.58 21�50 percent 6.84 7.36 4.24 6.63 6.55 51�100 percent 11.17 8.27 11.33 8.25 9.09� Not applicable.1 Percentage of a school�s 10th-grade students that receive free or reduced-price lunch.SOURCE: U.S. Department of Education, National Center for Education Statistics, Education Longitudinal Study of 2002 (ELS:2002), �Base Year, Library Media Center Survey, 2002.�
Table B-9. Standard errors for Table 9: Percent of school library media centers with various staff dddddddddmembers, by selected school characteristics: 2002

B-15
NeverOnce during
the year
Once or twice a semester or
term Monthly WeeklyMore than
once a week
Total 3.61 0.69 2.88 2.68 1.86 2.38
School sector Public 3.90 0.86 3.37 3.22 2.23 2.19 Catholic 5.37 0.88 5.85 5.70 4.50 3.66 Other private 10.73 � 6.13 2.57 3.20 10.07
School urbanicity Urban 5.92 0.21 4.32 4.12 3.51 4.50 Suburban 3.42 0.30 3.48 3.12 2.61 3.99 Rural 7.83 1.82 6.25 5.83 2.29 3.10
School region Northeast 2.40 � 5.62 5.56 4.97 4.22 Midwest 4.93 1.26 5.74 5.26 3.74 4.82 South 6.63 1.58 4.21 4.81 3.24 4.34 West 10.56 0.59 8.41 4.89 2.07 4.65
Grade span PK, K, 1, 2, 3, 4, or 5�12 9.85 1.33 5.87 6.73 2.84 7.05 6, 7, or 8�12 3.65 3.46 7.27 7.72 4.54 5.77 9�10, 11, 12 1.16 0.26 3.34 2.62 2.38 1.94 10�11, 12 � � 9.42 11.49 6.60 8.64
School enrollment 1�399 7.91 1.49 6.67 5.14 2.44 4.24 400�799 4.16 1.44 4.19 5.51 4.47 4.67 800�1,199 1.20 0.78 3.37 4.40 5.30 6.58 1,200�1,599 0.59 0.67 4.43 4.90 4.49 4.42 1,600+ 1.21 1.10 3.00 3.51 3.94 4.29
Grade 10 percent free lunch1
0�5 percent 6.82 0.16 4.09 3.84 3.55 4.88 6�20 percent 7.71 0.19 5.88 5.31 3.60 4.94 21�50 percent 7.20 1.19 5.54 6.59 3.14 3.91 51�100 percent � 0.89 9.38 3.95 6.86 7.25� Not applicable.1 Percentage of a school�s 10th-grade students that receive free or reduced-price lunch.
How frequently worked with English teachers during the 2001�2002 school year
School characteristic
SOURCE: U.S. Department of Education, National Center for Education Statistics, Education Longitudinal Study of 2002 (ELS:2002), �Base Year, Library Media Center Survey, 2002.�
Table B-10. Standard errors for Table 10: Percent distribution of how frequently school library media center ddddddddddsurvey respondents worked with English teachers to plan and deliver instruction, by selected ddddddddddschool characteristics: 2002

B-16
NeverOnce during
the year
Once or twice a semester or
term Monthly WeeklyMore than
once a week
Total 3.58 1.77 2.81 1.78 0.57 0.93
School sector Public 3.96 2.13 3.26 1.92 0.50 0.34 Catholic 7.01 4.55 5.73 3.47 2.66 � Other private 10.57 2.46 6.64 5.73 2.58 5.67
School urbanicity Urban 6.18 4.15 3.59 2.20 2.15 4.29 Suburban 4.48 2.77 4.00 3.19 0.51 0.65 Rural 6.51 2.60 5.50 2.75 0.79 0.14
School region Northeast 6.31 5.68 5.80 4.24 � 0.25 Midwest 6.63 2.79 5.52 2.17 1.48 � South 6.67 2.54 5.47 3.71 1.01 0.14 West 7.17 4.74 2.58 3.42 0.54 4.62
Grade span PK, K, 1, 2, 3, 4, or 5�12 8.67 3.05 6.43 4.77 � 3.26 6, 7, or 8�12 7.68 6.21 7.12 5.62 0.96 � 9�10, 11, 12 3.51 2.01 3.00 1.45 0.98 0.50 10�11, 12 9.39 7.74 10.78 4.66 4.99 �
School enrollment 1�399 6.72 1.94 5.79 2.85 1.09 � 400�799 6.30 4.37 5.07 4.77 1.28 1.08 800�1,199 5.60 4.79 4.85 1.38 1.09 7.04 1,200�1,599 4.65 5.59 5.06 3.94 1.83 � 1,600+ 4.36 3.60 4.81 2.75 0.98 0.49
Grade 10 percent free lunch1
0�5 percent 6.36 3.79 4.94 2.01 1.60 � 6�20 percent 7.37 3.80 5.37 4.11 1.26 1.17 21�50 percent 6.89 1.64 6.04 4.03 0.71 0.21 51�100 percent 8.08 7.41 5.70 2.57 1.51 7.92� Not applicable.1 Percentage of a school�s 10th-grade students that receive free or reduced-price lunch.
How frequently worked with math teachers during the 2001�2002 school year
SOURCE: U.S. Department of Education, National Center for Education Statistics, Education Longitudinal Study of 2002 (ELS:2002), �Base Year, Library Media Center Survey, 2002.�
School characteristic
Table B-11. Standard errors for Table 11: Percent distribution of how frequently school library media ddddddddddcenter survey respondents worked with math teachers to plan and deliver instruction, by ddddddddddselected school characteristics: 2002

B-17
During scheduled
periods/set times Anytime
Students may use
library on own before
or after school
Students may use
library on own during lunch break
Students may use
library on own during
set times throughout
the day
Students may use
library on own between
classes or during recess
Students may use
library on own at other
time
Total 3.24 3.24 6.87 6.56 5.98 6.54 5.52
School sector Public 3.64 3.64 7.42 7.68 5.95 7.98 6.07 Catholic 5.81 5.81 13.50 13.23 6.59 12.48 10.30 Other private 8.85 8.85 15.70 15.32 16.72 9.59 14.16
School urbanicity Urban 6.52 6.52 12.25 9.76 9.24 9.72 9.16 Suburban 4.00 4.00 9.75 9.57 8.79 8.26 8.95 Rural 6.65 6.65 11.56 10.05 11.78 14.20 4.50
School region Northeast 6.51 6.51 8.59 9.17 6.93 10.55 6.74 Midwest 5.05 5.05 7.13 10.51 4.27 12.04 6.97 South 4.82 4.82 12.98 12.22 12.49 8.75 10.57 West 9.74 9.74 16.09 15.06 14.20 16.19 14.18
Grade span PK, K, 1, 2, 3, 4, or 5�12 9.01 9.01 13.69 14.09 12.25 13.73 9.86 6, 7, or 8�12 5.31 5.31 17.44 17.59 3.65 10.28 12.05 9�10, 11, 12 3.58 3.58 8.75 8.33 7.08 7.58 7.04 10�11, 12 10.20 10.20 � 10.33 11.18 10.91 18.07
School enrollment 1�399 6.89 6.89 12.50 12.43 11.78 11.45 10.39 400�799 4.47 4.47 5.47 8.40 6.78 8.62 8.72 800�1,199 6.12 6.12 19.14 17.28 9.16 12.74 10.19 1,200�1,599 4.84 4.84 3.03 5.74 7.37 8.16 8.76 1,600+ 3.87 3.87 1.93 4.11 7.94 6.16 7.78
Grade 10 percent free lunch1
0�5 percent 6.13 6.13 12.16 11.56 13.07 9.42 9.21 6�20 percent 5.13 5.13 4.28 11.50 8.13 11.13 11.02 21�50 percent 6.97 6.97 4.94 11.62 5.59 10.85 2.82 51�100 percent 10.03 10.03 12.84 12.49 16.78 11.20 17.01� Not applicable.1 Percentage of a school�s 10th-grade students that receive free or reduced-price lunch.
When students may use library on own Of those schools with set times for students� use of library on own:
Table B-12. Standard errors for Table 12: Percent distribution of when students may use school library media ddddddddddcenters on their own, by selected school characteristics: 2002
SOURCE: U.S. Department of Education, National Center for Education Statistics, Education Longitudinal Study of 2002 (ELS:2002), �Base Year, Library Media Center Survey, 2002.�
School characteristic
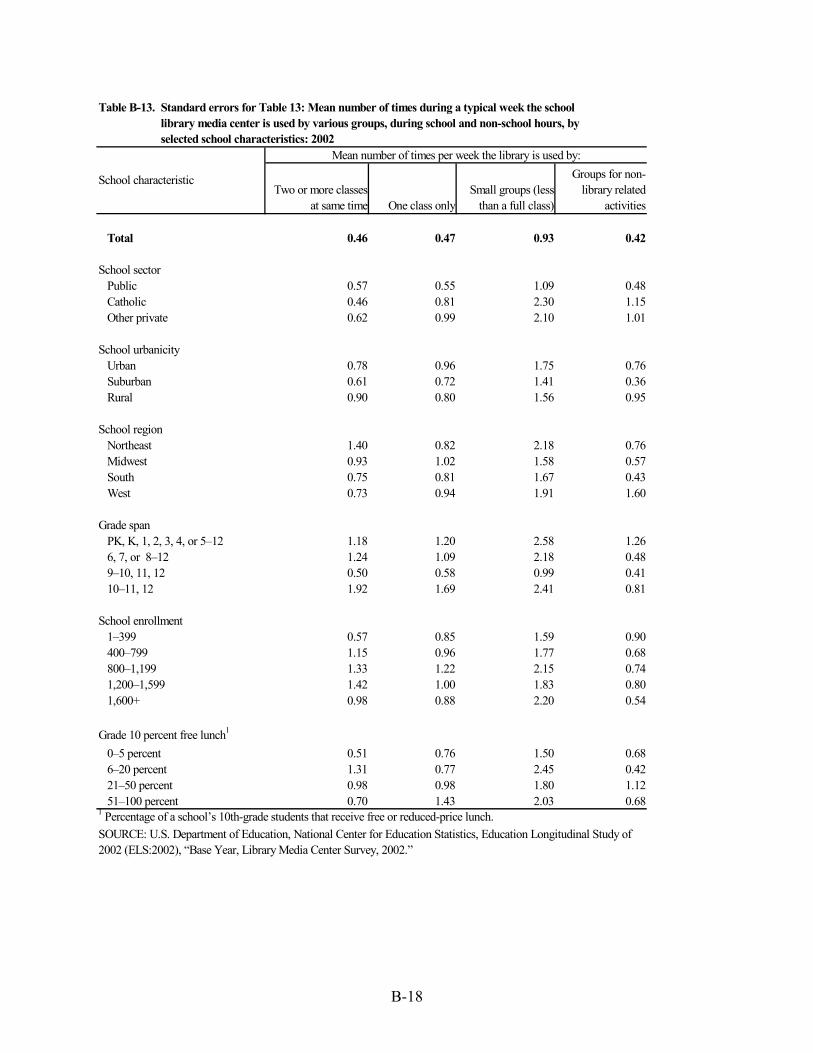
B-18
Two or more classes at same time One class only
Small groups (less than a full class)
Groups for non-library related
activities
Total 0.46 0.47 0.93 0.42
School sector Public 0.57 0.55 1.09 0.48 Catholic 0.46 0.81 2.30 1.15 Other private 0.62 0.99 2.10 1.01
School urbanicity Urban 0.78 0.96 1.75 0.76 Suburban 0.61 0.72 1.41 0.36 Rural 0.90 0.80 1.56 0.95
School region Northeast 1.40 0.82 2.18 0.76 Midwest 0.93 1.02 1.58 0.57 South 0.75 0.81 1.67 0.43 West 0.73 0.94 1.91 1.60
Grade span PK, K, 1, 2, 3, 4, or 5�12 1.18 1.20 2.58 1.26 6, 7, or 8�12 1.24 1.09 2.18 0.48 9�10, 11, 12 0.50 0.58 0.99 0.41 10�11, 12 1.92 1.69 2.41 0.81
School enrollment 1�399 0.57 0.85 1.59 0.90 400�799 1.15 0.96 1.77 0.68 800�1,199 1.33 1.22 2.15 0.74 1,200�1,599 1.42 1.00 1.83 0.80 1,600+ 0.98 0.88 2.20 0.54
Grade 10 percent free lunch1
0�5 percent 0.51 0.76 1.50 0.68 6�20 percent 1.31 0.77 2.45 0.42 21�50 percent 0.98 0.98 1.80 1.12 51�100 percent 0.70 1.43 2.03 0.681 Percentage of a school�s 10th-grade students that receive free or reduced-price lunch.
Mean number of times per week the library is used by:
School characteristic
Table B-13. Standard errors for Table 13: Mean number of times during a typical week the school ddddddddddlibrary media center is used by various groups, during school and non-school hours, by ddddddddddselected school characteristics: 2002
SOURCE: U.S. Department of Education, National Center for Education Statistics, Education Longitudinal Study of 2002 (ELS:2002), �Base Year, Library Media Center Survey, 2002.�
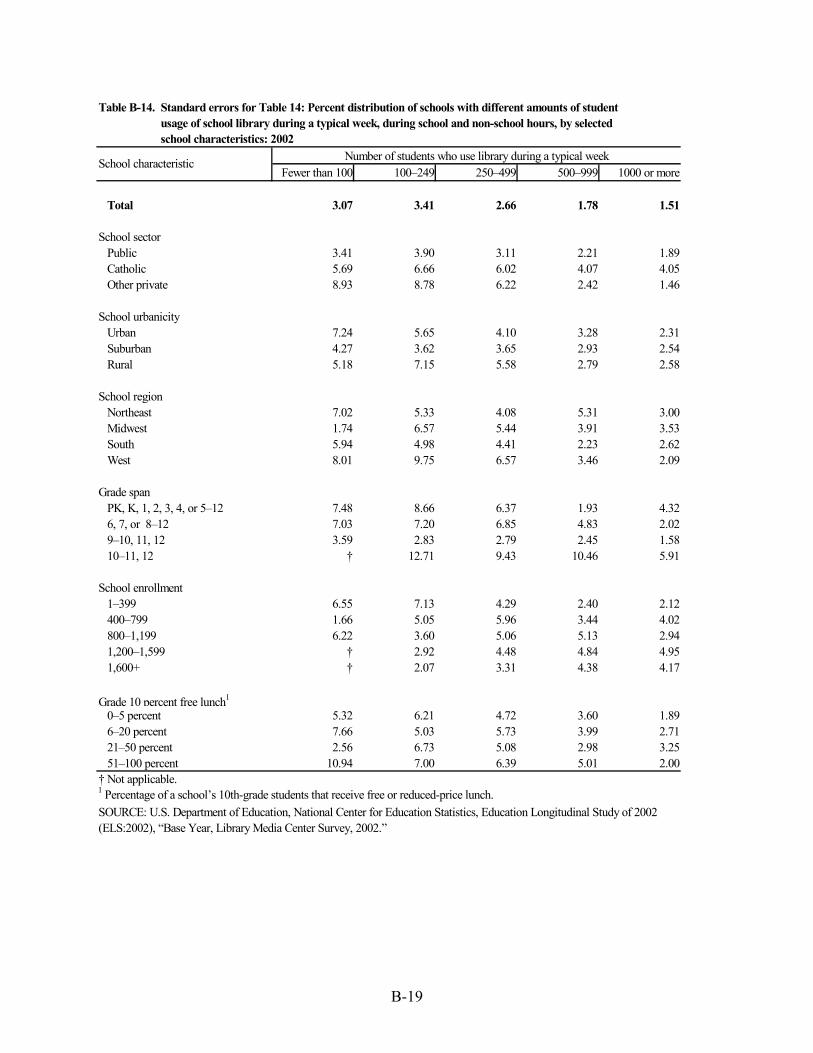
B-19
Fewer than 100 100�249 250�499 500�999 1000 or more
Total 3.07 3.41 2.66 1.78 1.51
School sector Public 3.41 3.90 3.11 2.21 1.89 Catholic 5.69 6.66 6.02 4.07 4.05 Other private 8.93 8.78 6.22 2.42 1.46
School urbanicity Urban 7.24 5.65 4.10 3.28 2.31 Suburban 4.27 3.62 3.65 2.93 2.54 Rural 5.18 7.15 5.58 2.79 2.58
School region Northeast 7.02 5.33 4.08 5.31 3.00 Midwest 1.74 6.57 5.44 3.91 3.53 South 5.94 4.98 4.41 2.23 2.62 West 8.01 9.75 6.57 3.46 2.09
Grade span PK, K, 1, 2, 3, 4, or 5�12 7.48 8.66 6.37 1.93 4.32 6, 7, or 8�12 7.03 7.20 6.85 4.83 2.02 9�10, 11, 12 3.59 2.83 2.79 2.45 1.58 10�11, 12 � 12.71 9.43 10.46 5.91
School enrollment 1�399 6.55 7.13 4.29 2.40 2.12 400�799 1.66 5.05 5.96 3.44 4.02 800�1,199 6.22 3.60 5.06 5.13 2.94 1,200�1,599 � 2.92 4.48 4.84 4.95 1,600+ � 2.07 3.31 4.38 4.17
Grade 10 percent free lunch1
0�5 percent 5.32 6.21 4.72 3.60 1.89 6�20 percent 7.66 5.03 5.73 3.99 2.71 21�50 percent 2.56 6.73 5.08 2.98 3.25 51�100 percent 10.94 7.00 6.39 5.01 2.00� Not applicable.1 Percentage of a school�s 10th-grade students that receive free or reduced-price lunch.
Number of students who use library during a typical weekSchool characteristic
Table B-14. Standard errors for Table 14: Percent distribution of schools with different amounts of student ddddddddddusage of school library during a typical week, during school and non-school hours, by selected ddddddddddschool characteristics: 2002
SOURCE: U.S. Department of Education, National Center for Education Statistics, Education Longitudinal Study of 2002 (ELS:2002), �Base Year, Library Media Center Survey, 2002.�

B-20
0 1�2 3�5 6 or moreVaries by
grade levelNo
maximum
Total 1.33 3.01 3.24 1.06 2.59 2.38
School sector Public 1.69 3.10 3.79 1.27 2.97 2.68 Catholic � 4.29 5.44 4.18 2.63 6.94 Other private � 9.71 7.61 1.66 7.29 6.18
School urbanicity Urban 5.94 5.51 4.23 2.04 3.95 3.58 Suburban 0.60 3.61 4.26 1.51 3.03 3.60 Rural � 6.31 6.95 2.04 5.65 4.40
School region Northeast � 5.41 5.81 2.49 1.46 6.34 Midwest � 5.08 5.45 1.66 5.58 4.41 South 3.48 6.15 5.25 1.00 3.75 3.07 West 1.31 4.02 9.51 3.95 7.59 6.46
Grade span PK, K, 1, 2, 3, 4, or 5�12 � 9.11 8.74 0.72 8.60 1.84 6, 7, or 8�12 � 4.74 7.53 1.37 4.41 7.06 9�10, 11, 12 2.38 2.47 3.28 1.78 0.57 3.10 10�11, 12 � 12.78 11.99 6.04 � 8.96
School enrollment 1�399 3.18 6.29 7.10 1.87 5.14 5.08 400�799 1.09 5.10 5.76 2.01 5.43 4.05 800�1,199 � 6.47 4.99 2.98 2.90 4.68 1,200�1,599 � 3.81 5.49 3.69 � 5.19 1,600+ � 2.29 4.33 3.00 � 3.79
Grade 10 percent free lunch1
0�5 percent � 6.08 5.37 1.90 3.40 4.68 6�20 percent � 3.44 6.55 1.70 3.59 5.77 21�50 percent 0.88 6.48 6.56 2.65 6.16 3.62 51�100 percent 8.69 8.35 6.71 1.30 6.73 8.64� Not applicable.1 Percentage of a school�s 10th-grade students that receive free or reduced-price lunch.
Maximum number of books student may take out of library at a time
School characteristic
Table B-15. Standard errors for Table 15: Percent of schools with different maximum number of ddddddddddbooks that a student may check out of the school library at one time, by selected school ddddddddddcharacteristics: 2002
SOURCE: U.S. Department of Education, National Center for Education Statistics, Education Longitudinal Study of 2002 (ELS:2002), �Base Year, Library Media Center Survey, 2002.�

B-21
School characteristic Mean circulation per weekMean circulation per
student, per week
Total 26.48 0.098
School sector Public 24.13 0.10 Catholic 10.04 0.033 Other private 119.58 0.38
School urbanicity Urban 58.93 0.064 Suburban 26.60 0.049 Rural 56.78 0.24
School region Northeast 31.19 0.057 Midwest 51.18 0.25 South 31.08 0.083 West 89.47 0.29
Grade span PK, K, 1, 2, 3, 4, or 5�12 85.24 0.28 6, 7, or 8�12 33.41 0.076 9�10, 11, 12 16.40 0.064 10�11, 12 48.15 0.024
School enrollment 1�399 52.70 0.21 400�799 43.04 0.071 800�1,199 83.26 0.071 1,200�1,599 40.06 0.029 1,600+ 49.02 0.022
Grade 10 percent free lunch1
0�5 percent 58.72 0.23 6�20 percent 26.40 0.11 21�50 percent 45.39 0.21 51�100 percent 82.62 0.911 Percentage of a school�s 10th-grade students that receive free or reduced-price lunch.SOURCE: U.S. Department of Education, National Center for Education Statistics, Education Longitudinal Study of 2002 (ELS:2002), �Base Year, Library Media Center Survey, 2002.�
Table B-16. Standard errors for Table 16: Mean total circulation of library ddddddddddmaterials (books, etc.) checked out from the library media center ddddddddddduring a typical week, and per student, by selected school ddddddddddcharacteristics: 2002

B-22
Reference materials Periodicals
AV materials
AV equipment
Computer software (includes
CD-ROM)Computer hardware
None of these
Total 3.25 3.31 2.99 2.44 2.00 0.99 3.08 2.92
School sector Public 3.63 3.70 3.60 2.92 2.26 1.24 3.40 3.35 Catholic 5.39 6.01 6.90 5.65 4.71 1.22 5.52 6.68 Other private 9.37 9.53 5.17 5.24 5.34 1.05 9.22 7.42
School urbanicity Urban 5.73 6.03 4.78 3.14 3.78 1.50 4.80 6.43 Suburban 3.87 4.33 3.54 3.56 3.03 1.99 4.24 3.78 Rural 6.54 6.41 6.61 4.87 3.54 1.07 6.12 4.97
School region Northeast 6.07 5.97 5.25 4.86 3.20 3.07 5.99 5.15 Midwest 6.25 5.35 6.17 5.42 5.05 1.76 4.34 5.17 South 5.62 5.93 3.51 2.58 2.56 0.95 5.80 4.56 West 7.37 7.53 8.88 6.72 4.51 3.06 7.10 8.66
Grade spanPK, K, 1, 2, 3, 4, or 5�12 8.24 8.78 6.94 5.07 4.26 0.65 8.73 6.62
6, 7, or 8�12 7.47 7.83 7.00 6.41 6.35 4.08 7.30 5.85 9�10, 11, 12 3.37 3.49 3.25 2.79 2.22 1.22 2.86 3.41 10�11, 12 11.28 12.21 11.64 7.65 8.32 5.59 12.46 10.60
School enrollment 1�399 6.51 6.92 5.92 4.82 3.77 1.76 6.72 5.97 400�799 5.86 5.03 5.35 5.05 4.23 2.03 4.44 5.22 800�1,199 5.39 4.88 5.58 5.41 4.75 2.77 3.55 6.26 1,200�1,599 5.53 5.03 5.26 4.49 3.94 2.12 4.40 5.30 1,600+ 4.37 4.22 4.09 3.70 3.49 2.13 3.34 4.46
Grade 10 percent free lunch1
0�5 percent 5.51 5.58 4.51 4.15 4.41 2.01 5.29 4.52 6�20 percent 6.43 6.93 6.26 5.13 3.18 1.73 7.42 5.06 21�50 percent 6.38 6.14 6.51 4.99 3.86 1.06 5.83 5.52 51�100 percent 9.51 9.20 6.91 4.12 5.03 1.95 8.83 10.351 Percentage of a school�s 10th-grade students that receive free or reduced-price lunch.SOURCE: U.S. Department of Education, National Center for Education Statistics, Education Longitudinal Study of 2002 (ELS:2002), �Base Year, Library Media Center Survey, 2002.�
Students may take out:
School characteristic
Table B-17. Standard errors for Table 17: Percent distribution of schools allowing certain materials to be taken out ddddddddddof the school library, by selected school characteristics: 2002
Parents allowed to check out
material

B-23
Assign-ments
In-school
projects Home-
workResearch
papersLeisure reading
To read magazines
or news-papers
To read books for
fun
Interests outside of
schoolInternet
access
Total 0.76 0.79 0.62 0.76 0.41 0.46 0.46 0.48 0.78
Sex Male 0.96 0.95 0.72 0.96 0.57 0.60 0.57 0.67 0.93 Female 0.90 0.96 0.83 0.87 0.56 0.62 0.64 0.60 0.95
Race/ethnicityAmerican Indian/Alaska Native, non-Hispanic 6.49 6.24 4.77 6.07 4.09 4.96 4.65 4.81 5.17Asian, Hawaii/Pacific Islander, non-Hispanic 2.22 2.35 1.66 2.12 1.41 1.63 1.50 1.28 1.89Black or African-American, non-Hispanic 1.64 1.73 1.39 1.79 1.17 1.49 1.38 1.41 1.68Hispanic 1.51 1.59 1.53 1.71 1.03 1.03 1.21 1.26 1.57Multiracial, non-Hispanic 2.43 2.59 1.96 2.71 2.20 1.96 2.11 2.03 2.57White, non-Hispanic 0.95 1.01 0.80 0.96 0.50 0.57 0.50 0.57 1.04
Socioeconomic status Lowest quartile 1.19 1.29 1.08 1.24 0.83 0.88 0.93 0.95 1.23 Middle two quartiles 0.94 0.93 0.71 0.94 0.52 0.62 0.58 0.63 0.94 Highest quartile 1.21 1.25 1.11 1.26 0.72 0.75 0.73 0.78 1.25
Composite achievement test score in grade 10 Lowest quartile 1.14 1.20 1.12 1.30 0.87 0.94 1.06 1.04 1.22 Middle two quartiles 0.89 0.95 0.79 0.92 0.56 0.63 0.56 0.64 0.97 Highest quartile 1.25 1.23 1.03 1.30 0.67 0.68 0.72 0.74 1.25
School sector Public 0.80 0.83 0.65 0.81 0.44 0.49 0.50 0.51 0.83 Catholic 2.65 2.76 2.02 2.69 1.12 1.25 0.78 1.38 2.74 Other private 4.10 3.93 2.75 3.67 1.58 1.83 1.61 1.75 3.98
School urbanicity Urban 1.47 1.53 1.12 1.45 0.73 0.80 0.85 0.88 1.37 Suburban 1.03 1.10 0.85 1.09 0.58 0.62 0.66 0.65 1.13 Rural 1.76 1.70 1.47 1.58 0.92 1.22 0.99 1.17 1.79
School region Northeast 1.95 2.11 1.76 2.22 1.09 1.09 1.08 1.03 2.27 Midwest 1.45 1.51 1.27 1.34 0.82 1.09 0.92 0.96 1.60 South 1.16 1.24 0.84 1.11 0.60 0.73 0.77 0.77 1.18 West 1.70 1.69 1.35 1.72 0.90 0.87 1.02 1.13 1.45
Percent of students who reported �sometimes� or �often� to use of school library for these purposes:
Table B-18. Standard errors for Table 18: Percent of students who reported �sometimes� or �often� for use of school ddddddddddlibrary media center for various purposes, for students whose schools have library media centers, by selected ddddddddddstudent characteristics: 2002
Student characteristic
SOURCE: U.S. Department of Education, National Center for Education Statistics, Education Longitudinal Study of 2002 (ELS:2002), �Base Year, Student Survey, 2002.�
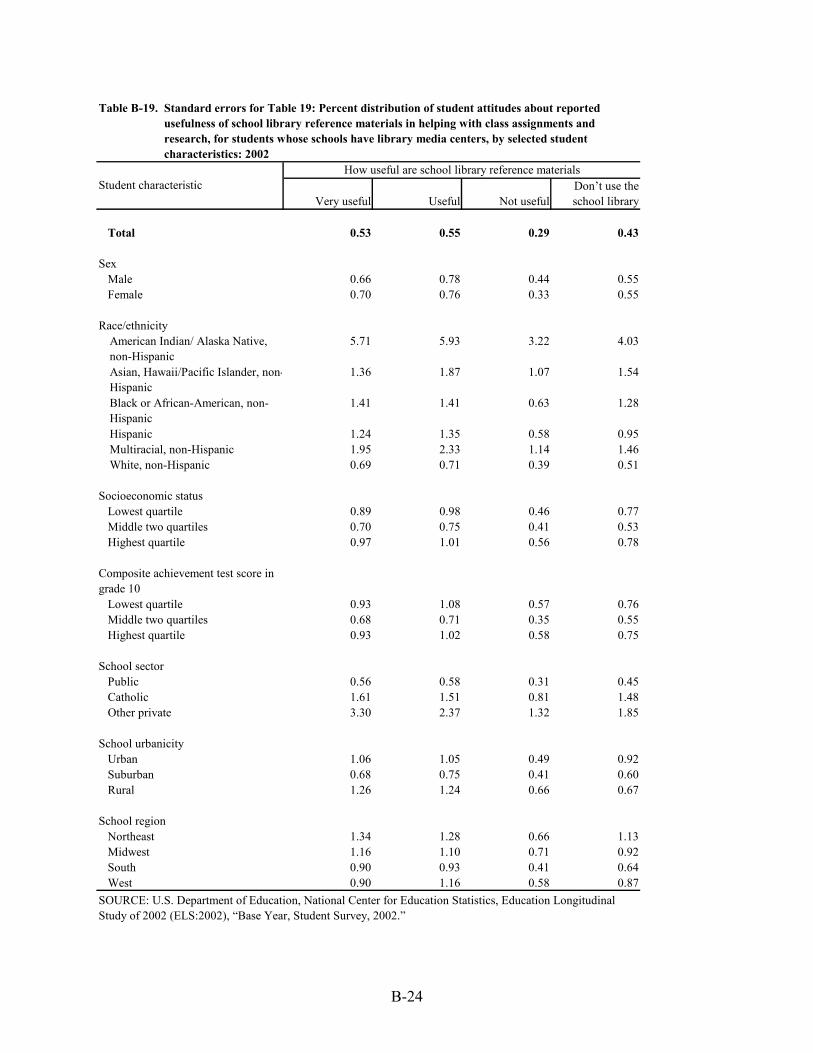
B-24
Very useful Useful Not usefulDon�t use the school library
Total 0.53 0.55 0.29 0.43
Sex Male 0.66 0.78 0.44 0.55 Female 0.70 0.76 0.33 0.55
Race/ethnicityAmerican Indian/ Alaska Native, non-Hispanic
5.71 5.93 3.22 4.03
Asian, Hawaii/Pacific Islander, non-Hispanic
1.36 1.87 1.07 1.54
Black or African-American, non-Hispanic
1.41 1.41 0.63 1.28
Hispanic 1.24 1.35 0.58 0.95Multiracial, non-Hispanic 1.95 2.33 1.14 1.46White, non-Hispanic 0.69 0.71 0.39 0.51
Socioeconomic status Lowest quartile 0.89 0.98 0.46 0.77 Middle two quartiles 0.70 0.75 0.41 0.53 Highest quartile 0.97 1.01 0.56 0.78
Composite achievement test score in grade 10 Lowest quartile 0.93 1.08 0.57 0.76 Middle two quartiles 0.68 0.71 0.35 0.55 Highest quartile 0.93 1.02 0.58 0.75
School sector Public 0.56 0.58 0.31 0.45 Catholic 1.61 1.51 0.81 1.48 Other private 3.30 2.37 1.32 1.85
School urbanicity Urban 1.06 1.05 0.49 0.92 Suburban 0.68 0.75 0.41 0.60 Rural 1.26 1.24 0.66 0.67
School region Northeast 1.34 1.28 0.66 1.13 Midwest 1.16 1.10 0.71 0.92 South 0.90 0.93 0.41 0.64 West 0.90 1.16 0.58 0.87
Table B-19. Standard errors for Table 19: Percent distribution of student attitudes about reported ddddddddddusefulness of school library reference materials in helping with class assignments and ddddddddddresearch, for students whose schools have library media centers, by selected student ddddddddddcharacteristics: 2002
How useful are school library reference materials Student characteristic
SOURCE: U.S. Department of Education, National Center for Education Statistics, Education Longitudinal Study of 2002 (ELS:2002), �Base Year, Student Survey, 2002.�

B-25
Finding research resources (books, magazines,
newspaper articles) on a research topic
Using online databases or CD-ROMs for research
Using the Internet for research
Total 0.57 0.71 0.66
Sex Male 0.74 0.90 0.82 Female 0.69 0.82 0.80
Race/ethnicityAmerican Indian/Alaska Native, non-Hispanic 4.81 6.88 8.51Asian, Hawaii/Pacific Islander, non-Hispanic 1.96 2.23 2.42Black or African-American, non-Hispanic 1.44 1.70 1.65Hispanic 1.28 1.45 1.45Multiracial, non-Hispanic 1.83 2.25 2.18White, non-Hispanic 0.68 0.87 0.81
Socioeconomic status Lowest quartile 1.05 1.20 1.18 Middle two quartiles 0.73 0.89 0.81 Highest quartile 1.02 1.17 1.07
Composite achievement test score in grade 10 Lowest quartile 0.92 1.11 1.01 Middle two quartiles 0.74 0.87 0.84 Highest quartile 0.96 1.17 1.14
School sector Public 0.60 0.75 0.70 Catholic 2.02 2.11 2.01 Other private 2.82 4.03 3.61
School urbanicity Urban 1.06 1.30 1.17 Suburban 0.81 1.00 0.92 Rural 1.25 1.63 1.62
School region Northeast 1.36 1.69 1.62 Midwest 1.21 1.45 1.28 South 0.95 1.16 1.10 West 1.14 1.57 1.46
Percent of students who reported �very helpful� or �helpful� to questions regarding helpfulness of library staff with various tasks:
Student characteristic
Table B-20. Standard errors for Table 20: Percent of students who reported �very helpful� or �helpful� for ddddddddddquestions about helpfulness of library staff with various tasks, for students whose schools have ddddddddddlibrary media centers, by selected student characteristics: 2002
SOURCE: U.S. Department of Education, National Center for Education Statistics, Education Longitudinal Study of 2002 (ELS:2002), �Base Year, Student Survey, 2000.
C-1
Appendix C: ELS:2002 Library Media Center Questionnaire This questionnaire (and other ELS:2002 questionnaires) is available on the NCES website at http://www.nces.ed.gov/surveys/els2002/questionnaires.asp