school of computing and information sciences
TRANSCRIPT
School of Computing and Information Sciences
Summary of Direct Assessment Data for the BS in Computer Science Academic Year 2012 -2013
Prepared by Norman Pestaina, Undergraduate Programs Assessments Coordinator. August 18, 2013
In accordance with the SCIS Assessment Plan for the BS in Computer Science, several direct measures of attainment of Student Outcomes were undertaken. BS in CS Student Outcomes (Revised Fall 2010) To complete the program of study for the BS in Computer Science, every student will a) Demonstrate proficiency in the foundation areas of Computer Science including
mathematics, discrete structures, logic and the theory of algorithms. b) Demonstrate proficiency in various areas of Computer Science including data structures and
algorithms, concepts of programming languages and computer systems. c) Demonstrate proficiency in problem solving and application of software engineering
techniques. d) Demonstrate mastery of at least one modern programming language and proficiency in at
least one other. e) Demonstrate understanding of the social and ethical concerns of the practicing computer
scientist. f) Demonstrate the ability to work cooperatively in teams. g) Demonstrate effective communication skills. h) Have experience with contemporary environments and tools necessary for the practice of
computing.
The Direct Assessment Schedule for AY 2012-13 is attached as an appendix.
The Course Outcomes for the BS-CS courses are included into the common course syllabi and
may be viewed at http://www.cis.fiu.edu/courses.php
Drafts (Spring 2012 vintage) of the Student Learning Outcomes for the BS-CS courses may be
viewed at: http://users.cis.fiu.edu/~pestaina/learning_outcomes.html
The raw data summarized in this report, and the assessment rubrics utilized to derive the data,
may be inspected at http://users.cis.fiu.edu/~pestaina/cis4911.html

Page | 2
BS-CS Student Outcome (a): Foundation Areas Course-embedded Assessment in MAD 2104 Discrete Mathematics, Fall 2012
The final examination responses in one section of MAD 2104 were analyzed by applying the Discrete Structures Assessment rubric. On each exam, the response to each of 16 questions was rated 1 (substantially correct answer) or 0. Ratings of the exams of 19 Computer Science majors who passed the course (C or higher grade) are summarized:
# answers rated 1 16 15 14 13 12 11 10 <= 9
% answers rated 1 100% 94% 88% 81% 75% 69% 63% <= 56%
# exams 1 1 1 2 1 5 3 5
Cumulative # exams 1 2 3 5 6 11 14 19
Cumulative % exams 5% 11% 16% 26% 32% 58% 74% 100% TABLE 1-1: MAD 2104, Rubric Score by Number of Exams
The following table shows, for each rubric item, the associated MAD 2104 Student Learning Outcome, and the number and percentage of exam responses that were rated 1:
Rubric
Student Learning
Answers rated 1
Item # Outcome Discrete Structures Rubric Item Description # %
1 1.1 Understand Terminology of SETS 13 68
2 1.2 Write SET Theory Proof 7 37
3 1.1 Understand Terminology of RELATIONS 17 89
4 1.2 Perform Operations on RELATIONS 11 58
5 1.1 Understand Terminology of FUNCTIONS 18 95
6 1.2 Perform Operations on FUNCTIONS 10 53
7 2.1 Understand Notation of LOGIC 19 100
8 2.1 Apply Methods of LOGIC 17 89
9 3.1 Know Structure of PROOFS 11 58
10 3.2 Apply MATHEMATICAL INDUCTION 3 16
11 4.1 Compute PERMUTATIONS 14 74
12 4.1 Compute COMBINATIONS 14 74
13 5.1 Know Terminology of GRAPHS 16 84
14 5.2 Apply Methods of GRAPHS 15 79
15 6.1 Use Disjunctive Normal Form in BOOLEAN ALGEBRA 13 68
16 6.2 Apply Minimization Techniques in BOOLEAN ALGEBRA 18 42
TABLE 1-2: MAD 2104, Rubric Ratings by Rubric Item
Expectation: a. 75% of the completed exams should achieve a rubric rating total of at least 75%. b. Each of the 16 rubric items should be rated 1 on at least 75% of exams.
Observations: a. 32 % of the completed exams achieved a rubric rating total of 75% or better. b. 8 of the 16 rubric items were rated 1 on at least 74% of exams.

Page | 3
BS-CS Student Outcome (a): Foundation Areas Course-embedded Assessment in MAD 3512 Theory of Algorithms, Fall 2012
33 students enrolled in MAD3512 completed a 10-question multiple choice assessment quiz. Results of only the 27 students who passed the course are considered. The results are summarized as follows:
# correct answers 10, 9 8 7 6 5 4 3 <= 2
% correct answers >= 90% 80% 70% 60% 50% 40% 30% <= 20%
# quizzes 0 6 8 6 4 1 2 0
Cumulative # quizzes 0 6 14 20 24 25 27 27
Cumulative % quizzes 0% 22% 52% 74% 89% 93% 100% 100% TABLE 2-1: MAD 3512, Quiz Score by Number of Students
The following table shows for each quiz question, the associated MAD 3512 Student Learning Outcome, and the number and percentage of correct answers:
Quiz Question
Student Learning
Correct Answers
Outcome # %
1 1.1 25 93
2 1.2 27 100
3 1.3 16 59
4 1.4 14 52
5 2.1 14 52
6 1.3 24 89
7 3.2 5 19
8 4.1 11 41
9 3.1 17 63
10 2.2 19 70
TABLE 2-2: MAD 3512, Scores for each Quiz Question
Expectation: a. 75% of the quizzes should be scored 75% or higher b. Each of the 16 rubric items should be scored 1 on at least 75% of the quizzes.
Observations: a. 32 % of the quizzes were scored 75% or better. 74% achieved a score of 63%. b. 8 of the 16 rubric items were answered correctly on at least 74% of the quizzes.
Page | 4
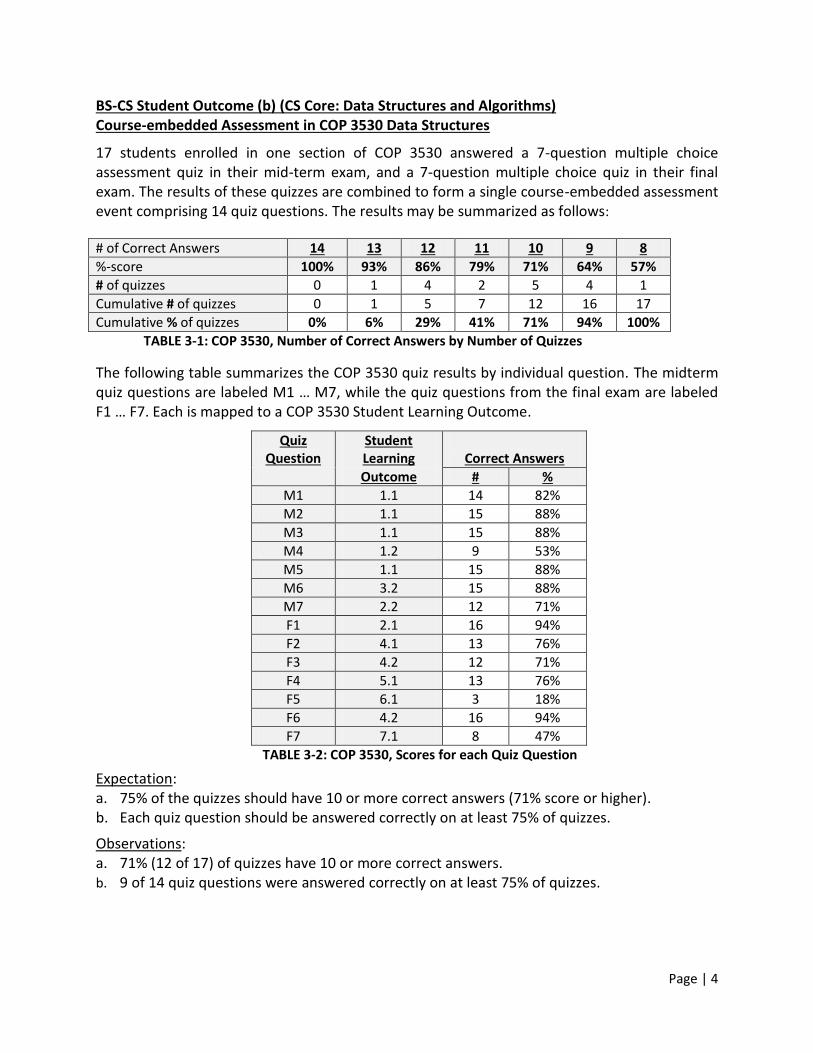
BS-CS Student Outcome (b) (CS Core: Data Structures and Algorithms) Course-embedded Assessment in COP 3530 Data Structures
17 students enrolled in one section of COP 3530 answered a 7-question multiple choice assessment quiz in their mid-term exam, and a 7-question multiple choice quiz in their final exam. The results of these quizzes are combined to form a single course-embedded assessment event comprising 14 quiz questions. The results may be summarized as follows:
# of Correct Answers 14 13 12 11 10 9 8
%-score 100% 93% 86% 79% 71% 64% 57%
# of quizzes 0 1 4 2 5 4 1
Cumulative # of quizzes 0 1 5 7 12 16 17
Cumulative % of quizzes 0% 6% 29% 41% 71% 94% 100%
TABLE 3-1: COP 3530, Number of Correct Answers by Number of Quizzes
The following table summarizes the COP 3530 quiz results by individual question. The midterm quiz questions are labeled M1 … M7, while the quiz questions from the final exam are labeled F1 … F7. Each is mapped to a COP 3530 Student Learning Outcome.
Quiz Question
Student Learning
Correct Answers
Outcome # %
M1 1.1 14 82%
M2 1.1 15 88%
M3 1.1 15 88%
M4 1.2 9 53%
M5 1.1 15 88%
M6 3.2 15 88%
M7 2.2 12 71%
F1 2.1 16 94%
F2 4.1 13 76%
F3 4.2 12 71%
F4 5.1 13 76%
F5 6.1 3 18%
F6 4.2 16 94%
F7 7.1 8 47%
TABLE 3-2: COP 3530, Scores for each Quiz Question
Expectation: a. 75% of the quizzes should have 10 or more correct answers (71% score or higher). b. Each quiz question should be answered correctly on at least 75% of quizzes.
Observations: a. 71% (12 of 17) of quizzes have 10 or more correct answers. b. 9 of 14 quiz questions were answered correctly on at least 75% of quizzes.
Page | 5
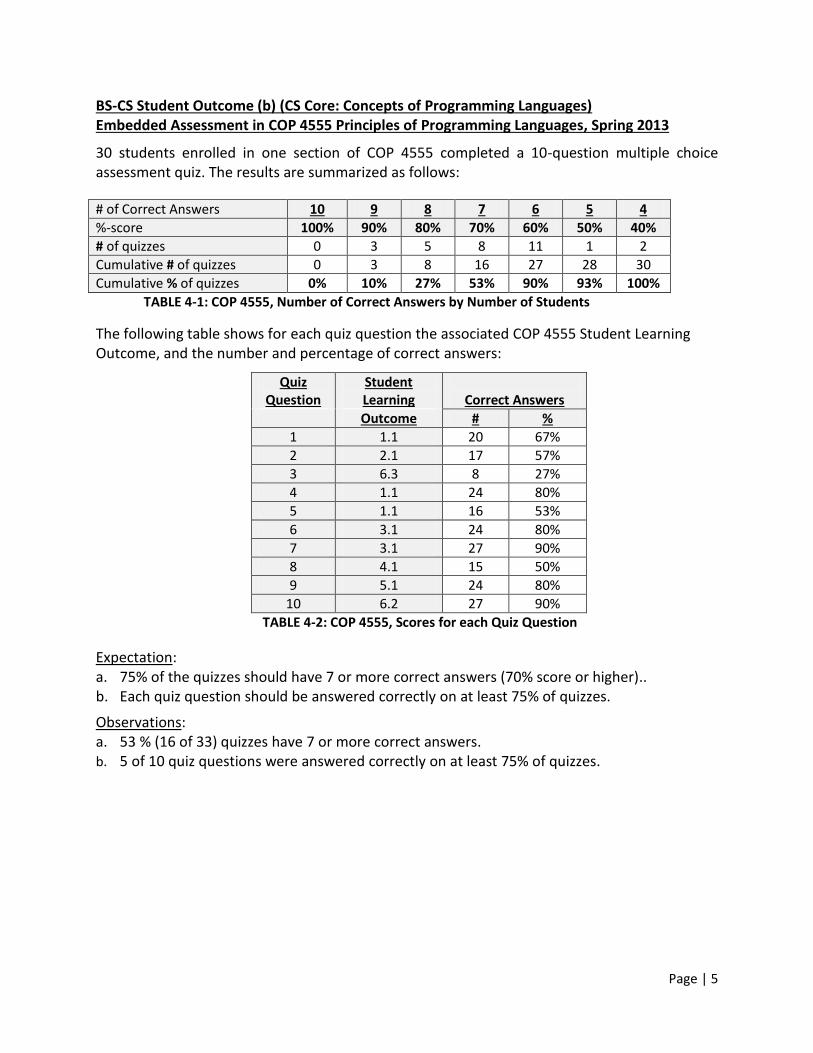
BS-CS Student Outcome (b) (CS Core: Concepts of Programming Languages) Embedded Assessment in COP 4555 Principles of Programming Languages, Spring 2013
30 students enrolled in one section of COP 4555 completed a 10-question multiple choice assessment quiz. The results are summarized as follows:
# of Correct Answers 10 9 8 7 6 5 4
%-score 100% 90% 80% 70% 60% 50% 40%
# of quizzes 0 3 5 8 11 1 2
Cumulative # of quizzes 0 3 8 16 27 28 30
Cumulative % of quizzes 0% 10% 27% 53% 90% 93% 100%
TABLE 4-1: COP 4555, Number of Correct Answers by Number of Students
The following table shows for each quiz question the associated COP 4555 Student Learning Outcome, and the number and percentage of correct answers:
Quiz Question
Student Learning
Correct Answers
Outcome # %
1 1.1 20 67%
2 2.1 17 57%
3 6.3 8 27%
4 1.1 24 80%
5 1.1 16 53%
6 3.1 24 80%
7 3.1 27 90%
8 4.1 15 50%
9 5.1 24 80%
10 6.2 27 90%
TABLE 4-2: COP 4555, Scores for each Quiz Question
Expectation: a. 75% of the quizzes should have 7 or more correct answers (70% score or higher).. b. Each quiz question should be answered correctly on at least 75% of quizzes.
Observations: a. 53 % (16 of 33) quizzes have 7 or more correct answers. b. 5 of 10 quiz questions were answered correctly on at least 75% of quizzes.

Page | 6
BS-CS Student Outcome (b) (CS Core: Computer Systems - Database) Course-embedded Assessment in COP 4710 Database Management, Fall 2012 20 students enrolled in one section of COP 4710 completed a 5-question multiple choice assessment quiz. The results are summarized as follows:
# of Correct Answers 5 4 3 2
%-score 100% 80% 60% <= 40%
# of quizzes 9 10 1 0
Cumulative # of quizzes 9 19 20 20
Cumulative % of quizzes 45% 95% 100% 100%
TABLE 5-1: COP 4710, Number of Correct Answers by Number of Quizzes
The following table shows for each quiz question the associated COP 4710 Student Learning Outcome, and the number and percentage of correct answers:
Quiz Question
Student Learning
Correct Answers
Outcome(s) # %
1 1.1, 2.1, 3.1 20 100%
2 4.1 20 100%
3 3.2, 5.1 16 80%
4 5.2, 7.1 13 65%
5 6.1 19 95%
TABLE 5-2: COP 4710, Scores for each Quiz Question
Expectation: a. 75% of the quizzes should have 4 or 5 correct answers (80% score or higher).. b. Each quiz question should be answered correctly on at least 75% of quizzes.
Observations: a. 95% (19 of 20) of quizzes have 4 or 5 correct answers. b. 4 of 5 quiz questions were answered correctly on at least 75% of quizzes.
Page | 7
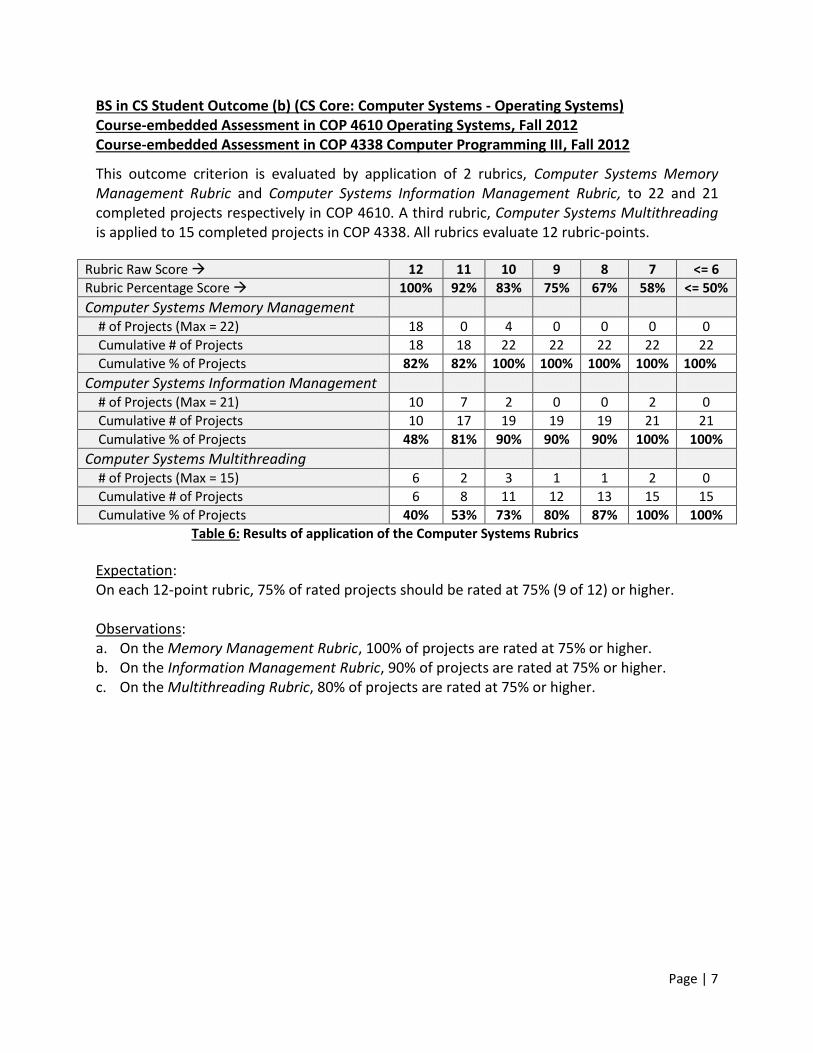
BS in CS Student Outcome (b) (CS Core: Computer Systems - Operating Systems) Course-embedded Assessment in COP 4610 Operating Systems, Fall 2012 Course-embedded Assessment in COP 4338 Computer Programming III, Fall 2012
This outcome criterion is evaluated by application of 2 rubrics, Computer Systems Memory Management Rubric and Computer Systems Information Management Rubric, to 22 and 21 completed projects respectively in COP 4610. A third rubric, Computer Systems Multithreading is applied to 15 completed projects in COP 4338. All rubrics evaluate 12 rubric-points.
Rubric Raw Score 12 11 10 9 8 7 <= 6
Rubric Percentage Score 100% 92% 83% 75% 67% 58% <= 50%
Computer Systems Memory Management
# of Projects (Max = 22) 18 0 4 0 0 0 0
Cumulative # of Projects 18 18 22 22 22 22 22
Cumulative % of Projects 82% 82% 100% 100% 100% 100% 100%
Computer Systems Information Management
# of Projects (Max = 21) 10 7 2 0 0 2 0
Cumulative # of Projects 10 17 19 19 19 21 21
Cumulative % of Projects 48% 81% 90% 90% 90% 100% 100%
Computer Systems Multithreading
# of Projects (Max = 15) 6 2 3 1 1 2 0
Cumulative # of Projects 6 8 11 12 13 15 15
Cumulative % of Projects 40% 53% 73% 80% 87% 100% 100%
Table 6: Results of application of the Computer Systems Rubrics
Expectation: On each 12-point rubric, 75% of rated projects should be rated at 75% (9 of 12) or higher. Observations: a. On the Memory Management Rubric, 100% of projects are rated at 75% or higher. b. On the Information Management Rubric, 90% of projects are rated at 75% or higher. c. On the Multithreading Rubric, 80% of projects are rated at 75% or higher.
Page | 8
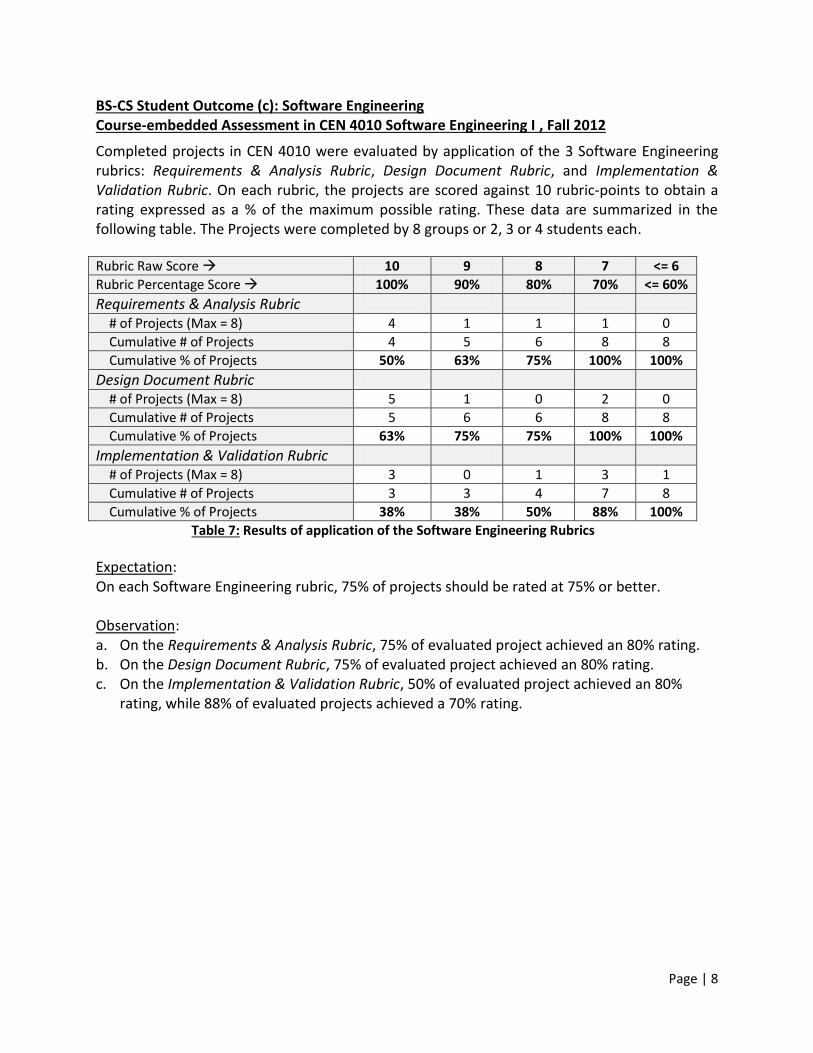
BS-CS Student Outcome (c): Software Engineering Course-embedded Assessment in CEN 4010 Software Engineering I , Fall 2012
Completed projects in CEN 4010 were evaluated by application of the 3 Software Engineering rubrics: Requirements & Analysis Rubric, Design Document Rubric, and Implementation & Validation Rubric. On each rubric, the projects are scored against 10 rubric-points to obtain a rating expressed as a % of the maximum possible rating. These data are summarized in the following table. The Projects were completed by 8 groups or 2, 3 or 4 students each.
Rubric Raw Score 10 9 8 7 <= 6
Rubric Percentage Score 100% 90% 80% 70% <= 60%
Requirements & Analysis Rubric
# of Projects (Max = 8) 4 1 1 1 0
Cumulative # of Projects 4 5 6 8 8
Cumulative % of Projects 50% 63% 75% 100% 100%
Design Document Rubric
# of Projects (Max = 8) 5 1 0 2 0
Cumulative # of Projects 5 6 6 8 8
Cumulative % of Projects 63% 75% 75% 100% 100%
Implementation & Validation Rubric
# of Projects (Max = 8) 3 0 1 3 1
Cumulative # of Projects 3 3 4 7 8
Cumulative % of Projects 38% 38% 50% 88% 100%
Table 7: Results of application of the Software Engineering Rubrics
Expectation: On each Software Engineering rubric, 75% of projects should be rated at 75% or better. Observation: a. On the Requirements & Analysis Rubric, 75% of evaluated project achieved an 80% rating. b. On the Design Document Rubric, 75% of evaluated project achieved an 80% rating. c. On the Implementation & Validation Rubric, 50% of evaluated project achieved an 80%
rating, while 88% of evaluated projects achieved a 70% rating.

Page | 9
BS-CS Student Outcome (d): Computer Programming Course-embedded Assessment in COP 3530 Data Structures, Spring 2013 Course-embedded Assessment in COP 3337 Computer Programming II, Spring 2013 Course-embedded Assessment in COP 4338 Computer Programming III, Fall 2012
For the “mastery of one programming language” facet of outcome (d), completed COP 3530 Java programming assignments were evaluated via 4 rubrics: Programming: Abstraction Rubric, Programming: API Usage Rubric, Programming: Recursion Rubric, and Programming: Linked Structures Rubric. A 5th, Programming: Inheritance Rubric was applied to one Java assignment in COP 3337. All rubrics utilize an 8-point scale except for the API Usage Rubric which uses a 16-point scale, normalized to 8 for this report. These data are summarized in the following table.
Rubric Raw Score 8 7 6 5 <= 4
Rubric Percentage Score 100% 87.5% 75% 62.5% <= 50%
Programming: Abstraction Rubric
# of Projects (Max = 17) 15 0 0 0 2
Cumulative # of Projects 15 15 15 15 17
Cumulative % of Projects 88% 88% 88% 88% 100%
Programming: API Usage Rubric
# of Projects (Max = 17) 11 6 0 0 0
Cumulative # of Projects 11 17 17 17 17
Cumulative % of Projects 65% 100% 100% 100% 100%
Programming: Recursion Rubric
# of Projects (Max 17) 17 0 0 0 0
Cumulative # of Projects 17 17 17 17 17
Cumulative % of Projects 100% 100% 100% 100% 100%
Programming: Linked Structures Rubric
# of Projects (Max = 17) 15 0 1 0 1
Cumulative # of Projects 15 15 16 16 17
Cumulative % of Projects 88% 88% 94% 94% 100%
Programming: Inheritance & Polymorphism Rubric
# of Projects (Max = 19) 1 9 4 4 1
Cumulative # of Projects 1 10 14 18 19
Cumulative % of Projects 5% 53% 74% 95% 100%
Table 8-1: Results of application of the Computer Programming Rubrics
For the “proficiency in at least one other” facet, completed COP 4338 C Language programming assignments were evaluated via the 12-point Programming: C_Language Proficiency Rubric: Rubric Raw Score 12 11 10 9 <= 8
Rubric Percentage Score 100% 92% 83% 75% <= 67%
Programming: C_Language Proficiency Rubric
# of Projects (Max = 15) 1 9 3 2 0
Cumulative # of Projects 1 10 13 15 15
Cumulative % of Projects 7% 67% 87% 100% 100%
Table 8-2: Results of application of the C_Language Proficiency Rubric

Page | 10
Expectation: On each Computer Programming rubric, 75% of projects should be rated at 75% or better. Observations: a. On the Programming: Abstraction Rubric, 88% of evaluated projects achieved a 75% rating. b. On the Programming: API Usage Rubric, 100% of evaluated projects achieved a 75% rating. c. On the Programming: Recursion Rubric, 100% of evaluated projects achieved a 75% rating. d. On the Programming: Linked Structures Rubric, 94% of evaluated projects achieved a 75%
rating. e. On the Programming: Inheritance & Polymorphism Rubric, 74% of evaluated project
achieved a 75% rating. f. On the Programming: C_Language Proficiency Rubric, 100% of evaluated project achieved a
75% rating.
Page | 11
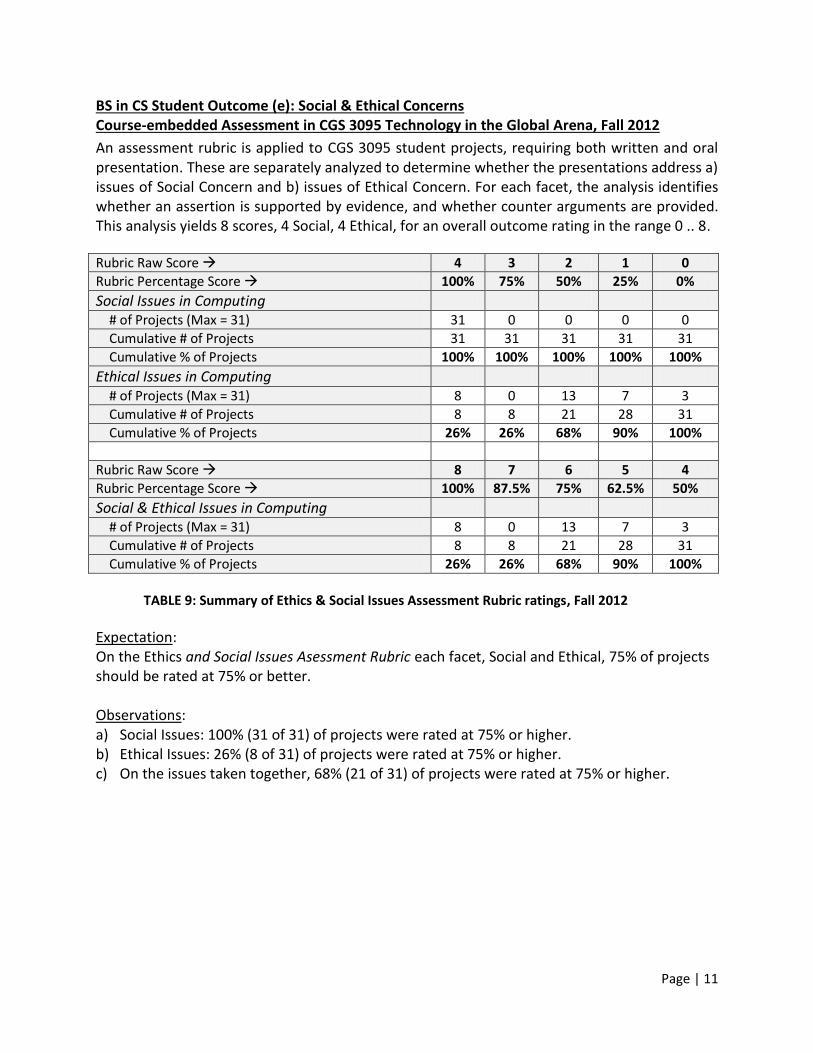
BS in CS Student Outcome (e): Social & Ethical Concerns
Course-embedded Assessment in CGS 3095 Technology in the Global Arena, Fall 2012
An assessment rubric is applied to CGS 3095 student projects, requiring both written and oral presentation. These are separately analyzed to determine whether the presentations address a) issues of Social Concern and b) issues of Ethical Concern. For each facet, the analysis identifies whether an assertion is supported by evidence, and whether counter arguments are provided. This analysis yields 8 scores, 4 Social, 4 Ethical, for an overall outcome rating in the range 0 .. 8.
Rubric Raw Score 4 3 2 1 0
Rubric Percentage Score 100% 75% 50% 25% 0%
Social Issues in Computing
# of Projects (Max = 31) 31 0 0 0 0
Cumulative # of Projects 31 31 31 31 31
Cumulative % of Projects 100% 100% 100% 100% 100%
Ethical Issues in Computing
# of Projects (Max = 31) 8 0 13 7 3
Cumulative # of Projects 8 8 21 28 31
Cumulative % of Projects 26% 26% 68% 90% 100%
Rubric Raw Score 8 7 6 5 4
Rubric Percentage Score 100% 87.5% 75% 62.5% 50%
Social & Ethical Issues in Computing
# of Projects (Max = 31) 8 0 13 7 3
Cumulative # of Projects 8 8 21 28 31
Cumulative % of Projects 26% 26% 68% 90% 100%
TABLE 9: Summary of Ethics & Social Issues Assessment Rubric ratings, Fall 2012
Expectation: On the Ethics and Social Issues Asessment Rubric each facet, Social and Ethical, 75% of projects should be rated at 75% or better. Observations: a) Social Issues: 100% (31 of 31) of projects were rated at 75% or higher. b) Ethical Issues: 26% (8 of 31) of projects were rated at 75% or higher. c) On the issues taken together, 68% (21 of 31) of projects were rated at 75% or higher.
Page | 12
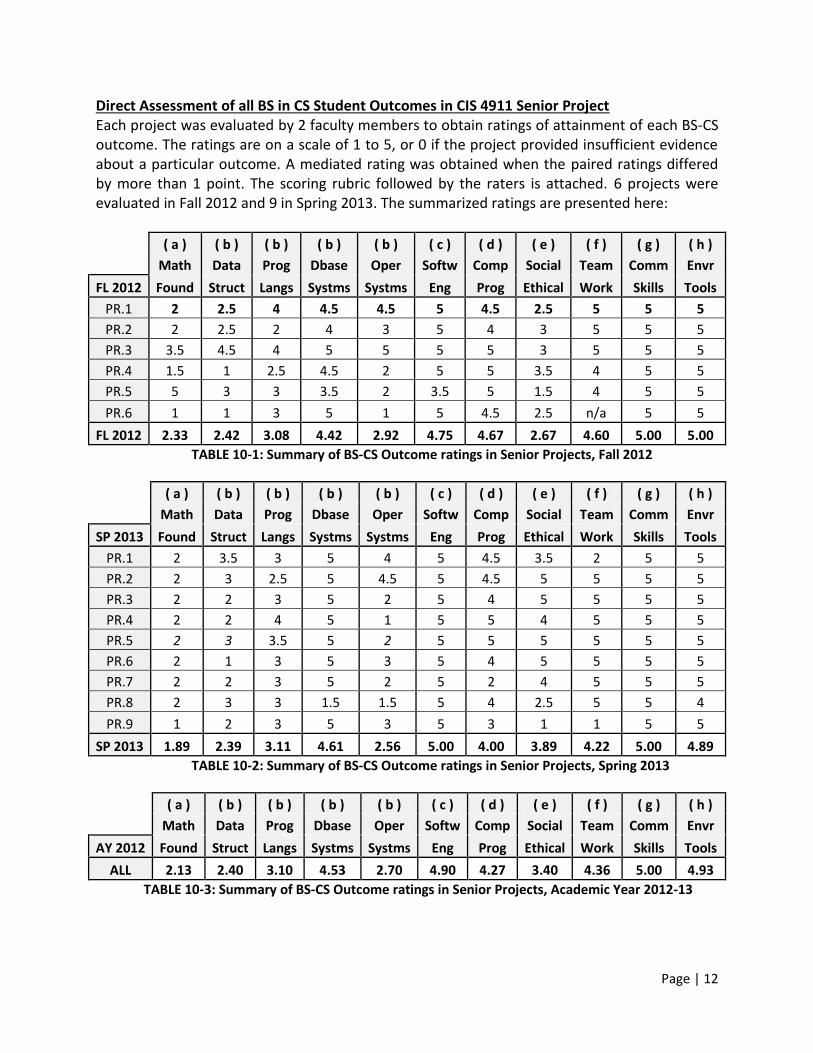
Direct Assessment of all BS in CS Student Outcomes in CIS 4911 Senior Project
Each project was evaluated by 2 faculty members to obtain ratings of attainment of each BS-CS outcome. The ratings are on a scale of 1 to 5, or 0 if the project provided insufficient evidence about a particular outcome. A mediated rating was obtained when the paired ratings differed by more than 1 point. The scoring rubric followed by the raters is attached. 6 projects were evaluated in Fall 2012 and 9 in Spring 2013. The summarized ratings are presented here:
( a ) ( b ) ( b ) ( b ) ( b ) ( c ) ( d ) ( e ) ( f ) ( g ) ( h )
Math Data Prog Dbase Oper Softw Comp Social Team Comm Envr
FL 2012 Found Struct Langs Systms Systms Eng Prog Ethical Work Skills Tools
PR.1 2 2.5 4 4.5 4.5 5 4.5 2.5 5 5 5
PR.2 2 2.5 2 4 3 5 4 3 5 5 5
PR.3 3.5 4.5 4 5 5 5 5 3 5 5 5
PR.4 1.5 1 2.5 4.5 2 5 5 3.5 4 5 5
PR.5 5 3 3 3.5 2 3.5 5 1.5 4 5 5
PR.6 1 1 3 5 1 5 4.5 2.5 n/a 5 5
FL 2012 2.33 2.42 3.08 4.42 2.92 4.75 4.67 2.67 4.60 5.00 5.00
TABLE 10-1: Summary of BS-CS Outcome ratings in Senior Projects, Fall 2012
( a ) ( b ) ( b ) ( b ) ( b ) ( c ) ( d ) ( e ) ( f ) ( g ) ( h )
Math Data Prog Dbase Oper Softw Comp Social Team Comm Envr
SP 2013 Found Struct Langs Systms Systms Eng Prog Ethical Work Skills Tools
PR.1 2 3.5 3 5 4 5 4.5 3.5 2 5 5
PR.2 2 3 2.5 5 4.5 5 4.5 5 5 5 5
PR.3 2 2 3 5 2 5 4 5 5 5 5
PR.4 2 2 4 5 1 5 5 4 5 5 5
PR.5 2 3 3.5 5 2 5 5 5 5 5 5
PR.6 2 1 3 5 3 5 4 5 5 5 5
PR.7 2 2 3 5 2 5 2 4 5 5 5
PR.8 2 3 3 1.5 1.5 5 4 2.5 5 5 4
PR.9 1 2 3 5 3 5 3 1 1 5 5
SP 2013 1.89 2.39 3.11 4.61 2.56 5.00 4.00 3.89 4.22 5.00 4.89
TABLE 10-2: Summary of BS-CS Outcome ratings in Senior Projects, Spring 2013
( a ) ( b ) ( b ) ( b ) ( b ) ( c ) ( d ) ( e ) ( f ) ( g ) ( h )
Math Data Prog Dbase Oper Softw Comp Social Team Comm Envr
AY 2012 Found Struct Langs Systms Systms Eng Prog Ethical Work Skills Tools
ALL 2.13 2.40 3.10 4.53 2.70 4.90 4.27 3.40 4.36 5.00 4.93
TABLE 10-3: Summary of BS-CS Outcome ratings in Senior Projects, Academic Year 2012-13