schorn speaks at cowen & company energy & natural
TRANSCRIPT
Patrick SchornExecutive Vice President, New Ventures
Cowen & Company
7th Annual Energy & Natural Resources Conference
New York, December 4, 2017
This presentation contains “forward-looking statements” within the meaning of the federal securities laws — that is,statements about the future, not about past events. Such statements often contain words such as “expect,” “may,”“believe,” “plan,” “estimate,” “intend,” “anticipate,” “should,” “could,” “will,” “see,” “likely,” and other similar words.Forward-looking statements address matters that are, to varying degrees, uncertain, such as statements about ourfinancial and performance targets and other forecasts or expectations regarding business outlook; growth forSchlumberger as a whole and for each of its segments (and for specified products or geographic areas within eachsegment); oil and natural gas demand and production growth; oil and natural gas prices; improvements in operatingprocedures and technology, including our transformation program; capital expenditures by Schlumberger and the oil andgas industry; the business strategies of Schlumberger’s customers; the success of Schlumberger’s SPM projects, jointventures and alliances; future global economic conditions; and future results of operations. These statements aresubject to risks and uncertainties, including, but not limited to, global economic conditions; changes in exploration andproduction spending by Schlumberger’s customers and changes in the level of oil and natural gas exploration anddevelopment; general economic, political and business conditions in key regions of the world; foreign currency risk;pricing pressure; weather and seasonal factors; operational modifications, delays or cancellations; production declines;changes in government regulations and regulatory requirements, including those related to offshore oil and gasexploration, radioactive sources, explosives, chemicals, hydraulic fracturing services and climate-related initiatives; theinability of technology to meet new challenges in exploration; the inability to retain key employees; and other risks anduncertainties detailed in our most recent Forms 10-K, 10-Q, and 8-K filed with or furnished to the U.S. Securities andExchange Commission. If one or more of these or other risks or uncertainties materialize (or the consequences of sucha development changes), or should underlying assumptions prove incorrect, actual outcomes may vary materially fromthose reflected in our forward-looking statements. The forward-looking statements speak only as of the date of thispresentation, and Schlumberger disclaims any intention or obligation to update publicly or revise such statements,whether as a result of new information, future events or otherwise.
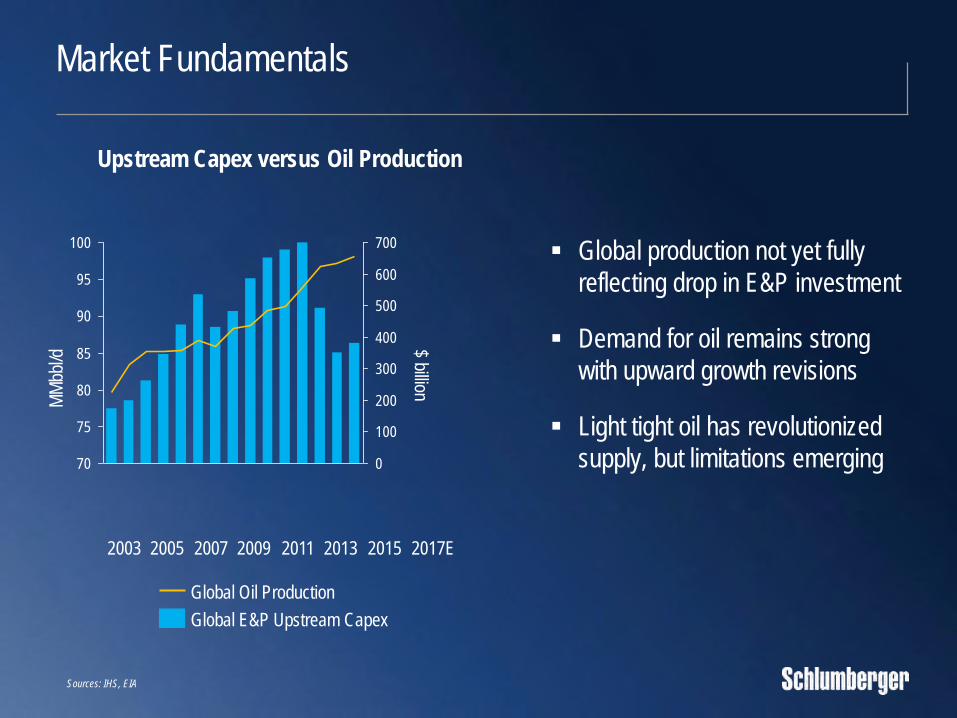
Market Fundamentals
Sources: IHS, EIA
0
100
200
300
400
500
600
700
70
75
80
85
90
95
100
$ billion
MM
bbl/d
2017E20152009 20112003 2007 20132005
Global E&P Upstream Capex
Global Oil Production
Upstream Capex versus Oil Production
▪ Global production not yet fully
reflecting drop in E&P investment
▪ Demand for oil remains strong
with upward growth revisions
▪ Light tight oil has revolutionized
supply, but limitations emerging

Light Tight Oil Revolutionized Supply—But Limits Emerge
Sources: IHS, EIA ; * Nov 2017 EIA
2008-2017 Global E&P Capex ($ trillion)
2017 Estimated Oil Supply (MMbbl/d)
$4.2T
$1.1T
All other E&P
Land unconventional
93 MMbbl/d
5
US tight oil
All other oil supply
▪ Forecast rates of production growth
slowing in the medium term
▪ Pursuit of growth now balanced by
stronger focus on financial performance
▪ Investment in light tight oil has reached
one-fifth of total E&P investment
▪ Well spacing and completion volumes
may be reaching technology limit
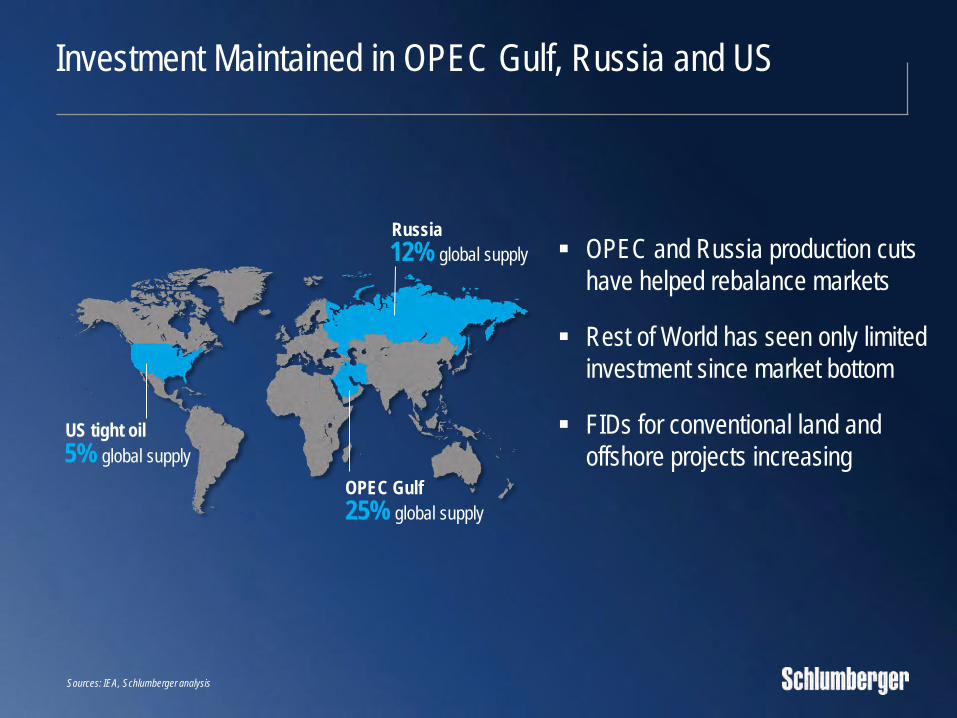
Investment Maintained in OPEC Gulf, Russia and US
Sources: IEA, Schlumberger analysis
Russia
12% global supply
US tight oil
5% global supply
OPEC Gulf
25% global supply
▪ OPEC and Russia production cuts
have helped rebalance markets
▪ Rest of World has seen only limited
investment since market bottom
▪ FIDs for conventional land and
offshore projects increasing
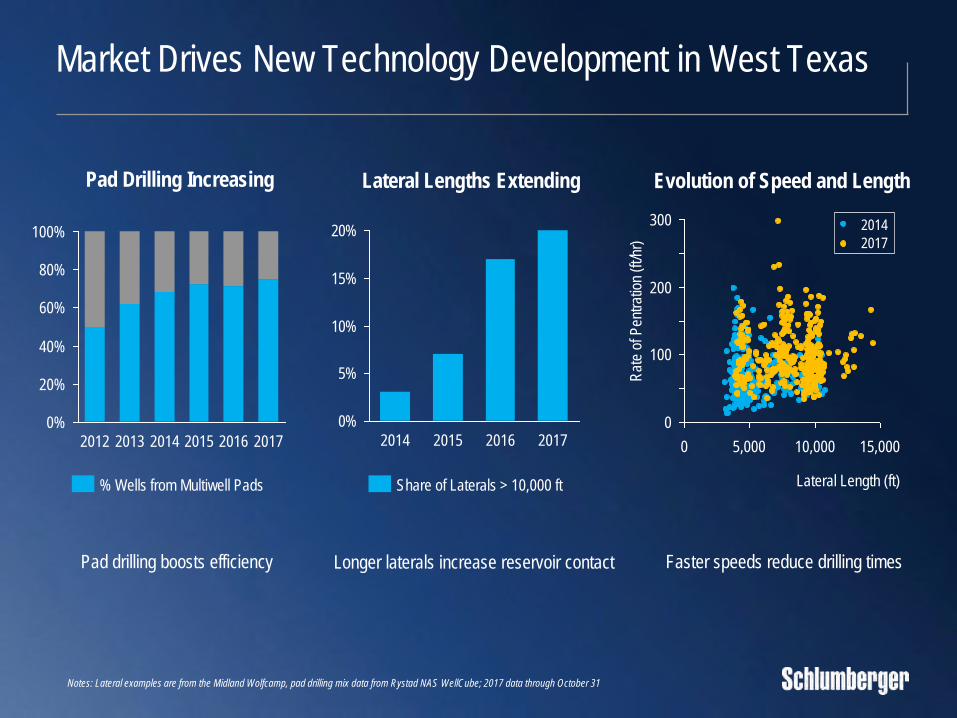
Notes: Lateral examples are from the Midland Wolfcamp, pad drilling mix data from Rystad NAS WellCube; 2017 data through October 31
Market Drives New Technology Development in West Texas
Lateral Lengths ExtendingPad Drilling Increasing
Pad drilling boosts efficiency Longer laterals increase reservoir contact Faster speeds reduce drilling times
0%
80%
20%
100%
60%
40%
2013 201720152012 2014 2016
0%
5%
10%
15%
20%
2017201620152014
Share of Laterals > 10,000 ft% Wells from Multiwell Pads
Evolution of Speed and Length
0
300
15,0000 5,000
200
100
10,000
Lateral Length (ft)
Rat
e of
Pen
trat
ion
(ft/h
r) 2017
2014

Note: Cost of ownership includes compensation, maintenance and capex per job; 2017 data through October 31
Transformation Improves Internal Efficiency in US Land
Asset Utilization Improving Remote Operations Expanding
Cost of Ownership Decreasing Tool Reliability Increasing
0
20
40
60
80
100
-32%
xBolt
%
TelePacer
500
1,500
2,500
0
xBoltTelePacer
+17%
Hrs
/Fai
lure
0
2
4
6
8
20172015
Tool
s/Jo
b
-49%
2016
0
10
20
30
40
2017
+149%
2014 2016
%
2015

PowerDrive RSS Technology Drives Performance in US Land
7-Well Campaign for
Eclipse Resources in Ohio
Average Lateral Footage Per Well
Average Days Per Well
Cost Per Lateral
80-Well Campaign for
Parsley Energy in West Texas
5,000
10,000
15,000
20,000
25,000
30,000
0 2 4 6 8 10 12
Mea
sure
d D
epth
(ft)
Drilling Time (days)
Seventh well 5 days
First well 10 days
+9%-17% -30%
2015
2016
Note: Cost of ownership includes compensation, maintenance and capex per job
▪ Drill time halved between first and seventh wells
▪ Two record-breaking laterals >20k feet drilled in October
▪ All seven wells drilled fully in geological window
▪ Drilling cost per lateral reduced by 30%
▪ Total lateral footage drilled per well extended by 9%
▪ 7,128-ft lateral drilled in 1.7 days

Transforming Completions and Production—OneStim

Improving Asset Utilization and Reducing Unit Cost—OneStim
Operations Planning
Global Traceability
▪ Sand volume doubled since 2014
▪ Asset utilization increased by 30%
▪ Unit cost reduced by 56%
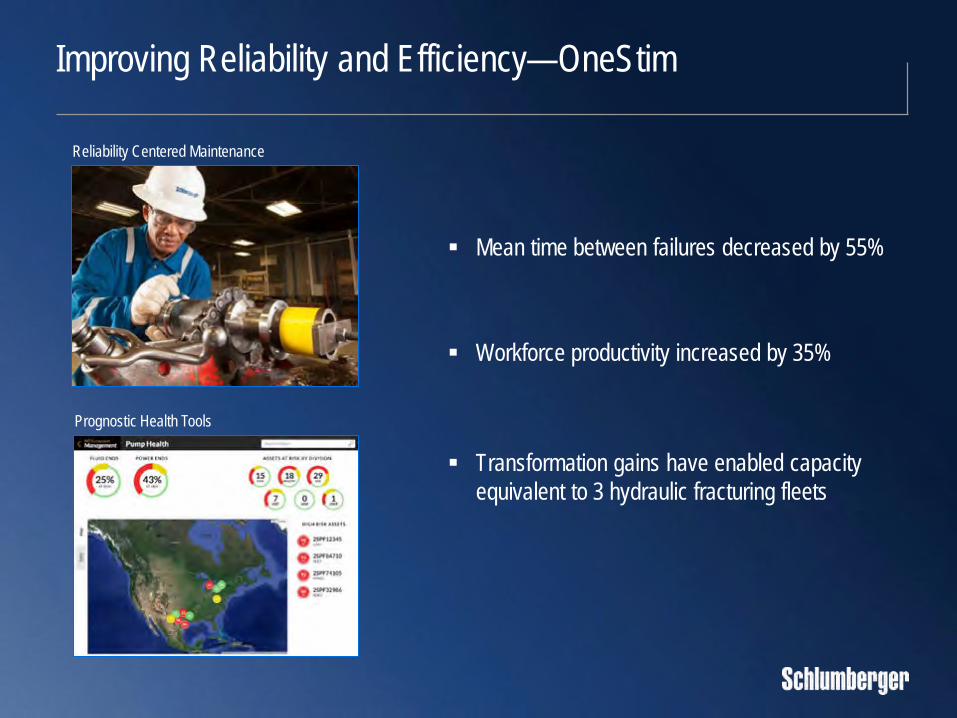
Improving Reliability and Efficiency—OneStim
Reliability Centered Maintenance
Prognostic Health Tools
▪ Mean time between failures decreased by 55%
▪ Workforce productivity increased by 35%
▪ Transformation gains have enabled capacity
equivalent to 3 hydraulic fracturing fleets

New Generation Hydraulic Fracturing Equipment—OneStim
Activity since introduction in 2017
Stages completed: 3,732
Wells completed: 128
Operating time: 26,143 hours
Connecting E&P Workflows with Digital Enablement
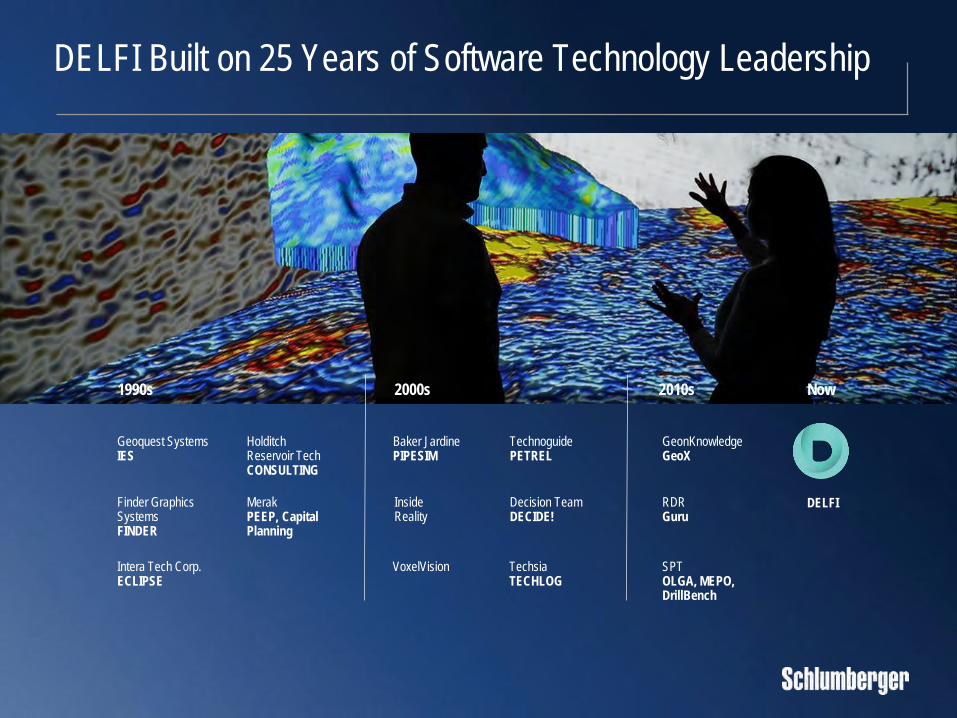
DELFI Built on 25 Years of Software Technology Leadership
1990s
Geoquest SystemsIES
HolditchReservoir TechCONSULTING
Finder Graphics SystemsFINDER
Intera Tech Corp.ECLIPSE
MerakPEEP, Capital Planning
TechnoguidePETREL
Baker JardinePIPESIM
InsideReality
VoxelVision
Decision TeamDECIDE!
TechsiaTECHLOG
SPTOLGA, MEPO, DrillBench
GeonKnowledgeGeoX
RDRGuru
DELFI
2000s 2010s Now
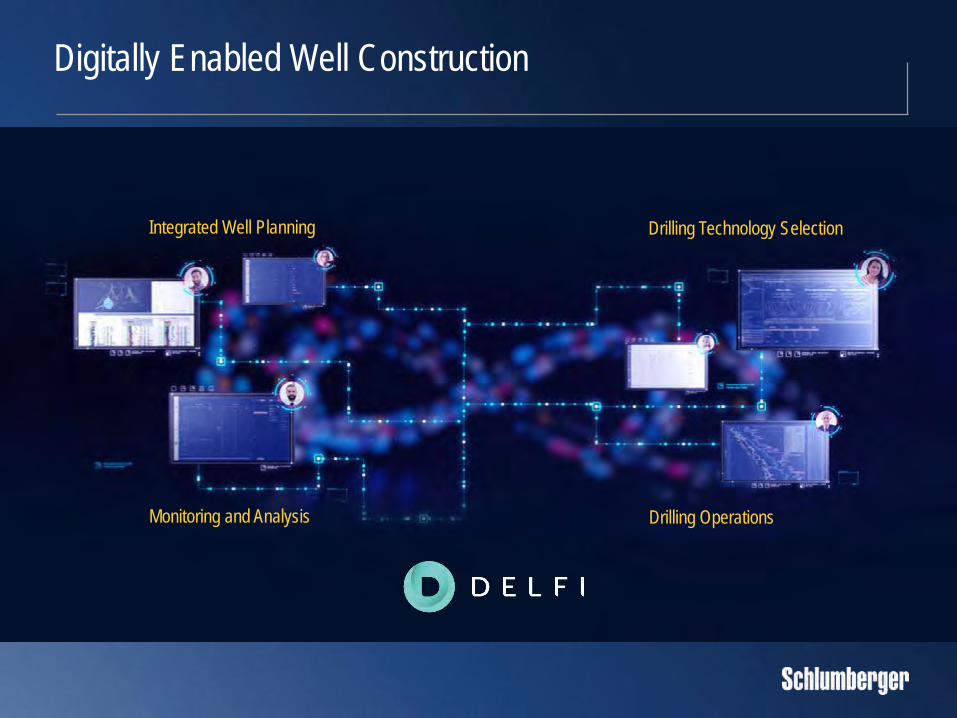
Digitally Enabled Well Construction
Integrated Well Planning Drilling Technology Selection
Monitoring and Analysis Drilling Operations

Fourth-Quarter Sequential Outlook
Reservoir Characterization Group – Lower▪ Northern hemisphere seasonal reductions across several product
lines and muted year-end multiclient and software sales
Drilling Group – Flat ▪ Higher drilling in North America land offset by seasonal decline in the
Northern Hemisphere following Q3 strong summer drilling campaigns
Production Group – Higher
▪ Continued growth in North America land with full quarter benefit from
capacity redeployment although moderated by seasonality
Cameron Group – Modestly Higher
▪ Surface and V&M higher on robust North America activity partially
offset by slowing decline in OneSubsea and Drilling Systems
▪ NAM land growth continues—moderated by holiday season
and rig count flattening
▪ Modest growth in Latin America and Middle East,
Europe/Africa/Central Asia lower on winter seasonality
▪ Year-end product sales muted

Summary
▪ The narrowing gap between oil supply and demand is leading commodity prices
higher. We are increasingly positive on the outlook for our global business
▪ We continue to invest in our business, and our technology leadership coupled with
increasing digital enablement provides a foundation to leverage market recovery
▪ Our multiyear transformation program continues to contribute to performance while
innovative technology development meets evolving market needs
▪ We are confident that our financial strength, geographical footprint and technology
portfolio position us as the oilfield services leader as the market moves to recovery