schroder special situations fund audited annual report
TRANSCRIPT

Schroder Special Situations Fund
Audited Annual Report31 December 2020
R.C.S. Luxembourg B 58.066


Schroder Special Situations FundSociété d’Investissement à Capital Variable (SICAV)
Audited Annual Report
31 December 2020
No subscriptions can be received on the basis of financial reports. Subscriptions are valid only if made on the basis of the current prospectus and KIID, accompanied by the last available audited annual report or unaudited semi-annual report if published thereafter. Audited annual and unaudited semi-annual reports, the current prospectus, KIID and the Articles of Incorporation of Schroder Special Situations Fund (the ‘Company’) are available, free of charge, at the Company’s registered office, 5, rue Höhenhof, L-1736 Senningerberg, Grand Duchy of Luxembourg.

Table Of Contents
4Schroder Special Situations Fund Audited Annual Report
31 December 2020
Schroder Special Situations Fund 5Board of Directors 6Administration 7Directors’ Report 8Investment Manager’s Report 9Audit Report 11Statistical Information 14Combined Statement of Net Assets 18Combined Statement of Operations and Changes in Net Assets 23Schedule of Investments 28
Schroder SSF Diversified Alternative Assets 28Schroder SSF Fixed Maturity Bond I 30Schroder SSF Fixed Maturity Bond 2021 (II) 32Schroder SSF Fixed Maturity Bond 2023 (I) 35Schroder SSF Fixed Maturity Bond II 38Schroder SSF Fixed Maturity Bond III 41Schroder SSF Fixed Maturity Bond IV 44Schroder SSF Fixed Maturity Bond V* 47Schroder SSF Fixed Maturity Bond VI* 50Schroder SSF Fixed Maturity Bond 2022 53Schroder SSF International Equity 56Schroder SSF Managed Wealth Portfolio 58Schroder SSF Multi-Asset Dynamic 60Schroder SSF Wealth Management USD Cautious* 63Schroder SSF Wealth Management USD Balanced* 66Schroder SSF Wealth Management USD Growth* 69Schroder SSF Sterling Liquidity Plus 72
Notes to the Financial Statements 76Total Expense Ratio (the “TER”) 89Appendix I – Global Exposure and Leverage (Unaudited) 91Appendix II – Remuneration Disclosures (Unaudited) 92
* Please refer to the Directors’ Report for details of all corporate actions that occurred during the year under review.

5Schroder Special Situations Fund Audited Annual Report
31 December 2020
Schroder Special Situations Fund
The CompanySchroder Special Situations Fund (the “Company”) is an open-ended investment company organised as a ‘société anonyme’ under the laws of the Grand Duchy of Luxembourg. The Company operates separate ‘sub-funds’, each of which is represented by one or more share classes. The sub-funds are distinguished by their specific investment policy or any other specific features. Please refer to the current prospectus for the investment objectives of the sub-funds as well as the investment restrictions. This report covers the period from 1 January 2020 to 31 December 2020. At the date of this report, there were 17 sub-funds available for investment. The last day on which prices were calculated was 31 December 2020, the last working day of the year under review. The financial statements are prepared in accordance with Luxembourg regulations relating to undertakings for collective investments. Hereafter, names of the sub-funds will be preceded by “Schroder SSF”, e.g. Schroder SSF International Equity. Schroders is a FATCA compliant organisation. The FATCA classification of this entity and its GIIN is as follows: FATCA entity classification: FFI; Sponsoring entity: Schroder Investment Management (Europe) S.A.; Sponsoring entity GIIN: 4RIMT7.00000.SP.442 For sub-funds registered in the UK, as required by the Financial Conduct Authority (FCA), Schroders entered into the Temporary Permissions Regime (TPR). This regime allows registered sub-funds to be distributed and marketed in the UK/to UK investors post Brexit.
Corporate Governance The Company is subject to corporate governance based on: 1. Its obligations as defined by the UCITS Directive 2009/65/ EC dated 13 July 2009, as implemented in Luxembourg law, which is available for inspection at the registered office of the Company at 5, rue Höhenhof, 1736 Senningerberg, Grand Duchy of Luxembourg.2. Its articles of incorporation which are available for inspection at the registered office of the Company and at the Luxembourg corporate and trade register, Registre de Commerce et des Sociétés (“RCSL”). 3. Its obligations in respect of the management of the Company, for which the Company has appointed Schroder Investment Management (Europe) S.A. (the “Management Company”), which is subject to the requirements of the Management Company Directive 2010/ 43/EC, as implemented in Luxembourg law. 4. The Association of the Luxembourg Fund Industry (“ALFI”) code of conduct, the principles of which the Company has voluntarily adopted.
Internal Control and Risk Management Systems The Board of Directors is responsible for establishing and maintaining adequate internal control and risk management systems of the Company in relation to the financial reporting process. Such systems are designed to manage rather than eliminate the risk of error or fraud in achieving the Company’s financial reporting objectives and can only provide reasonable and not absolute assurance against material misstatement or loss. The Board of Directors has contracted with the Management Company to put procedures in place to ensure all relevant accounting records are properly maintained and are readily available, including the production of annual and semi-annual reports. The annual and semi-annual reports of the Company are required to be approved by the Board of Directors of the Company and filed with the Commission de Surveillance du Secteur Financier (“CSSF”) and in the case of annual reports with the RCSL. The annual statutory financial statements are required to be audited by independent auditors who report to the Board of Directors on their findings. The Board meets at least four times a year and ensures that the Company maintains high standards of integrity and control in its operations and that it possesses adequate governance and means of control as law and regulation demand.

Board of Directors
6Schroder Special Situations Fund Audited Annual Report
31 December 2020
Chairman ¯ Richard Mountford
Head of Planning, Corporate ManagementSchroder Investment Management Limited 1 London Wall Place London EC2Y 5AU United Kingdom
Directors ¯ Carla Bergareche
Head of Iberian BusinessPinar 7, 4th Floor 28006 Madrid Spain
¯ Eric BertrandNon-Executive DirectorVaults 13-15, Valletta WaterfrontFRN 1914Malta
¯ Mike ChampionHead of Product DevelopmentSchroder Investment Management Limited 1 London Wall Place London EC2Y 5AU United Kingdom
¯ Marie-Jeanne Chevremont-LorenziniIndependent Director12, rue de la SapinièreL-8150 BridelGrand Duchy of Luxembourg
¯ Daniel De Fernando Garcia *Independent DirectorSerrano 1 28001 MadridSpain
¯ Bernard Herman Independent DirectorImmeuble Dyapason4, Rue Robert StumperL-2557 Grand Duchy of Luxembourg
¯ Achim KuessnerCountry Head Germany, Austria & CEESchroder Investment Management (Europe) S.A.,German BranchTaunustor 1 (Taunus Turm) 60310 Frankfurt am MainGermany
¯ Hugh Mullan **Independent Director5, rue Höhenhof 1736 Senningerberg, Grand Duchy of Luxembourg
¯ Neil WaltonHead of Investment SolutionsSchroder Investment Management Limited 1 London Wall Place London EC2Y 5AU United Kingdom
* Daniel De Fernando Garcia resigned from the Board of Directors on 5 May 2020. ** Hugh Mullan was appointed to the Board of Directors on 5 May 2020.
Administration
7Schroder Special Situations Fund Audited Annual Report
31 December 2020
Registered OfficeSchroder Investment Management (Europe) S.A.5, rue Höhenhof1736 Senningerberg, Grand Duchy of Luxembourg
Management Company, Domiciliary Agent and RegistrarSchroder Investment Management (Europe) S.A.5, rue Höhenhof1736 Senningerberg, Grand Duchy of Luxembourg
Depositary Bank and Fund AdministratorJ.P. Morgan Bank Luxembourg S.A.European Bank & Business Centre6 route de Trèves 2633 SenningerbergGrand Duchy of Luxembourg
Legal AdviserElvinger Hoss Prussen, société anonyme2, place Winston Churchill1340 Luxembourg Grand Duchy of Luxembourg
Independent AuditorPricewaterhouseCoopers, Société coopérative2, rue Gerhard Mercator2182 Luxembourg Grand Duchy of Luxembourg
Principal Paying Agent & TransferAgentHSBC Continental Europe, Luxembourg 16, boulevard d’Avranches, 1160 Luxembourg Grand Duchy of Luxembourg
Investment ManagersSchroder Investment Management Limited1 London Wall Place, London, EC2Y 5AU, United KingdomSchroder SSF International Equity Schroder SSF Multi-Asset Dynamic Schroder SSF Sterling Liquidity Plus
Schroder Investment Management NorthAmerica Inc.7 Bryant Park, New York, New York 10018-3706, United States of AmericaSchroder SSF Fixed Maturity Bond I Schroder SSF Fixed Maturity Bond II Schroder SSF Fixed Maturity Bond III Schroder SSF Fixed Maturity Bond IV Schroder SSF Fixed Maturity Bond 2021 (II) Schroder SSF Fixed Maturity Bond 2022 Schroder SSF Fixed Maturity Bond 2023 (I) Schroder SSF Fixed Maturity Bond V *Schroder SSF Fixed Maturity Bond VI *
Schroder & Co. Ltd 1 London Wall Place, London, EC2Y 5AU, United Kingdom Schroder SSF Diversified Alternative Assets Schroder SSF Managed Wealth Portfolio
Schroder & Co. (Asia) Ltd138 Market Street, #23-02 CapitaGreen, Singapore 048946Schroder SSF Wealth Management USD Cautious *Schroder SSF Wealth Management USD Balanced *Schroder SSF Wealth Management USD Growth *
* Please refer to the Directors’ Report for details of all corporate actions that occurred during the year under review.

Directors’ Report
8Schroder Special Situations Fund Audited Annual Report
31 December 2020
IntroductionThe directors of the Company submit their report and the audited financial statements for the year ended 31 December 2020.
Activities during the year On 31 December 2020, the total net assets of the Company were EUR 7,980,498,975 compared to EUR 7,520,235,766 on 31 December 2019, representing an increase of 6.12%.
1. New Sub-Funds During the year under review, 5 new sub-funds were made available for investment within the Company:
Sub-FundSub-Fund Base
Currency Launch Date
Schroder SSF Fixed Maturity Bond VI USD 26 February 2020Schroder SSF Wealth Management USD Balanced USD 22 May 2020Schroder SSF Wealth Management USD Cautious USD 22 May 2020Schroder SSF Wealth Management USD Growth USD 22 May 2020Schroder SSF Fixed Maturity Bond V USD 27 May 2020
2. New share classesIn addition to the 27 share classes launched in new Sub-Funds on launch dates, the following share class was also made available during the year under review:
Sub-Fund and Share ClassShare Class
CurrencySub-Fund Base
Currency Launch Date
Schroder SSF Sterling Liquidity PlusClass X2 Acc GBP GBP 1 October 2020
3. Share class liquidationsThe following share class was liquidated during the year under review:
Sub-Fund and Share ClassShare Class
CurrencySub-Fund Base
Currency Liquidation Date
Schroder SSF Fixed Maturity Bond IIIClass A2 Dis EUR Hedged EUR USD 5 October 2020
The Board of DirectorsSchroder Special Situations Fund 31 December 2020
The information contained in this report is historical and is not necessarily indicative of future performance.
Investment Manager’s Report
9Schroder Special Situations Fund Audited Annual Report
31 December 2020
2020 reviewThe year was dominated by the dramatic spread of Covid-19 around the world. After the discovery of the virus in China, countries went into lockdown to try to contain what was soon declared a global pandemic. Industries such as hospitality and travel were particularly badly affected amid restriction of gatherings and stay-at-home orders. Governments and central banks announced measures to support businesses and households, and to reduce borrowing costs.The pandemic had a severe economic impact. US non-farm payrolls showed 20.5 million jobs were lost in the country in April. The Federal Reserve (Fed) cut interest rates twice in March, taking rates to 0-0.25%, and announced unlimited quantitative easing (buying bonds). The US Senate also passed a $2 trillion stimulus package. Europe was hit hard by the virus with Italy and Spain among the worst affected countries in the early phase of the pandemic. The European Commission proposed a €750 billion recovery fund to support economies in the wake of the crisis. The European Central Bank expanded its pandemic emergency purchase programme to €1.35 trillion. In the UK, the Bank of England cut interest rates to 0.1%. Japan saw a far lower level of Covid-19 cases and deaths than most western developed economies. However, the pandemic did lead to the postponement of the 2020 Tokyo Olympics. Other Asian nations also weathered the pandemic relatively successfully, with China largely managing to contain the virus after early lockdowns in affected areas. Other emerging markets fared less well, with Brazil and much of the rest of South America suffering highs levels of infections and deaths. Across Europe and the US, lockdown measures and the arrival of warmer weather allowed lockdown restrictions to start being lifted in the late spring and early summer. This allowed economic activity to pick up, but a renewed increase in infections in the autumn resulted in restrictions being imposed once again. The turbulence for the economic was reflected in growth data, with US GDP plunging by 31.4% in Q2 2020, then advancing 33.4% in Q3. The US economy ended the year 3.5% smaller overall. China saw growth of 2.3% in 2020 and is likely to be the only major economy to avoid contraction as a result of Covid-19. On the political front, Japan saw a change of prime minister in September after Shinzo Abe stepped down amid health problems. He was replaced by Yoshihide Suga, who was seen as a continuity candidate who may reignite some of Abe’s proposed structural reforms once the pandemic is over. In the UK, a Brexit trade deal with the European Union was eventually reached just days before the end of the transition period on 31 December. However, the major political focus of the year was the US presidential election in November, which saw Democrat Joe Biden defeat incumbent Donald Trump. The election results coincided with news of successful vaccines against Covid-19, sparking hopes that economic stimulus would be agreed and that the vaccines would provide a route towards normal activity resuming once more.
Equity market reviewGlobal equities, as measured by the MSCI World Index, returned 15.9% in 2020 (in US dollar terms). Markets fell sharply in March and April as it became clear that the coronavirus was spreading globally. However, the fiscal and monetary support offered by governments and central banks soon saw shares turn higher. However, the strong overall gain masked very divergent performance within the market. Growth stocks continue to dominate, with value actually showing a negative return. The MSCI World Growth index returned 33.8% while MSCI World Value returned -1.2% (both in US dollar terms). The year saw the continued dominance of a narrow group of widely held stocks which were already the established market leaders of recent years - Apple, Microsoft and Amazon among them. By contrast, value parts of the market lagged with the energy sector particularly under pressure as oil prices tumbled amid reduced demand. By region, the US was a strong performer with other in-demand stocks such as Netflix also supporting the market. The S&P 500 returned 18.4% (in US dollar terms) compared to -1.0% (in euros) for the eurozone MSCI EMU index. The UK was a key underperformer with the FTSE All-Share posting a negative return (-9.8%, in sterling) amid Brexit uncertainty and some disappointment regarding the handling of the Covid crisis. Emerging markets performed strongly with the MSCI EM index returning 18.3% while the standout gains were made in Asian shares as the MSCI AC Asia ex Japan index gained 25.0% (both in US dollars).(Data source: DataStream)
Fixed income reviewGovernment yields fell over the period as the Covid-19 pandemic led investors to seek lower risk assets, with central banks launching further vast supportive policy measures. The US 10-year yield fell 100 basis points (bps) to 0.91%. The UK 10-year yield was over 60bps lower at 0.20%. Following the Covid crisis, the Bank of England began to discuss the possibility of negative interest rates and Brexit uncertainty resurfaced with a deal between the UK and EU reached only days before the deadline. In Europe, Germany’s 10-year fell from -0.19% to -0.57%, Italy’s by 90bp to 0.52% and Spain’s fell from 0.47% to 0.05%. The EU agree on a pandemic recovery fund which includes the promise of direct grants to countries to aid the recovery from the impact of Covid-19. Italy and Spain stand to be prime beneficiaries. Corporate bonds sold-off sharply in the Covid crisis but rebounded sharply, delivering positive total returns for the year, outperforming government bonds. Investment grade returned 7.7% (local currency). High yield gained 6.3%, nearly all due to returns from income.(Data source: ICE BAML)
OutlookThe Schroders economics team forecasts global GDP growth at 5.5% in 2021. The first few months of the year are likely to see weaker activity due to the pandemic and heightened restrictions in a number of countries. However, in the second half of 2021, growth should pick up following the roll-out of vaccines and a return to normality. The vaccines are intended to be distributed to a significant proportion of the population by the third quarter and should revive spending on services. The team also sees the recovery extending into 2022 as fiscal and monetary policy remain loose while activity normalises. Meanwhile, inflation is forecast to remain relatively contained with only a modest pick-up in response to higher commodity prices. The firmer oil price and stronger activity push our global inflation forecast up slightly to 2.2% in 2021 and 2.4% in 2022. Central banks remain wary of the threat of deflation. The Federal Reserve’s new framework means there will need to be a period of 2%-plus inflation to hit the average inflation target. That means zero interest rates and continued quantitative easing (QE). However, the economic recovery will also mean that QE will eventually moderate, although probably not until 2022.In terms of the investment implications, equity valuations for some markets appear rich relative to history. However, valuations are supported by depressed bond yields. Equities could draw benefit from opportunities for return in other asset classes, such as credit, being more limited. Meanwhile, a combination of continued liquidity provided by the central banks, fiscal support, positive news on vaccines and the ongoing cyclical recovery should support equities. Regionally, emerging market equities are supported by the strength of the recovery in China, attractive valuations and a weaker US dollar. Japan is well positioned to benefit from the recovery in global trade given its exposure to industrials. Despite expensive valuations, relative to history and their peers, US stocks should continue to deliver positive returns. This is aided by the ample liquidity provided by the Fed. Europe ex UK equities stand to benefit most from global activity normalising, given the cyclical nature of the stock market. Meanwhile, with the government reaching a Brexit deal with the EU, there is scope for UK equities to catch up to peers.
Investment Manager’s Report (continued)
10Schroder Special Situations Fund Audited Annual Report
31 December 2020
Turning to fixed income, government bond valuations remain very expensive. US Treasuries can be a useful hedge as Covid could still derail growth in the short term. However, German Bunds offer limited protection against the prospect of a growth disappointment. On corporate credit, the recent tightening in spread levels has made valuations less attractive. However, for the investment grade sector, liquidity support measures from the central banks, particularly buying by the Fed and the ECB, continue to benefit the market. By contrast, fundamentals in the HY sector, particular in the US market, are weak.Commodities should see moderate gains as global economic activity begins to normalise. The recovery in demand plus the OPEC deal should support the oil price. As regards industrial metals, there continues to be a strong recovery in demand from China, particularly in property and infrastructure spending. Ongoing central bank stimulus underpins the low interest rate environment, which should support gold prices.
Outlook (continued)

PricewaterhouseCoopers, Société coopérative, 2 rue Gerhard Mercator, B.P. 1443, L-1014 LuxembourgT : +352 494848 1, F : +352 494848 2900, www.pwc.lu Cabinet de révision agréé. Expert-comptable (autorisation gouvernementale n°10028256)R.C.S. Luxembourg B 65 477 - TVA LU25482518
Audit report
To the Shareholders ofSchroder Special Situations Fund
Our opinion
In our opinion, the accompanying financial statements give a true and fair view of the financial position of Schroder Special Situations Fund (the “Fund”) and of each of its sub-funds as at 31 December 2020, and of the results of their operations and changes in their net assets for the year then ended in accordance with Luxembourg legal and regulatory requirements relating to the preparation and presentation of the financial statements.
What we have audited
The Fund’s financial statements comprise:
• the combined statement of net assets as at 31 December 2020;• the schedule of investments as at 31 December 2020;• the combined statement of operations and changes in net assets for the year then ended; and• the notes to the financial statements, which include a summary of significant accounting policies.
Basis for opinion
We conducted our audit in accordance with the Law of 23 July 2016 on the audit profession (Law of 23 July 2016) and with International Standards on Auditing (ISAs) as adopted for Luxembourg by the “Commission de Surveillance du Secteur Financier” (CSSF). Our responsibilities under the Law of 23 July 2016 and ISAs as adopted for Luxembourg by the CSSF are further described in the “Responsibilities of the “Réviseur d’entreprises agréé” for the audit of the financial statements” section of our report.
We believe that the audit evidence we have obtained is sufficient and appropriate to provide a basis for our opinion.
We are independent of the Fund in accordance with the International Code of Ethics for Professional Accountants, including International Independence Standards, issued by the International Ethics Standards Board for Accountants (IESBA Code) as adopted for Luxembourg by the CSSF together with the ethical requirements that are relevant to our audit of the financial statements. We have fulfilled our other ethical responsibilities under those ethical requirements.
Other information
The Board of Directors of the Fund is responsible for the other information. The other information comprises the information stated in the annual report but does not include the financial statements and our audit report thereon.
Our opinion on the financial statements does not cover the other information and we do not express any form of assurance conclusion thereon.

12
In connection with our audit of the financial statements, our responsibility is to read the other information identified above and, in doing so, consider whether the other information is materially inconsistent with the financial statements or our knowledge obtained in the audit, or otherwise appears to be materially misstated. If, based on the work we have performed, we conclude that there is a material misstatement of this other information, we are required to report that fact. We have nothing to report in this regard.
Responsibilities of the Board of Directors of the Fund for the financial statements
The Board of Directors of the Fund is responsible for the preparation and fair presentation of the financial statements in accordance with Luxembourg legal and regulatory requirements relating to the preparation and presentation of the financial statements, and for such internal control as the Board of Directors of the Fund determines is necessary to enable the preparation of financial statements that are free from material misstatement, whether due to fraud or error.
In preparing the financial statements, the Board of Directors of the Fund is responsible for assessing the Fund’s and each of its sub-funds' ability to continue as a going concern, disclosing, as applicable, matters related to going concern and using the going concern basis of accounting unless the Board of Directors of the Fund either intends to liquidate the Fund or close any of its sub-funds or to cease operations, or has no realistic alternative but to do so.
Responsibilities of the “Réviseur d’entreprises agréé” for the audit of the financial statements
The objectives of our audit are to obtain reasonable assurance about whether the financial statements as a whole are free from material misstatement, whether due to fraud or error, and to issue an audit report that includes our opinion. Reasonable assurance is a high level of assurance, but is not a guarantee that an audit conducted in accordance with the Law of 23 July 2016 and with ISAs as adopted for Luxembourg by the CSSF will always detect a material misstatement when it exists. Misstatements can arise from fraud or error and are considered material if, individually or in the aggregate, they could reasonably be expected to influence the economic decisions of users taken on the basis of these financial statements.
As part of an audit in accordance with the Law of 23 July 2016 and with ISAs as adopted for Luxembourg by the CSSF, we exercise professional judgment and maintain professional scepticism throughout the audit. We also:
• identify and assess the risks of material misstatement of the financial statements, whether due to fraud or error, design and perform audit procedures responsive to those risks, and obtain audit evidence that is sufficient and appropriate to provide a basis for our opinion. The risk of not detecting a material misstatement resulting from fraud is higher than for one resulting from error, as fraud may involve collusion, forgery, intentional omissions, misrepresentations, or the override of internal control;
• obtain an understanding of internal control relevant to the audit in order to design audit procedures that are appropriate in the circumstances, but not for the purpose of expressing an opinion on the effectiveness of the Fund’s internal control;
• evaluate the appropriateness of accounting policies used and the reasonableness of accounting estimates and related disclosures made by the Board of Directors of the Fund;

13
• conclude on the appropriateness of the Board of Directors of the Fund’s use of the going concern basis of accounting and, based on the audit evidence obtained, whether a material uncertainty exists related to events or conditions that may cast significant doubt on the Fund’s or any of its sub-funds' ability to continue as a going concern. If we conclude that a material uncertainty exists, we are required to draw attention in our audit report to the related disclosures in the financial statements or, if such disclosures are inadequate, to modify our opinion. Our conclusions are based on the audit evidence obtained up to the date of our audit report. However, future events or conditions may cause the Fund or any of its sub-funds to cease to continue as a going concern;
• evaluate the overall presentation, structure and content of the financial statements, including the disclosures, and whether the financial statements represent the underlying transactions and events in a manner that achieves fair presentation.
We communicate with those charged with governance regarding, among other matters, the planned scope and timing of the audit and significant audit findings, including any significant deficiencies in internal control that we identify during our audit.
PricewaterhouseCoopers, Société coopérativeRepresented by@esig
@esigSteven Libby
Luxembourg, 20 April 2021

14Schroder Special Situations Fund Audited Annual Report
31 December 2020
Statistical Information
as at 31 December 2020
Shares outstanding as at
31 December 2020
NAV per Share as at
31 December 2020
NAV per Share as at
31 December 2019
NAV per Share as at
31 December 2018Schroder SSF Diversified Alternative Assets Class S Acc 8,963 109.3573 108.1300 –Class S Dis 6,852,928 102.8204 106.1700 99.6100Class S Dis EUR Hedged SV 173,592 99.0198 101.8500 –Class S Dis USD Hedged 462,267 111.9159 113.5800 104.8800Total Net Assets in GBP – 758,969,423 668,471,842 324,416,722Schroder SSF Fixed Maturity Bond I Class A Acc 633,752 93.5037 96.6400 –Class A Acc HKD 16 741.6182 768.8400 –Class A Acc SGD Hedged 115 120.3703 125.0300 –Class A Dis 1,523,500 85.7391 94.0700 –Class A Dis EUR Hedged 10,928 82.9910 92.6300 –Class A Dis GBP Hedged 15,452 67.0032 74.4400 –Class A Dis HKD 33,375 679.1589 748.3400 –Class A Dis SGD Hedged 124 110.6635 121.7100 –Class A1 Acc 252,874 93.8527 96.7600 –Class A1 Acc HKD 16 744.5860 769.9800 –Class A1 Acc SGD Hedged 115 120.8411 125.2000 –Class A1 Dis 1,080,784 85.7468 94.0800 –Class A1 Dis HKD 18 679.3178 748.4800 –Class A1 Dis SGD Hedged 124 110.6759 121.7200 –Class A2 Acc 42,097 94.0761 96.8500 –Class A2 Dis 301,651 85.7338 94.0600 –Class A2 Dis EUR Hedged 158,915 83.0727 92.6500 –Class A2 Dis GBP Hedged 32,761 67.0639 74.5000 –Total Net Assets in USD – 360,824,667 481,764,966 –Schroder SSF Fixed Maturity Bond 2021 (II) Class A Dis 1,766,203 92.2290 96.0600 95.2400Class A Dis HKD 486,393 732.5885 766.2400 764.0900Class A Dis SGD Hedged 23,582 128.7946 134.0800 133.0900Total Net Assets in USD – 211,151,356 300,896,272 333,831,941Schroder SSF Fixed Maturity Bond 2023 (I) Class A Acc 248,089 108.7597 105.9100 –Class A Dis 3,141,158 101.1151 102.6500 –Class A Dis SGD Hedged 187,572 130.3780 132.7200 –Class A1 Dis 216,620 101.1234 102.6600 –Total Net Assets in USD – 385,020,857 505,406,908 –
The NAV per share of each share class is stated in the currency of the share class.

15Schroder Special Situations Fund Audited Annual Report
31 December 2020
Statistical Information
as at 31 December 2020 (continued)
Shares outstanding as at
31 December 2020
NAV per Share as at
31 December 2020
NAV per Share as at
31 December 2019
NAV per Share as at
31 December 2018Schroder SSF Fixed Maturity Bond II Class A Acc 29,722 100.0764 99.1900 –Class A Acc EUR Hedged 8,024 97.0044 97.7600 –Class A Dis 97,625 94.0851 97.1600 –Class A Dis EUR Hedged 23,631 90.7839 95.7600 –Class A1 Acc 7,000 100.9132 99.4700 –Class A1 Acc EUR Hedged 86,051 97.8273 98.0400 –Class A1 Dis 48,500 94.1108 97.1800 –Class A1 Dis EUR Hedged 77,158 90.9484 95.7800 –Class A1 Dis GBP Hedged 107 73.6969 77.0100 –Class A2 Acc 13,435 100.3811 99.3000 –Class A2 Dis 1,925,072 94.0931 97.1700 –Class A2 Dis GBP Hedged 14,938 73.6978 77.0000 –Class A2 Dis HKD 38,875 746.9178 774.6700 –Class A2 Dis SGD Hedged 217,777 121.5582 125.8300 –Total Net Assets in USD – 247,769,606 282,431,854 –Schroder SSF Fixed Maturity Bond III Class A Acc 706,255 104.0468 101.5700 –Class A Acc HKD 15 823.6099 806.8300 –Class A Acc SGD Hedged 108 134.4724 131.9000 –Class A Dis 362,115 100.0856 101.1100 –Class A Dis EUR Hedged 103 98.0056 100.6300 –Class A Dis HKD 15 791.6058 803.1400 –Class A Dis SGD Hedged 111 129.7124 131.3200 –Class A1 Acc 109,370 104.2245 101.5900 –Class A1 Dis 16 100.0980 101.1200 –Class A1 Dis EUR Hedged 103 98.0021 100.6300 –Class A2 Acc 277,845 104.3594 101.6200 –Class A2 Dis 208,941 100.0998 101.1200 –Class A2 Dis EUR Hedged – – 100.6400 –Class A2 Dis GBP Hedged 3,230 78.9855 80.7000 –Total Net Assets in USD – 171,435,424 135,548,562 –Schroder SSF Fixed Maturity Bond IV Class A Acc 117,437 102.8451 100.7000 –Class A Acc EUR Hedged 100 100.8486 100.3900 –Class A Dis 119,734 98.2710 100.4300 –Class A Dis EUR Hedged 27,736 96.4402 100.1200 –Class A1 Acc 94,665 103.4776 100.7600 –Class A1 Acc EUR Hedged 100 101.4824 100.4500 –Class A1 Dis 674,127 98.3023 100.4500 –Class A1 Dis EUR Hedged 104 96.4907 100.1400 –Class A1 Dis GBP Hedged 6,854 77.6038 80.2200 –Class A2 Acc 14,865 103.0745 100.7200 –Class A2 Dis 119,835 98.2827 100.4400 –Class A2 Dis GBP Hedged 104 77.5849 80.2100 –Class A2 Dis HKD 16 778.9175 799.3400 –Class A2 Dis SGD Hedged 112 127.3660 130.4800 –Total Net Assets in USD – 117,290,678 122,011,260 –
The NAV per share of each share class is stated in the currency of the share class.
16Schroder Special Situations Fund Audited Annual Report
31 December 2020
Statistical Information
as at 31 December 2020 (continued)
Shares outstanding as at
31 December 2020
NAV per Share as at
31 December 2020
NAV per Share as at
31 December 2019
NAV per Share as at
31 December 2018
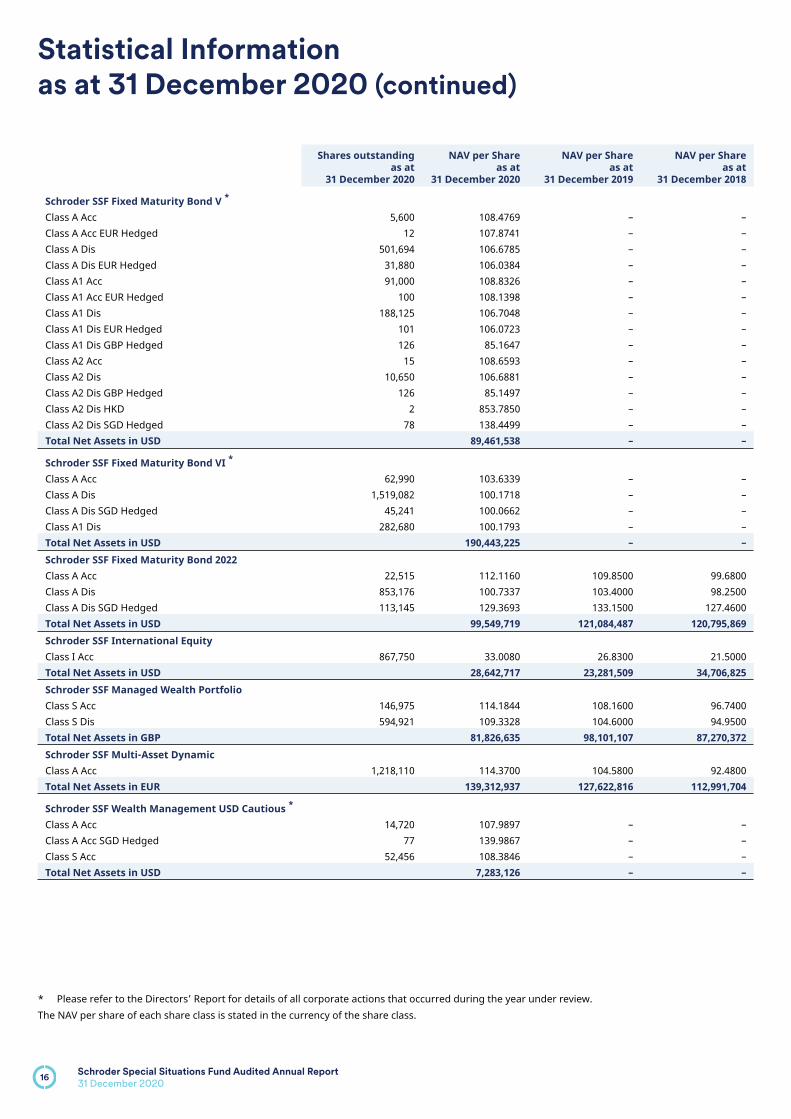
Schroder SSF Fixed Maturity Bond V *
Class A Acc 5,600 108.4769 – –Class A Acc EUR Hedged 12 107.8741 – –Class A Dis 501,694 106.6785 – –Class A Dis EUR Hedged 31,880 106.0384 – –Class A1 Acc 91,000 108.8326 – –Class A1 Acc EUR Hedged 100 108.1398 – –Class A1 Dis 188,125 106.7048 – –Class A1 Dis EUR Hedged 101 106.0723 – –Class A1 Dis GBP Hedged 126 85.1647 – –Class A2 Acc 15 108.6593 – –Class A2 Dis 10,650 106.6881 – –Class A2 Dis GBP Hedged 126 85.1497 – –Class A2 Dis HKD 2 853.7850 – –Class A2 Dis SGD Hedged 78 138.4499 – –Total Net Assets in USD – 89,461,538 – –
Schroder SSF Fixed Maturity Bond VI *
Class A Acc 62,990 103.6339 – –Class A Dis 1,519,082 100.1718 – –Class A Dis SGD Hedged 45,241 100.0662 – –Class A1 Dis 282,680 100.1793 – –Total Net Assets in USD – 190,443,225 – –Schroder SSF Fixed Maturity Bond 2022 Class A Acc 22,515 112.1160 109.8500 99.6800Class A Dis 853,176 100.7337 103.4000 98.2500Class A Dis SGD Hedged 113,145 129.3693 133.1500 127.4600Total Net Assets in USD – 99,549,719 121,084,487 120,795,869Schroder SSF International Equity Class I Acc 867,750 33.0080 26.8300 21.5000Total Net Assets in USD – 28,642,717 23,281,509 34,706,825Schroder SSF Managed Wealth Portfolio Class S Acc 146,975 114.1844 108.1600 96.7400Class S Dis 594,921 109.3328 104.6000 94.9500Total Net Assets in GBP – 81,826,635 98,101,107 87,270,372Schroder SSF Multi-Asset Dynamic Class A Acc 1,218,110 114.3700 104.5800 92.4800Total Net Assets in EUR – 139,312,937 127,622,816 112,991,704
Schroder SSF Wealth Management USD Cautious *
Class A Acc 14,720 107.9897 – –Class A Acc SGD Hedged 77 139.9867 – –Class S Acc 52,456 108.3846 – –Total Net Assets in USD – 7,283,126 – –
* Please refer to the Directors’ Report for details of all corporate actions that occurred during the year under review.The NAV per share of each share class is stated in the currency of the share class.
17Schroder Special Situations Fund Audited Annual Report
31 December 2020
Statistical Information
as at 31 December 2020 (continued)
Shares outstanding as at
31 December 2020
NAV per Share as at
31 December 2020
NAV per Share as at
31 December 2019
NAV per Share as at
31 December 2018
Schroder SSF Wealth Management USD Balanced *
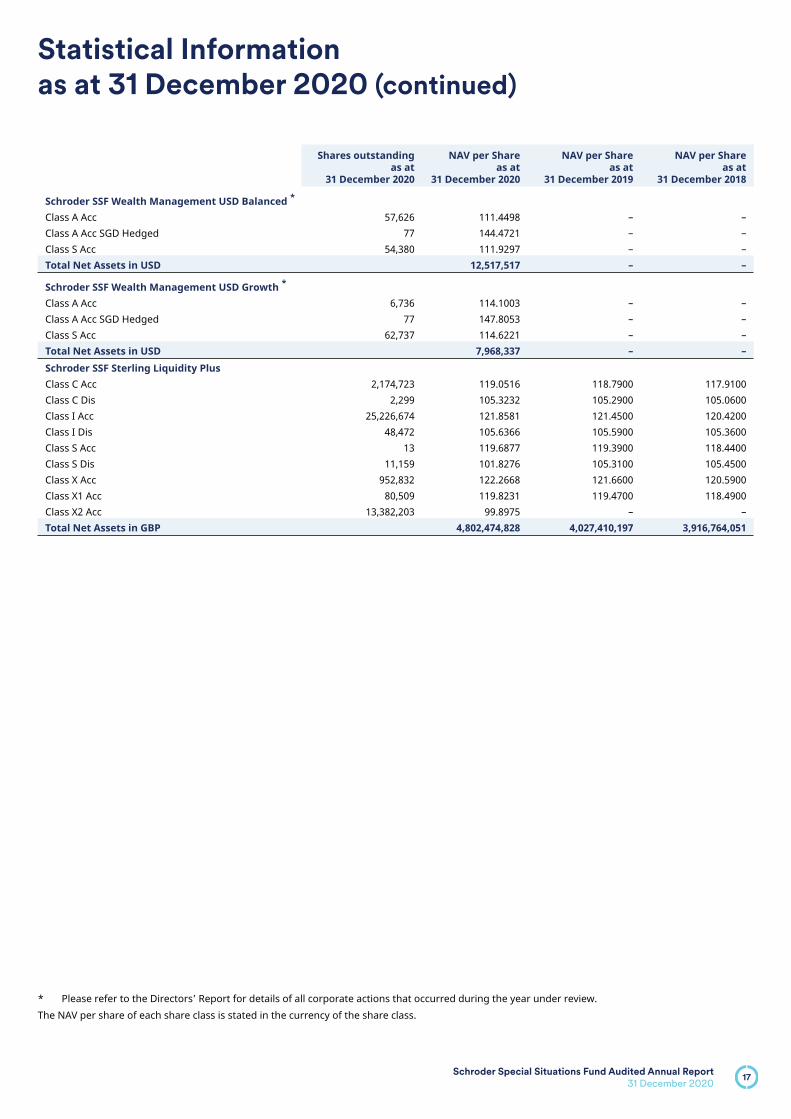
Class A Acc 57,626 111.4498 – –Class A Acc SGD Hedged 77 144.4721 – –Class S Acc 54,380 111.9297 – –Total Net Assets in USD – 12,517,517 – –
Schroder SSF Wealth Management USD Growth *
Class A Acc 6,736 114.1003 – –Class A Acc SGD Hedged 77 147.8053 – –Class S Acc 62,737 114.6221 – –Total Net Assets in USD – 7,968,337 – –Schroder SSF Sterling Liquidity Plus Class C Acc 2,174,723 119.0516 118.7900 117.9100Class C Dis 2,299 105.3232 105.2900 105.0600Class I Acc 25,226,674 121.8581 121.4500 120.4200Class I Dis 48,472 105.6366 105.5900 105.3600Class S Acc 13 119.6877 119.3900 118.4400Class S Dis 11,159 101.8276 105.3100 105.4500Class X Acc 952,832 122.2668 121.6600 120.5900Class X1 Acc 80,509 119.8231 119.4700 118.4900Class X2 Acc 13,382,203 99.8975 – –Total Net Assets in GBP – 4,802,474,828 4,027,410,197 3,916,764,051
* Please refer to the Directors’ Report for details of all corporate actions that occurred during the year under review.The NAV per share of each share class is stated in the currency of the share class.

18Schroder Special Situations Fund Audited Annual Report
31 December 2020
The accompanying notes form an integral part of these financial statements.
Combined Statement of Net Assets
as at 31 December 2020
Schroder SSF Diversified
Alternative Assets GBP
Schroder SSF Fixed Maturity Bond I
USD
Schroder SSF Fixed Maturity Bond 2021
(II) USD
Schroder SSF Fixed Maturity Bond 2023
(I) USD
ASSETS
Investments in securities at cost 728,333,214 353,157,801 210,659,310 365,328,314Unrealised gain/(loss) 10,202,269 125,014 (4,511,626) 12,487,623Investments in securities at market value 738,535,483 353,282,815 206,147,684 377,815,937Cash at bank and at brokers 33,628,830 4,467,948 4,418,666 4,666,872Collateral receivable – 85,506 10,578 88,317Receivables on subscriptions 1,076,187 – – –Dividends receivable 911,531 – – –Interest receivable – 6,566,311 2,619,535 5,946,537Unrealised gain on forward currency exchange contracts 5,094 72,693 7,506 59,899Other assets 7,063 1,375 84 127,578TOTAL ASSETS 774,164,188 364,476,648 213,204,053 388,705,140
LIABILITIES
Collateral payable 224,477 – – –Payables on redemptions 327,449 – – –Interest payable 821 20 1 2Dividend distributions payable 14,305,170 3,383,748 1,941,437 3,427,921Management fees payable 89,263 187,489 44,836 136,054Unrealised loss on forward currency exchange contracts 187,322 1 66 –Other liabilities 60,263 80,723 66,357 120,306TOTAL LIABILITIES 15,194,765 3,651,981 2,052,697 3,684,283
TOTAL NET ASSETS 758,969,423 360,824,667 211,151,356 385,020,857

19Schroder Special Situations Fund Audited Annual Report
31 December 2020
The accompanying notes form an integral part of these financial statements.
Combined Statement of Net Assets
as at 31 December 2020 (continued)
Schroder SSF Fixed Maturity Bond II
USD
Schroder SSF Fixed Maturity Bond III
USD
Schroder SSF Fixed Maturity Bond IV
USD
Schroder SSF Fixed Maturity Bond V*
USD
ASSETS
Investments in securities at cost 236,490,779 166,224,373 115,298,509 82,742,895Unrealised gain/(loss) 6,522,013 2,563,347 1,354,601 5,098,756Investments in securities at market value 243,012,792 168,787,720 116,653,110 87,841,651Cash at bank and at brokers 3,612,958 1,115,093 1,171,628 1,336,685Collateral receivable 186,249 – 10,679 1,436Interest receivable 3,120,766 2,094,367 1,598,975 942,642Unrealised gain on forward currency exchange contracts 141,156 1,656 13,626 13,092Other assets 7 – – –TOTAL ASSETS 250,073,928 171,998,836 119,448,018 90,135,506
LIABILITIES
Collateral payable – 3,501 – –Payables on investments purchased – – 1,042,500 –Dividend distributions payable 2,097,391 469,061 1,022,651 584,282Management fees payable 142,142 53,144 51,347 53,938Unrealised loss on forward currency exchange contracts 221 11 52 14Other liabilities 64,568 37,695 40,790 35,734TOTAL LIABILITIES 2,304,322 563,412 2,157,340 673,968
TOTAL NET ASSETS 247,769,606 171,435,424 117,290,678 89,461,538
* Please refer to the Directors’ Report for details of all corporate actions that occurred during the year under review.

20Schroder Special Situations Fund Audited Annual Report
31 December 2020
The accompanying notes form an integral part of these financial statements.
Combined Statement of Net Assets
as at 31 December 2020 (continued)
Schroder SSF Fixed Maturity Bond VI*
USD
Schroder SSF Fixed Maturity Bond 2022
USD
Schroder SSF International Equity
USD
Schroder SSF Managed Wealth
Portfolio GBP
ASSETS
Investments in securities at cost 183,601,229 95,693,174 20,309,981 69,257,305Unrealised gain/(loss) 3,597,786 1,579,027 7,993,458 9,385,706Investments in securities at market value 187,199,015 97,272,201 28,303,439 78,643,011Cash at bank and at brokers 2,463,231 1,707,229 363,723 3,114,192Collateral receivable 15,549 55,111 – –Receivables on subscriptions – – – 325,000Dividends receivable – – 34,338 55,493Interest receivable 2,756,507 1,536,460 – 5,443Tax reclaims receivable – – 16,780 –Unrealised gain on forward currency exchange contracts 11,148 35,872 – –Other assets 13,433 39,983 – 1,737TOTAL ASSETS 192,458,883 100,646,856 28,718,280 82,144,876
LIABILITIES
Payables on investments purchased – – 54,190 –Interest payable – – 2 –Dividend distributions payable 1,894,654 1,022,895 – 277,606Management fees payable 72,441 38,012 14,279 26,261Unrealised loss on forward currency exchange contracts 63 – – –Other liabilities 48,500 36,230 7,092 14,374TOTAL LIABILITIES 2,015,658 1,097,137 75,563 318,241
TOTAL NET ASSETS 190,443,225 99,549,719 28,642,717 81,826,635
* Please refer to the Directors’ Report for details of all corporate actions that occurred during the year under review.

21Schroder Special Situations Fund Audited Annual Report
31 December 2020
The accompanying notes form an integral part of these financial statements.
Combined Statement of Net Assets
as at 31 December 2020 (continued)
Schroder SSF Multi-Asset Dynamic
EUR
Schroder SSF Wealth Management USD
Cautious* USD
Schroder SSF Wealth Management USD
Balanced* USD
Schroder SSF Wealth Management USD
Growth* USD
ASSETS
Investments in securities at cost 122,212,244 6,286,123 10,631,767 6,588,342Unrealised gain/(loss) 6,573,030 393,858 906,863 800,279Investments in securities at market value 128,785,274 6,679,981 11,538,630 7,388,621Cash at bank and at brokers 9,947,723 590,516 965,517 536,771Receivables on subscriptions – – – 50,000Dividends receivable – 2,124 5,147 4,226Interest receivable 81,020 37,439 42,252 16,867Tax reclaims receivable – – 126 –Unrealised gain on financial futures contracts 1,239,587 – – –Unrealised gain on forward currency exchange contracts 454,537 26 28 28Other assets 1,188 – – –TOTAL ASSETS 140,509,329 7,310,086 12,551,700 7,996,513
LIABILITIES
Due to brokers 579,976 – – –Collateral payable – 9,823 9,818 9,814Interest payable 2,588 – – –Management fees payable 58,416 3,552 8,723 4,522Unrealised loss on financial futures contracts 135,625 – – –Unrealised loss on forward currency exchange contracts 383,120 – 1 1Other liabilities 36,667 13,585 15,641 13,839TOTAL LIABILITIES 1,196,392 26,960 34,183 28,176
TOTAL NET ASSETS 139,312,937 7,283,126 12,517,517 7,968,337
* Please refer to the Directors’ Report for details of all corporate actions that occurred during the year under review.

22Schroder Special Situations Fund Audited Annual Report
31 December 2020
The accompanying notes form an integral part of these financial statements.
Combined Statement of Net Assets
as at 31 December 2020 (continued)
Schroder SSF Sterling Liquidity
Plus GBP
Combined‡ EUR
ASSETS
Investments in securities at cost 4,246,293,437 7,235,226,873Unrealised gain/(loss) 1,688,494 61,888,801Investments in securities at market value 4,247,981,931 7,297,115,674Cash at bank and at brokers 144,000,650 233,103,470Time deposits 410,251,512 455,862,102Collateral receivable – 369,091Receivables on subscriptions – 1,597,667Dividends receivable – 1,111,845Interest receivable 848,198 23,234,597Tax reclaims receivable – 13,762Unrealised gain on financial futures contracts – 1,239,588Unrealised gain on forward currency exchange contracts – 750,578Other assets 514,785 731,507TOTAL ASSETS 4,803,597,076 8,015,129,881
LIABILITIES
Due to brokers – 579,976Collateral payable – 276,259Payables on redemptions – 363,854Payables on investments purchased – 892,715Interest payable 6,725 10,992Dividend distributions payable 19,894 29,123,321Management fees payable 599,236 1,512,377Unrealised loss on financial futures contracts – 135,625Unrealised loss on forward currency exchange contracts – 591,619Other liabilities 496,393 1,144,168TOTAL LIABILITIES 1,122,248 34,630,906
TOTAL NET ASSETS 4,802,474,828 7,980,498,975
‡ For the total of the Statement of Net Assets, which has been presented in EUR, assets and liabilities stated in currencies other than EUR have been converted at the following exchange rates ruling as at 31 December 2020 : 1 Euro = 1.2285 US Dollar; 1 Euro = 0.8999 British Pound.

23Schroder Special Situations Fund Audited Annual Report
31 December 2020
The accompanying notes form an integral part of these financial statements.
Combined Statement of Operations and
Changes in Net Assets for the Year Ended 31
December 2020
Schroder SSF Diversified
Alternative Assets GBP
Schroder SSF Fixed Maturity Bond I
USD
Schroder SSF Fixed Maturity Bond 2021
(II) USD
Schroder SSF Fixed Maturity Bond 2023
(I) USD
NET ASSETS AT THE BEGINNING OF THE YEAR 668,471,842 481,764,966 300,896,272 505,406,908
INCOMEDividend income, net of withholding taxes 28,073,835 – – –Interest income from investments, net of withholding taxes – 25,370,719 11,705,059 19,808,948Bank interest 27,706 10,381 964 1,945TOTAL INCOME 28,101,541 25,381,100 11,706,023 19,810,893
EXPENSESManagement fees 976,685 2,276,221 1,107,905 1,719,418Administration fees 188,800 209,885 143,760 250,482Taxe d’abonnement 69,920 184,946 113,596 207,338Depositary fees 39,991 30,391 25,915 42,976Bank and other interest expenses 11,397 – – –Operating expenses 54,757 44,120 20,863 36,166TOTAL EXPENSES 1,341,550 2,745,563 1,412,039 2,256,380
Less: Expense subsidy (3,363) – – (127,577)NET INVESTMENT INCOME/(LOSS) 26,763,354 22,635,537 10,293,984 17,682,090
Net realised gain/(loss) on: 2,463 56,174 14,642 13,015Sale of investments (1,303,622) (58,928,474) (14,687,958) (13,404,035)Forward currency exchange contracts (524,565) 1,382,105 33,599 196,314Currency exchange (109,770) (9,417) (21,496) (3,259)NET REALISED GAIN/(LOSS) FOR THE YEAR (1,937,957) (57,555,786) (14,675,855) (13,210,980)
Net change in unrealised appreciation/(depreciation) on: Investments (15,684,864) 11,811,601 (87,858) 351,690Forward currency exchange contracts 329,402 (158,018) (12,325) (98,671)Currency exchange (451) 4,806 212 904NET CHANGE IN UNREALISED APPRECIATION/(DEPRECIATION) FOR THE YEAR (15,355,913) 11,658,389 (99,971) 253,923
INCREASE/(DECREASE) IN NET ASSETS AS A RESULT OF OPERATIONS 9,469,484 (23,261,860) (4,481,842) 4,725,033
Subscriptions 200,188,087 256,769 – –Redemptions (91,853,978) (81,934,578) (76,825,087) (110,245,241)INCREASE/(DECREASE) IN NET ASSETS AS A RESULT OF MOVEMENTS IN SHARE CAPITAL 108,334,109 (81,677,809) (76,825,087) (110,245,241)
Dividend distributions (27,306,012) (16,000,630) (8,437,987) (14,865,843)NET ASSETS AT THE END OF THE YEAR 758,969,423 360,824,667 211,151,356 385,020,857

24Schroder Special Situations Fund Audited Annual Report
31 December 2020
The accompanying notes form an integral part of these financial statements.
Combined Statement of Operations and
Changes in Net Assets for the Year Ended 31
December 2020 (continued)
Schroder SSF Fixed Maturity Bond II
USD
Schroder SSF Fixed Maturity Bond III
USD
Schroder SSF Fixed Maturity Bond IV
USD
Schroder SSF Fixed Maturity Bond V *
USD
NET ASSETS AT THE BEGINNING OF THE YEAR 282,431,854 135,548,562 122,011,260 –
INCOMEInterest income from investments, net of withholding taxes 12,886,439 7,056,737 6,210,946 2,180,586Bank interest 1,237 5,097 407 –TOTAL INCOME 12,887,676 7,061,834 6,211,353 2,180,586
EXPENSESManagement fees 1,695,796 631,105 593,150 375,588Administration fees 142,002 99,919 67,837 16,890Taxe d’abonnement 124,351 90,737 63,764 33,981Depositary fees 23,507 14,591 24,101 19,900Bank and other interest expenses – – – 2Operating expenses 37,439 20,558 13,348 6,082TOTAL EXPENSES 2,023,095 856,910 762,200 452,443
NET INVESTMENT INCOME/(LOSS) 10,864,581 6,204,924 5,449,153 1,728,143
Net realised gain/(loss) on: 15,723 4,830 3,557 (1,449)Sale of investments (19,632,706) (4,375,058) (4,101,903) 684,621Forward currency exchange contracts 1,959,468 (229,097) 272,748 353,527Currency exchange (8,882) 3,159 (670) 57,165NET REALISED GAIN/(LOSS) FOR THE YEAR (17,682,120) (4,600,996) (3,829,825) 1,095,313
Net change in unrealised appreciation/(depreciation) on: Investments 8,244,176 1,442,528 1,046,551 5,098,756Forward currency exchange contracts (251,652) (3,252) (26,926) 13,078Currency exchange 3,505 (8) (200) (237)NET CHANGE IN UNREALISED APPRECIATION/(DEPRECIATION) FOR THE YEAR 7,996,029 1,439,268 1,019,425 5,111,597
INCREASE/(DECREASE) IN NET ASSETS AS A RESULT OF OPERATIONS 1,178,490 3,043,196 2,638,753 7,935,053
Subscriptions 452,640 77,070,234 59,434 92,786,658Redemptions (26,727,395) (42,129,885) (3,188,036) (9,882,635)INCREASE/(DECREASE) IN NET ASSETS AS A RESULT OF MOVEMENTS IN SHARE CAPITAL (26,274,755) 34,940,349 (3,128,602) 82,904,023
Dividend distributions (9,565,983) (2,096,683) (4,230,733) (1,377,538)NET ASSETS AT THE END OF THE YEAR 247,769,606 171,435,424 117,290,678 89,461,538
* Please refer to the Directors’ Report for details of all corporate actions that occurred during the year under review.

25Schroder Special Situations Fund Audited Annual Report
31 December 2020
The accompanying notes form an integral part of these financial statements.
Combined Statement of Operations and
Changes in Net Assets for the Year Ended 31
December 2020 (continued)
Schroder SSF Fixed Maturity Bond VI *
USD
Schroder SSF Fixed Maturity Bond 2022
USD
Schroder SSF International Equity
USD
Schroder SSF Managed Wealth
Portfolio GBP
NET ASSETS AT THE BEGINNING OF THE YEAR – 121,084,487 23,281,509 98,101,107
INCOMEDividend income, net of withholding taxes – – 267,271 836,800Interest income from investments, net of withholding taxes 7,649,544 5,609,079 – 21,808Bank interest 30,809 2,309 1,033 2,822TOTAL INCOME 7,680,353 5,611,388 268,304 861,430
EXPENSESManagement fees 706,547 475,776 143,380 311,844Administration fees 89,668 63,104 25,421 21,093Taxe d’abonnement 91,816 52,863 2,389 8,837Depositary fees 21,760 19,171 5,732 8,110Operating expenses 16,037 9,421 2,018 2,106TOTAL EXPENSES 925,828 620,335 178,940 351,990
Less: Expense subsidy (13,433) (39,983) – –NET INVESTMENT INCOME/(LOSS) 6,767,958 5,031,036 89,364 509,440
Net realised gain/(loss) on: 4,044 1,790 (1,592) 1,672Sale of investments (4,370,487) (2,065,099) 1,594,064 (1,746,905)Forward currency exchange contracts 160,953 138,838 – 12,901Currency exchange 4,286 (2,373) (1,777) 48,637NET REALISED GAIN/(LOSS) FOR THE YEAR (4,205,248) (1,928,634) 1,592,287 (1,685,367)
Net change in unrealised appreciation/(depreciation) on: Investments 3,597,786 (1,855,929) 3,676,365 5,046,267Forward currency exchange contracts 11,085 (57,413) – –Currency exchange (217) 937 3,192 2,256NET CHANGE IN UNREALISED APPRECIATION/(DEPRECIATION) FOR THE YEAR 3,608,654 (1,912,405) 3,679,557 5,048,523
INCREASE/(DECREASE) IN NET ASSETS AS A RESULT OF OPERATIONS 6,171,364 1,189,997 5,361,208 3,872,596
Subscriptions 200,783,176 535 – 11,228,299Redemptions (10,352,255) (18,157,964) – (31,097,760)INCREASE/(DECREASE) IN NET ASSETS AS A RESULT OF MOVEMENTS IN SHARE CAPITAL 190,430,921 (18,157,429) – (19,869,461)
Dividend distributions (6,159,060) (4,567,336) – (277,607)NET ASSETS AT THE END OF THE YEAR 190,443,225 99,549,719 28,642,717 81,826,635
* Please refer to the Directors’ Report for details of all corporate actions that occurred during the year under review.

26Schroder Special Situations Fund Audited Annual Report
31 December 2020
The accompanying notes form an integral part of these financial statements.
Combined Statement of Operations and
Changes in Net Assets for the Year Ended 31
December 2020 (continued)
Schroder SSF Multi-Asset Dynamic
EUR
Schroder SSF Wealth Management USD
Cautious *
USD
Schroder SSF Wealth Management USD
Balanced *
USD
Schroder SSF Wealth Management USD
Growth *
USD
NET ASSETS AT THE BEGINNING OF THE YEAR 127,622,816 – – –
INCOMEDividend income, net of withholding taxes 118,380 29,358 58,197 50,240Interest income from investments, net of withholding taxes 355,004 65,577 70,645 34,891Bank interest – 28 – 6TOTAL INCOME 473,384 94,963 128,842 85,137
EXPENSESManagement fees 634,328 20,931 43,908 26,679Administration fees 11,980 11,369 15,030 11,236Taxe d’abonnement 34,767 936 2,092 868Depositary fees 25,056 6,976 11,106 7,850Bank and other interest expenses 81,683 – 140 5Operating expenses 9,816 388 566 393TOTAL EXPENSES 797,630 40,600 72,842 47,031
NET INVESTMENT INCOME/(LOSS) (324,246) 54,363 56,000 38,106
Net realised gain/(loss) on: (15,667) (29) (26) (23)Sale of investments (468,257) 27,580 28,094 23,835Options contracts (948,804) – – –Financial futures contracts 9,788,678 – – –Forward currency exchange contracts (688,726) 535 542 547Currency exchange (166,996) 330 (3,310) (1,748)NET REALISED GAIN/(LOSS) FOR THE YEAR 7,515,895 28,445 25,326 22,634
Net change in unrealised appreciation/(depreciation) on: Investments 4,675,243 393,858 906,863 800,279Financial futures contracts 118,698 – – –Forward currency exchange contracts (52,171) 26 27 27Currency exchange (4,209) 20 48 32NET CHANGE IN UNREALISED APPRECIATION/(DEPRECIATION) FOR THE YEAR 4,737,561 393,904 906,938 800,338
INCREASE/(DECREASE) IN NET ASSETS AS A RESULT OF OPERATIONS 11,929,210 476,712 988,264 861,078
Subscriptions 59,983 6,806,414 11,529,253 7,107,259Redemptions (299,072) – – –INCREASE/(DECREASE) IN NET ASSETS AS A RESULT OF MOVEMENTS IN SHARE CAPITAL (239,089) 6,806,414 11,529,253 7,107,259
NET ASSETS AT THE END OF THE YEAR 139,312,937 7,283,126 12,517,517 7,968,337
* Please refer to the Directors’ Report for details of all corporate actions that occurred during the year under review.

27Schroder Special Situations Fund Audited Annual Report
31 December 2020
The accompanying notes form an integral part of these financial statements.
Combined Statement of Operations and
Changes in Net Assets for the Year Ended 31
December 2020 (continued)
Schroder SSF Sterling Liquidity
Plus GBP
Combined ‡
EUR
NET ASSETS AT THE BEGINNING OF THE YEAR$ 4,027,410,197 7,060,156,632
INCOMEDividend income, net of withholding taxes – 32,572,944Interest income from investments, net of withholding taxes 14,680,580 96,993,122Bank interest 37,835 120,095TOTAL INCOME 14,718,415 129,686,161
EXPENSESManagement fees 1,925,274 12,196,058Administration fees 1,267,358 2,586,812Taxe d’abonnement 393,881 1,349,277Depositary fees 339,040 661,977Bank and other interest expenses – 94,467Operating expenses 437,913 728,423TOTAL EXPENSES 4,363,466 17,617,014
Less: Expense subsidy (514,785) (723,084)NET INVESTMENT INCOME/(LOSS) 10,869,734 112,792,231
Net realised gain/(loss) on: (4,347) 74,172Sale of investments 4,346,672 (96,063,827)Options contracts – (948,804)Financial futures contracts – 9,788,678Forward currency exchange contracts – 2,218,601Currency exchange (159) (225,327)NET REALISED GAIN/(LOSS) FOR THE YEAR 4,346,513 (85,230,679)
Net change in unrealised appreciation/(depreciation) on: Investments (1,195,120) 20,363,459Financial futures contracts – 118,699Forward currency exchange contracts – (161,540)Currency exchange (105,170) (108,489)NET CHANGE IN UNREALISED APPRECIATION/(DEPRECIATION) FOR THE YEAR (1,300,290) 20,212,129
INCREASE/(DECREASE) IN NET ASSETS AS A RESULT OF OPERATIONS 13,915,957 47,773,681
Subscriptions 14,371,193,471 16,526,963,503Redemptions (13,610,024,903) (15,568,938,287)INCREASE/(DECREASE) IN NET ASSETS AS A RESULT OF MOVEMENTS IN SHARE CAPITAL 761,168,568 958,025,216
Dividend distributions (19,894) (85,456,554)NET ASSETS AT THE END OF THE YEAR 4,802,474,828 7,980,498,975
$ The opening balance was combined using the foreign exchange rates as at 31 December 2020. The same net assets combined using the foreign exchange rates as at 31 December 2019 reflected a figure of EUR 7,520,235,766.
‡ For the total of the Statement of Operations, which has been presented in EUR, income and expenses stated in currencies other than EUR have been converted at the following exchange rates ruling as at 31 December 2020; 1 Euro = 1.2285 US Dollar; 1 Euro = 0.8999 British Pound.

28
Schedule of Investments as at 31 December 2020Schroder SSF Diversified Alternative Assets
Schroder Special Situations Fund Audited Annual Report
31 December 2020
The accompanying notes form an integral part of these financial statements.
Portfolio of Investments a
Investments CurrencyQuantity/
Nominal Value
Market Value
GBP
% of Net
Assets
Transferable securities and money market instruments admitted to an official exchange listingEquitiesFinancialsDraper Esprit plc GBP 2,739,400 18,080,040 2.38Greencoat Renewables plc EUR 12,435,238 13,037,572 1.72Octopus Renewables Infrastructure Trust plc GBP 25,424,262 28,920,098 3.81a 60,037,710 7.91IndustrialsDoric Nimrod Air Three Ltd. Preference GBP 10,700,000 4,708,000 0.62Doric Nimrod Air Two Ltd. Preference GBP 11,123,764 8,899,011 1.17DP Aircraft I Ltd. USD 19,322,705 849,306 0.11a 14,456,317 1.90Real EstateAssura plc, REIT GBP 23,320,000 17,909,760 2.36Civitas Social Housing plc, REIT, Reg. S GBP 7,498,900 7,858,847 1.04Empiric Student Property plc, REIT GBP 11,760,365 8,808,513 1.16Impact Healthcare Reit plc, Reg. S GBP 12,210,000 13,308,900 1.75LXI REIT plc, Reg. S GBP 9,250,000 11,007,500 1.45Primary Health Properties plc, REIT GBP 5,015,153 7,663,154 1.01Residential Secure Income plc, REIT, Reg. S GBP 13,734,250 12,278,420 1.62Schroder Real Estate Investment Trust Ltd. GBP 16,716,000 6,519,240 0.86Secure Income REIT plc GBP 2,979,640 8,938,920 1.18Supermarket Income Reit plc GBP 26,462,546 28,182,612 3.71Target Healthcare REIT plc GBP 12,495,090 14,244,403 1.88Urban Logistics REIT plc GBP 7,600,000 10,868,000 1.43a 147,588,269 19.45
Total Equities 222,082,296 29.26Total Transferable securities and money market instruments admitted to an official exchange listing 222,082,296 29.26
Investments CurrencyQuantity/
Nominal Value
Market Value
GBP
% of Net
Assets
Units of authorised UCITS or other collective investment undertakingsCollective Investment Schemes - AIFFinancials3i Infrastructure plc GBP 9,641,667 29,696,334 3.91Aberdeen Diversified Income and Growth Trust plc GBP 8,700,000 8,700,000 1.15Aquila European Renewables Income Fund plc (The) EUR 11,000,000 10,542,873 1.39HgCapital Trust plc GBP 5,721,000 17,449,050 2.30Hipgnosis Songs Fund Ltd. (The) Fund Reg. S GBP 38,000,000 46,930,000 6.19Pantheon International plc (The) Fund GBP 941,500 23,584,575 3.11Tufton Oceanic Assets Ltd. (The) Fund Reg. S USD 21,995,000 14,904,273 1.96VPC Specialty Lending Investments plc Reg. S GBP 22,400,000 17,628,800 2.32a 169,435,905 22.33Investment FundsBBGI Global Infrastructure SA GBP 16,763,750 29,168,925 3.84CATCo Reinsurance Opportunities Fund Ltd. USD 2,841,565 468,366 0.06CATCo Reinsurance Opportunities Fund Ltd. USD 3,089,808 984,614 0.13Foresight Solar Fund Ltd. GBP 15,007,650 15,382,841 2.03Gresham House Energy Storage Fund plc (The) Fund GBP 12,200,000 13,725,000 1.81HarbourVest Global Private Equity Ltd. GBP 1,421,000 27,652,660 3.64HICL Infrastructure plc GBP 18,229,668 31,719,622 4.19ICG Enterprise Trust plc GBP 1,150,000 11,017,000 1.45International Public Partnerships Ltd. GBP 17,436,787 29,677,411 3.91M&G Credit Income Investment Trust plc (The) Fund GBP 13,724,577 12,626,611 1.66

29Schroder Special Situations Fund Audited Annual Report
31 December 2020
The accompanying notes form an integral part of these financial statements.
Schedule of Investments as at 31 December 2020 Schroder SSF Diversified Alternative Assets
Portfolio of Investments (continued) a
Investments CurrencyQuantity/
Nominal Value
Market Value
GBP
% of Net
Assets
NB Private Equity Partners Ltd. USD 1,622,500 18,660,765 2.46Riverstone Energy Ltd. GBP 2,518,000 7,478,460 0.99Sequoia Economic Infrastructure Income Fund Ltd. GBP 18,007,581 19,772,324 2.61Starwood European Real Estate Finance Ltd. GBP 20,356,700 18,321,030 2.41a 236,655,629 31.19Real EstateGround Rents Income Fund plc, REIT GBP 9,675,000 7,086,938 0.93a 7,086,938 0.93UtilitiesGreencoat UK Wind plc GBP 22,000,000 29,524,000 3.89Renewables Infrastructure Group Ltd. (The) GBP 12,426,835 15,881,495 2.09a 45,405,495 5.98
Total Collective Investment Schemes - AIF 458,583,967 60.43
Investments CurrencyQuantity/
Nominal Value
Market Value
GBP
% of Net
Assets
Collective Investment Schemes - UCITSInvestment FundsATLAS Global Infrastructure Fund - Series B GBP Unhedged Share Class (Inc) GBP 120,000 14,807,124 1.95M&G UK Inflation Linked Corporate Bond Fund - Class PP Acc GBP 9,095,361 9,562,863 1.26a 24,369,987 3.21
Total Collective Investment Schemes - UCITS 24,369,987 3.21Exchange Traded FundsInvestment FundsiShares Physical Gold Fund USD 1,237,000 33,499,233 4.41a 33,499,233 4.41
Total Exchange Traded Funds 33,499,233 4.41Total Units of authorised UCITS or other collective investment undertakings 516,453,187 68.05Total Investments 738,535,483 97.31Cash 33,628,830 4.43Other assets/(liabilities) (13,194,890) (1.74)Total Net Assets 758,969,423 100.00
Forward Currency Exchange Contracts
Currency Purchased
Amount Purchased
Currency Sold
Amount Sold
Maturity Date Counterparty
Unrealised Gain/(Loss)
GBP% of Net
Assets
Share Class HedgingGBP 121,837 EUR 134,559 29/01/2021 HSBC 692 –GBP 690,676 USD 936,993 29/01/2021 HSBC 4,402 –Unrealised Gain on NAV Hedged Share Classes Forward Currency Exchange Contracts - Assets 5,094 –Total Unrealised Gain on Forward Currency Exchange Contracts - Assets 5,094 –Share Class HedgingEUR 17,387,749 GBP 15,666,432 29/01/2021 HSBC (12,091) –USD 52,846,273 GBP 38,881,013 29/01/2021 HSBC (175,231) (0.02)Unrealised Loss on NAV Hedged Share Classes Forward Currency Exchange Contracts - Liabilities (187,322) (0.02)Total Unrealised Loss on Forward Currency Exchange Contracts - Liabilities (187,322) (0.02)Net Unrealised Loss on Forward Currency Exchange Contracts - Liabilities (182,228) (0.02)

30
Schedule of Investments as at 31 December 2020Schroder SSF Fixed Maturity Bond I
Schroder Special Situations Fund Audited Annual Report
31 December 2020
The accompanying notes form an integral part of these financial statements.
Portfolio of Investments a
Investments CurrencyQuantity/
Nominal Value
Market Value
USD
% of Net
Assets
Transferable securities and money market instruments admitted to an official exchange listingBondsConsumer DiscretionaryFalabella SA, Reg. S 3.75% 30/04/2023 USD 12,485,000 13,178,697 3.65Metalsa SA de CV, Reg. S 4.9% 24/04/2023 USD 16,525,000 17,349,680 4.81a 30,528,377 8.46Consumer StaplesNatura Cosmeticos SA, Reg. S 5.375% 01/02/2023 USD 810,000 831,068 0.23a 831,068 0.23EnergyEcopetrol SA 5.875% 18/09/2023 USD 5,520,000 6,170,035 1.71Petroleos Mexicanos 5.95% 28/01/2031 USD 4,203,000 4,176,731 1.16Petroleos Mexicanos 3.5% 30/01/2023 USD 8,070,000 8,225,832 2.28YPF Energia Electrica SA, Reg. S 10% 25/07/2026 USD 11,950,000 9,739,250 2.70YPF SA, Reg. S 8.5% 28/07/2025 USD 11,340,000 8,806,219 2.44a 37,118,067 10.29FinancialsBanco BTG Pactual SA, Reg. S 5.5% 31/01/2023 USD 9,445,000 10,160,223 2.82Banco de Bogota SA, Reg. S 5.375% 19/02/2023 USD 9,580,000 10,250,600 2.84BBVA Bancomer SA, Reg. S 6.75% 30/09/2022 USD 1,935,000 2,093,670 0.58Costa Rica Government Bond, Reg. S 4.25% 26/01/2023 USD 17,620,000 16,937,401 4.69Credito Real SAB de CV SOFOM ER, Reg. S 9.5% 07/02/2026 USD 1,600,000 1,738,016 0.48El Salvador Government Bond, Reg. S 7.75% 24/01/2023 USD 17,538,000 17,382,876 4.82Gilex Holding Sarl, Reg. S 8.5% 02/05/2023 USD 9,810,000 10,257,581 2.84
Investments CurrencyQuantity/
Nominal Value
Market Value
USD
% of Net
Assets
Mexarrend SAPI de CV, Reg. S 10.25% 24/07/2024 USD 10,570,000 9,645,231 2.67Operadora de Servicios Mega SA de CV Sofom ER, Reg. S 8.25% 11/02/2025 USD 9,673,000 10,102,239 2.80Provincia de Cordoba, Reg. S 7.125% 10/06/2021 USD 24,580,000 16,591,500 4.60Unifin Financiera SAB de CV, Reg. S 7.25% 27/09/2023 USD 3,750,000 3,630,938 1.01a 108,790,275 30.15MaterialsEldorado Intl. Finance GmbH, Reg. S 8.625% 16/06/2021 USD 6,300,000 6,401,651 1.77Nexa Resources Peru SAA, Reg. S 4.625% 28/03/2023 USD 9,788,000 10,374,350 2.88Unigel Luxembourg SA, Reg. S 8.75% 01/10/2026 USD 4,140,000 4,460,850 1.24a 21,236,851 5.89UtilitiesAES El Salvador Trust II, Reg. S 6.75% 28/03/2023 USD 10,750,000 10,305,541 2.86Light Servicos de Eletricidade SA, Reg. S 7.25% 03/05/2023 USD 9,208,000 9,662,737 2.68Pampa Energia SA, Reg. S 7.375% 21/07/2023 USD 10,840,000 10,352,200 2.86a 30,320,478 8.40
Total Bonds 228,825,116 63.42Total Transferable securities and money market instruments admitted to an official exchange listing 228,825,116 63.42Transferable securities and money market instruments dealt in on another regulated marketBondsCommunication ServicesSixsigma Networks Mexico SA de CV, Reg. S 7.5% 02/05/2025 USD 2,635,000 2,453,567 0.68a 2,453,567 0.68
31Schroder Special Situations Fund Audited Annual Report
31 December 2020
The accompanying notes form an integral part of these financial statements.
Schedule of Investments as at 31 December 2020 Schroder SSF Fixed Maturity Bond I
Portfolio of Investments (continued) a
Investments CurrencyQuantity/
Nominal Value
Market Value
USD
% of Net
Assets
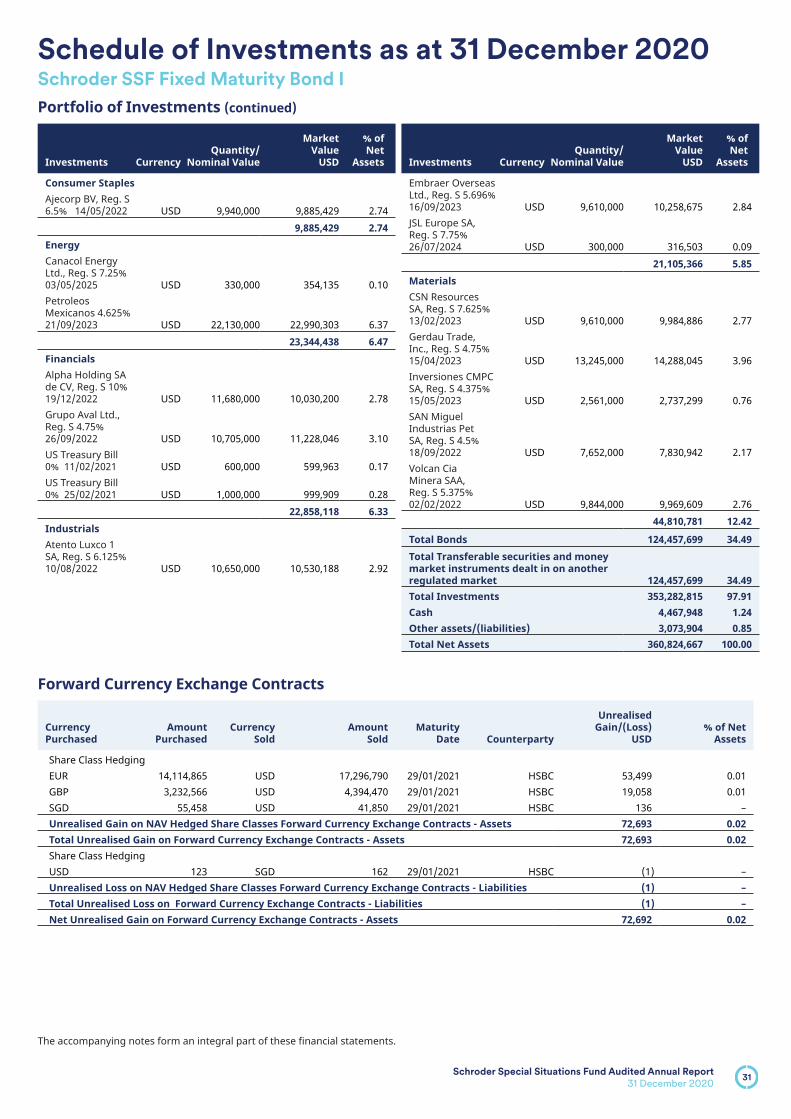
Consumer StaplesAjecorp BV, Reg. S 6.5% 14/05/2022 USD 9,940,000 9,885,429 2.74a 9,885,429 2.74EnergyCanacol Energy Ltd., Reg. S 7.25% 03/05/2025 USD 330,000 354,135 0.10Petroleos Mexicanos 4.625% 21/09/2023 USD 22,130,000 22,990,303 6.37a 23,344,438 6.47FinancialsAlpha Holding SA de CV, Reg. S 10% 19/12/2022 USD 11,680,000 10,030,200 2.78Grupo Aval Ltd., Reg. S 4.75% 26/09/2022 USD 10,705,000 11,228,046 3.10US Treasury Bill 0% 11/02/2021 USD 600,000 599,963 0.17US Treasury Bill 0% 25/02/2021 USD 1,000,000 999,909 0.28a 22,858,118 6.33IndustrialsAtento Luxco 1 SA, Reg. S 6.125% 10/08/2022 USD 10,650,000 10,530,188 2.92
Investments CurrencyQuantity/
Nominal Value
Market Value
USD
% of Net
Assets
Embraer Overseas Ltd., Reg. S 5.696% 16/09/2023 USD 9,610,000 10,258,675 2.84JSL Europe SA, Reg. S 7.75% 26/07/2024 USD 300,000 316,503 0.09a 21,105,366 5.85MaterialsCSN Resources SA, Reg. S 7.625% 13/02/2023 USD 9,610,000 9,984,886 2.77Gerdau Trade, Inc., Reg. S 4.75% 15/04/2023 USD 13,245,000 14,288,045 3.96Inversiones CMPC SA, Reg. S 4.375% 15/05/2023 USD 2,561,000 2,737,299 0.76SAN Miguel Industrias Pet SA, Reg. S 4.5% 18/09/2022 USD 7,652,000 7,830,942 2.17Volcan Cia Minera SAA, Reg. S 5.375% 02/02/2022 USD 9,844,000 9,969,609 2.76a 44,810,781 12.42
Total Bonds 124,457,699 34.49Total Transferable securities and money market instruments dealt in on another regulated market 124,457,699 34.49Total Investments 353,282,815 97.91Cash 4,467,948 1.24Other assets/(liabilities) 3,073,904 0.85Total Net Assets 360,824,667 100.00
Forward Currency Exchange Contracts
Currency Purchased
Amount Purchased
Currency Sold
Amount Sold
Maturity Date Counterparty
Unrealised Gain/(Loss)
USD% of Net
Assets
Share Class HedgingEUR 14,114,865 USD 17,296,790 29/01/2021 HSBC 53,499 0.01GBP 3,232,566 USD 4,394,470 29/01/2021 HSBC 19,058 0.01SGD 55,458 USD 41,850 29/01/2021 HSBC 136 –Unrealised Gain on NAV Hedged Share Classes Forward Currency Exchange Contracts - Assets 72,693 0.02Total Unrealised Gain on Forward Currency Exchange Contracts - Assets 72,693 0.02Share Class HedgingUSD 123 SGD 162 29/01/2021 HSBC (1 ) –Unrealised Loss on NAV Hedged Share Classes Forward Currency Exchange Contracts - Liabilities (1 ) –Total Unrealised Loss on Forward Currency Exchange Contracts - Liabilities (1 ) –Net Unrealised Gain on Forward Currency Exchange Contracts - Assets 72,692 0.02

32
Schedule of Investments as at 31 December 2020Schroder SSF Fixed Maturity Bond 2021 (II)
Schroder Special Situations Fund Audited Annual Report
31 December 2020
The accompanying notes form an integral part of these financial statements.
Portfolio of Investments a
Investments CurrencyQuantity/
Nominal Value
Market Value
USD
% of Net
Assets
Transferable securities and money market instruments admitted to an official exchange listingBondsConsumer DiscretionaryKia Motors Corp., Reg. S 2.625% 21/04/2021 USD 3,435,000 3,455,040 1.64a 3,455,040 1.64EnergyIndian Oil Corp. Ltd., Reg. S 5.625% 02/08/2021 USD 2,870,000 2,947,980 1.40Petroleos Mexicanos 5.375% 13/03/2022 USD 10,040,000 10,406,711 4.93Rosneft Oil Co., Reg. S 4.199% 06/03/2022 USD 310,000 319,723 0.15Sinopec Group Overseas Development 2016 Ltd., Reg. S 2% 29/09/2021 USD 8,690,000 8,750,991 4.14YPF SA, Reg. S 8.5% 23/03/2021 USD 1,685,000 1,613,388 0.76a 24,038,793 11.38FinancialsAxis Bank Ltd., Reg. S 2.875% 01/06/2021 USD 710,000 713,640 0.34CBQ Finance Ltd., Reg. S 3.25% 13/06/2021 USD 4,000,000 4,050,640 1.92CDBI Treasure I Ltd., Reg. S 2.25% 02/08/2021 USD 3,880,000 3,899,163 1.85Charming Light Investments Ltd., Reg. S 2.375% 30/08/2021 USD 8,943,000 9,004,074 4.26GTLK Europe DAC, Reg. S 5.95% 19/07/2021 USD 8,130,000 8,323,088 3.94Oman Government Bond, Reg. S 3.625% 15/06/2021 USD 10,190,000 10,220,570 4.84Oman Government Bond, Reg. S 3.875% 08/03/2022 USD 9,760,000 9,844,365 4.66Provincia de Cordoba, Reg. S 7.125% 10/06/2021 USD 15,645,000 10,560,375 4.99Qatar Government Bond, Reg. S 2.375% 02/06/2021 USD 4,380,000 4,418,062 2.09
Investments CurrencyQuantity/
Nominal Value
Market Value
USD
% of Net
Assets
Qatar Government Bond, Reg. S 4.5% 20/01/2022 USD 380,000 396,693 0.19Shinhan Bank Co. Ltd., Reg. S 2.875% 28/03/2022 USD 1,425,000 1,468,284 0.70Sri Lanka Government Bond, Reg. S 6.25% 27/07/2021 USD 11,300,000 9,835,294 4.66TC Ziraat Bankasi A/S, Reg. S 4.75% 29/04/2021 USD 5,320,000 5,345,823 2.53Turkiye Ihracat Kredi Bankasi A/S, Reg. S 5% 23/09/2021 USD 10,235,000 10,321,076 4.88Turkiye Is Bankasi A/S, Reg. S 5% 25/06/2021 USD 1,780,000 1,795,442 0.85Ukraine Government Bond, Reg. S 7.75% 01/09/2021 USD 8,740,000 9,071,220 4.30Woori Bank, Reg. S 2.625% 20/07/2021 USD 4,125,000 4,174,193 1.98Yapi ve Kredi Bankasi A/S, Reg. S 5.75% 24/02/2022 USD 1,985,000 2,017,733 0.96a 105,459,735 49.94IndustrialsNongHyup Bank, Reg. S 1.875% 12/09/2021 USD 4,155,000 4,195,530 1.99a 4,195,530 1.99MaterialsBukit Makmur Mandiri Utama PT, Reg. S 7.75% 13/02/2022 USD 2,010,000 1,992,402 0.94Eldorado Intl. Finance GmbH, Reg. S 8.625% 16/06/2021 USD 1,965,000 1,996,705 0.95Indonesia Asahan Aluminium Persero PT, Reg. S 5.23% 15/11/2021 USD 400,000 415,597 0.20Severstal OAO, Reg. S 3.85% 27/08/2021 USD 4,000,000 4,076,721 1.93a 8,481,425 4.02Real EstateChina SCE Group Holdings Ltd., Reg. S 7.45% 17/04/2021 USD 515,000 520,793 0.25

33Schroder Special Situations Fund Audited Annual Report
31 December 2020
The accompanying notes form an integral part of these financial statements.
Schedule of Investments as at 31 December 2020 Schroder SSF Fixed Maturity Bond 2021 (II)
Portfolio of Investments (continued) a
Investments CurrencyQuantity/
Nominal Value
Market Value
USD
% of Net
Assets
Jinke Properties Group Co. Ltd., Reg. S 8.375% 20/06/2021 USD 1,760,000 1,790,790 0.85Ronshine China Holdings Ltd., Reg. S 10.5% 01/03/2022 USD 1,770,000 1,871,753 0.89Yuzhou Group Holdings Co. Ltd., Reg. S 8.625% 23/01/2022 USD 1,800,000 1,887,759 0.89a 6,071,095 2.88UtilitiesCLP Power Hong Kong Financing Ltd., Reg. S 4.75% 12/07/2021 USD 3,400,000 3,468,134 1.64Comision Federal de Electricidad, Reg. S 4.875% 26/05/2021 USD 8,700,000 8,858,210 4.20Instituto Costarricense de Electricidad, Reg. S 6.95% 10/11/2021 USD 10,380,000 10,380,103 4.92Korea Gas Corp., Reg. S 1.875% 18/07/2021 USD 3,970,000 4,000,825 1.89Korea Midland Power Co. Ltd., Reg. S 2.5% 21/07/2021 USD 4,075,000 4,119,252 1.95Korea Southern Power Co. Ltd., Reg. S 3% 29/01/2021 USD 1,480,000 1,483,308 0.70a 32,309,832 15.30
Total Bonds 184,011,450 87.15Total Transferable securities and money market instruments admitted to an official exchange listing 184,011,450 87.15
Investments CurrencyQuantity/
Nominal Value
Market Value
USD
% of Net
Assets
Transferable securities and money market instruments dealt in on another regulated marketBondsConsumer DiscretionaryHyundai Capital America, Reg. S 2.45% 15/06/2021 USD 4,075,000 4,107,522 1.94NagaCorp Ltd., Reg. S 9.375% 21/05/2021 USD 1,220,000 1,244,547 0.59a 5,352,069 2.53EnergyPetroleos Mexicanos 4.875% 24/01/2022 USD 10,070,000 10,342,040 4.90a 10,342,040 4.90FinancialsBBVA Bancomer SA, Reg. S 6.5% 10/03/2021 USD 1,543,000 1,561,516 0.74a 1,561,516 0.74IndustrialsMega Advance Investments Ltd., Reg. S 5% 12/05/2021 USD 1,375,000 1,393,777 0.66a 1,393,777 0.66MaterialsVolcan Cia Minera SAA, Reg. S 5.375% 02/02/2022 USD 389,000 393,964 0.19a 393,964 0.19UtilitiesKorea Hydro & Nuclear Power Co. Ltd., Reg. S 4.75% 13/07/2021 USD 3,025,000 3,092,868 1.46a 3,092,868 1.46
Total Bonds 22,136,234 10.48Total Transferable securities and money market instruments dealt in on another regulated market 22,136,234 10.48Total Investments 206,147,684 97.63Cash 4,418,666 2.09Other assets/(liabilities) 585,006 0.28Total Net Assets 211,151,356 100.00

34Schroder Special Situations Fund Audited Annual Report
31 December 2020
The accompanying notes form an integral part of these financial statements.
Schedule of Investments as at 31 December 2020 Schroder SSF Fixed Maturity Bond 2021 (II)
Forward Currency Exchange Contracts
Currency Purchased
Amount Purchased
Currency Sold
Amount Sold
Maturity Date Counterparty
Unrealised Gain/(Loss)
USD% of Net
Assets
Share Class HedgingSGD 3,058,962 USD 2,308,408 29/01/2021 HSBC 7,506 –Unrealised Gain on NAV Hedged Share Classes Forward Currency Exchange Contracts - Assets 7,506 –Total Unrealised Gain on Forward Currency Exchange Contracts - Assets 7,506 –Share Class HedgingUSD 17,812 SGD 23,614 29/01/2021 HSBC (66 ) –Unrealised Loss on NAV Hedged Share Classes Forward Currency Exchange Contracts - Liabilities (66 ) –Total Unrealised Loss on Forward Currency Exchange Contracts - Liabilities (66 ) –Net Unrealised Gain on Forward Currency Exchange Contracts - Assets 7,440 –

35Schroder Special Situations Fund Audited Annual Report
31 December 2020
The accompanying notes form an integral part of these financial statements.
Schedule of Investments as at 31 December 2020Schroder SSF Fixed Maturity Bond 2023 (I)
Portfolio of Investments a
Investments CurrencyQuantity/
Nominal Value
Market Value
USD
% of Net
Assets
Transferable securities and money market instruments admitted to an official exchange listingBondsCommunication ServicesOoredoo International Finance Ltd., Reg. S 3.25% 21/02/2023 USD 7,100,000 7,437,250 1.93a 7,437,250 1.93Consumer DiscretionaryGolden Eagle Retail Group Ltd., Reg. S 4.625% 21/05/2023 USD 980,000 1,004,990 0.26Metalsa SA de CV, Reg. S 4.9% 24/04/2023 USD 2,545,000 2,672,008 0.70a 3,676,998 0.96EnergyEcopetrol SA 5.875% 18/09/2023 USD 16,940,000 18,934,854 4.92Gazprom Neft OAO, Reg. S 4.375% 19/09/2022 USD 7,090,000 7,445,953 1.93Greenko Mauritius Ltd., Reg. S 6.25% 21/02/2023 USD 2,570,000 2,657,539 0.69NAK Naftogaz Ukraine, Reg. S 7.375% 19/07/2022 USD 4,100,000 4,241,409 1.10Petroleos Mexicanos 3.5% 30/01/2023 USD 18,635,000 18,994,843 4.94ReNew Power Pvt Ltd., Reg. S 6.45% 27/09/2022 USD 2,010,000 2,094,420 0.54a 54,369,018 14.12FinancialsBanco BTG Pactual SA, Reg. S 5.5% 31/01/2023 USD 3,490,000 3,754,280 0.98Banco de Bogota SA, Reg. S 5.375% 19/02/2023 USD 3,380,000 3,616,600 0.94Barclays plc 4.61% 15/02/2023 USD 6,920,000 7,225,372 1.88BBVA Bancomer SA, Reg. S 6.75% 30/09/2022 USD 2,345,000 2,537,290 0.66Belarus Government Bond, Reg. S 6.875% 28/02/2023 USD 2,090,000 2,190,602 0.57
Investments CurrencyQuantity/
Nominal Value
Market Value
USD
% of Net
Assets
Bolivia Government Bond, Reg. S 4.875% 29/10/2022 USD 2,190,000 2,227,832 0.58Bolivia Government Bond, Reg. S 5.95% 22/08/2023 USD 2,212,000 2,297,505 0.60Development Bank of Kazakhstan JSC, Reg. S 4.125% 10/12/2022 USD 8,300,000 8,739,900 2.27Export-Import Bank of India, Reg. S 4% 14/01/2023 USD 5,680,000 6,006,288 1.56Fondo MIVIVIENDA SA, Reg. S 3.5% 31/01/2023 USD 18,036,000 18,936,087 4.91General Motors Financial Co., Inc. 3.25% 05/01/2023 USD 2,890,000 3,031,177 0.79General Motors Financial Co., Inc. 5.2% 20/03/2023 USD 2,000,000 2,193,782 0.57Natwest Group plc 6.125% 15/12/2022 USD 6,685,000 7,352,958 1.91Oman Government Bond, Reg. S 4.125% 17/01/2023 USD 11,157,000 11,274,149 2.93Saudi Government Bond, Reg. S 2.875% 04/03/2023 USD 18,070,000 18,941,696 4.91SoQ Sukuk A QSC, Reg. S 3.241% 18/01/2023 USD 5,710,000 6,019,982 1.56Standard Chartered plc, Reg. S 3.95% 11/01/2023 USD 7,160,000 7,537,540 1.96Unifin Financiera SAB de CV, 144A 7.25% 27/09/2023 USD 3,010,000 2,914,433 0.76Unifin Financiera SAB de CV, Reg. S 7.25% 27/09/2023 USD 650,000 629,363 0.16
USD 17,301,000 18,517,952 4.80a 135,944,788 35.30IndustrialseHi Car Services Ltd., Reg. S 5.875% 14/08/2022 USD 3,925,000 3,571,699 0.93

36Schroder Special Situations Fund Audited Annual Report
31 December 2020
The accompanying notes form an integral part of these financial statements.
Schedule of Investments as at 31 December 2020 Schroder SSF Fixed Maturity Bond 2023 (I)
Portfolio of Investments (continued) a
Investments CurrencyQuantity/
Nominal Value
Market Value
USD
% of Net
Assets
Georgian Railway JSC, Reg. S 7.75% 11/07/2022 USD 4,170,000 4,413,945 1.15Transnet SOC Ltd., Reg. S 4% 26/07/2022 USD 10,980,000 11,137,453 2.89a 19,123,097 4.97MaterialsBukit Makmur Mandiri Utama PT, Reg. S 7.75% 13/02/2022 USD 2,470,000 2,448,375 0.64China Hongqiao Group Ltd., Reg. S 7.125% 22/07/2022 USD 3,800,000 3,662,288 0.95CNAC HK Finbridge Co. Ltd., Reg. S 4.625% 14/03/2023 USD 1,960,000 2,032,818 0.53Indonesia Asahan Aluminium Persero PT, Reg. S 5.71% 15/11/2023 USD 10,150,000 11,230,179 2.91Nexa Resources Peru SAA, Reg. S 4.625% 28/03/2023 USD 4,450,000 4,716,577 1.23a 24,090,237 6.26Real EstateChina Aoyuan Group Ltd., Reg. S 7.95% 19/02/2023 USD 3,335,000 3,545,379 0.92China Evergrande Group, Reg. S 9.5% 29/03/2024 USD 4,090,000 3,588,954 0.93Country Garden Holdings Co. Ltd., Reg. S 8% 27/01/2024 USD 2,365,000 2,558,930 0.66Greenland Global Investment Ltd., Reg. S 5.9% 12/02/2023 USD 3,750,000 3,553,006 0.92Logan Group Co. Ltd., Reg. S 5.25% 23/02/2023 USD 985,000 1,004,702 0.26Ronshine China Holdings Ltd., Reg. S 10.5% 01/03/2022 USD 1,020,000 1,078,638 0.28Sunac China Holdings Ltd., Reg. S 8.35% 19/04/2023 USD 3,585,000 3,781,610 0.99Yuzhou Group Holdings Co. Ltd., Reg. S 6% 25/01/2022 USD 515,000 524,007 0.14
Investments CurrencyQuantity/
Nominal Value
Market Value
USD
% of Net
Assets
Zhenro Properties Group Ltd., Reg. S 8.65% 21/01/2023 USD 3,520,000 3,687,200 0.96a 23,322,426 6.06UtilitiesComision Federal de Electricidad, Reg. S 4.875% 15/01/2024 USD 4,050,000 4,500,178 1.17Korea East-West Power Co. Ltd., Reg. S 2.625% 19/06/2022 USD 905,000 934,105 0.24a 5,434,283 1.41
Total Bonds 273,398,097 71.01Total Transferable securities and money market instruments admitted to an official exchange listing 273,398,097 71.01Transferable securities and money market instruments dealt in on another regulated marketBondsCommunication ServicesTime Warner Entertainment Co. LP 8.375% 15/03/2023 USD 3,500,000 4,087,421 1.06a 4,087,421 1.06Consumer DiscretionaryDaimler Finance North America LLC, 144A 3.35% 22/02/2023 USD 3,985,000 4,219,703 1.10Nissan Motor Acceptance Corp., 144A 3.45% 15/03/2023 USD 7,245,000 7,566,759 1.96QVC, Inc. 4.375% 15/03/2023 USD 7,180,000 7,547,975 1.96a 19,334,437 5.02Consumer StaplesAjecorp BV, Reg. S 6.5% 14/05/2022 USD 293,000 291,391 0.08a 291,391 0.08FinancialsAlpha Holding SA de CV, Reg. S 10% 19/12/2022 USD 4,000,000 3,435,000 0.89Ares Capital Corp. 3.5% 10/02/2023 USD 6,948,000 7,364,265 1.91BNP Paribas SA, 144A 3.5% 01/03/2023 USD 5,975,000 6,361,790 1.65BPCE SA, 144A 2.75% 11/01/2023 USD 3,650,000 3,818,150 0.99Deutsche Bank AG 3.95% 27/02/2023 USD 7,078,000 7,521,124 1.96
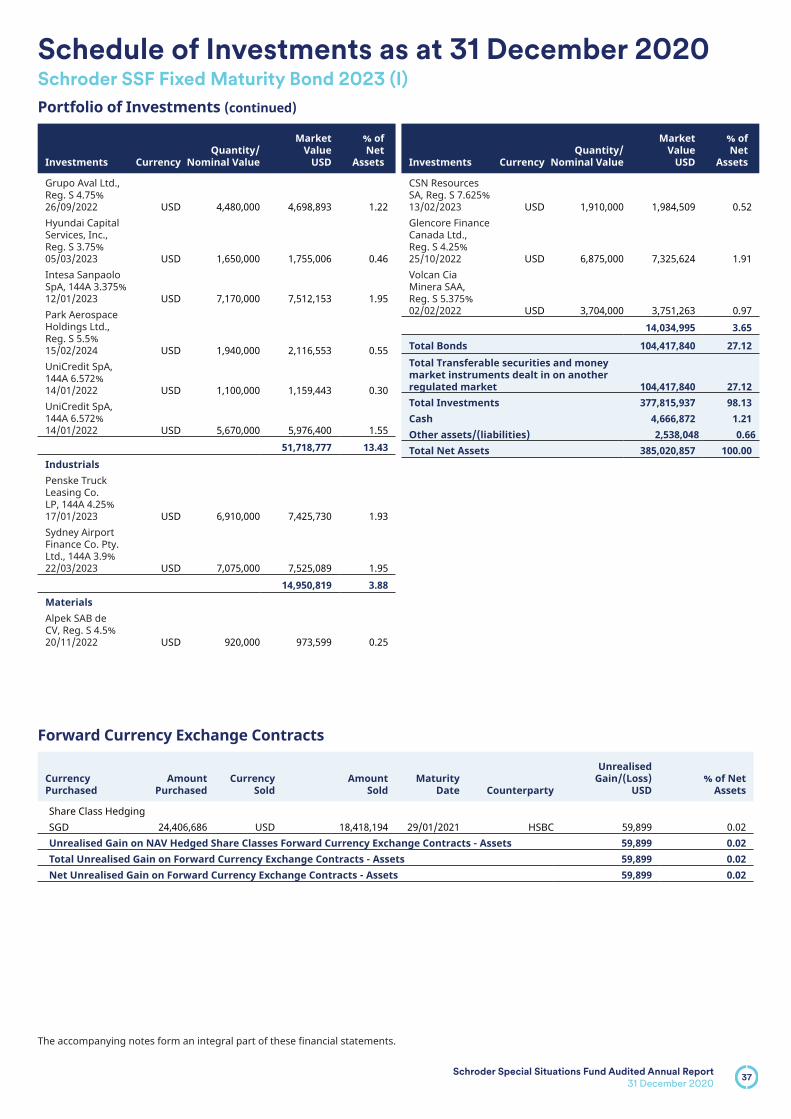
37Schroder Special Situations Fund Audited Annual Report
31 December 2020
The accompanying notes form an integral part of these financial statements.
Schedule of Investments as at 31 December 2020 Schroder SSF Fixed Maturity Bond 2023 (I)
Portfolio of Investments (continued) a
Investments CurrencyQuantity/
Nominal Value
Market Value
USD
% of Net
Assets
Grupo Aval Ltd., Reg. S 4.75% 26/09/2022 USD 4,480,000 4,698,893 1.22Hyundai Capital Services, Inc., Reg. S 3.75% 05/03/2023 USD 1,650,000 1,755,006 0.46Intesa Sanpaolo SpA, 144A 3.375% 12/01/2023 USD 7,170,000 7,512,153 1.95Park Aerospace Holdings Ltd., Reg. S 5.5% 15/02/2024 USD 1,940,000 2,116,553 0.55UniCredit SpA, 144A 6.572% 14/01/2022 USD 1,100,000 1,159,443 0.30UniCredit SpA, 144A 6.572% 14/01/2022 USD 5,670,000 5,976,400 1.55a 51,718,777 13.43IndustrialsPenske Truck Leasing Co. LP, 144A 4.25% 17/01/2023 USD 6,910,000 7,425,730 1.93Sydney Airport Finance Co. Pty. Ltd., 144A 3.9% 22/03/2023 USD 7,075,000 7,525,089 1.95a 14,950,819 3.88MaterialsAlpek SAB de CV, Reg. S 4.5% 20/11/2022 USD 920,000 973,599 0.25
Investments CurrencyQuantity/
Nominal Value
Market Value
USD
% of Net
Assets
CSN Resources SA, Reg. S 7.625% 13/02/2023 USD 1,910,000 1,984,509 0.52Glencore Finance Canada Ltd., Reg. S 4.25% 25/10/2022 USD 6,875,000 7,325,624 1.91Volcan Cia Minera SAA, Reg. S 5.375% 02/02/2022 USD 3,704,000 3,751,263 0.97a 14,034,995 3.65
Total Bonds 104,417,840 27.12Total Transferable securities and money market instruments dealt in on another regulated market 104,417,840 27.12Total Investments 377,815,937 98.13Cash 4,666,872 1.21Other assets/(liabilities) 2,538,048 0.66Total Net Assets 385,020,857 100.00
Forward Currency Exchange Contracts
Currency Purchased
Amount Purchased
Currency Sold
Amount Sold
Maturity Date Counterparty
Unrealised Gain/(Loss)
USD% of Net
Assets
Share Class HedgingSGD 24,406,686 USD 18,418,194 29/01/2021 HSBC 59,899 0.02Unrealised Gain on NAV Hedged Share Classes Forward Currency Exchange Contracts - Assets 59,899 0.02Total Unrealised Gain on Forward Currency Exchange Contracts - Assets 59,899 0.02Net Unrealised Gain on Forward Currency Exchange Contracts - Assets 59,899 0.02

38
Schedule of Investments as at 31 December 2020Schroder SSF Fixed Maturity Bond II
Schroder Special Situations Fund Audited Annual Report
31 December 2020
The accompanying notes form an integral part of these financial statements.
Portfolio of Investments a
Investments CurrencyQuantity/
Nominal Value
Market Value
USD
% of Net
Assets
Transferable securities and money market instruments admitted to an official exchange listingBondsConsumer DiscretionaryMacy's Retail Holdings LLC 2.875% 15/02/2023 USD 1,666,000 1,609,773 0.65Metalsa SA de CV, Reg. S 4.9% 24/04/2023 USD 4,525,000 4,750,820 1.92a 6,360,593 2.57Consumer StaplesImperial Brands Finance plc, 144A 3.5% 11/02/2023 USD 4,270,000 4,472,791 1.81a 4,472,791 1.81EnergyEnable Midstream Partners LP 3.9% 15/05/2024 USD 290,000 295,861 0.12Marathon Petroleum Corp. 4.5% 01/05/2023 USD 4,100,000 4,451,346 1.80Mongolian Mining Corp., Reg. S 9.25% 15/04/2024 USD 2,340,000 2,140,731 0.86Pertamina Persero PT, Reg. S 4.3% 20/05/2023 USD 5,480,000 5,899,056 2.38Petroleos Mexicanos 3.5% 30/01/2023 USD 11,960,000 12,190,948 4.92ReNew Power Pvt Ltd., Reg. S 6.45% 27/09/2022 USD 1,660,000 1,729,720 0.70a 26,707,662 10.78FinancialsBBVA Bancomer SA, Reg. S 6.75% 30/09/2022 USD 860,000 930,520 0.38Belarus Government Bond, Reg. S 6.875% 28/02/2023 USD 7,380,000 7,735,236 3.12China Great Wall International Holdings III Ltd., Reg. S 4.375% 25/05/2023 USD 1,250,000 1,339,306 0.54China Huadian Overseas Development 2018 Ltd., Reg. S 3.875% 17/05/2023 USD 960,000 1,017,672 0.41Ford Motor Credit Co. LLC 3.096% 04/05/2023 USD 340,000 343,930 0.14
Investments CurrencyQuantity/
Nominal Value
Market Value
USD
% of Net
Assets
General Motors Financial Co., Inc. 4.15% 19/06/2023 USD 4,447,000 4,785,521 1.93Gilex Holding Sarl, Reg. S 8.5% 02/05/2023 USD 2,250,000 2,352,656 0.95Natwest Group plc, FRN 3.498% 15/05/2023 USD 3,200,000 3,323,654 1.34Oman Government Bond, Reg. S 4.125% 17/01/2023 USD 1,230,000 1,242,915 0.50Provincia de Cordoba, Reg. S 7.125% 10/06/2021 USD 5,920,000 3,996,000 1.61Qatar Government Bond, Reg. S 3.875% 23/04/2023 USD 8,520,000 9,168,099 3.70Santander UK Group Holdings plc 3.571% 10/01/2023 USD 1,650,000 1,700,387 0.69Saudi Government Bond, Reg. S 2.875% 04/03/2023 USD 9,000,000 9,434,160 3.80Sri Lanka Government Bond, Reg. S 6.35% 28/06/2024 USD 1,900,000 1,166,619 0.47Standard Chartered plc, Reg. S 3.95% 11/01/2023 USD 2,920,000 3,073,969 1.24TC Ziraat Bankasi A/S, Reg. S 5.125% 29/09/2023 USD 6,420,000 6,441,282 2.60Trinidad & Tobago Government Bond, Reg. S 4.375% 16/01/2024 USD 910,000 969,064 0.39Turkey Government Bond 3.25% 23/03/2023 USD 7,110,000 7,101,248 2.87Turkiye Ihracat Kredi Bankasi A/S, Reg. S 8.25% 24/01/2024 USD 5,400,000 5,865,750 2.37Turkiye Ihracat Kredi Bankasi A/S, Reg. S 6.125% 03/05/2024 USD 7,080,000 7,273,638 2.94

39Schroder Special Situations Fund Audited Annual Report
31 December 2020
The accompanying notes form an integral part of these financial statements.
Schedule of Investments as at 31 December 2020 Schroder SSF Fixed Maturity Bond II
Portfolio of Investments (continued) a
Investments CurrencyQuantity/
Nominal Value
Market Value
USD
% of Net
Assets
Ukraine Government Bond, Reg. S 8.994% 01/02/2024 USD 10,220,000 11,593,671 4.67Westpac Banking Corp. 3.65% 15/05/2023 USD 440,000 475,218 0.19a 91,330,515 36.85IndustrialseHi Car Services Ltd., Reg. S 5.875% 14/08/2022 USD 2,600,000 2,365,966 0.95Pelabuhan Indonesia III Persero PT, Reg. S 4.5% 02/05/2023 USD 8,670,000 9,247,119 3.74a 11,613,085 4.69MaterialsBlueScope Finance Americas LLC, Reg. S 4.625% 25/05/2023 USD 4,000,000 4,268,002 1.72China Hongqiao Group Ltd., Reg. S 7.375% 02/05/2023 USD 2,470,000 2,343,305 0.95CNAC HK Finbridge Co. Ltd., Reg. S 4.625% 14/03/2023 USD 560,000 580,805 0.23a 7,192,112 2.90Real EstateAPL Realty Holdings Pte. Ltd., Reg. S 5.95% 02/06/2024 USD 2,900,000 2,421,644 0.98China Aoyuan Group Ltd., Reg. S 7.95% 19/02/2023 USD 1,980,000 2,104,903 0.85China Evergrande Group, Reg. S 7.5% 28/06/2023 USD 2,720,000 2,352,800 0.95Country Garden Holdings Co. Ltd., Reg. S 8% 27/01/2024 USD 4,070,000 4,403,740 1.78Greenland Global Investment Ltd., Reg. S 5.9% 12/02/2023 USD 2,160,000 2,046,532 0.83Logan Group Co. Ltd., Reg. S 5.25% 23/02/2023 USD 2,070,000 2,111,403 0.85Ronshine China Holdings Ltd., Reg. S 8.1% 09/06/2023 USD 2,080,000 2,152,809 0.87Shimao Group Holdings Ltd., Reg. S 4.75% 03/07/2022 USD 4,310,000 4,415,595 1.78
Investments CurrencyQuantity/
Nominal Value
Market Value
USD
% of Net
Assets
Sunac China Holdings Ltd., Reg. S 8.35% 19/04/2023 USD 2,050,000 2,162,427 0.87Times China Holdings Ltd., Reg. S 6.6% 02/03/2023 USD 1,560,000 1,595,490 0.64Ventas Realty LP, REIT 3.125% 15/06/2023 USD 4,200,000 4,438,790 1.79Yuzhou Group Holdings Co. Ltd., Reg. S 8.5% 04/02/2023 USD 2,080,000 2,246,487 0.91Zhenro Properties Group Ltd., Reg. S 8.65% 21/01/2023 USD 2,060,000 2,157,850 0.87a 34,610,470 13.97UtilitiesAES El Salvador Trust II, Reg. S 6.75% 28/03/2023 USD 2,420,000 2,319,945 0.94Comision Federal de Electricidad, Reg. S 4.875% 15/01/2024 USD 2,910,000 3,233,461 1.31Edison International 2.4% 15/09/2022 USD 2,995,000 3,062,963 1.24Edison International 2.95% 15/03/2023 USD 1,310,000 1,361,906 0.55Korea Western Power Co. Ltd., Reg. S 3.75% 07/06/2023 USD 1,020,000 1,100,051 0.44Pampa Energia SA, Reg. S 7.375% 21/07/2023 USD 2,570,000 2,454,350 0.99State Grid Overseas Investment 2013 Ltd., Reg. S 3.125% 22/05/2023 USD 3,710,000 3,905,891 1.57a 17,438,567 7.04
Total Bonds 199,725,795 80.61Total Transferable securities and money market instruments admitted to an official exchange listing 199,725,795 80.61Transferable securities and money market instruments dealt in on another regulated marketBondsCommunication ServicesSES SA, 144A 3.6% 04/04/2023 USD 4,450,000 4,710,401 1.90a 4,710,401 1.90

40Schroder Special Situations Fund Audited Annual Report
31 December 2020
The accompanying notes form an integral part of these financial statements.
Schedule of Investments as at 31 December 2020 Schroder SSF Fixed Maturity Bond II
Portfolio of Investments (continued) a
Investments CurrencyQuantity/
Nominal Value
Market Value
USD
% of Net
Assets
Consumer DiscretionaryQVC, Inc. 4.375% 15/03/2023 USD 2,270,000 2,386,338 0.96a 2,386,338 0.96Consumer StaplesAjecorp BV, Reg. S 6.5% 14/05/2022 USD 1,595,000 1,586,243 0.64a 1,586,243 0.64FinancialsAlpha Holding SA de CV, 144A 10% 19/12/2022 USD 2,500,000 2,146,875 0.87Ares Capital Corp. 3.5% 10/02/2023 USD 4,490,000 4,759,003 1.91Credit Agricole SA, 144A 3.75% 24/04/2023 USD 3,080,000 3,308,327 1.34Deutsche Bank AG 3.95% 27/02/2023 USD 4,380,000 4,654,214 1.88Intesa Sanpaolo SpA, 144A 3.375% 12/01/2023 USD 4,440,000 4,651,878 1.88
Investments CurrencyQuantity/
Nominal Value
Market Value
USD
% of Net
Assets
UniCredit SpA, 144A 6.572% 14/01/2022 USD 2,270,000 2,392,668 0.97US Treasury Bill 0% 11/02/2021 USD 3,000,000 2,999,813 1.21a 24,912,778 10.06MaterialsGlencore Funding LLC, 144A 4.125% 30/05/2023 USD 4,200,000 4,545,237 1.83Volcan Cia Minera SAA, Reg. S 5.375% 02/02/2022 USD 605,000 612,720 0.25a 5,157,957 2.08UtilitiesEnel Finance International NV, 144A 2.75% 06/04/2023 USD 4,330,000 4,533,280 1.83a 4,533,280 1.83
Total Bonds 43,286,997 17.47Total Transferable securities and money market instruments dealt in on another regulated market 43,286,997 17.47Total Investments 243,012,792 98.08Cash 3,612,958 1.46Other assets/(liabilities) 1,143,856 0.46Total Net Assets 247,769,606 100.00
Forward Currency Exchange Contracts
Currency Purchased
Amount Purchased
Currency Sold
Amount Sold
Maturity Date Counterparty
Unrealised Gain/(Loss)
USD% of Net
Assets
Share Class HedgingEUR 18,328,172 USD 22,459,718 29/01/2021 HSBC 69,656 0.03GBP 1,106,516 USD 1,504,242 29/01/2021 HSBC 6,520 –SGD 26,482,974 USD 19,985,054 29/01/2021 HSBC 64,980 0.03Unrealised Gain on NAV Hedged Share Classes Forward Currency Exchange Contracts - Assets 141,156 0.06Total Unrealised Gain on Forward Currency Exchange Contracts - Assets 141,156 0.06Share Class HedgingUSD 59,937 SGD 79,459 29/01/2021 HSBC (221 ) –Unrealised Loss on NAV Hedged Share Classes Forward Currency Exchange Contracts - Liabilities (221 ) –Total Unrealised Loss on Forward Currency Exchange Contracts - Liabilities (221 ) –Net Unrealised Gain on Forward Currency Exchange Contracts - Assets 140,935 0.06

41Schroder Special Situations Fund Audited Annual Report
31 December 2020
The accompanying notes form an integral part of these financial statements.
Schedule of Investments as at 31 December 2020Schroder SSF Fixed Maturity Bond III
Portfolio of Investments a
Investments CurrencyQuantity/
Nominal Value
Market Value
USD
% of Net
Assets
Transferable securities and money market instruments admitted to an official exchange listingBondsConsumer DiscretionaryDR Horton, Inc. 4.75% 15/02/2023 USD 155,000 166,865 0.10Ford Motor Co. 8.5% 21/04/2023 USD 2,000,000 2,254,210 1.31Macy's Retail Holdings LLC 2.875% 15/02/2023 USD 2,408,000 2,326,730 1.36Metalsa SA de CV, Reg. S 4.9% 24/04/2023 USD 1,405,000 1,475,117 0.86a 6,222,922 3.63Consumer StaplesBunge Ltd. Finance Corp. 3% 25/09/2022 USD 4,315,000 4,482,420 2.61Imperial Brands Finance plc, 144A 3.5% 11/02/2023 USD 4,796,000 5,023,771 2.94a 9,506,191 5.55EnergyAntero Resources Corp. 5.125% 01/12/2022 USD 2,795,000 2,792,205 1.63Crestwood Midstream Partners LP 6.25% 01/04/2023 USD 1,180,000 1,185,163 0.69EQT Corp. 3% 01/10/2022 USD 3,812,000 3,847,737 2.25Greenko Mauritius Ltd., Reg. S 6.25% 21/02/2023 USD 1,640,000 1,695,861 0.99Marathon Petroleum Corp. 4.5% 01/05/2023 USD 1,091,000 1,184,492 0.69Murphy Oil Corp. 4% 01/06/2022 USD 994,000 992,126 0.58Nabors Industries, Inc. 5.5% 15/01/2023 USD 2,711,000 1,770,622 1.03Occidental Petroleum Corp. 2.7% 15/02/2023 USD 1,647,000 1,651,299 0.96Petroleos Mexicanos 3.5% 30/01/2023 USD 1,815,000 1,850,048 1.08a 16,969,553 9.90FinancialsABN AMRO Bank NV, Reg. S 6.25% 27/04/2022 USD 2,980,000 3,196,390 1.86Ally Financial, Inc. 4.625% 19/05/2022 USD 2,385,000 2,514,830 1.47
Investments CurrencyQuantity/
Nominal Value
Market Value
USD
% of Net
Assets
Azure Orbit IV International Finance Ltd., Reg. S 3.75% 25/01/2023 USD 3,781,000 3,951,287 2.30Banco Santander SA 3.125% 23/02/2023 USD 4,200,000 4,423,290 2.58Barclays plc 3.684% 10/01/2023 USD 4,249,000 4,380,853 2.56Belarus Government Bond, Reg. S 6.875% 28/02/2023 USD 1,770,000 1,855,199 1.08Capital One Bank USA NA 3.375% 15/02/2023 USD 525,000 555,683 0.32CDBL Funding 2, Reg. S 3% 01/08/2022 USD 3,855,000 3,953,577 2.31China Great Wall International Holdings III Ltd., Reg. S 3.125% 31/08/2022 USD 3,919,000 4,037,112 2.35Egypt Government Bond, Reg. S 5.577% 21/02/2023 USD 1,465,000 1,550,780 0.90Fondo MIVIVIENDA SA, Reg. S 3.5% 31/01/2023 USD 2,180,000 2,288,793 1.34Ford Motor Credit Co. LLC 4.14% 15/02/2023 USD 1,883,000 1,944,198 1.13General Motors Financial Co., Inc. 3.25% 05/01/2023 USD 4,796,000 5,030,286 2.94ICBCIL Finance Co. Ltd., Reg. S 3.375% 05/04/2022 USD 1,140,000 1,170,737 0.68ICBCIL Finance Co. Ltd., Reg. S 3.125% 15/11/2022 USD 2,520,000 2,600,692 1.52Morgan Stanley 4.875% 01/11/2022 USD 874,000 942,312 0.55NatWest Markets plc, 144A 3.625% 29/09/2022 USD 4,155,000 4,382,834 2.56Oman Government Bond, Reg. S 4.125% 17/01/2023 USD 1,635,000 1,652,168 0.96
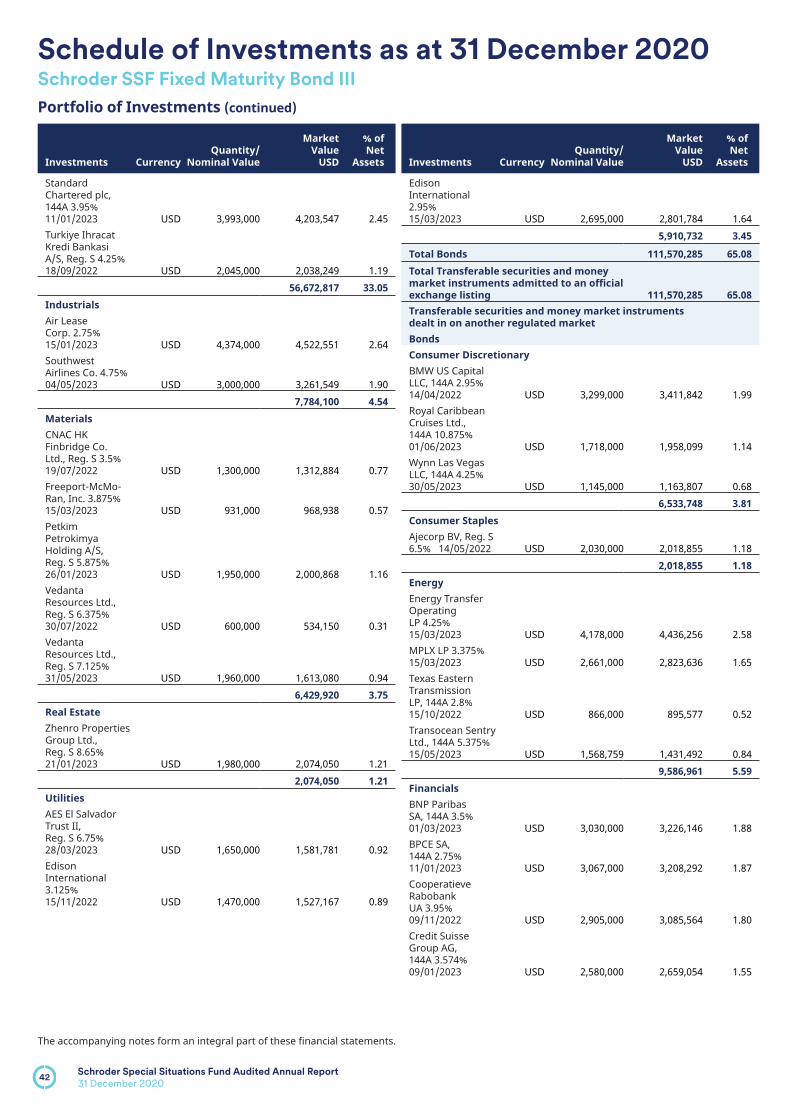
42Schroder Special Situations Fund Audited Annual Report
31 December 2020
The accompanying notes form an integral part of these financial statements.
Schedule of Investments as at 31 December 2020 Schroder SSF Fixed Maturity Bond III
Portfolio of Investments (continued) a
Investments CurrencyQuantity/
Nominal Value
Market Value
USD
% of Net
Assets
Standard Chartered plc, 144A 3.95% 11/01/2023 USD 3,993,000 4,203,547 2.45Turkiye Ihracat Kredi Bankasi A/S, Reg. S 4.25% 18/09/2022 USD 2,045,000 2,038,249 1.19a 56,672,817 33.05IndustrialsAir Lease Corp. 2.75% 15/01/2023 USD 4,374,000 4,522,551 2.64Southwest Airlines Co. 4.75% 04/05/2023 USD 3,000,000 3,261,549 1.90a 7,784,100 4.54MaterialsCNAC HK Finbridge Co. Ltd., Reg. S 3.5% 19/07/2022 USD 1,300,000 1,312,884 0.77Freeport-McMo-Ran, Inc. 3.875% 15/03/2023 USD 931,000 968,938 0.57Petkim Petrokimya Holding A/S, Reg. S 5.875% 26/01/2023 USD 1,950,000 2,000,868 1.16Vedanta Resources Ltd., Reg. S 6.375% 30/07/2022 USD 600,000 534,150 0.31Vedanta Resources Ltd., Reg. S 7.125% 31/05/2023 USD 1,960,000 1,613,080 0.94a 6,429,920 3.75Real EstateZhenro Properties Group Ltd., Reg. S 8.65% 21/01/2023 USD 1,980,000 2,074,050 1.21a 2,074,050 1.21UtilitiesAES El Salvador Trust II, Reg. S 6.75% 28/03/2023 USD 1,650,000 1,581,781 0.92Edison International 3.125% 15/11/2022 USD 1,470,000 1,527,167 0.89
Investments CurrencyQuantity/
Nominal Value
Market Value
USD
% of Net
Assets
Edison International 2.95% 15/03/2023 USD 2,695,000 2,801,784 1.64a 5,910,732 3.45
Total Bonds 111,570,285 65.08Total Transferable securities and money market instruments admitted to an official exchange listing 111,570,285 65.08Transferable securities and money market instruments dealt in on another regulated marketBondsConsumer DiscretionaryBMW US Capital LLC, 144A 2.95% 14/04/2022 USD 3,299,000 3,411,842 1.99Royal Caribbean Cruises Ltd., 144A 10.875% 01/06/2023 USD 1,718,000 1,958,099 1.14Wynn Las Vegas LLC, 144A 4.25% 30/05/2023 USD 1,145,000 1,163,807 0.68a 6,533,748 3.81Consumer StaplesAjecorp BV, Reg. S 6.5% 14/05/2022 USD 2,030,000 2,018,855 1.18a 2,018,855 1.18EnergyEnergy Transfer Operating LP 4.25% 15/03/2023 USD 4,178,000 4,436,256 2.58MPLX LP 3.375% 15/03/2023 USD 2,661,000 2,823,636 1.65Texas Eastern Transmission LP, 144A 2.8% 15/10/2022 USD 866,000 895,577 0.52Transocean Sentry Ltd., 144A 5.375% 15/05/2023 USD 1,568,759 1,431,492 0.84a 9,586,961 5.59FinancialsBNP Paribas SA, 144A 3.5% 01/03/2023 USD 3,030,000 3,226,146 1.88BPCE SA, 144A 2.75% 11/01/2023 USD 3,067,000 3,208,292 1.87Cooperatieve Rabobank UA 3.95% 09/11/2022 USD 2,905,000 3,085,564 1.80Credit Suisse Group AG, 144A 3.574% 09/01/2023 USD 2,580,000 2,659,054 1.55

43Schroder Special Situations Fund Audited Annual Report
31 December 2020
The accompanying notes form an integral part of these financial statements.
Schedule of Investments as at 31 December 2020 Schroder SSF Fixed Maturity Bond III
Portfolio of Investments (continued) a
Investments CurrencyQuantity/
Nominal Value
Market Value
USD
% of Net
Assets
Harley-Davidson Financial Services, Inc., 144A 2.55% 09/06/2022 USD 1,475,000 1,504,611 0.88Harley-Davidson Financial Services, Inc., 144A 3.35% 15/02/2023 USD 1,771,000 1,848,537 1.08Intesa Sanpaolo SpA, 144A 3.125% 14/07/2022 USD 4,040,000 4,185,315 2.45Nordea Bank Abp, 144A 4.25% 21/09/2022 USD 2,695,000 2,862,382 1.67Park Aerospace Holdings Ltd., 144A 4.5% 15/03/2023 USD 3,909,000 4,098,063 2.39a 26,677,964 15.57IndustrialsBoeing Co. (The) 2.8% 01/03/2023 USD 1,800,000 1,869,194 1.09a 1,869,194 1.09
Investments CurrencyQuantity/
Nominal Value
Market Value
USD
% of Net
Assets
Information TechnologyMicrosoft Corp. 2.65% 03/11/2022 USD 1,435,000 1,494,921 0.87NXP BV, 144A 4.625% 01/06/2023 USD 755,000 825,647 0.48a 2,320,568 1.35MaterialsCSN Resources SA, Reg. S 7.625% 13/02/2023 USD 2,103,000 2,185,038 1.27Glencore Finance Canada Ltd., 144A 4.25% 25/10/2022 USD 4,219,000 4,495,535 2.63OI European Group BV, 144A 4% 15/03/2023 USD 1,495,000 1,529,572 0.89a 8,210,145 4.79
Total Bonds 57,217,435 33.38Total Transferable securities and money market instruments dealt in on another regulated market 57,217,435 33.38Total Investments 168,787,720 98.46Cash 1,115,093 0.65Other assets/(liabilities) 1,532,611 0.89Total Net Assets 171,435,424 100.00
Forward Currency Exchange Contracts
Currency Purchased
Amount Purchased
Currency Sold
Amount Sold
Maturity Date Counterparty
Unrealised Gain/(Loss)
USD% of Net
Assets
Share Class HedgingEUR 20,299 USD 24,874 29/01/2021 HSBC 77 –GBP 256,007 USD 348,027 29/01/2021 HSBC 1,508 –SGD 28,848 USD 21,770 29/01/2021 HSBC 71 –Unrealised Gain on NAV Hedged Share Classes Forward Currency Exchange Contracts - Assets 1,656 –Total Unrealised Gain on Forward Currency Exchange Contracts - Assets 1,656 –Share Class HedgingUSD 134 EUR 109 29/01/2021 HSBC – –USD 1,924 GBP 1,417 29/01/2021 HSBC (11 ) –USD 50 SGD 66 29/01/2021 HSBC – –Unrealised Loss on NAV Hedged Share Classes Forward Currency Exchange Contracts - Liabilities (11 ) –Total Unrealised Loss on Forward Currency Exchange Contracts - Liabilities (11 ) –Net Unrealised Gain on Forward Currency Exchange Contracts - Assets 1,645 –

44
Schedule of Investments as at 31 December 2020Schroder SSF Fixed Maturity Bond IV
Schroder Special Situations Fund Audited Annual Report
31 December 2020
The accompanying notes form an integral part of these financial statements.
Portfolio of Investments a
Investments CurrencyQuantity/
Nominal Value
Market Value
USD
% of Net
Assets
Transferable securities and money market instruments admitted to an official exchange listingBondsConsumer DiscretionaryGeneral Motors Co. 5.4% 02/10/2023 USD 2,000,000 2,246,434 1.91Golden Eagle Retail Group Ltd., Reg. S 4.625% 21/05/2023 USD 270,000 276,885 0.24a 2,523,319 2.15Consumer StaplesMARB BondCo plc, Reg. S 7% 15/03/2024 USD 830,000 851,796 0.73Prosperous Ray Ltd., Reg. S 4.625% 12/11/2023 USD 2,836,000 3,084,841 2.63a 3,936,637 3.36EnergyEcopetrol SA 5.875% 18/09/2023 USD 3,600,000 4,023,936 3.43Enable Midstream Partners LP 3.9% 15/05/2024 USD 1,080,000 1,101,827 0.94EQT Corp. 3% 01/10/2022 USD 337,000 340,159 0.29Mongolian Mining Corp., Reg. S 9.25% 15/04/2024 USD 3,630,000 3,320,878 2.83ReNew Power Pvt Ltd., Reg. S 6.45% 27/09/2022 USD 3,220,000 3,355,240 2.86a 12,142,040 10.35FinancialsBahamas Government Bond, Reg. S 5.75% 16/01/2024 USD 525,000 522,380 0.45Bank of Ireland Group plc, Reg. S 4.5% 25/11/2023 USD 3,130,000 3,433,066 2.92China Great Wall International Holdings III Ltd., Reg. S 4.375% 25/05/2023 USD 250,000 267,861 0.23General Motors Financial Co., Inc. 4.15% 19/06/2023 USD 1,090,000 1,172,975 1.00Gilex Holding Sarl, Reg. S 8.5% 02/05/2023 USD 200,000 209,125 0.18Lloyds Banking Group plc 4.05% 16/08/2023 USD 340,000 371,640 0.32
Investments CurrencyQuantity/
Nominal Value
Market Value
USD
% of Net
Assets
Mexarrend SAPI de CV, Reg. S 10.25% 24/07/2024 USD 3,220,000 2,938,282 2.51Natwest Group plc 3.875% 12/09/2023 USD 1,160,000 1,259,205 1.07Qatar Government Bond, Reg. S 3.875% 23/04/2023 USD 5,090,000 5,477,185 4.66Saudi Government Bond, Reg. S 2.875% 04/03/2023 USD 2,360,000 2,473,846 2.11Standard Chartered plc, Reg. S 3.95% 11/01/2023 USD 230,000 242,128 0.21Unifin Financiera SAB de CV, Reg. S 7.25% 27/09/2023 USD 1,100,000 1,065,075 0.91Westpac Banking Corp. 3.65% 15/05/2023 USD 1,150,000 1,242,048 1.06a 20,674,816 17.63Health CareAbbVie, Inc. 3.75% 14/11/2023 USD 690,000 752,480 0.64a 752,480 0.64IndustrialsAdani Ports & Special Economic Zone Ltd., Reg. S 3.375% 24/07/2024 USD 3,130,000 3,258,931 2.77eHi Car Services Ltd., Reg. S 5.875% 14/08/2022 USD 2,330,000 2,120,270 1.81Pelabuhan Indonesia III Persero PT, Reg. S 4.5% 02/05/2023 USD 1,700,000 1,813,161 1.55a 7,192,362 6.13MaterialsChina Hongqiao Group Ltd., Reg. S 7.375% 02/05/2023 USD 1,500,000 1,423,060 1.21CNAC HK Finbridge Co. Ltd., Reg. S 4.625% 14/03/2023 USD 340,000 352,632 0.30Indonesia Asahan Aluminium Persero PT, Reg. S 5.71% 15/11/2023 USD 4,400,000 4,868,255 4.15a 6,643,947 5.66

45Schroder Special Situations Fund Audited Annual Report
31 December 2020
The accompanying notes form an integral part of these financial statements.
Schedule of Investments as at 31 December 2020 Schroder SSF Fixed Maturity Bond IV
Portfolio of Investments (continued) a
Investments CurrencyQuantity/
Nominal Value
Market Value
USD
% of Net
Assets
Real EstateCentral China Real Estate Ltd., Reg. S 7.65% 27/08/2023 USD 2,250,000 2,324,396 1.98Country Garden Holdings Co. Ltd., Reg. S 4.75% 28/09/2023 USD 1,140,000 1,169,919 1.00Country Garden Holdings Co. Ltd., Reg. S 8% 27/01/2024 USD 2,020,000 2,185,640 1.86Dar Al-Arkan Sukuk Co. Ltd., Reg. S 6.875% 21/03/2023 USD 1,000,000 1,027,500 0.88Greenland Global Investment Ltd., Reg. S 5.9% 12/02/2023 USD 3,320,000 3,145,595 2.68Ronshine China Holdings Ltd., Reg. S 8.1% 09/06/2023 USD 2,190,000 2,266,660 1.93Shimao Group Holdings Ltd., Reg. S 6.125% 21/02/2024 USD 1,840,000 1,954,074 1.67Sino-Ocean Land Treasure Finance I Ltd., Reg. S 6% 30/07/2024 USD 3,080,000 3,395,648 2.90Sunac China Holdings Ltd., Reg. S 6.5% 09/07/2023 USD 1,631,000 1,693,083 1.44a 19,162,515 16.34UtilitiesEdison International 2.95% 15/03/2023 USD 3,150,000 3,274,813 2.79Korea Western Power Co. Ltd., Reg. S 3.75% 07/06/2023 USD 3,180,000 3,429,571 2.93a 6,704,384 5.72
Total Bonds 79,732,500 67.98Total Transferable securities and money market instruments admitted to an official exchange listing 79,732,500 67.98Transferable securities and money market instruments dealt in on another regulated marketBondsCommunication ServicesSES SA, 144A 3.6% 04/04/2023 USD 710,000 751,547 0.64a 751,547 0.64
Investments CurrencyQuantity/
Nominal Value
Market Value
USD
% of Net
Assets
EnergyEni SpA, 144A 4% 12/09/2023 USD 2,050,000 2,233,247 1.90Petroleos Mexicanos 4.625% 21/09/2023 USD 3,350,000 3,480,231 2.97a 5,713,478 4.87FinancialsAlpha Holding SA de CV, 144A 10% 19/12/2022 USD 3,230,000 2,773,763 2.36Ares Capital Corp. 3.5% 10/02/2023 USD 3,310,000 3,508,306 3.00BPCE SA, 144A 5.7% 22/10/2023 USD 2,860,000 3,238,958 2.76Commerzbank AG, Reg. S 8.125% 19/09/2023 USD 1,800,000 2,105,999 1.80Deutsche Bank AG 3.95% 27/02/2023 USD 3,130,000 3,325,956 2.84Santander UK plc, Reg. S 5% 07/11/2023 USD 2,310,000 2,552,661 2.18Societe Generale SA, 144A 4.25% 14/09/2023 USD 680,000 741,930 0.63US Treasury Bill 0% 11/02/2021 USD 1,000,000 999,938 0.85US Treasury Bill 0% 25/02/2021 USD 3,300,000 3,299,701 2.81a 22,547,212 19.23Health CareMylan, Inc. 4.2% 29/11/2023 USD 520,000 569,024 0.49a 569,024 0.49IndustrialsAtento Luxco 1 SA, Reg. S 6.125% 10/08/2022 USD 1,613,000 1,594,854 1.36JSL Europe SA, Reg. S 7.75% 26/07/2024 USD 3,100,000 3,270,531 2.79a 4,865,385 4.15MaterialsAlpek SAB de CV, Reg. S 5.375% 08/08/2023 USD 940,000 1,033,948 0.88SAN Miguel Industrias Pet SA, Reg. S 4.5% 18/09/2022 USD 680,000 695,902 0.59a 1,729,850 1.47
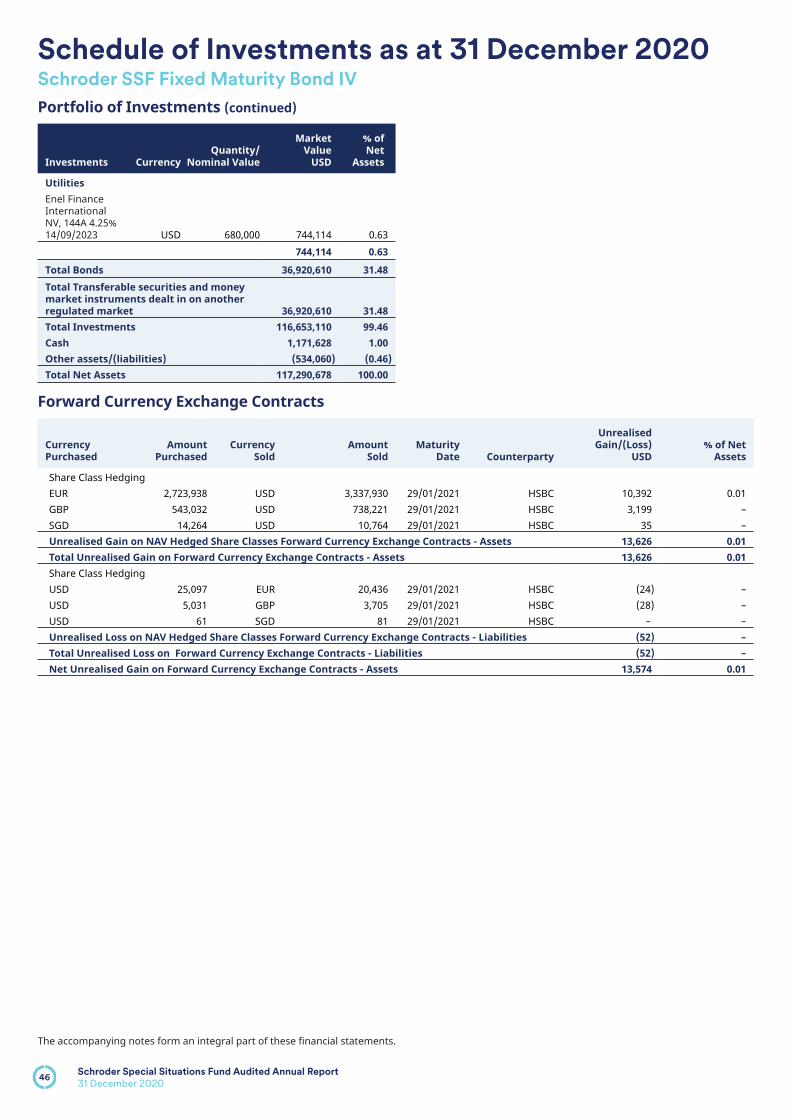
46Schroder Special Situations Fund Audited Annual Report
31 December 2020
The accompanying notes form an integral part of these financial statements.
Schedule of Investments as at 31 December 2020 Schroder SSF Fixed Maturity Bond IV
Portfolio of Investments (continued) a
Investments CurrencyQuantity/
Nominal Value
Market Value
USD
% of Net
Assets
UtilitiesEnel Finance International NV, 144A 4.25% 14/09/2023 USD 680,000 744,114 0.63a 744,114 0.63
Total Bonds 36,920,610 31.48Total Transferable securities and money market instruments dealt in on another regulated market 36,920,610 31.48Total Investments 116,653,110 99.46Cash 1,171,628 1.00Other assets/(liabilities) (534,060) (0.46)Total Net Assets 117,290,678 100.00
Forward Currency Exchange Contracts
Currency Purchased
Amount Purchased
Currency Sold
Amount Sold
Maturity Date Counterparty
Unrealised Gain/(Loss)
USD% of Net
Assets
Share Class HedgingEUR 2,723,938 USD 3,337,930 29/01/2021 HSBC 10,392 0.01GBP 543,032 USD 738,221 29/01/2021 HSBC 3,199 –SGD 14,264 USD 10,764 29/01/2021 HSBC 35 –Unrealised Gain on NAV Hedged Share Classes Forward Currency Exchange Contracts - Assets 13,626 0.01Total Unrealised Gain on Forward Currency Exchange Contracts - Assets 13,626 0.01Share Class HedgingUSD 25,097 EUR 20,436 29/01/2021 HSBC (24) –USD 5,031 GBP 3,705 29/01/2021 HSBC (28) –USD 61 SGD 81 29/01/2021 HSBC – –Unrealised Loss on NAV Hedged Share Classes Forward Currency Exchange Contracts - Liabilities (52) –Total Unrealised Loss on Forward Currency Exchange Contracts - Liabilities (52) –Net Unrealised Gain on Forward Currency Exchange Contracts - Assets 13,574 0.01
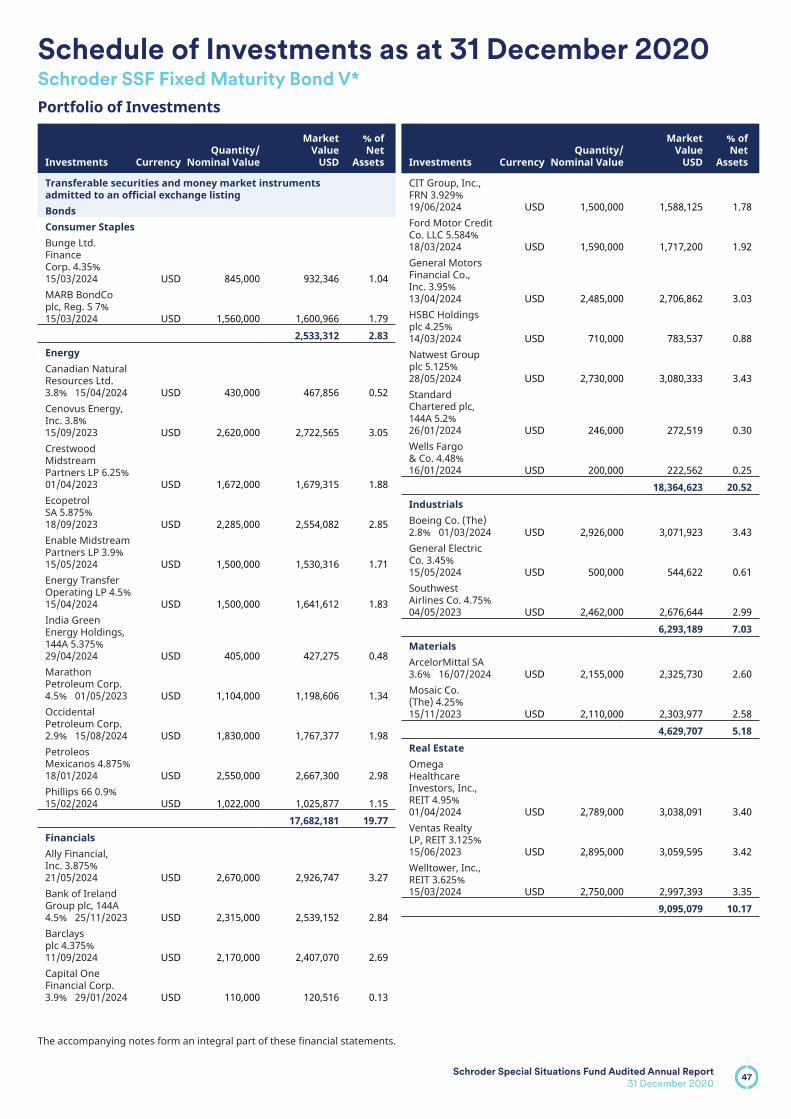
47Schroder Special Situations Fund Audited Annual Report
31 December 2020
The accompanying notes form an integral part of these financial statements.
Schedule of Investments as at 31 December 2020Schroder SSF Fixed Maturity Bond V*
Portfolio of Investments a
Investments CurrencyQuantity/
Nominal Value
Market Value
USD
% of Net
Assets
Transferable securities and money market instruments admitted to an official exchange listingBondsConsumer StaplesBunge Ltd. Finance Corp. 4.35% 15/03/2024 USD 845,000 932,346 1.04MARB BondCo plc, Reg. S 7% 15/03/2024 USD 1,560,000 1,600,966 1.79a 2,533,312 2.83EnergyCanadian Natural Resources Ltd. 3.8% 15/04/2024 USD 430,000 467,856 0.52Cenovus Energy, Inc. 3.8% 15/09/2023 USD 2,620,000 2,722,565 3.05Crestwood Midstream Partners LP 6.25% 01/04/2023 USD 1,672,000 1,679,315 1.88Ecopetrol SA 5.875% 18/09/2023 USD 2,285,000 2,554,082 2.85Enable Midstream Partners LP 3.9% 15/05/2024 USD 1,500,000 1,530,316 1.71Energy Transfer Operating LP 4.5% 15/04/2024 USD 1,500,000 1,641,612 1.83India Green Energy Holdings, 144A 5.375% 29/04/2024 USD 405,000 427,275 0.48Marathon Petroleum Corp. 4.5% 01/05/2023 USD 1,104,000 1,198,606 1.34Occidental Petroleum Corp. 2.9% 15/08/2024 USD 1,830,000 1,767,377 1.98Petroleos Mexicanos 4.875% 18/01/2024 USD 2,550,000 2,667,300 2.98Phillips 66 0.9% 15/02/2024 USD 1,022,000 1,025,877 1.15a 17,682,181 19.77FinancialsAlly Financial, Inc. 3.875% 21/05/2024 USD 2,670,000 2,926,747 3.27Bank of Ireland Group plc, 144A 4.5% 25/11/2023 USD 2,315,000 2,539,152 2.84Barclays plc 4.375% 11/09/2024 USD 2,170,000 2,407,070 2.69Capital One Financial Corp. 3.9% 29/01/2024 USD 110,000 120,516 0.13
Investments CurrencyQuantity/
Nominal Value
Market Value
USD
% of Net
Assets
CIT Group, Inc., FRN 3.929% 19/06/2024 USD 1,500,000 1,588,125 1.78Ford Motor Credit Co. LLC 5.584% 18/03/2024 USD 1,590,000 1,717,200 1.92General Motors Financial Co., Inc. 3.95% 13/04/2024 USD 2,485,000 2,706,862 3.03HSBC Holdings plc 4.25% 14/03/2024 USD 710,000 783,537 0.88Natwest Group plc 5.125% 28/05/2024 USD 2,730,000 3,080,333 3.43Standard Chartered plc, 144A 5.2% 26/01/2024 USD 246,000 272,519 0.30Wells Fargo & Co. 4.48% 16/01/2024 USD 200,000 222,562 0.25a 18,364,623 20.52IndustrialsBoeing Co. (The) 2.8% 01/03/2024 USD 2,926,000 3,071,923 3.43General Electric Co. 3.45% 15/05/2024 USD 500,000 544,622 0.61Southwest Airlines Co. 4.75% 04/05/2023 USD 2,462,000 2,676,644 2.99a 6,293,189 7.03MaterialsArcelorMittal SA 3.6% 16/07/2024 USD 2,155,000 2,325,730 2.60Mosaic Co. (The) 4.25% 15/11/2023 USD 2,110,000 2,303,977 2.58a 4,629,707 5.18Real EstateOmega Healthcare Investors, Inc., REIT 4.95% 01/04/2024 USD 2,789,000 3,038,091 3.40Ventas Realty LP, REIT 3.125% 15/06/2023 USD 2,895,000 3,059,595 3.42Welltower, Inc., REIT 3.625% 15/03/2024 USD 2,750,000 2,997,393 3.35a 9,095,079 10.17

48Schroder Special Situations Fund Audited Annual Report
31 December 2020
The accompanying notes form an integral part of these financial statements.
Schedule of Investments as at 31 December 2020 Schroder SSF Fixed Maturity Bond V*
Portfolio of Investments (continued) a
Investments CurrencyQuantity/
Nominal Value
Market Value
USD
% of Net
Assets
UtilitiesEdison International 2.95% 15/03/2023 USD 1,770,000 1,840,133 2.06a 1,840,133 2.06
Total Bonds 60,438,224 67.56Total Transferable securities and money market instruments admitted to an official exchange listing 60,438,224 67.56Transferable securities and money market instruments dealt in on another regulated marketBondsCommunication ServicesKenbourne Invest SA, Reg. S 6.875% 26/11/2024 USD 1,615,000 1,757,120 1.97Vodafone Group plc, FRN 1.22% 16/01/2024 USD 100,000 101,375 0.11a 1,858,495 2.08Consumer DiscretionaryDaimler Finance North America LLC, 144A 3.65% 22/02/2024 USD 195,000 212,563 0.24Hyundai Capital America, 144A 2.375% 10/02/2023 USD 2,500,000 2,579,059 2.88Royal Caribbean Cruises Ltd., 144A 10.875% 01/06/2023 USD 424,000 483,256 0.54Wynn Las Vegas LLC, 144A 4.25% 30/05/2023 USD 1,745,000 1,773,662 1.98a 5,048,540 5.64EnergyEni SpA, 144A 4% 12/09/2023 USD 210,000 228,772 0.26Plains All American Pipeline LP 3.85% 15/10/2023 USD 2,475,000 2,648,715 2.96a 2,877,487 3.22
Investments CurrencyQuantity/
Nominal Value
Market Value
USD
% of Net
Assets
FinancialsAIB Group plc, Reg. S 4.75% 12/10/2023 USD 2,570,000 2,833,074 3.17Intesa Sanpaolo SpA, 144A 3.25% 23/09/2024 USD 455,000 486,221 0.54Park Aerospace Holdings Ltd., 144A 4.5% 15/03/2023 USD 1,344,000 1,409,004 1.57State of Illinois 5% 01/01/2023 USD 1,000,000 1,036,276 1.16a 5,764,575 6.44IndustrialsAircastle Ltd. 4.4% 25/09/2023 USD 1,395,000 1,478,866 1.65JSL Europe SA, Reg. S 7.75% 26/07/2024 USD 1,645,000 1,735,491 1.94a 3,214,357 3.59Information TechnologyMicrochip Technology, Inc., 144A 2.67% 01/09/2023 USD 1,273,000 1,332,150 1.49a 1,332,150 1.49MaterialsBraskem Finance Ltd. 6.45% 03/02/2024 USD 1,554,000 1,703,572 1.90CSN Resources SA, Reg. S 7.625% 13/02/2023 USD 1,550,000 1,610,466 1.80Glencore Funding LLC, 144A 4.125% 12/03/2024 USD 1,485,000 1,635,148 1.83a 4,949,186 5.53Real EstateVornado Realty LP, REIT 3.5% 15/01/2025 USD 2,230,000 2,358,637 2.64a 2,358,637 2.64
Total Bonds 27,403,427 30.63Total Transferable securities and money market instruments dealt in on another regulated market 27,403,427 30.63Total Investments 87,841,651 98.19Cash 1,336,685 1.49Other assets/(liabilities) 283,202 0.32Total Net Assets 89,461,538 100.00

49Schroder Special Situations Fund Audited Annual Report
31 December 2020
The accompanying notes form an integral part of these financial statements.
Schedule of Investments as at 31 December 2020 Schroder SSF Fixed Maturity Bond V*
Forward Currency Exchange Contracts
Currency Purchased
Amount Purchased
Currency Sold
Amount Sold
Maturity Date Counterparty
Unrealised Gain/(Loss)
USD% of Net
Assets
Share Class HedgingEUR 3,399,669 USD 4,166,005 29/01/2021 HSBC 12,939 0.01GBP 21,476 USD 29,196 29/01/2021 HSBC 127 –SGD 10,730 USD 8,097 29/01/2021 HSBC 26 –Unrealised Gain on NAV Hedged Share Classes Forward Currency Exchange Contracts - Assets 13,092 0.01Total Unrealised Gain on Forward Currency Exchange Contracts - Assets 13,092 0.01Share Class HedgingUSD 1,677 EUR 1,375 29/01/2021 HSBC (14 ) –Unrealised Loss on NAV Hedged Share Classes Forward Currency Exchange Contracts - Liabilities (14 ) –Total Unrealised Loss on Forward Currency Exchange Contracts - Liabilities (14 ) –Net Unrealised Gain on Forward Currency Exchange Contracts - Assets 13,078 0.01
* Please refer to the Directors’ Report for details of all corporate actions that occurred during the year under review.

50
Schedule of Investments as at 31 December 2020Schroder SSF Fixed Maturity Bond VI*
Schroder Special Situations Fund Audited Annual Report
31 December 2020
The accompanying notes form an integral part of these financial statements.
Portfolio of Investments a
Investments CurrencyQuantity/
Nominal Value
Market Value
USD
% of Net
Assets
Transferable securities and money market instruments admitted to an official exchange listingBondsCommunication ServicesEmpresa Nacional de Telecomu-nicaciones SA, Reg. S 4.875% 30/10/2024 USD 3,250,000 3,513,658 1.84a 3,513,658 1.84Consumer DiscretionaryGeneral Motors Co. 4.875% 02/10/2023 USD 3,370,000 3,741,751 1.97Golden Eagle Retail Group Ltd., Reg. S 4.625% 21/05/2023 USD 1,840,000 1,886,920 0.99a 5,628,671 2.96Consumer StaplesAltria Group, Inc. 4% 31/01/2024 USD 3,340,000 3,669,312 1.92MARB BondCo plc, Reg. S 7% 15/03/2024 USD 1,700,000 1,744,642 0.92a 5,413,954 2.84EnergyEcopetrol SA 5.875% 18/09/2023 USD 8,230,000 9,199,164 4.83Enable Midstream Partners LP 3.9% 15/05/2024 USD 1,850,000 1,887,389 0.99Indian Oil Corp. Ltd., Reg. S 4.75% 16/01/2024 USD 3,390,000 3,673,913 1.93Indika Energy Capital III Pte. Ltd., Reg. S 5.875% 09/11/2024 USD 1,730,000 1,781,900 0.94Kinder Morgan Energy Partners LP 4.15% 01/02/2024 USD 2,440,000 2,666,402 1.40Mongolian Mining Corp., Reg. S 9.25% 15/04/2024 USD 2,080,000 1,902,872 1.00ONGC Videsh Ltd., Reg. S 3.75% 07/05/2023 USD 3,510,000 3,678,103 1.93Saudi Arabian Oil Co., Reg. S 1.25% 24/11/2023 USD 265,000 268,501 0.14a 25,058,244 13.16FinancialsAHB Sukuk Co. Ltd., Reg. S 4.375% 19/09/2023 USD 4,210,000 4,583,386 2.41
Investments CurrencyQuantity/
Nominal Value
Market Value
USD
% of Net
Assets
Bahamas Government Bond, Reg. S 5.75% 16/01/2024 USD 4,200,000 4,179,042 2.19Bancolombia SA 3% 29/01/2025 USD 400,000 416,380 0.22Bank of Ireland Group plc, Reg. S 4.5% 25/11/2023 USD 2,190,000 2,402,049 1.26Citigroup, Inc. 3.875% 25/10/2023 USD 2,500,000 2,751,592 1.44GTLK Europe DAC, Reg. S 5.125% 31/05/2024 USD 5,200,000 5,525,000 2.90Mexarrend SAPI de CV, Reg. S 10.25% 24/07/2024 USD 1,770,000 1,615,143 0.85Oman Government Bond, Reg. S 4.125% 17/01/2023 USD 1,750,000 1,768,375 0.93Qatar Government Bond, Reg. S 3.875% 23/04/2023 USD 930,000 1,000,743 0.53Russian Foreign Bond - Eurobond, Reg. S 4.875% 16/09/2023 USD 3,400,000 3,741,771 1.96Societe Generale SA, Reg. S 5% 17/01/2024 USD 3,250,000 3,589,937 1.89Standard Chartered plc, Reg. S 5.2% 26/01/2024 USD 3,250,000 3,600,359 1.89Ukraine Government Bond, Reg. S 8.994% 01/02/2024 USD 4,800,000 5,445,168 2.86Unifin Financiera SAB de CV, Reg. S 7% 15/01/2025 USD 1,830,000 1,746,525 0.92
USD 8,190,000 9,120,606 4.79Wells Fargo & Co. 4.48% 16/01/2024 USD 2,500,000 2,782,019 1.46a 54,268,095 28.50IndustrialsEmpresa de Transporte de Pasajeros Metro SA, Reg. S 4.75% 04/02/2024 USD 8,360,000 9,205,011 4.83a 9,205,011 4.83
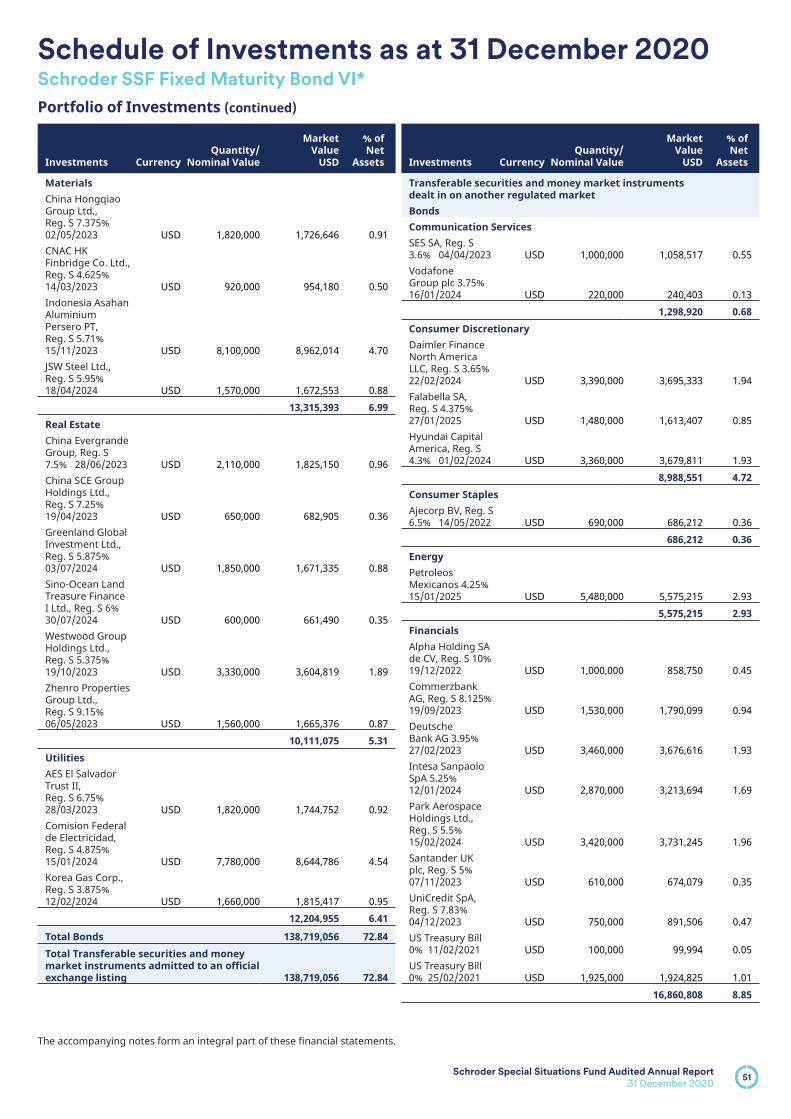
51Schroder Special Situations Fund Audited Annual Report
31 December 2020
The accompanying notes form an integral part of these financial statements.
Schedule of Investments as at 31 December 2020 Schroder SSF Fixed Maturity Bond VI*
Portfolio of Investments (continued) a
Investments CurrencyQuantity/
Nominal Value
Market Value
USD
% of Net
Assets
MaterialsChina Hongqiao Group Ltd., Reg. S 7.375% 02/05/2023 USD 1,820,000 1,726,646 0.91CNAC HK Finbridge Co. Ltd., Reg. S 4.625% 14/03/2023 USD 920,000 954,180 0.50Indonesia Asahan Aluminium Persero PT, Reg. S 5.71% 15/11/2023 USD 8,100,000 8,962,014 4.70JSW Steel Ltd., Reg. S 5.95% 18/04/2024 USD 1,570,000 1,672,553 0.88a 13,315,393 6.99Real EstateChina Evergrande Group, Reg. S 7.5% 28/06/2023 USD 2,110,000 1,825,150 0.96China SCE Group Holdings Ltd., Reg. S 7.25% 19/04/2023 USD 650,000 682,905 0.36Greenland Global Investment Ltd., Reg. S 5.875% 03/07/2024 USD 1,850,000 1,671,335 0.88Sino-Ocean Land Treasure Finance I Ltd., Reg. S 6% 30/07/2024 USD 600,000 661,490 0.35Westwood Group Holdings Ltd., Reg. S 5.375% 19/10/2023 USD 3,330,000 3,604,819 1.89Zhenro Properties Group Ltd., Reg. S 9.15% 06/05/2023 USD 1,560,000 1,665,376 0.87a 10,111,075 5.31UtilitiesAES El Salvador Trust II, Reg. S 6.75% 28/03/2023 USD 1,820,000 1,744,752 0.92Comision Federal de Electricidad, Reg. S 4.875% 15/01/2024 USD 7,780,000 8,644,786 4.54Korea Gas Corp., Reg. S 3.875% 12/02/2024 USD 1,660,000 1,815,417 0.95a 12,204,955 6.41
Total Bonds 138,719,056 72.84Total Transferable securities and money market instruments admitted to an official exchange listing 138,719,056 72.84
Investments CurrencyQuantity/
Nominal Value
Market Value
USD
% of Net
Assets
Transferable securities and money market instruments dealt in on another regulated marketBondsCommunication ServicesSES SA, Reg. S 3.6% 04/04/2023 USD 1,000,000 1,058,517 0.55Vodafone Group plc 3.75% 16/01/2024 USD 220,000 240,403 0.13a 1,298,920 0.68Consumer DiscretionaryDaimler Finance North America LLC, Reg. S 3.65% 22/02/2024 USD 3,390,000 3,695,333 1.94Falabella SA, Reg. S 4.375% 27/01/2025 USD 1,480,000 1,613,407 0.85Hyundai Capital America, Reg. S 4.3% 01/02/2024 USD 3,360,000 3,679,811 1.93a 8,988,551 4.72Consumer StaplesAjecorp BV, Reg. S 6.5% 14/05/2022 USD 690,000 686,212 0.36a 686,212 0.36EnergyPetroleos Mexicanos 4.25% 15/01/2025 USD 5,480,000 5,575,215 2.93a 5,575,215 2.93FinancialsAlpha Holding SA de CV, Reg. S 10% 19/12/2022 USD 1,000,000 858,750 0.45Commerzbank AG, Reg. S 8.125% 19/09/2023 USD 1,530,000 1,790,099 0.94Deutsche Bank AG 3.95% 27/02/2023 USD 3,460,000 3,676,616 1.93Intesa Sanpaolo SpA 5.25% 12/01/2024 USD 2,870,000 3,213,694 1.69Park Aerospace Holdings Ltd., Reg. S 5.5% 15/02/2024 USD 3,420,000 3,731,245 1.96Santander UK plc, Reg. S 5% 07/11/2023 USD 610,000 674,079 0.35UniCredit SpA, Reg. S 7.83% 04/12/2023 USD 750,000 891,506 0.47US Treasury Bill 0% 11/02/2021 USD 100,000 99,994 0.05US Treasury Bill 0% 25/02/2021 USD 1,925,000 1,924,825 1.01a 16,860,808 8.85
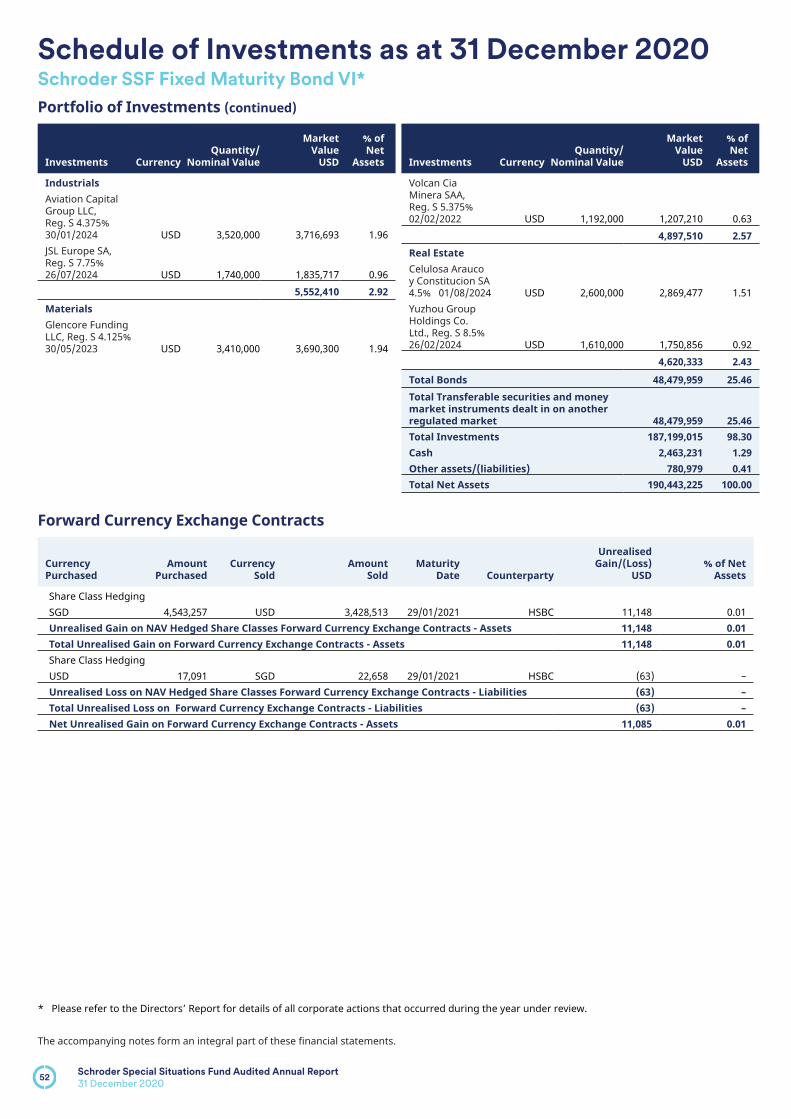
52Schroder Special Situations Fund Audited Annual Report
31 December 2020
The accompanying notes form an integral part of these financial statements.
Schedule of Investments as at 31 December 2020 Schroder SSF Fixed Maturity Bond VI*
Portfolio of Investments (continued) a
Investments CurrencyQuantity/
Nominal Value
Market Value
USD
% of Net
Assets
IndustrialsAviation Capital Group LLC, Reg. S 4.375% 30/01/2024 USD 3,520,000 3,716,693 1.96JSL Europe SA, Reg. S 7.75% 26/07/2024 USD 1,740,000 1,835,717 0.96a 5,552,410 2.92MaterialsGlencore Funding LLC, Reg. S 4.125% 30/05/2023 USD 3,410,000 3,690,300 1.94
Investments CurrencyQuantity/
Nominal Value
Market Value
USD
% of Net
Assets
Volcan Cia Minera SAA, Reg. S 5.375% 02/02/2022 USD 1,192,000 1,207,210 0.63a 4,897,510 2.57Real EstateCelulosa Arauco y Constitucion SA 4.5% 01/08/2024 USD 2,600,000 2,869,477 1.51Yuzhou Group Holdings Co. Ltd., Reg. S 8.5% 26/02/2024 USD 1,610,000 1,750,856 0.92a 4,620,333 2.43
Total Bonds 48,479,959 25.46Total Transferable securities and money market instruments dealt in on another regulated market 48,479,959 25.46Total Investments 187,199,015 98.30Cash 2,463,231 1.29Other assets/(liabilities) 780,979 0.41Total Net Assets 190,443,225 100.00
Forward Currency Exchange Contracts
Currency Purchased
Amount Purchased
Currency Sold
Amount Sold
Maturity Date Counterparty
Unrealised Gain/(Loss)
USD% of Net
Assets
Share Class HedgingSGD 4,543,257 USD 3,428,513 29/01/2021 HSBC 11,148 0.01Unrealised Gain on NAV Hedged Share Classes Forward Currency Exchange Contracts - Assets 11,148 0.01Total Unrealised Gain on Forward Currency Exchange Contracts - Assets 11,148 0.01Share Class HedgingUSD 17,091 SGD 22,658 29/01/2021 HSBC (63 ) –Unrealised Loss on NAV Hedged Share Classes Forward Currency Exchange Contracts - Liabilities (63 ) –Total Unrealised Loss on Forward Currency Exchange Contracts - Liabilities (63 ) –Net Unrealised Gain on Forward Currency Exchange Contracts - Assets 11,085 0.01
* Please refer to the Directors’ Report for details of all corporate actions that occurred during the year under review.

53Schroder Special Situations Fund Audited Annual Report
31 December 2020
The accompanying notes form an integral part of these financial statements.
Schedule of Investments as at 31 December 2020Schroder SSF Fixed Maturity Bond 2022
Portfolio of Investments a
Investments CurrencyQuantity/
Nominal Value
Market Value
USD
% of Net
Assets
Transferable securities and money market instruments admitted to an official exchange listingBondsConsumer DiscretionaryMetalsa SA de CV, Reg. S 4.9% 24/04/2023 USD 1,120,000 1,175,894 1.18a 1,175,894 1.18EnergyGreenko Mauritius Ltd., Reg. S 6.25% 21/02/2023 USD 570,000 589,415 0.59Lukoil International Finance BV, Reg. S 6.656% 07/06/2022 USD 1,700,000 1,840,454 1.85NAK Naftogaz Ukraine, Reg. S 7.375% 19/07/2022 USD 1,880,000 1,944,841 1.95Pertamina Persero PT, Reg. S 4.875% 03/05/2022 USD 4,510,000 4,749,037 4.77Petroleos Mexicanos 5.375% 13/03/2022 USD 4,712,000 4,884,106 4.91ReNew Power Pvt Ltd., Reg. S 6.45% 27/09/2022 USD 250,000 260,500 0.26Rosneft Oil Co., Reg. S 4.199% 06/03/2022 USD 1,830,000 1,887,400 1.90Sinopec Group Overseas Development 2012 Ltd., Reg. S 3.9% 17/05/2022 USD 210,000 218,170 0.22a 16,373,923 16.45FinancialsBanco del Estado de Chile, Reg. S 3.875% 08/02/2022 USD 4,650,000 4,823,877 4.85Belarus Government Bond, Reg. S 6.875% 28/02/2023 USD 1,820,000 1,907,606 1.92Development Bank of Kazakhstan JSC, Reg. S 4.125% 10/12/2022 USD 4,085,000 4,301,505 4.32Gazprom PJSC, Reg. S 4.95% 19/07/2022 USD 4,560,000 4,815,159 4.84Huarong Finance 2017 Co. Ltd., Reg. S 3.75% 27/04/2022 USD 2,790,000 2,860,486 2.87
Investments CurrencyQuantity/
Nominal Value
Market Value
USD
% of Net
Assets
Hyundai Capital Services, Inc., Reg. S 3% 06/03/2022 USD 250,000 256,852 0.26Indonesia Government Bond, Reg. S 3.75% 25/04/2022 USD 210,000 218,901 0.22Namibia Government Bond, Reg. S 5.5% 03/11/2021 USD 1,930,000 1,981,390 1.99Oman Government Bond, Reg. S 3.875% 08/03/2022 USD 2,748,000 2,771,754 2.78Petronas Capital Ltd., Reg. S 7.875% 22/05/2022 USD 950,000 1,046,773 1.05Qatar Government Bond, Reg. S 4.5% 20/01/2022 USD 3,020,000 3,152,663 3.17Rongshi International Finance Ltd., Reg. S 2.875% 04/05/2022 USD 210,000 214,751 0.22
USD 4,430,000 4,741,606 4.76a 33,093,323 33.25IndustrialseHi Car Services Ltd., Reg. S 5.875% 14/08/2022 USD 1,020,000 928,187 0.93Georgian Railway JSC, Reg. S 7.75% 11/07/2022 USD 2,690,000 2,847,365 2.86Pelabuhan Indonesia III Persero PT, Reg. S 4.5% 02/05/2023 USD 4,000,000 4,266,260 4.29Russian Railways, Reg. S 5.7% 05/04/2022 USD 4,555,000 4,825,567 4.85Transnet SOC Ltd., Reg. S 4% 26/07/2022 USD 2,800,000 2,840,152 2.85a 15,707,531 15.78MaterialsBukit Makmur Mandiri Utama PT, Reg. S 7.75% 13/02/2022 USD 970,000 961,508 0.97China Hongqiao Group Ltd., Reg. S 7.375% 02/05/2023 USD 950,000 901,271 0.91CNAC HK Finbridge Co. Ltd., Reg. S 3.5% 19/07/2022 USD 4,670,000 4,716,282 4.73

54Schroder Special Situations Fund Audited Annual Report
31 December 2020
The accompanying notes form an integral part of these financial statements.
Schedule of Investments as at 31 December 2020 Schroder SSF Fixed Maturity Bond 2022
Portfolio of Investments (continued) a
Investments CurrencyQuantity/
Nominal Value
Market Value
USD
% of Net
Assets
Indonesia Asahan Aluminium Persero PT, Reg. S 5.23% 15/11/2021 USD 2,490,000 2,587,091 2.60Severstal OAO, Reg. S 3.85% 27/08/2021 USD 860,000 876,495 0.88a 10,042,647 10.09Real EstateCentral China Real Estate Ltd., Reg. S 6.875% 08/08/2022 USD 850,000 869,136 0.87China Aoyuan Group Ltd., Reg. S 7.95% 19/02/2023 USD 820,000 871,727 0.88China Evergrande Group, Reg. S 11.5% 22/01/2023 USD 890,000 849,980 0.85CIFI Holdings Group Co. Ltd., Reg. S 5.5% 23/01/2023 USD 820,000 843,809 0.85Country Garden Holdings Co. Ltd., Reg. S 4.75% 25/07/2022 USD 1,860,000 1,904,617 1.90Shimao Group Holdings Ltd., Reg. S 4.75% 03/07/2022 USD 1,700,000 1,741,650 1.75Sunac China Holdings Ltd., Reg. S 6.5% 09/07/2023 USD 609,000 632,181 0.64Yuzhou Group Holdings Co. Ltd., Reg. S 6% 25/01/2022 USD 760,000 773,293 0.78a 8,486,393 8.52UtilitiesComision Federal de Electricidad, Reg. S 4.875% 26/05/2021 USD 1,934,000 1,969,169 1.97State Grid Overseas Investment 2016 Ltd., Reg. S 2.75% 04/05/2022 USD 210,000 215,292 0.22a 2,184,461 2.19
Total Bonds 87,064,172 87.46Total Transferable securities and money market instruments admitted to an official exchange listing 87,064,172 87.46
Investments CurrencyQuantity/
Nominal Value
Market Value
USD
% of Net
Assets
Transferable securities and money market instruments dealt in on another regulated marketBondsConsumer DiscretionaryHyundai Capital America, Reg. S 3.1% 05/04/2022 USD 480,000 493,721 0.50a 493,721 0.50FinancialsAlpha Holding SA de CV, 144A 10% 19/12/2022 USD 1,000,000 851,406 0.86Banco Davivienda SA, Reg. S 5.875% 09/07/2022 USD 910,000 965,487 0.97Grupo Aval Ltd., Reg. S 4.75% 26/09/2022 USD 1,000,000 1,048,860 1.05Romania Government Bond, Reg. S 6.75% 07/02/2022 USD 3,020,000 3,224,315 3.24US Treasury Bill 0% 25/02/2021 USD 650,000 649,941 0.65a 6,740,009 6.77IndustrialsAtento Luxco 1 SA, Reg. S 6.125% 10/08/2022 USD 590,000 583,363 0.59Embraer SA 5.15% 15/06/2022 USD 860,000 884,187 0.88a 1,467,550 1.47MaterialsAlpek SAB de CV, Reg. S 5.375% 08/08/2023 USD 520,000 571,971 0.57Volcan Cia Minera SAA, Reg. S 5.375% 02/02/2022 USD 923,000 934,778 0.94a 1,506,749 1.51
Total Bonds 10,208,029 10.25Total Transferable securities and money market instruments dealt in on another regulated market 10,208,029 10.25Total Investments 97,272,201 97.71Cash 1,707,229 1.71Other assets/(liabilities) 570,289 0.58Total Net Assets 99,549,719 100.00
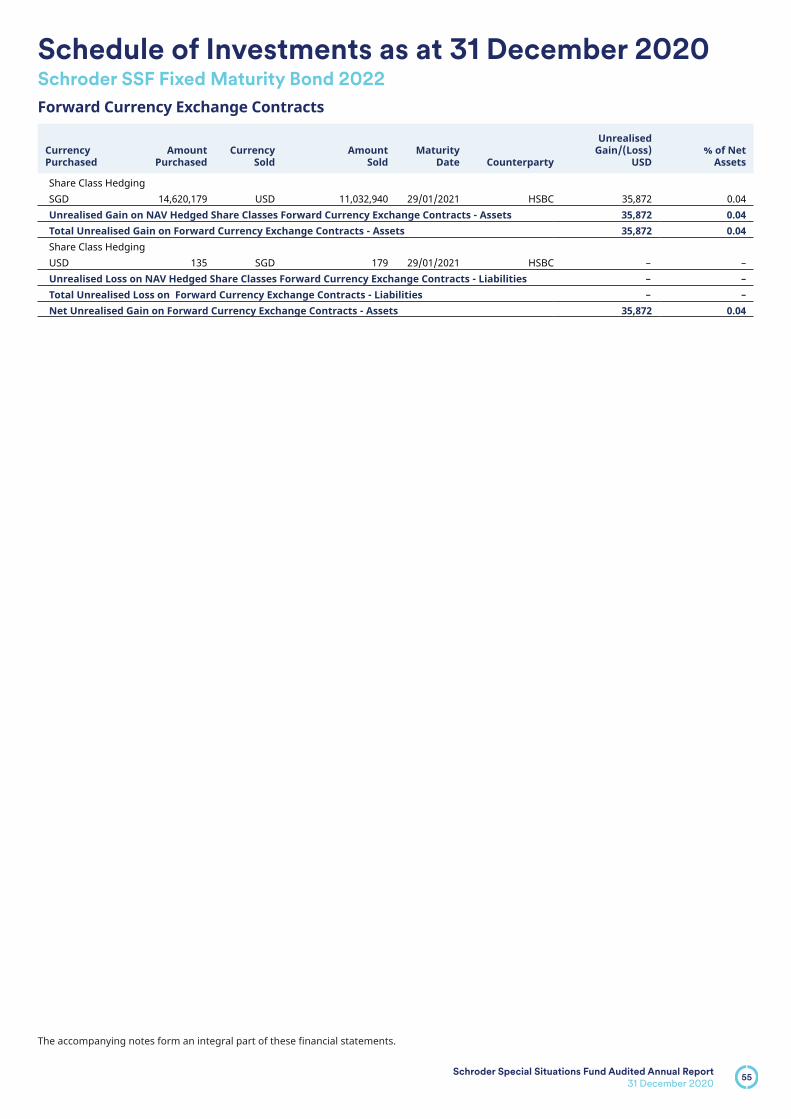
55Schroder Special Situations Fund Audited Annual Report
31 December 2020
The accompanying notes form an integral part of these financial statements.
Schedule of Investments as at 31 December 2020 Schroder SSF Fixed Maturity Bond 2022
Forward Currency Exchange Contracts
Currency Purchased
Amount Purchased
Currency Sold
Amount Sold
Maturity Date Counterparty
Unrealised Gain/(Loss)
USD% of Net
Assets
Share Class HedgingSGD 14,620,179 USD 11,032,940 29/01/2021 HSBC 35,872 0.04Unrealised Gain on NAV Hedged Share Classes Forward Currency Exchange Contracts - Assets 35,872 0.04Total Unrealised Gain on Forward Currency Exchange Contracts - Assets 35,872 0.04Share Class HedgingUSD 135 SGD 179 29/01/2021 HSBC – –Unrealised Loss on NAV Hedged Share Classes Forward Currency Exchange Contracts - Liabilities – –Total Unrealised Loss on Forward Currency Exchange Contracts - Liabilities – –Net Unrealised Gain on Forward Currency Exchange Contracts - Assets 35,872 0.04

56
Schedule of Investments as at 31 December 2020Schroder SSF International Equity
Schroder Special Situations Fund Audited Annual Report
31 December 2020
The accompanying notes form an integral part of these financial statements.
Portfolio of Investments a
Investments CurrencyQuantity/
Nominal Value
Market Value
USD
% of Net
Assets
Transferable securities and money market instruments admitted to an official exchange listingEquitiesCommunication ServicesActivision Blizzard, Inc. USD 3,250 297,239 1.04Alphabet, Inc. 'A' USD 703 1,219,924 4.26Comcast Corp. 'A' USD 14,175 726,175 2.54Facebook, Inc. 'A' USD 3,633 986,362 3.44Sea Ltd., ADR USD 1,875 368,701 1.29Tencent Holdings Ltd. HKD 3,800 276,351 0.96a 3,874,752 13.53Consumer Discretionaryadidas AG EUR 1,389 508,328 1.77Alibaba Group Holding Ltd., ADR USD 1,022 243,746 0.85Amazon.com, Inc. USD 346 1,135,169 3.97AutoZone, Inc. USD 231 271,507 0.95Bayerische Motoren Werke AG EUR 5,207 462,037 1.61Booking Holdings, Inc. USD 296 653,199 2.28Dollar General Corp. USD 941 197,430 0.69Lowe's Cos., Inc. USD 3,475 557,830 1.95Next plc GBP 4,888 472,811 1.65NVR, Inc. USD 66 272,290 0.95Peugeot SA EUR 7,177 197,233 0.69a 4,971,580 17.36Consumer StaplesDiageo plc GBP 20,147 791,509 2.76Nestle SA CHF 3,385 401,178 1.40Philip Morris International, Inc. USD 6,875 560,081 1.96Procter & Gamble Co. (The) USD 5,072 697,986 2.44Swedish Match AB SEK 2,582 201,481 0.70a 2,652,235 9.26EnergyEquinor ASA NOK 32,425 551,721 1.93Royal Dutch Shell plc 'A' EUR 30,049 539,474 1.88a 1,091,195 3.81FinancialsAIA Group Ltd. HKD 43,600 534,079 1.86American Express Co. USD 4,082 488,504 1.71Erste Group Bank AG EUR 21,511 659,066 2.30First Republic Bank USD 2,208 320,092 1.12HDFC Bank Ltd., ADR USD 7,021 505,759 1.77
Investments CurrencyQuantity/
Nominal Value
Market Value
USD
% of Net
Assets
JPMorgan Chase & Co. USD 8,959 1,124,995 3.92a 3,632,495 12.68Health CareAnthem, Inc. USD 1,943 609,661 2.13Edwards Lifesciences Corp. USD 4,822 432,369 1.51Merck & Co., Inc. USD 4,158 335,040 1.17Roche Holding AG CHF 1,257 441,524 1.54Thermo Fisher Scientific, Inc. USD 803 370,391 1.29UnitedHealth Group, Inc. USD 2,118 730,066 2.55a 2,919,051 10.19IndustrialsAMETEK, Inc. USD 3,001 359,658 1.26Fortive Corp. USD 5,613 390,723 1.36Otis Worldwide Corp. USD 3,228 215,142 0.75Schneider Electric SE EUR 2,528 367,395 1.28Trane Technologies plc USD 2,424 351,020 1.23Union Pacific Corp. USD 2,386 491,731 1.72Vertiv Holdings Co. USD 23,461 436,418 1.52Vestas Wind Systems A/S DKK 1,872 444,891 1.55a 3,056,978 10.67Information TechnologyAdobe, Inc. USD 1,397 694,261 2.42Cadence Design Systems, Inc. USD 2,497 337,382 1.18Infineon Technologies AG EUR 16,232 625,943 2.19Intuit, Inc. USD 930 348,935 1.22Microsoft Corp. USD 5,670 1,255,777 4.39Samsung Electronics Co. Ltd. KRW 9,827 729,973 2.55Texas Instruments, Inc. USD 4,048 658,631 2.30Visa, Inc. 'A' USD 4,819 1,052,618 3.67a 5,703,520 19.92Real EstateDeutsche Wohnen SE EUR 7,483 401,633 1.40a 401,633 1.40
Total Equities 28,303,439 98.82Total Transferable securities and money market instruments admitted to an official exchange listing 28,303,439 98.82Total Investments 28,303,439 98.82Cash 363,723 1.27

57Schroder Special Situations Fund Audited Annual Report
31 December 2020
The accompanying notes form an integral part of these financial statements.
Schedule of Investments as at 31 December 2020 Schroder SSF International Equity
Portfolio of Investments (continued) a
Investments CurrencyQuantity/
Nominal Value
Market Value
USD
% of Net
Assets
Other assets/(liabilities) (24,445) (0.09)Total Net Assets 28,642,717 100.00

58
Schedule of Investments as at 31 December 2020Schroder SSF Managed Wealth Portfolio
Schroder Special Situations Fund Audited Annual Report
31 December 2020
The accompanying notes form an integral part of these financial statements.
Portfolio of Investments a
Investments CurrencyQuantity/
Nominal Value
Market Value
GBP
% of Net
Assets
Transferable securities and money market instruments admitted to an official exchange listingBondsFinancialsUK Treasury Inflation Linked, Reg. S 1.25% 22/10/2041 GBP 2,270,567 2,521,733 3.08a 2,521,733 3.08
Total Bonds 2,521,733 3.08EquitiesFinancialsDraper Esprit plc GBP 187,000 1,234,200 1.51PCGH ZDP plc, Reg. S Preference GBP 1,485,050 1,618,704 1.98a 2,852,904 3.49
Total Equities 2,852,904 3.49Total Transferable securities and money market instruments admitted to an official exchange listing 5,374,637 6.57Transferable securities and money market instruments dealt in on another regulated marketBondsFinancialsHSBC Bank plc 0% 23/10/2024 GBP 850,000 893,605 1.09HSBC Bank plc 0% 27/05/2025 GBP 1,000,000 1,003,200 1.23a 1,896,805 2.32
Total Bonds 1,896,805 2.32Total Transferable securities and money market instruments dealt in on another regulated market 1,896,805 2.32Units of authorised UCITS or other collective investment undertakingsCollective Investment Schemes - AIFFinancialsAshoka India Equity Investment Trust plc Reg. S GBP 973,134 1,333,194 1.63HgCapital Trust plc GBP 542,207 1,653,731 2.02a 2,986,925 3.65Investment FundsNB Private Equity Partners Ltd. GBP 779,825 912,395 1.12NB Private Equity Partners Ltd. GBP 2,080,290 2,257,115 2.75Syncona Ltd. GBP 741,563 1,935,479 2.37a 5,104,989 6.24
Total Collective Investment Schemes - AIF 8,091,914 9.89Collective Investment Schemes - UCITSFinancialsInvesco Japanese Equity Advantage Fund - Class S Distribution USD 227,000 2,145,165 2.62
Investments CurrencyQuantity/
Nominal Value
Market Value
GBP
% of Net
Assets
Polar Capital Global Insurance Fund - Class E GBP Distribution Shares GBP 806,840 4,438,023 5.43a 6,583,188 8.05IndustrialsSchroder ISF Asian Total Return - Class S GBP Dist GBP 5,919 2,742,710 3.35a 2,742,710 3.35Investment FundsAberdeen Standard Listed Private Capital Fund - K SInc GBP GBP 151,909 2,064,990 2.52BlackRock Asian Dragon Fund - Class D4 GBP GBP 45,940 1,800,389 2.20BlackRock European Dynamic Fund - Class FD Accumulating GBP GBP 1,110,000 2,898,210 3.54Fidelity Asian Smaller Companies Fund - Y-ACC-GBP GBP 49,535 1,479,610 1.81Findlay Park American Fund - Class USD USD 87,300 10,093,025 12.32LF Tellworth UK Smaller Companies Fund - F Accumulation Shares'F' GBP 1,675,075 2,149,959 2.63Robeco BP Global Premium Equities - IB GBP GBP 15,206 1,726,033 2.11RWC Global Emerging Markets Fund - Class S GBP DIST GBP 26,343 3,125,492 3.82Schroder SSF Diversified Alternative Assets - Class S Dist'S' GBP 8,895 915,815 1.12Trojan Income Fund - X Income GBP 2,720,000 2,637,856 3.22TwentyFour Absolute Return Credit Fund - Class AQNG GBP GBP 38,110 3,940,574 4.82Virtus GF SGA Global Growth Fund - Class K Income GBP 23,160 2,644,409 3.23Wellington Global Health Care Equity Fund - GBP Class N Accumulating Unhedged GBP 130,000 2,616,549 3.20

59Schroder Special Situations Fund Audited Annual Report
31 December 2020
The accompanying notes form an integral part of these financial statements.
Schedule of Investments as at 31 December 2020 Schroder SSF Managed Wealth Portfolio
Portfolio of Investments (continued) a
Investments CurrencyQuantity/
Nominal Value
Market Value
GBP
% of Net
Assets
William Blair U.S. Small-Mid Cap Growth Fund - Class JW I (GBP) GBP 16,800 2,720,928 3.33a 40,813,839 49.87
Total Collective Investment Schemes - UCITS 50,139,737 61.27Exchange Traded FundsInvestment FundsiShares China CNY Bond UCITS ETF'D' USD 324,758 1,272,320 1.55iShares Physical Gold Fund USD 89,439 2,422,100 2.96Lyxor Core US TIPS DR Fund GBP 61,012 6,885,204 8.42WisdomTree Physical Gold - GBP Daily Hedged GBP 247,073 2,560,294 3.13a 13,139,918 16.06
Total Exchange Traded Funds 13,139,918 16.06Total Units of authorised UCITS or other collective investment undertakings 71,371,569 87.22Total Investments 78,643,011 96.11Cash 3,114,192 3.81Other assets/(liabilities) 69,432 0.08Total Net Assets 81,826,635 100.00

60
Schedule of Investments as at 31 December 2020Schroder SSF Multi-Asset Dynamic
Schroder Special Situations Fund Audited Annual Report
31 December 2020
The accompanying notes form an integral part of these financial statements.
Portfolio of Investments a
Investments CurrencyQuantity/
Nominal Value
Market Value
EUR
% of Net
Assets
Transferable securities and money market instruments admitted to an official exchange listingBondsFinancialsBundesrepublik Deutschland, Reg. S 4.75% 04/07/2034 EUR 2,245,000 3,897,785 2.80Italy Buoni Ordinari del Tesoro BOT, Reg. S 0% 12/02/2021 EUR 5,920,000 5,923,958 4.25Italy Buoni Ordinari del Tesoro BOT, Reg. S 0% 14/04/2021 EUR 6,780,000 6,791,277 4.87Italy Buoni Ordinari del Tesoro BOT, Reg. S 0% 14/05/2021 EUR 7,000,000 7,014,590 5.04Italy Buoni Ordinari del Tesoro BOT, Reg. S 0% 31/05/2021 EUR 7,000,000 7,016,107 5.03Mexican Bonos 8% 07/12/2023 MXN 50,356,500 2,268,494 1.63Spain Government Bond 0.35% 30/07/2023 EUR 2,867,000 2,934,736 2.11Spain Government Bond, Reg. S, 144A 0.5% 30/04/2030 EUR 3,354,000 3,518,547 2.53Spain Letras del Tesoro 0% 07/05/2021 EUR 7,000,000 7,014,739 5.03Spain Letras del Tesoro 0% 12/02/2021 EUR 2,820,000 2,822,140 2.03US Treasury Inflation Indexed 0.125% 15/07/2026 USD 6,545,400 6,393,532 4.59a 55,595,905 39.91
Total Bonds 55,595,905 39.91Total Transferable securities and money market instruments admitted to an official exchange listing 55,595,905 39.91Units of authorised UCITS or other collective investment undertakingsCollective Investment Schemes - UCITSFinancialsSchroder ISF Global Multi-Asset Balanced - Class I EUR Acc EUR 16,006 2,601,710 1.87a 2,601,710 1.87IndustrialsSchroder ISF Asian Total Return - Class I Acc USD 8,389 3,291,984 2.36
Investments CurrencyQuantity/
Nominal Value
Market Value
EUR
% of Net
Assets
Schroder ISF Emerging Europe - Class I Acc EUR 31,495 1,453,773 1.04Schroder ISF Emerging Market Bond - Class I USD Acc USD 20,001 2,341,908 1.68Schroder ISF Euro Corporate Bond - Class I Acc EUR 485,688 14,850,503 10.67Schroder ISF Euro Government Bond - Class I Acc EUR 513,443 7,837,038 5.63Schroder ISF Global Emerging Market Opportunities - Class I Acc'A' USD 64,412 1,580,427 1.13Schroder ISF Global Equity Alpha - Class I Acc USD 26,025 7,702,258 5.53Schroder ISF Global High Yield - Class I Acc USD 72,010 3,725,863 2.67a 42,783,754 30.71Investment FundsSchroder ISF China A - Class I Acc'I' USD 10,856 1,712,703 1.23Schroder ISF China Local Currency Bond - Class I USD Acc USD 34,648 3,603,532 2.59Schroder ISF EURO Credit Absolute Return - Class I Acc EUR 65,689 7,923,460 5.68Schroder ISF Global Disruption - Class I Acc'I' USD 18,468 2,998,143 2.15Schroder ISF Global Energy Transition - Class I Acc'I' USD 9,287 1,667,020 1.20Schroder ISF Securitised Credit - Class I Acc'I' USD 86,520 7,637,262 5.48a 25,542,120 18.33
Total Collective Investment Schemes - UCITS 70,927,584 50.91Exchange Traded FundsInvestment FundsiShares J.P. Morgan EM Local Government Bond Fund GBP 45,819 2,261,785 1.62a 2,261,785 1.62
Total Exchange Traded Funds 2,261,785 1.62Total Units of authorised UCITS or other collective investment undertakings 73,189,369 52.53
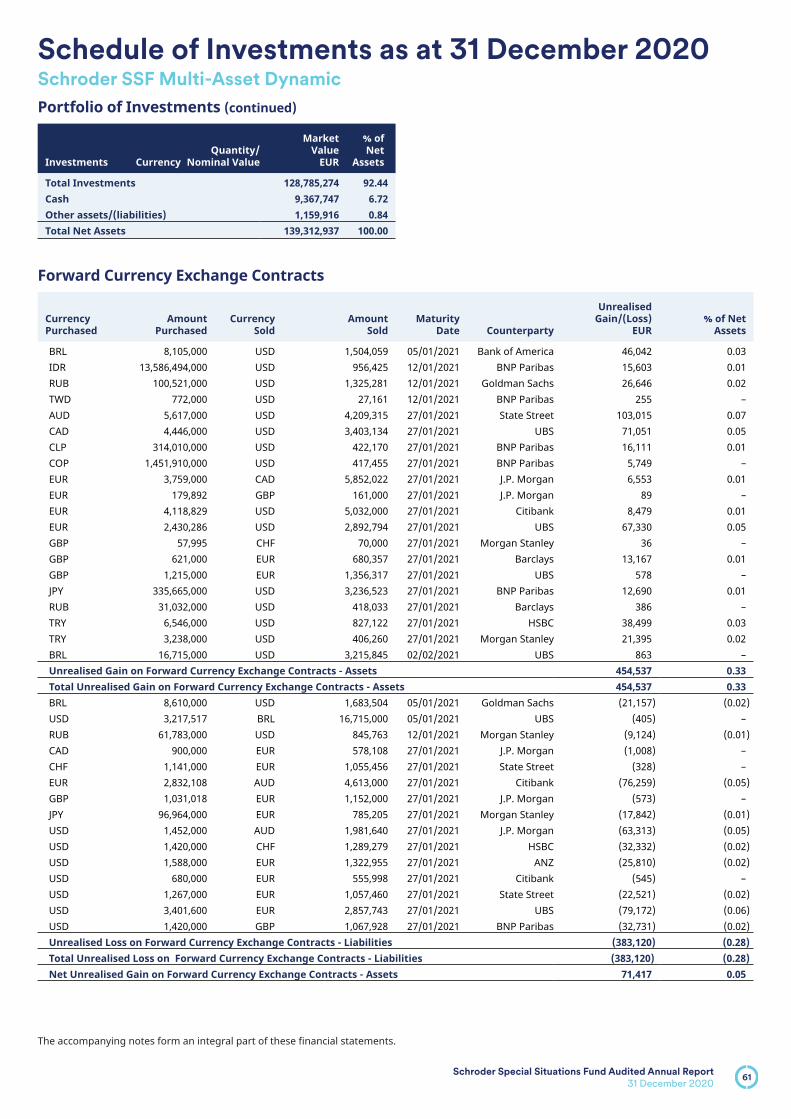
61Schroder Special Situations Fund Audited Annual Report
31 December 2020
The accompanying notes form an integral part of these financial statements.
Schedule of Investments as at 31 December 2020 Schroder SSF Multi-Asset Dynamic
Portfolio of Investments (continued) a
Investments CurrencyQuantity/
Nominal Value
Market Value
EUR
% of Net
Assets
Total Investments 128,785,274 92.44Cash 9,367,747 6.72Other assets/(liabilities) 1,159,916 0.84Total Net Assets 139,312,937 100.00
Forward Currency Exchange Contracts
Currency Purchased
Amount Purchased
Currency Sold
Amount Sold
Maturity Date Counterparty
Unrealised Gain/(Loss)
EUR% of Net
Assets
BRL 8,105,000 USD 1,504,059 05/01/2021 Bank of America 46,042 0.03IDR 13,586,494,000 USD 956,425 12/01/2021 BNP Paribas 15,603 0.01RUB 100,521,000 USD 1,325,281 12/01/2021 Goldman Sachs 26,646 0.02TWD 772,000 USD 27,161 12/01/2021 BNP Paribas 255 –AUD 5,617,000 USD 4,209,315 27/01/2021 State Street 103,015 0.07CAD 4,446,000 USD 3,403,134 27/01/2021 UBS 71,051 0.05CLP 314,010,000 USD 422,170 27/01/2021 BNP Paribas 16,111 0.01COP 1,451,910,000 USD 417,455 27/01/2021 BNP Paribas 5,749 –EUR 3,759,000 CAD 5,852,022 27/01/2021 J.P. Morgan 6,553 0.01EUR 179,892 GBP 161,000 27/01/2021 J.P. Morgan 89 –EUR 4,118,829 USD 5,032,000 27/01/2021 Citibank 8,479 0.01EUR 2,430,286 USD 2,892,794 27/01/2021 UBS 67,330 0.05GBP 57,995 CHF 70,000 27/01/2021 Morgan Stanley 36 –GBP 621,000 EUR 680,357 27/01/2021 Barclays 13,167 0.01GBP 1,215,000 EUR 1,356,317 27/01/2021 UBS 578 –JPY 335,665,000 USD 3,236,523 27/01/2021 BNP Paribas 12,690 0.01RUB 31,032,000 USD 418,033 27/01/2021 Barclays 386 –TRY 6,546,000 USD 827,122 27/01/2021 HSBC 38,499 0.03TRY 3,238,000 USD 406,260 27/01/2021 Morgan Stanley 21,395 0.02BRL 16,715,000 USD 3,215,845 02/02/2021 UBS 863 –Unrealised Gain on Forward Currency Exchange Contracts - Assets 454,537 0.33Total Unrealised Gain on Forward Currency Exchange Contracts - Assets 454,537 0.33BRL 8,610,000 USD 1,683,504 05/01/2021 Goldman Sachs (21,157) (0.02)USD 3,217,517 BRL 16,715,000 05/01/2021 UBS (405) –RUB 61,783,000 USD 845,763 12/01/2021 Morgan Stanley (9,124) (0.01)CAD 900,000 EUR 578,108 27/01/2021 J.P. Morgan (1,008) –CHF 1,141,000 EUR 1,055,456 27/01/2021 State Street (328) –EUR 2,832,108 AUD 4,613,000 27/01/2021 Citibank (76,259) (0.05)GBP 1,031,018 EUR 1,152,000 27/01/2021 J.P. Morgan (573) –JPY 96,964,000 EUR 785,205 27/01/2021 Morgan Stanley (17,842) (0.01)USD 1,452,000 AUD 1,981,640 27/01/2021 J.P. Morgan (63,313) (0.05)USD 1,420,000 CHF 1,289,279 27/01/2021 HSBC (32,332) (0.02)USD 1,588,000 EUR 1,322,955 27/01/2021 ANZ (25,810) (0.02)USD 680,000 EUR 555,998 27/01/2021 Citibank (545) –USD 1,267,000 EUR 1,057,460 27/01/2021 State Street (22,521) (0.02)USD 3,401,600 EUR 2,857,743 27/01/2021 UBS (79,172) (0.06)USD 1,420,000 GBP 1,067,928 27/01/2021 BNP Paribas (32,731) (0.02)Unrealised Loss on Forward Currency Exchange Contracts - Liabilities (383,120) (0.28)Total Unrealised Loss on Forward Currency Exchange Contracts - Liabilities (383,120) (0.28)Net Unrealised Gain on Forward Currency Exchange Contracts - Assets 71,417 0.05

62Schroder Special Situations Fund Audited Annual Report
31 December 2020
The accompanying notes form an integral part of these financial statements.
Schedule of Investments as at 31 December 2020 Schroder SSF Multi-Asset Dynamic
Financial Futures Contracts
Security DescriptionNumber of
Contracts Currency
Unrealised Gain/(Loss)
EUR% of Net
Assets
DAX Index, 19/03/2021 8 EUR 107,200 0.08E-mini Industrial Select Sector Index, 19/03/2021 45 USD 12,872 0.01EURO STOXX 50 Index, 19/03/2021 243 EUR 118,766 0.08FTSE/MIB Index, 19/03/2021 14 EUR 24,080 0.02MSCI China Free Index, 19/03/2021 90 USD 157,632 0.11MSCI Emerging Markets Index, 19/03/2021 17 USD 27,651 0.02NASDAQ 100 Emini Index, 19/03/2021 20 USD 158,392 0.11Russell 2000 Emini Index, 19/03/2021 35 USD 78,618 0.06S&P 500 Emini Index, 19/03/2021 143 USD 514,241 0.37TOPIX Index, 11/03/2021 10 JPY 11,478 0.01US 10 Year Note, 22/03/2021 24 USD 3,067 –US Ultra Bond, 22/03/2021 (4) USD 3,932 –XAF Financial Index, 19/03/2021 10 USD 21,658 0.02Total Unrealised Gain on Financial Futures Contracts - Assets 1,239,587 0.89Euro-Bund, 08/03/2021 (23) EUR (11,410) (0.01)Euro-Buxl 30 Year Bond, 08/03/2021 (10) EUR (27,200) (0.02)FTSE 100 Index, 19/03/2021 19 GBP (19,741) (0.01)FTSE China A50 Index, 28/01/2021 (97) USD (66,672) (0.05)IBEX 35 Index, 15/01/2021 19 EUR (10,602) (0.01)Total Unrealised Loss on Financial Futures Contracts - Liabilities (135,625) (0.10)Net Unrealised Gain on Financial Futures Contracts - Assets 1,103,962 0.79

63Schroder Special Situations Fund Audited Annual Report
31 December 2020
The accompanying notes form an integral part of these financial statements.
Schedule of Investments as at 31 December 2020Schroder SSF Wealth Management USD Cautious*
Portfolio of Investments a
Investments CurrencyQuantity/
Nominal Value
Market Value
USD
% of Net
Assets
Transferable securities and money market instruments admitted to an official exchange listingBondsCommunication ServicesWalt Disney Co. (The) 2% 01/09/2029 USD 100,000 104,408 1.43Weibo Corp. 3.5% 05/07/2024 USD 200,000 209,885 2.89a 314,293 4.32Consumer DiscretionaryLi & Fung Ltd., Reg. S 4.5% 18/08/2025 USD 200,000 204,588 2.81a 204,588 2.81EnergyContemporary Ruiding Development Ltd., Reg. S 1.875% 17/09/2025 USD 200,000 202,103 2.77a 202,103 2.77FinancialsBank of America Corp. 3.875% 01/08/2025 USD 90,000 102,634 1.41Banque Ouest Africaine de Developpement, Reg. S 5.5% 06/05/2021 USD 200,000 203,408 2.79CCBL Cayman 1 Corp. Ltd., Reg. S 1.99% 21/07/2025 USD 200,000 202,180 2.78Huarong Finance 2019 Co. Ltd., Reg. S 3.75% 29/05/2024 USD 200,000 210,532 2.89Postal Savings Bank of China Co. Ltd., Reg. S, FRN 4.5% Perpetual USD 200,000 206,281 2.83Shanghai Commercial Bank Ltd., Reg. S, FRN 5% 17/01/2029 USD 250,000 267,976 3.67a 1,193,011 16.37IndustrialsBOC Aviation Ltd., Reg. S 3.25% 29/04/2025 USD 200,000 212,032 2.91a 212,032 2.91Information TechnologyPayPal Holdings, Inc. 2.85% 01/10/2029 USD 100,000 111,195 1.53a 111,195 1.53
Investments CurrencyQuantity/
Nominal Value
Market Value
USD
% of Net
Assets
MaterialsCNAC HK Finbridge Co. Ltd., Reg. S 2% 22/09/2025 USD 200,000 191,349 2.63a 191,349 2.63UtilitiesElectricite de France SA, Reg. S, FRN 5.25% Perpetual USD 200,000 212,404 2.92a 212,404 2.92
Total Bonds 2,640,975 36.26EquitiesCommunication ServicesAlphabet, Inc. 'A' USD 29 50,324 0.68AT&T, Inc. USD 712 20,283 0.28NetEase, Inc. HKD 1,499 28,517 0.39Telenor ASA NOK 1,729 29,612 0.41Vodafone Group plc GBP 22,727 37,520 0.52Walt Disney Co. (The) USD 260 47,141 0.65a 213,397 2.93Consumer DiscretionaryAlibaba Group Holding Ltd. HKD 1,172 35,148 0.48Capri Holdings Ltd. USD 583 25,555 0.35Jardine Cycle & Carriage Ltd. SGD 1,372 20,304 0.28LVMH Moet Hennessy Louis Vuitton SE EUR 96 60,252 0.83Shangri-La Asia Ltd. HKD 36,500 32,524 0.45Target Corp. USD 227 39,440 0.54Trip.com Group Ltd., ADR USD 1,023 34,096 0.47a 247,319 3.40Consumer StaplesAnheuser-Busch InBev SA/NV EUR 391 27,384 0.38Hengan International Group Co. Ltd. HKD 2,496 17,670 0.24Henkel AG & Co. KGaA EUR 362 35,066 0.48Pernod Ricard SA EUR 192 36,984 0.51Reckitt Benckiser Group plc GBP 570 50,903 0.70Unilever plc EUR 706 42,988 0.59a 210,995 2.90EnergyTOTAL SE EUR 924 40,070 0.55a 40,070 0.55

64Schroder Special Situations Fund Audited Annual Report
31 December 2020
The accompanying notes form an integral part of these financial statements.
Schedule of Investments as at 31 December 2020 Schroder SSF Wealth Management USD Cautious*
Portfolio of Investments (continued) a
Investments CurrencyQuantity/
Nominal Value
Market Value
USD
% of Net
Assets
FinancialsAXA SA EUR 1,187 28,453 0.39Bank of China Ltd. 'H' HKD 56,184 19,201 0.26JPMorgan Chase & Co. USD 322 40,435 0.56Oversea-Chinese Banking Corp. Ltd. SGD 3,230 24,597 0.34a 112,686 1.55Health CareAstraZeneca plc GBP 383 38,291 0.53Bayer AG EUR 301 17,807 0.24Gilead Sciences, Inc. USD 393 22,249 0.31GlaxoSmithKline plc GBP 1,700 31,143 0.43Illumina, Inc. USD 100 36,430 0.50Roche Holding AG CHF 123 43,204 0.59Thermo Fisher Scientific, Inc. USD 165 76,107 1.04a 265,231 3.64Industrials3M Co. USD 169 29,432 0.40ComfortDelGro Corp. Ltd. SGD 22,803 28,823 0.40Honeywell International, Inc. USD 160 33,766 0.46IHS Markit Ltd. USD 378 33,434 0.46Otis Worldwide Corp. USD 434 28,926 0.40Raytheon Technologies Corp. USD 319 22,784 0.31SATS Ltd. SGD 6,912 20,823 0.29Weichai Power Co. Ltd. 'H' HKD 12,795 25,671 0.35a 223,659 3.07Information TechnologyCisco Systems, Inc. USD 646 28,737 0.39International Business Machines Corp. USD 98 12,193 0.17Mastercard, Inc. 'A' USD 93 33,075 0.45Microsoft Corp. USD 299 66,222 0.91NXP Semiconductors NV USD 364 58,083 0.80Omron Corp. JPY 598 53,484 0.73QUALCOMM, Inc. USD 487 73,019 1.01salesforce.com, Inc. USD 97 21,566 0.30a 346,379 4.76MaterialsAmcor plc, CDI AUD 2,630 31,218 0.43Barrick Gold Corp. USD 941 21,838 0.30
Investments CurrencyQuantity/
Nominal Value
Market Value
USD
% of Net
Assets
BHP Group Ltd. AUD 1,320 43,303 0.60DuPont de Nemours, Inc. USD 326 22,938 0.31FMC Corp. USD 277 31,622 0.44Nutrien Ltd. USD 560 26,440 0.36a 177,359 2.44Real EstateKeppel DC REIT, REIT SGD 41,981 89,273 1.23Keppel REIT SGD 77,120 65,383 0.90Mapletree Logistics Trust, REIT SGD 108,449 164,960 2.25Parkway Life Real Estate Investment Trust SGD 27,842 81,558 1.12UOL Group Ltd. SGD 5,507 32,145 0.44a 433,319 5.94UtilitiesKeppel Infrastructure Trust SGD 147,287 60,757 0.83a 60,757 0.83
Total Equities 2,331,171 32.01Total Transferable securities and money market instruments admitted to an official exchange listing 4,972,146 68.27Transferable securities and money market instruments dealt in on another regulated marketBondsFinancialsCitadel LP, Reg. S 5.375% 17/01/2023 USD 200,000 215,002 2.95Nordea Bank Abp, Reg. S, FRN 6.125% Perpetual USD 200,000 218,515 3.00a 433,517 5.95
Total Bonds 433,517 5.95Total Transferable securities and money market instruments dealt in on another regulated market 433,517 5.95Units of authorised UCITS or other collective investment undertakingsExchange Traded FundsInvestment FundsiShares China CNY Bond UCITS ETF'D' USD 28,260 151,106 2.07iShares Physical Gold Fund USD 14,056 519,615 7.14iShares USD TIPS Fund GBP 745 181,536 2.49iShares USD Treasury Bond 20+yr Fund GBP 26,401 154,788 2.13

65Schroder Special Situations Fund Audited Annual Report
31 December 2020
The accompanying notes form an integral part of these financial statements.
Schedule of Investments as at 31 December 2020 Schroder SSF Wealth Management USD Cautious*
Portfolio of Investments (continued) a
Investments CurrencyQuantity/
Nominal Value
Market Value
USD
% of Net
Assets
iShares USD Treasury Bond 3-7yr Fund USD 1,450 205,581 2.82
Investments CurrencyQuantity/
Nominal Value
Market Value
USD
% of Net
Assets
Vanguard S&P 500 Fund USD 872 61,692 0.85a 1,274,318 17.50
Total Exchange Traded Funds 1,274,318 17.50Total Units of authorised UCITS or other collective investment undertakings 1,274,318 17.50Total Investments 6,679,981 91.72Cash 590,516 8.11Other assets/(liabilities) 12,629 0.17Total Net Assets 7,283,126 100.00
Forward Currency Exchange Contracts
Currency Purchased
Amount Purchased
Currency Sold
Amount Sold
Maturity Date Counterparty
Unrealised Gain/(Loss)
USD% of Net
Assets
Share Class HedgingSGD 10,757 USD 8,117 29/01/2021 HSBC 26 –Unrealised Gain on NAV Hedged Share Classes Forward Currency Exchange Contracts - Assets 26 –Total Unrealised Gain on Forward Currency Exchange Contracts - Assets 26 –Net Unrealised Gain on Forward Currency Exchange Contracts - Assets 26 –
* Please refer to the Directors’ Report for details of all corporate actions that occurred during the year under review.
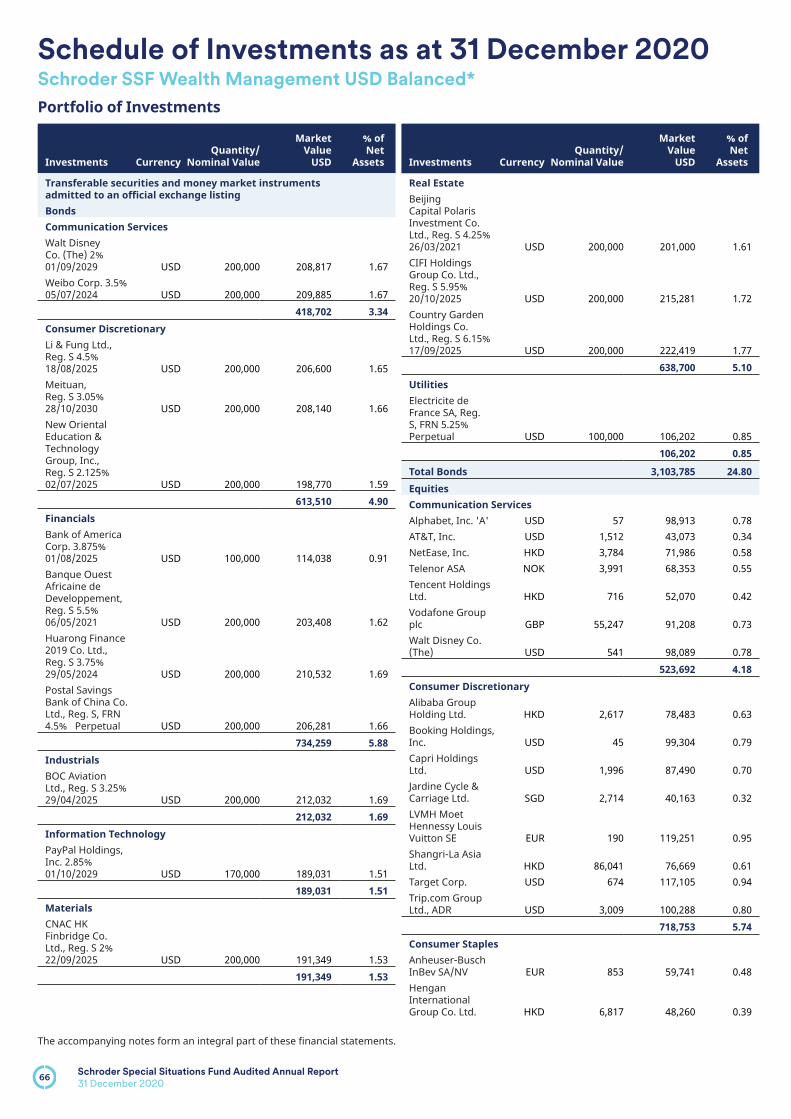
66
Schedule of Investments as at 31 December 2020Schroder SSF Wealth Management USD Balanced*
Schroder Special Situations Fund Audited Annual Report
31 December 2020
The accompanying notes form an integral part of these financial statements.
Portfolio of Investments a
Investments CurrencyQuantity/
Nominal Value
Market Value
USD
% of Net
Assets
Transferable securities and money market instruments admitted to an official exchange listingBondsCommunication ServicesWalt Disney Co. (The) 2% 01/09/2029 USD 200,000 208,817 1.67Weibo Corp. 3.5% 05/07/2024 USD 200,000 209,885 1.67a 418,702 3.34Consumer DiscretionaryLi & Fung Ltd., Reg. S 4.5% 18/08/2025 USD 200,000 206,600 1.65Meituan, Reg. S 3.05% 28/10/2030 USD 200,000 208,140 1.66New Oriental Education & Technology Group, Inc., Reg. S 2.125% 02/07/2025 USD 200,000 198,770 1.59a 613,510 4.90FinancialsBank of America Corp. 3.875% 01/08/2025 USD 100,000 114,038 0.91Banque Ouest Africaine de Developpement, Reg. S 5.5% 06/05/2021 USD 200,000 203,408 1.62Huarong Finance 2019 Co. Ltd., Reg. S 3.75% 29/05/2024 USD 200,000 210,532 1.69Postal Savings Bank of China Co. Ltd., Reg. S, FRN 4.5% Perpetual USD 200,000 206,281 1.66a 734,259 5.88IndustrialsBOC Aviation Ltd., Reg. S 3.25% 29/04/2025 USD 200,000 212,032 1.69a 212,032 1.69Information TechnologyPayPal Holdings, Inc. 2.85% 01/10/2029 USD 170,000 189,031 1.51a 189,031 1.51MaterialsCNAC HK Finbridge Co. Ltd., Reg. S 2% 22/09/2025 USD 200,000 191,349 1.53a 191,349 1.53
Investments CurrencyQuantity/
Nominal Value
Market Value
USD
% of Net
Assets
Real EstateBeijing Capital Polaris Investment Co. Ltd., Reg. S 4.25% 26/03/2021 USD 200,000 201,000 1.61CIFI Holdings Group Co. Ltd., Reg. S 5.95% 20/10/2025 USD 200,000 215,281 1.72Country Garden Holdings Co. Ltd., Reg. S 6.15% 17/09/2025 USD 200,000 222,419 1.77a 638,700 5.10UtilitiesElectricite de France SA, Reg. S, FRN 5.25% Perpetual USD 100,000 106,202 0.85a 106,202 0.85
Total Bonds 3,103,785 24.80EquitiesCommunication ServicesAlphabet, Inc. 'A' USD 57 98,913 0.78AT&T, Inc. USD 1,512 43,073 0.34NetEase, Inc. HKD 3,784 71,986 0.58Telenor ASA NOK 3,991 68,353 0.55Tencent Holdings Ltd. HKD 716 52,070 0.42Vodafone Group plc GBP 55,247 91,208 0.73Walt Disney Co. (The) USD 541 98,089 0.78a 523,692 4.18Consumer DiscretionaryAlibaba Group Holding Ltd. HKD 2,617 78,483 0.63Booking Holdings, Inc. USD 45 99,304 0.79Capri Holdings Ltd. USD 1,996 87,490 0.70Jardine Cycle & Carriage Ltd. SGD 2,714 40,163 0.32LVMH Moet Hennessy Louis Vuitton SE EUR 190 119,251 0.95Shangri-La Asia Ltd. HKD 86,041 76,669 0.61Target Corp. USD 674 117,105 0.94Trip.com Group Ltd., ADR USD 3,009 100,288 0.80a 718,753 5.74Consumer StaplesAnheuser-Busch InBev SA/NV EUR 853 59,741 0.48Hengan International Group Co. Ltd. HKD 6,817 48,260 0.39

67Schroder Special Situations Fund Audited Annual Report
31 December 2020
The accompanying notes form an integral part of these financial statements.
Schedule of Investments as at 31 December 2020 Schroder SSF Wealth Management USD Balanced*
Portfolio of Investments (continued) a
Investments CurrencyQuantity/
Nominal Value
Market Value
USD
% of Net
Assets
Henkel AG & Co. KGaA EUR 739 71,584 0.57Pernod Ricard SA EUR 378 72,813 0.58Reckitt Benckiser Group plc GBP 1,035 92,428 0.74Unilever plc EUR 1,562 95,111 0.75a 439,937 3.51EnergyChina Petroleum & Chemical Corp. 'H' HKD 133,436 59,701 0.48TOTAL SE EUR 1,974 85,604 0.68a 145,305 1.16FinancialsAXA SA EUR 3,078 73,781 0.59Bank of China Ltd. 'H' HKD 92,618 31,653 0.25JPMorgan Chase & Co. USD 637 79,989 0.64Oversea-Chinese Banking Corp. Ltd. SGD 7,489 57,031 0.46PICC Property & Casualty Co. Ltd. 'H' HKD 51,118 38,684 0.31Ping An Insurance Group Co. of China Ltd. 'H' HKD 4,089 50,091 0.40a 331,229 2.65Health CareAstraZeneca plc GBP 801 80,082 0.64Bayer AG EUR 673 39,813 0.32Gilead Sciences, Inc. USD 875 49,536 0.40GlaxoSmithKline plc GBP 3,005 55,049 0.44Illumina, Inc. USD 234 85,246 0.68Roche Holding AG CHF 244 85,706 0.68Thermo Fisher Scientific, Inc. USD 351 161,902 1.29a 557,334 4.45Industrials3M Co. USD 355 61,825 0.49ComfortDelGro Corp. Ltd. SGD 53,735 67,922 0.54General Electric Co. USD 6,661 71,455 0.57Honeywell International, Inc. USD 501 105,728 0.84IHS Markit Ltd. USD 1,244 110,032 0.89Otis Worldwide Corp. USD 1,042 69,448 0.55Raytheon Technologies Corp. USD 1,118 79,852 0.64SATS Ltd. SGD 23,740 71,520 0.57
Investments CurrencyQuantity/
Nominal Value
Market Value
USD
% of Net
Assets
Weichai Power Co. Ltd. 'H' HKD 32,960 66,129 0.53a 703,911 5.62Information TechnologyAdvantest Corp. JPY 1,383 104,027 0.83Cisco Systems, Inc. USD 1,306 58,096 0.46International Business Machines Corp. USD 321 39,939 0.32Mastercard, Inc. 'A' USD 231 82,154 0.66Microsoft Corp. USD 689 152,599 1.23NXP Semiconductors NV USD 785 125,262 1.00Omron Corp. JPY 985 88,096 0.70QUALCOMM, Inc. USD 1,004 150,537 1.20salesforce.com, Inc. USD 384 85,376 0.68Taiwan Semiconductor Manufacturing Co. Ltd., ADR USD 903 98,381 0.79Texas Instruments, Inc. USD 521 84,769 0.68a 1,069,236 8.55MaterialsAmcor plc, CDI AUD 7,415 88,017 0.70Barrick Gold Corp. USD 2,158 50,080 0.40BHP Group Ltd. AUD 3,230 105,958 0.85DuPont de Nemours, Inc. USD 1,123 79,018 0.63FMC Corp. USD 781 89,159 0.71Nutrien Ltd. USD 1,076 50,803 0.41a 463,035 3.70Real EstateCapitaLand Integrated Commercial Trust, REIT SGD 100,295 163,966 1.31Keppel REIT SGD 128,085 108,592 0.87Mapletree Logistics Trust, REIT SGD 189,329 287,984 2.30Parkway Life Real Estate Investment Trust SGD 46,895 137,370 1.10UOL Group Ltd. SGD 13,815 80,641 0.64a 778,553 6.22

68Schroder Special Situations Fund Audited Annual Report
31 December 2020
The accompanying notes form an integral part of these financial statements.
Schedule of Investments as at 31 December 2020 Schroder SSF Wealth Management USD Balanced*
Portfolio of Investments (continued) a
Investments CurrencyQuantity/
Nominal Value
Market Value
USD
% of Net
Assets
UtilitiesKeppel Infrastructure Trust SGD 247,922 102,270 0.82a 102,270 0.82
Total Equities 5,833,255 46.60Total Transferable securities and money market instruments admitted to an official exchange listing 8,937,040 71.40Transferable securities and money market instruments dealt in on another regulated marketBondsFinancialsCitadel LP, Reg. S 5.375% 17/01/2023 USD 200,000 215,002 1.72Nordea Bank Abp, Reg. S, FRN 6.125% Perpetual USD 200,000 218,515 1.74a 433,517 3.46
Total Bonds 433,517 3.46Total Transferable securities and money market instruments dealt in on another regulated market 433,517 3.46
Investments CurrencyQuantity/
Nominal Value
Market Value
USD
% of Net
Assets
Units of authorised UCITS or other collective investment undertakingsExchange Traded FundsInvestment FundsiShares China CNY Bond UCITS ETF'D' USD 35,604 190,375 1.52iShares Physical Gold Fund USD 23,423 865,889 6.92iShares USD TIPS Fund GBP 1,250 304,590 2.43iShares USD Treasury Bond 20+yr Fund GBP 42,485 249,089 1.99iShares USD Treasury Bond 3-7yr Fund USD 2,744 389,043 3.11Vanguard S&P 500 Fund USD 2,390 169,087 1.35a 2,168,073 17.32
Total Exchange Traded Funds 2,168,073 17.32Total Units of authorised UCITS or other collective investment undertakings 2,168,073 17.32Total Investments 11,538,630 92.18Cash 965,517 7.71Other assets/(liabilities) 13,370 0.11Total Net Assets 12,517,517 100.00
Forward Currency Exchange Contracts
Currency Purchased
Amount Purchased
Currency Sold
Amount Sold
Maturity Date Counterparty
Unrealised Gain/(Loss)
USD% of Net
Assets
Share Class HedgingSGD 11,210 USD 8,459 29/01/2021 HSBC 28 –Unrealised Gain on NAV Hedged Share Classes Forward Currency Exchange Contracts - Assets 28 –Total Unrealised Gain on Forward Currency Exchange Contracts - Assets 28 –Share Class HedgingUSD 88 SGD 118 29/01/2021 HSBC (1 ) –Unrealised Loss on NAV Hedged Share Classes Forward Currency Exchange Contracts - Liabilities (1 ) –Total Unrealised Loss on Forward Currency Exchange Contracts - Liabilities (1 ) –Net Unrealised Gain on Forward Currency Exchange Contracts - Assets 27 –
* Please refer to the Directors’ Report for details of all corporate actions that occurred during the year under review.

69Schroder Special Situations Fund Audited Annual Report
31 December 2020
The accompanying notes form an integral part of these financial statements.
Schedule of Investments as at 31 December 2020Schroder SSF Wealth Management USD Growth*
Portfolio of Investments a
Investments CurrencyQuantity/
Nominal Value
Market Value
USD
% of Net
Assets
Transferable securities and money market instruments admitted to an official exchange listingBondsFinancialsHuarong Finance 2019 Co. Ltd., Reg. S 3.75% 29/05/2024 USD 200,000 210,531 2.64ICBCIL Finance Co. Ltd., Reg. S 1.75% 25/08/2025 USD 200,000 201,227 2.53a 411,758 5.17IndustrialsBOC Aviation Ltd., Reg. S 3.25% 29/04/2025 USD 200,000 212,032 2.66a 212,032 2.66Information TechnologyPayPal Holdings, Inc. 2.85% 01/10/2029 USD 60,000 66,717 0.84a 66,717 0.84MaterialsCNAC HK Finbridge Co. Ltd., Reg. S 2% 22/09/2025 USD 200,000 191,349 2.40a 191,349 2.40Real EstateCIFI Holdings Group Co. Ltd., Reg. S 5.95% 20/10/2025 USD 200,000 215,281 2.70a 215,281 2.70UtilitiesElectricite de France SA, Reg. S, FRN 5.25% Perpetual USD 100,000 106,202 1.33a 106,202 1.33
Total Bonds 1,203,339 15.10EquitiesCommunication ServicesAlphabet, Inc. 'A' USD 42 72,883 0.91AT&T, Inc. USD 1,161 33,074 0.42NetEase, Inc. HKD 3,142 59,772 0.75Sarana Menara Nusantara Tbk. PT IDR 511,403 35,034 0.44Telenor ASA NOK 2,558 43,810 0.55Tencent Holdings Ltd. HKD 764 55,561 0.70Vodafone Group plc GBP 41,318 68,213 0.86Walt Disney Co. (The) USD 560 101,535 1.27a 469,882 5.90
Investments CurrencyQuantity/
Nominal Value
Market Value
USD
% of Net
Assets
Consumer DiscretionaryAlibaba Group Holding Ltd. HKD 2,382 71,435 0.90Booking Holdings, Inc. USD 32 70,616 0.89Capri Holdings Ltd. USD 1,684 73,814 0.93Jardine Cycle & Carriage Ltd. SGD 1,740 25,749 0.32LVMH Moet Hennessy Louis Vuitton SE EUR 183 114,858 1.43Shangri-La Asia Ltd. HKD 71,098 63,354 0.80Target Corp. USD 642 111,545 1.40Trip.com Group Ltd., ADR USD 2,936 97,855 1.23a 629,226 7.90Consumer StaplesAnheuser-Busch InBev SA/NV EUR 860 60,231 0.76Hengan International Group Co. Ltd. HKD 7,862 55,658 0.70Henkel AG & Co. KGaA EUR 525 50,855 0.64Pernod Ricard SA EUR 324 62,411 0.78Reckitt Benckiser Group plc GBP 884 78,944 0.99Unilever plc EUR 1,145 69,719 0.87a 377,818 4.74EnergyChina Petroleum & Chemical Corp. 'H' HKD 117,530 52,585 0.66TOTAL SE EUR 1,785 77,408 0.97a 129,993 1.63FinancialsAXA SA EUR 2,595 62,203 0.78Bank of China Ltd. 'H' HKD 89,021 30,424 0.38JPMorgan Chase & Co. USD 612 76,850 0.97Oversea-Chinese Banking Corp. Ltd. SGD 5,118 38,975 0.49PICC Property & Casualty Co. Ltd. 'H' HKD 35,325 26,733 0.34Ping An Insurance Group Co. of China Ltd. 'H' HKD 3,930 48,143 0.60a 283,328 3.56Health CareAstraZeneca plc GBP 740 73,984 0.93Bayer AG EUR 515 30,466 0.38Gilead Sciences, Inc. USD 792 44,837 0.56

70Schroder Special Situations Fund Audited Annual Report
31 December 2020
The accompanying notes form an integral part of these financial statements.
Schedule of Investments as at 31 December 2020 Schroder SSF Wealth Management USD Growth*
Portfolio of Investments (continued) a
Investments CurrencyQuantity/
Nominal Value
Market Value
USD
% of Net
Assets
GlaxoSmithKline plc GBP 2,514 46,055 0.58Illumina, Inc. USD 216 78,688 0.99Roche Holding AG CHF 156 54,795 0.69Thermo Fisher Scientific, Inc. USD 252 116,237 1.46a 445,062 5.59Industrials3M Co. USD 315 54,859 0.69ComfortDelGro Corp. Ltd. SGD 49,741 62,873 0.79General Electric Co. USD 5,867 62,938 0.79Honeywell International, Inc. USD 413 87,157 1.09IHS Markit Ltd. USD 1,196 105,786 1.32Otis Worldwide Corp. USD 923 61,517 0.77Raytheon Technologies Corp. USD 1,172 83,709 1.05SATS Ltd. SGD 25,017 75,367 0.95Weichai Power Co. Ltd. 'H' HKD 27,783 55,742 0.70a 649,948 8.15Information TechnologyAdvantest Corp. JPY 1,149 86,426 1.08Cisco Systems, Inc. USD 1,094 48,666 0.61International Business Machines Corp. USD 206 25,631 0.32Mastercard, Inc. 'A' USD 194 68,996 0.87Microsoft Corp. USD 505 111,845 1.40NXP Semiconductors NV USD 616 98,295 1.23Omron Corp. JPY 947 84,698 1.06QUALCOMM, Inc. USD 772 115,750 1.46salesforce.com, Inc. USD 313 69,590 0.87Taiwan Semiconductor Manufacturing Co. Ltd., ADR USD 974 106,116 1.33Texas Instruments, Inc. USD 334 54,344 0.68a 870,357 10.91MaterialsAmcor plc, CDI AUD 4,752 56,407 0.71Barrick Gold Corp. USD 2,048 47,528 0.60BHP Group Ltd. AUD 2,902 95,197 1.18DuPont de Nemours, Inc. USD 947 66,634 0.84FMC Corp. USD 723 82,538 1.04
Investments CurrencyQuantity/
Nominal Value
Market Value
USD
% of Net
Assets
Nutrien Ltd. USD 1,183 55,855 0.70a 404,159 5.07Real EstateCapitaLand Integrated Commercial Trust, REIT SGD 64,269 105,070 1.32Keppel REIT SGD 81,747 69,306 0.87Mapletree Logistics Trust, REIT SGD 117,953 179,415 2.25Parkway Life Real Estate Investment Trust SGD 30,143 88,298 1.11UOL Group Ltd. SGD 11,589 67,647 0.85a 509,736 6.40UtilitiesKeppel Infrastructure Trust SGD 199,279 82,205 1.03a 82,205 1.03
Total Equities 4,851,714 60.88Total Transferable securities and money market instruments admitted to an official exchange listing 6,055,053 75.98Transferable securities and money market instruments dealt in on another regulated marketBondsFinancialsCitadel LP, Reg. S 5.375% 17/01/2023 USD 200,000 215,002 2.70a 215,002 2.70
Total Bonds 215,002 2.70Total Transferable securities and money market instruments dealt in on another regulated market 215,002 2.70Units of authorised UCITS or other collective investment undertakingsExchange Traded FundsInvestment FundsiShares China CNY Bond UCITS ETF'D' USD 14,889 79,611 1.00iShares Physical Gold Fund USD 14,736 544,754 6.84iShares USD TIPS Fund GBP 667 162,529 2.04iShares USD Treasury Bond 20+yr Fund GBP 24,477 143,508 1.80iShares USD Treasury Bond 3-7yr Fund USD 412 58,413 0.73

71Schroder Special Situations Fund Audited Annual Report
31 December 2020
The accompanying notes form an integral part of these financial statements.
Schedule of Investments as at 31 December 2020 Schroder SSF Wealth Management USD Growth*
Portfolio of Investments (continued) a
Investments CurrencyQuantity/
Nominal Value
Market Value
USD
% of Net
Assets
Vanguard S&P 500 Fund USD 1,834 129,751 1.63a 1,118,566 14.04
Investments CurrencyQuantity/
Nominal Value
Market Value
USD
% of Net
Assets
Total Exchange Traded Funds 1,118,566 14.04Total Units of authorised UCITS or other collective investment undertakings 1,118,566 14.04Total Investments 7,388,621 92.72Cash 536,771 6.74Other assets/(liabilities) 42,945 0.54Total Net Assets 7,968,337 100.00
Forward Currency Exchange Contracts
Currency Purchased
Amount Purchased
Currency Sold
Amount Sold
Maturity Date Counterparty
Unrealised Gain/(Loss)
USD% of Net
Assets
Share Class HedgingSGD 11,512 USD 8,687 29/01/2021 HSBC 28 –Unrealised Gain on NAV Hedged Share Classes Forward Currency Exchange Contracts - Assets 28 –Total Unrealised Gain on Forward Currency Exchange Contracts - Assets 28 –Share Class HedgingUSD 122 SGD 162 29/01/2021 HSBC (1 ) –Unrealised Loss on NAV Hedged Share Classes Forward Currency Exchange Contracts - Liabilities (1 ) –Total Unrealised Loss on Forward Currency Exchange Contracts - Liabilities (1 ) –Net Unrealised Gain on Forward Currency Exchange Contracts - Assets 27 –
* Please refer to the Directors’ Report for details of all corporate actions that occurred during the year under review.

72
Schedule of Investments as at 31 December 2020Schroder SSF Sterling Liquidity Plus
Schroder Special Situations Fund Audited Annual Report
31 December 2020
The accompanying notes form an integral part of these financial statements.
Portfolio of Investments a
Investments CurrencyQuantity/
Nominal Value
Market Value
GBP
% of Net
Assets
Transferable securities and money market instruments admitted to an official exchange listingBondsFinancialsJPMorgan Chase Bank NA, Reg. S, FRN 0.293% 10/05/2021 GBP 15,800,000 15,800,290 0.33Lloyds Bank plc, Reg. S, FRN 0.21% 10/01/2021 GBP 22,640,000 22,640,227 0.47Toronto-Dominion Bank (The), Reg. S, FRN 0.749% 19/03/2021 GBP 22,200,000 22,231,781 0.46a 60,672,298 1.26
Total Bonds 60,672,298 1.26Total Transferable securities and money market instruments admitted to an official exchange listing 60,672,298 1.26Transferable securities and money market instruments dealt in on another regulated marketBondsFinancialsUK Treasury Bill 0% 04/01/2021 GBP 1 1 –UK Treasury Bill 0% 22/03/2021 GBP 8,000,000 8,000,500 0.17UK Treasury Bill 0% 04/05/2021 GBP 100 100 –UK Treasury Bill 0% 07/06/2021 GBP 83,900,000 83,914,070 1.75UK Treasury Bill 0% 14/06/2021 GBP 4,993,550 4,994,426 0.10UK Treasury Bill 0% 21/06/2021 GBP 228,000,000 228,041,735 4.75a 324,950,832 6.77
Total Bonds 324,950,832 6.77Certificates of DepositFinancialsABN AMRO Bank NV 0% 01/02/2021 GBP 40,000,000 40,003,507 0.83ABN AMRO Bank NV 0% 04/02/2021 GBP 45,000,000 45,004,316 0.94Banque Federative du Credit Mutuel SA 0% 28/04/2021 GBP 45,000,000 45,001,164 0.94Banque Federative du Credit Mutuel SA 0% 16/12/2021 GBP 50,000,000 49,959,759 1.04Commonwealth Bank of Australia 0.05% 03/08/2021 GBP 45,000,000 45,013,253 0.94
Investments CurrencyQuantity/
Nominal Value
Market Value
GBP
% of Net
Assets
Commonwealth Bank of Australia, FRN 0% 09/03/2021 GBP 40,000,000 40,000,000 0.83Cooperatieve Rabobank UA 0% 14/04/2021 GBP 45,000,000 44,999,231 0.94Cooperatieve Rabobank UA 0% 20/05/2021 GBP 40,000,000 39,996,625 0.83Credit Agricole Co. 0.19% 04/01/2021 GBP 64,800,000 64,801,206 1.34DZ Bank AG Deutsche Zen-tral-Genossen-schaftsbank Frankfurt Am Main 0.03% 27/01/2021 GBP 40,000,000 40,000,592 0.83First Abu Dhabi Bank PJSC 0% 21/01/2021 GBP 30,000,000 30,000,000 0.62First Abu Dhabi Bank PJSC 0% 09/02/2021 GBP 20,000,000 20,000,000 0.42First Abu Dhabi Bank PJSC 0% 16/04/2021 GBP 20,000,000 19,997,619 0.42First Abu Dhabi Bank PJSC 0% 17/05/2021 GBP 5,000,000 4,998,837 0.10First Abu Dhabi Bank PJSC, FRN 0% 05/02/2021 GBP 40,000,000 40,000,000 0.83HSBC Bank plc 0.18% 16/09/2021 GBP 40,000,000 40,041,425 0.83Lloyds Bank plc 0% 27/01/2021 GBP 40,000,000 40,000,000 0.83Lloyds Bank plc 0.05% 16/02/2021 GBP 45,000,000 45,002,781 0.94Mizuho International plc 0% 14/01/2021 GBP 219,100,000 219,098,319 4.55MUFG Bank Ltd. 0.03% 19/02/2021 GBP 40,000,000 39,998,520 0.83MUFG Bank Ltd. 0.05% 01/04/2021 GBP 45,000,000 44,997,756 0.94MUFG Bank Ltd. 0.055% 12/04/2021 GBP 40,000,000 39,997,987 0.83MUFG Bank Ltd. 0.07% 04/05/2021 GBP 45,000,000 44,998,776 0.94MUFG Bank Ltd. 0.02% 14/05/2021 GBP 50,000,000 49,988,990 1.04

73Schroder Special Situations Fund Audited Annual Report
31 December 2020
The accompanying notes form an integral part of these financial statements.
Schedule of Investments as at 31 December 2020 Schroder SSF Sterling Liquidity Plus
Portfolio of Investments (continued) a
Investments CurrencyQuantity/
Nominal Value
Market Value
GBP
% of Net
Assets
National Australia Bank Ltd. 0% 12/04/2021 GBP 45,000,000 44,997,611 0.94National Australia Bank Ltd. 0% 20/04/2021 GBP 40,000,000 39,997,348 0.83National Westminster American Equity Pension 0% 04/01/2021 GBP 45,000,000 44,999,753 0.94National Westminster Bank plc 0% 05/01/2021 GBP 45,000,000 44,999,692 0.94National Westminster Bank plc 0.045% 23/03/2021 GBP 45,000,000 44,997,776 0.94National Westminster Bank plc 0.15% 20/09/2021 GBP 40,000,000 40,012,083 0.83Nordea Bank AB 0% 05/05/2021 GBP 45,000,000 45,015,416 0.94Nordea Bank AB 0.01% 06/05/2021 GBP 45,000,000 45,017,094 0.94Nordea Bank Abp 0.12% 30/04/2021 GBP 45,000,000 45,032,566 0.94Nordea Bank Abp 0.1% 11/06/2021 GBP 20,000,000 20,017,764 0.42Nordea Bank Finland plc 0.11% 06/01/2021 GBP 45,000,000 45,001,554 0.94Qatar National Bank QPSC 0% 05/02/2021 GBP 45,000,000 45,001,198 0.94Qatar National Bank QPSC 0% 13/04/2021 GBP 40,000,000 39,997,856 0.83Qatar National Bank QPSC 0% 26/05/2021 GBP 45,000,000 44,985,425 0.94Qatar National Bank QPSC 0% 14/09/2021 GBP 40,000,000 39,946,559 0.83Qatar National Bank SAQ 0% 04/01/2021 GBP 25,000,000 25,000,082 0.52Qatar National Bank SAQ 0% 05/11/2021 GBP 13,200,000 13,174,125 0.27Rabobank International 0% 02/06/2021 GBP 45,000,000 44,994,907 0.94Royal Bank of Canada 0% 04/01/2021 GBP 45,000,000 45,000,000 0.94Royal Bank of Canada, FRN 0% 25/02/2021 GBP 40,000,000 40,004,909 0.83
Investments CurrencyQuantity/
Nominal Value
Market Value
GBP
% of Net
Assets
Royal Bank of Canada, FRN 0% 12/03/2021 GBP 45,000,000 45,048,137 0.94Santander Financial Services plc, FRN 0% 10/03/2021 GBP 40,000,000 39,998,790 0.83Santander UK plc 0.15% 05/01/2021 GBP 45,000,000 45,000,863 0.94Santander UK plc 0% 11/01/2021 GBP 40,000,000 39,999,880 0.83Santander UK plc 0% 18/02/2021 GBP 40,000,000 39,999,302 0.83Skandinaviska Enskilda Banken AB 0.1% 29/11/2021 GBP 45,000,000 45,022,159 0.94Societe Generale SA 0% 05/02/2021 GBP 40,000,000 39,998,343 0.83Societe Generale SA, FRN 0% 08/01/2021 GBP 40,000,000 39,999,649 0.83Standard Chartered Bank 0.23% 04/01/2021 GBP 20,000,000 20,000,482 0.42Standard Chartered Bank 0% 05/02/2021 GBP 40,000,000 39,999,606 0.83Standard Chartered Bank 0.05% 09/03/2021 GBP 20,000,000 20,001,490 0.42Standard Chartered Bank, FRN 0% 12/02/2021 GBP 20,000,000 20,000,000 0.42Standard Chartered Bank, FRN 0% 24/02/2021 GBP 40,000,000 40,012,034 0.83Standard Chartered Bank 0% 10/09/2021 GBP 40,000,000 40,000,000 0.83Standard Chartered Bank 0% 13/12/2021 GBP 40,000,000 40,213,720 0.84Sumitomo Mitsui Banking Corp. 0% 15/02/2021 GBP 45,000,000 44,998,299 0.94Sumitomo Mitsui Banking Corp. 0% 22/02/2021 GBP 40,000,000 39,998,025 0.83Sumitomo Mitsui Banking Corp. 0% 05/03/2021 GBP 45,000,000 44,997,002 0.94Sumitomo Mitsui Banking Corp. 0% 10/03/2021 GBP 45,000,000 44,996,768 0.94Sumitomo Mitsui Banking Corp. 0% 15/03/2021 GBP 45,000,000 44,996,533 0.94

74Schroder Special Situations Fund Audited Annual Report
31 December 2020
The accompanying notes form an integral part of these financial statements.
Schedule of Investments as at 31 December 2020 Schroder SSF Sterling Liquidity Plus
Portfolio of Investments (continued) a
Investments CurrencyQuantity/
Nominal Value
Market Value
GBP
% of Net
Assets
Toronto Dominion Holdings UK Ltd. 0.09% 03/12/2021 GBP 45,000,000 45,010,379 0.94Toronto-Dominion Bank (The) 0.19% 12/07/2021 GBP 45,000,000 45,033,531 0.94Toronto-Dominion Bank (The) 0.01% 29/10/2021 GBP 50,000,000 50,000,000 1.04Toronto-Dominion Bank (The) 0% 10/12/2021 GBP 45,000,000 45,000,000 0.94UBS AG 0.82% 18/01/2021 GBP 30,000,000 30,012,131 0.62UBS AG 0.01% 17/06/2021 GBP 45,000,000 44,998,343 0.94UBS AG 0% 03/12/2021 GBP 45,000,000 44,958,905 0.94Zuercher Kantonalbank 0% 12/04/2021 GBP 50,000,000 49,999,302 1.04Zuercher Kantonalbank 0% 17/05/2021 GBP 45,000,000 45,000,000 0.94Zuercher Kantonalbank, Reg. S 0% 17/06/2021 GBP 61,000,000 60,990,455 1.27a 3,168,378,509 65.98
Total Certificates of Deposit 3,168,378,509 65.98Commercial PapersFinancialsAgence Centrale des Organismes de Securite Sociale 0% 05/02/2021 GBP 40,000,000 40,004,143 0.83Agence Centrale des Organismes de Securite Sociale 0% 08/03/2021 GBP 40,000,000 40,004,480 0.83Banque Federative du Credit Mutuel SA 0% 06/01/2021 GBP 40,000,000 40,000,184 0.83Banque Federative du Credit Mutuel SA 0% 13/04/2021 GBP 45,000,000 45,001,524 0.94Dexia Credit Local de France Banque 0% 15/06/2021 GBP 45,000,000 44,994,066 0.94Dexia Credit Local SA 0% 19/04/2021 GBP 45,000,000 44,997,044 0.94Dexia Credit Local SA 0% 04/06/2021 GBP 45,000,000 44,994,650 0.94First Abu Dhabi Bank PJSC 0% 05/01/2021 GBP 40,000,000 40,000,000 0.83
Investments CurrencyQuantity/
Nominal Value
Market Value
GBP
% of Net
Assets
First Abu Dhabi Bank PJSC 0% 29/03/2021 GBP 45,000,000 44,997,505 0.94FMS Wertmanagement 0% 06/01/2021 GBP 90,000,000 90,001,479 1.88National Bank of Abu Dhabi 0% 04/02/2021 GBP 40,000,000 40,000,000 0.83Natixis SA 0% 01/03/2021 GBP 40,000,000 40,006,576 0.83OP Corporate Bank plc 0% 25/02/2021 GBP 13,000,000 12,999,601 0.27OP Corporate Bank plc 0% 12/07/2021 GBP 15,000,000 14,996,511 0.31OP Corporate Bank plc 0% 27/08/2021 GBP 26,000,000 25,989,789 0.54Santander Financial Services plc 0% 20/01/2021 GBP 40,000,000 39,999,781 0.83Skandinaviska Enskilda Banken AB 0% 29/09/2021 GBP 45,000,000 44,992,959 0.94a 693,980,292 14.45
Total Commercial Papers 693,980,292 14.45Total Transferable securities and money market instruments dealt in on another regulated market 4,187,309,633 87.20Total Investments 4,247,981,931 88.46Time DepositsFinancialsBNP Paribas SA 0.01% 04/01/2021 GBP 50,918,143 50,918,143 1.06Cooperatieve Rabobank UA 0.01% 04/01/2021 GBP 5,224,392 5,224,392 0.11Credit Agricole Corporate and Investment Bank SA 0.02% 04/01/2021 GBP 50,361,825 50,361,825 1.05DZ Bank AG 0.02% 04/01/2021 GBP 90,018,412 90,018,412 1.87Landesbank Baden-Würt-temberg 0.04% 04/01/2021 GBP 50,038,498 50,038,498 1.04MUFG Bank Ltd. 0.01% 04/01/2021 GBP 103,313,213 103,313,214 2.15

75Schroder Special Situations Fund Audited Annual Report
31 December 2020
The accompanying notes form an integral part of these financial statements.
Schedule of Investments as at 31 December 2020 Schroder SSF Sterling Liquidity Plus
Portfolio of Investments (continued) a
Investments CurrencyQuantity/
Nominal Value
Market Value
GBP
% of Net
Assets
Natixis SA 0.02% 04/01/2021 GBP 60,377,028 60,377,028 1.26
410,251,512 8.54Total Time Deposits 410,251,512 8.54Cash 144,000,650 3.00Other assets/(liabilities) 240,735 –Total Net Assets 4,802,474,828 100.00

Notes to the Financial Statements
as at 31 December 2020
76Schroder Special Situations Fund Audited Annual Report
31 December 2020
The CompanyThe Company is an umbrella structured open-ended investment company with limited liability, organised as a ‘société anonyme’ and qualifies as a ‘Société d’Investissement à Capital Variable’ (‘SICAV’), regulated by the provisions of Part I of the Luxembourg Law of 17 December 2010 regarding undertaking for collective investment (the “2010” law). The Company was incorporated in Luxembourg on 7 February 1997 and its Articles were published in the Mémorial on 11 March 1997. The Articles were last amended on 26 May 2009 and were published in the Mémorial on 16 June 2009.
Classes of SharesThe classes of shares available for investment as at the reporting date are shown below:
Sub-Fund Class
Schroder SSF Diversified Alternative Assets Class S AccClass S DisClass S Dis EUR Hedged SVClass S Dis USD Hedged
Schroder SSF Fixed Maturity Bond I Class A AccClass A Acc HKDClass A Acc SGD HedgedClass A DisClass A Dis EUR HedgedClass A Dis GBP HedgedClass A Dis HKDClass A Dis SGD HedgedClass A1 AccClass A1 Acc HKDClass A1 Acc SGD HedgedClass A1 DisClass A1 Dis HKDClass A1 Dis SGD HedgedClass A2 AccClass A2 DisClass A2 Dis EUR HedgedClass A2 Dis GBP Hedged
Schroder SSF Fixed Maturity Bond 2021 (II) Class A DisClass A Dis HKDClass A Dis SGD Hedged
Schroder SSF Fixed Maturity Bond 2023 (I) Class A AccClass A DisClass A Dis SGD HedgedClass A1 Dis
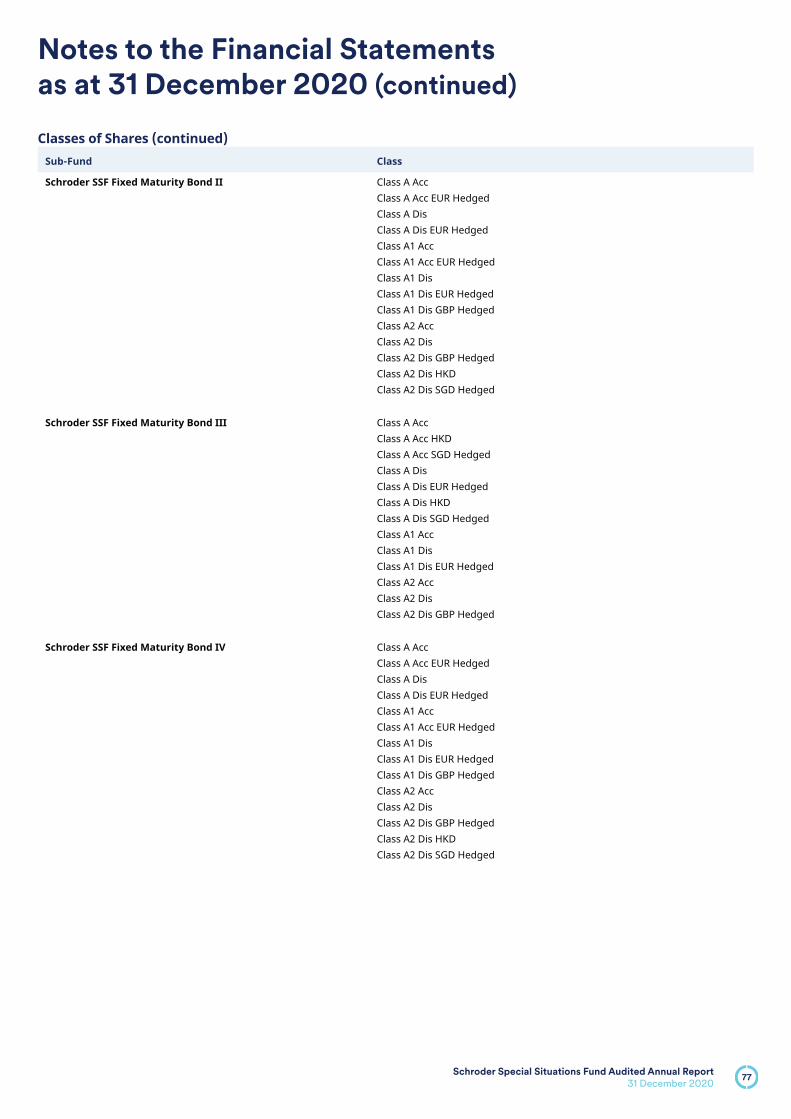
77Schroder Special Situations Fund Audited Annual Report
31 December 2020
Notes to the Financial Statements
as at 31 December 2020 (continued)
Sub-Fund Class
Schroder SSF Fixed Maturity Bond II Class A AccClass A Acc EUR HedgedClass A DisClass A Dis EUR HedgedClass A1 AccClass A1 Acc EUR HedgedClass A1 DisClass A1 Dis EUR HedgedClass A1 Dis GBP HedgedClass A2 AccClass A2 DisClass A2 Dis GBP HedgedClass A2 Dis HKDClass A2 Dis SGD Hedged
Schroder SSF Fixed Maturity Bond III Class A AccClass A Acc HKDClass A Acc SGD HedgedClass A DisClass A Dis EUR HedgedClass A Dis HKDClass A Dis SGD HedgedClass A1 AccClass A1 DisClass A1 Dis EUR HedgedClass A2 AccClass A2 DisClass A2 Dis GBP Hedged
Schroder SSF Fixed Maturity Bond IV Class A AccClass A Acc EUR HedgedClass A DisClass A Dis EUR HedgedClass A1 AccClass A1 Acc EUR HedgedClass A1 DisClass A1 Dis EUR HedgedClass A1 Dis GBP HedgedClass A2 AccClass A2 DisClass A2 Dis GBP HedgedClass A2 Dis HKDClass A2 Dis SGD Hedged
Classes of Shares (continued)

78Schroder Special Situations Fund Audited Annual Report
31 December 2020
Notes to the Financial Statements
as at 31 December 2020 (continued)
Sub-Fund Class
Schroder SSF Fixed Maturity Bond V* Class A AccClass A Acc EUR HedgedClass A DisClass A Dis EUR HedgedClass A1 AccClass A1 Acc EUR HedgedClass A1 DisClass A1 Dis EUR HedgedClass A1 Dis GBP HedgedClass A2 AccClass A2 DisClass A2 Dis GBP HedgedClass A2 Dis HKDClass A2 Dis SGD Hedged
Schroder SSF Fixed Maturity Bond VI* Class A AccClass A DisClass A Dis SGD HedgedClass A1 Dis
Schroder SSF Fixed Maturity Bond 2022 Class A AccClass A DisClass A Dis SGD Hedged
Schroder SSF International Equity Class I Acc
Schroder SSF Managed Wealth Portfolio Class S AccClass S Dis
Schroder SSF Multi-Asset Dynamic Class A Acc
Schroder SSF Wealth Management USD Cautious* Class A AccClass A Acc SGD HedgedClass S Acc
Schroder SSF Wealth Management USD Balanced* Class A AccClass A Acc SGD HedgedClass S Acc
Schroder SSF Wealth Management USD Growth* Class A AccClass A Acc SGD HedgedClass S Acc
Classes of Shares (continued)
* Please refer to the Directors’ Report for details of all corporate actions that occurred during the year under review.
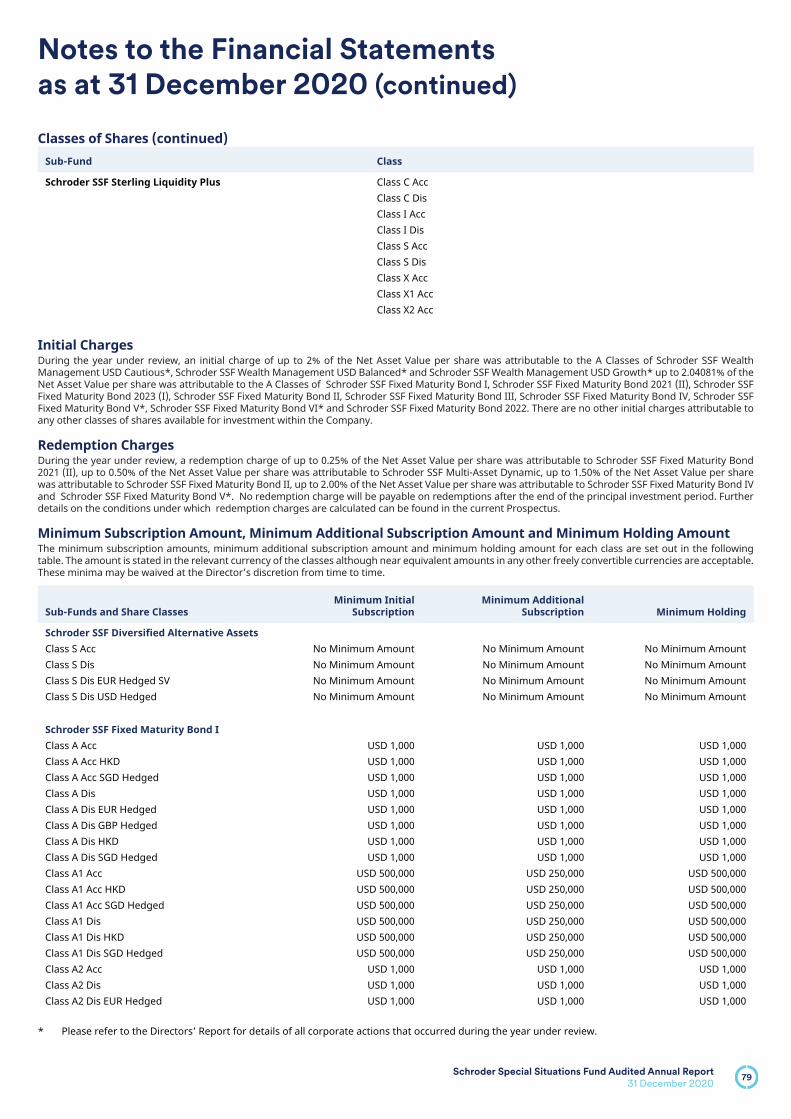
79Schroder Special Situations Fund Audited Annual Report
31 December 2020
Notes to the Financial Statements
as at 31 December 2020 (continued)
Sub-Fund Class
Schroder SSF Sterling Liquidity Plus Class C AccClass C DisClass I AccClass I DisClass S AccClass S DisClass X AccClass X1 AccClass X2 Acc
Initial ChargesDuring the year under review, an initial charge of up to 2% of the Net Asset Value per share was attributable to the A Classes of Schroder SSF Wealth Management USD Cautious*, Schroder SSF Wealth Management USD Balanced* and Schroder SSF Wealth Management USD Growth* up to 2.04081% of the Net Asset Value per share was attributable to the A Classes of Schroder SSF Fixed Maturity Bond I, Schroder SSF Fixed Maturity Bond 2021 (II), Schroder SSF Fixed Maturity Bond 2023 (I), Schroder SSF Fixed Maturity Bond II, Schroder SSF Fixed Maturity Bond III, Schroder SSF Fixed Maturity Bond IV, Schroder SSF Fixed Maturity Bond V*, Schroder SSF Fixed Maturity Bond VI* and Schroder SSF Fixed Maturity Bond 2022. There are no other initial charges attributable to any other classes of shares available for investment within the Company.
Redemption ChargesDuring the year under review, a redemption charge of up to 0.25% of the Net Asset Value per share was attributable to Schroder SSF Fixed Maturity Bond 2021 (II), up to 0.50% of the Net Asset Value per share was attributable to Schroder SSF Multi-Asset Dynamic, up to 1.50% of the Net Asset Value per share was attributable to Schroder SSF Fixed Maturity Bond II, up to 2.00% of the Net Asset Value per share was attributable to Schroder SSF Fixed Maturity Bond IV and Schroder SSF Fixed Maturity Bond V*. No redemption charge will be payable on redemptions after the end of the principal investment period. Further details on the conditions under which redemption charges are calculated can be found in the current Prospectus.
Minimum Subscription Amount, Minimum Additional Subscription Amount and Minimum Holding AmountThe minimum subscription amounts, minimum additional subscription amount and minimum holding amount for each class are set out in the following table. The amount is stated in the relevant currency of the classes although near equivalent amounts in any other freely convertible currencies are acceptable. These minima may be waived at the Director’s discretion from time to time.
Sub-Funds and Share ClassesMinimum Initial
SubscriptionMinimum Additional
Subscription Minimum Holding
Schroder SSF Diversified Alternative AssetsClass S Acc No Minimum Amount No Minimum Amount No Minimum AmountClass S Dis No Minimum Amount No Minimum Amount No Minimum AmountClass S Dis EUR Hedged SV No Minimum Amount No Minimum Amount No Minimum AmountClass S Dis USD Hedged No Minimum Amount No Minimum Amount No Minimum Amount
Schroder SSF Fixed Maturity Bond IClass A Acc USD 1,000 USD 1,000 USD 1,000Class A Acc HKD USD 1,000 USD 1,000 USD 1,000Class A Acc SGD Hedged USD 1,000 USD 1,000 USD 1,000Class A Dis USD 1,000 USD 1,000 USD 1,000Class A Dis EUR Hedged USD 1,000 USD 1,000 USD 1,000Class A Dis GBP Hedged USD 1,000 USD 1,000 USD 1,000Class A Dis HKD USD 1,000 USD 1,000 USD 1,000Class A Dis SGD Hedged USD 1,000 USD 1,000 USD 1,000Class A1 Acc USD 500,000 USD 250,000 USD 500,000Class A1 Acc HKD USD 500,000 USD 250,000 USD 500,000Class A1 Acc SGD Hedged USD 500,000 USD 250,000 USD 500,000Class A1 Dis USD 500,000 USD 250,000 USD 500,000Class A1 Dis HKD USD 500,000 USD 250,000 USD 500,000Class A1 Dis SGD Hedged USD 500,000 USD 250,000 USD 500,000Class A2 Acc USD 1,000 USD 1,000 USD 1,000Class A2 Dis USD 1,000 USD 1,000 USD 1,000Class A2 Dis EUR Hedged USD 1,000 USD 1,000 USD 1,000
Classes of Shares (continued)
* Please refer to the Directors’ Report for details of all corporate actions that occurred during the year under review.

80Schroder Special Situations Fund Audited Annual Report
31 December 2020
Notes to the Financial Statements
as at 31 December 2020 (continued)
Sub-Funds and Share ClassesMinimum Initial
SubscriptionMinimum Additional
Subscription Minimum Holding
Schroder SSF Fixed Maturity Bond I (continued)Class A2 Dis GBP Hedged USD 1,000 USD 1,000 USD 1,000
Schroder SSF Fixed Maturity Bond 2021 (II)Class A Dis USD 1,000 USD 1,000 USD 1,000Class A Dis HKD USD 1,000 USD 1,000 USD 1,000Class A Dis SGD Hedged USD 1,000 USD 1,000 USD 1,000
Schroder SSF Fixed Maturity Bond 2023 (I)Class A Acc USD 1,000 USD 1,000 USD 1,000Class A Dis USD 1,000 USD 1,000 USD 1,000Class A Dis SGD Hedged USD 1,000 USD 1,000 USD 1,000Class A1 Dis USD 1,000 USD 1,000 USD 1,000
Schroder SSF Fixed Maturity Bond IIClass A Acc USD 1,000 USD 1,000 USD 1,000Class A Acc EUR Hedged USD 1,000 USD 1,000 USD 1,000Class A Dis USD 1,000 USD 1,000 USD 1,000Class A Dis EUR Hedged USD 1,000 USD 1,000 USD 1,000Class A1 Acc USD 500,000 USD 250,000 USD 500,000Class A1 Acc EUR Hedged USD 500,000 USD 250,000 USD 500,000Class A1 Dis USD 500,000 USD 250,000 USD 500,000Class A1 Dis EUR Hedged USD 500,000 USD 250,000 USD 500,000Class A1 Dis GBP Hedged USD 500,000 USD 250,000 USD 500,000Class A2 Acc USD 1,000 USD 1,000 USD 1,000Class A2 Dis USD 1,000 USD 1,000 USD 1,000Class A2 Dis GBP Hedged USD 1,000 USD 1,000 USD 1,000Class A2 Dis HKD USD 1,000 USD 1,000 USD 1,000Class A2 Dis SGD Hedged USD 1,000 USD 1,000 USD 1,000
Schroder SSF Fixed Maturity Bond IIIClass A Acc USD 1,000 USD 1,000 USD 1,000Class A Acc HKD USD 1,000 USD 1,000 USD 1,000Class A Acc SGD Hedged USD 1,000 USD 1,000 USD 1,000Class A Dis USD 1,000 USD 1,000 USD 1,000Class A Dis EUR Hedged USD 1,000 USD 1,000 USD 1,000Class A Dis HKD USD 1,000 USD 1,000 USD 1,000Class A Dis SGD Hedged USD 1,000 USD 1,000 USD 1,000Class A1 Acc USD 500,000 USD 250,000 USD 500,000Class A1 Dis USD 500,000 USD 250,000 USD 500,000Class A1 Dis EUR Hedged USD 500,000 USD 250,000 USD 500,000Class A2 Acc USD 1,000 USD 1,000 USD 1,000Class A2 Dis USD 1,000 USD 1,000 USD 1,000Class A2 Dis EUR Hedged USD 0.00001 USD 0.00001 USD 0Class A2 Dis GBP Hedged USD 1,000 USD 1,000 USD 1,000
Schroder SSF Fixed Maturity Bond IVClass A Acc USD 1,000 USD 1,000 USD 1,000Class A Acc EUR Hedged USD 1,000 USD 1,000 USD 1,000Class A Dis USD 1,000 USD 1,000 USD 1,000Class A Dis EUR Hedged USD 1,000 USD 1,000 USD 1,000Class A1 Acc USD 500,000 USD 250,000 USD 500,000
Minimum Subscription Amount, Minimum Additional Subscription Amount and Minimum Holding Amount (continued)

81Schroder Special Situations Fund Audited Annual Report
31 December 2020
Notes to the Financial Statements
as at 31 December 2020 (continued)
Sub-Funds and Share ClassesMinimum Initial
SubscriptionMinimum Additional
Subscription Minimum Holding
Schroder SSF Fixed Maturity Bond IV (continued)Class A1 Acc EUR Hedged USD 500,000 USD 250,000 USD 500,000Class A1 Dis USD 500,000 USD 250,000 USD 500,000Class A1 Dis EUR Hedged USD 500,000 USD 250,000 USD 500,000Class A1 Dis GBP Hedged USD 500,000 USD 250,000 USD 500,000Class A2 Acc USD 1,000 USD 1,000 USD 1,000Class A2 Dis USD 1,000 USD 1,000 USD 1,000Class A2 Dis GBP Hedged USD 1,000 USD 1,000 USD 1,000Class A2 Dis HKD USD 1,000 USD 1,000 USD 1,000Class A2 Dis SGD Hedged USD 1,000 USD 1,000 USD 1,000
Schroder SSF Fixed Maturity Bond V*
Class A Acc USD 1,000 USD 1,000 USD 1,000Class A Acc EUR Hedged USD 1,000 USD 1,000 USD 1,000Class A Dis USD 1,000 USD 1,000 USD 1,000Class A Dis EUR Hedged USD 1,000 USD 1,000 USD 1,000Class A1 Acc USD 500,000 USD 250,000 USD 500,000Class A1 Acc EUR Hedged USD 500,000 USD 250,000 USD 500,000Class A1 Dis USD 500,000 USD 250,000 USD 500,000Class A1 Dis EUR Hedged USD 500,000 USD 250,000 USD 500,000Class A1 Dis GBP Hedged USD 500,000 USD 250,000 USD 500,000Class A2 Acc USD 1,000 USD 1,000 USD 1,000Class A2 Dis USD 1,000 USD 1,000 USD 1,000Class A2 Dis GBP Hedged USD 1,000 USD 1,000 USD 1,000Class A2 Dis HKD USD 1,000 USD 1,000 USD 1,000Class A2 Dis SGD Hedged USD 1,000 USD 1,000 USD 1,000
Schroder SSF Fixed Maturity Bond VI*
Class A Acc USD 1,000 USD 1,000 USD 1,000Class A Dis USD 1,000 USD 1,000 USD 1,000Class A Dis SGD Hedged USD 1,000 USD 1,000 USD 1,000Class A1 Dis USD 500,000 USD 250,000 USD 500,000
Schroder SSF Fixed Maturity Bond 2022Class A Acc USD 1,000 USD 1,000 USD 1,000Class A Dis USD 1,000 USD 1,000 USD 1,000Class A Dis SGD Hedged USD 1,000 USD 1,000 USD 1,000
Schroder SSF International EquityClass I Acc USD 5,000,000 USD 2,500,000 USD 5,000,000
Schroder SSF Managed Wealth PortfolioClass S Acc No Minimum Amount No Minimum Amount No Minimum AmountClass S Dis No Minimum Amount No Minimum Amount No Minimum Amount
Schroder SSF Multi-Asset DynamicClass A Acc EUR 1,000 EUR 1,000 EUR 1,000
Minimum Subscription Amount, Minimum Additional Subscription Amount and Minimum Holding Amount (continued)

82Schroder Special Situations Fund Audited Annual Report
31 December 2020
Notes to the Financial Statements
as at 31 December 2020 (continued)
Sub-Funds and Share ClassesMinimum Initial
SubscriptionMinimum Additional
Subscription Minimum Holding
Schroder SSF Wealth Management USD Cautious*
Class A Acc USD 250,000 USD 50,000 USD 250,000Class A Acc SGD Hedged USD 250,000 USD 50,000 USD 250,000Class S Acc No Minimum Amount No Minimum Amount No Minimum Amount
Schroder SSF Wealth Management USD Balanced*
Class A Acc USD 250,000 USD 50,000 USD 250,000Class A Acc SGD Hedged USD 250,000 USD 50,000 USD 250,000Class S Acc No Minimum Amount No Minimum Amount No Minimum Amount
Schroder SSF Wealth Management USD Growth*
Class A Acc USD 250,000 USD 50,000 USD 250,000Class A Acc SGD Hedged USD 250,000 USD 50,000 USD 250,000Class S Acc No Minimum Amount No Minimum Amount No Minimum Amount
Schroder SSF Sterling Liquidity PlusClass C Acc GBP 300,000 GBP 150,000 GBP 300,000Class C Dis GBP 300,000 GBP 150,000 GBP 300,000Class I Acc GBP 3,000,000 GBP 1,500,000 GBP 3,000,000Class I Dis GBP 3,000,000 GBP 1,500,000 GBP 3,000,000Class S Acc No Minimum Amount No Minimum Amount No Minimum AmountClass S Dis No Minimum Amount No Minimum Amount No Minimum AmountClass X Acc GBP 25,000,000 GBP 12,500,000 GBP 25,000,000Class X1 Acc GBP 300,000 GBP 150,000 GBP 300,000Class X2 Acc GBP 25,000,000 GBP 12,500,000 GBP 25,000,000
Accounting PoliciesSummary of Significant Accounting PoliciesThe financial statements are prepared and presented in accordance with generally accepted accounting principles in Luxembourg for investment funds on a going concern basis.
Net Asset ValueCalculation of Net Asset Value per ShareThe Net Asset Value (‘NAV’) per Share of each Class is calculated on each Dealing Day in the currency of the relevant class. It is calculated by dividing the NAV attributable to each Class, being the proportionate value of its assets less its liabilities, by the number of Shares of such Class then in issue. The resulting sum is rounded to the nearest up to four decimal places. Further details on rules that apply in valuing total assets can be found in the current prospectus.
Valuation of the Assets of the CompanyThe value of securities, derivative instruments and assets is determined on the basis of the last available price on the stock exchange or any other regulated market on which those securities or assets are traded or admitted for trading. Where such securities or other assets are quoted or dealt in on more than one stock exchange or any other regulated market, the Directors shall make regulations for the order of priority in which stock exchanges or other regulated markets shall be used for the provision of prices of securities or other assets.If a security is not traded on or admitted to any official stock exchange or any other regulated market or, in the case of securities so traded or admitted, the last available price does not reflect their true value, the Directors are required to proceed on the basis of their expected sales price, which shall be valued with prudence and in good faith.The value of any cash in hand or on deposit, bills and demand notes and accounts receivable, prepaid expenses, cash dividends and interest declared or accrued as aforesaid and not yet received shall be deemed to be the full amount thereof, unless in any case the same is unlikely to be paid or received in full, in which case the value thereof shall be arrived at after making such discount as the Company may consider appropriate in such case to reflect the true value thereof.Financial derivative instruments, which are not listed on any official stock exchange or any other regulated market, are valued in accordance with market practice. The swaps are valued at their fair value based on the underlying securities at close of business or intraday) as well as on the characteristics of the underlying commitments.
Minimum Subscription Amount, Minimum Additional Subscription Amount and Minimum Holding Amount (continued)
* Please refer to the Directors’ Report for details of all corporate actions that occurred during the year under review.
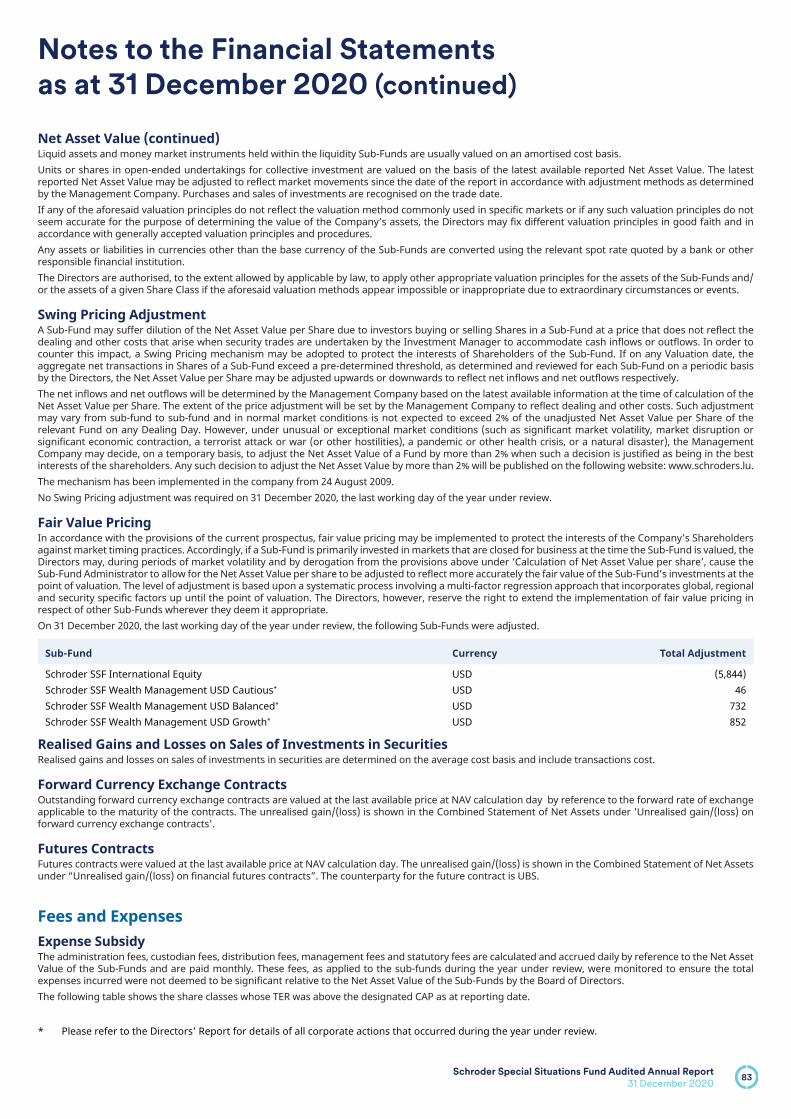
83Schroder Special Situations Fund Audited Annual Report
31 December 2020
Notes to the Financial Statements
as at 31 December 2020 (continued)
Liquid assets and money market instruments held within the liquidity Sub-Funds are usually valued on an amortised cost basis.Units or shares in open-ended undertakings for collective investment are valued on the basis of the latest available reported Net Asset Value. The latest reported Net Asset Value may be adjusted to reflect market movements since the date of the report in accordance with adjustment methods as determined by the Management Company. Purchases and sales of investments are recognised on the trade date. If any of the aforesaid valuation principles do not reflect the valuation method commonly used in specific markets or if any such valuation principles do not seem accurate for the purpose of determining the value of the Company’s assets, the Directors may fix different valuation principles in good faith and in accordance with generally accepted valuation principles and procedures. Any assets or liabilities in currencies other than the base currency of the Sub-Funds are converted using the relevant spot rate quoted by a bank or other responsible financial institution.The Directors are authorised, to the extent allowed by applicable by law, to apply other appropriate valuation principles for the assets of the Sub-Funds and/or the assets of a given Share Class if the aforesaid valuation methods appear impossible or inappropriate due to extraordinary circumstances or events.
Swing Pricing AdjustmentA Sub-Fund may suffer dilution of the Net Asset Value per Share due to investors buying or selling Shares in a Sub-Fund at a price that does not reflect the dealing and other costs that arise when security trades are undertaken by the Investment Manager to accommodate cash inflows or outflows. In order to counter this impact, a Swing Pricing mechanism may be adopted to protect the interests of Shareholders of the Sub-Fund. If on any Valuation date, the aggregate net transactions in Shares of a Sub-Fund exceed a pre-determined threshold, as determined and reviewed for each Sub-Fund on a periodic basis by the Directors, the Net Asset Value per Share may be adjusted upwards or downwards to reflect net inflows and net outflows respectively.The net inflows and net outflows will be determined by the Management Company based on the latest available information at the time of calculation of the Net Asset Value per Share. The extent of the price adjustment will be set by the Management Company to reflect dealing and other costs. Such adjustment may vary from sub-fund to sub-fund and in normal market conditions is not expected to exceed 2% of the unadjusted Net Asset Value per Share of the relevant Fund on any Dealing Day. However, under unusual or exceptional market conditions (such as significant market volatility, market disruption or significant economic contraction, a terrorist attack or war (or other hostilities), a pandemic or other health crisis, or a natural disaster), the Management Company may decide, on a temporary basis, to adjust the Net Asset Value of a Fund by more than 2% when such a decision is justified as being in the best interests of the shareholders. Any such decision to adjust the Net Asset Value by more than 2% will be published on the following website: www.schroders.lu.The mechanism has been implemented in the company from 24 August 2009.No Swing Pricing adjustment was required on 31 December 2020, the last working day of the year under review.
Fair Value Pricing In accordance with the provisions of the current prospectus, fair value pricing may be implemented to protect the interests of the Company’s Shareholders against market timing practices. Accordingly, if a Sub-Fund is primarily invested in markets that are closed for business at the time the Sub-Fund is valued, the Directors may, during periods of market volatility and by derogation from the provisions above under ‘Calculation of Net Asset Value per share’, cause the Sub-Fund Administrator to allow for the Net Asset Value per share to be adjusted to reflect more accurately the fair value of the Sub-Fund’s investments at the point of valuation. The level of adjustment is based upon a systematic process involving a multi-factor regression approach that incorporates global, regional and security specific factors up until the point of valuation. The Directors, however, reserve the right to extend the implementation of fair value pricing in respect of other Sub-Funds wherever they deem it appropriate. On 31 December 2020, the last working day of the year under review, the following Sub-Funds were adjusted.
Sub-Fund Currency Total Adjustment
Schroder SSF International Equity USD (5,844)Schroder SSF Wealth Management USD Cautious* USD 46Schroder SSF Wealth Management USD Balanced* USD 732Schroder SSF Wealth Management USD Growth* USD 852
Realised Gains and Losses on Sales of Investments in SecuritiesRealised gains and losses on sales of investments in securities are determined on the average cost basis and include transactions cost.
Forward Currency Exchange ContractsOutstanding forward currency exchange contracts are valued at the last available price at NAV calculation day by reference to the forward rate of exchange applicable to the maturity of the contracts. The unrealised gain/(loss) is shown in the Combined Statement of Net Assets under 'Unrealised gain/(loss) on forward currency exchange contracts'.
Futures ContractsFutures contracts were valued at the last available price at NAV calculation day. The unrealised gain/(loss) is shown in the Combined Statement of Net Assets under “Unrealised gain/(loss) on financial futures contracts”. The counterparty for the future contract is UBS.
.Fees and Expenses Expense SubsidyThe administration fees, custodian fees, distribution fees, management fees and statutory fees are calculated and accrued daily by reference to the Net Asset Value of the Sub-Funds and are paid monthly. These fees, as applied to the sub-funds during the year under review, were monitored to ensure the total expenses incurred were not deemed to be significant relative to the Net Asset Value of the Sub-Funds by the Board of Directors.The following table shows the share classes whose TER was above the designated CAP as at reporting date.
Net Asset Value (continued)
* Please refer to the Directors’ Report for details of all corporate actions that occurred during the year under review.

84Schroder Special Situations Fund Audited Annual Report
31 December 2020
Notes to the Financial Statements
as at 31 December 2020 (continued)
Sub-Fund Classes TER Cap
Schroder SSF Diversified Alternative Assets Class S Dis EUR Hedged 0.20%Schroder SSF Fixed Maturity Bond 2023 (I) Class A Acc 0.52%Schroder SSF Fixed Maturity Bond 2023 (I) Class A Dis 0.52%Schroder SSF Fixed Maturity Bond 2023 (I) Class A Dis SGD Hedged 0.52%Schroder SSF Fixed Maturity Bond 2023 (I) Class A1 Dis 0.42%Schroder SSF Fixed Maturity Bond VI* Class A Acc 0.57%Schroder SSF Fixed Maturity Bond VI* Class A Dis 0.57%Schroder SSF Fixed Maturity Bond VI* Class A Dis SGD Hedged 0.60%Schroder SSF Fixed Maturity Bond VI* Class A1 Dis 0.42%Schroder SSF Fixed Maturity Bond 2022 Class A Acc 0.55%Schroder SSF Fixed Maturity Bond 2022 Class A Dis 0.55%Schroder SSF Fixed Maturity Bond 2022 Class A Dis SGD Hedged 0.55%Schroder SSF Sterling Liquidity Plus Class X Acc 0.02%Schroder SSF Sterling Liquidity Plus Class X2 Acc 0.52%
The following table shows the share classes whose TER was below the designated CAP as at reporting date. Y
Sub-Fund Classes TER Cap
Schroder SSF Diversified Alternative Assets Class S Acc 0.20%Schroder SSF Diversified Alternative Assets Class S Dis 0.20%Schroder SSF Diversified Alternative Assets Class S Dis USD Hedged 0.20%Schroder SSF Fixed Maturity Bond I Class A Acc 0.90%Schroder SSF Fixed Maturity Bond I Class A Acc HKD 0.90%Schroder SSF Fixed Maturity Bond I Class A Dis 0.90%Schroder SSF Fixed Maturity Bond I Class A Dis EUR Hedged 0.93%Schroder SSF Fixed Maturity Bond I Class A Dis GBP Hedged 0.93%Schroder SSF Fixed Maturity Bond I Class A Dis HKD 0.90%Schroder SSF Fixed Maturity Bond I Class A1 Acc 0.65%Schroder SSF Fixed Maturity Bond I Class A1 Acc HKD 0.65%Schroder SSF Fixed Maturity Bond I Class A1 Acc SGD Hedged 0.65%Schroder SSF Fixed Maturity Bond I Class A1 Dis 0.65%Schroder SSF Fixed Maturity Bond I Class A1 Dis HKD 0.65%Schroder SSF Fixed Maturity Bond I Class A1 Dis SGD Hedged 0.65%Schroder SSF Fixed Maturity Bond I Class A2 Acc 0.50%Schroder SSF Fixed Maturity Bond I Class A2 Dis 0.50%Schroder SSF Fixed Maturity Bond I Class A2 Dis EUR Hedged 0.53%Schroder SSF Fixed Maturity Bond I Class A2 Dis GBP Hedged 0.53%Schroder SSF Fixed Maturity Bond 2021 (II) Class A Dis 0.60%Schroder SSF Fixed Maturity Bond 2021 (II) Class A Dis HKD 0.60%Schroder SSF Fixed Maturity Bond 2021 (II) Class A Dis SGD Hedged 0.60%
Operating ExpensesThe Sub-Funds pays other Operating expenses incurred in the operation of the Company which are composed of statutory fees and are mainly audit, legal and publication fees, please refer to the 'Operating Expenses’ shown in the Combined Statement of Operations and Change in Net Assets.
Depositary and Administration FeesThe Depositary and Sub-Fund Administrator are entitled to fees for related services rendered in accordance with common practice in Luxembourg, payable monthly, out of the net assets of the Sub-Fund.
Directors’ FeesFor the year from 1 January 2020 to 31 December 2020 Daniel de Fernando Garcia received in remuneration the amount of EUR 7,473 per annum, Hugh Mullan received in remuneration the amount of EUR 10,505 per annum. Eric Bertrand, Marie-Jeanne Chevremont-Lorenzini and Bernard Herman each received EUR 20,167 in remuneration per annum.
* Please refer to the Directors’ Report for details of all corporate actions that occurred during the year under review.

85Schroder Special Situations Fund Audited Annual Report
31 December 2020
Notes to the Financial Statements
as at 31 December 2020 (continued)
The remaining directors have waived their remuneration.
Management FeesThe Investment Managers are entitled to receive management fees for their services, which are calculated and accrued daily by reference to the Net Asset Value of the Sub-funds and are paid monthly. The actual rates payable as at 31 December 2020, which vary from Sub-Fund to Sub-Fund and from share class to share class are set out in the table on pages 87-88.
Performance FeesNo performance fees were payable for the financial year under review.
Taxation The Company is not subject to any taxes in Luxembourg on income or capital gains. The only tax to which the Company in Luxembourg is subject is the ‘taxe d’abonnement’ to a rate of 0.05% per annum based on the net asset value of each Sub-Fund at the end of the relevant quarter, calculated and paid quarterly. In respect of any Share Class or Sub-Fund which comprises only institutional Investors (within the meaning of article 174 of the Law of 17 December 2010), the tax levied will be at the rate of 0.01% per annum. Interest and dividend income received by the Company may be subject to non-recoverable withholding tax in the source countries. The Company may further be subject to tax on the realised or unrealised capital appreciation of its assets in the countries of origin, and provisions in this respect may be recognised in certain jurisdictions..
Disclosure of Transaction CostsThe transaction costs are broker commission fees and taxes related to the purchase and sale of transferable securities. Custodian transaction costs are not included in this table, please refer to the Depository Fees’ shown in the Combined Statement of Operations and Change in Net Assets which includes custody transaction costs that represent fixed rate charges per market levied by the custodian for the servicing of portfolio transactions. Bond Sub-Funds will generally show the figure of zero as the broker commission fees are included in the spread, which is excluded from the calculation pursuant to Annex I, Schedule B, Chapter V of Directive 2009/65/EC of the European Parliament. The transactions costs for the year under review are as follows:
Sub-Funds Sub-Funds Currency Total Transaction Costs
Schroder SSF Diversified Alternative Assets GBP 156,570Schroder SSF Fixed Maturity Bond I USD –Schroder SSF Fixed Maturity Bond 2021 (II) USD –Schroder SSF Fixed Maturity Bond 2023 (I) USD –Schroder SSF Fixed Maturity Bond II USD –Schroder SSF Fixed Maturity Bond III USD –Schroder SSF Fixed Maturity Bond IV USD –Schroder SSF Fixed Maturity Bond V* USD –Schroder SSF Fixed Maturity Bond VI* USD –Schroder SSF Fixed Maturity Bond 2022 USD –Schroder SSF International Equity USD 12,119Schroder SSF Managed Wealth Portfolio GBP 7,333Schroder SSF Multi-Asset Dynamic EUR –Schroder SSF Wealth Management USD Cautious* USD 4,255Schroder SSF Wealth Management USD Balanced* USD 10,575Schroder SSF Wealth Management USD Growth* USD 7,717Schroder SSF Sterling Liquidity Plus GBP –
Cross Sub-Fund investmentAs at 31 December 2020, the total cross Sub-Fund investment amounts to EUR 1,017,633 and therefore, the total combined NAV at the year end without cross Sub-Fund investments would amount to EUR 7,979,481,342. The details of the cross Sub-Fund investments are disclosed in the following table:
InvestmentSub-Funds
CurrencyMarket
Value % of net
assets
Schroder SSF Managed Wealth PortfolioSchroder SSF Diversified Alternative Assets - Class S Dist GBP 915,815 1.12
GBP 915,815 1.12
Directors’ Fees (continued)
* Please refer to the Directors’ Report for details of all corporate actions that occurred during the year under review.

86Schroder Special Situations Fund Audited Annual Report
31 December 2020
Notes to the Financial Statements
as at 31 December 2020 (continued)
Exchange RatesThe exchange rate used for the calculation of the combined total in EUR of the Financial Statements as at reporting date.
Currency Rate
EUR = 1GBP 0.8999USD 1.2285
Changes in the Sub-Funds A list, specifying the total purchases and sales for each sub-fund, which took place during the year under review may be obtained free of charge upon request at the registered office of the Company.
Subsequent EventsOn 8 January 2021, the following share classes were liquidated.
Schroder SSF Fixed Maturity Bond I Class A Acc HKDSchroder SSF Fixed Maturity Bond I Class A Acc SGD HedgedSchroder SSF Fixed Maturity Bond I Class A Dis SGD HedgedSchroder SSF Fixed Maturity Bond I Class A1 Acc HKDSchroder SSF Fixed Maturity Bond I Class A1 Acc SGD HedgedSchroder SSF Fixed Maturity Bond I Class A1 Dis HKDSchroder SSF Fixed Maturity Bond I Class A1 Dis SGD HedgedSchroder SSF Fixed Maturity Bond II Class A1 Dis GBP HedgedSchroder SSF Fixed Maturity Bond III Class A Acc HKDSchroder SSF Fixed Maturity Bond III Class A Acc SGD Hedged
On 19 January 2021, the following share classes were liquidated.
Schroder SSF Fixed Maturity Bond III Class A Dis EUR HedgedSchroder SSF Fixed Maturity Bond III Class A Dis HKDSchroder SSF Fixed Maturity Bond III Class A Dis SGD HedgedSchroder SSF Fixed Maturity Bond III Class A1 DisSchroder SSF Fixed Maturity Bond III Class A1 Dis EUR HedgedSchroder SSF Fixed Maturity Bond V Class A Acc EUR HedgedSchroder SSF Fixed Maturity Bond V Class A1 Acc EUR HedgedSchroder SSF Fixed Maturity Bond V Class A1 Dis EUR HedgedSchroder SSF Fixed Maturity Bond V Class A1 Dis GBP HedgedSchroder SSF Fixed Maturity Bond V Class A2 Acc
On 25 January 2021, the following share classes were liquidated.
Schroder SSF Fixed Maturity Bond IV Class A Acc EUR HedgedSchroder SSF Fixed Maturity Bond IV Class A1 Acc EUR HedgedSchroder SSF Fixed Maturity Bond IV Class A1 Dis EUR HedgedSchroder SSF Fixed Maturity Bond IV Class A1 Dis GBP HedgedSchroder SSF Fixed Maturity Bond IV Class A2 Dis HKDSchroder SSF Fixed Maturity Bond IV Class A2 Dis SGD HedgedSchroder SSF Fixed Maturity Bond V Class A2 Dis GBP HedgedSchroder SSF Fixed Maturity Bond V Class A2 Dis HKDSchroder SSF Fixed Maturity Bond V Class A2 Dis SGD Hedged
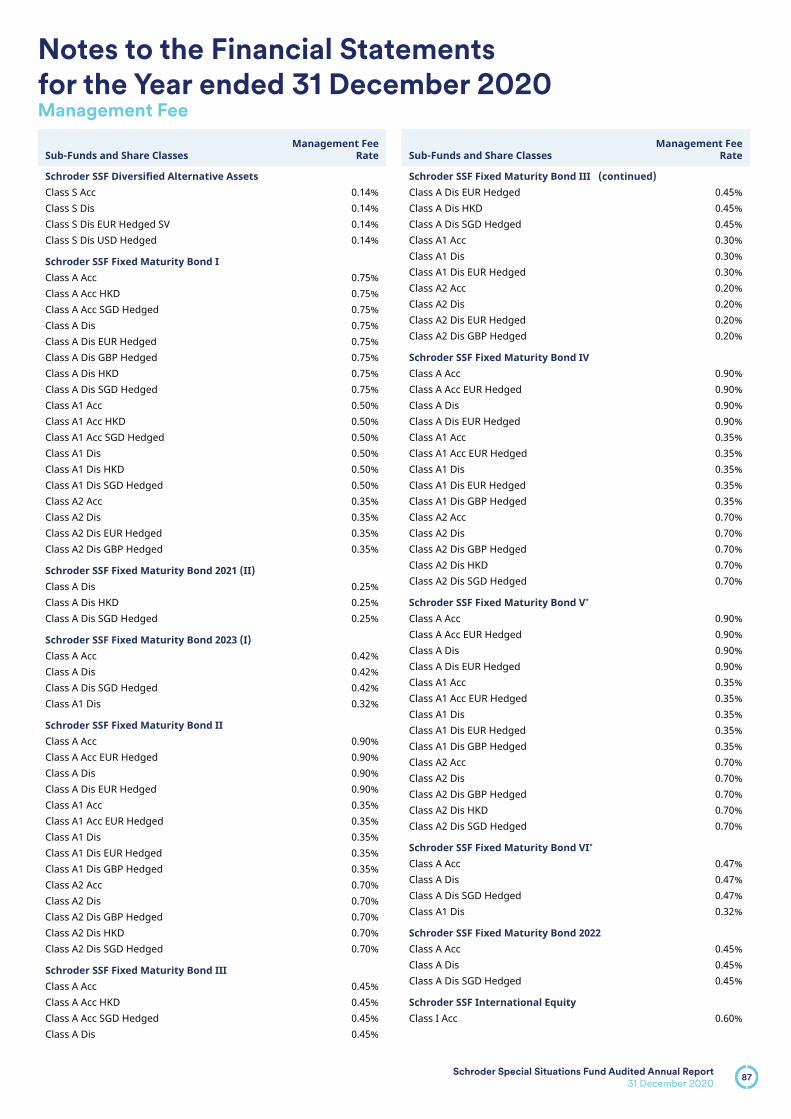
87Schroder Special Situations Fund Audited Annual Report
31 December 2020
Notes to the Financial Statements
for the Year ended 31 December 2020Management Fee
Sub-Funds and Share ClassesManagement Fee
Rate
Schroder SSF Diversified Alternative Assets Class S Acc 0.14%Class S Dis 0.14%Class S Dis EUR Hedged SV 0.14%Class S Dis USD Hedged 0.14%
Schroder SSF Fixed Maturity Bond I Class A Acc 0.75%Class A Acc HKD 0.75%Class A Acc SGD Hedged 0.75%Class A Dis 0.75%Class A Dis EUR Hedged 0.75%Class A Dis GBP Hedged 0.75%Class A Dis HKD 0.75%Class A Dis SGD Hedged 0.75%Class A1 Acc 0.50%Class A1 Acc HKD 0.50%Class A1 Acc SGD Hedged 0.50%Class A1 Dis 0.50%Class A1 Dis HKD 0.50%Class A1 Dis SGD Hedged 0.50%Class A2 Acc 0.35%Class A2 Dis 0.35%Class A2 Dis EUR Hedged 0.35%Class A2 Dis GBP Hedged 0.35%
Schroder SSF Fixed Maturity Bond 2021 (II) Class A Dis 0.25%Class A Dis HKD 0.25%Class A Dis SGD Hedged 0.25%
Schroder SSF Fixed Maturity Bond 2023 (I) Class A Acc 0.42%Class A Dis 0.42%Class A Dis SGD Hedged 0.42%Class A1 Dis 0.32%
Schroder SSF Fixed Maturity Bond II Class A Acc 0.90%Class A Acc EUR Hedged 0.90%Class A Dis 0.90%Class A Dis EUR Hedged 0.90%Class A1 Acc 0.35%Class A1 Acc EUR Hedged 0.35%Class A1 Dis 0.35%Class A1 Dis EUR Hedged 0.35%Class A1 Dis GBP Hedged 0.35%Class A2 Acc 0.70%Class A2 Dis 0.70%Class A2 Dis GBP Hedged 0.70%Class A2 Dis HKD 0.70%Class A2 Dis SGD Hedged 0.70%
Schroder SSF Fixed Maturity Bond III Class A Acc 0.45%Class A Acc HKD 0.45%Class A Acc SGD Hedged 0.45%Class A Dis 0.45%
Sub-Funds and Share ClassesManagement Fee
Rate
Schroder SSF Fixed Maturity Bond III (continued)Class A Dis EUR Hedged 0.45%Class A Dis HKD 0.45%Class A Dis SGD Hedged 0.45%Class A1 Acc 0.30%Class A1 Dis 0.30%Class A1 Dis EUR Hedged 0.30%Class A2 Acc 0.20%Class A2 Dis 0.20%Class A2 Dis EUR Hedged 0.20%Class A2 Dis GBP Hedged 0.20%
Schroder SSF Fixed Maturity Bond IV Class A Acc 0.90%Class A Acc EUR Hedged 0.90%Class A Dis 0.90%Class A Dis EUR Hedged 0.90%Class A1 Acc 0.35%Class A1 Acc EUR Hedged 0.35%Class A1 Dis 0.35%Class A1 Dis EUR Hedged 0.35%Class A1 Dis GBP Hedged 0.35%Class A2 Acc 0.70%Class A2 Dis 0.70%Class A2 Dis GBP Hedged 0.70%Class A2 Dis HKD 0.70%Class A2 Dis SGD Hedged 0.70%
Schroder SSF Fixed Maturity Bond V* Class A Acc 0.90%Class A Acc EUR Hedged 0.90%Class A Dis 0.90%Class A Dis EUR Hedged 0.90%Class A1 Acc 0.35%Class A1 Acc EUR Hedged 0.35%Class A1 Dis 0.35%Class A1 Dis EUR Hedged 0.35%Class A1 Dis GBP Hedged 0.35%Class A2 Acc 0.70%Class A2 Dis 0.70%Class A2 Dis GBP Hedged 0.70%Class A2 Dis HKD 0.70%Class A2 Dis SGD Hedged 0.70%
Schroder SSF Fixed Maturity Bond VI* Class A Acc 0.47%Class A Dis 0.47%Class A Dis SGD Hedged 0.47%Class A1 Dis 0.32%
Schroder SSF Fixed Maturity Bond 2022 Class A Acc 0.45%Class A Dis 0.45%Class A Dis SGD Hedged 0.45%
Schroder SSF International Equity Class I Acc 0.60%

88Schroder Special Situations Fund Audited Annual Report
31 December 2020
Notes to the Financial Statements
for the Year ended 31 December 2020 (continued)Management Fee
Sub-Funds and Share ClassesManagement Fee
Rate
Schroder SSF Managed Wealth Portfolio Class S Acc 0.38%Class S Dis 0.38%
Schroder SSF Multi-Asset Dynamic Class A Acc 1.00%
Schroder SSF Wealth Management USD Cautious* Class A Acc 0.95%Class A Acc SGD Hedged 0.95%Class S Acc 0.48%
Schroder SSF Wealth Management USD Balanced* Class A Acc 1.10%Class A Acc SGD Hedged 1.10%Class S Acc 0.55%
Schroder SSF Wealth Management USD Growth* Class A Acc 1.25%Class A Acc SGD Hedged 1.25%Class S Acc 0.63%
Schroder SSF Sterling Liquidity Plus Class C Acc 0.10%Class C Dis 0.10%Class I Acc 0.00%Class I Dis 0.00%Class S Acc 0.06%Class S Dis 0.06%Class X Acc 0.00%Class X1 Acc 0.04%Class X2 Acc 0.50%
* Please refer to the Directors’ Report for details of all corporate actions that occurred during the year under review.

89Schroder Special Situations Fund Audited Annual Report
31 December 2020
Total Expense Ratio (the “TER”)
for the Year ended 31 December 2020
Sub-Funds and Share Classes TER
Schroder SSF Diversified Alternative Assets Class S Acc 0.19%Class S Dis 0.19%Class S Dis EUR Hedged SV 0.22%Class S Dis USD Hedged 0.19%
Schroder SSF Fixed Maturity Bond I Class A Acc 0.88%Class A Acc HKD 0.82%Class A Acc SGD Hedged 0.90%Class A Dis 0.88%Class A Dis EUR Hedged 0.91%Class A Dis GBP Hedged 0.91%Class A Dis HKD 0.88%Class A Dis SGD Hedged 0.90%Class A1 Acc 0.63%Class A1 Acc HKD 0.57%Class A1 Acc SGD Hedged 0.64%Class A1 Dis 0.63%Class A1 Dis HKD 0.57%Class A1 Dis SGD Hedged 0.64%Class A2 Acc 0.48%Class A2 Dis 0.48%Class A2 Dis EUR Hedged 0.51%Class A2 Dis GBP Hedged 0.51%
Schroder SSF Fixed Maturity Bond 2021 (II) Class A Dis 0.59%Class A Dis HKD 0.60%Class A Dis SGD Hedged 0.59%
Schroder SSF Fixed Maturity Bond 2023 (I) Class A Acc 0.55%Class A Dis 0.55%Class A Dis SGD Hedged 0.55%Class A1 Dis 0.45%
Schroder SSF Fixed Maturity Bond II Class A Acc 1.03%Class A Acc EUR Hedged 1.06%Class A Dis 1.03%Class A Dis EUR Hedged 1.06%Class A1 Acc 0.48%Class A1 Acc EUR Hedged 0.51%Class A1 Dis 0.48%Class A1 Dis EUR Hedged 0.51%Class A1 Dis GBP Hedged 0.49%Class A2 Acc 0.83%Class A2 Dis 0.83%Class A2 Dis GBP Hedged 0.86%Class A2 Dis HKD 0.83%Class A2 Dis SGD Hedged 0.86%
Sub-Funds and Share Classes TER
Schroder SSF Fixed Maturity Bond III Class A Acc 0.58%Class A Acc HKD 0.55%Class A Acc SGD Hedged 0.59%Class A Dis 0.58%Class A Dis EUR Hedged 0.60%Class A Dis HKD 0.55%Class A Dis SGD Hedged 0.59%Class A1 Acc 0.43%Class A1 Dis 0.31%Class A1 Dis EUR Hedged 0.45%Class A2 Acc 0.33%Class A2 Dis 0.33%Class A2 Dis EUR Hedged 0.36%Class A2 Dis GBP Hedged 0.36%
Schroder SSF Fixed Maturity Bond IV Class A Acc 1.03%Class A Acc EUR Hedged 1.06%Class A Dis 1.03%Class A Dis EUR Hedged 1.06%Class A1 Acc 0.48%Class A1 Acc EUR Hedged 0.50%Class A1 Dis 0.48%Class A1 Dis EUR Hedged 0.50%Class A1 Dis GBP Hedged 0.51%Class A2 Acc 0.83%Class A2 Dis 0.83%Class A2 Dis GBP Hedged 0.84%Class A2 Dis HKD 0.80%Class A2 Dis SGD Hedged 0.84%
Schroder SSF Fixed Maturity Bond V *
Class A Acc 1.00%Class A Acc EUR Hedged 1.01%Class A Dis 1.00%Class A Dis EUR Hedged 1.03%Class A1 Acc 0.45%Class A1 Acc EUR Hedged 0.48%Class A1 Dis 0.45%Class A1 Dis EUR Hedged 0.48%Class A1 Dis GBP Hedged 0.47%Class A2 Acc 0.76%Class A2 Dis 0.80%Class A2 Dis GBP Hedged 0.82%Class A2 Dis HKD 0.07%Class A2 Dis SGD Hedged 0.81%
Schroder SSF Fixed Maturity Bond VI *
Class A Acc 0.60%Class A Dis 0.60%Class A Dis SGD Hedged 0.61%Class A1 Dis 0.45%
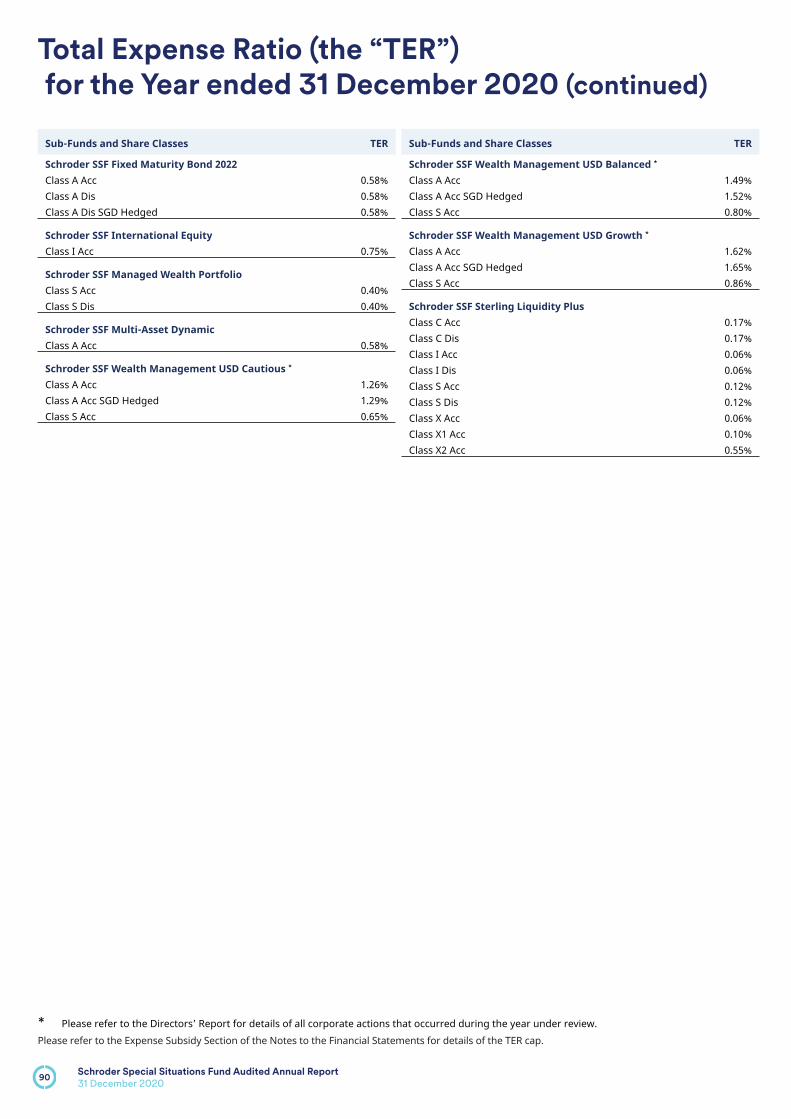
90Schroder Special Situations Fund Audited Annual Report
31 December 2020
Total Expense Ratio (the “TER”)
for the Year ended 31 December 2020 (continued)
Sub-Funds and Share Classes TER
Schroder SSF Fixed Maturity Bond 2022 Class A Acc 0.58%Class A Dis 0.58%Class A Dis SGD Hedged 0.58%
Schroder SSF International Equity Class I Acc 0.75%
Schroder SSF Managed Wealth Portfolio Class S Acc 0.40%Class S Dis 0.40%
Schroder SSF Multi-Asset Dynamic Class A Acc 0.58%
Schroder SSF Wealth Management USD Cautious *
Class A Acc 1.26%Class A Acc SGD Hedged 1.29%Class S Acc 0.65%
Sub-Funds and Share Classes TER
Schroder SSF Wealth Management USD Balanced *
Class A Acc 1.49%Class A Acc SGD Hedged 1.52%Class S Acc 0.80%
Schroder SSF Wealth Management USD Growth *
Class A Acc 1.62%Class A Acc SGD Hedged 1.65%Class S Acc 0.86%
Schroder SSF Sterling Liquidity Plus Class C Acc 0.17%Class C Dis 0.17%Class I Acc 0.06%Class I Dis 0.06%Class S Acc 0.12%Class S Dis 0.12%Class X Acc 0.06%Class X1 Acc 0.10%Class X2 Acc 0.55%
* Please refer to the Directors’ Report for details of all corporate actions that occurred during the year under review.Please refer to the Expense Subsidy Section of the Notes to the Financial Statements for details of the TER cap.

91Schroder Special Situations Fund Audited Annual Report
31 December 2020
Appendix I – Global Exposure and Leverage
(Unaudited)
The UCITS global exposure can be managed under a commitment approach, a relative Value at Risk (relative VaR) approach or an absolute Value at Risk (absolute VaR) approach. All Schroder SSF sub-funds are managed under the commitment approach which is used for the funds with low derivative usage or funds which limit their derivatives commitment to 100% or less of their Net Asset Value.
Appendix II – Remuneration Disclosures (Unaudited)
92Schroder Special Situations Fund Audited Annual Report
31 December 2020
UCITS remuneration disclosures for Schroder Investment Management Europe S.A. (‘SIM Europe’) for the year to 31 December 2019 These disclosures form part of the non-audited section of this annual report and accounts and should be read in conjunction with the Schroders plc Remuneration Report on pages 72 to 108 of the 2019 Annual Report & Accounts (available on the Group’s website –www.schroders.com/annualreport2019), which provides more information on the activities of our Remuneration Committee and our remuneration principles and policies.The UCITS Material Risk Takers (‘UCITS MRTs’) of SIM Europe are individuals whose roles within the Schroders Group can materially affect the risk of SIM Europe or any UCITS fund that it manages. These roles are identified in line with the requirements of the UCITS Directive and guidance issued by the European Securities and Markets Authority.The Remuneration Committee of Schroders plc has established a remuneration policy to ensure the requirements of the UCITS Directive are met for all UCITS MRTs. The Remuneration Committee and the Board of Schroders plc review remuneration strategy at least annually. The directors of SIM Europe are responsible for the adoption of the remuneration policy, for reviewing its general principles at least annually, for overseeing its implementation and for ensuring compliance with relevant local legislation and regulation. During 2019 the Remuneration Policy was reviewed to ensure compliance with the UCITS/AIFMD remuneration requirements and no significant changes were made.The implementation of the remuneration policy is, at least annually, subject to independent internal review for compliance with the policies and procedures for remuneration adopted by the Board of SIM Europe and the Remuneration Committee. The most recent review found no fundamental issues but resulted in a range of more minor recommendations, principally improvements to process and policy documentation.The total spend on remuneration is determined based on a profit share ratio, measuring variable remuneration charge against pre-bonus profit, and from a total compensation ratio, measuring total remuneration expense against net income. This ensures that the interests of employees are aligned with Schroders financial performance. In determining the remuneration spend each year, the underlying strength and sustainability of the business is taken into account, along with reports on risk, legal, compliance and internal audit matters from the heads of those areas.The remuneration data that follows reflects amounts paid in respect of performance during 2019.- The total amount of remuneration paid by SIM Europe to its 339 staff was €46.19 million of which €34.11 million was fixed remuneration (e.g. salaries, benefits in kind) and €12.08 million was variable remuneration (e.g. annual bonus awards or deferred bonus awards). Employees of other Schroders Group entities who serve as Directors of SIM Europe receive no additional fees in respect of their role on the Board of SIM Europe.- The following disclosures relate to UCITS MRTs of SIM Europe. Most of those UCITS MRTs were employed by and provided services to other Schroders group companies, including as a result of delegation by SIM Europe of investment management or other responsibilities to other Schroders group entities or third parties. Many of those UCITS MRTs provide services to other Schroders group companies and other clients, and as a result, only a portion of remuneration for those individuals is included in the aggregate remuneration figures that follow, based on an objective apportionment to reflect the balance of each role using relevant regulated AUM as a proportion of the total AUM within the scope of each role. The aggregate total remuneration paid to the 241 UCITS MRTs of SIM Europe in respect of the financial year ended 31 December 2019, and attributed to SIM Europe’s UCITS management company activities or the UCITS funds that it manages, is €51.17 million, of which €12.29 million was paid to senior management, €36.14 million was paid to MRTs deemed to be taking risk on behalf of SIM Europe or the UCITS funds that it manages and €2.74 million was paid to other UCITS MRTs including control function MRTs. These total remuneration values include amounts paid by delegates where available.For additional qualitative information on remuneration policies and practices see www.schroders.com/rem-disclosures.

Schroder Investment Management (Europe) S.A.
5, rue HöhenhofL-1736 SenningerbergGrand Duchy of LuxembourgTel: (+352) 341 342 212Fax: (+352) 341 342 342
SSSF AR 31 December 2020 LUEN