schuyler county - nys governor's traffic safety ... data on the total number of speed-related...
TRANSCRIPT

SCHUYLER COUNTYTRAFFIC SAFETY DATA
Prepared by
Institute for Traffic Safety Management and Research80 Wolf Road, Suite 607, Albany, NY 12205-2604
Phone 518-453-0291 . FAX 518-453-0298
February 2011
COUNTY TRAFFIC SAFETY DATA This document provides various accident and ticket data for the county. Ticket data are presented for the years 2007-2009. Four summary reports provide detailed accident data for the three years 2007-2009. The four accident reports provide data for 1) all accidents, 2) alcohol-related accidents, 3) speed-related accidents, and 4) motorcycle accidents. Caution is advised in interpreting the data in cases where the numbers are very small. For assistance in using the data in this document or to request additional information, please contact
Institute for Traffic Safety Management and Research
80 Wolf Road, Suite 607 Albany, New York 12205 Telephone: 518-453-0291
Contact Person: Sandra Fuller
E-Mail: [email protected]
OR
Governor’s Traffic Safety Committee NYS Department of Motor Vehicles
6 Empire State Plaza Room 414 Albany, New York 12228 Telephone: 518-474-5111
Contact your GTSC Representative
listed below:
GTSC Representatives
RICH DEVLIN SHARON HENDERSON JENNIFER HOGAN PAUL OVERBAUGH CRAIG WHITTEN 518-486-4221 518-474-2279 518-473-7786 518-486-5395 518-486-6718
[email protected] [email protected] [email protected] [email protected] [email protected]
Essex Cayuga Fulton Albany Allegany
Hamilton Clinton Greene Chenango Broome
Herkimer Franklin Montgomery Columbia Cattaraugus
Warren Jefferson Nassau Cortland Chautauqua
Lewis New York City: Bronx, Kings, Manhattan, Queens, Richmond
Delaware Chemung
Madison Rensselaer Dutchess Erie
Oneida Schenectady Orange Genesee
Onondaga Schoharie Putnam Livingston
Oswego Suffolk Rockland Monroe
St. Lawrence Westchester Saratoga Niagara
Seneca Sullivan Ontario
Wayne Ulster Orleans
Washington Otsego
Schuyler
Steuben
Tioga
Tompkins
Wyoming
Yates

TABLE OF CONTENTS
COUNTY DATA
Section Accident Data: 2007 - 2009 General Accident Summary Report ......................................................................................... 1
Alcohol-Related Accident Summary Report ........................................................................... 2
Speed-Related Accident Summary Report............................................................................... 3
Motorcycle Accident Summary Report.................................................................................... 4
Ticket Data: 2007 - 2009 Tickets Issued and Conviction Rates for Selected Violations ................................................. 5
DWI/AI Probation Data ........................................................................................................... 5
Tickets Issued by TSLED Agencies by Agency Type ............................................................. 5
TSLED Tickets Issued for Selected Violations by Enforcement Agency ................................ 5

SECTION 1
General Accident Summary Report

Category TotalsCounty Total
NYS Total
% of NYS
County Total
NYS Total
% of NYS
County Total
NYS Total
% of NYS
Total Accidents 528 323,106 0.2 555 316,231 0.2 531 314,974 0.2Fatal Accidents 0 1,220 0.0 0 1,160 0.0 4 1,060 0.4Non-Fatal Personal Injury Accidents 135 139,117 0.1 135 134,894 0.1 113 133,888 0.1Reportable Property Damage Accidents 393 182,769 0.2 420 180,177 0.2 414 180,026 0.2
Manner of CollisionSingle Vehicle Accidents 359 103,286 0.3 394 104,790 0.4 386 101,080 0.4Multiple Vehicle Accidents 169 219,820 0.1 161 211,441 0.1 145 213,894 0.1
Special Accident SeriesPedestrian/Motor Vehicle Accidents 4 15,701 <0.1 2 15,620 <0.1 3 15,682 <0.1Bicycle/Motor Vehicle Accidents 0 5,535 0.0 1 5,646 <0.1 1 5,620 <0.1Motorcycle Accidents 19 5,426 0.4 14 5,396 0.3 13 5,150 0.3
FatalitiesPersons Killed (1) 0 1,317 0.0 0 1,224 0.0 4 1,148 0.3Drivers Killed 0 762 0.0 0 669 0.0 4 603 0.7Passengers Killed 0 231 0.0 0 211 0.0 0 209 0.0Pedestrians Killed 0 272 0.0 0 302 0.0 0 307 0.0Bicyclists Killed 0 50 0.0 0 42 0.0 0 29 0.0Other 0 2 0.0 0 0 0.0 0 0 0.0
Non-Fatal InjuriesPersons Injured (1) 179 194,255 0.1 179 187,160 0.1 161 186,034 0.1Drivers Injured 123 119,314 0.1 125 114,393 0.1 103 112,855 0.1Passengers Injured 52 53,261 0.1 52 51,120 0.1 54 51,499 0.1Pedestrians Injured 4 15,472 <0.1 1 15,317 <0.1 3 15,321 <0.1Bicyclists Injured 0 5,373 0.0 1 5,422 <0.1 1 5,405 <0.1Other 0 835 0.0 0 908 0.0 0 954 0.0
General Notes* Some of the tables are based upon information received from police and motorist reports of motor vehicle accidents. Others are based only on the police reports; these are indicated by a (P).* The Property Damage Accident reporting level is $1,000 or more. * The term "vehicle" always excludes bicycles.* The term "driver" always excludes bicyclists.* Percentages may not total 100.0 due to rounding.
(1) Includes pedestrians, bicyclists and all other non-vehicle involved persons as well as vehicle occupants regardless of seating position.
2009
Schuyler County
Motor Vehicle AccidentsNew York State Department of Motor Vehicles
TABLE 1 Accident Summary Totals2007 2008
Compiled by ITSMR, December 2010All Accidents
Page 1 of 6

2007 2008 2009Crash Rates Crash Rate per 10,000 Population 277.50 293.84 283.65 Crash Rate per 10,000 Licensed Drivers 367.30 391.53 374.84
Fatality & Injury Rates Fatality & Injury Rate per 10,000 Population 94.08 94.77 88.14 Fatality & Injury Rate per 10,000 Licensed Drivers 124.52 126.28 116.48
TotalAccidents Mid-6am 6am-Noon Noon-6pm 6pm-Mid Unknown
Total 531 71 140 168 142 10Sunday 68 12 17 21 17 1Monday 71 4 19 22 23 3Tuesday 76 10 21 21 23 1Wednesday 64 7 20 19 17 1Thursday 80 10 32 23 12 3Friday 92 14 15 37 26 0Saturday 80 14 16 25 24 1
# % # % # %Total 470 100.0 499 100.0 480 100.0
State Police 49 10.4 56 11.2 63 13.1County Police 341 72.6 367 73.5 361 75.2New York City (NYPD) 0 0.0 0 0.0 0 0.0Municipal Police (non-NYC) 80 17.0 76 15.2 56 11.7Unknown 0 0.0 0 0.0 0 0.0
New York State Department of Motor Vehicles
Schuyler County
Motor Vehicle Accidents
Time of Day
200920082007TABLE 3(P) Police Investigating Agency
TABLE 2 Day of Week/Time of Day: 2009
TABLE 1.1 Crash and Fatality & Injury Rates
Compiled by ITSMR, December 2010All Accidents
Page 2 of 6

2007 2008 2009# % # % # %
Total 528 100.0State Routes 277 52.5County Routes 101 19.1Town Routes 83 15.7Municipal Routes 41 7.8Parkways 0 0.0Thruway 0 0.0Other Interstates 0 0.0Unknown 26 4.9
# % # % # %Total Drivers 686 100.0 695 100.0 644 100.0
Male 450 65.6 398 57.3 376 58.4Female 231 33.7 284 40.9 257 39.9Unknown 5 0.7 13 1.9 11 1.7
Under Age 16 0 0.0 0 0.0 0 0.0Ages 16-20 95 13.8 78 11.2 75 11.6Ages 21-29 125 18.2 123 17.7 109 16.9Ages 30-39 109 15.9 95 13.7 97 15.1Ages 40-49 139 20.3 147 21.2 135 21.0Ages 50-59 117 17.1 123 17.7 113 17.5Ages 60-69 60 8.7 63 9.1 62 9.6Ages 70 and Over 36 5.2 51 7.3 41 6.4Unknown Age 5 0.7 15 2.2 12 1.9
New York State Department of Motor VehiclesMotor Vehicle Accidents
Schuyler County
Data are notavailable.
200920082007TABLE 5 Driver Gender and Age
TABLE 4 Jurisdictional Road System
Data are notavailable.
Compiled by ITSMR, December 2010All Accidents
Page 3 of 6

# % # % # %Total Accidents 470 499 480
Alcohol Involvement* 35 7.4 26 5.2 18 3.8Backing Unsafely 14 3.0 15 3.0 17 3.5Driver Inattention/Distraction 62 13.2 68 13.6 52 10.8Driver Inexperience 25 5.3 13 2.6 14 2.9Failure to Keep Right 7 1.5 5 1.0 12 2.5Failure to Yield R.O.W. 27 5.7 27 5.4 34 7.1Following Too Closely 35 7.4 26 5.2 19 4.0Passing/Lane Violations 24 5.1 25 5.0 17 3.5Traffic Control Disregarded 10 2.1 6 1.2 4 0.8Turning Improperly 15 3.2 8 1.6 14 2.9Unsafe Speed* 48 10.2 68 13.6 52 10.8
Note: Many accidents have multiple factors reported.
Age Group Total # % # of Ped/Bike Total # % # of Ped/BikeTotal 179 100.0 2 165 100.0 4
Under Age 4 3 1.7 0 0 0.0 0Ages 4-6 0 0.0 0 4 2.4 0Ages 7-15 13 7.3 1 12 7.3 1Ages 16-17 10 5.6 0 12 7.3 0Ages 18-20 19 10.6 0 18 10.9 0Ages 21-29 34 19.0 0 26 15.8 1Ages 30-39 24 13.4 0 21 12.7 0Ages 40-49 31 17.3 0 29 17.6 1Ages 50-59 22 12.3 0 19 11.5 0Ages 60-69 11 6.1 0 12 7.3 0Ages 70 and Over 12 6.7 1 11 6.7 1Unknown Age 0 0.0 0 1 0.6 0
# Killed or Injured %
# Killed or Injured %
# Killed or Injured %
Motor Vehicle Occupants 150 100.0 156 100.0 142 100.0No Restraint Used 22 14.7 11 7.1 8 5.6Restraint Used 118 78.7 131 84.0 129 90.8Unknown 10 6.7 14 9.0 5 3.5
Motorcyclists 21 100.0 11 100.0 11 100.0No Helmet Used 1 4.8 0 0.0 0 0.0Helmet Used 18 85.7 10 90.9 10 90.9Unknown 2 9.5 1 9.1 1 9.1
Bicyclists 0 0.0 1 100.0 1 100.0No Helmet Used 0 0.0 1 100.0 0 0.0Helmet Used 0 0.0 0 0.0 0 0.0Unknown 0 0.0 0 0.0 1 100.0
* These numbers represent the total number of accidents in which police checked "alcohol involvement" or "unsafe speed" as apparent contributing factors on police accident report form. They do not represent the total number of alcohol-related or speed-related accidents that occurred in the county. For data on the total number of alcohol-related accidents in the county, see the separate report titled, "Summary of Alcohol-Related Accidents." For data on the total number of speed-related accidents in the county, see the separate report titled, "Summary of Speed-Related Accidents."
2008 2009
TABLE 6(P) Select Accident Contributing Factors
Schuyler County
Motor Vehicle AccidentsNew York State Department of Motor Vehicles
200920082007
200920082007
TABLE 8(P) Reported Safety Equipment Use
TABLE 7 Persons Killed or Injured by Age Group: 2008-2009
Compiled by ITSMR, December 2010All Accidents
Page 4 of 6

18%
20%
31%
19%
15% 15%
20%
25%
30%
35%
FIGURE 1Schuyler County 2009
Licensed Drivers and Drivers Involved in Fatal and Personal Injury Accidentsby Age Group
Licensed Drivers (n=14,166)Drivers in F&PI Accidents (n=157)
Note: In interpreting these data, any age group with a greater percentage of drivers involved in fatal and personal injury accidents than licensed drivers indicates that the drivers in that age group are overrepresented in fatal and personal injury accidents. 2 drivers in fatal and personal injury accidents were excluded due to unknown age.
1%
4% 6%6%
12%
18%
20%
31%
6%
11%9% 10%
14%
19%
15% 15%
0%
5%
10%
15%
20%
25%
30%
35%
<18 18-20 21-24 25-29 30-39 40-49 50-59 60+
Age Group
FIGURE 1Schuyler County 2009
Licensed Drivers and Drivers Involved in Fatal and Personal Injury Accidentsby Age Group
Licensed Drivers (n=14,166)Drivers in F&PI Accidents (n=157)
Compiled by ITSMR, December 2010All Accidents
Page 5 of 6

TABLE 9 Fatal & Personal Injury Crashes, Crash Rate per Roadway Mile, and Fatalities & Injuries by County Jurisdiction
Pop./ F&PI Crashes/ # Killed & F&PI Crashes/ # Killed & F&PI Crashes/ # Killed &Pop. % Miles % Mile Crashes Mile Injured Crashes Mile Injured Crashes Mile Injured
Towns Catharine 1,405 7.2 59.7 8.4 23.5 5 0.1 7 10 0.2 11 4 0.1 5Cayuta 550 2.8 29.0 4.1 19.0 11 0.4 13 4 0.1 4 10 0.3 14Dix 2,262 11.6 77.3 10.8 29.3 18 0.2 29 23 0.3 32 11 0.1 13Hector 4,666 23.9 216.6 30.4 21.5 32 0.1 43 32 0.1 47 27 0.1 33Montour 747 3.8 37.9 5.3 19.7 9 0.2 11 2 0.1 2 17 0.4 30Orange 1,786 9.2 85.7 12.0 20.8 12 0.1 18 9 0.1 8 9 0.1 12Reading 1,462 7.5 63.0 8.8 23.2 15 0.2 16 15 0.2 23 9 0.1 15Tyrone 1,730 8.9 94.2 13.2 18.4 9 0.1 13 10 0.1 12 5 0.1 5
Villages Burdett 353 1.8 4.0 0.6 88.3 1 0.3 1 1 0.3 2 1 0.3 2
Montour Falls 1,802 9.2 18.9 2.7 95.3 7 0.4 7 7 0.4 13 5 0.3 8Odessa 616 3.2 8.0 1.1 77.0 3 0.4 3 3 0.4 4 4 0.5 7Watkins Glen 2,126 10.9 18.4 2.6 115.5 13 0.7 18 17 0.9 19 14 0.8 20
Other unknown na na na na na 0 na na 2 na 2 1 na 1
Schuyler19,505 712.6 27.4 135 0.2 179 135 0.2 179 117 0.2 165
New York State 19,227,088 113342.8 169.6 140,337 1.2 195,572 136,054 1.2 188,384 134,948 1.2 187,182
Source: US Census Bureau redistricting data, NYSDOT Highway Mileage report, and the NYSDMV AIS data base.
2009
Schuyler County
Motor Vehicle AccidentsNew York State Department of Motor Vehicles
20082007
County Total
Jurisdiction
Compiled by ITSMR, December 2010All Accidents
Page 6 of 6

SECTION 2
Alcohol-Related Accident Summary Report

Category TotalsCounty Total
NYS Total
% of NYS
County Total
NYS Total
% of NYS
County Total
NYS Total
% of NYS
Total Accidents 35 9,480 0.4 26 9,202 0.3 19 8,873 0.2Fatal Accidents 0 344 0.0 0 355 0.0 1 329 0.3Non-Fatal Personal Injury Accidents 20 4,991 0.4 16 4,775 0.3 5 4,676 0.1Reportable Property Damage Accidents 15 4,145 0.4 10 4,072 0.2 13 3,868 0.3
Manner of CollisionSingle Vehicle Accidents 31 5,138 0.6 20 5,033 0.4 16 4,843 0.3Multiple Vehicle Accidents 4 4,342 0.1 6 4,169 0.1 3 4,030 0.1
Special A-R Accident SeriesA-R Pedestrian/Motor Vehicle Accidents 0 403 0.0 1 428 0.2 0 432 0.0A-R Bicycle/Motor Vehicle Accidents 0 97 0.0 0 106 0.0 0 118 0.0A-R Motorcycle Accidents 2 217 0.9 0 220 0.0 1 191 0.5
FatalitiesPersons Killed (1) 0 373 0.0 0 381 0.0 1 361 0.3Drivers Killed 0 239 0.0 0 212 0.0 1 198 0.5
Drinking Drivers 0 215 0.0 0 192 0.0 0 175 0.0Non-Drinking Drivers 0 24 0.0 0 20 0.0 1 23 4.3
Passengers Killed 0 65 0.0 0 77 0.0 0 64 0.0Pedestrians Killed 0 62 0.0 0 82 0.0 0 91 0.0Bicyclists Killed 0 7 0.0 0 10 0.0 0 8 0.0Other 0 0 0.0 0 0 0.0 0 0 0.0
Non-Fatal InjuriesPersons Injured (1) 27 7,175 0.4 18 6,886 0.3 10 6,810 0.1Drivers Injured 18 4,593 0.4 15 4,396 0.3 6 4,321 0.1Passengers Injured 9 2,072 0.4 3 1,979 0.2 4 1,959 0.2Pedestrians Injured 0 362 0.0 0 360 0.0 0 369 0.0Bicyclists Injured 0 90 0.0 0 94 0.0 0 107 0.0Other 0 58 0.0 0 57 0.0 0 54 0.0
General Notes* All tables are based on information received from police reports.* The Property Damage Accident reporting level is $1,000 or more. * The term "vehicle" always excludes bicycles.* The term "driver" always excludes bicyclists.* Percentages may not total 100.0 due to rounding.
2009
New York State Department of Motor VehiclesAlcohol-Related Motor Vehicle Accidents
Schuyler County
(1) Includes pedestrians, bicyclists and all other non-vehicle involved persons as well as vehicle occupants regardless of seating position.
2007 2008TABLE 1(P) Alcohol-Related (A-R) Accidents
Compiled by ITSMR, December 2010Alcohol-Related Accidents
Page 1 of 4

TotalAccidents Mid-6am 6am-Noon Noon-6pm 6pm-Mid Unknown
Total 19 6 0 4 9 0Sunday 4 1 0 1 2 0Monday 2 0 0 1 1 0Tuesday 3 0 0 1 2 0Wednesday 1 0 0 0 1 0Thursday 2 2 0 0 0 0Friday 2 0 0 1 1 0Saturday 5 3 0 0 2 0
# % # % # %Total Drivers 36 100.0 30 100.0 20 100.0
Male 32 88.9 20 66.7 16 80.0Drinking Drivers 31 86.1 19 63.3 14 70.0Non-Drinking Drivers 1 2.8 1 3.3 2 10.0
Female 4 11.1 9 30.0 4 20.0Drinking Drivers 4 11.1 7 23.3 4 20.0Non-Drinking Drivers 0 0.0 2 6.7 0 0.0
Unknown 0 0.0 1 3.3 0 0.0Drinking Drivers 0 0.0 0 0.0 0 0.0Non-Drinking Drivers 0 0.0 1 3.3 0 0.0
Drinking Drivers 35 100.0 26 100.0 18 100.0Under Age 16 0 0.0 0 0.0 0 0.0Ages 16-20 6 17.1 4 15.4 2 11.1Ages 21-29 9 25.7 10 38.5 3 16.7Ages 30-39 8 22.9 1 3.8 5 27.8Ages 40-49 7 20.0 7 26.9 5 27.8Ages 50-59 5 14.3 2 7.7 1 5.6Age 60 and Over 0 0.0 2 7.7 2 11.1Unknown Age 0 0.0 0 0.0 0 0.0
Non-Drinking Drivers 1 100.0 4 100.0 2 100.0Under Age 16 0 0.0 0 0.0 0 0.0Ages 16-20 1 100.0 1 25.0 0 0.0Ages 21-29 0 0.0 0 0.0 1 50.0Ages 30-39 0 0.0 0 0.0 0 0.0Ages 40-49 0 0.0 1 25.0 1 50.0Ages 50-59 0 0.0 0 0.0 0 0.0Age 60 and Over 0 0.0 1 25.0 0 0.0Unknown Age 0 0.0 1 25.0 0 0.0
Time of Day
New York State Department of Motor VehiclesAlcohol-Related Motor Vehicle Accidents
Schuyler County
2007 2008 2009TABLE 3(P) Driver Gender and Age
TABLE 2(P) Day of Week/Time of Day: 2009
Compiled by ITSMR, December 2010Alcohol-Related Accidents
Page 2 of 4

# % # % # %Total Accidents 35 26 19
Driver Inattention/Distraction 0 0.0 1 3.8 0 0.0Failure to Keep Right 3 8.6 1 3.8 3 15.8Failure to Yield R.O.W. 0 0.0 0 0.0 0 0.0Fell Asleep 2 5.7 1 3.8 1 5.3Following Too Closely 0 0.0 1 3.8 0 0.0Passing/Lane Violations 1 2.9 2 7.7 1 5.3Traffic Control Disregarded 0 0.0 0 0.0 0 0.0Unsafe Speed 13 37.1 4 15.4 1 5.3
Note: Many accidents have multiple factors reported.
Age Group Total # % # of Ped/Bike Total # % # of Ped/BikeTotal 18 100.0 0 11 100.0 0
Under Age 4 0 0.0 0 0 0.0 0Ages 4-6 0 0.0 0 2 18.2 0Ages 7-15 0 0.0 0 0 0.0 0Ages 16-17 0 0.0 0 0 0.0 0Ages 18-20 3 16.7 0 1 9.1 0Ages 21-29 6 33.3 0 3 27.3 0Ages 30-39 2 11.1 0 0 0.0 0Ages 40-49 3 16.7 0 2 18.2 0Ages 50-59 1 5.6 0 1 9.1 0Ages 60-69 2 11.1 0 1 9.1 0Ages 70 and Over 1 5.6 0 1 9.1 0Unknown Age 0 0.0 0 0 0.0 0
# Killed or Injured %
# Killed or Injured %
# Killed or Injured %
Motor Vehicle Occupants 25 100.0 18 100.0 9 100.0No Restraint Used 11 44.0 2 11.1 4 44.4Restraint Used 9 36.0 10 55.6 3 33.3Unknown 5 20.0 6 33.3 2 22.2
Motorcyclists 2 100.0 0 0.0 2 100.0No Helmet Used 0 0.0 0 0.0 0 0.0Helmet Used 2 100.0 0 0.0 2 100.0Unknown 0 0.0 0 0.0 0 0.0
Bicyclists 0 0.0 0 0.0 0 0.0No Helmet Used 0 0.0 0 0.0 0 0.0Helmet Used 0 0.0 0 0.0 0 0.0Unknown 0 0.0 0 0.0 0 0.0
TABLE 4(P) Select Accident Contributing Factors
Schuyler County
Alcohol-Related Motor Vehicle AccidentsNew York State Department of Motor Vehicles
20082007 2009
20082007 2009TABLE 6(P) Reported Safety Equipment Use
TABLE 5(P) Persons Killed or Injured by Age Group: 2008-20092008 2009
Compiled by ITSMR, December 2010Alcohol-Related Accidents
Page 3 of 4

18%
20%
31%
17% 17% 17% 17% 17% 17%
21%
29%
20%
25%
30%
35%
FIGURE 1Schuyler County 2009
Licensed Drivers, Impaired Drivers Involved in Alcohol-Related Fatal andPersonal Injury Accidents, and Drivers Arrested for Impaired Driving
by Age GroupLicensed Drivers (n=14,166)
Impaired Drivers in A-R F&PI Accidents (n=6)
Impaired Driving Arrests (n=112)
Note: In interpreting these data, any age group with a greater percentage of impaired drivers involved in A-R fatal and personal injury accidents than licensed drivers indicates that the drivers in that age group are overrepresented in A-R fatal and personal injury accidents. Similarly, any age group with a greater percentage of drivers arrested for impaired driving than licensed drivers indicates that drivers in that age group are overrepresented in alcohol-related arrests.
6% 6%6%
12%
18%
20%
31%
17% 17% 17% 17% 17%
0%
17%
10%12%
10%
21%
29%
12%
7%
0%
5%
10%
15%
20%
25%
30%
35%
<21 21-24 25-29 30-39 40-49 50-59 60+
Age Group
FIGURE 1Schuyler County 2009
Licensed Drivers, Impaired Drivers Involved in Alcohol-Related Fatal andPersonal Injury Accidents, and Drivers Arrested for Impaired Driving
by Age GroupLicensed Drivers (n=14,166)
Impaired Drivers in A-R F&PI Accidents (n=6)
Impaired Driving Arrests (n=112)
Compiled by ITSMR, December 2010Alcohol-Related Accidents
Page 4 of 4
SECTION 3
Speed-Related Accident Summary Report
Category TotalsCounty
Total
NYS
Total
% of
NYS
County
Total
NYS
Total
% of
NYS
County
Total
NYS
Total
% of
NYS
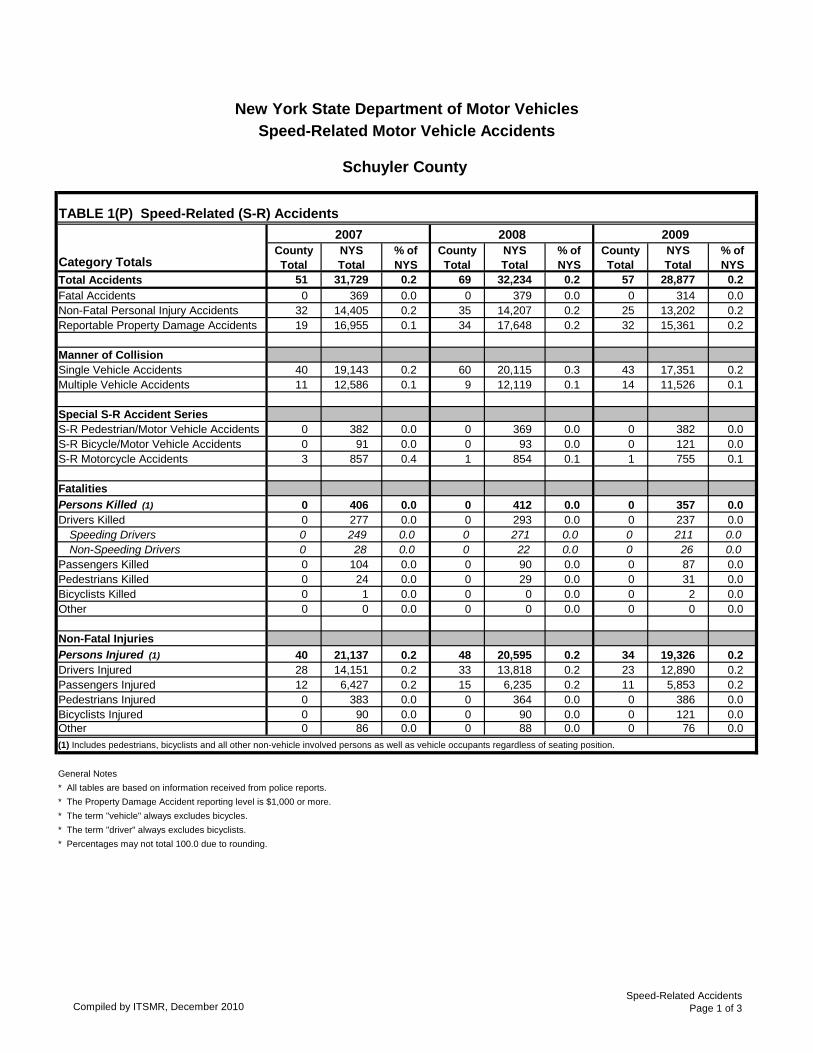
Total Accidents 51 31,729 0.2 69 32,234 0.2 57 28,877 0.2
Fatal Accidents 0 369 0.0 0 379 0.0 0 314 0.0
Non-Fatal Personal Injury Accidents 32 14,405 0.2 35 14,207 0.2 25 13,202 0.2
Reportable Property Damage Accidents 19 16,955 0.1 34 17,648 0.2 32 15,361 0.2
Manner of Collision
Single Vehicle Accidents 40 19,143 0.2 60 20,115 0.3 43 17,351 0.2
Multiple Vehicle Accidents 11 12,586 0.1 9 12,119 0.1 14 11,526 0.1
Special S-R Accident Series
S-R Pedestrian/Motor Vehicle Accidents 0 382 0.0 0 369 0.0 0 382 0.0
S-R Bicycle/Motor Vehicle Accidents 0 91 0.0 0 93 0.0 0 121 0.0
S-R Motorcycle Accidents 3 857 0.4 1 854 0.1 1 755 0.1
Fatalities
Persons Killed (1) 0 406 0.0 0 412 0.0 0 357 0.0
Drivers Killed 0 277 0.0 0 293 0.0 0 237 0.0
Speeding Drivers 0 249 0.0 0 271 0.0 0 211 0.0
Non-Speeding Drivers 0 28 0.0 0 22 0.0 0 26 0.0
Passengers Killed 0 104 0.0 0 90 0.0 0 87 0.0
Pedestrians Killed 0 24 0.0 0 29 0.0 0 31 0.0
Bicyclists Killed 0 1 0.0 0 0 0.0 0 2 0.0
Other 0 0 0.0 0 0 0.0 0 0 0.0
Non-Fatal Injuries
Persons Injured (1) 40 21,137 0.2 48 20,595 0.2 34 19,326 0.2
Drivers Injured 28 14,151 0.2 33 13,818 0.2 23 12,890 0.2
Passengers Injured 12 6,427 0.2 15 6,235 0.2 11 5,853 0.2
Pedestrians Injured 0 383 0.0 0 364 0.0 0 386 0.0
Bicyclists Injured 0 90 0.0 0 90 0.0 0 121 0.0
Other 0 86 0.0 0 88 0.0 0 76 0.0
General Notes
* All tables are based on information received from police reports.
* The Property Damage Accident reporting level is $1,000 or more.
* The term "vehicle" always excludes bicycles.
* The term "driver" always excludes bicyclists.
* Percentages may not total 100.0 due to rounding.
(1) Includes pedestrians, bicyclists and all other non-vehicle involved persons as well as vehicle occupants regardless of seating position.
TABLE 1(P) Speed-Related (S-R) Accidents
2009
New York State Department of Motor Vehicles
Speed-Related Motor Vehicle Accidents
Schuyler County
20082007
Compiled by ITSMR, December 2010Speed-Related Accidents
Page 1 of 3

Total Time of Day
Accidents Mid-6am 6am-Noon Noon-6pm 6pm-Mid Unknown
Total 57 9 15 19 14 0
Sunday 9 1 4 2 2 0
Monday 6 1 1 3 1 0
Tuesday 7 1 1 2 3 0
Wednesday 7 0 4 2 1 0
Thursday 4 1 1 1 1 0
Friday 13 2 2 4 5 0
Saturday 11 3 2 5 1 0
# % # % # %
Total Drivers 61 100.0 75 100.0 67 100.0
Male 38 62.3 34 45.3 45 67.2
Speeding Drivers 33 54.1 30 40.0 39 58.2
Non-Speeding Drivers 5 8.2 4 5.3 6 9.0
Female 22 36.1 41 54.7 20 29.9
Speeding Drivers 19 31.1 39 52.0 16 23.9
Non-Speeding Drivers 3 4.9 2 2.7 4 6.0
Unknown 1 1.6 0 0.0 2 3.0
Speeding Drivers 0 0.0 0 0.0 1 1.5
Non-Speeding Drivers 1 1.6 0 0.0 1 1.5
Speeding Drivers 52 100.0 69 100.0 56 100.0
Under Age 16 0 0.0 0 0.0 0 0.0
Ages 16-20 20 38.5 15 21.7 17 30.4
Ages 21-29 12 23.1 21 30.4 18 32.1
Ages 30-39 8 15.4 8 11.6 8 14.3
Ages 40-49 8 15.4 11 15.9 6 10.7
Ages 50-59 2 3.8 10 14.5 4 7.1
Age 60 and Over 2 3.8 4 5.8 2 3.6
Unknown Age 0 0.0 0 0.0 1 1.8
Non-Speeding Drivers 9 100.0 6 100.0 11 100.0
Under Age 16 0 0.0 0 0.0 0 0.0
Ages 16-20 2 22.2 0 0.0 0 0.0
Ages 21-29 2 22.2 1 16.7 2 18.2
Ages 30-39 0 0.0 0 0.0 2 18.2
Ages 40-49 1 11.1 1 16.7 3 27.3
Ages 50-59 2 22.2 0 0.0 0 0.0
Age 60 and Over 1 11.1 4 66.7 3 27.3
Unknown Age 1 11.1 0 0.0 1 9.1
New York State Department of Motor Vehicles
Speed-Related Motor Vehicle Accidents
Schuyler County
200920082007
TABLE 2(P) Day of Week/Time of Day: 2009
TABLE 3(P) Driver Gender and Age
Compiled by ITSMR, December 2010Speed-Related Accidents
Page 2 of 3
# % # % # %
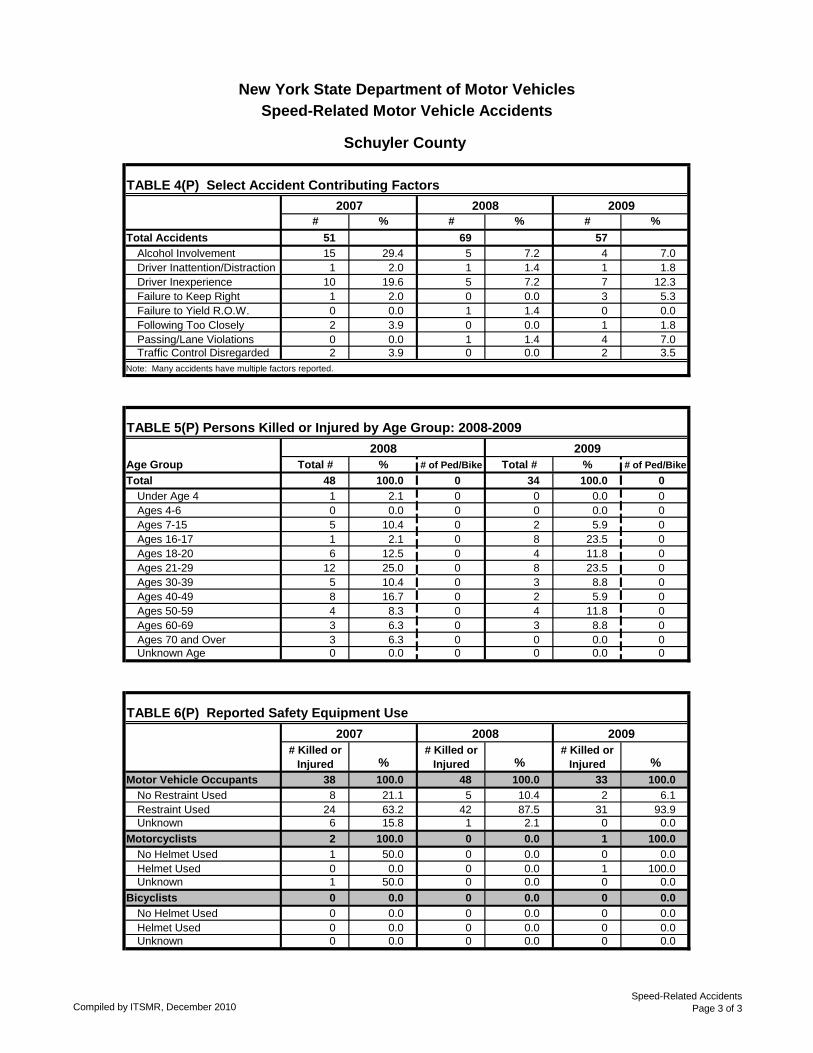
Total Accidents 51 69 57
Alcohol Involvement 15 29.4 5 7.2 4 7.0
Driver Inattention/Distraction 1 2.0 1 1.4 1 1.8
Driver Inexperience 10 19.6 5 7.2 7 12.3
Failure to Keep Right 1 2.0 0 0.0 3 5.3
Failure to Yield R.O.W. 0 0.0 1 1.4 0 0.0
Following Too Closely 2 3.9 0 0.0 1 1.8
Passing/Lane Violations 0 0.0 1 1.4 4 7.0
Traffic Control Disregarded 2 3.9 0 0.0 2 3.5
Note: Many accidents have multiple factors reported.
Age Group Total # % # of Ped/Bike Total # % # of Ped/Bike
Total 48 100.0 0 34 100.0 0
Under Age 4 1 2.1 0 0 0.0 0
Ages 4-6 0 0.0 0 0 0.0 0
Ages 7-15 5 10.4 0 2 5.9 0
Ages 16-17 1 2.1 0 8 23.5 0
Ages 18-20 6 12.5 0 4 11.8 0
Ages 21-29 12 25.0 0 8 23.5 0
Ages 30-39 5 10.4 0 3 8.8 0
Ages 40-49 8 16.7 0 2 5.9 0
Ages 50-59 4 8.3 0 4 11.8 0
Ages 60-69 3 6.3 0 3 8.8 0
Ages 70 and Over 3 6.3 0 0 0.0 0
Unknown Age 0 0.0 0 0 0.0 0
# Killed or
Injured %# Killed or
Injured %# Killed or
Injured %
Motor Vehicle Occupants 38 100.0 48 100.0 33 100.0
No Restraint Used 8 21.1 5 10.4 2 6.1
Restraint Used 24 63.2 42 87.5 31 93.9
Unknown 6 15.8 1 2.1 0 0.0
Motorcyclists 2 100.0 0 0.0 1 100.0
No Helmet Used 1 50.0 0 0.0 0 0.0
Helmet Used 0 0.0 0 0.0 1 100.0
Unknown 1 50.0 0 0.0 0 0.0
Bicyclists 0 0.0 0 0.0 0 0.0
No Helmet Used 0 0.0 0 0.0 0 0.0
Helmet Used 0 0.0 0 0.0 0 0.0
Unknown 0 0.0 0 0.0 0 0.0
New York State Department of Motor Vehicles
TABLE 6(P) Reported Safety Equipment Use
TABLE 5(P) Persons Killed or Injured by Age Group: 2008-2009
2008 2009
200920082007
TABLE 4(P) Select Accident Contributing Factors
200920082007
Schuyler County
Speed-Related Motor Vehicle Accidents
Compiled by ITSMR, December 2010Speed-Related Accidents
Page 3 of 3

SECTION 4
Motorcycle Accident Summary Report

Category TotalsCounty
Total
NYS
Total
% of
NYS
County
Total
NYS
Total
% of
NYS
County
Total
NYS
Total
% of
NYS
Total Motorcycle Accidents 19 5,426 0.4 14 5,396 0.3 13 5,150 0.3
Fatal Accidents 0 164 0.0 0 184 0.0 3 152 2.0
Non-Fatal Personal Injury Accidents 17 4,727 0.4 12 4,593 0.3 9 4,347 0.2
Reportable Property Damage Accidents 2 535 0.4 2 619 0.3 1 651 0.2
Manner of Collision
Single Motorcycle Accidents 12 2,318 0.5 7 2,392 0.3 9 2,270 0.4
Multiple Vehicle Accidents 7 3,108 0.2 7 3,004 0.2 4 2,880 0.1
Special Motorcycle Accident Series
Motorcycle/Pedestrian Accidents 0 74 0.0 0 84 0.0 0 63 0.0
Motorcycle/Bicycle Accidents 0 19 0.0 0 29 0.0 0 28 0.0
Fatalities
Persons Killed (1) 0 172 0.0 0 188 0.0 3 155 1.9
Drivers Killed 0 162 0.0 0 175 0.0 3 146 2.1
Motorcycle Operators 0 162 0.0 0 175 0.0 3 146 2.1
Non-Motorcycle Drivers 0 0 0.0 0 0 0.0 0 0 0.0
Passengers Killed 0 9 0.0 0 8 0.0 0 5 0.0
Motorcycle Passengers 0 9 0.0 0 7 0.0 0 5 0.0
Passengers in Other Vehicles 0 0 0.0 0 1 0.0 0 0 0.0
Pedestrians Killed 0 1 0.0 0 4 0.0 0 3 0.0
Bicyclists Killed 0 0 0.0 0 1 0.0 0 1 0.0
Other 0 0 0.0 0 0 0.0 0 0 0.0
Non-Fatal Injuries
Persons Injured (1) 22 5,503 0.4 13 5,290 0.2 14 5,042 0.3
Drivers Injured 17 4,830 0.4 13 4,674 0.3 12 4,444 0.3
Passengers Injured 5 579 0.9 0 493 0.0 2 505 0.4
Pedestrians Injured 0 71 0.0 0 81 0.0 0 61 0.0
Bicyclists Injured 0 15 0.0 0 28 0.0 0 24 0.0
Other 0 8 0.0 0 14 0.0 0 8 0.0
General Notes
* Some of the tables are based upon information received from police and motorist
reports of motor vehicle accidents. Others are based only on the police
reports; these are indicated by a (P).
* The Property Damage Accident reporting level is $1,000 or more.
* The term "vehicle" always excludes bicycles.
* The term "driver" always excludes bicyclists.
* Percentages may not total 100.0 due to rounding.
Motorcycle Accidents
New York State Department of Motor Vehicles
(1) Includes pedestrians, bicyclists and all other non-vehicle involved persons as well as vehicle occupants regardless of seating position.
TABLE 1 Accident Summary Totals
20082007 2009
Schuyler County
Compiled by ITSMR, December 2010Motorcycle Accidents
Page 1 of 3
Total
Accidents Mid-6am 6am-Noon Noon-6pm 6pm-Mid Unknown
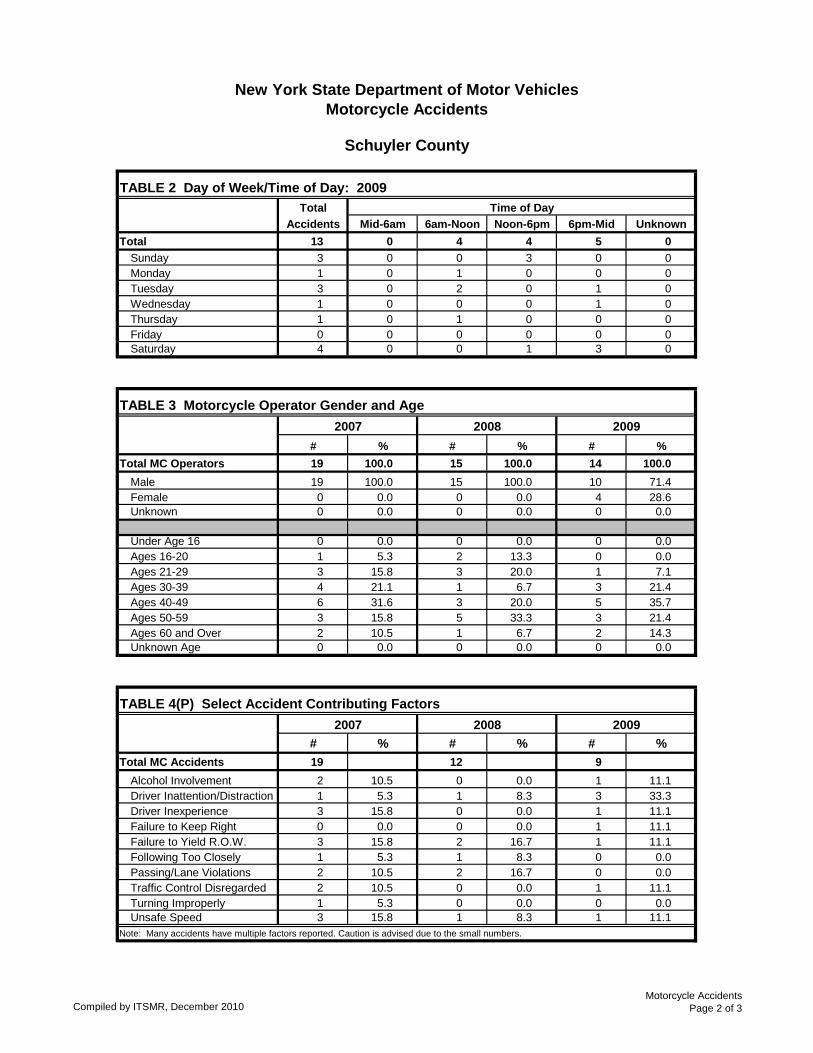
Total 13 0 4 4 5 0
Sunday 3 0 0 3 0 0
Monday 1 0 1 0 0 0
Tuesday 3 0 2 0 1 0
Wednesday 1 0 0 0 1 0
Thursday 1 0 1 0 0 0
Friday 0 0 0 0 0 0
Saturday 4 0 0 1 3 0
# % # % # %
Total MC Operators 19 100.0 15 100.0 14 100.0
Male 19 100.0 15 100.0 10 71.4
Female 0 0.0 0 0.0 4 28.6
Unknown 0 0.0 0 0.0 0 0.0
Under Age 16 0 0.0 0 0.0 0 0.0
Ages 16-20 1 5.3 2 13.3 0 0.0
Ages 21-29 3 15.8 3 20.0 1 7.1
Ages 30-39 4 21.1 1 6.7 3 21.4
Ages 40-49 6 31.6 3 20.0 5 35.7
Ages 50-59 3 15.8 5 33.3 3 21.4
Ages 60 and Over 2 10.5 1 6.7 2 14.3
Unknown Age 0 0.0 0 0.0 0 0.0
# % # % # %
Total MC Accidents 19 12 9
Alcohol Involvement 2 10.5 0 0.0 1 11.1
Driver Inattention/Distraction 1 5.3 1 8.3 3 33.3
Driver Inexperience 3 15.8 0 0.0 1 11.1
Failure to Keep Right 0 0.0 0 0.0 1 11.1
Failure to Yield R.O.W. 3 15.8 2 16.7 1 11.1
Following Too Closely 1 5.3 1 8.3 0 0.0
Passing/Lane Violations 2 10.5 2 16.7 0 0.0
Traffic Control Disregarded 2 10.5 0 0.0 1 11.1
Turning Improperly 1 5.3 0 0.0 0 0.0
Unsafe Speed 3 15.8 1 8.3 1 11.1
Note: Many accidents have multiple factors reported. Caution is advised due to the small numbers.
20082007 2009
TABLE 4(P) Select Accident Contributing Factors
200920082007
Time of Day
New York State Department of Motor Vehicles
Motorcycle Accidents
Schuyler County
TABLE 3 Motorcycle Operator Gender and Age
TABLE 2 Day of Week/Time of Day: 2009
Compiled by ITSMR, December 2010Motorcycle Accidents
Page 2 of 3

# % # % # %
Age Group 21 100.0 13 100.0 14 100.0
Under Age 4 0 0.0 0 0.0 0 0.0
Ages 4-6 0 0.0 0 0.0 0 0.0
Ages 7-15 0 0.0 0 0.0 0 0.0
Ages 16-17 1 4.8 0 0.0 0 0.0
Ages 18-20 0 0.0 1 7.7 0 0.0
Ages 21-29 4 19.0 3 23.1 1 7.1
Ages 30-39 3 14.3 1 7.7 4 28.6
Ages 40-49 7 33.3 3 23.1 5 35.7
Ages 50-59 4 19.0 4 30.8 3 21.4
Ages 60-69 2 9.5 0 0.0 1 7.1
Ages 70 and Over 0 0.0 1 7.7 0 0.0
Unknown Age 0 0.0 0 0.0 0 0.0
# % # % # %
Motorcyclists 21 100.0 11 100.0 11 100.0
No Helmet Used 1 4.8 0 0.0 0 0.0
Helmet Used 18 85.7 10 90.9 10 90.9
Unknown 2 9.5 1 9.1 1 9.1
# % of NYS # % of NYS
2005 808 0.3 1,788 0.3
2006 871 0.3 1,827 0.3
2007 917 0.3 1,877 0.3
2008 1,029 0.3 1,929 0.3
2009 1,023 0.3 1,948 0.3
2007
Schuyler County
Motorcycle Accidents
New York State Department of Motor Vehicles
TABLE 6(P) Reported Safety Equipment Use for Motorcyclists Killed or Injured
TABLE 5 Motorcyclists Killed or Injured by Age Group
20092008
MC Registrations MC Licenses
TABLE 7 Motorcycle Registrations / License Endorsements
200920082007
Compiled by ITSMR, December 2010Motorcycle Accidents
Page 3 of 3

SECTION 5
Ticket Data

2007 2008 2009
TOTAL TICKETS ISSUED 3,728 3,513 4,169
SPEED (V&T 1180) 785 719 694 % of total tickets 21.1% 20.5% 16.6% % convicted on same charge (of adjudicated cases) 61.8% 60.4% 51.4%
SAFETY RESTRAINTS (V&T 1229c) 268 237 284 % of total tickets 7.2% 6.7% 6.8% % convicted on same charge (of adjudicated cases) 88.6% 85.5% 85.0%
Tickets for Non-Restrained Children (Under Age 16) 10 11 16
IMPAIRED DRIVING (V&T 1192) 248 199 204 % of total tickets 6.7% 5.7% 4.9%
Persons Arrested for Impaired Driving (N=142) (N=111) (N=112)Case adjudicated 91.6% 91.9% 95.5%Case pending 8.4% 8.1% 4.5%
Adjudicated Cases* (N=130) (N=102) (N=107)Convicted on original 1192 charge 60.8% 64.7% 49.5%Convicted on other 1192 charge 30.8% 28.4% 42.1%Convicted on non-1192 charge 1.5% 2.0% 0.0%Dismissed/Acquitted/Convicted on charge
associated with different event 6.9% 4.9% 8.4%
* Since some drivers are charged with more than one alcohol offense during a single traffic stop, conviction rates are based on drivers who have had at least one offense adjudicated.
Source: NYSDMV TSLED ticket system.
2007 2008 2009
Number of Persons Sentenced to Probation 29 33 19
Number of Persons on Probation 55 71 64
Source: NYS Division of Probation and Correctional Alternatives.
SCHUYLER COUNTY
Tickets Issued and Conviction Rates for Select Violations
SCHUYLER COUNTY
Probation Data for V&T 1192 and 511 Convictions
Compiled by ITSMR, December 2010Enforcement/Adjudication
Page 1 of 3

Schuyler County
Tickets Issued by TSLED Agencies
By Agency Type
59%
16%
26%
62%
15%
24%
60%
18%22%
0%
20%
40%
60%
80%
State Police Local Sheriff/County
2007 2008 2009
All Tickets Seat Belt Tickets
Speed Tickets Persons Ticketed for
Impaired Driving
80%
10% 10%
79%
11% 11%
62%
29%
9%
0%
20%
40%
60%
80%
100%
State Police Local Sheriff/County
2007 2008 2009
59%
16%
25%
61%
12%
27%
67%
9%
24%
0%
20%
40%
60%
80%
State Police Local Sheriff/County
2007 2008 2009
24%27%
49%
24% 23%
52%
27%
22%
51%
0%
20%
40%
60%
State Police Local Sheriff/County
2007 2008 2009
Enforcement/Adjudication
Page 2 of 3

% of % of % of % of % of % of
Enforcement Agency # Shf/Local Co. Total # Shf/Local Co. Total # Shf/Local Co. Total
Schuyler Sheriff alcohol 117 65.7 47.2 98 65.8 49.2 104 69.3 51.0
NCIC 04800 speed 194 60.6 24.7 194 70.5 27.0 167 79.5 24.1
seatbelt 27 50.0 10.1 25 52.1 10.5 26 28.3 9.2
Watkins Glen P.D. alcohol 61 34.3 24.6 51 34.2 25.6 46 30.7 22.5
NCIC 04821 speed 126 39.4 16.1 81 29.5 11.3 43 20.5 6.2
seatbelt 27 50.0 10.1 23 47.9 9.7 66 71.7 23.2
Totals by Agency Type Sheriff and Local alcohol 178 71.8 149 74.9 150 73.5
speed 320 40.8 275 38.2 210 30.3
seatbelt 54 20.1 48 20.3 92 32.4
State Police alcohol 64 25.8 50 25.1 54 26.5
speed 462 58.9 436 60.6 468 67.4
seatbelt 213 79.5 186 78.5 177 62.3
Other alcohol 6 2.4 0 0.0 0 0.0
incl. Park Police speed 3 0.4 8 1.1 16 2.3
seatbelt 1 0.4 3 1.3 15 5.3
County Totalsalcohol 248 199 204
speed 785 719 694
seatbelt 268 237 284
Source: NYSDMV
2009
TSLED Tickets Issued for Selected Violations by Enforcement Agency
SCHUYLER COUNTY
20082007
Enforcement /Adjudication
Page 3 of 3

Institute for Traffic Safety Management and Research 80 Wolf Road, Suite 607 Albany NY 12205-2604
Phone: 518-453-0291 FAX: 518-453-0298 E-mail: [email protected] www.itsmr.org