science cases for a visible interferometer - arxiv · scopes (uts) and the ˘10 as ... 2017 0:30...
TRANSCRIPT

March 22, 2017 0:30 World Scientific Book - 9.75in x 6.5in Science˙cases˙visible page i
September, 29 2015 Science cases for a visible interferometer
Publishers’ page
i
arX
iv:1
703.
0239
5v3
[as
tro-
ph.S
R]
21
Mar
201
7

March 22, 2017 0:30 World Scientific Book - 9.75in x 6.5in Science˙cases˙visible page ii
Publishers’ page
ii

March 22, 2017 0:30 World Scientific Book - 9.75in x 6.5in Science˙cases˙visible page iii
Publishers’ page
iii

March 22, 2017 0:30 World Scientific Book - 9.75in x 6.5in Science˙cases˙visible page iv
Publishers’ page
iv

March 22, 2017 0:30 World Scientific Book - 9.75in x 6.5in Science˙cases˙visible page v
This book is dedicated to the memory of our colleague OlivierChesneau who passed away at the age of 41.
v

March 22, 2017 0:30 World Scientific Book - 9.75in x 6.5in Science˙cases˙visible page vi
vi Science cases for a visible interferometer

March 22, 2017 0:30 World Scientific Book - 9.75in x 6.5in Science˙cases˙visible page vii
Preface
High spatial resolution is the key for the understanding of various astrophysical
phenomena. But even with the future E-ELT, single dish instrument are limited to
a spatial resolution of about 4 mas in the visible whereas, for the closest objects
within our Galaxy, most of the stellar photosphere remain smaller than 1 mas.
Part of these limitations was the success of long baseline interferometry with
the AMBER (Petrov et al., 2007) instrument on the VLTI, operating in the near
infrared (K band) of the MIDI instrument (Leinert et al., 2003) in the thermal
infrared (N band). One of the key point of the AMBER beam combiner was its
capability of combining high spatial resolution observations with spectrally resolved
measurements thanks to its spectrograph (Petrov, 1988) and the fact that it can
combine up to 3 telescopes. MIDI was limited to 2 telescopes baselines and a poor
spectral resolution allowing for broad band observations but with a higher sensi-
tivity. Thanks to its 3 beams combiner, AMBER was also able to measure closure
phases which was very useful to evidence various asymmetries in many objects.
In 2010, VEGA (Mourard et al., 2011) was able to combine simultaneously up
to 4 telescopes while the fringes were externally stabilized with MIRC (Monnier
et al., 2008) in medium spectral resolution, i.e. 5000. More recently, PIONIER (Le
Bouquin et al., 2011) was also able to combine routinely up to 4 telescopes with a
limited spectral resolution but a very good sensitivity which enables image recon-
structions of faint binaries or extended sources, such as circumstellar disks around
pre-main sequence stars.
In the following year, GRAVITY (Eisenhauer et al., 2011), a four way beam
combination second generation instrument for the VLTI will be installed in Paranal.
GRAVITY will be able to measure astrometric distances between objects located
within the 2′′
field-of-view of the VLTI. With the sensitivity of the 8 meters tele-
scopes (UTs) and the ∼10 µas astrometric precision, it will allow to measure orbital
motions within the galactic center with unprecedented precision. More or less at the
same period, MATISSE (Lopez et al., 2014), a mid-infrared spectro-interferometer
vii

March 22, 2017 0:30 World Scientific Book - 9.75in x 6.5in Science˙cases˙visible page viii
viii Science cases for a visible interferometer
(from 3 to 13 µm) combining the beams of up to 4 UTs or Auxiliary 1.8m Telescopes
(ATs) of the VLTInterferometer, will extend the astrophysical potential of the VLTI
by overcoming the ambiguities existing in the interpretation of simple visibility mea-
surements from MIDI and will enable direct image reconstruction. MATISSE key
science programs cover the formation and evolution of planetary systems, the birth
of massive stars as well as the observation of the high-contrast environment of hot
and evolved stars.
In the visible, after decades of spectrally resolved interferometry with respec-
tively I2T, GI2T and VEGA on the CHARA array (Mourard et al., 2009a) we
have decide to push for a new instrument in the visible which will allow direct
image reconstruction, following the PIONIER success as well as high spectral res-
olution, from the VEGA concept. In this direction a prototype, named FRIEND
(Fibered and spectrally Resolved Interferometric Experiment - New Design) as been
designed and was already tested onto the sky (Berio et al., 2014a). Having a visible
instrument on the VLTI seems to be promising since by reducing by a factor 4 the
observing wavelength (going from the K band to the visible) is equivalent, regard-
ing the spatial resolution, to an increase by a factor 4 of the baseline length, i.e.
reaching a nearly kilometric baseline. This future instrument can also be installed
on the CHARA array, an US facility with 6 telescopes of 1m which will be equipped
with adaptive optics.
With the idea to develop strong science cases for a future visible interferome-
ter, we have organized a science group around the following main topics: Pre-main
sequence stars, Main sequence stars, Fundamental parameters, Asteroseismology,
Pulsating stars, Evolved stars, Massive Stars, Active Galactic Nuclei (AGNs) and
Imaging technics. A meeting was organized in January 15 & 16, 2015 in Nice with
the support of the Action Specific in Haute Resolution Angulaire (ASHRA), the
Programme National en Physique Stellaire (PNPS), the Lagrange Laboratory and
the Observatoire de la Cote d’Azur, in order to present and discuss possible science
cases for a future visible interferometers. This book presents these science cases
developed with the help of the following people (last name, first name):
- Allard France - Benisty Myriam - Bigot Lionel - Blind Nicolas - Boffin Henri
- Borges Fernandes Marcelo - Carciofi Alex - Chiavassa Andrea - Creevey Orlagh
- Cruzalebes Pierre - de Wit Willem-Jan - Domiciano de Souza Armando - Elvis
martin - Fabas Nicolas - Faes Daniel - Gallenne Alexandre - Guerrero Pena Carlos
- Hillen Michel - Hoenig Sebastian - Irland Michael - Kervella Pierre - Kishimoto
Makoto - Kostogryz Nadia - Kraus Stefan - Labeyrie Antoine - Le Bouquin Jean-
Baptiste - Lebre Agnes - Ligi Roxanne - Marconi Alessandro - Marsh Thomas -
Meilland Anthony - Millour Florentin - Monnier John - Mourard Denis - Nardetto
Nicolas - Ohnaka Keiichi - Paladini Claudia - Perraut Karine - Perrin Guy - Petit

March 22, 2017 0:30 World Scientific Book - 9.75in x 6.5in Science˙cases˙visible page ix
Preface ix
Pascal - Petrov Romain - Rakshit Suvendu - Schaefer Gail - Schneider Jean - Shulyak
Denis - Simon Michal - Soulez Ferreol - Stee Philippe - Steeghs Danny - Tallon-Bosc
Isabelle - Tallon Michel - ten Brummelaar Theo - Thiebaut Eric - Thevenin Frederic
- Van Winckel Hans - Wittkowski Markus - Zorec Juan
I warmly thanks all the contributors for their participation and the redaction of
the following chapters.
Ph. Stee

March 22, 2017 0:30 World Scientific Book - 9.75in x 6.5in Science˙cases˙visible page x
x Science cases for a visible interferometer

March 22, 2017 0:30 World Scientific Book - 9.75in x 6.5in Science˙cases˙visible page xi
Contents
Preface vii
1. Executive summary 1
2. Fundamental properties of main sequence stars from interfero-
metric measurements 11
O. L. Creevey1,2, L. Bigot2, A. Chiavassa2, P. Petit3, F. Allard4
R. Ligi2, N. Nardetto2, D. Shulyak5, M. Wittkowski6
2.1 Introduction . . . . . . . . . . . . . . . . . . . . . . . . . . . . . . . 11
2.2 A Diameters of stars from non time-constrained V2 observations 12
2.2.1 Planetary Systems: stellar diameters for characterisation
of planetary systems and determining planet radii . . . . . 13
2.2.2 Effective temperatures of Population I and II stars and set-
ting the temperature scale. . . . . . . . . . . . . . . . . . 15
2.2.3 Interferometry and Asteroseismology . . . . . . . . . . . . 18
2.2.4 Surface brightness relations, binaries and other applications 21
2.3 B Planet-detection and convection from time sensitive and time
series observations using closure phases and imaging . . . . . . . . 22
2.4 C Spots and limb-darkening using medium-to-high resolution V2
and imaging . . . . . . . . . . . . . . . . . . . . . . . . . . . . . . 23
2.5 Science case summary . . . . . . . . . . . . . . . . . . . . . . . . . 26
2.6 Future Requirements . . . . . . . . . . . . . . . . . . . . . . . . . . 30
3. Interferometry in the visible - Pre-Main Sequence stars 31
K. Perraut1, M. Benisty1, S. Kraus,2 G. Schaefer3, M. Simon1
3.1 Introduction . . . . . . . . . . . . . . . . . . . . . . . . . . . . . . . 31
3.2 Determining their fundamental parameters . . . . . . . . . . . . . . 31
3.2.1 Scientific rationale . . . . . . . . . . . . . . . . . . . . . . . 31
xi

March 22, 2017 0:30 World Scientific Book - 9.75in x 6.5in Science˙cases˙visible page xii
xii Science cases for a visible interferometer
3.2.2 Candidates . . . . . . . . . . . . . . . . . . . . . . . . . . . 33
3.3 Studying their complex environment . . . . . . . . . . . . . . . . . 35
3.3.1 Scientific rationale . . . . . . . . . . . . . . . . . . . . . . . 35
3.3.2 Accretion-ejection tracers . . . . . . . . . . . . . . . . . . . 36
3.3.3 Looking for companions . . . . . . . . . . . . . . . . . . . . 37
3.3.4 Scattered light features . . . . . . . . . . . . . . . . . . . . 38
3.4 Summary of the High-Level Requirements . . . . . . . . . . . . . . 39
3.5 Conclusion . . . . . . . . . . . . . . . . . . . . . . . . . . . . . . . . 40
4. Breaking the frontier to the cosmic distance scale using visible
interferometry of cepheids and eclipsing binaries 41
N. Nardetto1, P. Kervella2, A. Chiavassa2, A. Gallenne3, A. Merand4
D. Mourard1, J. Breitfelder2,
4.1 Introduction . . . . . . . . . . . . . . . . . . . . . . . . . . . . . . . 41
4.2 The physics of Cepheids . . . . . . . . . . . . . . . . . . . . . . . . 42
4.2.1 The projection factor derived from Cepheids in binaries . . 43
4.2.2 The limb-darkening of Cepheids as a constrain on the pro-
jection factor . . . . . . . . . . . . . . . . . . . . . . . . . . 43
4.2.3 The circumstellar environment of Cepheids . . . . . . . . . 45
4.3 The robust BW method combined with Gaia: a constrain on the
period-projection factor relation . . . . . . . . . . . . . . . . . . . . 45
4.3.1 High spectral resolution interferometry of Cepheids as an
indicator of distances? . . . . . . . . . . . . . . . . . . . . . 47
4.4 Eclipsing binaries . . . . . . . . . . . . . . . . . . . . . . . . . . . . 48
4.4.1 The SBCR of early and late-type stars: distances in the
local group . . . . . . . . . . . . . . . . . . . . . . . . . . . 48
4.4.2 The distance of Galactic eclipsing binaries: a cross-check
for the method . . . . . . . . . . . . . . . . . . . . . . . . . 49
4.5 Conclusion . . . . . . . . . . . . . . . . . . . . . . . . . . . . . . . . 49
5. Massive Stars 51
Ph. Stee1, A. Meilland1, F. Millour1, M. Borges Fernandes2,
A. Carciofi3, W-J de Wit4, A. Domiciano de Souza Jr1,
D. Faes5,1, N. Kostogryz6, N. Nardetto1, J. Zorec7
5.1 Massive multiple stars . . . . . . . . . . . . . . . . . . . . . . . . . 51
5.2 Physics of active massive stars . . . . . . . . . . . . . . . . . . . . . 53
5.2.1 Stellar rotation among Be stars . . . . . . . . . . . . . . . 53
5.2.2 Measuring differential rotation on the surface of Bn stars . 54
5.2.3 Physics of B[e] stars . . . . . . . . . . . . . . . . . . . . . . 56
5.2.4 Direct detection of Non Radial Pulsations of massive stars. 59

March 22, 2017 0:30 World Scientific Book - 9.75in x 6.5in Science˙cases˙visible page xiii
Contents xiii
6. Evolved stars, Planetary Nebulae, δ Scuti, and RR Lyrae as seen
by a visible interferometer 63
C. Paladini1, A. Chiavassa2, K. Ohnaka3, N. Fabas4,5
M. Hillen6, N. Nardetto2, van Winckel H.6, Wittkowski M.7, M.
Ireland8, J.D. Monnier9
6.1 Asymptotic Giant Branch Stars . . . . . . . . . . . . . . . . . . . . 63
6.1.1 The dust distribution around AGB stars . . . . . . . . . . 64
6.1.2 Mapping magnetic fields and velocity fields over the surface
of stars . . . . . . . . . . . . . . . . . . . . . . . . . . . . . 65
6.1.3 Spatially resolving the chromosphere and its dynamics . . . 65
6.1.4 Probing the MOLsphere with TiO lines . . . . . . . . . . . 66
6.1.5 Geometrical characterization of shock waves in Mira stars 66
6.1.6 Requirements for the science cases of AGB stars . . . . . . 66
6.2 Red Supergiant Stars . . . . . . . . . . . . . . . . . . . . . . . . . . 67
6.2.1 Requirements . . . . . . . . . . . . . . . . . . . . . . . . . . 68
6.3 Post-AGB . . . . . . . . . . . . . . . . . . . . . . . . . . . . . . . . 69
6.3.1 Locating the continuum scattered light around post-AGB
binaries . . . . . . . . . . . . . . . . . . . . . . . . . . . . . 70
6.3.2 Tracing the inner gas streams in post-AGB binaries: accre-
tion disk and/or jet? . . . . . . . . . . . . . . . . . . . . . . 71
6.3.3 Requirements . . . . . . . . . . . . . . . . . . . . . . . . . . 71
6.4 The projection factor of δ Scuti and RR Lyrae stars . . . . . . . . 72
6.5 Pulsating stars in binaries . . . . . . . . . . . . . . . . . . . . . . . 74
7. Interacting binaries 77
N. Blind1, H. Boffin2, M. Borges Fernandes3, A. Gallenne4, C.
Guerrero Pena5, M. Hillen6, A. Labeyrie7, T. Marsh8, M. Simon9,
F. Milllour1, N. Nardetto1, D. Steeghs8, T. ten Brummelaar10,
7.1 Binaries . . . . . . . . . . . . . . . . . . . . . . . . . . . . . . . . . 77
7.2 Finding a companion . . . . . . . . . . . . . . . . . . . . . . . . . . 80
7.3 Determining accurate masses . . . . . . . . . . . . . . . . . . . . . 81
7.4 Probing the mass transfer mechanism . . . . . . . . . . . . . . . . . 83
7.5 A case in point: SS Lep . . . . . . . . . . . . . . . . . . . . . . . . 85
7.6 Going to the Visible . . . . . . . . . . . . . . . . . . . . . . . . . . 85
8. Imaging, Technics and the FRIEND prototype 89
F. Millour1, Ph. Berio1, Labeyrie Antoine2, Mourard Denis1,
Schneider Jean3, Soulez Ferreol4, Tallon-Bosc Isabelle4, Tallon
Michel4, Ten Brummelaar Theo5, Thiebaut Eric4
8.1 The CHARA Array . . . . . . . . . . . . . . . . . . . . . . . . . . . 89

March 22, 2017 0:30 World Scientific Book - 9.75in x 6.5in Science˙cases˙visible page xiv
xiv Science cases for a visible interferometer
8.2 The VLTI Array . . . . . . . . . . . . . . . . . . . . . . . . . . . . 89
8.3 Polychromatic data . . . . . . . . . . . . . . . . . . . . . . . . . . . 90
8.4 Optimal number of telescopes to use and baselines length . . . . . 91
8.5 Recombination scheme . . . . . . . . . . . . . . . . . . . . . . . . . 92
8.6 The FRIEND prototype . . . . . . . . . . . . . . . . . . . . . . . . 92
9. AGNs 95
R.Petrov1, S. Rakshit1 E. Martin2, M. Kishimoto3, A. Marconi4,
A. Meilland1, F. Millour1, G. Weigelt5
9.1 Active Galactic Nuclei . . . . . . . . . . . . . . . . . . . . . . . . . 95
9.2 Accretion Disks . . . . . . . . . . . . . . . . . . . . . . . . . . . . . 96
9.3 Broad Line Region . . . . . . . . . . . . . . . . . . . . . . . . . . . 96
9.4 Narrow Line Region . . . . . . . . . . . . . . . . . . . . . . . . . . 101
9.5 Dust Torus . . . . . . . . . . . . . . . . . . . . . . . . . . . . . . . 101
9.6 Specifications of Visible Interferometry for AGN Science . . . . . . 102
Bibliography 103

March 22, 2017 0:30 World Scientific Book - 9.75in x 6.5in Science˙cases˙visible page 1
Chapter 1
Executive summary
In this executive summary I have tried to extract the most important science cases
from the various topics discussed during the Nice meeting. For more details please
read the corresponding contribution in the following chapters.
Fundamental properties of main sequence and sub-giant stars:
A major topic is the diameters estimation of planet-hosting stars for charac-
terization of planetary systems and in particular to determine the planet’s radius.
This requires up to 2% precision on the visibility measurements. Determining the
effective temperatures of metal-poor stars for setting the temperature scale is also
fundamental. The interferometric temperatures provide reference points for fix-
ing the effective temperature scale. This thus allows a more precise and accurate
determination of the chemical abundances of more distant stars for studying the
chemical evolution of our Galaxy. Radii and effective temperatures can be used for
calibrating the 1D mixing-length parameter in stellar evolution models and deter-
mining ages of stars. Interferometric radii are complementary to asteroseismic data
for solar-like stars, for determining precise masses (3%) and ages (10%). Magnetic
inflation of cool, rapidly rotating stars can also be studied. Closure phases and
imaging of stellar granulation and detection of planetary transits are possible in
the visible as well as limb-darkening and surface spots and surface inhomogeneities
determination in stars across the HR diagram. For that purpose, the following
requirements are the most important in terms of fundamental parameters of main-
sequence and sub-giant stars: Increase of the angular resolution and sensitivity and
for higher precision, more telescope time is needed.
Pre-Main Sequence Stars:
The young stellar objects (YSOs) present a strong science case for interferome-
try in the visible. Interferometric imaging and spectroscopy will provide unique and
complementary data for understanding star and planet formation. The techniques
will probe the innermost regions of protoplanetary disks and will enable diameter
measurements of stars still contracting to the main sequence. The science case is
1

March 22, 2017 0:30 World Scientific Book - 9.75in x 6.5in Science˙cases˙visible page 2
2 Science cases for a visible interferometer
very challenging mainly because of the brightness of targets. Determining the fun-
damental parameters of pre-main sequence stars is certainly a key subject. For in-
stance measuring the angular diameter of Nearby Young Moving Groups (NYMGs)
provide their physical diameter and hence an independent measurement of their age.
Revealing complex structures around young stellar objects such as spirals, gaps, and
holes at distances of few tens of astronomical units, probing the innermost regions
are key processes for the star-disk-protoplanet(s) interactions. Accretion-ejection
tracers is also possible by studying the HeI 10830 nm line as well as recombination
and forbidden lines. Companions hunting by high-contrast imaging is a key issue
for pre-main sequence stars formation studies and scattered light studies tin the
visible can reveal asymmetric structures that might be linked to planet formation.
Breaking the frontier to the cosmic distance scale using visible interferometry of
cepheids and eclipsing binaries
The general concept is to strengthen the physics of Cepheids. High-spectral
resolution visible interferometry can be a very robust tool to bring new constrain
on the dynamical structure of Cepheids’ atmosphere, but could also provide a novel
method of distance determination. The study of the projection factor derived from
Cepheids in binaries can be done by the detection and characterization of more
Cepheids in binary systems. Such detections are crucial since they bring new con-
strain on the mass of Cepheids and could help in resolving the Cepheid mass dis-
crepancy and they allow a geometrical determination of the projection factor. The
limb-darkening of Cepheids as a constrain on the projection facto is also a key
topic. A precision of 5% on the visibility in the second lobe would give the average
value of the limb-darkening of the star at about 1% of precision. But even better,
1% on the visibility in the second lobe would provide the time-dependency of the
limb-darkening of the star with a 5σ detection. The precision of the projection
factor and the physics of the photosphere of Cepheids would be greatly improved
with such unique measurement. Characterizing the circumstellar environment of
Cepheids in the visible is mandatory since the circumstellar envelopes we have dis-
covered around several Galactic Cepheids create a positive bias on their apparent
luminosity. The robust Baade-Wesselink method combined with Gaia can put a
constrain on the period-projection factor relation. For instance a 2% precision on
the distance (or similarly 2% on the projection factor) for 75 Cepheids with CHARA
and 40 with VLTI would lead to a 2% precision on the individual projection factors
bringing exciting result on the period-projection factor relation. High spectral res-
olution interferometry of Cepheids as an indicator of distances is very promising.
Spectro-interferometry within metallic or even Hα lines of Cepheids will become
possible with future visible interferometers. Spectro-interferometry could be used
to apply a new method of distance determination (with a 15σ detection or 5% in
precision on the individual angular diameter for only one measurement. Moreover,

March 22, 2017 0:30 World Scientific Book - 9.75in x 6.5in Science˙cases˙visible page 3
Executive summary 3
the surface-brightness color-relation (SBCR) of early and late-type stars allows the
determination of distances in the local group. With a new generation of visible
long-baseline interferometry it could be possible to measure orbital separations of
a large sample of Galactic eclipsing binaries. Thus, we could compare several types
of distances:
• The distance derived from the interferometric measurement of the separa-
tion (combined with spectroscopy)
• The distance derived from the classical approach: photometry, spectroscopy
are used to derive the individual radii and are combined with the angular
diameter obtained from SBCR relation
• If the individual angular diameter of the system are resolved by interferom-
etry, once combined with individual radii (classical approach), it provides
another estimate of the distance
• The distance from trigonometric parallaxes with Gaia.
These different approaches will greatly help in resolving some possible system-
atics in the method.
Finally, a next generation interferometer in the visible, with high precision mea-
surements, 6 telescopes with baselines of 300m, but also high spectral resolution
would be extremely important to reach the 1% precision and accuracy on the dis-
tances in our Galaxy and beyond, but also to understand the physics of Cepheids
and eclipsing binaries. Such improvements are crucial to reduce the precision and
systematics on the Hubble constant.
Massive Stars
Massive multiple stars studies is actually a key topic in massive stars formation
theories. Interferometry in the visible is able to resolve binaries with separations
ranging between 1 and 40 mas (at 0.6 µm). Establishing the distribution of binary
separations and of mass ratios is essential to constrain the influence of mass loss and
mass transfer on the evolution of high-mass binaries and to ascertain the origin and
properties of their remnants. The nature of the circumstellar environment (CE) of
active massive stars is central to understand many issues related to these objects.
As a natural tracer of mass-loss, the study of this material is crucial to improve
massive star evolution models. Moreover, the effect of rotation on the non-spherical
distribution of mass-loss for these luminous objects is an active subject of debate.
This is especially for classical Be stars which are known to be the fastest-rotating
non-degenerated stars. To make progress in the understanding of these objects
and the role of rotation in mass-loss processes, one needs to accurately determine
the structure of their CE. By providing simultaneously high spatial and spectral
resolution, interferometry in the visible is particularly well suited for the study of

March 22, 2017 0:30 World Scientific Book - 9.75in x 6.5in Science˙cases˙visible page 4
4 Science cases for a visible interferometer
these objects. Measuring differential rotation on the surface of Bn star is a new
and challenging subject. The measurement of the ratio of the centrifugal and the
gravitational force at the stellar equator is crucial if we would like to know how close
are Be stars to the critical rotation. Unfortunately, Be stars can have photospheric
spectral lines marred by emission/absorptions due to their circumstellar disc. Bn
stars, which are nearly as fast rotators as Be stars, don’t have spectra perturbed by
circumstellar matter, so that the study of their apparent geometry can be carried
out more properly and reliably. Moreover, due to the rapid rotation, the surface ge-
ometry of Bn and Be stars is highly deformed. The surface angular velocity can be
dependent on the stellar latitude. Then, not only the centrifugal force acting on the
stellar surface, but also the effective temperature distribution (Von Zeipel effect)
should depend on the particular surface rotation law. In order to constrain this
differential rotation we definitely need an interferometric instrument in the visible
since it the only way to combine high spatial resolution (for our purpose we need
to reach ∼ 0.2 mas) and spectral resolution as high as 100000 in order to reach 0.1
A in spectral lines. The direct detection of Non Radial Pulsations of massive stars
is foreseen with a visible instrument. We propose to detect non-radial pulsations
by differential interferometry using the dynamic spectra of photocenter shift vari-
ability characterized by bumps traveling from blue to red within the spectral lines.
The theoretical estimation of expected signal-to-noise ratios in differential speckle
interferometry demonstrated the practical applicability of the technique to a wide
number of sources. We finally remind that up to now, interferometric studies of
active hot and massive stars have produced the largest contributions of referred pa-
pers using the VLTI/AMBER and CHARA/VEGA instruments. This is certainly
due to the fact that they are bright (many sources have mv < 7) with diameters
well suited for current interferometric baselines, i.e. central stars with diameters ∼0.5 mas and circumstellar disk of a few mas. These properties will certainly also
benefit from a future visible interferometric instrument.
Evolved stars, Planetary Nebulae, δ Scuti, and RR Lyrae as seen by a visible
interferometer
Determining the dust distribution around Asymptotic Giant Branch (AGB)
Stars is certainly a key topic. The atmosphere of an AGB star is cool enough to
allow formation of various dust species. Dust plays a crucial role in the stellar wind,
although there are some cases where the dynamics is not completely understood.
The gain of going to the visible to study the dust distribution around AGBs is that
the scattering from dust contribution becomes more important. The challenge is the
fact that dusty stars become fainter. The size of the photosphere in the visible will
be in average < 10 mas,but the dust component is expected to be more extended,
especially for the nearby objects. Mapping magnetic fields and velocity fields over
the surface of stars will also be possible. The spatially resolved spectra of regions

March 22, 2017 0:30 World Scientific Book - 9.75in x 6.5in Science˙cases˙visible page 5
Executive summary 5
with strong local magnetic fields (e.g., starspots) would show the Zeeman splitting,
which enables us to map the magnetic fields over the surface of stars. Spatially re-
solving the chromosphere and its dynamics is very interesting. We propose to image
the chromosphere and derive its physical properties by interferometry of the Hα and
Ca II lines. High resolution imaging would help to understand the heating mecha-
nism of the chromosphere, its role in the mass loss, and why it can coexist with the
molecular component. Another promising subject is to probe the MOLsphere with
TiO lines thanks to a visible instrument. The MOLsphere is quasi-static, dense,
warm molecular layers extending to several stellar radii and exists not only in Mira
stars but also in normal red giants and red supergiants. Spatially resolving the stars
in the TiO lines helps to better understand the structure of the outer atmosphere.
Given that TiO may serve as seed nuclei for dust formation, it is important to know
the physical properties of TiO layers for understanding the dust formation. The
geometrical characterization of shock waves in Mira stars is foreseen in the visible.
Radially pulsating AGB stars (a.k.a. Mira stars) are characterized by strong emis-
sion in the Balmer lines linked to the propagation of a strong hypersonic radiative
shock waves. Spectro-interferometry in the visible would help establish the shape
and time evolution of these shock waves, all of this in comparison to the shape and
evolution of the photosphere. The study of AGB Stars is very promising. AGBs are
very luminous and have extended atmosphere, therefore they become naturally the
first objects to be observed with infrared interferometry. When moving to the visi-
ble though one has to be careful. In fact many evolved AGBs will be faint because of
dust obscuration. Typical magnitudes for the most evolved Mira variables will vary
between 8 and 13 mag in the V-band. One has also to take into account the fact
that Mira variable will change their brightness of up to 9 magnitude within one year.
Imaging programs will have to take this into account, and a proper number of tele-
scopes (6+) or a fast system to change configuration (in the current VLTI scheme:
3 configurations within 2 weeks maximum) are needed. Massive evolved stars with
masses between roughly 10 and 25 M spend some time as red supergiant (RSG)
making them the largest stars in the universe. The understanding of the physics of
their convective envelope is crucial for these stars that contribute extensively to the
dust and chemical enrichment of the galaxies. Moreover, the mass-loss significantly
affects the evolution of massive stars, and it is a key to understanding the progeni-
tors of core-collapse supernovae. The effects of convection and non-radial waves can
be represented by numerical multi-dimensional time-dependent radiation hydrody-
namics (RHD) simulations with realistic input physics carried out with CO5BOLD
code. These simulations have been used extensively employed to predict and inter-
pret interferometric observations. Optically-bright post-AGB stars are commonly
found in binary systems with separations of typically 1 AU and that are surrounded
by rather compact, stable circumbinary disks. These disks are very similar to the
protoplanetary disks (PPDs) around young stars. However, the formation history
of post-AGB disks is clearly different from PPDs, as is the further evolution of the

March 22, 2017 0:30 World Scientific Book - 9.75in x 6.5in Science˙cases˙visible page 6
6 Science cases for a visible interferometer
illuminating star. A visible interferometric instrument is highly needed to extend
the constraints on the parameter space of the models beyond what the ALMA and
the second-generation instruments on the VLTI are able to provide. Visible in-
terferometry can provide unique additional insights and constraints. There are, in
particular, two fundamental questions that can be addressed by such an instrument:
Locating the continuum scattered light around post-AGB binaries and tracing the
inner gas streams in post-AGB binaries: accretion disk and/or jet ? Finally, as
for Cepheids, the projection factor of δ Scuti and RR Lyrae stars can be con-
strained. The objective is to derive the expected period-projection factor relation
of RR Lyrae and High-Amplitude δ Scuti stars (HADS) by applying the inverse
BW method. HADS are generally supposed to pulsate radially. However, weak
non-radial pulsation could be detected using long baseline visible interferometry.
In that case, the Baade-Wesselink method, if revised, can constitute an interesting
tool to distinguish radial and non-radial modes of pulsation. Last but not least,
another very interesting aspect is to study pulsating stars in binaries in order to
measure their orbital solution with interferometry and derive their mass, which put
important constrains on the evolutionary models. It concerns not only δ Scuti stars,
but also RR Lyrae, β Cepheids, γ Dor and RoAp stars.
Interacting binaries
The presence of a companion will be betrayed by its signature in the interfero-
metric signal. If the difference in magnitude between the two objects is less than
6, i.e. the contrast in flux is about 200 or less, then current interferometers such as
PIONIER on ESO’s Very Large Telescope can detect the companion, using visibili-
ties and closure phases provided there is an error of 0.5 degrees or less on the latter
(Le Bouquin et al. 2011). Once the companion has been detected, it is then possi-
ble to follow the relative orbital motion of the two components, providing a visual
orbit, which coupled with radial velocities measurements lead to the measurement
of the masses of the two stars. Working at high spectral resolution allows one to
probe the smallest interacting systems by spectro-astrometry. While the giant is
in generally dominating the continuum emission in the visible domain, the faint
companion is situated in the energetic accretion zone presenting strong emission
line like Hα. The photocentre of the binary, centred on the giant companion in the
continuum, shifts towards the accretor in the line, which could be measured by help
of differential phases. A simple calculation and the experience gained on VEGA
show that reaching precision of order 10 µas or better is well within reach, and is
therefore able to probe the most compact semi-detached systems. Mass is the most
crucial input in stellar internal structure modeling. It predominantly influences
the luminosity of a star and, therefore, its lifetime. Unfortunately, the mass of a
star can generally only be determined when the star belongs to a binary system.

March 22, 2017 0:30 World Scientific Book - 9.75in x 6.5in Science˙cases˙visible page 7
Executive summary 7
Therefore, modeling stars with extremely accurate masses (better than 1 %), in
different ranges of masses, would allow to firmly anchor the models of the more
loosely constrained single stars. Interferometry in the visible is quite suitable for
that, as already demonstrated by PIONIER: it observes the relative orbits instead
of the photocentric ones, and this compensates the fact that the accuracy of the
instrument is a bit worse than that of Gaia. For systems which are double-lined
spectroscopic binaries, that is, for which we already have the mass ratio, as well as
the orbital period and eccentricity, using interferometry to make it a visual binary,
allows us to determine the remaining parameters, i.e. the inclination and the indi-
vidual masses. This thus allows obtaining precise stellar masses. Symbiotic stars
show a composite spectrum, composed of the absorption features of a cool giant,
in addition to strong hydrogen and helium emission lines, linked to the presence
of a hot star and a nebula. It is now well established that such a “symbiosis” is
linked to the fact that these stars are active binary systems, with orbital periods
between a hundred days and several years. In such systems, the red giant is losing
mass that is partly transferred to the accreting companion – either a main sequence
(MS) star or a white dwarf (WD). One of the main questions related to symbiotic
stars is how the mass transfer takes place: by stellar wind? Through Roche-lobe
overflow (RLOF)? Or through some intermediate process? Answering this question
requires being able to compare the radii of the stars to their Roche lobe radius
(which depends on the separation and the mass ratio). However, determining the
radius of the red giant in symbiotic systems is not straightforward, and there has
always been some controversy surrounding this. Optical interferometry is currently
the only available technique that can achieve this. It allows determining the size
and the distortion of the giant star, and in some cases, the orbital parameters of
the system, without any a priori on their characteristics.
Imaging, technics and the FRIEND prototype.
For the CHARA array an important limitation for imaging purposes is the lim-
itation of short baselines. Adding one telescope would be an interesting idea to
boost its imaging capabilities. The VLTI has larger telescopes but no visible beam
combiner up to now. The VLTI is not yet ready for visible light combination, and
a few technical tweaks need to be implemented to enable UBV bands (RIJ do go
through already). The MACAO dichroic would need to be changed and we are
wondering if one would be able to select between different dichroic/semi-reflecting
plates. The guiding strategy should also be modified. Regarding the polychromatic
data there is already some existing tools thanks to the JMMC to prepare interfer-
ometric observations and make some model fitting such as ASPRO, LITPro and
searchCal. On the other side, a new visible instrument will provide differential visi-
bilities and differential phases, as do VEGA, AMBER and MIDI today but current
tools (LITpro, MIRA, BSMEM) used squared visibilities and closure phases only.
Some developments have occurred to take chromatic information into account. The
POLCA project has successfully developed tools for handling polychromatic data.

March 22, 2017 0:30 World Scientific Book - 9.75in x 6.5in Science˙cases˙visible page 8
8 Science cases for a visible interferometer
In image reconstruction, new algorithms are now able to reconstruct full 3D poly-
chromatic maps from all available interferometric data. Project POLCA has also
allowed improvements in LITpro model fitting software, by including for instance
VEGA differential visibilities taking nutrimental chromatic artifacts into account.
Spectral resolution is also important for helping regularizations in image recon-
struction, for instance when there is a large continuum with various spectral lines.
PIONIER instrument was missing the spectral information which would have been
better for data interpretation. VEGA has spectroscopic capabilities but is limited
due to saturation effects on the detector. Varying spectral resolution as a function of
baseline length is a powerfull method in some hyperspectral remote sensing studies
since high frequency information position is not going to change much depending
on high frequency baseline. The spectrum of the object is also quite important for
image reconstruction. For the number of telescopes and the baselines length, a pos-
sibility would be many telescopes with few delay lines that can be switched quickly
wheres another option would be a continuously following of one baseline along time
with a high frequency of recording. A minimum is certainly 4 telescopes and differ-
ent configurations to make imaging. Experience at CHARA with MIRC shows that
6 telescopes is a strict minimum for snapshot imaging. In the same direction we re-
call that the Plateau de Bure interferometer of IRAM was only able to make direct
images when the telescope network was extended to 6 antennas within 10 years and
that actually the NOEMA project is extended the array to 12 antennas. Regarding
the baselines length, short baseline are really mandatory for imaging purposes in
order to fix features in the field of view. Longest baselines are not always usable
due to SNR issues, and short baselines are needed to get the low frequencies. This
pushes the need of additional telescopes. In the next 2 or 3 years, the two major
interferometric arrays, VLTI and CHARA, will equip their telescopes of 1.8m and
1m respectively with Adaptive Optics (AO hereafter) systems. This improvement
will permit to apply with a reasonable efficiency in the visible domain, the principle
of spatial filtering with single mode fibers demonstrated in the near-infrared. It will
clearly open new astrophysical fields by taking benefit of an improved sensitivity
and state-of-the-art precision and accuracy on interferometric observables. To pre-
pare this future possibility, we started the development of a demonstrator called
FRIEND (Fibered and spectrally Resolved Interferometric Experiment - New De-
sign). FRIEND combines the beams coming from 3 telescopes after injection in
single mode optical fibers and provides some spectral capabilities for characteriza-
tion purposes as well as photometric channels. It operates in the R spectral band
(from 600nm to 750nm) and uses the world’s fastest and more sensitive analogic
detector OCAM2. Tests on sky at the focus of the CHARA interferometer have
been successfully done in December 2014.
AGNs

March 22, 2017 0:30 World Scientific Book - 9.75in x 6.5in Science˙cases˙visible page 9
Executive summary 9
Active Galactic Nuclei (AGN) are extremely bright sources powered by the accretion
of material on a central super massive black hole (SMBH). They emit more than
1/5 of the electromagnetic power in the universe and a majority of galaxies might
host a central BH triggering some level of nuclei activity. AGNs can be considered
as important contributors and markers for the global history of mass accretion and
galaxy evolution in the Universe. If well understood, they could be used as standard
candles for the evaluation of cosmological distances at redshifts z > 3. Quasars make
the current reference grid for the calibration of GAIA astrometry but, at the tens of
µas accuracy of GAIA, the structure of these sources could have a significant impact
on the definition of their GAIA photocenter. We have an unified model of AGNs
(Antonucci (1993), Urry and Padovani (1995)) that is increasingly considered as
over simplistic but still offers a simple and useful structure to discuss typical sizes
and magnitudes and therefore to contribute to a first evaluation of the potential of
visible long baseline interferometry. This model features a very compact accretion
disk (AD) around the central SMBH, a Broad Line Region (BLR) composed of
high velocity gas clouds producing broad emission lines when this central region is
not obscured by the clumpy dust torus located after the dust sublimation radius.
This dust torus (DT) collimates the light from the central source that can ionize
some narrow line region (NLR) lower velocity gas clouds placed in the non-obscured
double cone and producing narrow emission lines. When an AGN is close to equator-
on, the dust torus shields the BLR, that can be detected only in polarized light
reprocessed by the more far away NLR clouds. Some AGNs emit high velocity jets.
Observations in the visible would bring a decisive improvement, if the interfer-
ometer can be made sensitive enough in that spectral band. First we will gain in
resolution by a factor 4 compared to near-infrared observations. Second we will be
allowed to use Balmer lines (for low z sources) that are 3 to 20 times stronger than
the Paschen and Bracket lines available in the near IR. The combination of these
two effects would yield a significant gain in the accuracy of quasar parallax distance
measurements, as well as in the other parameters measures such as the masses. It
will also strongly enhance the possibility to image gas in direct relation with the
dust torus.
Another major advantage of visible observations is to allow a direct combination
with RM observations that have so far been made almost exclusively in the visible,
without the need to use models to correct the relative scales in the visible and in
the IR, nor having to launch very long term IR RM campaigns. The condition for
visible observation of BLRs with the VLTI to give a significant contribution is to
be able to observe with a sufficient limiting magnitude in V. A very preliminary
results of a feasibility study of BLR observation in visible using VLTI from Rakshit
et al. (2015), extrapolated from his work for the K band. It shows that:
• At V=14, we would obtain visibility, differential visibility and differential
phase for all the GRAVITY targets (without FT), but with an improved

March 22, 2017 0:30 World Scientific Book - 9.75in x 6.5in Science˙cases˙visible page 10
10 Science cases for a visible interferometer
distance accuracy by typically a factor 10. Such a magnitude could be
achieved with the ATs if they have adaptive optics system providing a
Strehl ratio of 0.5 in the (red) visible. In a few cases we will obtain images
of the gas in or above the dust torus.
• At V=15, we will be able to observe more than 120 quasars. For all K
band VLTI targets we should have substantial distance and mass accuracy
improvements. The exact gains need to be assessed but the very first es-
timate is that we would have more than 50 targets with Quasars parallax
more accurate than 10%. Such a magnitude can be achieved on the UTs
if they are equipped with an AO system providing a Strehl ratio of 10% in
the red visible.

March 22, 2017 0:30 World Scientific Book - 9.75in x 6.5in Science˙cases˙visible page 11
Chapter 2
Fundamental properties of main sequencestars from interferometric measurements
O. L. Creevey1,2, L. Bigot2, A. Chiavassa2, P. Petit3, F. Allard4
R. Ligi2, N. Nardetto2, D. Shulyak5, M. Wittkowski6
1 Insitut d’Astrophysique Spatiale, UMR 8617, Universite de Paris-Sud, 91405,
Orsay, France2 Laboratoire Lagrange, UMR 7293, CNRS, Observatoire de la Cote d’Azur,
Universite de Nice Sophia-Antipolis, Nice, France3 Institut de Recherche en Astrophysique et Plantologie, 14 Avenue Edouard,
Belin, F-31400 Toulouse, France4 Centre de Recherche Astrophysique de LyonEcole Normale Superieure de Lyon,
46 Allee dItalie, 69364 Lyon Cedex 07, France5 Institute of Astrophysics, Georg-August University, Friedrich-Hund-Platz 1,
D-37077 Gottingen, Germany6 ESO, Karl-Schwarzschild-St. 2, 85748, Garching bei Munchen, Germany
2.1 Introduction
Visible interferometry has many applications to main sequence stars: studying ac-
tivity, determining fundamental parameters, and galactic archaeology. and com-
plementary observations for asteroseismology. In this chapter we discuss several
science cases in terms of current and future interferometers. In particular we em-
phasize the need for pushing the sensitivity limits to reach fainter targets and thus
better calibrators and higher signal-to-noise target observations which in turn bring
more confidence to observations such as squared visibilities higher in the visibility
curve, thus giving access to diameters as low as 0.1 mas. In this chapter we cover
the topics of visible interferometry for fundamental parameters, main sequence and
sub-giant stellar evolution and asteroseismology.
To begin with we may ask why we care about main sequence stars of which we
apparently know a lot about. Remember that main sequence stars cover a huge per-
centage of the observable Galaxy, and they are also the main hosts for searching for
11

March 22, 2017 0:30 World Scientific Book - 9.75in x 6.5in Science˙cases˙visible page 12
12 Science cases for a visible interferometer
Earth-like planets. While we have a good understanding of these stars and thus we
can delve into details, there are also some very basic properties that we have a poor
knowledge of. The poor knowledge of such fundamental parameters has implica-
tions for understanding the star. Here fundamental parameters implies stellar radii,
effective temperatures, masses and ages. Imagine we have an excellent grasp on all
of these parameters, then we can calibrate age-rotation relations (gyrochronology)
and thus date whole populations of stars and planet-hosts to constrain their evo-
lution, we can determine very accuracte and precise chemical abundances (because
we know the effective temperature and surface gravity of a star) and in fact we can
then use this precise knowledge to make improvements to stellar models (evolution
and atmosphere) because we have direct indisputable measurements for which, for
example, diffusion theories need to heed or non LTE corrections can be calibrated.
Here we list a non-exhaustive list of some of the main science drivers for determin-
ing fundamental parameters and studying main sequence stars and in the following
sections we describe in more detail how a selection of these topics can benefit only
from long-baseline optical/visible interferometry, and we address the topics in order
of technical requirements.
The following sections are organised as follows, where we note that all require
high angular resolution (> 0.1 mas) hence the need to observe in the visible domain.
Low/Medium spectral resolution:
A Sect. 2.2 No time constraints (sizes, diameters, V2 measurements)
B Sect. 2.3 Time sensitive and time series (convection, planet-detection, clo-
sure phases and imaging measurements)
Medium/High spectral resolution:
C Sect. 2.4 Spots and limb-darkening and needing V2 and closure phases
2.2 A Diameters of stars from non time-constrained V2 obser-
vations
Angular diameters from interferometric visibility measurements provide an impor-
tant input for many different science cases. From a measured angular diameter, and
using complementary information, we determine with very little model dependence
the radius and effective temperature of a star. In many science cases we require
< 2% precision on the angular diameter, with typical “single-shot” observations of
between 4 – 6 hours, over 2 or 3 nights to ensure reliability, with 2 or more tele-
scopes. Depending on the nature of the scientific program, this 2% precision can be
relaxed. The advantage of visible wavelengths over infra-red is notably the ability
to reach a higher angular resolution, e.g. compare 0.2 mas with VEGA (Mourard
et al., 2009b; Ligi et al., 2013) on CHARA to 0.9 mas with Classic on CHARA. The

March 22, 2017 0:30 World Scientific Book - 9.75in x 6.5in Science˙cases˙visible page 13
Fundamental properties of main sequence stars from interferometric measurements 13
CHARA array (McAlister et al., 2012) holds the longest baselines in the world (up
to 330 m), and thus presently provides the ability for the highest angular resolu-
tion. It hosts two visible interferometers VEGA and PAVO (Ireland et al., 2008),
and thus benefit from the best angular resolution in the world (∼ 0.3 mas), despite
a limiting magnitude in the V band of around ∼ 8. The NPOI’s current longest
baseline is 79 m, but in the near future this will reach 432m (Baines et al., 2014).
A new prototype of VEGA, called FRIEND (Berio et al., 2014b), is currently
being tested on CHARA and observes in a similar visible wavelength region, but
can reach higher sensitivity. This will result in higher precision measurements for
brighter stars along with the ability to probe a few magnitudes deeper mV < 10.
These few extra magnitudes contribute significantly to number of interesting targets
to be measured (figure 2.1). Of course not all of these stars will be resolved, but if
we can measure precise visibilities even high on the visibility curve we can attain
a 0.1 mas limit (precision to be tested). In Fig. 2.2 we show the predicted angular
diameter of ZAMS stars as a function of apparent magnitude and spectral type. As
can be seen the ability to probe higher magnitudes is of great interest considering
upcoming missions, such as the TESS mission, which will target bright G and K
stars. In the following section we will discuss a series of scientific drivers.
Fig. 2.1 The number of stars with declinations above –20 (observable from CHARA) as a func-tion of magnitude
2.2.1 Planetary Systems: stellar diameters for characterisation of
planetary systems and determining planet radii
Using transit photometry, the ratio of the planetary-to-star radius Rp/R? can be
determined with very high precision. The precision on the individual planetary
radius Rp thus depends only on the precision on the stellar radius R?. When Gaia

March 22, 2017 0:30 World Scientific Book - 9.75in x 6.5in Science˙cases˙visible page 14
14 Science cases for a visible interferometer
Fig. 2.2 The predicted angular diameters of stars of different spectral types as a function ofmagnitude number of stars grows exponentially as the magnitude limit is extended. The dotted
line is the hard lower limit in angular diameter.
parallaxes become available (2017), the limiting factor for determining a precise
measurement of the stellar radius (for single stars) is the precision on the angular
diameter for which we require up to 2% precision. Currently there are a very
limited number of exo-planetary host stars discovered by the transit method, that
are measureable using interferometry, and these are shown in Fig. 2.3. The blue box
indicates the region where the current visible VEGA interferometer can reach. The
new FRIEND instrument mentioned above which will probe fainter magnitudes,
thus allowing higher sensitivity and better calibrators, will allow us to drop the
lower limit of the blue box to about 0.1 mas. In this case, the star will not be
fully resolved, but with the better precision, accurate measurements high in the
visibility curve will enable these angular diameters to be measured. In this figure
we also indicate the cut-off limit in magnitude of FRIEND. One can see that this
then opens the possibility of adding about 15 stars to the current 1 observable (red
dot shown in the blue box) (Ligi et al., 2015).
In Figure 2.3 (bottom) we show the number of known transiting exoplanet host
stars as a function of magnitude. Already we can see that a small increase in number
is possible down to a magnitude of about V ∼ 10, while within a couple of years
the number of known exoplanet hosts (transiting or RV) will increase exponentially
(TESS/CHEOPS/PLATO).
Apart from characterising directly the planetary radius, the stellar diameter
also provides a very important constraint for determining the mass of the star, in
particular if the stellar density can be derived from light curve fitting. Constraining
the mass, along with the stellar diameter, indicates the evolutionary stage of the
stellar system.

March 22, 2017 0:30 World Scientific Book - 9.75in x 6.5in Science˙cases˙visible page 15
Fundamental properties of main sequence stars from interferometric measurements 15
Fig. 2.3 (Top) Transiting exoplanets host stars with available distance and radius that allow us
to derive their angular diameter. They are plotted according to the ratio θp/θ?, with θp and θ?the planetary and stellar angular diameters. Stars with mV < 10 are plotted in red and those
with mV > 10 in black. The blue box represents the detecting ability of VEGA (Ligi et al., 2015).
(Bottom) Angular diameters of transiting exoplanet host stars as a function of V magnitude.
2.2.2 Effective temperatures of Population I and II stars and set-
ting the temperature scale.
Deriving effective temperatures of stars using classical methods such as spectro-
scopic analyses often encounters difficulties due to missing physics in the atmosphere
models, in particular for those metal-poor or more metal-rich stars. Therefore, using
such methods often leads to large differences in the derived temperatures, surface
gravity and as a consequence the metallicity and chemical abundances and are very
dependent on the method and the models used. A largely model-independent way of

March 22, 2017 0:30 World Scientific Book - 9.75in x 6.5in Science˙cases˙visible page 16
16 Science cases for a visible interferometer
determining their effective temperatures is by using interferometric diameters and
coupling this with the bolometric flux of the star. Combining the diameter with
the parallax yields the radius, and even with a very modest estimate of the mass
of the star, log g can be determined with precisions of less than 0.05 dex (Creevey
et al., 2012, 2014).
The effective temperature itself is not in fact a real physical stellar quantity. It is
defined as the temperature that the star would have if it radiated like a blackbody,
such that the integral of the total radiated flux is equivalent to the integral of the
blackbody. Typically with spectroscopy and photometry observations do not span
the full range of where flux is radiated, but just a very small section, such as a few
tens or hundreds of nm. The most correct way to measure Teff is thus to measure its
total radiation at the surface of the star in all directions and compare this directly
to the integral of a blackbody. However, we can not do this. We can, however,
measure the amount of flux we receive on the top of the Earth’s atmosphere per
unit of radiating surface. If we additionally know the true radius of the star and its
distance (to convert the received flux to absolute flux) we can calculate the total
radiation. This is equivalent to measuring the received bolometric flux of the star
and combining this with its (apparent, seen from the Earth) angular radius. With
interferometry we measure the true definition of the effective temperature.
2.2.2.1 Effective temperature scale
Knowing the true absolute effective temperature scale has vast implications in all
of astrophysics (Casagrande et al., 2011). While we can’t measure it directly for
all stars due to the interferometric constraints, we can measure it for bright stars
and use these along with spectroscopic and photometric measurements to define a
zero-point. The infra-red flux method is an extremely powerful way of estimating
the effective temperatures of stars and can be applied to all stars with infra-red pho-
tometry, in principle to stars of any magnitude. Casagrande et al. has developed
such a method and has shown that this method provides excellent agreement with
interferometric measurements (see Fig. 2 of [Casagrande et al. (2014)]) and thus
provides a method to set the temperature scale and then provide reliable estimates
for determining metallicities and alpha-abundances of stars for studying galactic as-
trophysics. Casagrande et al. (2010) derive colour-temperature-metallicity relations
given in the form of polynomial expansions, and for the Johnson V and 2MASS Ks
dereddened magnitudes this equation can be written as:
θeff = 0.5057 + 0.2600(V −Ks)− 0.0146(V −KS)2
−0.0131(V −Ks)[Fe/H]
+0.0288[Fe/H] + 0.0016[Fe/H]2 (2.1)
where θeff = 5040/Teff applicable in the (V −Ks) range of 0.78 – 3.15 and [Fe/H]
between –5.0 and 0.4. A small error is introduced in the absence of [Fe/H] and for

March 22, 2017 0:30 World Scientific Book - 9.75in x 6.5in Science˙cases˙visible page 17
Fundamental properties of main sequence stars from interferometric measurements 17
the case of the Sun, considering ± 0.5 dex error this corresponds to ±30 K on the
solar effective temperature.
Fig. 2.4 Spectroscopic determinations of the Teff , log g and [Fe/H] of the metal-poor giant
HD 122563 (Soubiran et al., 2010). The interferometric Teff±1σ is illustrated by the grey shadedregion (Creevey et al., 2012).
2.2.2.2 Calibrating large scale survey data and their methods
Such interferometric measurements are used also to validate spectroscopic models
and methods. In particular if Teff and log g are known a priori, studies targeting
improvements of stellar atmospheres can be performed. Spectroscopic analyses of
these stars then provides, theoretically, more accurate and precise metallicities and
abundances. For large scale missions, such as Gaia and the Gaia-ESO survey, use of
interferometry plays a foremost role for validating the methods that will be applied
to analyse hundreds of thousands of fainter targets and for ensuring the calibration
of the data. Heiter et al. (submitted) published a list of 34 benchmark stars for
which Teff and log g from the literature were critically analysed and compared with
interferometric measurements. They conclude that indeed largest discrepancies are
found for the coolest and most metal-poor stars. Figure 2.4 shows a comparison
between the effective temperature determined by Creevey et al. (2012) and spec-
troscopic values determined from the literature Soubiran et al. (2010). It illustrates
the consequences on the metallicity and log g determination if all three parameters
need to be fitted in spectroscopic analyses. Understanding the biases in these de-
terminations is important for eliminating systematic errors arising from either the
method or the (simplified) models used. Jofre et al. (2014) published iron abun-
dances for these same stars by fixing the effective temperatures and log g. Some of

March 22, 2017 0:30 World Scientific Book - 9.75in x 6.5in Science˙cases˙visible page 18
18 Science cases for a visible interferometer
Star [Fe/H]
HD 122563 –2.64
HD 140283 –2.36
HD 84937 –2.03
µ Cas –0.81
ε For –0.60
τ Cet –0.49
18 Sco +0.03
Sun +0.03
δ Eri +0.06
these are reproduced in Table 2.1 listed in order of increasing iron abundance. The
largest sources of errors (thus contributing to the uncertainties) arise from non LTE
corrections for the poorest metal-poot stars.
2.2.2.3 Metal-poor stars
Of particular interest are the measurements of fundamental parameters for metal-
poor stars. One reason, as stated above, is to indeed aim to improve our under-
standing of the physical processes in stellar atmospheres. But the ability to reduce
the error bar on Teff , log g and [Fe/H] has very positive consequences for determin-
ing the ages of these stars, some of the oldest stars in our Galaxy. Additionally
such HR diagram models often fail to match the observational constraints and thus
corrections to the evolution models need to be made. The ages of some metal-poor
stars was studied by Creevey et al. (2012, 2014) using tailored stellar models, while
such determinations using grids of existing models was also done by authors such
as VandenBerg et al. (2014) and Casagrande et al. (2011). Tailoring stellar models
allows one to understand the impact of all variables on the determination of the
stellar age, as shown in Fig. 2.5. The mean ages of the stars studied by Creevey
et al. (2012, 2014) is 12.2 Gyr consistent with theory that predicts Halo stars to
appear at roughly 1 billion years after the Big Bang.
Today there are about six metal-poor stars that are measureable but with better
precision allowing more confidence in a 0.1 mas star and increasing the magnitude
range, this sample can be extended to about 27 stars.
2.2.3 Interferometry and Asteroseismology
Interferometric and asteroseismic approaches are complementary in two main ways:
the first one concerns the validation of seismic scaling relations, while the second
concerns using the diameter as a complementary constraint for stellar modelling
along with the seismic diagnostics. The validation of scaling laws opens a window

March 22, 2017 0:30 World Scientific Book - 9.75in x 6.5in Science˙cases˙visible page 19
Fundamental properties of main sequence stars from interferometric measurements 19
Fig. 2.5 Observational constraints in the HR diagram for HD 140283 (box continuous lines) andseveral stellar models that pass through the error box. The stellar models vary by mass (blue)
and other adjustable quantities (green). The measured radius is shown by the red line.
for galactic archaeology (Miglio et al., 2013) and determinations of planetary radii
with transit photometry. A complementary observation of radius in stellar mod-
elling yields high precision masses and ages, along with constraining other stellar
parameters such as the mixing-length parameter and the initial helium abundance.
It also constrains the interior structure by constraining its absolute dimensions.
Asteroseismic data has huge potential for determining stellar properties of stars
such as mass, radius, and age. The frequencies that are detected are sensitive to
the density structure of the star and thus provide very precise information about
the quantity M/R3. It has been shown, for example, that log g can be determined
to a precision of < 0.03 dex for main sequence stars, with accuracies as high as 0.01
dex (e.g. Creevey et al. 2013).
Measurements of oscillation modes have been made in thousands of targets.
For a star like our Sun a large range of frequencies may be observed as shown in
Fig. 2.6. In this figure the individual frequencies can be seen, but it can also be
noted that the amplitudes of the frequencies vary with frequency. The quantity
νmax is the approximate frequency where the largest amplitudes are seen. It can
also be seen that a regular spacing exists between the frequencies. Twice the value
of this spacing (because modes with degree 0 and 1 are separated by about half of
this value) is called the large frequency spacing or 〈∆ν〉. These two global values are
of particular interest because along with an estimate of Teff , the radius and mass
can be estimated independently of stellar models by applying the so-called seismic
scaling relations. (R
R
)=
(νmax
νmax
)(〈∆ν〉〈∆ν〉
)−2 (Teff
Teff
)1/2
(2.2)

March 22, 2017 0:30 World Scientific Book - 9.75in x 6.5in Science˙cases˙visible page 20
20 Science cases for a visible interferometer
Fig. 2.6 A typical oscillation spectrum of a solar-like star displaying many oscillation frequencies.The global seismic quantites 〈∆ν〉 and νmax are indicated.
(M
M
)=
(νmax
νmax
)3 ( 〈∆ν〉〈∆ν〉
)−4 (Teff
Teff
)3/2
(2.3)
If the radius is measured using interferometry, then Eq. 2.2 can be validated using
this external measurement. Huber et al. (2012) have shown that the relation holds
well for solar-metallicity main sequence stars, and White et al. (2013) applies the
relations to determine model-independent masses of several targets. Going a step
further Metcalfe et al. (2014) include some interferometric diameters as constraints
in asteroseismic analyses which result in better determined masses and ages.
How well the mass can be determined depends on the precision in the measured
diameter. In some case, the mass can be determined with a precision of as low as
1.5% (e.g. Creevey et al. 2007, Figure 2.7). Along with this high precision mass
comes a well-determined age and initial helium abundance. These parameters are
fundamental for studying stellar populations and the history of our Galaxy, along
with high-precision characterisation of planetary systems and their members.
Today observational restrictions limit the number of bright asteroseismic targets
from ground-based campaigns (about 40 in total for V < 5), while space-photometry
is providing hundreds of asteroseismic data on main sequence and sub-giant stars
but for magnitudes in the range of V > 9. The fainter targets are not accessible with
interferometric instruments, while the brigher targets having been mostly observed
from the southern hemisphere have angular diameters that are too small for southern
interferometric diameters. The Stellar Observations Network Group1 (SONG) is a
network of telescopes (currently 2) dedicated to bright star asteroseismology. All
of these targets will be accesible to interferometric instruments. The TESS2 and
1song.au.dk2http://tess.gsfc.nasa.gov/

March 22, 2017 0:30 World Scientific Book - 9.75in x 6.5in Science˙cases˙visible page 21
Fundamental properties of main sequence stars from interferometric measurements 21
PLATO3 missions, both aiming to find Earth-like planetary systems by searching
around bright targets are the most promising missions for a better overlap between
asteroseismic and interferometric targets. In both cases, the targets are generally
4 < V < 11 main sequence stars. For TESS, global seismic quantities (see below)
will be attainable for the targets, while for PLATO High precision asteroseismic
data will be available for 1000s of stars up to magnitude 8. At the same time
continued efforts to conduct asteroseismic campaigns from ground-based telescopes
is needed and will improve the overlap.
Fig. 2.7 Determination of stellar parameters from simulations as a function of precision in inter-
ferometric radius. M, Z, X, and α denote mass, initial metallicity and hydrogen mass fraction,
and mixing-length parameter. All simulations include seismic diagnostics. The dashed line for αalso include the separations between degree modes 0 and 2, adapted from Creevey et al. (2007)
2.2.4 Surface brightness relations, binaries and other applications
In this final subsection we give a brief summary of other applications of interfero-
metric diameters.
Binaries
In this section we have not discussed interferometric orbits and the huge potential
for determining fundamental parameters in particular the mass. An interferometric
orbit (several data points) provides the inclination and separation of the components
(scaled to absolute units when the parallax is known) along with an orbital period.
Combining this with radial velocity data which also derives the orbital period and
the mass ratios and applying Kepler’s Law, allows us to deduce the individual mass
components.
Surface brightness relations
Relating measured angular diameters with easily measured magnitudes and colours
3http://www.oact.inaf.it/plato/PPLC/Home.html

March 22, 2017 0:30 World Scientific Book - 9.75in x 6.5in Science˙cases˙visible page 22
22 Science cases for a visible interferometer
provides a method for estimating angular sizes of stars (Kervella et al., 2004b) that
are too distant (or small) to be measured directly. Gaia will deliver parallaxes
for stars up to a magnitude of 20 and combining these complementary data yields
an independent determination of stellar radii, a parameter notably important for
determining planetary radii in transiting planetary systems.
Mixing-length parameter
1D stellar evolution models are characterised by the generally unobservable prop-
erties of mass, age and initial chemical composition. Such models are usually used
to determine masses and ages for single stars and/or populations of stars for many
different astrophysical reasons. Few observations and error bars implies that the
solutions are generally degenerate. To add to the problem there is another pa-
rameter of stellar models that is used to describe the efficiency of convection. It
is called the mixing-length parameter and is unfortunately an unconstrained pa-
rameter that we usually fix as to be equal to a solar-calibrated one for the same
physics. Observations have shown this not to be correct, however, there are little
observational methods to help understand how this parameter varies with stellar
evolution stage, mass and temperature. Generally we are concerned only with the
outer stellar convective envelope and so the adjustable parameter in the models ef-
fects only the surface-most properties such as radius and effective temperature, but
not luminosity. Angular diameters therefore have a huge potential for constraining
this parameter in cases where other constraints are also available. Such examples
are metal-poor stars, where we already can constrain the mass and age of the star,
or binary systems, or clusters where mass, age and/or chemical composition are
known a priori, or through asteroseismic analysis where the combination of radius
and seismic data allows one to narrow down the plausible range.
2.3 B Planet-detection and convection from time sensitive and
time series observations using closure phases and imaging
To detect and characterise stellar granulation and attempt to detect planetary tran-
sits we require time-sensitive closure phases and imaging. Stellar activity and, in
particular, convection-related surface structures, potentially cause bias in the char-
acterisation of stellar parameters and, eventually, in planet detection. [Chiavassa
et al. (2014)] showed that the stellar surface asymmetries in the brightness distribu-
tion mostly affect closure phases, because of either convection-related structures or
a faint companion (Chiavassa et al., 2014, 2012, 2010a). The levels of asymmetry
and inhomogeneity of stellar disk images reach high values with stronger effects
from frequencies corresponding to the 2nd/3rd visibility lobe on, depending on the
stellar parameters: asymmetries are larger for low surface gravity K giant stars and
smaller for sub-giant and solar type stars. [Chiavassa et al. (2014)] presented two
possible benchmark solar type and sub-giant targets: Beta Com (1.1 mas) and Pro-
cyon (5.4 mas); the choice of the authors is due to the angular diameter to illustrate

March 22, 2017 0:30 World Scientific Book - 9.75in x 6.5in Science˙cases˙visible page 23
Fundamental properties of main sequence stars from interferometric measurements 23
observations with good UV coverage, but many more can be also observed.
Interferometry can also help to disentangle the signal of a transiting planet.
Closure phases and imaging are required to do this. The observations are time
sensitive: before and after planetary transit and for a duration of many hours to a
day. [Chiavassa et al. (2014)] also showed that there is also a starspot signal, due
to magnetic activity, on closure phases that can be of the same order as the transit-
ing planet signal. Nevertheless, it should be possible to differentiate between them
because the time-scale of a planet crossing the stellar disk is much smaller than the
typical rotational modulation of the star. It is important to note that when probing
high spatial frequencies, the signal to noise ratio of the measurements would be very
low due to low fringe visibilities, greatly deteriorating the closure phase precision
and affecting the instrument capability. Moreover, this would influence the capabil-
ity and sensitivity of detecting the signatures of granulation and disentangling the
planetary signal. The future visible interferometer must pay attention to overcome
these limitations.
To differentiate a planetary signal from a spot signal, instrumental improve-
ments are also needed. To directly detect a 0.10 mas exoplanet crossing a 1 mas
star, represented by a limb-darkened disk, at visible wavelength with interferometry,
an accuracy better than ∼ 0.5% from the first null is required in squared visibilities,
at best observing conditions. A precision better than ∼ 1 on phases is necessary in
the first lobe, or better than ∼ 6 in the second lobe (see Figure 2.8). At present,
no instrument can reach these accuracies. To detect a 0.05 mas exoplanet, the ac-
curacy needed on squared visibilities and phases are ∼ 0.1% and ∼ 1 from the first
null. Magnetic spot signals can easily mimic these exoplanet signals, and distin-
guishing between them is essential for an exoplanet characterization, but requires
measurements generally beyond the third lobe of visibility (Ligi et al., 2015). As
stated before, temporal variations should be taken into account for these measure-
ments since the timescale of stellar spots is different from the transity time, and
such accurate measurements would require a very good S/N.
2.4 C Spots and limb-darkening using medium-to-high resolu-
tion V2 and imaging
Surface inhomogeneities are found in stars throughout the H-R diagram. These
inhomogeneities were first observed in the Sun in form of cool and therefore dark
localized regions and they have been known as spots ever since. We will refer to spots
as to any long-lived inhomogeneity in a stellar photosphere that could induce strong
variations in some observed parameters (e.g., surface brightnest, magnetic field
strength, etc.). Of course, stellar spots and magnetic activity can be constrainted
with interferometric visibilities and closure phases provided that instruments can
reach required angular resolution.
In stars with outer convective envelopes, the dynamo action triggers magnetic

March 22, 2017 0:30 World Scientific Book - 9.75in x 6.5in Science˙cases˙visible page 24
24 Science cases for a visible interferometer
Fig. 2.8 Phases of a single star (blue), a star with a spot (orange) at (0.2, 0.2) mas, a star witha transiting exoplanet (red) at (0.2, 0.0) mas on the stellar disk and a star with both (green).
The spots diameter is θs = 0.10 mas, the stars diameter is 1 mas and the exoplanets diameter is
θp = 0.10 mas (Ligi et al., 2014).
activity which then produces temperature spots on the surface of these stars, just
like we observe in the Sun. Therefore, studying starspots is essential if we want to
understand the generation of magnetic fields and activity cycles in stars other than
the Sun. Combined with alternative observables, like, say, photometric light curves
and variations of surface magnetic fields, interferometry can put strong constrains
on spot contrast (and therefore their physics) and morphology (e.g., number of
spots) which is essintial for tuning modern dynamo theories (Shulyak et al., 2015;
Yadav et al., 2015; Gastine et al., 2013).
Temperature spots are not the only spots that are found in stars. There is a
particular class of main-sequence stars called chemically peculiar (CP) stars that
have no (or very weak) convection in their atmospheres but still have surface spots.
However, unlike in cool stars, spots in CP stars are not of temperature but abun-
dance origin. They appear when atoms and ions of certain elements tend to ac-
cumulate at different regions on the stellar surface driven by diffusion processes
(Michaud, 1970). Studying these abundance spots brings important constrains on
the evolution of chemical elements, physics of diffusion processes, and evolution of
fossil magnetic fields (the later are frequently found in CP stars and may rich tens
of kG – strongest fields among non-degenerate stars (Babcock, 1960; Elkin et al.,
2010)). The abundance spots have been detected in a number of CP stars of dif-
ferent spectral types (Nesvacil et al., 2012; Luftinger et al., 2010; Kochukhov and

March 22, 2017 0:30 World Scientific Book - 9.75in x 6.5in Science˙cases˙visible page 25
Fundamental properties of main sequence stars from interferometric measurements 25
Wade, 2010; Kuschnig et al., 1999), and even spot evolution was detected for the
first time in one presumably non-magnetic CP star (Kochukhov et al., 2007).
Optical and infrared interferometry is a powerful observational technique capa-
ble of reaching a very high angular resolution. Potentially, interferometry allows
one to derive not only the sizes of stellar objects, but, under the conditions of
sufficient spatial coverage, even to reconstruct the details on the stellar surfaces.
With the development of the long baseline interferometry it will be possible to
resolve and analyze stellar spots by means of interferometric observable such as
absolute visibility and closure/differential phase (Wittkowski et al., 2002; Jankov
et al., 2003; Rousselet-Perraut et al., 2004; Shulyak et al., 2014). Orientation of the
stellar rotation axis and geometry of local magnetic fields can also be constrained.
Thus, interferometry is a powerful technique to study starspots that can provide a
complementary information about stellar surface structures.
In addition it should be remembered that a method of Doppler Imaging (DI)
that is commonly and very successfully used to recover the surface structures of stars
is limited to stars rotating fast enough so that rotation dominates the broadening
of spectroscopic lines. However, there are stars that rotate very slowly or have
small projected rotational velocities, but still show significant spectral variability
indicating existence of spots in their atmospheres. For those stars no DI is possible,
and interferometry thus appears to be a promising technique to study their surface
morphology.
The application of interferometry to main-sequence (MS) stars, unfortunately, is
still limited to only brightest objects. Modern facilities are capable of resolving the
closest and/or largest MS stars and measure their diameters already on a regular
basis (e.g. Boyajian et al., 2013; Maestro et al., 2013). Recently, interferometry has
been successfully applied to CP stars resulting in a first estimate of the radii of a
few of them: α Cir (HD 128898, Bruntt et al., 2008), β CrB (HD 137909, Bruntt
et al., 2010), γ Equ (HD 201601, Perraut et al., 2011), and 10 Aql (HD 176232,
Perraut et al., 2013). Detailed studies of surface morphology of MS stars with spots,
however, remain challenging.
The essential requirements for the present and planned interferometric facilities
to study spotty structures on MS stars are large (hundred of meters) baselines, high
sensitivity (V 2 < 10−2 and below), and from medium to high spectral resolution
(R > 103).
For instance, in their case study of the one of the brightest CP star ε UMa (which
also has the largets angular diameter among CP stars known by date; θ = 1.54 mas)
Shulyak et al. (2014) showed that an instrument like VEGA or its successor based
on the principle of the demonstrator FRIEND should be able to detect the effect of
spots and stellar rotation from spectroscopic features, provided that the instrument
is able to measure squared visibility down to ≈ 10−3, and/or closure phase in
visual. An instrument with the spectral resolution around R = 6 000 like, e.g., VLTI
instruments AMBER (present) or GRAVITY (future) would be able to measure

March 22, 2017 0:30 World Scientific Book - 9.75in x 6.5in Science˙cases˙visible page 26
26 Science cases for a visible interferometer
rotation and spots, but baselines longer than currenly provided 140 m were needed.
As an example, Fig. 2.9 illustrates predicted spot and rotation signals in V 2 for
ε UMa calculated for a set of baselines at the center of strong Fei 531.6 nm line. One
can clearly see the bright Fe spot and the dark vertical stripes induced by stellar
rotation. Both these effects can be unambiguosly detected in V 2 if the observations
are taken at different baseline orientations.
If closure phases are provided, they can bring very rich information on spots
and rotation, especially when observing at high spectral resolution. For instance,
for the same case of ε UMa there are many telescope configurations for which the
spotted star looks different compared to a homogeneous one. This is illustrated on
Fig. 2.10, where it can be seen that a rotating star with uniform surface produces
closure phases that are symmetric relative to the core of spectral lines, whereas
spots induce more rich and complex closure phase patterns. More details can be
found in Shulyak et al. (2014).
Analysis of known CP stars show that most of them have angular diameters
below 1 mas. Therefore, both long baselines of hundreds of meters and detectors
sensitive to values of V 2 < 10−2 are required. About ten of CP stars can already
be subject for spot detection using existing interferometric facilities. Note that
none of the CP stars can be observed with VLTI and the reason for this is a
short baseline range provided by VLTI compared to other existing interferometers.
Alternatively, there are two objects that could be observed already with available
maximum baseline of 140 m but detectors operating in visual were needed.
2.5 Science case summary
In this section we summarize the science driver information in terms of scientific
objectives in tabular form for quick reference.
(1) Diameters of planet-hosting stars
(2) Effective temperatures of metal-poor stars
(3) Calibrating 1D mixing-length in stellar models
(4) Stellar interiors, masses, ages
(5) Magnetic inflation of cool, rapidly rotating stars
(6) Stellar granulation and planetary-transit detection
(7) Spots and magnetic activity
(8) Limb-darkening and surface spots

March 22, 2017 0:30 World Scientific Book - 9.75in x 6.5in Science˙cases˙visible page 27
Fundamental properties of main sequence stars from interferometric measurements 27
0 km s−1 35 km s−1 35 km s−1
α = 135° λ = 531.667 nm
0 100 200 300 400 500Baseline, m
10-4
10-2
100
102
V2
υ ⋅ sin(i) = 0.00 km/s, uniformυ ⋅ sin(i) = 0.00 km/s, spottedυ ⋅ sin(i) = 35.00 km/s, uniformυ ⋅ sin(i) = 35.00 km/s, spotted
α = 270° λ = 531.667 nm
0 100 200 300 400 500Baseline, m
10-4
10-2
100
102
V2
υ ⋅ sin(i) = 0.00 km/s, uniformυ ⋅ sin(i) = 0.00 km/s, spottedυ ⋅ sin(i) = 35.00 km/s, uniformυ ⋅ sin(i) = 35.00 km/s, spotted
Fig. 2.9 Stellar intensity images (top panel) for non-rotating spotted star (v sin i= 0 km s−1),rotating homogeneous star, and rotating spotted star (v sin i= 35 km s−1), and squared visibilityat the center of strong Fei 531.6 nm line calculated for the two position angle of 135 (middle
panel) and 270 (bottom panel) respectively.

March 22, 2017 0:30 World Scientific Book - 9.75in x 6.5in Science˙cases˙visible page 28
28 Science cases for a visible interferometer
606 608 610 612λ, nm
2.8
2.9
3.0
3.1
3.2
Fλ ×
10
-9,
erg
/cm
2/s
/nm
Homogeneous
606 608 610 612λ, nm
-180
-90
0
90
180
Clo
sure
ph
ase,
deg
Spotted
606 608 610 612λ, nm
-180
-90
0
90
180
Clo
sure
ph
ase,
deg
Fig. 2.10 Closure phases as a function of wavelength. First row – spectrum predicted byspotted model; second and third rows – closure phase predicted by homogeneous and spot-
ted models, respectively. In all plots R = 30 000, v sin i= 35 km s−1. Closure phases were
computed for the following configurations: (0, 40m)+(270, 40m)+(135, 57m) – black crosses;(0, 100m)+(270, 100m)+(135, 141m) – red diamonds; (0, 180m)+(270, 180m)+(135, 255m) –
blue squares; (0, 320m)+(270, 320m)+(135, 453m) – violet circles. See online version for colored
symbols.

March
22
,2
01
70
:30
World
Scien
tific
Bo
ok
-9
.75
inx
6.5
inS
cience˙ca
ses˙visible
pa
ge
29
Fundamen
talproperties
ofmain
sequen
cesta
rsfro
minterfero
metric
measu
remen
ts29
Science Observables Technical RequirementsCase V2 V2
λ,i ∆φ Imaging Spatial Spectral Temporal # Telescopes Time per Precision(mas) (hrs) source (%)
1 X X — — < 0.1 L-M — > 2 4-6 < 2%2 X X — — < 0.1 L-M — > 2 4-6 < 2%3 X X — — < 0.1 L-M — > 2 4-6 < 2%4 X X — — < 0.1 L-M — > 2 4-6 < 2%5 X — X X6 — — X X L B/A Tr > 2 (6) 4− 247 X X — < 0.1 H > 28 X X X — > 0.5 M > 3 (6)
X = Required
— = Not required
L, M, H = Low-, Medium-, High-spectral resolution
B/A Tr = Before/After planetary transit

March 22, 2017 0:30 World Scientific Book - 9.75in x 6.5in Science˙cases˙visible page 30
30 Science cases for a visible interferometer
2.6 Future Requirements
We have identified the following requirements as the most important in terms of
fundamental parameters of main-sequence and sub-giant stars:
• Increase of angular resolution
• For higher precision, more telescope time needed
• Increase sensitivity

March 22, 2017 0:30 World Scientific Book - 9.75in x 6.5in Science˙cases˙visible page 31
Chapter 3
Interferometry in the visible - Pre-MainSequence stars
K. Perraut1, M. Benisty1, S. Kraus,2 G. Schaefer3, M. Simon1
1 Institut d’Astrophysique et de Planetologie de Grenoble, CNRS-UJF UMR 5571,
414 rue de la Piscine, 38400, St Martin d’Heres, France2University of Michigan, Astronomy Department, 941 Dennison Bldg, Ann Arbor,
MI 48109-1090, USA3 The CHARA Array of Georgia State University, Mount Wilson Observatory,
Mount Wilson, California 91023, USA
3.1 Introduction
Most star formation proceeds along the same lines with: an initial collapse of an
interstellar molecular cloud caused by gravity, the cloud fragmentation into clumps,
the fragmentation of clumps in protostars, and finally the star formation. The initial
rotation of the collapsing cloud leads to the distribution of gas along the equatorial
plane in a circumstellar disk. Crucial to the formation of a protostar and active
for most of the pre-main sequence (PMS) phase a large scale outflow is ejected to
conserve the angular momentum: this is one of the most spectacular manifestation
of star formation. The generation of jets from young stars involves a complex
interplay, still poorly understood, between gravity, turbulence, and magnetic forces
that may have strong implications on conditions for planet formation (Figure 3.1).
3.2 Determining their fundamental parameters
3.2.1 Scientific rationale
The Hertzsprung-Russel Diagram (HRD) is the single most useful diagnostic tool in
observational stellar astronomy. Astronomers estimate the mass and age of a young
star by its location on the HRD relative to theoretical calculations of collapse to
the main sequence. It is well known that for stars less massive than ∼ 1.0 M there
31

March 22, 2017 0:30 World Scientific Book - 9.75in x 6.5in Science˙cases˙visible page 32
32 Science cases for a visible interferometer
Fig. 3.1 The different phases of star formation.
is considerable scatter in these estimates (e.g., Simon 2001; Hillenbrand & White
2004). As a consequence, the mass spectrum of the stars produced in a star-forming
region and the region’s star- and planet-forming histories are imprecisely known.
The main reasons for the scatter are differences among the several theoretical cal-
culations of pre-main sequence (PMS) evolution owing to different treatments of
convection, the equation of state, and the photospheric spectrum.
A powerful way to distinguish among these calculations and test the input
physics is to compare predicted masses to masses obtained by dynamical methods;
binary stars are well-known as the ideal targets. At the distances to nearby star-
forming regions (∼ 120–140 pc), long-baseline optical/infrared interferometry is
required to resolve double-lined spectroscopic binaries (SB2s; e.g., Boden et al. 2005;
Simon et al. 2013; Le Bouquin et al. 2014). Recent measurements have renewed
the interest of theorists in improving the models (e.g., Tognelli et al. 2011; Feiden
& Chaboyer 2012). Binaries that can be studied both as visual binaries (VB) and
SB2s are particularly precious because the orbital analysis yields their component
masses and distance.
As young stars collapse to the main sequence their diameters decrease. Mem-
bers of the Nearby Young Moving Groups (NYMGs) are near enough, bright enough,
and young enough that their diameters are measurable interferometrically (e.g., Si-
mon & Schaefer 2011; McCarthy & White 2012; Schaefer & White 2015). Since the
theoretical evolutionary tracks of stars more massive than ∼ 1 M are reliable, and
Hipparcos distances are already available for such stars in the NYMG, their mea-
sured angular diameters provide their physical diameter and hence an independent

March 22, 2017 0:30 World Scientific Book - 9.75in x 6.5in Science˙cases˙visible page 33
Interferometry in the visible - Pre-Main Sequence stars 33
V (mag)
a si
n i
(mas
) Resolved SB2
Eclipsing
SB2
Fig. 3.2 Separations vs. limiting magnitudes for spectroscopic binaries of star-forming regions
(Taurus-Auriga, Ophiuchus, Sco-Cen, Chamaeleon, Orion, NGC 2264). Spectral types range from
F to M.
measurement of their age.
3.2.2 Candidates
Extending the long-baseline interferometry technique to the visible, say to 0.6 or
0.8 µm offers the promise of resolutions three to four times finer than in the infrared
at 2.2 µm. For the PMS stars in the Taurus and Ophiuchus star-forming regions,
astrometric orbital measurements will be able to reach orbits with smaller angular
sizes than possible by purely infrared studies. These have the advantages that
their orbital periods are shorter and the studies advance faster. In particular, more
angularly resolvable SB2s will become accessible. Figure 3.2 shows that nearly twice
as many VB+SB2 systems will be resolvable at 0.6 µm as at 2.2 µm. Reaching a
large sample of these systems requires a limiting magnitude of V ∼ 14 mag.
While most members of the NYMGs are in the southern hemisphere, the
β Pic (age ∼ 8–10 Myr) and AB Dor (age ∼ 40–100 Myr) NYMG also have
members in the north and are accessible to both the CHARA and VLTI arrays.
Table 3.2.2 shows that in the β Pic NYMG alone, about 15 stars are accessible for
diameter measurement with the VLTI. Successful diameter measurements would
increase the measured stars four to five-fold and enable for the first time the study
of the possible age spread of their formation.

March 22, 2017 0:30 World Scientific Book - 9.75in x 6.5in Science˙cases˙visible page 34
34 Science cases for a visible interferometer
Vmag range Number of stars Spectral types
3-4 1 A
4-5 1 A
5-6 3 2 A - 1 F
6-7 5 5 F
7-8 6 4 F - 1 G - 1 K
8-9 3 Mostly G and K
9-10 4 Mostly G and K
10-11 13 Mostly G and K
11-12 11 Mostly M
12-13 6 Mostly M
13-14 2 Mostly M
14-15 1 Mostly M

March 22, 2017 0:30 World Scientific Book - 9.75in x 6.5in Science˙cases˙visible page 35
Interferometry in the visible - Pre-Main Sequence stars 35
3.3 Studying their complex environment
3.3.1 Scientific rationale
While optical direct imaging and (sub-)millimetric observations have revealed com-
plex structures around young stellar objects such as spirals, gaps, and holes at
distances of few tens of astronomical units (AU), probing the innermost regions
where key processes for the star-disk-protoplanet(s) interactions are set requires a
very high angular resolution only provided by optical long-baseline interferometry
(Figure 3.3). Recently near-infrared (spectro-)interferometry has directly probed
the emission within this first AU and shown that these regions appear to be much
more complex than expected. Moreover all the complicated inner disk structures
are strongly time variable on a timescale of weeks to years.
Fig. 3.3 Schematic view of a protoplanetary disk. From Dullemond & Monnier (2010).
Most of the continuum emission is due to the dust rim located at the dust
evaporation front (at 1500 K) located at 0.5-1 AU for HAeBe stars. A gaseous disk
extends further in, and material is accreted onto the star. Besides mass ejection
through wind and/or jets are believed to originate in this inner region. To probe
the key mechanisms of our disk paradigm the distribution of the circumstellar gas
and dust have to be studied. Multi-technique and multi-wavelength approaches
are thus required to address the numerous open questions related to the puzzling
environment of these objects.
The observations and modelling of gas lines to probe the geometry and physi-
cal conditions in these accretion and ejection mechanisms have been published since
more than two decades (e.g. Hartmann 1982; Hartmann et al. 1990; Hartmann
et al. 1994). Only recently it has been used through the technique of spectro-
interferometry to spatially resolve the line. It has only been achieved on a limited
number of stars, and mostly in the infrared range (e.g. across the H I [Brγ ] line)

March 22, 2017 0:30 World Scientific Book - 9.75in x 6.5in Science˙cases˙visible page 36
36 Science cases for a visible interferometer
Fig. 3.4 Spectrum of the Young Stellar Object ISOSS J 20298+3559-IRS 1. From Krause et al.
2003.
(Benisty et al. 2010; Kraus et al. 2008; Eisner et al. 2014) with typical angular
resolution of 0.5 AU. This corresponds also to the spatial extent of the inner rim of
the dusty disk. Many more objects could be observed in the continuum (e.g. about
50 sources in the PIONIER Large Program (Berger et al. in prep.), and at very long
baselines (Tannirkulam et al. 2008) and detailed modelling of these measurements
have been published (e.g. Weigelt et al. 2011; Kraus et al. 2012; Ellerbroek et
al. 2015). Improving the capability of visible interferometer and their ability to
spatially resolve emission and absorption lines would be of strong interest as one
would gain in angular resolution and probe complementary lines to the H I [Brγ ]
line.
3.3.2 Accretion-ejection tracers
3.3.2.1 He I 10830 nm
This line provides a unique diagnostic of kinematic motion in the regions close to
the star. Its high opacity makes it a very sensitive probe to the geometry of the
mechanisms at play. Observational studies have shown that the He I line is com-
posite, with narrow and broad components that support an origin in magnetically
controlled accretion from the disk onto the stellar surface but also in a hot wind
(Beristain et al. 2001). About 70% of the surveyed Classical T Tauri Stars (CTTS)
show a sub-continuum blue-shifted absorption in the He I 10830 line, in contrast
with the hydrogen lines, where only 10% of the CTTS have blue absorption (Ed-
wards et al. 2003, 2006). The blue-shifted absorption below the continuum can
be related to mass-loss through either a stellar or disk wind. The comparison with
a survey of CTTS shows that the blue-shifted absorption are likely to be induced
by a disk wind in 30% of the stars, and by stellar winds in 60%. On the other
hand, the red absorption can be used as a probe of accreting material. Fischer
et al. (2008) modelled this feature via scattering of stellar and veiling continua,

March 22, 2017 0:30 World Scientific Book - 9.75in x 6.5in Science˙cases˙visible page 37
Interferometry in the visible - Pre-Main Sequence stars 37
assuming that the magnetospheric accretion is due to an azimuthally symmetric
dipole. They derived accretion shock filling factors and sizes of the funnel flows.
Kurosawa et al. (2011) simultaneously model the He I 10830 with the Paβ, Brγlines using non-LTE radiative transfer. Their model is consistent with the narrow
blue shifted absorption component of the He I 10830 being caused by a disk wind,
while the wider blueshfited absorption is caused by a bipolar stellar wind. However,
these winds are still very compact (few stellar radii) and being able to resolve them
spatially would require extremely high angular resolution.
3.3.2.2 Recombination lines
Besides the He I 10830 nm line, there are several other promising lines (Figure 3.4),
such as the hydrogen recombination lines (Hα, Hβ, ...). These lines are consid-
ered accretion tracer (Hartmann et al. 1994), likely tracing structures on the stellar
surface and in the magnetospheric accretion columns on scales of 3-5 stellar radii.
Some commonly observed characteristics in the line profiles include: (1) slightly
blueshifted emission peaks, (2) blueward asymmetries, and (3) redshifted absorp-
tion components and inverse P Cygni profiles. These features, as well as the Ultra-
violet Balmer discontinuity, can be reproduced by combinations of accretion shock
models and outflow (disk wind or stellar wind) models (e.g. Kurosawa et al. 2011).
Assuming a typical T Tauri star (K7 type, R? = 1.85R) in the Taurus star form-
ing region (R? = 0.06 mas at d = 140 pc) and that the accretion columns extend
to 3 R?, we require an angular resolution better than 0.2 mas to resolve the accre-
tion geometry. Also the Ca II infrared triplet (850/854/866 nm) lines are considered
tracers of magnetospheric infall in T Tauri stars (Azevedo et al. 2006).
3.3.2.3 Forbidden lines
The spectra of many pre-main-sequence stars show forbidden lines, for instance
from [OI], [NII], [FeII], and [SII] (Figure 3.4). These lines trace low-density gas
that is located on relatively large spatial scales. Detailed imaging and integral field
spectroscopy observations on individual objects have found that the line emission
is sometimes distributed over several arcseconds (e.g. DG Tau: Podio et al. 2011;
Bacciotti et al. 2002; RY Tau: Agra-Amboage et al. 2009). Therefore, most of the
line emission in these tracers might be overresolved with interferometry, although
there might also be contributions from a compact component.
3.3.3 Looking for companions
Young short period binaries (with a period less than a few tens days, and a sep-
aration of a few tenths AU) cannot support large circumstellar disks. In these
close binary systems stars orbit in a gap opened by tidal interactions inside a cir-
cumbinary disk. Evidence of an enhanced emission line activity close to periastron
passages have been observed (DQ Tau: Basri et al. 1997; UZ Tau E: Jensen et al.
2007). Such phenomena can be modelled by non-axisymmetric accretion (de Val-
Borro et al. 2011). Interferometry will provide a critical test for such simulations.
Another interesting prospect for imaging in accretion-tracing lines could be

March 22, 2017 0:30 World Scientific Book - 9.75in x 6.5in Science˙cases˙visible page 38
38 Science cases for a visible interferometer
to detect the signatures of low-mass companions that might be forming in the cir-
cumstellar disk. Close et al. (2014) argued that the companion/star contrast might
be much more favourable in accretion-tracing lines than in visual or near-infrared
continuum, in particular if one approaches the planetary-mass regime (Figure 3.5).
Assuming an accretion rate of 5.9×10⁻¹⁰ M/yr (as deduced for the 0.25 M-mass
companion around HD 142527), then one could expect to detect a 260 MJupiter-
mass brown dwarf at a contrast 10−3 and a 1 MJupiter-mass planet still at a contrast
10−4 (without extinction), although it should be noted that it is still highly uncer-
tain whether the corresponding models can be extrapolated to the planetary-mass
regime. Also, these young bodies should still be embedded in the circumstellar disk
in order to allow significant accretion to occur, which should result in significant
extinction. Already a modest amount of extinction (e.g. 3.4 mag) would lower the
contrast to 5× 10⁻⁵ (for the 260 MJupiter-mass brown dwarf) and 5× 10⁻⁶ (for the
Jupiter-mass object), respectively (see solid lines in Figure 3.5). This reduces the
chances for detecting such objects. Anyway high-contrast imaging is required for
this science case.
Fig. 3.5 Left. Predicted companion/star contrast ratio for the Hα-line (black solid lines, with
different values of extinction) and the R-band and H-band continuum (blue and red lines), asfunction of companion mass. Right. The companion (HD 142527B red dot), inside the gap of
a transitional disk, has significant accretion emission compared to younger low mass stars andbrown dwarfs. (From Close et al. (2014)).
3.3.4 Scattered light features
Imaging in scattered light could reveal asymmetric structures that might be linked
to planet formation, similar as seen in the outer disk of HD 141569 (Mouillet et al.
2001). Since the total integrated scattered light contributions are about 100 times
fainter than the stellar flux, this will require high-fidelity, high-contrast imaging. In
that case, a polarimetric mode (like the ZIMPOL mode of SPHERE - Beuzit et al.
2014) or a nulling mode would be of strong interest.

March 22, 2017 0:30 World Scientific Book - 9.75in x 6.5in Science˙cases˙visible page 39
Interferometry in the visible - Pre-Main Sequence stars 39
3.4 Summary of the High-Level Requirements
The high-level requirements for each science case are summarized in Table 3.4.
The main challenge is related to the sensitivity in V due to the faintness of the
YSO in this spectral range (Figure 3.6). Given the equivalent width of the visible
interesting lines (Table 3.4 a spectral resolution of a few thousands is required for
studies across the Hα line while the other lines require a spectral resolution of a few
tens thousands.
Science case Baseline length Spectral resolution Accuracy Imaging Notes
Diameter of stars in SFR unreachable
Diameter of stars in NYMG > 100 m – < 2% on visibility –
Dynamical masses 300 m – < 2% on visibility x
< 0.5 on the closure phase (1)
Accretion-ejection hectometric a few 1000 (Hα) < 2% on visibility x
a few 10000 (other lines)
< 1 on the closure phase
Looking for companions hectometric a few 1000 < 0.001 on the closure phase High-contrast (2)
Scattered light features hectometric – < 0.1% on visibility High-contrast
High-fidelity (3)
(1) A closure phase accuracy like ± 0.3 leads to a contrast between stars of nearly 4-5 mag to be
reached.
(2) The phase accuracy is the critical aspect and not the visibilities. To detect a companion with
a contrast of 10−5 a phase accuracy better than 0.001 is needed.
(3) Since the integrated scattered light contributions are likely 100-times fainter than the stellar
flux an absolute visibility calibration better than 0.1% is required to see some structures.
0
10
20
30
40
50
60
70
4,5 5,5 6,5 7,5 8,5 9,5 10,5 11,5 12,5 13,5 14,5 15,5 16,5 17,5 18,5 19,5 20,5
Ob
ject
nu
mb
ers
Magnitude
K
R
Fig. 3.6 Rmag histogram of Pre-Main Sequence stars in the Taurus-Auriga Star Forming Region
(from Kenyon et al. (2008)). In Ophiuchus, Kmags are similar but Rmags are fainter because of
greater extinction.

March 22, 2017 0:30 World Scientific Book - 9.75in x 6.5in Science˙cases˙visible page 40
40 Science cases for a visible interferometer
Line Wavelengths (nm) Equivalent width (A)
Hα 656.2 20 - 150
Ca II triplet 849.8 854.2 866.2 0.5 - 50
He I 667.8 706.5 0.5 - 2
O I 777.2 844.6 1.6 - 8
[OI] 630 < 15
[SII] 673.1 < 5
[FeII] 715.5 < 2
3.5 Conclusion
The YSOs present a strong science case for interferometry in the visible. Inter-
ferometric imaging and spectroscopy will provide unique and complementary data
for understanding star and planet formation. The techniques will probe the in-
nermost regions of protoplanetary disks and will enable diameter measurements of
stars still contracting to the main sequence. The science case is very challenging
mainly because of the brightness of targets.

March 22, 2017 0:30 World Scientific Book - 9.75in x 6.5in Science˙cases˙visible page 41
Chapter 4
Breaking the frontier to the cosmicdistance scale using visible interferometry
of cepheids and eclipsing binaries
N. Nardetto1, P. Kervella2, A. Chiavassa2, A. Gallenne3, A. Merand4
D. Mourard1, J. Breitfelder2,
1 Laboratoire Lagrange, UMR 7293, CNRS, Observatoire de la Cote d’Azur,
Universite de Nice Sophia-Antipolis, France2 Observatoire de Paris-Meudon, LESIA, UMR 8109, 5 Place Jules Janssen,
F-92195 Meudon Cedex, France3 Departamento de Astronomıa, Universidad de Concepcion, Casilla 160-C,
Concepcion, Chile4 European Southern Observatory, Alonso de Cordova 3107, Casilla 19001,
Santiago 19, Chile
4.1 Introduction
To understand the nature of dark energy and the global geometry of space, one of
the best solution to date is proposed by the SHOES project (Supernovae, H0, for
the Equation of State of dark energy), led by A. Riess, and the Carnegie Hubble
Program, led by W. Freedman, who both derived the Hubble constant (Ho) with
a '3% precision (including systematics) using basically two different anchors to
the type 1a supernova relation (SN): the trigonometric parallaxes of few Galactic
Cepheids and the distance to the Large Magellanic Cloud (LMC). Besides, the ob-
servation of extragalactic eclipsing binaries provides a new path to a very precise
determination of the distance to galaxies in the local group. Using new generation
of long-baseline visible interferometers (in north and south hemispheres), and also
in the context of Gaia, we aim at improving the calibration of the first ladder of the
distance scale (i.e. in the local group). This can be done by better understanding
the physics of Cepheids and eclipsing binaries and also by improving a very funda-
mental tool in stellar physics, which is the surface-brigthness color relation (SBCR
hereafter). These improved SBCR, once applied to Cepheids and eclipsing binaries
will indeed break the frontier of the cosmic distance scale, which means (1) promote
the Baade-Wesselink method as a even more robust tool to derive the distance of
Milky Way and LMC Cepheids (which basically means to better understand also
the physics of Cepheids thanks to Gaia), (2) derive the distance to LMC with a pre-
cision and accuracy of 1% (1% for eclipsing binary, probably 3% for Cepheids), (3)
41

March 22, 2017 0:30 World Scientific Book - 9.75in x 6.5in Science˙cases˙visible page 42
42 Science cases for a visible interferometer
derive the distance to M31 and M33 (and many other galaxies in the local Group)
with a precision and accuracy of 5%. We find that with a new generation of long-
baseline visible interferometer (with limiting magnitude of basically 10 with and an
unprecedented precision on the visibility), we could reach indeed these objectives.
The number of stars that could be observed in the north and south hemisphere and
the expected precision is given for Cepheids and eclipsing binaries, respectively,
and for each sub-projects. This cartography of the local universe relying on visible
interferometry, once corrected from systematics (e.g. metallicity, ...) thanks to the
cross-check with Gaia parallaxes, will be used by the SHOES and CHP projects
to determine the Hubble constant with a precision and accuracy of 2% or better
shedding light on the nature of dark energy.
Two distance indicators are currently very powerful: namely Cepheids and
eclipsing binaries. We show in this white book how long-baseline and high precision
visible interferometry can help to better understand the physics of Cepheids and also
eclipsing binaries by using Gaia parallaxes, and how in turn, this would help to break
the frontier to the cosmic distance scale in particular by providing a very precise
distance to LMC and distant galaxies. This approach is particularly consistent and
complementary with other on-going or future projects, such as Gaia, MATISSE.
This work is part of the Araucaria Project (Gieren et al., 2005a; Pietrzynski et al.,
2013).
4.2 The physics of Cepheids
A powerful way of constraining the PL relation is to use the Baade-Wesselink (BW)
method of distance determination. The basic principle of the BW method is to com-
pare the linear and angular size variation of a pulsating star in order to derive its
distance through a simple division. The angular diameter is either derived by in-
terferometry (hereafter IBW for Interferometric Baade-Wesselink method; see for
instance (Kervella et al., 2004a) or by using the InfraRed Surface Brightness (IRSB)
relation Storm et al. (2011a,b). However, when determining the linear radius vari-
ation of the Cepheid by spectroscopy, one has to use a conversion projection factor
from radial to pulsation velocity. There is currently a consensus on the period-
projection factor relation (hereafter Pp relation) between hydrodynamical models
(Nardetto et al., 2004, 2007, 2009, 2011) and observational constraints based on in-
frared interferometry (Merand et al., 2005) or Cepheids in Eclipsing Binaries (Pilecki
et al., 2013). However, a 2σ discrepancy is found when using the IRSB method,
i.e. the surface-brightness relation Storm et al. (2011a,b); Nardetto et al. (2011).
Riess et al. (2011) adopted a conservative approach concerning the BW method:
‘We have not made use of additional distance measures to Galactic Cepheids based
on the BW method or stellar associations as they are much more uncertain than
well-measured parallaxes, and the former appear to be under refinement due to un-
certainties in their projection factors, as discussed by Fouque et al. (2007) and van
Leeuwen et al. (2007)” (cf. Riess et al. (2009a,b)).
Next generation of visible interferometers can greatly help in resolving such
discrepancy in the projection factor. On the one hand, it seems necessary to add
additional direct constrains on the projection factor by increasing the number of

March 22, 2017 0:30 World Scientific Book - 9.75in x 6.5in Science˙cases˙visible page 43
Breaking the frontier to the cosmic distance scale using visible interferometry of cepheids and eclipsing binaries43
Cepheids in binaries that could be resolved (Sect 4.2.1) or by measuring for the
first time the limb-darkening of Cepheids (Sect 4.2.2). On the other hand, it seems
essential to test the surface-brightness relation of short-period Cepheids (where the
p-factor discrepancy appears), by pushing the recent efforts made to characterize
the CSEs of Cepheids (Sect 4.2.3). Another problem could come from the ’famous
bump’ of Cepheids which arises at the pulsation phase of minimum radius (Storm
et al., 2011a; Fokin et al., 1996). A monitoring of Cepheids with a homogeneous
precision of few percents (in particular at minimum radius) is required. Moreover,
such angular diameter curves of high precision will allow an application of the inverse
BW method based on trigonometric parallaxes of Gaia (Sect 4.3). We will show
also that high-spectral resolution visible interferometry can be a very robust tool
to bring new constrain on the dynamical structure of Cepheids’ atmosphere, but
could also provide a novel method of distance determination (Sect 4.3.1). The final
objective is to have a better knowledge of the period-projection factor relation and
promote the Baade-Wesselink as an even more robust tool for the distance scale.
4.2.1 The projection factor derived from Cepheids in binaries
Several companion of Cepheids have been recently revealed by interferometry:
V1334 Cyg (Gallenne et al., 2013b), AX Cir and AW Per (Gallenne et al., 2014b), see
also (Gallenne et al., 2014a).The contrast between the companion and the Cepheid
is rather high in H band (flux ratio between 30 and 100), where current interfero-
metric recombiners work. However, in the visible wavelength, the contrast is more
favorable (flux ratio between 2 and 100).
With a visible interferometer of new generation it would be possible to detect
and characterize more Cepheids in binary systems. Such detections are crucial for
several reasons: (1) they bring new constrain on the mass of Cepheids and could
help in resolving the Cepheid mass discrepancy (Neilson et al., 2011; Keller, 2008;
Bono et al., 2006), (2) they allow a geometrical determination of the projection
factor of Cepheids.
N? 10-15
spatial resolution 0.3 mas
spectral resolution R = 3000
temporal resolution 2-40 years
precision 1% even at low visibilities
imaging 6T is best
4.2.2 The limb-darkening of Cepheids as a constrain on the pro-
jection factor
Computation of limb-darkening profiles at different wavelengths and pulsational
phases is needed in the BW method not only to derive the limb-darkened interfer-
ometric angular diameters, but also to determine the geometric projection factor.
However, theoretical results concerning limb-darkening are currently inconsistent

March 22, 2017 0:30 World Scientific Book - 9.75in x 6.5in Science˙cases˙visible page 44
44 Science cases for a visible interferometer
at an important level (see for example Marengo et al. 2003 - Fig. 3, and Nardetto
et al. (2006) - Fig 3). Figure 4.1 is derived from Nardetto et al. (2006) and shows
the limb-darkening variation as a function of time based on the hydrodynamical
model by Fokin (1991). Fig. 4.2 gives the detail of the continuum limb-darkening
variation at maximum contraction and expansion velocities. From our theoretical
simulations we find that a precision of 5% on the visibility in the second lobe would
give the average value of the limb-darkening of the star at about 1% of precision.
But even better, 1% on the visibility in the second lobe would provide the time-
dependency of the limb-darkening of the star with a 5σ detection. The precision
of the projection factor and the physics of the photosphere of Cepheids would be
greatly improved with such unique measurement.
Fig. 4.1 A 3D diagram that represents the normalized stellar disk intensity distribution of δ Cepin the continuum as a function of µ (see text) for different phases. The vertical plot (arbitrary
unit) represents the photospheric pulsation velocity as a function of the phase (in the heliocentricframe). Two distributions (in accentuated) are interesting because they correspond to extreme
cases in limb-darkening.
N? δ Cep and ` Car
spatial resolution 0.3 mas
spectral resolution R = 3000
temporal resolution P = 5.36d (δ Cep), P = 35.5d (` Car)
precision 1% in the second lobe (V' 10%)
imaging 3T is fine

March 22, 2017 0:30 World Scientific Book - 9.75in x 6.5in Science˙cases˙visible page 45
Breaking the frontier to the cosmic distance scale using visible interferometry of cepheids and eclipsing binaries45
0
0,5
1
00,20,40,60,81
= 0.00
= 0.77
I ( )/I(1)
Fig. 4.2 Details of the two intensity distributions for phases 0.77 and 0.00 as a function of µ inthe case of δ Cep. The profile corresponding to the highest velocity at contraction (φ = 0.77)
is the most limb-darkened, while the profile corresponding to the highest velocity at expansion
(φ = 0.0) is the lowest limb-darkened. The vertical dashed line represents the photosphere ofthe star defined by τc = 2/3. The photosphere corresponds to the same value of µ for the two
pulsation phases considered here.
4.2.3 The circumstellar environment of Cepheids
Although Cepheids are fundamental distance indicators, the circumstellar envelopes
(CSEs) we discovered around several Galactic Cepheids create a positive bias on
their apparent luminosity (Figure 2; Merand et al. (2007); Gallenne et al. (2012,
2013a)). Their potential impact on the calibration of the Period-Luminosity re-
lation in different wavelength domains (visible, near-infrared, thermal infrared) is
discussed in Kervella et al. (2013). New observations of Cepheid CSEs in the ther-
mal infrared domain using the VLTI/MIDI instrument (Fig. 3; Gallenne et al.
(2013a)) indicate that these envelopes probably contain refractory dust grains (in-
cluding alumina), but their nature is not yet fully understood.
Recently, a bright CSE has been also discovered in the visible with VEGA
around δ Cep (paper in preparation).If confirmed, a systematic study of theses CSEs
in visible with next generation of long interferometers and also with MATISSE in
infrared will be of high importance for the distance scale calibration.
4.3 The robust BW method combined with Gaia: a constrain on
the period-projection factor relation
Gaia will provide the distances of one billion of stars in the Milky Way with an
unprecedented precision. In the second release of Gaia in 2017, we should find the
distance to 250 Cepheids (within 3 kpc) with precisions better than 2%. Our aim

March 22, 2017 0:30 World Scientific Book - 9.75in x 6.5in Science˙cases˙visible page 46
46 Science cases for a visible interferometer
N? about 20
spatial resolution 0.3 mas
spectral resolution R = 3000
temporal resolution several obs. per star is enough
precision 1% in the first lobe (V' 50%)
imaging 3T is fine, but 6T better
is to apply the inverse Baade-Wesselink to the whole sample of Galactic Cepheids
observed by interferometry.
About 25 Cepheids have already been observed with VEGA/CHARA and
FLUOR/CHARA (papers in preparation) but with inhomogeneous precision. A
new generation of visible interferometer of high precision would allow to reach the
1 or 2% precision for each individual determination of the angular diameter at a
specific pulsation phase. The most important is to concentrate on the minimum and
maximum radii of the star. It is in particular well known that some unexplained dis-
crepancies in the surface-brightness are found at minimum radius for some objects,
probably not all Cepheids (Storm et al., 2011a,b). Reaching a 1 or 2% accuracy
when the star has its smallest angular diameter is crucial to resolve this question.
The CSEs and the limb-darkening should be also well defined in the analysis of the
interferometric data.
From the Galactic cepheid database (Fernie et al., 1995) we found that 272
stars are observable from CHARA (δ > −25o) and 256 from VLTI (δ < −25o).
If we select Cepheids brighter than mV = 10, we have 105 Cepheids observable
with CHARA and 147 with VLTI. If we consider a precision on the visibility of
5% (R = 2500), the amplification factor found in the PhD by Merand, and 20
measurements per star (at maximum and minimum radii), we find we could get
a 2% precision on the distance (or similarly 2% on the projection factor) for 75
Cepheids with CHARA and 40 with VLTI. This would lead to a 2% precision on
the individual projection factors bringing exciting result on the period-projection
factor relation. The current observational status of the Pp can be found in Storm
et al. (2011b), their figure 6.
N? 105
spatial resolution 0.3 mas
spectral resolution R = 3000
temporal resolution periods from 2 to 50 days
precision 5% on the visibility (V' 50%)
imaging 3T is fine, but 6T better

March 22, 2017 0:30 World Scientific Book - 9.75in x 6.5in Science˙cases˙visible page 47
Breaking the frontier to the cosmic distance scale using visible interferometry of cepheids and eclipsing binaries47
4.3.1 High spectral resolution interferometry of Cepheids as an
indicator of distances?
Spectro-interferometry within metallic or even Hα lines of Cepheids is beyond the
sensitivity of current interferometers. Nevertheless, with future visible interferom-
eters, such observations will become possible. For instance, if we consider δ Cep,
we find theoretically (using toy modeling) an S-signature photocenter displacement
due mainly to pulsation, rotation (assumed to 8km s−1), line depth (about 25% of
the continuum) and the angular diameter at a given pulsation phase. The largest
S-signal is obtained at maximum radius (when the pulsation velocity is null) with a
peak-to-peak value of 160µas when considering a spectral resolution of R = 60000
(see Fig. 5.3 of the PhD of Nardetto). The second largest signal is obtained at
minimum radius (when the pulsation velocity is null) with a peak-to-peak value
of 145µas. The difference between these two situations is mainly due the angu-
lar diameter (all other parameters are the same) and of about 15µas (or about
10%). For a 200m baseline, a wavelength of 1µm and a precision σ(φ)φ = 10−3 on
the phase measurements, one can reach a sensitivity of 1µas. If verified, spectro-
interferometry would be a perfect tool to probe the dynamical structure of Cepheid’
atmosphere (projection factor), but could also be used to apply a new method of
distance determination (with a 15σ detection or 5% in precision on the individual
angular diameter for only one measurement; actually it should be even more precise
as all the S-signal signature has to be fitted). The only requirement is to extract
without degeneracy the angular diameter from other parameters. We emphasize
that for such analysis, hydrodynamical models are ready (Nardetto et al., 2006)
(Fig. 4.3).
We now anticipate the observation of LMC Cepheids (as presented in
Mourard and Nardetto (2006)). We have used a sample of LMC Cepheids extracted
from Persson et al. (2004). This sample gives access to J, H and K magnitudes of
about 90 cepheids with periods ranging from 3 to 48 days. In order to estimate an-
gular diameter for each star of this sample, we have used empirical relations based
on the (J,J-K) parameters. Half of the sample have a K magnitude between 10 and
12 and an angular diameter between 20 and 40µas. If we consider δ Cep as are
reference, this values translate into an effect on the peak-to-peak S-signature in the
differential phase of 2.5µas and 5µas, respectively. In order to get the distance (or
angular diameter variation) we would need to detect an effect of 10%, which means
0.25µas and 0.5µas, respectively. Thus, to derive the distance of LMC Cepheids
with this technic a precision on the differential phase of at least 0.2µas would be
necessary.
N? 40 in MW ; 40 in LMC
spatial resolution 0.3 mas
spectral resolution R = 60000
temporal resolution periods from 2 to 50 days
precision 1µas for MW; 0.2µas for LMC
imaging 3T is fine, but 6T better

March 22, 2017 0:30 World Scientific Book - 9.75in x 6.5in Science˙cases˙visible page 48
48 Science cases for a visible interferometer
Fig. 4.3 A 3D diagram that represents the spectral line profile (FeI 6003.012 A) for the maximum
expansion velocity (φ = 0.00) with the corresponding intensity distributions. The dashed linerepresents the reference wavelength in the stellar rest frame.
4.4 Eclipsing binaries
4.4.1 The SBCR of early and late-type stars: distances in the local
group
The distance to the LMC, which provides the fiducial Cepheid PL relation consti-
tutes the largest source of uncertainty in the whole process of constructing distance
scale ladder Freedman et al. (2001). The Araucaria team led by Pietrzynski et al.
(2013) have detected a dozen very long-period (60-772d) eclipsing binary systems
composed of intermediate-mass, late-type giants located in a quiet evolutionary
phase on the helium-burning loop. By observing spectroscopically eight of these
systems intensively over the past 8 yr, they could accurately measure the linear sizes
of their components, while the angular sizes have been derived from the surface-
brightness color-relation (SBCR). The LMC distance that we derive from these
systems is accurate to 2.2% and provides a firm base for a 3% determination of the
Hubble constant. However, the systematic uncertainty in the distance measurement
comes mainly from the calibration of the surface-brightness color-relation. The root
mean squared scatter in the current SBCR is 0.03 mag Di Benedetto (2005), which
translates to an accuracy of 2% in the respective angular diameters of the compo-
nent stars.
Some efforts are currently undertaken to achieve the 1% precision on the
relation. In this context, future interferometry combined with photometric cam-

March 22, 2017 0:30 World Scientific Book - 9.75in x 6.5in Science˙cases˙visible page 49
Breaking the frontier to the cosmic distance scale using visible interferometry of cepheids and eclipsing binaries49
paigns could play a central role. The objective is not only to achieve 1% but also
to reach the intrinsic dispersion of the relation, which basically means to quantify
the impact of stellar activity on the surface-brightness of the star. Late-type stars
are not perfect blackbody, the magnetism, the convection, could play a role. For
early-type, it is even more complex: rotation, wind, pulsation have probably an
impact of up to 10% on the SBCR relation (Challouf et al., 2014). Late-type stars
are faint but extremely useful to derive the distance to LMC and SMC even if they
are indeed difficult to detect. Conversely, early-type stars in eclipsing binaries could
play a major role. These very bright systems are indeed very easily detected in the
LMC and even in M31 and also in many other galaxies in the Local Group. Pushing
the precision on the SBCR of early-type stars down to even 5% would be of great
interest.
N? ' 200
spatial resolution 0.3 mas
spectral resolution R = 3000
temporal resolution no particular constrain
precision 1% or better on θ
imaging 3T is fine, but 6T better
4.4.2 The distance of Galactic eclipsing binaries: a cross-check for
the method
With new generation visible long-baseline interferometry it could be possible to
measure of orbital separation of a large sample of Galactic eclipsing binaries, about
50 systems (on-going project actually). Then, we could compare several types of
distances:
• the distance derived from the interferometric measurement of the separation
(combined with spectroscopy)
• the distance derived from the classical approach: photometry, spectroscopy are
used to derive the individual radii and are combined with the angular diameter
obtained from SBCR relation
• if the individual angular diameter of the system are resolved by interferometry,
once combined with individual radii (classical approach), it provides another
estimate of the distance
• distance from trigonometric parallaxes (Gaia)
These different approaches will greatly help in resolving some possible systematics
in the method.
4.5 Conclusion
For more than one decade now, visible interferometry has played (and continue to
play) a central for the distance scale calibration. We have shown that a next gener-

March 22, 2017 0:30 World Scientific Book - 9.75in x 6.5in Science˙cases˙visible page 50
50 Science cases for a visible interferometer
N? 50 eclipsing binary systems
spatial resolution 0.3 mas
spectral resolution R = 3000
temporal resolution to be defined
precision 1% on the visibilities
imaging 6T better
ation interferometer in the visible - with high precision measurements, 6 telescopes
with baselines of 300m, but also high spectral resolution - would be extremely im-
portant to reach the 1% precision and accuracy on the distances in our Galaxy
and beyond, but also to understand the physics of Cepheids and eclipsing bina-
ries. Such improvements are crucial to reduce the precision and systematics on the
Hubble constant.

March 22, 2017 0:30 World Scientific Book - 9.75in x 6.5in Science˙cases˙visible page 51
Chapter 5
Massive Stars
Ph. Stee1, A. Meilland1, F. Millour1, M. Borges Fernandes2, A. Carciofi3,
W-J de Wit4, A. Domiciano de Souza Jr1, D. Faes5,1, N. Kostogryz6,
N. Nardetto1, J. Zorec7
1 Laboratoire Lagrange, UMR 7293, CNRS, Observatoire de la Cote d’Azur,
Universite de Nice Sophia-Antipolis, 06304 Nice, France2 Observatorio Nacional, Rua General Jose Cristino 77, 20921-400 Sao Cristovao,
Rio de Janeiro, Brazil3 Instituto de Astronomia, Geofısica e Ciencias Atmosfericas, Universidade de Sao
Paulo, Rua do Matao 1226, Cidade Universitaria, 05508-090, Sao Paulo, SP, Brazil4 ESO - European Organisation for Astronomical Research in the Southern
Hemisphere, Chile5 Instituto de Astronomia, Geofısica e Ciencias Atmosfericas, Universidade de Sao
Paulo, Rua do Matao 1226, Cidade Universitaria, 05508-900, Sao Paulo, SP, Brazil6 Kiepenheuer-Institut fur Sonnenphysik (KIS), Schoneckstrasse 6, 79104,
Freiburg, Germany7 Sorbonne Universites, UPMC Universite Paris 6 et CNRS, UMR7095 Institut
d’Astrophysique de Paris, F-75014 Paris, France.
5.1 Massive multiple stars
The mass of the most massive stars has long been investigated (see e.g. Banerjee &
Kroupa 2012 and references therein). There have been even debates on the so-called
supermassive stars (e.g., Schmidt- Kaler and Feitzinger 1981; Cassinelli et al. 1981),
and R136a in the 30 Doradus nebula was suggested to be a single supermassive star
with a mass of 1000 to 3000 M. Speckle interferometric observations resolved
R136a for the first time and demonstrated that R136a consists of eight dominant
stars (a1 to a8) within 1 arcsec (Weigelt & Baier 1985). SINFONI spectroscopy
of R136a (Schnurr et al. 2009) showed that the three brightest stars a1 to a3 are
WN5h stars.
Recently, Massey et al. (2002), Crowther et al. (2010), Schnurr et al. (2009)
and others performed detailed studies of the brightest members of several young
clusters, which may be among the most massive stars known (suggesting very high
initial masses of up to 300 M for the brightest, young stars in R136, Crowther et
51

March 22, 2017 0:30 World Scientific Book - 9.75in x 6.5in Science˙cases˙visible page 52
52 Science cases for a visible interferometer
al. 2010) under the assumption that these stars are single. However, one cannot
rule out yet that these stars might be binaries, because speckle or adaptive optics-
assisted imaging lack the highest angular resolution necessary to resolve them into
binaries. For such systems, radial velocity measurements are also extremely difficult
given the line broadening due to the emerging winds. Because of the implications
for massive star formation and evolution, it is then of foremost interest to estab-
lish conclusively whether they are binary or single stars (see Sana et al. 2012 and
Sana et al. 2013). Indeed, binary evolution may have drastic consequences on the
evolution of high-mass stars, via mass transfer or possibly mergers, hence on the
progenitors of core-collapsed supernovae. Establishing the distribution of binary
separations and of mass ratios is therefore essential to constrain the influence of
mass loss and mass transfer on the evolution of high-mass binaries and to ascertain
the origin and properties of their remnants.
Observing stars in distant clusters was however too challenging for the VLTI
up to now, even for the most luminous ones. Indeed, the currently offered limiting
magnitude of AMBER is K=7.5 mag on the UTs (under regular conditions, seeing
0.8).
AMBER has already demonstrated spectro-astrometric capabilities. Spectro-
astrometry is a technique aiming at going beyond the classical diffraction limit of
a telescope, when emission lines are available in the selected targets. Spectro-
astrometry has long been used for studies of binaries (see e.g. Baines et al. 2006,
Wheelwright et al. 2010). By computing the photocenter shift of the point-spread
function as a function of wavelength, it is possible to detect binaries whose com-
ponents have different spectral types, or trace Doppler shift-induced photocenter
in rotating disks of Be stars. With interferometry in the visible, this means go-
ing beyond the classically accepted resolution limit of 1 mas (in the V band), by
making use of the wavelength-differential phase, which can be compared to the
photocenter in the case of unresolved objects. Spectro-astrometry on single-dish
telescopes has demonstrated in the past the detection of photocenter shifts up to
1000 times smaller than the seeing limit (see e.g. Oudmaijer et al. 2008). With
spectro-interferometry using AMBER, the proven photocenter-shift detection limit
using differential phases is as small as 10 µarc-seconds (see e.g. Le Bouquin et al.
2009, Domiciano de Souza et al. 2012). The use of differential phases over spec-
tral lines allows us to probe binaries well-below the technical resolution limit. For
example, given the current errors on differential phases at low flux, of the order
of 2 σ, this translates into a potential separation limit of 0.1 mas for a WR+O
system (see an example in Fig. 4). This technique works well for 1:1 flux ratio and
different spectral types of the components. Hence, it works best with WR+O stars,
or emission-line stars such as LBVs or sgB[e] stars. In the LMC, the detectable
binary separation threshold would shrink from 100 AU to 5 AU. These improved
limits, made available by an intermediate spectral resolution, will provide a signif-
icant overlap with radial velocity (RV) binary detections. Hence, a comparison of
our data with the available RV measurements will enable a direct assessment of the
biases from RV programs on the massive binary populations.
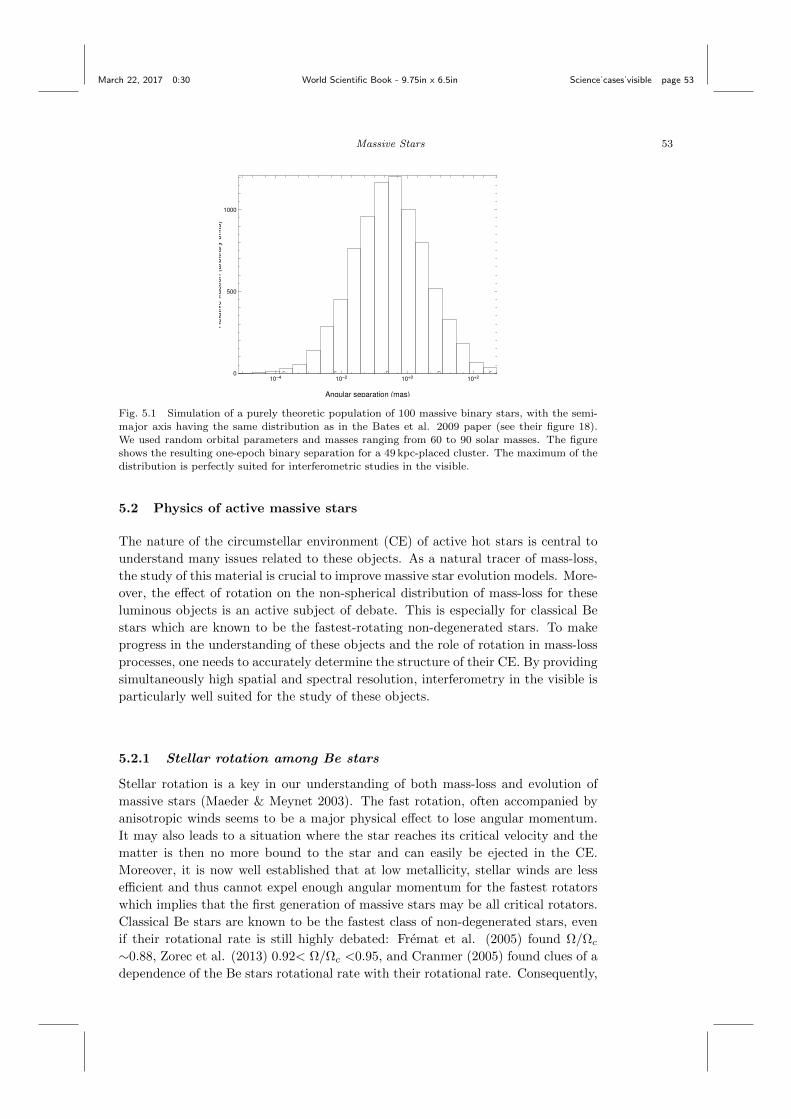
March 22, 2017 0:30 World Scientific Book - 9.75in x 6.5in Science˙cases˙visible page 53
Massive Stars 53
F F F F F
10−4 10−2 10+0 10+2 0
500
1000
Angular separation (mas)
Re
lative
fra
ctio
n (
arb
itra
ry u
nits)
Fig. 5.1 Simulation of a purely theoretic population of 100 massive binary stars, with the semi-
major axis having the same distribution as in the Bates et al. 2009 paper (see their figure 18).We used random orbital parameters and masses ranging from 60 to 90 solar masses. The figure
shows the resulting one-epoch binary separation for a 49 kpc-placed cluster. The maximum of the
distribution is perfectly suited for interferometric studies in the visible.
5.2 Physics of active massive stars
The nature of the circumstellar environment (CE) of active hot stars is central to
understand many issues related to these objects. As a natural tracer of mass-loss,
the study of this material is crucial to improve massive star evolution models. More-
over, the effect of rotation on the non-spherical distribution of mass-loss for these
luminous objects is an active subject of debate. This is especially for classical Be
stars which are known to be the fastest-rotating non-degenerated stars. To make
progress in the understanding of these objects and the role of rotation in mass-loss
processes, one needs to accurately determine the structure of their CE. By providing
simultaneously high spatial and spectral resolution, interferometry in the visible is
particularly well suited for the study of these objects.
5.2.1 Stellar rotation among Be stars
Stellar rotation is a key in our understanding of both mass-loss and evolution of
massive stars (Maeder & Meynet 2003). The fast rotation, often accompanied by
anisotropic winds seems to be a major physical effect to lose angular momentum.
It may also leads to a situation where the star reaches its critical velocity and the
matter is then no more bound to the star and can easily be ejected in the CE.
Moreover, it is now well established that at low metallicity, stellar winds are less
efficient and thus cannot expel enough angular momentum for the fastest rotators
which implies that the first generation of massive stars may be all critical rotators.
Classical Be stars are known to be the fastest class of non-degenerated stars, even
if their rotational rate is still highly debated: Fremat et al. (2005) found Ω/Ωc∼0.88, Zorec et al. (2013) 0.92< Ω/Ωc <0.95, and Cranmer (2005) found clues of a
dependence of the Be stars rotational rate with their rotational rate. Consequently,

March 22, 2017 0:30 World Scientific Book - 9.75in x 6.5in Science˙cases˙visible page 54
54 Science cases for a visible interferometer
it is not clear if Be stars can be considered as a homogeneous group of stars in term
of mass-ejection processes (Stee & Meilland 2009).
Spectro-interferometry is the most suitable technique to test the various hy-
potheses on the mass-ejection processes by constraining both the CE geometry and
kinematics. For example, the first VLTI/AMBER observations of Be stars pub-
lished in Meilland et al. (2007) or Carciofi et al. (2009) have provided evidence
that the disks surrounding these objects are fully dominated by rotation, finally rul-
ing out the hypothesis of slowly expanding wind due to the bi-stability mechanism
introduced by Lamers & Pauldrach (1991).
After these early successes we have also initiated a first spectro-
interferometric survey on the brightest Be stars with the VLTI/AMBER completed
by VLTI/MIDI (mid-IR) and CHARA/VEGA (visible) observations. The observa-
tions published in (Meilland et al. 2008, 2009, 2011, 2012, 2013 ; Delaa et al. 2011
; Stee et al. 2012) allow us to start a statistical study of the CE geometry (in R, V,
and N bands) and the kinematics (using Hα, Brγ, and HeI 2.05 µm lines). We have
found that all the CE were well modeled by geometrically thin disk in Kelperian
rotation. We also found evidence of the N-band emission compactness (see Fig.1)
that may be linked either to disk truncation (Chesneau et al. 2005) or isothermal
disk (Jones et al. 2004 ; 2009). Moreover, we strongly constrain the disk inclination
angle and thus the stellar rotation itself. We found a rotation rate of Ω/Ωc= 0.95
± 0.02 which is slightly higher than the previous estimate by Fremat et al.(2005)
but compatible with Zorec et al. (2012) estimation. Consequently, Be stars seem
to rotate very close to their critical velocity. However despite these successes in
modeling the Be disc kinematics, its physical structure i.e. radial and vertical den-
sity distribution, ionization, and temperature, and their dependency on the stellar
parameters remains poorly known. Thus, in order to put strong constants on these
physical parameters we need at least a spectral resolution in the visible of 20000
which corresponds to a spectral resolution of about 0.3 A, i.e. 15 km s−1 to have
enough spectral channels to accurately study the envelope kinematics. Regarding
the spatial resolution, since most of the stellar photospheres of Be stars are smaller
than 0.5 mas, we need at least baselines of ∼ 300m, as already provided by the
CHARA array, but if we want to ”see” some photospheric structures baselines of ∼1000m are needed.
5.2.2 Measuring differential rotation on the surface of Bn stars
As already outlined in the previous section and even though ΩΩc
can be very high it
still underestimates the actual stellar rotation, which is more clearly evidenced by
the η parameter. η is defined as the ratio of the centrifugal and the gravitational
force at the stellar equator. Thus, the measurement of η is crucial if we would like
to know how close are Be stars to the critical rotation. Unfortunately, Be stars
can have photospheric spectral lines marred by emission/absorptions due to their
circumstellar disc. Bn stars, which are nearly as fast rotators as Be stars, don’t
have spectra perturbed by circumstellar matter, so that the study of their apparent
geometry can be carried out more properly and reliably.

March 22, 2017 0:30 World Scientific Book - 9.75in x 6.5in Science˙cases˙visible page 55
Massive Stars 55
Fig. 5.2 Brightness distribution on the stellar disk in the continuum at λ = 4437 A, near the HeI 4471 A line, calculated for a star rotating at η = 0.9 and for different values of α, where α is the
constant that parameterizes the degree of differential rotation (from left to right): -1.0, 0.0 and1.5, seen at an inclination angle of 90o. From Delaa et al. (2013).
Moreover, due to the rapid rotation, the surface geometry of Bn and Be
stars is highly deformed. The surface angular velocity can be dependent on the
stellar latitude. Then, not only the centrifugal force acting on the stellar surface,
but also the effective temperature distribution (gravity darkening effect) should
depend on the particular surface rotation law. Up to now, these effects have been
measured only for few stars (Domiciano de Souza et al. (2003), Monnier et al.
(2007), Zhao et al. (2009), Che et al. (2011)) and different values of the β exponent
of the gravity darkening law were deduced using image reconstruction technique
(Monnier et al. (2007), Zhao et al. (2009), Che et al. (2011)). Delaa et al. (2013)
has demonstrated that a differential rotation at the surface of fast rotating star may
affect the brightness distribution of the stellar disc and so, also modify the value of
the β exponent.
In all these measurements it was assumed that a genuine constant gravity-
darkening β exponent exists. Actually, β is a function of the stellar co-latitude
and on the particular differential rotation law. Using nothing but the simplest
Maunder’s approximation to sketch the stellar surface differential rotation, Ω(θ) =
Ωe(1 + α cos2 θ), it can be shown that β = β(α, θ), which consequently forces that
every empirical determined β exponent is dependent also on the inclination-angle i
of the stellar rotation axis. This implies, that a value of β different from 0.25 (for
a fully a radiative an barotropic envelope; von Zeipel (1924)) can also be due to a
non-conservative rotational law in the outermost stellar layers (Zorec et al., 2011)
mixed with aspect angle effects. Such β values must be constrained by spectrally
resolved interferometric measurements, because nonetheless they carry precious in-
formation on the surface rotation law that may be unscrambled using differential
interferometry through the spectral line differential phases and spectroscopic mod-
els of stellar atmospheres with differential rotation. This approach is useful, since
the latitude dependent angular velocity introduces peculiar characteristics to the
spectral lines and spectral line differential phases, which are sensitive to the stellar
inclination angle and to the surface angular velocity law (Delaa et al., 2013).
Statistical studies based on the distribution of true velocity ratios V/Vc of
classical Be stars, corrected for induced effects on the measured values of V sin i
due to the gravity darkening effect, macro-turbulence and presence of close binary
components, produce the probability distribution of the differential rotation pa-
rameter α in Maunder’s expression for Ω(θ) shown in Fig. 5.3, which suggests that
−0.5 < α < +0.3 is the probable interval of values of α characterizing the surface
rotation of Be stars and possibly in other fast rotators, like Bn stars.

March 22, 2017 0:30 World Scientific Book - 9.75in x 6.5in Science˙cases˙visible page 56
56 Science cases for a visible interferometer
In order to constrain this differential rotation empirically we definitely need
an interferometric instrument in the visible since it the only way to combine high
spatial resolution (for our purpose we need to reach ∼ 0.2 mas) and spectral reso-
lution as high as 100000 in order to reach 0.1 A in spectral lines sensitive to this
effect as HeI lines. With a spectral resolution of 20000 it is still already possible
to access to the differential rotation if we are able to obtain measurements with a
radial velocity precision of 15 < ∆V < 30 km s−1 and a phase shit precision of
2o < ∆φ < 5o as described in (Delaa et al., 2013).
0.2 0.3 0.4 0.5 0.6 0.7 0.8 0.9 1.0
u=V/Vc
0.0
0.5
1.0
1.5
2.0
2.5
3.0
3.5
4.0
CoRoT-KEPLER Be stars
(u)
(a)
-1.0 -0.5 0.0 0.5 1.0 1.50.0
0.2
0.4
0.6
0.8
1.0
1.2
1.4
P( )
(b)
Fig. 5.3 (a) Distribution Φ(u) of the equatorial velocity ratios u = Ve/Vc of classical Be stars
corrected for micro-turbulence, presence of binary components, and having Maunder’s like surfacedifferential rotation. The shaded box indicate the V/Vc− interval of up to now studied CoRoT and
KEPLER Be stars; (b) Occurrence probability function P (α) of the differential rotation parameterα.
5.2.3 Physics of B[e] stars
Stars with the B[e] phenomenon are B-type stars that present in the optical spec-
trum, strong Balmer lines, and also permitted and forbidden low-excitation lines
of singly ionized or neutral metals, e.g. Fe ii and O i, all of them in emission. In
addition, there is also an excess in the near- and mid-IR, due to circumstellar dust
(Conti (1997)).
This group of stars is actually very heterogenous, with objects in different evo-
lutionary stages, such as low and high mass evolved stars (supergiants and compact
planetary nebula with the B[e] phenomenon), intermediate-mass pre-main sequence
objects (Herbig Ae/B[e] stars) and symbiotic stars (Lamers et al. (1998)). However,
most of the stars with the B[e] phenomenon in the Milky Way is still unclassified
with respect to their nature, mainly due to the absence of realiable stellar parame-
ters and especially distances, being called as unclassified B[e] stars. These objects

March 22, 2017 0:30 World Scientific Book - 9.75in x 6.5in Science˙cases˙visible page 57
Massive Stars 57
are usually embedded in dense circumstellar material. Consequently, their optical
spectra are strongly polluted with circumstellar emission, while photospheric lines
are rare or absent, making difficult a proper stellar classification.
One of the main questions related to these objects is how such different stars
may have similar spectral characteristics. The most probable answer seems to be
linked to the presence of circumstellar disks, as proposed originally by [Zickgraf
et al. (1985)] for B[e] supergiants. Due to the structure and kinematics of these
disks, they would be the ideal environment not only for the origin of forbidden lines
and dust emission, and consequently the B[e] phenomenon, but also for molecular
emission. Recent papers that studied the CO emission in these objects revealed that
dense material, in a disk or ring, is in Keplerian rotation, rather than in expansion
(Oksala et al. (2012); Kraus et al. (2013); Muratore et al. (2015)). Of course, the
mechanisms for the formation of these disks may be different for each class of stars
with the B[e] phenomenon, and there are still many open questions related to their
exact properties (shape, density, composition, temperature, etc.).
Miroshnichenko (2007) suggested that most of the unclassified B[e] stars
would actually be non-supergiants objects in binary systems, and a new class of
objects was proposed, the FS CMa stars (name of its template object). However,
the presence of a companion could not be confirmed for several of these objects
yet, and this suggestion deserves future investigation. In addition, based on recent
papers (Millour et al. (2009, 2011); Kraus et al. (2012a,b)), we cannot discard a
possible link between binarity and the B[e] phenomenon for B[e] supergiants.
Based on this, long baseline interferometry, associated to the state-of-art 3D
radiative transfer codes, like HDUST1, is definitely a powerful tool to search for
both companions and disks around stars with the B[e] phenomenon and describe
their physical characteristics.
An interesting interferometric study of a B[e] star has been done on HD 62623
(3 Puppis, HR 2996) which is the brightest star showing the B[e] phenomenon. Its
distance was estimated to be 700 ± 150 pc and its radius R? = 55 ±10 R (Bittar
et al. 2001). It exhibits radial velocity variations with a period of 137.7 days which
where interpreted as the presence of an unseen companion (Lambert 1988). MIDI
observations (Meilland et et al. 2010) showed that the dust around HD 62623 is
concentrated in a disc-like structure which extends to a hundred mas in the N band.
Using radiative transfer modeling combining dust (computed using MC3D code by
Wolf 2003) and gas (SIMECA, Stee et al. 1994) the authors constrained the disc
structure, i.e. mass, dust inner radius, stratification, and gas contribution in the N-
band (See Fig 2). They also constrained the object inclination angle and rotational
velocity and showed that the star was rotating too fast according to its evolutionary
stage but too slow to explain the break of symmetry of its environment. HD 62623
was then observed during four full nights using AMBER in HR mode centered
on the Brγ emission line (Millour et al. 2011). These observations were used
to reconstructed narrow-spectral-channel images through Brγ. The reconstructed
images not only confirmed the model deduced from the MIDI observations, but also
1HDUST is a three-dimensional Monte Carlo radiative transfer code that combines the full non-
local thermodynamic equilibrium (NLTE) treatment of the radiative transfer in gaseous media,
with a very general treatment for circumstellar dust grains (Carciofi and Bjorkman (2006)).

March 22, 2017 0:30 World Scientific Book - 9.75in x 6.5in Science˙cases˙visible page 58
58 Science cases for a visible interferometer
allowed to significantly constrain the gas geometry and kinematics, showing that
it was concentrated in a Keplerian rotating disc. Using additional spectroscopic
observations from Plets et al. (1995), the authors concluded that the gas and dust
were part of a same at least partly stratified Keplerian disc, similar in many aspects
to the one found around young stars. Nevertheless, as for most B[e] stars, the origin
and formation mechanism of HD62623 disc remains unsettled, even if the most
credible hypotheses imply effects from the putative companion. Consequently, to
progress in the understanding of binary and rotation effects on evolution of massive
stars we propose to image B[e] stars in the visible which will require at least three
quadruplets, i.e. 18 visibilities measurements with phase closure to provide a decent
(u,v) plan coverage. Since in the visible we are probing the inner part of the gaseous
disk, the spatial as well as spectral requirements are globally similar to the ones for
Be stars, i.e. respectively 0.1 mas and 20000 for the spatial and spectral resolution.
However, a strong limitation is, in general, the low sensitivity of the interfer-
ometers, making possible the observation of only a few bright objects. For example,
considering the list of stars with the B[e] phenomenon (Lamers et al. (1998)) and
instruments, like AMBER and MIDI, we have the following:
• VLTI/AMBER: only 8 objects can be observed by ATs and 24 by UTs
• VLTI/MIDI: only 12 objects can be observed by ATs (those ones with an emis-
sion at 12 µm higher than 20 Jy)
Despite this limitation, different papers, based mainly on interferometric
data, have confirmed the presence of gaseous and dusty circumstellar disks for eight
objects: HD 50138, see Fig. 1 (Borges Fernandes et al. (2011); Ellerbroek et al.
(2014)), CPD-57o2874 (?), MWC 300 (Wang et al. (2012)), CPD-52o9243 (Cidale
et al. (2012)), HD 62623 (Meilland et al. (2010)), HD 85567 (Wheelwright et al.
(2013); Vural et al. (2014)), HD 45677 (Kanaan et al., in preparation), and GG
Car (Seriacopi et al., in preparation). In addition, for three B[e] supergiants candi-
dates the presence of a companion was discovered or confirmed by interferometry:
HD 327083 (Wheelwright et al. (2012a,b)), CD-4211721 (Kraus et al. (2012a,b)),
and HD 62623 (Millour et al. (2011)).
All the previous cited works are in the IR wavelengths, but the importance of
interferometry in the optical range is also remarkable. We would like to highlight the
work made by VEGA, which is attached to CHARA interferometer. It is an ideal
instrument to measure wind sizes and compare them with the optical continuum
forming regions.
However, for the study of stars with the B[e] phenomenon, only two objects
brighter than MV = 8 can be observed by VEGA. For one of them, the young
massive spectroscopic binary MWC 361, Benisty et al. (2013) could spatially resolve
the Hα line emission region that can be in a disk-wind, which is enhanced by the
periastron passage of the companion, due to gravitational perturbations.
It is clear that new similar instruments, especially at the southern hemi-
sphere, are definitely necessary for the study of a larger sample of B[e] stars. This
will provide us:
• good quality imaging of the circumstellar environment and wind structures that
can be modelled by modern 3D codes;

March 22, 2017 0:30 World Scientific Book - 9.75in x 6.5in Science˙cases˙visible page 59
Massive Stars 59
Fig. 5.4 VLTI/MIDI N-band spectrally resolved visibilities plotted as a function of the spatialfrequency (B/λ). Colors indicate the baselines position angle with respect to the polarization
measurement. The color scale (i.e., blue, cyan, green, yellow, orange, and red) goes from blue
for baselines parallel to the polarization angle to red for the perpendicular ones. The dots witherror bars indicate the 10.7µm Keck measurements. The thin solid and dashed lines represent
the visibilities from Gaussian disks with different FWHM. The thick red solid line represents the
model fitting aligned to the PA of the major axes of the 2-Gaussian distribution and the blue oneto the PA of the minor axes, confirming the presence of a dusty disk around HD 50138 (extracted
from [Borges Fernandes et al. (2011)]).
• spatial and spectral resolution of the close circumstellar gas environment, where
the B[e] phenomenon is formed and the identification of companions. In ad-
dition, interferometric measurements of different spectral lines in the visible
(H, He, etc.) will allow us to better obtain velocity fields and temperature
distribution in the disks;
• temporal resolution to confirm the effects of short and long-time variations in
the close atmosphere and wind structure caused by binary interactions or even
by pulsations, as seen for HD 50138 (Borges Fernandes et al. (2011)).
Long baseline interferometry, associated to the state-of-art 3D radiative
transfer codes, is the ideal tool to provide information concerning the geometry
and inclination of the circumstellar matter of stars with the B[e] phenomenon. Up
to now several papers are based on IR data. However, interferometry in the vis-
ible can also be a very important source of information. It is clear that only a
multi-wavelength study may, in a near future, allow us:
• (i) to comprehend the nature of some unclassified B[e] stars;
• (ii) to include the B[e] phenomenon in the evolutionary tracks;
• (iii) to understand phases of the stellar evolution that are not well understood
yet.
5.2.4 Direct detection of Non Radial Pulsations of massive stars.
The study of the surface of massive rapidly rotating stars with strong non-radial
oscillations using Differential Speckle Interferometry (DSI) technique was already
proposed by Vakili and Percheron (1991). The application of this technique to the
study of surface structure is particularly well justified for the stars at high inclina-
tions (Petrov, 1988). Jankov et al. (2001) treated explicitly the case of non-radial

March 22, 2017 0:30 World Scientific Book - 9.75in x 6.5in Science˙cases˙visible page 60
60 Science cases for a visible interferometer
Fig. 5.5 Top: Maximum Entropy reconstruction of a Mercator projection of the visible surface
from normalized flux spectra from stellar surface brightness perturbation due to the non-radial
pulsation m=4, l=5 mode on a star tilted at i=85o. One notices a characteristic mirroring dueto the north-south ambiguity. Bottom: Maximum Entropy reconstruction from photocenter shifts
parallel to rotation. The north-south ambiguity is removed. From Jankov et al. (2001).
stellar pulsations, for which the cancellation of opposite sign temperature or velocity
fields introduces difficulties, and showed that interferometric constraint introduces
the crucial improvement. In fact, the photocenter shift provides the first order
moment of the spatial brightness distribution and (comparing to the zero order mo-
ment spectroscopic information) the corresponding stellar regions are reinforced by
weighting with the coordinate parallel or orthogonal to rotation. Consequently, the
modes that are cancelled in flux spectrum should appear in the spectrally resolved
photocenter shift data. Of course, the correct detection and identification of modes
present in the star is crucial for a credible asteroseismological analysis.
Following this technique, Jankov et al. (2001) propose to detect non-radial
pulsations by differential interferometry using the dynamic spectra of photocen-
ter shift variability characterized by bumps traveling from blue to red within the
spectral lines. The theoretical estimation of expected signal-to-noise ratios in differ-
ential speckle interferometry (Chelli, 1989) demonstrated the practical applicability
of the technique to a wide number of sources. For instance, the high precision
CHARA/VEGA or VLTI/AMBER measurements of differential fringe phase cor-
responding to ∼ 10 µas photocenter shift (standard limit), makes measurements
feasible for the low order pulsation of 20 kms−1 and considering a star at an in-
termediate inclination (i = 45o), which should yield a signal of about ∼ 25 µas for
the typical angular diameter of η Cen (∼ 0.5 mas). Moreover, for η Cen i ∼ 70o
and, since the star is tilted at high inclinations, the expected signals, calculated by
Jankov et al. (2001), should be even stronger, particularly for low order pulsations,

March 22, 2017 0:30 World Scientific Book - 9.75in x 6.5in Science˙cases˙visible page 61
Massive Stars 61
making the feasibility better. For that purpose,visible interferometric observations
are mandatory since this technics requires baselines late enough to (partly) resolve
the stellar surface (on the order of ∼ 500m) and spectral resolution of at least 20000
in order to have sufficient spectral channels across photospheric lines. A good (u,v)
plane coverage is mendatory.
Up to now, interferometric studies of active hot and massive stars have pro-
duced the largest contributions of referred papers using the VLTI/AMBER and
CHARA/VEGA instruments. This is certainly due to the fact that they are bright
(many sources have mv < 7) with diameters well suited for current interferometric
baselines, i.e. central stars with diameters ∼ 0.5 mas and circumstellar disk of a few
mas. These properties will certainly also benefit from a future visible interferometric
instrument.

March 22, 2017 0:30 World Scientific Book - 9.75in x 6.5in Science˙cases˙visible page 62
62 Science cases for a visible interferometer

March 22, 2017 0:30 World Scientific Book - 9.75in x 6.5in Science˙cases˙visible page 63
Chapter 6
Evolved stars, Planetary Nebulae, δ Scuti,and RR Lyrae as seen by a visible
interferometer
C. Paladini1, A. Chiavassa2, K. Ohnaka3, N. Fabas4,5
M. Hillen6, N. Nardetto2, van Winckel H.6, Wittkowski M.7, M. Ireland8, J.D.
Monnier9
1 IInstitut of Astronomy and Astrophysics, Universite Libre de Bruxelles, CP226,
Boulevard du Triomphe, B-1050 Brussels, Belgium2 Laboratoire Lagrange, UMR7293, Universite de Nice Sophia-Antipolis, CNRS,
Observatoire de la Cote d’Azur, Nice, France3 Max-Planck-Institut fur Radioastronomie, Auf dem Hgel 69, 53121 Bonn,
Germany4 Instituto de Astrofısica de Canarias, E-38205 La Laguna, S/C de Tenerife, Spain
5 Departamento de Astrofısica, Facultad de Fısica, Universidad de la Laguna,
Tenerife, Spain6 Instituut voor Sterrenkunde, University of Leuven, Celestijnenlaan 200D,
B-3001 Leuven, Belgium7 European Southern Observatory, Karl-Schwarzschild Str. 2, 85748 Garching bei
Muenchen, Germany8 Research School of Astronomy and Astrophysics, Australian National University,
Canberra, Australian Capital Territory 2611, Australia9 Department of Astronomy, University of Michigan, 941 Dennison Building, Ann
Arbor, Michigan 48109, USA.
6.1 Asymptotic Giant Branch Stars
The AGB is the late evolutionary stage of low to intermediate mass stars. During
this phase the atmosphere of the star is dramatically affected by several dynamical
processes such as pulsation, dust formation, and stellar wind. The latter is a crucial
process for galactic and extra-galactic astrophysics: through the mass-loss process
all the material that was synthesized during the life-time of the star via nuclear
processes is returned to the interstellar medium.
There have been few attempt to study AGBs in the visible with interferome-
try. The observations were mainly limited to measure stellar parameters, determine
the diameter variation over a pulsation period, and/or across a few spectral wave-
lengths ranges (Koechlin and Rabbia, 1985; Quirrenbach et al., 1992, 1993, 1994).
63

March 22, 2017 0:30 World Scientific Book - 9.75in x 6.5in Science˙cases˙visible page 64
64 Science cases for a visible interferometer
The visible spectrum of AGBs is populated by several molecular and spectral
bands. According to the chemistry, an oxygen-rich star will exhibit TiO (already
mentioned in Sect. 6.1.4), H2O, VO; an AGB star with 0.5 ≥ C/O ≤ 1 (also
called S-type star) will show ZrO and LaO bands beside the TiO. Carbon rich stars
will have CN, C2, and other carbon-rich molecules (easily observable at λ ≥ 6600,
λ ∼ 7000−7200 and beyond λ7900 A). Despite the strong molecular blending, many
atomic lines can be measured. Beside the classic CaII and Hα, other lines of interest
are lithium (four absorption lines 4603, 6104, 6708, and 8126 A), technetium (quite
weak and detectable towards the blue 4238.19, 4262.27 and 4297.06 A), rubidium
(7800.3 A), and more in general all the s-process lines.
This plethora of lines is used for abundances measurements, but how do
the pulsation, non-LTE effects, inhomogeneities, and shock-wave propagation affect
these measurements? A visible interfererometer will help to address part of these
questions in the following ways: (i) monitoring programs (three images within one
year during selected pulsation phases on a few selected targets will constrain the
time-scale of the life of the inhomogeneities; (ii) monitoring imaging through a
pulsation cycle will enable to assess the effect of pulsation on the stellar atmosphere.
A few observations ( 6 to 10 visibilities) covering different spatial frequencies for a
sample of targets with various chemistry and variability type will help constraining
the molecular stratification of the available model atmospheres.
Beside these general questions there are also some very specific science cases
that would benefit from the existence of a visible interferometer that provides:
medium-to-high spectral resolution, imaging capabilities, and if possible a polarime-
try mode. The science cases are discussed in the following Sect.s 6.1.1, 6.1.2, 6.1.3,
6.1.4, and 6.1.5 while a summary of the requirements is presented in Sect. 6.1.6.
6.1.1 The dust distribution around AGB stars
The atmosphere of an AGB star is cool enough to allow formation of various dust
species. Dust plays a crucial role in the stellar wind, although there are some
cases where the dynamics is not completely understood. The dust-driven stellar
wind in small particle approximation can successfully explain the observations of
carbon-rich stars (Gautschy-Loidl et al., 2004; Nowotny et al., 2005; Sacuto et al.,
2011), while it fails for the O-rich case. [Hofner (2008)] suggested that in the case
of oxygen-rich atmospheres, the wind is driven by scattering on micron-size Fe-
free silicate dust grains. These models were tested vs. interferometric observations
of the O-rich variable RT Vir by [Sacuto et al. (2013)], while the proof of the
existence of such large grains arrived with the SAM-NACO observations presented
by [Norris et al. (2012)]. The authors used the interferometric (aperture masking)
technique to reach the angular resolution required to observe close to the stellar
surface (∼ 10 mas). This technique was combined with polarimetry that allows to
distinguish between the contribution coming from the stellar surface and the one
coming from a dust shell. Through modelling one can establish the dust grain size,
composition, distribution and importance of clumpiness.
The gain of going to the visible to study the dust distribution around AGBs is
that the scattering from dust contribution becomes more important. The challenge
is the fact that dusty stars become fainter. There are around 200 objects that could

March 22, 2017 0:30 World Scientific Book - 9.75in x 6.5in Science˙cases˙visible page 65
Evolved stars, Planetary Nebulae, δ Scuti, and RR Lyrae as seen by a visible interferometer 65
be observed from Paranal (selection criteria DEC< +10) with an average V-band
magnitude ∼ 7.45 mag. A few spectral channels spread over the visible should be
enough to perform the observations. One could choose the same ones available on
other instruments mounted on single-dish telescopes to be able to cover different
spatial scales. VLT/EFOSC2 for example covers the Hα filter (6577 A), a Stromgren
y filter (5482 A), and narrow filters (50 A) centred on the resonance lines of Na
(5894A). The size of the photosphere in the visible will be in average < 10 mas,
but the dust component is expected to be more extended, especially for the nearby
objects. To be able to reconstruct the distribution of grain size, one will need
both long and very short configurations. Because of the complexity of the AGB
environment, six telescope is the minimum number of apertures required. Single
epoch observations need to be performed within maximum 1 week to avoid to be
affected by the temporal variability of the star.
Adding a polarimetry mode in the visible might be a big challenge but the
science case presented for AGBs can be extended also to other dust-enshrouded
objects like K-Giant stars, post-AGBs (Sect. 6.3) and protoplanetary discs.
6.1.2 Mapping magnetic fields and velocity fields over the surface
of stars
The generation mechanism of magnetic fields in cool evolved stars and their possi-
ble connections to the mass loss are not well understood. We expect the study of
starspots to be the key of understanding stellar dynamos (Berdyugina, 2005). In-
terferometry combined with high spectral resolution provides the spatially resolved
spectrum at each position over the surface of stars, as demonstrated by the re-
cent velocity-resolved VLTI/AMBER imaging of the RSGs Betelgeuse and Antares
(Ohnaka et al., 2011a, 2013)1. This allows us to map the velocity field, opening a
new window to observe stars like the Sun. The spatially resolved spectra of regions
with strong local magnetic fields (e.g., starspots) would show the Zeeman splitting,
which enables us to map the magnetic fields over the surface of stars. The combined
mapping of the velocity fields and magnetic fields would bring stellar astrophysics
to an entirely new dimension.
6.1.3 Spatially resolving the chromosphere and its dynamics
The heating mechanism of the chromosphere in cool evolved stars and its role in
the mass loss is little understood. Recent observations suggest the coexistence of
the hot chromospheric plasma and cool molecular gas within several stellar radii,
forming inhomogeneous structures (e.g., Harper et al., 2001; Harper and Brown,
2006). [Berio et al. (2011)] probed the chromosphere of K giants in the Hαand Ca II
lines with CHARA/VEGA. We propose to image the chromosphere and derive its
physical properties by interferometry of the H alpha and Ca II lines. High resolution
imaging would help to understand the heating mechanism of the chromosphere, its
role in the mass loss, and why it can coexist with the molecular component.
1see also movies at
http://www3.mpifr-bonn.mpg.de/staff/kohnaka/alfori2.html
http://www3.mpifr-bonn.mpg.de/staff/kohnaka/alfsco2.html

March 22, 2017 0:30 World Scientific Book - 9.75in x 6.5in Science˙cases˙visible page 66
66 Science cases for a visible interferometer
6.1.4 Probing the MOLsphere with TiO lines
The MOLsphere is quasi-static, dense, warm molecular layers extending to several
stellar radii and exists not only in Mira stars but also in normal red giants and
red supergiants. Recent interferometric observations have succeeded in spatially
resolving or imaging the MOLsphere and demonstrated the presence of outer atmo-
spheres much more extended than hydrostatic photospheric models (e.g. Ohnaka
et al., 2013, and references therein). Nevertheless there are observational data chal-
lenging the presence of the MOLsphere (Ryde et al., 2014). For example, the current
MOLsphere models predict the TiO bands in the visible to be too strong compared
to the observed spectra, suggesting that we do not yet understand the structure
of the outer atmosphere very well. Spatially resolving the stars in the TiO lines
helps to better understand the structure of the outer atmosphere. Given that TiO
may serve as seed nuclei for dust formation, it is important to know the physical
properties of TiO layers for understanding the dust formation.
6.1.5 Geometrical characterization of shock waves in Mira stars
Radially pulsating AGB stars (a.k.a. Mira stars) are characterized by strong emis-
sion in the Balmer lines linked to the propagation of a strong hypersonic radiative
shock waves. Strong signatures in linear polarization in these lines have been de-
tected (Fabas et al., 2011) and this result points toward global non-sphericity of
the shock since the polarization of the disk-integrated flux does not cancel out.
Spectro-interferometry in the visible would help establish the shape and time evo-
lution of these shock waves, all of this in comparison to the shape and evolution of
the photosphere. Indeed, we think that, while it propagates outwards, the shock
front breaks down and is at the origin of the formation of clumps in the circumstellar
envelope. The requirements for this kind of observations should allow to resolve the
lower atmosphere of a given Mira star, so 30 mas should be a good upper value for
spatial resolution and, of course, a high spectral resolution is needed (> 30, 000) in
order to study individual lines. Since the pulsation period can be as long as a year,
a time sampling of one week around and after the maximum light would be good.
One triplet of telescopes is sufficient in order to get visibilities and closure phases,
which means imaging is not necessary. The Mira stars to be observed typically have
a magnitude V < 7 at maximum light.
6.1.6 Requirements for the science cases of AGB stars
AGBs are very luminous and have extended atmosphere, therefore they become
naturally the first objects to be observed with infrared interferometry. When moving
to the visible though one has to be careful. In fact many evolved AGBs will be
faint because of dust obscuration. Typical magnitudes for the most evolved Mira
variables will vary between 8 and 13 mag in the V-band. One has also to take into
account the fact that Mira variable will change their brightness of up to 9 magnitude
within one year. Imaging programs will have to take this into account, and a proper
number of telescopes (6+) or a fast system to change configuration (in the current
VLTI scheme: 3 configurations within 2 weeks maximum) are needed.
Well-studied cool evolved stars like Betelgeuse, omi Cet, etc, have angular

March 22, 2017 0:30 World Scientific Book - 9.75in x 6.5in Science˙cases˙visible page 67
Evolved stars, Planetary Nebulae, δ Scuti, and RR Lyrae as seen by a visible interferometer 67
diameters larger than 30 mas. At 0.6 µm, they are completely resolved out already
at 8 m. For imaging, it is necessary to sample the first lobe, therefore baselines
as short as 4 m are needed. A diffraction-limited imager on a single-dish telescope
may help, but only if the single-dish imager’s spectral resolution matches with that
of the interferometer. For imaging of stars with angular diameters of 10–20 mas, a
spatial resolution of ∼ 1–2 mas is required. There are ∼ 30 stars with 10–20 mas
with V < 4–5. Time interval of 1 month would be useful for probing time variations.
Precision: 5–10% in visibility, 2–3 deg in CP.
A spectral resolution of a few thousands (> 10 000) is enough to resolve
the molecular bands, while we need a spectral resolution of > 40 000 to resolve
the atomic line profiles. To detect the Zeeman splitting (Sect.6.1.2) the spectral
resolution of at least 50 000 (better 105) is required.
6.2 Red Supergiant Stars
Massive evolved stars with masses between roughly 10 and 25 M spend some
time as red supergiant (RSG) stars being the largest stars in the universe. They
have effective temperatures, Teff , ranging from 3 450 to 4 100 K, luminosities of
20 000 to 300 000 L and radii up to 1 500 R (Levesque et al., 2005; Levesque,
2010). Their luminosities place them among the brightest stars, visible to very large
distances. These stars exhibit variations in integrated brightness, surface features,
and the depths, shapes, and Doppler shifts of spectral lines; as a consequence, stellar
parameters and abundances are difficult to determine.
RSGs eject massive amounts of mass back to the interstellar medium (
3×10⁻⁴ – 2×10⁻⁷ - M/yr De Beck et al., 2010) with an unidentified process
that may be related to acoustic waves and radiation pressure on molecules (Josselin
and Plez, 2007), or to the dissipation of Alfven waves from magnetic field, recently
discovered on RSGs (Auriere et al., 2010; Grunhut et al., 2010), as early suggested
by [Hartmann and Avrett (1984); Pijpers and Hearn (1989); Cuntz (1997)]. The
understanding of the physics of the convective envelope is crucial for these stars that
contribute extensively to the dust and chemical enrichment of the galaxies. More-
over, the mass-loss significantly affects the evolution of massive stars, and it is a key
to understanding the progenitors of core-collapse supernovae. The effects of con-
vection and non-radial waves can be represented by numerical multi-dimensional
time-dependent radiation hydrodynamics (RHD) simulations with realistic input
physics carried out with CO5BOLD code. These simulations have been used ex-
tensively employed to predict and interpret interferometric observations for evolved
stars such as, e.g., for AGBs (Chiavassa et al., 2010c) and for RSGs (Chiavassa
et al., 2010b).
There is a number of multiwavelength imaging examples of RSGs because of
their high luminosity and large angular diameter. Several research teams (Buscher
et al., 1990; Wilson et al., 1992; Tuthill et al., 1997; Wilson et al., 1997; Young et al.,
2000) detected time-variable inhomogeneities on the surface of α Ori with WHT
and COAST; [Haubois et al. (2009)] reported a reconstructed image in the H-band
with two large spots; [Ohnaka et al. (2009, 2011b); Ohnaka (2014)] detected possible
convective motions in CO line formation layers for α Ori and Antares. [Tuthill et al.

March 22, 2017 0:30 World Scientific Book - 9.75in x 6.5in Science˙cases˙visible page 68
68 Science cases for a visible interferometer
(1997)] reported bright spots on the surface of the supergiants α Her and α SCO
using WHT, and [Chiavassa et al. (2010c)] on VX Sgr using VLTI/AMBER.
6.2.1 Requirements
The main objectives that we need to recover from visible interferometric im-
ages/observables are:
• the size of the granulation cells from the large scale granule to the small-medium
scale convection-related structures;
• the surface intensity contrast;
• the velocity field and the timescale of the convective motions.
These objectives are crucial:
• to understand the photosphere and dynamics of RSGs where about half of the
atomic elements are produced;
• to explain the (unknown) mass-loss process;
• to constrain model atmospheres that will be used to determine accurate abun-
dances in distant galaxies from complex spectra.
In Section 6.1.4, we indicated several molecular and atomic lines predominant
in evolved stars. Several spectral resolutions should be used to attack the different
related problems either for RSG and AGB stars:
• Low resolution, R = λ/∆λ = 30. This resolution will help to characterize
the size granulation pattern in terms of intensity surface contrast and spatial
coverage of the surface.
• Medium resolution, R = λ/∆λ = 3000. This resolution will help to study the
temperature stratification in the atmosphere. Observations at wavelengths in a
molecular band and in the close pseudo-continuum probe different atmospheric
depths, and thus layers at different temperatures that highly constraint the
limb-darkening effect to be compared to 3D RHD simulations.
• High resolution, R = λ/∆λ > 30000. This resolution will help to study the
cinematic in the spectral lines. In fact, these stars have velocities up to 20 ? 30
km/s in the optical thin region that strongly affect the line broadening.
A last important point concerns the temporal and the wavelength variabil-
ity. Monochromatic intensity maps from 3D RHD simulations are characterized by
strong wavelength dependence that changes the appearance of the stellar surface.
In average, the brightest areas exhibit an intensity ∼50 times or larger than the
dark ones in the optical and up to ∼10 times in the infrared. Probing very narrow
wavelength filters close to particular optical spectral line centers may increase these
values. The importance of the spectral resolution is shown in Fig. 14 and 15 and re-
lated Section 5.4 of [Chiavassa et al. (2009)]. Moreover, the temporal time scales of
the granulation pattern differ also with respect to the spectral region probed: with,
e.g., the optical region characterized by short-lived (a few weeks to a few months)
small-scale structures (Chiavassa et al., 2011); and the near infrared characterized
by large cells evolving over years (Chiavassa et al., 2009). The temporal monitoring

March 22, 2017 0:30 World Scientific Book - 9.75in x 6.5in Science˙cases˙visible page 69
Evolved stars, Planetary Nebulae, δ Scuti, and RR Lyrae as seen by a visible interferometer 69
is then a key point, images must be carried out every month (or less) in the optical
region for all the spectral resolution options.
Fig. 6.1 Synthetic maps (linear intensity) of a RSG simulations at different stellar time in theH band (top row, Chiavassa et al., 2009) and in the optical region (bottom row, Chiavassa et al.,
2011).
6.3 Post-AGB
Optically-bright post-AGB stars are commonly found in binary systems with sep-
arations of typically 1 AU and that are surrounded by rather compact, stable cir-
cumbinary disks (Kamath et al., 2014; de Ruyter et al., 2006). These disks are
very similar to the protoplanetary disks (PPDs) around young stars. However, the
formation history of post-AGB disks is clearly different from PPDs, as is the further
evolution of the illuminating star. Optically thick and dusty disks are very com-
plex, which, in the post-AGB case, is added by the complication that the central
object is an (interacting) binary. To answer the relevant questions concerning the
origin, evolution and fate of these systems, therefore, requires a multiwavelength
approach, combined with a high angular resolving power. A visible interferomet-
ric instrument is highly needed to extend the constraints on the parameter space
of the models beyond what the ALMA and the second-generation instruments on
the VLTI are able to provide. Visible interferometry can provide unique additional

March 22, 2017 0:30 World Scientific Book - 9.75in x 6.5in Science˙cases˙visible page 70
70 Science cases for a visible interferometer
insights and constraints. There are, in particular, two fundamental questions that
can be addressed by such an instrument.
Case 1 Case 2 Case 3a Case 3b
α = 67.5hot (optically thin) gas bipolar
outflow halo
i = 12 i = 12 i = 12 i = 12
Fig. 6.2 The various proposed configurations to explain the existing visible interferometric data
for the 89 Her post-AGB binary. This system is seen pole-on so that the various possibilities
cannot be distinguished based on the existing data, although the modeling of Hillen et al. (2014)suggests that the first option of a highly scattering inner disk rim does not work. More systems
need to be observed to put this intriguing result in a bigger perspective. For more background
info concerning 89 Herculis, see Hillen et al. (2013) and Hillen et al. (2014).
6.3.1 Locating the continuum scattered light around post-AGB bi-
naries
Recently, using the visible instruments on the NPOI and the CHARA Array, Hillen
et al. (2013) spatially resolved a surprisingly large fraction of circumstellar optical
light around the bright prototypical post-AGB binary 89 Her. Between 35 and
40% of all optical flux received from this pole-on system is light scattered by the
inner region, either from the inner rim of the disk or from a region extended in the
vertical direction along the line of sight (see Fig. 6.2). Based on radiative transfer
disk models, Hillen et al. (2014) claim that the former option can be excluded:
such a large amount of optical light cannot exclusively be scattered by the disk
and this particular system must therefore have an optically thin dust component
in an outflow as well. Do all the post-AGB binary+disk systems have such a
scattered light contribution to the stellar part of the spectral energy distribution?
What fraction of the scattered light is coming from the disk and what is coming
from the environment, including possible outflows? Are the input data to our
models or some of the basic modeling assumptions/practices incorrect? More precise
observations (5-10% in visibility, 1-3 in CP) with a better uv-coverage (at least 4T
combination), such as can be provided easily with the VLTI baselines, are needed to
fully characterize the scattering source in this system. A polarimetric mode would
be highly advantageous for this kind of study as well, since different 3D-distributions
of the material can yield a variety of polarimetric signatures whereas the resulting
intensity projections on the sky may be similar. Although scattering can be studied
in the near-IR, additional observations in the visible wavelength domain give much
stronger constraints on the material properties and the spatial distribution of the
scattering material. With a visible instrument on the VLTI the light scattered in
post-AGB binary systems could be exploited in full detail, which would significantly
reduce the extensive parameter space involved in modeling these objects. About
60 Galactic sources with V < 12 mag are accessible to the VLTI. Extrapolating

March 22, 2017 0:30 World Scientific Book - 9.75in x 6.5in Science˙cases˙visible page 71
Evolved stars, Planetary Nebulae, δ Scuti, and RR Lyrae as seen by a visible interferometer 71
from the 89 Her results, a spatial resolution of 1 mas and a low spectral resolution
(preferentially over a wide spectral range) is sufficient to characterize a scattered-
light component in the majority of these systems.
6.3.2 Tracing the inner gas streams in post-AGB binaries: accre-
tion disk and/or jet?
Although outflows detected in optical continuum light are currently rare among
post-AGB binaries, 89 Her and the Red Rectangle being the only known examples,
outflows have been detected in these systems with a variety of other techniques.
For many objects, the CO sub-mm rotational lines have an outflowing component
in addition to the rotating disk (Bujarrabal et al., 2013a), which in some cases
has been resolved with the PdBI (Bujarrabal et al., 2007), and recently ALMA
(Bujarrabal et al., 2013b). Jet-like outflows emanating from the neighborhood of
the companion star have also been inferred on the basis of temporal spectroscopic
monitoring campaigns (e.g., Gorlova et al., 2012; Thomas et al., 2013). Although
feasible to detect jets in this way, to fully charactize these structures requires a more
direct imaging method. This is of great importance because the link between the
“inner outflows” detected in the optical and the large-scale outflows seen in CO is
not at all understood, nor is the driving mechanism for either outflow or the mass
reservoir from which they emanate. Is there an accretion disk around the secondary?
Is this disk being fed by accretion from the circumbinary disk or from the post-AGB
star? Are there more objects with a source morphology as complex as the Red
Rectangle? Will these post-AGB binaries ever become planetary nebulae, which
are by default asymmetric (Balick and Frank, 2002)? Many questions remain about
these objects and can only be resolved by constraining their outflow properties. The
number of sources and required spatial resolution is the same as in the previous
science case. In this case, however, a spectral resolution of at least 10 000 is needed,
to spectrally resolve the Halpha line.
6.3.3 Requirements
About 60 sources with V < 12−−13 can be observed from Paranal. The spectral
resolution needed for the first science case is 3-30, but more important is the spectral
range (up to B?). The required spatial resolution is about 1 AU at a distance of 1
kpc, or 1 mas, to fully resolve the nearest sources. Visibility precision: 5%, closure
phase precision: 1-3. Imaging is required, because we want to trace the scattered
light and the source morphology can be very complex: how much of it is coming from
the circumbinary disk, from a jet-like outflow, a halo or yet another morphology?
Imaging with four telescopes is possible, but six telescopes would be better, given
that RV Tauri stars pulsate on timescales of ∼15 days.
A spectral resolution of 10 000 is required for the second science case
(Sect. 6.3.2). The focus is on Halpha (and perhaps the Ca triplet). The required
spatial resolution is the same as for the first science case. Visibility precision: dif-
ferential measurements at the < 5% level are needed. Imaging is required for this
science case, given the complex morphologes that are to be expected. Six tele-
scopes would be preferred, given the pulsations and source complexity, although a

March 22, 2017 0:30 World Scientific Book - 9.75in x 6.5in Science˙cases˙visible page 72
72 Science cases for a visible interferometer
2-telescope temporal monitoring would already give interesting constraints.
6.4 The projection factor of δ Scuti and RR Lyrae stars
The Baade-Wesselink (BW) method has been widely used to calibrate the period-
luminosity relation of Cepheids (Fouque et al., 2007; Storm et al., 2011a,b) with
important implications for the extragalactic distance scale and cosmology (Riess
et al., 2011). It has been applied for Cepheids using interferometry (Kervella et al.,
2004a; Davis et al., 2009) and photometry (Gieren et al., 2005b), but also for RR
Lyrae stars (Fernley, 1994) and δ Scuti stars (Wilson et al., 1993; Milone et al.,
1994; Wilson et al., 1998). Concerning δ Scuti stars a radial pulsation is required to
apply the classical BW method. Many High-Amplitude δ-Scuti (hereafter HADS)
stars show radial fundamental mode of pulsation (combined sometimes with other
harmonics). These are the best candidates to apply the BW analysis. However,
few studies have been done in this field and the parallaxes of Hipparcos currently
remains the only geometric method that has been used to calibrate their PL relations
(Petersen and Hog, 1998).
The basic principle of the BW method is to compare the linear and angular
size variation of a pulsating star in order to derive its distance through a simple
division. The key point is that photometric measurements lead to angular diameters
corresponding to the photospheric layer, while the linear stellar radius variation is
deduced by spectroscopy, i.e., based on line-forming regions which form higher in the
atmosphere. Thus, radial velocities Vrad, which are derived from line profiles, include
the integration in two directions: over the stellar surface through limb-darkening
and over the atmospheric layers through velocity gradients. All these phenomena
are currently merged in one specific quantity, generally considered constant with
time: the projection factor p, defined as Vpuls = pVrad, where Vpuls is defined as
the photospheric pulsation velocity (Nardetto et al., 2004). Vpuls is then integrated
with time to derive the photospheric radius variation.
The projection factor appears widely in the literature for Cepheids. Up to
recently, a constant geometric projection factor was commonly used for all kinds of
pulsating stars (generally p = 1.36, Burki et al. (1982)). Using high precision spec-
troscopic measurements of 10 southern hemisphere Galactic Cepheids with HARPS,
we measure directly the velocity gradient within the atmosphere of Cepheids and
derive semi-theoretical p-factors. We discovered a relation between the period of
Cepheids and the projection factor. We also showed that if one uses a constant
p-factor (p = 1.36) to derive the PL relation, errors of 0.10 and 0.03 on the slope
and zero-point of the PL relation can be introduced. This means that distances can
be overestimated by 10% for long-period Cepheids (Nardetto et al., 2007, 2009).
The aim of this study is to derive the expected period-projection factor re-
lation of RR Lyrae and High-Amplitude δ Scuti stars (HADS) by applying the
inverse BW method. HADS are generally supposed to pulsate radially. However,
weak non-radial pulsation could be detected using long baseline visible interfer-
ometry. In that case, the Baade-Wesselink method, if revised, can constitute an
interesting tool to distinguish radial and non-radial modes of pulsation. Balona
and Stobie (1979c,b,a) and Stamford and Watson (1981) give a p-factor estimates

March 22, 2017 0:30 World Scientific Book - 9.75in x 6.5in Science˙cases˙visible page 73
Evolved stars, Planetary Nebulae, δ Scuti, and RR Lyrae as seen by a visible interferometer 73
Fig. 6.3 The Baade-Wesselink projection factor as a function of the period for different kinds ofpulsating stars. The δ Scuti stars indicated as blue diamonds are, by increasing period: β Cas,
DX Cet, AI Vel and ρ Pup.
connected to the non-radial mode of the star, while the classical approach done for
Cepheids have been recently applied to several δ-Scuti with dominant radial mode
Guiglion et al. (2013); Nardetto et al. (2014). The low and medium spectral res-
olutions (reported in Section 6.2.1) are the best modes of observation in order to
derive the angular diameter variation of pulsating stars with high precision.
Once the projection factor derived, the photometric version of the BW
method can be applied to a wider sample of fainter δ Scuti and RR Lyrae stars,
and, with the combination of Gaia parallaxes, this can help to provide a robust
period-luminosity relation. Deriving such relation is extremely interesting for dif-
ferent reasons. First, (Fernie, 1992) and then (McNamara et al., 2007) showed that
the PL relation of δ Scuti stars and Cepheids seems to be consistent in slope and
zero-point (Fig. 6.4). Second, Cepheids are supergiant stars and are relatively rare
in space, while δ-Scuti stars are dwarf or near-dwarf stars and are numerous in the
solar neighborhood. Many are so nearby that they have negligible or very small

March 22, 2017 0:30 World Scientific Book - 9.75in x 6.5in Science˙cases˙visible page 74
74 Science cases for a visible interferometer
Fig. 6.4 Period-Luminosity relation of Galactic δ Scuti (lower magnitude) and Cepheid (larger
magnitude) variable stars (figure from Mc Namara et al. 2007). The PL relation of Cepheids com-
bined with the PL relation of δ Scuti stars would provide an interesting tool for the extragalacticdistance scale.
reddening. Third, SX Ph stars can be found in Globular Clusters, that helps also
to constrain the PL relation of RR Lyrae (McNamara et al., 2007). The PL rela-
tion of Cepheids combined with the PL relation of δ Scuti stars would provide an
interesting tool to the extragalactic distance scale. And if we show that the BW
method can be used to calibrate the PL relation of δ Scuti using a specific p-factor
(and in a consistent way compared to trigonometric measurements) it will open a
new and promising field of investigation.
N? ' 10
spatial resolution θ from 0.1 to 0.25 mas
spectral resolution R = 3000
temporal resolution 10 minutes (high sensitivity required)
precision 1% at low visibilities
imaging 3T is fine, 6T is best
6.5 Pulsating stars in binaries
Another very interesting aspect is to study pulsating stars in binaries in order to
(1) measure their orbital solution with interferometry and (2) derive their mass,
which put important constrains on the evolutionary models. it concerns not only δ
Scuti stars, but also RR Lyrae, β Cepheids, γ Dor and RoAp stars. From Garcia
et al. (1995), Stankov et al. (2005) and Matthews et al. (1999), together with
the Galactic Variable Catalogue, we found about 140 objects to be observed with
mV < 7 and 200 objects with mV < 9. The exact orbital separation still have to
be calculated to better characterize how many objects could be resolved by a 300

March 22, 2017 0:30 World Scientific Book - 9.75in x 6.5in Science˙cases˙visible page 75
Evolved stars, Planetary Nebulae, δ Scuti, and RR Lyrae as seen by a visible interferometer 75
meters baseline interferometer.

March 22, 2017 0:30 World Scientific Book - 9.75in x 6.5in Science˙cases˙visible page 76
76 Science cases for a visible interferometer

March 22, 2017 0:30 World Scientific Book - 9.75in x 6.5in Science˙cases˙visible page 77
Chapter 7
Interacting binaries
N. Blind1, H. Boffin2, M. Borges Fernandes3, A. Gallenne4, C. Guerrero Pena5, M.
Hillen6, A. Labeyrie7, T. Marsh8, M. Simon9, F. Milllour1, N. Nardetto1, D.
Steeghs8, T. ten Brummelaar10,
1 Max Planck Institute for Extraterrestrial Physics, Giessenbachstrasse, 85741,
Garching, Germany2 ESO, Alonso de Cordova 3107, Casilla 19001, Santiago 19, Chile
3 Observatorio Nacional, Rua General Jose Cristino 77, 20921-400 Sao Cristovao,
Rio de Janeiro, Brazil4 Universidad de Concepcion, Departamento de Astronomıa, Casilla 160-C,
Concepcion, Chile5 Instituto de Astronomıa UNAM, Apdo. Postal 70-264, Cd. Universitaria, 04510
Mexico D.F., Mexico6 Instituut voor Sterrenkunde, KU Leuven, 3001, Leuven, Belgium
7 Collge de France, 11, place Marcelin Berthelot, F-75231 Paris Cedex 05, France8 Department of Physics, University of Warwick, Coventry CV4 7AL, UK
9 Department of Physics and Astronomy, Stony Brook University, Stony Brook,
NY 11794, USA10 CHARA Array, Mount Wilson Observatory, 91023, Mount Wilson, CA, USA
7.1 Binaries
It can be safely said that binary stars are critical for astrophysics, and especially
interacting binaries. This is by no means a gratuitous statement. First of all, stars
tend to form and live in binaries, with the fraction of binary stars being higher for
more massive stars: the binary fraction increases from 25–30 % for M dwarfs and
54±2% for solar-like stars, to more than 70% for B and O stars (Raghavan et al.,
2010; Chini et al., 2012). Moreover, a significant fraction of these binary stars will
interact in one way or another during their evolution. For example, Sana et al.
(2012) found that more than 70% of all massive stars will exchange mass with a
companion, leading to a binary merger in one-third of the cases.
Interactions in a binary system can be of different kind:
• Tidal interaction: stars will tidally interact, leading to synchronisation of the
stellar rotation with the orbital motion, and then later, to the circularisation of
77

March 22, 2017 0:30 World Scientific Book - 9.75in x 6.5in Science˙cases˙visible page 78
78 Science cases for a visible interferometer
the orbit. The typical timescales for tidal synchronisation in convective stars
is 104P 4 years (where P is in days), that is, about 108 years for a system
with an orbital period of 10 days, while circularisation occurs on timescales of
106P 16/3 years, meaning a timescale of 1011 years for a 10-d period system. The
circularisation period, i.e. the orbital period for which the orbit is circularised,
will thus depend on the age of a star and is therefore about a few days for solar-
like stars in our neighborhood or in open clusters. As a star evolves towards the
red giant and asymptotic giant branches, its radius increases by factor of ten to
hundreds, leading to much stronger tidal effects. The circularisation period for
red giants in open clusters is, for example, of several hundred days Mermilliod
et al. (2007).
• Mass transfer by wind: all stars loose mass by stellar wind, with mass-loss
varying between 10−14 Myr−1 for solar-like stars to 10−6–10−4 Myr−1 for
the most evolved stars. When a star is in a binary system, its wind will be
partially intercepted by the companion, leading to mass exchange. The simplest
formalism of such accretion is by Hoyle & Lyttleton (1944) and Bondi & Hoyle
(1950), but more sophisticated simulations in binary systems have shown that
things are more complicated, with the formation of spirals (Boffin et al., 1994;
Theuns et al., 1996; Nagae et al., 2004). Such spirals have now been detected,
e.g. by ALMA around the star R Scl Maercker et al. (2012). When the two stars
have strong winds, these will collide, creating shocks, which will emit X-rays.
This is particularly the case in massive binaries.
• Roche-lobe overflow: When a star fills its Roche lobe – a critical region defining
its zone of gravitational influence (see Fig. 7.1) – it is no more possible for it to
keep its material, and matter flows towards its companion. This is the typical
mass loss happening in Algols.
• Angular momentum loss: mass loss and mass transfer lead to angular momen-
tum loss and transfer, but one can also have angular momentum loss without
any mass loss. This is the case when one of the stars has a strong enough
magnetic field, such as in cataclysmic variables, or if the stars are very close
and degenerate, in which case, there will be emission of gravitational radiation.
The angular momentum variations lead to changes in the orbital elements and
in some cases merging of the two stars.
The mass transfer in a binary system will affect the chemical composition of
the companion, which can for example become polluted in processed elements like
in Algols or in Barium stars. It also leads to a mass increase of the companion, with
sometimes strong consequences, such as blue straggler stars or Type Ia supernovae.
Finally, mass transfer has also an impact of the evolution of the orbital separation.
Because of the various possible interactions, and the various sizes and mass-
loss of stars in the different evolutionary stages, interacting binaries are happening
on many different scales. On one extreme, the system SDSSJ010657.39-100003.3
[?]Killic2011 is a detached binary comprising two white dwarfs in orbit around each
other with an orbital period of 39 minutes: one of the white dwarf is tidally de-
formed, and because the system is losing angular momentum through gravitational
radiation, the two stars will merge in 37 Myr. This is by no means the binary
systems with the shortest orbital period: to our knowledge, this title is bestowed on

March 22, 2017 0:30 World Scientific Book - 9.75in x 6.5in Science˙cases˙visible page 79
Interacting binaries 79
Fig. 7.1 The two main cases of mass transfer in a binary system: by wind accretion (a) or by
Roche lobe overflow (b).
the AM Canum Venaticorum star HM Cancri, with an orbital period of 321 seconds
Roelofs et al. (2010). This system also contains two white dwarfs, with one of the
two transferring mass to the other by Roche lobe overflow. At the other extreme,
one of the most remarkable star in our Galaxy, η Car, is a binary system with an
orbital period of 5.5 years and a rather eccentric orbit. Every passage of the com-
panion star at the perihelion is leading to drastic effects Mehner et al. (2015). In the
1840’s, η Car underwent a gigantic outburst, making it the second brightest star in
the night sky, after Sirius. During this outburst, the star lost about 10 M, creating
the magnificent homunculus nebula. The likely explanation of this outburst lies in
the binary nature of the system.
Binary stars are thus critical as they are the clues to understand a large
variety of astrophysical phenomena, some playing an important role in chemical
enrichment of galaxies, such as Type Ia supernovae, short gamma-ray bursts, novae,
barium stars and other peculiar red giants, symbiotic stars, blue straggler stars, etc.
Moreover, as we have seen, some stars in binary systems will merge, so that even if
a star appear single now, it may not have been always the case, and the previous
binarity may be the cause for some odd physical properties of the stars. This could
explain some blue stragglers or some B subdwarfs, among others. Binary stars are
also crucial as they allow us to determine uniquely, and in a model-independent
way, the masses and radii of stars. It is thus critical to be able to study them in
details.
For solar-like stars, Duquennoy & Mayor (1991) showed that the period distri-
bution is log normal between 1 day and 10 million years, with a mean at logP = 4.8
days, and a standard deviation in log of 2.3. Thus, various techniques will be needed
to probe these different scales. The longest periods are often found as astrometric
or visual binaries, while for the shortest periods, one need to rely on spectroscopy or
photometry (spectroscopic binaries, eclipsing binaries, W Uma stars, etc.). The ad-
vance in technology has allowed to change also the application of a given technique

March 22, 2017 0:30 World Scientific Book - 9.75in x 6.5in Science˙cases˙visible page 80
80 Science cases for a visible interferometer
to various systems.
Currently the number of systems resolved as visual binaries is biased towards
long period systems: this is because traditionally, it was only possible to discern
visual binaries with a separation of 0.3” or more. The use of adaptive optics on
the largest telescopes as well as the Hubble Spatial Telescope has allowed us to go
to smaller separation, that is, the diffraction limit of the telescopes, typically 0.05”
or 50 mas. With interferometry, one can go down to much smaller separations
even, down to about 1 mas. This thus allows one to problem systems with short
orbital period and significant radial-velocity variations, that is, we can combine
spectroscopic and visual orbits and get most information on the system, in particular
the masses. As a typical distance of 100 pc, 0.3” corresponds to a separation of 30
AU and orbital periods of about 100 years; 0.05” to about 5 AU and 10 years, while
1 mas, corresponds to 0.1 AU and a period of a few days. For cases more typical
of massive stars, at a distance of 1.5 kpc, these numbers become, respectively, 450
AU and 2000 yrs, 75 AU and 100 yrs, and 1.5 yrs and 0.3 yrs. Thus interferometry
really allows us to reach a new class of systems, those most likely to interact. We
note that with techniques such as astro-tomography, it is even possible to go down
to the micro-arcsecond scale, but this is limited to a certain kind of binary systems
Boffin et al. (2001).
We identify three major interests of using interferometry for the different
types of binaries:
• Finding a companion to a star;
• Determine the fundamental parameters of stars, such as mass and radius;
• Study the kinematics of gas, accretion discs, etc., in interacting systems.
Interferometry has already been used for a variety of binary stars, such as
double-lined stars, symbiotic stars, post-AGB stars, binary cepheids, massive stars
and their various flavours, such as B[e] and luminous blue variable stars, as well as in
young binaries. As a testimony of the ubiquity of binary stars in all fields of stellar
astrophysics, some of these topics are covered in previous chapters in this book:
young binaries is covered in Chapter 3 by Perraut et al., while eclipsing binaries
and binary cepheids are covered in Chapter 4 by Nardetto et al., binarity of massive
stars and the use of spectro-astrometry in Chapter 5 by Stee et al., while discs in
binary post-AGB stars as well as pulsations in binaries are covered in Chapter 6 by
Paladini et al. Here, we will present some results obtained with interferometry, not
presented elsewhere in this book.
We also refer to the review of Stee et al. (2012) that present results be-
tween 2007 and 2011 based on interferometric observations of binaries and multiple
systems, as well as to the work by Millour et al. (2014), which used the VLT Inter-
ferometer to study the close environment of two post-merger stellar systems.
7.2 Finding a companion
The presence of a companion will be betrayed by its signature in the interferometric
signal. If the difference in magnitude between the two objects is less than 6, i.e. the
contrast in flux is about 200 or less, then current interferometers such as PIONIER

March 22, 2017 0:30 World Scientific Book - 9.75in x 6.5in Science˙cases˙visible page 81
Interacting binaries 81
on ESO’s Very Large Telescope can detect the companion, using visibilities and
closure phases provided there is an error of 0.5 degrees or less on the latter ?. Once
the companion has been detected, it is then possible to follow the relative orbital
motion of the two components, providing a visual orbit, which coupled with radial
velocities measurements lead to the measurement of the masses of the two stars (see
next section).
Working at high spectral resolution allows one to probe the smallest interact-
ing systems by spectro-astrometry. While the giant is in generally dominating the
continuum emission in the visible domain, the faint companion is situated in the
energetic accretion zone presenting strong emission line like Hα. The photocentre
of the binary, centred on the giant companion in the continuum, shifts towards the
accretor in the line, which could be measured by help of differential phases. A sim-
ple calculation and the experience gained on VEGA show that reaching precision of
order 10 µas or better is well within reach, and is therefore able to probe the most
compact semi-detached systems.
An example of such detection is given by the discovery of a companion to
the luminous blue variable (LBV), HR Car. As mentioned earlier, the best-known
LBV, η Car, is thought to have lost about 10 M during its great outburst in the
1840’s. There is no firmly established mechanism to explain such a mass loss, but
the discovery that η Car is a five-year highly eccentric binary puts focus on possible
binarity-induced mechanism for the giant outbursts, and prompted binarity searches
among LBVs. So far, however, while several wide LBV binaries were identified, no
system similar to η Car (relatively close & eccentric) has been found. The LBV
HR Car was observed as part of the OHANA sample (spectrally resolved 3-beam
interferometry of Br γ; see Rivinius et al., 2014). The OHANA data obtained for HR
Car showed a clear and temporally stable (over the several months of observations)
phase signature across the blue part of the emission line, but little to no visibility
signature. This marks a photocentre displacement of the emission line with respect
to the continuum, which is hard to explain with the more-or-less symmetric, but
variable wind of a single supergiant star. These data hinted at the possibility
for HR Car to be a binary, but more observations were needed to confirm this.
HR Car was observed with the four 1.8-metre Auxiliary Telescopes of ESO’s Very
Large Telescope Interferometer, using the PIONIER instrument in the H-band.
The visibilities and closure phases obtained at the two epochs (Rivinius et al. 2014)
clearly reveal asymmetries that cannot be due to a single, spherical object. In fact,
two sources are clearly detected with a flux ratio of 6, and about 2 mas apart (Boffin
et al. 2015, in prep.). This would correspond to an orbital period of the order of
10 years and would make HR Car a binary similar to η Car.
7.3 Determining accurate masses
Mass is the most crucial input in stellar internal structure modelling. It predomi-
nantly influences the luminosity of a star and, therefore, its lifetime. Unfortunately,
the mass of a star can generally only be determined when the star belongs to a
binary system. Therefore, modelling stars with extremely accurate masses (better
than 1 %), in different ranges of masses, would allow to firmly anchor the models
March 22, 2017 0:30 World Scientific Book - 9.75in x 6.5in Science˙cases˙visible page 82
82 Science cases for a visible interferometer
of the more loosely constrained single stars. At present, accurate masses are still
rare, however: in a recent paper, Torres et al. (2010) have listed the non-interacting
systems with masses more accurate than 3%. They found 95 eclipsing binaries and
23 astrometric binaries. Among these systems, the simultaneously astrometric and
spectroscopic binaries provide the less model-dependent masses, since the deriva-
tion of their masses only relies on the interpretation of their positions and radial
velocities by the Kepler’s laws. In addition, these systems are less likely to have
been affected by mass transfer, since their periods are much longer than those of
the eclipsing binaries. However, among the 23 astrometric systems, only 14 compo-
nents have masses more accurate than 1%. The majority of them are on the main
sequence, two are subgiant stars, one is a F9-type giant and only the components
of Capella are giant stars as late as G-type. Jean-Louis Halbwachs and colleagues
have started (Halbwachs, 2009; Halbwachs et al., 2014) a survey of of about 70
double-lined spectroscopic binaries (SB2), using the high-resolution spectrograph
Sophie (Haute-Provence Observatory) and Hermes (Roque de los Muchachos Ob-
servatory), and with the aim to determine the minimum masses of the components,
M1 sin3 i and M2 sin3 i, with an accuracy better than 1%. Accurate masses will be
obtained when the orbital inclinations, i, will be derived from astrometric measure-
ments. The binaries of the sample are expected to have large photocentric orbits
that will be observed with the Gaia satellite, and merging the radial velocities (RVs)
and the astrometric measurements from Gaia will provide accurate masses and also
magnitudes in the Gaia G photometric band. Combined with the Gaia exquisite
parallaxes, this will provide both masses and luminosities for each component. De-
spite the high quality that is expected for the Gaia measurements, it is known from
the reduction of the Hipparcos satellite (ESA, 1997 and (van Leeuwen, 2007)) that
the large space astrometric surveys may be prone to systematic errors. Moreover,
concerning double stars, a good orbit determination with Gaia depends on the mea-
surements at various epochs, which rely ultimately on the application of the PSF
calibration, considering the object as a single star. Binaries may then be sensitive
to small differences between the position given by the PSF and the position of the
actual photocentre. Therefore, an independent derivation of the masses of some
stars of the sample will be necessary in order to validate any future results. Inter-
ferometry, and PIONIER in particular, is quite suitable for that: it observes the
relative orbits instead of the photocentric ones, and this compensates the fact that
the accuracy of the instrument is a bit worse than that of Gaia.
For systems which are double-lined spectroscopic binaries, that is, for which
we already have the mass ratio, as well as the orbital period and eccentricity, using
interferometry to make it a visual binary, allows us to determine the remaining
parameters, i.e. the inclination, position angle of the node line, and, thereby, the
individual masses. This thus allows obtaining precise stellar masses. As an example
of what can be achieved, we show in Fig. 7.2 an example obtained with PIONIER
of a binary with a period of 98.8 days and containing a red giant (G2 III) and a
fainter companion – the luminosity ratio in the H-band is more than 5 magnitudes,
that is a factor 100 in flux. In this case, the giant is rather bright (H=2.4, V=3.9).
Because the companion is most likely a F star, in the visible, the luminosity contrast
would be smaller, hence, the companion would be easier to observe. Here, the giant
is also resolved and one can also estimate its diameter.

March 22, 2017 0:30 World Scientific Book - 9.75in x 6.5in Science˙cases˙visible page 83
Interacting binaries 83
Fig. 7.2 Relative positions of the two stars in one system studied with PIONIER. The primary is
a G2 III giant star whose diameter could be derived, and the position of the companion is shownfor various epochs, covering about a quarter of the full 98-d orbit. With more data points, it
should be possible to derive precisely the orbit of the two stars, leading to individual masses with
an error at the 1% level. From Halbwachs et al., in prep.
7.4 Probing the mass transfer mechanism
Symbiotic stars show a composite spectrum, composed of the absorption features
of a cool giant, in addition to strong hydrogen and helium emission lines, linked
to the presence of a hot star and a nebula. It is now well established that such a
“symbiosis” is linked to the fact that these stars are active binary systems, with
orbital periods between a hundred days and several years.
In such systems, the red giant is losing mass that is partly transferred to the
accreting companion – either a main sequence (MS) star or a white dwarf (WD).
One of the main questions related to symbiotic stars is how the mass transfer takes
place: by stellar wind? Through Roche-lobe overflow (RLOF)? Or through some
intermediate process? Answering this question requires being able to compare the
radii of the stars to their Roche lobe radius (which depends on the separation and the
mass ratio). However, determining the radius of the red giant in symbiotic systems is
not straightforward, and there has always been some controversy surrounding this.
Optical interferometry is currently the only available technique that can achieve
this. It allows determining the size and the distortion of the giant star, and in
some cases, the orbital parameters of the system, without any a priori on their
characteristics.
Recently, Boffin et al. (2014a) have observed with PIONIER several sym-

March 22, 2017 0:30 World Scientific Book - 9.75in x 6.5in Science˙cases˙visible page 84
84 Science cases for a visible interferometer
Fig. 7.3 Hertzsprung-Russell diagram of the symbiotic and related stars studied by Boffin et al.
(2014a), based on their estimate of the radius made with interferometry. This shows that such
stars are quite normal giants, and if, as thought, they have larger mass-loss rates than normalgiants, the origin of this must be in their binary nature.
biotic and related stars, measuring their diameters – in the range of 0.6 to 2.3
milli-arcseconds (mas) – and thereby assessing for the first time in an independent
way the filling factor of the Roche lobe of the mass-losing giants. For the three stars
with the shortest orbital periods (i.e. HD 352, FG Ser and HD 190658), they found
that the giants are filling (or are close to) their Roche lobe, consistent with the fact
that these objects present ellipsoidal variations in their light curve. In the case of
the symbiotic star FG Ser, there are some indications that the diameter is changing
by 13% over the course of 41 days, while observations of HD352 are, seemingly,
indicative of an elongation at the level of 10%. Such deformations need, however,
still to be confirmed with more precise interferometric observations and compared
with the outcome of light-curve modelling. The other three studied stars (V1261
Ori, ER Del, and AG Peg) have filling factors in the range 0.2 to 0.55, i.e., the star
is well within its Roche lobe, and for these the mass transfer must take place by
wind.
The detailed analysis of these stars also allows Boffin et al. to place the sys-
tems in an HR-diagram (Fig. 7.3), showing that red giants in symbiotic systems are
rather normal and obey similar relations between colour, spectral type, tempera-
ture, luminosity, and radius. We refer the reader to Boffin et al. (2014b) for further
discussion.

March 22, 2017 0:30 World Scientific Book - 9.75in x 6.5in Science˙cases˙visible page 85
Interacting binaries 85
7.5 A case in point: SS Lep
SS Leporis is composed of an evolved M giant and an A star in a 260-day orbit, and
presents the most striking effect of mass transfer, the “Algol” paradox. That is,
the M giant is less massive than the A star. The A star is unusually luminous and
surrounded by an expanding shell, certainly as the result of accretion. The observa-
tion of regular outbursts and of ultraviolet activity from the A star shell are further
hints that mass transfer is currently ongoing. Additionally, a large circumbinary
dusty disc surrounds the binary system, implying that the mass transfer process is
non-conservative. SS Lep was observed during the commissioning of the PIONIER
visitor instrument at the VLTI ?. Because it combines four telescopes (in our cases,
the four 1.8-m Auxiliary Telescopes), PIONIER provides six visibilities and four
closure phases simultaneously, which allows reliable image reconstructions. It was
possible to detect the two components of SS Lep as they moved across their orbit
and measure the diameter of the red giant in the system (∼2.2 milli-arcseconds).
By reconstructing the visual orbit and combining it with the previous spectroscopic
one, it was possible to well constrain the parameters of the two stars. The M giant
is found to have a mass of 1.3 M, while the less evolved A star has a mass twice as
large: a clear mass reversal must have taken place, with more than 0.7 M having
been transferred from one star to the other. Such results also indicate that the
M giant only fills around 85±3% of its Roche lobe, which means, that the mass
transfer in this system is most likely by a wind and not by Roche lobe overflow.
However, as the M giant is currently thought to be on the early-AGB phase, where
mass loss is still very small, it is difficult to understand how it could have lost so
much mass in a few million years (the time spent on the AGB), unless one invokes
the Companion-Reinforced Attrition Process (CRAP) of Tout and Eggleton (1988),
i.e. assume that the tidal force of the companion dramatically increases the wind
mass loss. Although this allows in principle to explain the current state of SS Lep
without resorting to a Roche-lobe overflow, this still needs to be proven by a more
detailed study. This would require more sensitivity and higher spatial resolution,
which can be achieved by going in the visible.
7.6 Going to the Visible
We are now briefly considering what can be done if we have an interferometer
working in the visible. In Tab. 7.1, we show the absolute magnitude in the V
and H bands for stars on the main-sequence and on the giant branch, as well as
distances we can reach assuming that with PIONIER we can currently study objects
with about H=8, while it is hoped that one can reach V=10 in the visible.
It is clear from this table that going to the visible, with such limiting mag-
nitudes, would allow us to reach more distant objects of early spectral types than
currently possible, a similar number of objects for early giants (K-type), while
slightly less of the reddest objects, that is M stars. However, one need to convolve
this with the fact, that in the visible, the magnitude contrast between a M star and
its companion would be higher, and it would thus be easier to detect the compan-
ion. It is also noteworthy that these numbers indicate that for O stars, one can

March 22, 2017 0:30 World Scientific Book - 9.75in x 6.5in Science˙cases˙visible page 86
86 Science cases for a visible interferometer
Table 7.1 Distances reached in V and H
Sp. Type MV MH DV (pc) DH (pc)
O V –5 -4 10,000 2,500
B V –3 –2.9 4,000 1,500
A V 1.5 1.3 500 215G V 5 3.5 100 80
M V 9 4.8 16 44
WD 12 11.8 4 1.7K III 0.5 –2.1 800 1000
M IIII –0.6 –4.8 1300 3700
thus reach the Bulge and thus have access to many objects.
If we could improve on current interferometers, and achieve a resolution of
0.1 mas, then a system at 10 kpc with such a separation, would imply a physical
separation of 1 AU. This is an interesting separation range to probe, as it is exactly
those of interest for, e.g., LBVs.
More generally, one can estimate for the different spectral classes, the range
of orbital periods and mass ratios we could detect, if we assume we can observe
objects up to V=10 with a resolution of 0.1 mas:

March 22, 2017 0:30 World Scientific Book - 9.75in x 6.5in Science˙cases˙visible page 87
Interacting binaries 87
O V stars
D=150 pc P ∼ 6 –1000 days q > 0.04
D=1 kpc P > 100 d q > 0.1
D=10 kpc P > 9 yrs q ∼ 1
A V stars
D=10 pc P < 100 d q > 0.1
D=100 pc P ∼ 1 d to 10 yrs q > 0.25
D=500 pc P ∼ 8 d to 100 yrs q ∼ 1
G V stars
D=10 pc P < 70d q >0.2
D=50 pc P <2 yrs q > 0.5
D=100 pc P < 6 yrs q ∼ 1
The above numbers indicate that one could probe, for example, at least 250
Algol systems, leading to a dramatic improvement in the understanding of such
systems. This would be similar for all kinds of stars. It is thus clear that the range
of parameters that can be probed would be amazingly wide, and would provide
much constraints for stellar evolution and binary processes!

March 22, 2017 0:30 World Scientific Book - 9.75in x 6.5in Science˙cases˙visible page 88
88 Science cases for a visible interferometer

March 22, 2017 0:30 World Scientific Book - 9.75in x 6.5in Science˙cases˙visible page 89
Chapter 8
Imaging, Technics and the FRIENDprototype
F. Millour1, Ph. Berio1, Labeyrie Antoine2, Mourard Denis1, Schneider Jean3,
Soulez Ferreol4, Tallon-Bosc Isabelle4, Tallon Michel4, Ten Brummelaar Theo5,
Thiebaut Eric4
1 Laboratoire Lagrange, UMR 7293, CNRS, Observatoire de la Cote d’Azur,
Universite de Nice Sophia-Antipolis, Nice, France2 Collge de France, 11, place Marcelin Berthelot, F-75231 Paris Cedex 05, France
3 Paris Observatory LUTh, 5 place Jules Janssen, 92190 Meudon, France4 Centre de Recherche Astronomique de Lyon, CNRS, Observatoire de Lyon,
France5 CHARA Array, Mount Wilson Observatory, 91023, Mount Wilson, CA, USA
8.1 The CHARA Array
The VEGA and PAVO beam combiners already give access to visible wavelengths
and CHARA will provide adaptive optics with 25% Strehl at 700 nm (80 % in
H band) with 1m telescopes (Berio et al. 2014). An important limitation for
imaging purposes is the limitation of short baselines on the CHARA array. Adding
one telescope would be an interesting idea to boost its imaging capabilities. The
forthcoming adaptative optics on the 1m telescopes will certainly help to increase
the limiting magnitude.
8.2 The VLTI Array
The VLTI has larger telescopes but no visible beam combiner up to now. Adaptive
optics will be available on the Auxiliary Telescopes (AT) thanks to the NAOMI
project (Aller-Charpentier et al. 2014). The required Strehl ratio is 30 % in the H
band. Using Marechal relationship, stating that the Strehl ratio is approximately
S = exp(Sf2) where Sf is the phase residual after adaptive optics correction and
holds for Sf larger than ∼ 20%, this Strehl ratio translates to 0.1% at 700nm.
This means that the height of the core of the image is approximatively the same
as the halo. At this level, the use of Marechal approximation is questionable and
this regime deserves numerical simulations to get reliable values. Adaptive optics
is already available on the Unit Telescopes (UT). It is advertised for a 50% Strehl
89

March 22, 2017 0:30 World Scientific Book - 9.75in x 6.5in Science˙cases˙visible page 90
90 Science cases for a visible interferometer
Fig. 8.1 Images of a B[e] star model made of a point source (the star) and a skewed ring (the
dusty disk). Left: the image and Right: the image convolved with a resolution matching the oneof the interferometer.
ration in the K band, i.e. again 0.1% at 700nm.
The VLTI is not yet ready for visible light combination, and a few technical
tweaks need to be implemented to enable UBV bands (RIJ do go through already):
• The MACAO dichroic would need to be changed and we are wondering if one
would be able to select between different dichroic/semi-reflecting plates?
• The guiding strategy should also be modified.
For the MACAO system, one possibility could be to use the infrared wavefront
sensors of GRAVITY. We need to assess how would that improve visible Strehl
ratio compared to a couple visible wave front sensor with dichroic or semi?reflecting
plates.
8.3 Polychromatic data
There is already some existing tools thanks to the JMMC to prepare interfero-
metric observations and make some model fitting such as ASPRO, LITPro and
searchCal. On the other side, a new visible instrument will provide differential visi-
bilities and differential phases, as do VEGA, AMBER and MIDI today but current
tools (LITpro, MIRA, BSMEM) used squared visibilities and closure phases only.
Some developments have occurred to take chromatic information into account, e.g.
SPIDAST (Cruzalebes et al. 2013) or fitomatic (Millour et al. 2009, 2011a, 2011b).
The POLCA project has successfully developed tools for handling polychromatic
data. In image reconstruction, new algorithms are now able to reconstruct full
3D polychromatic maps from all available interferometric data (Soulez & Thiebaut
2013; Schutz, A. et al. 2014). Project POLCA has also allowed improvements in
LITpro model fitting software, by including for instance VEGA differential visibili-
ties taking nutrimental chromatic artifacts into account (Tallon et al. 2014).
Spectral resolution is also important for helping regularizations in image re-

March 22, 2017 0:30 World Scientific Book - 9.75in x 6.5in Science˙cases˙visible page 91
Imaging, Technics and the FRIEND prototype 91
Fig. 8.2 Image reconstruction attempts by simulating a 3-nights observation of the above model
with one measurement every hour. The noise level of the observables is raised progressively fromtop-left to bottom-right. The interferometric beam is displayed on the bottom-left corner of each
image.
construction, for instance when there is a large continuum with various spectral
lines. PIONIER instrument was missing the spectral information which would have
been better for data interpretation. VEGA has spectroscopic capabilities but is
limited due to saturation effects on the detector. Varying spectral resolution as
a function of baseline length is a powerfull method in some hyperspectral remote
sensing studies since high frequency information position is not going to change
much depending on high frequency baseline. The spectrum of the object is also
quite important for image reconstruction.
8.4 Optimal number of telescopes to use and baselines length
A possibility would be many telescopes with few delay lines that can be switched
quickly wheres another option would be a continuously following of one baseline
along time with a high frequency of recording. A minimum is certainly 4 telescopes
and different configurations to make imaging. Experience at CHARA with MIRC
shows that 6 telescopes is a strict minimum for snapshot imaging. In the same
direction we recall that the Plateau de Bure interferometer of IRAM was only able
to make direct images when the telescope network was extended to 6 antennas
within 10 years and that actually the NOEMA project is extended the array to 12
antennas. Regarding the baselines length, short baseline are really mandatory for

March 22, 2017 0:30 World Scientific Book - 9.75in x 6.5in Science˙cases˙visible page 92
92 Science cases for a visible interferometer
−0.50.00.5
−0.5
0.0
0.5
R. A. (mas)
De
c.
(ma
s)
0%
20%
40%
60%
80%
100%
S1
S2
E1
E2
W1
W2 LAB
S1
S2
E1
E2
W1
W2 LAB
S1
S2
E1
E2
W1
W2 LAB
S1
S2
E1
E2
W1
W2 LAB
−100 0 100
0
100
200
300
Position (m) −−−−−−> E
Po
sitio
n (
m)
−−
−−
−−
> N
−4000 −2000 0 2000 4000−4000
−2000
0
2000
4000
E <−−−−−− Sp. freq. (cycles/as)
Sp. fr
eq. (c
ycle
s/a
s)
−−
−−
−−
> N
Fig. 8.3 (Top Left) Model of Betelgeuse in the visible (from A. Chiavassa) scaled to a diameter of
3 mas. (Top right) Image reconstruction of synthetic data made by simulating a visible instrument
using the previous model with the CHARA array and four sets of 3 telescopes. (Bottom Left) Thestations used for the simulation of a 3 telescope visible instrument at the CHARA array. (Bottom
Right) (u,v) plane of the simulated observations.
imaging purposes in order to fix features in the field of view. Longest baselines
are not always usable due to SNR issues, and short baselines are needed to get the
low frequencies. This pushes the need of additional telescopes. Often, the problem
is that there is a gap between speckle data and interferometric data, and this is
sometimes where most the information resides.
8.5 Recombination scheme
PAVO uses holes for spatial filtering whereas VEGA uses speckle data. None of them
is able to get closure phases and for VEGA the issue is coming from the detector.
Nevertheless, we have learned for instance from MIRC that closure phases are very
important for image reconstruction (ref ?).
8.6 The FRIEND prototype
In the next 2 or 3 years, the two major interferometric arrays, VLTI and CHARA,
will equip their telescopes of 1.8m and 1m respectively with Adaptive Optics (AO

March 22, 2017 0:30 World Scientific Book - 9.75in x 6.5in Science˙cases˙visible page 93
Imaging, Technics and the FRIEND prototype 93
Fig. 8.4 Image reconstruction attempts by simulating a 3-nights observation of the above model
with a given data noise level. The (u,v) plane filling is lowered progressively from top-left tobottom-right. The interferometric beam is displayed on the bottom-left corner of each image.
hereafter) systems. This improvement will permit to apply with a reasonable effi-
ciency in the visible domain, the principle of spatial filtering with single mode fibers
demonstrated in the near-infrared. It will clearly open new astrophysical fields by
taking benefit of an improved sensitivity and state-of-the-art precision and accu-
racy on interferometric observables. To prepare this future possibility, we started
the development of a demonstrator called FRIEND (Fibered and spectrally Re-
solved Interferometric Experiment - New Design). FRIEND (Berio et al., 2014b)
combines the beams coming from 3 telescopes after injection in single mode opti-
cal fibers and provides some spectral capabilities for characterization purposes as
well as photometric channels. It operates in the R spectral band (from 600nm to
750nm) and uses the world’s fastest and more sensitive analogic detector OCAM2.
From a technical point-of-view, the main goal of FRIEND is to validate
spectrally-resolved interferometric observations in the visible in the case of partial
correction by AO. In terms of astrophysics, a first and non-exhaustive analysis has
confirmed the need to reach a 10th limiting magnitude at least in the case of low
spectral resolution observations and to keep high spectral resolution capabilities.
So, we decided to use the well-known multi-axial ’all-in-one’ beam recombination
scheme. The FRIEND performance strongly depends on the quality of the AO cor-
rection. We used a simulator developped for the AO of CHARA to estimate the
coupling into a single mode fiber at λ = 700nm. We considered one seeing condition

March 22, 2017 0:30 World Scientific Book - 9.75in x 6.5in Science˙cases˙visible page 94
94 Science cases for a visible interferometer
(effective r0 = 12cm and t0 = 10ms at λ = 0.5µm ) corresponding to the 80th per-
centile of the summer seeing at Mount Wilson. We considered also two conditions
of AO corrections: Tip-Tilt only and Full AO. We found a mean coupling of 3%
and 25% for the Tip-Tilt only and Full AO conditions, respectively. The FRIEND
performance has been derived at R = 2600.
Fig. 8.5 Expected SNR of the squared visibility with FRIEND in the medium spectral resolution
mode for an unresolved star. Used parameters: λ = 700nm, ∆λ = 30nm, R = 2600, DIT = 10ms,QE = 90%, M = 30000 (i.e. 5 minutes of observation), Vinst = 0.9 and V∗ = 1.
Figure 8.5 shows the expected SNR of squared visibility with respect to the
star magnitude for two conditions of AO correction in the case of an unresolved star.
From a theoretical point-of-view (i.e. considering photon and detector noise only),
it clearly appears that a 10th limiting magnitude1 could be reached by averaging the
visibility estimates over a spectral band of 30nm in the case of Full AO correction.
This value is well within our specifications. In the case of Tip-Tilt only correction,
the limiting magnitude could not exceed the 8th magnitude.
Tests on sky at the focus of the CHARA interferometer have been successfully
done in December 2014. The real tests of FRIEND in AO correction conditions
could not be done before the Phase II AO system where a fast deformable mirror
is implemented to close the loop for Full AO correction. Meanwhile, FRIEND will
remain installed in the focal laboratory of CHARA. Depending on the first tests
and more especially on the data quality in the case of Tip-Tilt only correction, we
plan to carry out dedicated astrophysical programs with FRIEND in 2015.
1we define the limiting magnitude as the magnitude corresponding to SNRV 2 = 10

March 22, 2017 0:30 World Scientific Book - 9.75in x 6.5in Science˙cases˙visible page 95
Chapter 9
AGNs
R.Petrov1, S. Rakshit1 E. Martin2, M. Kishimoto3, A. Marconi4, A. Meilland1,
F. Millour1, G. Weigelt5
1 Laboratoire Lagrange, UMR 7293, CNRS, Observatoire de la Cote d’Azur,
Universite de Nice Sophia-Antipolis, Nice, France2 INTA-CSIC Centro de Astrobiologıa, 28850 Torrejon de Ardoz, Madrid, Spain
3 Department of Physics, Faculty of Science, Kyoto Sangyo University,
Kamigamo-motoyama, Kita-ku, Kyoto 603-8555, Japan4 Dipartimento di Fisica e Astronomia, Universita di Firenze, via Sansone 1,
50019 Sesto Fiorentino, Firenze, Italy5 Max-Planck-Institut fur Radioastronomie Auf dem Hugel 69, 53121 Bonn,
Germany
Foreword: This text reflects discussions in late 2014 and early 2015 about the
interest of a new interferometric instrument or a new interferometer operating in
the visible for the study of Active Galactic Nuclei. However it has not been iterated
among all participants and is substantially biased toward the personal views of the
redactors
9.1 Active Galactic Nuclei
Active Galactic Nuclei (AGN) are extremely bright sources powered by the accretion
of material on a central super massive black hole (SMBH). They emit more than
1/5 of the electromagnetic power in the universe and a majority of galaxies might
host a central BH triggering some level of nuclei activity. AGNs can be considered
as important contributors and markers for the global history of mass accretion and
galaxy evolution in the Universe. If well understood, they could be used as standard
candles for the evaluation of cosmological distances at redshifts z > 3. Quasars make
the current reference grid for the calibration of GAIA astrometry but, at the tens of
µas accuracy of GAIA, the structure of these sources could have a significant impact
on the definition of their GAIA photocenter. We have an unified model of AGNs
(Antonucci (1993), Urry and Padovani (1995)) that is increasingly considered as
over simplistic but still offers a simple and useful structure to discuss typical sizes
and magnitudes and therefore to contribute to a first evaluation of the potential of
visible long baseline interferometry. This model features a very compact accretion
95

March 22, 2017 0:30 World Scientific Book - 9.75in x 6.5in Science˙cases˙visible page 96
96 Science cases for a visible interferometer
disk (AD) around the central SMBH, a Broad Line Region (BLR) composed of
high velocity gas clouds producing broad emission lines when this central region is
not obscured by the clumpy dust torus located after the dust sublimation radius.
This dust torus (DT) collimates the light from the central source that can ionize
some narrow line region (NLR) lower velocity gas clouds placed in the non-obscured
double cone and producing narrow emission lines. When an AGN is close to equator-
on, the dust torus shields the BLR, that can be detected only in polarized light
reprocessed by the more far away NLR clouds. Some AGNs emit high velocity jets
near their rotation axis. A strong radio emission can be present in a cone around
the rotation axis and produce radio-loud AGNs if the line of sight is close enough to
their axis. In the following we discuss the possibility and the interest of observing
some of these features with a long baseline interferometer operated in the visible.
9.2 Accretion Disks
Imaging accretion disks would be decisive to understand and model the accretion
and jet launching mechanisms. However, the largest accretion disks are smaller
than 1 microarcsecond and even simple evaluations of equivalent size, inclination
and thickness would require baselines larger than 50 km for a visible interferom-
eter. Actual imaging would need typically 250 km baselines for a resolution of
0.2 microarcseconds. This seems quite unrealistic for ground-based interferometers.
However, the observation of the BLR and of the innermost parts of the dust torus
can strongly constrain the spatial distribution of light emitted by the central accre-
tion disk. The BLR, and maybe the inner NLR, can give accurate estimates of the
mass of the BH. This should allow accurate modeling of the accretion disk.
9.3 Broad Line Region
The BLR is currently the best tracer of the characteristics of the central source and
of the transport of material toward and away from the accretion disk. The spatial
and the brightness distribution of BLR clouds are supposed to be dominated by the
luminosity distribution of the central source and by its interaction with the inner
parts of the dust torus. The kinematic of the BLR is supposed to be dominated
by the mass of the central SMBH. Time resolved spectro-photometric techniques,
called reverberation mapping (RM), provide estimates of the BLR and inner dust
rim sizes, and constraints on the BLR morphology. RM is based on the study of
the time needed for a feature in a broad emission line, or in the dust torus, to echo
a variation of light near the central source. The time-velocity echo diagrams are
claimed (Peterson, 1993) to be unique signatures of the BLR morphology, but they
are often difficult to obtain with a sufficient quality for an image reconstruction or
a full model fitting, mainly because a perfect RM observation should be continuous,
well sampled and ”unlimited” in time, which is seldom possible from ground based
observations. Quite often, RM is limited to a typical lag τRM between the continuum
light curve and the global time variation of an emission line. The combination of this
RM linear size τRM with the line broadening ∆V attributed to the global velocity
field yields a virial mass estimate:

March 22, 2017 0:30 World Scientific Book - 9.75in x 6.5in Science˙cases˙visible page 97
AGNs 97
MBH = fM (cτRM∆V 2)/G (9.1)
This is used to produce mass-luminosity curves for quasars with dispersion
of the order of 0.44 dex, i.e. 275% Kaspi et al. (2007).
The typical BLR size cτRM can is related to the luminosity L of the AGN by:
RBLR = cτRM = fLL1/2 (9.2)
This yields size-luminosity laws, with a dispersion that can be reduced down
to 0.19 dex, or even 0.13 dex, for low luminosity quasars (Bentz, 2013). Reducing
the dispersion to 0.05 dex (12%) for a larger range of luminosity would transform
QSOs in decisive cosmological standard candles (Bentz, 2013), much more numerous
than type I supernova and observable at least up to z = 3.
The combination of the linear equivalent size1 cτRM with the equivalent an-
gular size Λ (defined as Λ = λB
√1− V from the visibility V measured in the line
for a partially unresolved source), yield a distance estimate:
DBLR = fDα(cτRM)
Λ(9.3)
where α is a unit conversion constant. This is the base of the quasar parallax
direct distance measurement method proposed by (Elvis and Karovska, 2002). This
could be used to check and calibrate the RM Quasars distance measurements. Inter-
ferometric observations of Λ are limited to a handful of targets with the 2nd gener-
ation of VLTI instruments GRAVITY and MATISSE. However, spectro-astrometry
with an ELT would allow measuring equivalent angular size for QSOs in the z = 2 to
z = 3 range, at least for the most likely geometry dominated by Keplerian rotation
in a moderately open disk (Petrov 2013, 2015).
The fudge factors fM , fD and fL strongly depend from the geometry of the
source. (Rakshit et al., 2015) has shown that fM and fD can change by more than
a factor 4 just with the inclination, opening angle and local-to-global velocity ratios
without changing the RM measures τRM and ∆V . Obtaining spectrally resolved
images of BLRs through emission lines would allow computing very accurately these
fudge factors. Unfortunately, a real image of the largest BLRs, such as the 3C273
one, requires a resolution of at least 0.1 mas, i.e. a baseline of 5 km in the visible.
Imaging an handful of very high luminosity BLRs would be decisive but with a
limited impact on the general understanding of Quasar mechanism and on the
calibration of the size-luminosity and mass luminosity laws that would make Quasars
global cosmological tools. However, in (Rakshit et al., 2015) we showed that measure
of the visibility, differential visibility and differential phases, that are accessible on
many quite unresolved sources constrain very strongly these fudge factors, typically
from few hundreds % with RM alone to better than 20% from RM and optical
interferometry together, if the optical interferometry data has a decent SNR, of at
least 5. Figure 9.1 shows different models produce same τRM or same RM BLR size
but interferometric differential visibility and phase signals show different signatures1The concept of equivalent size depends on the geometry of the sources and some distributions
have no characteristic size. Here the ”equivalent sizes” refer to measures: the centroid of the
cross-correlation between continuum and line light curves for τRM and the measured visibility for
Λ.

March 22, 2017 0:30 World Scientific Book - 9.75in x 6.5in Science˙cases˙visible page 98
98 Science cases for a visible interferometer
0 2 4 6 8 10delay (100 days)
0.0
0.2
0.4
0.6
0.8
1.0
Ψ(τ
)τcent(day) =199
Rin =0.3, σblr =0.152
Rin =0.15, σblr =0.34
Rin =0.08, σblr =0.43
3 2 1 0 1 2 3
vel. (103 km/s)
0.90
0.94
0.98
1.02
diff.
Vis
PA=0°
3 2 1 0 1 2 3
vel. (103 km/s)
0.90
0.94
0.98
1.02
diff.
Vis
PA=90°
Fig. 9.1 RM 1D response function (upper panel) and visibility in the ‖ (lower-left panel)and the ⊥ (lower-right panel) baselines for different BLR geometries that produce sameτcent but different visibilities.
allowing to constrain BLR model having a few points in the emission line. Note
that it is important to obtain all measures to fully constrain the model and strongly
reduce the fudge factor uncertainty:
• The absolute visibility in the continuum yields the size of the inner rim of
the dust torus and is used as a reference for differential observations in the
line. The accuracy on absolute visibility is mostly limited by the accuracy
of instrumental visibility calibration, which requires an active stabilization of
the interferometric fringes. In that respect the availability of a fringe tracker
operating up to magnitude 14 is mandatory to achieve the full VLTI potential
with GRAVITY, MATISSE as well as with specialized AGN instruments such
as OASIS2.
• The differential visibility in the line yields the BLR size and intensity distri-
bution, if the absolute visibility is well known, from absolute visibility or RM
measurements. In the K band, the accuracy on the differential visibility is
mostly limited by detector noise, and needs instruments designed to minimize
the number of pixel read. The differential visibility is accessible on quite un-
resolved sources, but in K band, the typical limit to be able to measure a
differential visibility is K ' 11.5 and only 10 to 20 targets are accessible with
the VLTI even with the best instrument+FT combination.
• The differential phase constrains the BLR size, geometry and kinematics, but
is quite model dependent if measured alone, or combined only with RM data.
It gives access to the highest super resolution factor and hence to the larger
number of targets, up to 60 targets with the VLTI at its best.
2OASIS: Optimized AGN Spectro-Interferometric Sensor is a simple visitor instrument (or visitormodule installed on AMBER) that optimizes the resolution, sampling and data processing for BLR
observations. It would allow a gain in accuracy of about a factor 10 over GRAVITY, which is
optimized for different science goals.

March 22, 2017 0:30 World Scientific Book - 9.75in x 6.5in Science˙cases˙visible page 99
AGNs 99
• A natural extension of the interferometric differential phase is the spectro-
astrometry photocenter measurements, which measures photocenter variations
with wavelength just as the differential phase. With an ELT, we should be
able to measure BLR photocenter displacements up to z=3 for high luminos-
ity QSOs similar to 3C273 or z=2 for lower luminosity targets such as 3C120
(Petrov, 2013, 2015). This needs to control the instrument systematics down
to 1/1000 pixels, which has been shown possible by the laboratory experiment
DIAMS (Abe, 2012).
The current strategy to observe AGNs in the near and mid infrared with
the VLTI, which is currently the single optical interferometer allowing a significant
program in that domain can be very roughly sketched as follows:
• MATISSE/VLTI will provide images for 2 to 4 of AGNs, providing a better
understanding of the dust torus structure. In addition, it will provide equivalent
sizes and global structural parameters for maybe two dozens of targets. This
assumes an external FT operating at least at K=13. MATISSE will also provide
constraints on the torus geometry and size for all targets for which we try to
obtain BLR information.
• MATISSE and GRAVITY will provide torus equivalent sizes and global struc-
tural parameters for maybe two dozens targets. The angular torus size can be
combined with IR reverberation mapping to obtain ”dust parallax” distance
measurements Honig et al. (2014). This is easy in the K band, because the K
band structure seems simpler, but for a number or targets strongly limited by
the VLTI resolution in the K band. The L, M and N bands would give access to
more targets but would require more modeling. These distance measurements
will complement, check and calibrate the BLR parallax measurements discussed
next.
• GRAVITY, and to a lesser extent MATISSE will make differential observations
of BLRs up to K∼10.5 (GRAVITY FT), which represents about 10 targets.
With an external FT, this number goes up to 20 targets with GRAVITY and
60 targets with an optimized module for BLR observations in the K band such
as OASIS.
• The AMBER+ observations of 3C273 ((Petrov et al., 2012), (Rakshit et al.,
2015)) showed that the BLR extends beyond the inner rim of the dust torus.
Thus GRAVITY should be able to image the gas in or above the dust torus for
a few objects.
• All VLTI observations of AGNs should be complemented by RM measures.
• This might be enough to try finding the relationship between the RM fudge
factors and spectro-photometry measures such as the luminosity and the line
profile. However, with GRAVITY alone, we cover a small range of luminosities.
The situation improves with an external FT and improves even further with the
specialized module OASIS. The accuracy of distance and mass measurements
will be good only for a dozen targets, allowing poor calibration of the size-
luminosity and mass-luminosity laws.
Observations in the visible would bring a decisive improvement, if the inter-
ferometer can be made sensitive enough in that spectral band. First we will gain

March 22, 2017 0:30 World Scientific Book - 9.75in x 6.5in Science˙cases˙visible page 100
100 Science cases for a visible interferometer
in resolution by a factor 4. Second we will be allowed to use Balmer lines (for low z
sources) that are 3 to 20 times stronger than the Paschen and Bracket lines avail-
able in the near IR. The combination of these two effects would yield a significant
gain in the accuracy of quasar parallax distance measurements, as well as in the
other parameters measures such as the masses. It will also strongly enhance the
possibility to image gas in direct relation with the dust torus.
7 8 9 10 11 12 13 14 15Vmag
10-2
10-1
100
101
102
Am
plit
ude
of t
he d
iffer
enti
al p
hase
var
iati
on (
deg)
7 8 9 10 11 12 13 14 15Vmag
10-3
10-2
10-1
Am
plit
ude
of t
he v
isib
ility
var
iati
on
Fig. 9.2 Feasibility of BLR observation with a visible mode of VLTI (considering Hα line).The solid curves represent differential phase (left) and differential visibility (right) for avisible mode with UTs (green) and ATs (blue). Each symbol represents one Sy1 AGNobservable at Paranal. UTs at VLTI with Strehl ratio 0.1 could reach up to V = 15allowing to observe more than 130 targets, while ATs could reach up to V = 14 if we haveStrehl ratio 0.5 in the visible. Credit: Rakshit et al. (2015).
Another major advantage of visible observations is to allow a direct combi-
nation with RM observations that have so far been made almost exclusively in the
visible, without the need to use models to correct the relative scales in the visible
and in the IR, nor having to launch very long term IR RM campaigns. The condi-
tion for visible observation of BLRs with the VLTI to give a significant contribution
is to be able to observe with a sufficient limiting magnitude in V. Figure 9.2 shows
a very preliminary results of a feasibility study of BLR observation in visible using
VLTI from Rakshit et al. (2015), extrapolated from his work for the K band. It
shows that:
• At V=14, we would obtain visibility, differential visibility and differential phase
for all the GRAVITY targets (without FT), but with an improved distance
accuracy by typically a factor 10. Such a magnitude could be achieved with the
ATs if they have adaptive optics system providing a Strehl ratio of 0.5 in the
(red) visible. In a few cases we will obtain images of the gas in or above the
dust torus.
• At V=15, we will be able to observe more than 120 quasars. For all K band VLTI
targets we should have substantial distance and mass accuracy improvements.
The exact gains need to be assessed but the very first estimate is that we would
have more than 50 targets with Quasars parallax more accurate than 10%.
Such a magnitude can be achieved on the UTs if they are equipped with an AO
system providing a Strehl ratio of 10% in the red visible.

March 22, 2017 0:30 World Scientific Book - 9.75in x 6.5in Science˙cases˙visible page 101
AGNs 101
9.4 Narrow Line Region
In radio-quiet AGN, the NLR is the most extended structure associated with the
black hole’s mass accretion and ejection mechanisms. It ranges from kiloparsec
scales well below down the resolution limit of even the largest optical telescopes.
The emission in the NLR is dominated by high-ionization optical lines. The
most prominent line with the largest equivalent width is the [OIII] line at 5007 A.
It is widely used as a tracer for the radiative power output of the AGN. Interest-
ingly, the NLR gas as traced by the emission lines is predominantly outflowing with
velocities of several 100 km/s, thus providing direct energy feedback from the AGN
to the galaxy. The emission lines are rather well understood in terms of photo-
ionization of gas clouds by the central AGN. Indeed, it has been suggested that the
sizes of the NLR structure in different galaxies scales with the square root of the
AGN luminosity in a similar way as the BLR and torus sizes. This indicates rather
simple, radiation-driven physics that lead to the observed emission.
While the NLR is clearly extended, the dominant part of the flux is originat-
ing from an unresolved region even in nearby objects such as NGC1068 or Circinus.
Therefore, we currently do not know the physical condition that lead to the launch
of the outflow associated with the NLR. Possibilities range from association to hy-
drodynamic winds in the accretion disk to evaporating clouds in the BLR or torus
region. Pinning down the origin provides access to constrain density, ionization pa-
rameter, and temperature in the launching region. It will also allow us to determine
the origin of the outflowing gas and its connection to the other structures in the
AGN unification scheme.
The resolution requirements on an optical interferometer to study the NLR
are modest. In terms of spatial resolution it has similar requirements as for studying
the BLR. The degree of resolved emission, and its corresponding density and mass,
will make it possible to locate the launching region. The width of typical narrow
emission lines from the nuclear source dictate the required spectral resolution. Tak-
ing the [OIII] line as reference and assuming typical line widths of 300-500 km/s, a
spatial resolution in the V-band range of 3000 − 5000 will offer enough resolution
to map the kinematic structure on sub-parsec scales. So, as for the BLR, the key
condition is to achieve a sensitivity in the V=13 to V=15 range. For V between 12
and 15, the main target being the 13− 14 range.
9.5 Dust Torus
The innermost parts of the dust torus are targets for MATISSE in the L, M and N
bands and to a lesser extent for GRAVITY in the K band continuum. The contribu-
tion of the torus to the visible continuum is expected to be faint, but has not been
actually evaluated. In particular the BLR and torus gas could have a contribution
to the visible continuum. This point still has to be investigated. The potential
benefit is the gain in resolution as well as constrains on the physical parameters
of the gas. On the other hand we have already underlined the complementarity
between gas observations, that are particularly interesting in the visible and torus
observations, as these features interact and are both shaped by the central source

March 22, 2017 0:30 World Scientific Book - 9.75in x 6.5in Science˙cases˙visible page 102
102 Science cases for a visible interferometer
intensity distribution. Thus it is highly desirable that all targets observed by MA-
TISSE and GRAVITY be also observed in the visible. We have already discussed
the ”dust parallax” distance measurements that would be a decisive corner stone to
Quasar distance measurements Honig et al. (2014). A significant torus contribution
in the visible continuum could extend the domain of that technique.
9.6 Specifications of Visible Interferometry for AGN Science
Facility Application Condition
VLTI
(B=135-200
m)
V = 13 A few NLR observations. Imaging the gas near the
torus for a few sources.
Strehl>0.2 in V on the
ATs
V = 14 BLR and NLR: Observing the GRAVITY-MATISSE
(without external FT) targets. Fudge factors con-
straints and improved accuracy on mass and distance
measurements on 10-20 targets
Strehl>0.5 in V on the
ATs
V = 15 Fudge factors, mass and distance measurements on
>120 targets in a large luminosity range. Grand uni-
fication based on fudge factor constrained by spectro-
photometric measures. Critical to calibrate RM and
RM+spectro-astrometry mass and distance measure-
ments.
Strehl>0.1 in V on the
UTs
New genera-
tion interfer-
ometer, PFI
(B>10km)
V = 13 Imaging BLRs Strehl>0.2 2m class tele-
scope or Strehl>0.8 1m
class telescope
V = 14 Imaging BLRs Strehl>0.5 2m class tele-
scope
V = 15 Very accurate and distance measurements up to z 2
with much less model dependence than from RM
alone or RM+spectro-astrometry
Strehl>0.1 8m class tele-
scope Strehl>0.4 4m class
telescope
E-
ELT spectro-
astrometry
RM+spectro astrometry yield direct distance mea-
surements up to z=3 (3C273 L) and z=2 (3C120
L), IF spectro-interferometric measures allowed con-
straining the fudge factors as a function of luminosity
and line width.
Spectro-astrometry sys-
tematics controlled down
to 1/1000 pixel

March 22, 2017 0:30 World Scientific Book - 9.75in x 6.5in Science˙cases˙visible page 103
Bibliography
Antonucci, R. (1993). Unified models for active galactic nuclei and quasars, ARA&A 31,pp. 473–521, doi:10.1146/annurev.aa.31.090193.002353.
Auriere, M., Donati, J., Konstantinova-Antova, R., Perrin, G., Petit, P., and Roudier,T. (2010). The magnetic field of Betelgeuse: a local dynamo from giant convectioncells? A&A 516, p. L2, doi:10.1051/0004-6361/201014925, eprint 1005.4845.
Babcock, H. W. (1960). The 34-KILOGAUSS Magnetic Field of HD 215441. ApJ 132, p.521, doi:10.1086/146960.
Baines, E. K., Armstrong, J. T., Schmitt, H. R., Benson, J. A., Zavala, R. T., and van Belle,G. T. (2014). Navy Precision Optical Interferometer Measurements of 10 StellarOscillators, ApJ 781, 90, doi:10.1088/0004-637X/781/2/90.
Balick, B. and Frank, A. (2002). Shapes and Shaping of Planetary Nebulae, ARA&A 40,pp. 439–486, doi:10.1146/annurev.astro.40.060401.093849.
Balona, L. A. and Stobie, R. S. (1979a). Application of the Wesselink method to a non-radially oscillating star, MNRAS 187, pp. 217–222.
Balona, L. A. and Stobie, R. S. (1979b). The effect of radial and non-radial stellar oscilla-tions on the light, colour and velocity variations, MNRAS 189, pp. 649–658.
Balona, L. A. and Stobie, R. S. (1979c). Wesselink radii of double-mode cepheids, MNRAS189, pp. 659–666.
Benisty, M., Perraut, K., Mourard, D., Stee, P., Lima, G. H. R. A., Le Bouquin, J. B.,Borges Fernandes, M., Chesneau, O., Nardetto, N., Tallon-Bosc, I., McAlister, H.,Ten Brummelaar, T., Ridgway, S., Sturmann, J., Sturmann, L., Turner, N., Far-rington, C., and Goldfinger, P. J. (2013). Enhanced H activity at periastron inthe young and massive spectroscopic binary HD 200775, A&A 555, A113, doi:10.1051/0004-6361/201219893, eprint 1306.0390.
Berdyugina, S. V. (2005). Starspots: A Key to the Stellar Dynamo, Living Reviews inSolar Physics 2, p. 8, doi:10.12942/lrsp-2005-8.
Berio, P., Bresson, Y., Clausse, J. M., Mourard, D., Dejonghe, J., Duthu, A., Lagarde,S., Meilland, A., Perraut, K., Tallon-Bosc, I., Nardetto, N., Spang, A., Bailet, C.,Marcotto, A., Chesneau, O., Stee, P., Feautrier, P., Balard, P., and Gach, J. L.(2014a). Long baseline interferometry in the visible: the FRIEND project, in Societyof Photo-Optical Instrumentation Engineers (SPIE) Conference Series, Society ofPhoto-Optical Instrumentation Engineers (SPIE) Conference Series, Vol. 9146, p. 16,doi:10.1117/12.2054890.
Berio, P., Bresson, Y., Clausse, J. M., Mourard, D., Dejonghe, J., Duthu, A., Lagarde,S., Meilland, A., Perraut, K., Tallon-Bosc, I., Nardetto, N., Spang, A., Bailet, C.,Marcotto, A., Chesneau, O., Stee, P., Feautrier, P., Balard, P., and Gach, J. L.(2014b). Long baseline interferometry in the visible: the FRIEND project, in Societyof Photo-Optical Instrumentation Engineers (SPIE) Conference Series, Society ofPhoto-Optical Instrumentation Engineers (SPIE) Conference Series, Vol. 9146, p. 16,doi:10.1117/12.2054890.
Berio, P., Merle, T., Thevenin, F., Bonneau, D., Mourard, D., Chesneau, O., Delaa, O.,
103

March 22, 2017 0:30 World Scientific Book - 9.75in x 6.5in Science˙cases˙visible page 104
104 Science cases for a visible interferometer
Ligi, R., Nardetto, N., Perraut, K., Pichon, B., Stee, P., Tallon-Bosc, I., Clausse,J. M., Spang, A., McAlister, H., ten Brummelaar, T., Sturmann, J., Sturmann,L., Turner, N., Farrington, C., and Goldfinger, P. J. (2011). Chromosphere of Kgiant stars. Geometrical extent and spatial structure detection, A&A 535, A59,doi:10.1051/0004-6361/201117479, eprint 1109.5476.
Boffin, H. M. J., Hillen, M., Berger, J. P., Jorissen, A., Blind, N., Le Bouquin, J. B.,Miko lajewska, J., and Lazareff, B. (2014a). Roche-lobe filling factor of mass-transferring red giants: the PIONIER view, A&A 564, A1, doi:10.1051/0004-6361/201323194, eprint 1402.1798.
Boffin, H. M. J., Pourbaix, D., Muzic, K., Ivanov, V. D., Kurtev, R., Beletsky, Y.,Mehner, A., Berger, J. P., Girard, J. H., and Mawet, D. (2014b). Possible astro-metric discovery of a substellar companion to the closest binary brown dwarf sys-tem WISE J104915.57-531906.1, A&A 561, L4, doi:10.1051/0004-6361/201322975,eprint 1312.1303.
Boffin, H. M. J., Steeghs, D., and Cuypers, J. (eds.) (2001). Astrotomography, LectureNotes in Physics, Berlin Springer Verlag, Vol. 573.
Boffin, H. M. J., Theuns, T., and Jorissen, A. (1994). Wind Accretion in Binary Systems:3D SPH Simulations, Mem. Societa Astronomica Italiana 65, p. 1199.
Bono, G., Caputo, F., and Castellani, V. (2006). Stellar pulsation and evolution: astepping-stone to match reality. Mem. Societa Astronomica Italiana 77, p. 207.
Borges Fernandes, M., Meilland, A., Bendjoya, P., Domiciano de Souza, A., Niccolini, G.,Chesneau, O., Millour, F., Spang, A., Stee, P., and Kraus, M. (2011). The Galac-tic unclassified B[e] star HD 50138. II. Interferometric constraints on the close cir-cumstellar environment, A&A 528, A20, doi:10.1051/0004-6361/201015602, eprint1101.4964.
Boyajian, T. S., von Braun, K., van Belle, G., Farrington, C., Schaefer, G., Jones, J.,White, R., McAlister, H. A., ten Brummelaar, T. A., Ridgway, S., Gies, D., Stur-mann, L., Sturmann, J., Turner, N. H., Goldfinger, P. J., and Vargas, N. (2013).Stellar Diameters and Temperatures. III. Main-sequence A, F, G, and K Stars: Ad-ditional High-precision Measurements and Empirical Relations, ApJ 771, 40, doi:10.1088/0004-637X/771/1/40, eprint 1306.2974.
Bruntt, H., Kervella, P., Merand, A., Brandao, I. M., Bedding, T. R., ten Brummelaar,T. A., Coude du Foresto, V., Cunha, M. S., Farrington, C., Goldfinger, P. J., Kiss,L. L., McAlister, H. A., Ridgway, S. T., Sturmann, J., Sturmann, L., Turner, N.,and Tuthill, P. G. (2010). The radius and effective temperature of the binary Apstar β CrB from CHARA/FLUOR and VLT/NACO observations, A&A 512, A55,doi:10.1051/0004-6361/200913405, eprint 0912.3215.
Bruntt, H., North, J. R., Cunha, M., Brandao, I. M., Elkin, V. G., Kurtz, D. W., Davis, J.,Bedding, T. R., Jacob, A. P., Owens, S. M., Robertson, J. G., Tango, W. J., Gameiro,J. F., Ireland, M. J., and Tuthill, P. G. (2008). The fundamental parameters of theroAp star α Circini, MNRAS 386, pp. 2039–2046, doi:10.1111/j.1365-2966.2008.13167.x, eprint 0803.1518.
Bujarrabal, V., Alcolea, J., Van Winckel, H., Santander-Garcıa, M., and Castro-Carrizo,A. (2013a). Extended rotating disks around post-AGB stars, A&A 557, A104, doi:10.1051/0004-6361/201322015, eprint 1307.1975.
Bujarrabal, V., Castro-Carrizo, A., Alcolea, J., Van Winckel, H., Sanchez Contreras,C., Santander-Garcıa, M., Neri, R., and Lucas, R. (2013b). ALMA observations ofthe Red Rectangle, a preliminary analysis, A&A 557, L11, doi:10.1051/0004-6361/201322232, eprint 1307.5959.
Bujarrabal, V., van Winckel, H., Neri, R., Alcolea, J., Castro-Carrizo, A., and Deroo, P.(2007). The nebula around the post-AGB star 89 Herculis, A&A 468, pp. L45–L48,doi:10.1051/0004-6361:20066969, eprint arXiv:astro-ph/0703718.
Burki, G., Mayor, M., and Benz, W. (1982). The peculiar classical Cepheid HR 7308, A&A109, pp. 258–270.
Buscher, D. F., Baldwin, J. E., Warner, P. J., and Haniff, C. A. (1990). Detection of a

March 22, 2017 0:30 World Scientific Book - 9.75in x 6.5in Science˙cases˙visible page 105
Bibliography 105
bright feature on the surface of Betelgeuse, MNRAS 245, pp. 7P–11P.Carciofi, A. C. and Bjorkman, J. E. (2006). Non-LTE Monte Carlo Radiative Transfer.
I. The Thermal Properties of Keplerian Disks around Classical Be Stars, ApJ 639,pp. 1081–1094, doi:10.1086/499483, eprint astro-ph/0511228.
Casagrande, L., Portinari, L., Glass, I. S., Laney, D., Silva Aguirre, V., Datson, J., Ander-sen, J., Nordstrom, B., Holmberg, J., Flynn, C., and Asplund, M. (2014). Towardsstellar effective temperatures and diameters at 1 per cent accuracy for future surveys,MNRAS 439, pp. 2060–2073, doi:10.1093/mnras/stu089, eprint 1401.3754.
Casagrande, L., Ramırez, I., Melendez, J., Bessell, M., and Asplund, M. (2010). An ab-solutely calibrated Teff scale from the infrared flux method. Dwarfs and subgiants,A&A 512, A54, doi:10.1051/0004-6361/200913204, eprint 1001.3142.
Casagrande, L., Schonrich, R., Asplund, M., Cassisi, S., Ramırez, I., Melendez, J., Bensby,T., and Feltzing, S. (2011). New constraints on the chemical evolution of the so-lar neighbourhood and Galactic disc(s). Improved astrophysical parameters for theGeneva-Copenhagen Survey, A&A 530, A138, doi:10.1051/0004-6361/201016276,eprint 1103.4651.
Challouf, M., Nardetto, N., Mourard, D., Graczyk, D., Aroui, H., Chesneau, O., Delaa,O., Pietrzynski, G., Gieren, W., Ligi, R., Meilland, A., Perraut, K., Tallon-Bosc,I., McAlister, H., ten Brummelaar, T., Sturmann, J., Sturmann, L., Turner, N.,Farrington, C., Vargas, N., and Scott, N. (2014). Improving the surface brightness-color relation for early-type stars using optical interferometry, ArXiv e-prints eprint1409.1351.
Che, X., Monnier, J. D., Zhao, M., Pedretti, E., Thureau, N., Merand, A., ten Brummelaar,T., McAlister, H., Ridgway, S. T., Turner, N., Sturmann, J., and Sturmann, L.(2011). Colder and Hotter: Interferometric Imaging of β Cassiopeiae and α Leonis,ApJ 732, 68, doi:10.1088/0004-637X/732/2/68, eprint 1105.0740.
Chelli, A. (1989). The phase problem in optical interferometry - Error analysis in thepresence of photon noise, A&A 225, pp. 277–290.
Chiavassa, A., Bigot, L., Kervella, P., Matter, A., Lopez, B., Collet, R., Magic, Z., andAsplund, M. (2012). Three-dimensional interferometric, spectrometric, and plan-etary views of Procyon, A&A 540, A5, doi:10.1051/0004-6361/201118652, eprint1201.3264.
Chiavassa, A., Collet, R., Casagrande, L., and Asplund, M. (2010a). Three-dimensionalhydrodynamical simulations of red giant stars: semi-global models for interpret-ing interferometric observations, A&A 524, A93, doi:10.1051/0004-6361/201015507,eprint 1009.1745.
Chiavassa, A., Haubois, X., Young, J. S., Plez, B., Josselin, E., Perrin, G., and Freytag,B. (2010b). Radiative hydrodynamics simulations of red supergiant stars. II. Simu-lations of convection on Betelgeuse match interferometric observations, A&A 515,p. A12, doi:10.1051/0004-6361/200913907, eprint 1003.1407.
Chiavassa, A., Lacour, S., Millour, F., Driebe, T., Wittkowski, M., Plez, B., Thiebaut,E., Josselin, E., Freytag, B., Scholz, M., and Haubois, X. (2010c). VLTI/AMBERspectro-interferometric imaging of VX Sagittarii’s inhomogenous outer atmosphere,A&A 511, p. A51, doi:10.1051/0004-6361/200913288, eprint 0911.4422.
Chiavassa, A., Ligi, R., Magic, Z., Collet, R., Asplund, M., and Mourard, D. (2014).Planet transit and stellar granulation detection with interferometry. Using the three-dimensional stellar atmosphere Stagger-grid simulations, A&A 567, A115, doi:10.1051/0004-6361/201323207, eprint 1404.7049.
Chiavassa, A., Pasquato, E., Jorissen, A., Sacuto, S., Babusiaux, C., Freytag, B., Ludwig,H.-G., Cruzalebes, P., Rabbia, Y., Spang, A., and Chesneau, O. (2011). Radiativehydrodynamic simulations of red supergiant stars. III. Spectro-photocentric variabil-ity, photometric variability, and consequences on Gaia measurements, A&A 528, p.A120, doi:10.1051/0004-6361/201015768, eprint 1012.5234.
Chiavassa, A., Plez, B., Josselin, E., and Freytag, B. (2009). Radiative hydrodynamicssimulations of red supergiant stars. I. interpretation of interferometric observations,

March 22, 2017 0:30 World Scientific Book - 9.75in x 6.5in Science˙cases˙visible page 106
106 Science cases for a visible interferometer
A&A 506, pp. 1351–1365, doi:10.1051/0004-6361/200911780, eprint 0907.1860.Chini, R., Hoffmeister, V. H., Nasseri, A., Stahl, O., and Zinnecker, H. (2012). A spectro-
scopic survey on the multiplicity of high-mass stars, MNRAS 424, pp. 1925–1929,doi:10.1111/j.1365-2966.2012.21317.x, eprint 1205.5238.
Cidale, L. S., Borges Fernandes, M., Andruchow, I., Arias, M. L., Kraus, M., Chesneau,O., Kanaan, S., Cure, M., de Wit, W. J., and Muratore, M. F. (2012). Observationalconstraints for the circumstellar disk of the B[e] star CPD-52 9243, A&A 548, A72,doi:10.1051/0004-6361/201220120.
Conti, P. S. (1997). B[e] Stars: What Are They and Why Are They At This Workshop?in A. Nota and H. Lamers (eds.), Luminous Blue Variables: Massive Stars in Tran-sition, Astronomical Society of the Pacific Conference Series, Vol. 120, p. 161.
Creevey, O., Thevenin, F., Berio, P., Heiter, U., von Braun, K., Mourard, D., Bigot,L., Boyajian, T. S., Kervella, P., Morel, P., Pichon, B., Chiavassa, A., Nardetto,N., Perraut, K., Meilland, A., Mc Alister, H. A., ten Brummelaar, T. A., Sturmann,C. F. J., Sturmann, L., and Turner, N. (2014). Benchmark stars for Gaia: fundamen-tal properties of the Population II star HD140283 from interferometric, spectroscopicand photometric data, ArXiv e-prints eprint 1410.4780.
Creevey, O. L., Monteiro, M. J. P. F. G., Metcalfe, T. S., Brown, T. M., Jimenez-Reyes,S. J., and Belmonte, J. A. (2007). The Complementary Roles of Interferometry andAsteroseismology in Determining the Mass of Solar-Type Stars, ApJ 659, pp. 616–625, doi:10.1086/512097, eprint astro-ph/0702270.
Creevey, O. L., Thevenin, F., Basu, S., Chaplin, W. J., Bigot, L., Elsworth, Y., Huber,D., Monteiro, M. J. P. F. G., and Serenelli, A. (2013). A large sample of calibrationstars for Gaia: log g from Kepler and CoRoT fields, MNRAS 431, pp. 2419–2432,doi:10.1093/mnras/stt336, eprint 1302.7158.
Creevey, O. L., Thevenin, F., Boyajian, T. S., Kervella, P., Chiavassa, A., Bigot, L.,Merand, A., Heiter, U., Morel, P., Pichon, B., Mc Alister, H. A., ten Brummelaar,T. A., Collet, R., van Belle, G. T., Coude du Foresto, V., Farrington, C., Goldfinger,P. J., Sturmann, J., Sturmann, L., and Turner, N. (2012). Fundamental propertiesof the Population II fiducial stars ¡ASTROBJ¿HD 122563¡/ASTROBJ¿ and ¡AS-TROBJ¿Gmb 1830¡/ASTROBJ¿ from CHARA interferometric observations, A&A545, A17, doi:10.1051/0004-6361/201219651, eprint 1207.5954.
Cuntz, M. (1997). Chromospheric velocity fields in α Orionis (M2 Iab) generated bystochastic shocks. A&A 325, pp. 709–713.
Davis, J., Jacob, A. P., Robertson, J. G., Ireland, M. J., North, J. R., Tango, W. J.,and Tuthill, P. G. (2009). Observations of the pulsation of the Cepheid l Car withthe Sydney University Stellar Interferometer, MNRAS 394, pp. 1620–1630, doi:10.1111/j.1365-2966.2009.14433.x, eprint 0812.4791.
De Beck, E., Decin, L., de Koter, A., Justtanont, K., Verhoelst, T., Kemper, F., andMenten, K. M. (2010). Probing the mass-loss history of AGB and red supergiantstars from CO rotational line profiles. II. CO line survey of evolved stars: derivationof mass-loss rate formulae, A&A 523, A18, doi:10.1051/0004-6361/200913771, eprint1008.1083.
de Ruyter, S., van Winckel, H., Maas, T., Lloyd Evans, T., Waters, L. B. F. M.,and Dejonghe, H. (2006). Keplerian discs around post-AGB stars: a commonphenomenon? A&A 448, pp. 641–653, doi:10.1051/0004-6361:20054062, eprintarXiv:astro-ph/0601578.
Delaa, O., Zorec, J., Domiciano de Souza, A., Mourard, D., Perraut, K., Stee, P., Fremat,Y., Monnier, J., Kraus, S., Che, X., Berio, P., Bonneau, D., Clausse, J. M., Challouf,M., Ligi, R., Meilland, A., Nardetto, N., Spang, A., McAlister, H., ten Brummelaar,T., Sturmann, J., Sturmann, L., Turner, N., Farrington, C., and Goldfinger, P. J.(2013). Spectrally resolved interferometric observations of α Cephei and physicalmodeling of fast rotating stars, A&A 555, A100, doi:10.1051/0004-6361/201220689.
Di Benedetto, G. P. (2005). Predicting accurate stellar angular diameters by the near-infrared surface brightness technique, MNRAS 357, pp. 174–190, doi:10.1111/j.

March 22, 2017 0:30 World Scientific Book - 9.75in x 6.5in Science˙cases˙visible page 107
Bibliography 107
1365-2966.2005.08632.x.Domiciano de Souza, A., Kervella, P., Jankov, S., Abe, L., Vakili, F., di Folco, E., and
Paresce, F. (2003). The spinning-top Be star Achernar from VLTI-VINCI, A&A 407,pp. L47–L50, doi:10.1051/0004-6361:20030786, eprint astro-ph/0306277.
Eisenhauer, F., Perrin, G., Brandner, W., Straubmeier, C., Perraut, K., Amorim, A.,Scholler, M., Gillessen, S., Kervella, P., Benisty, M., Araujo-Hauck, C., Jocou, L.,Lima, J., Jakob, G., Haug, M., Clenet, Y., Henning, T., Eckart, A., Berger, J.-P.,Garcia, P., Abuter, R., Kellner, S., Paumard, T., Hippler, S., Fischer, S., Moulin,T., Villate, J., Avila, G., Grater, A., Lacour, S., Huber, A., Wiest, M., Nolot,A., Carvas, P., Dorn, R., Pfuhl, O., Gendron, E., Kendrew, S., Yazici, S., Anton,S., Jung, Y., Thiel, M., Choquet, E., Klein, R., Teixeira, P., Gitton, P., Moch, D.,Vincent, F., Kudryavtseva, N., Strobele, S., Sturm, S., Fedou, P., Lenzen, R., Jolley,P., Kister, C., Lapeyrere, V., Naranjo, V., Lucuix, C., Hofmann, R., Chapron, F.,Neumann, U., Mehrgan, L., Hans, O., Rousset, G., Ramos, J., Suarez, M., Lederer,R., Reess, J.-M., Rohloff, R.-R., Haguenauer, P., Bartko, H., Sevin, A., Wagner, K.,Lizon, J.-L., Rabien, S., Collin, C., Finger, G., Davies, R., Rouan, D., Wittkowski,M., Dodds-Eden, K., Ziegler, D., Cassaing, F., Bonnet, H., Casali, M., Genzel, R.,and Lena, P. (2011). GRAVITY: Observing the Universe in Motion, The Messenger143, pp. 16–24.
Elkin, V. G., Mathys, G., Kurtz, D. W., Hubrig, S., and Freyhammer, L. M. (2010).A rival for Babcock’s star: the extreme 30-kG variable magnetic field in the Apstar HD75049, MNRAS 402, pp. 1883–1891, doi:10.1111/j.1365-2966.2009.16015.x,eprint 0908.0849.
Ellerbroek, L. E., Podio, L., Dougados, C., Cabrit, S., Sitko, M. L., Sana, H., Kaper, L., deKoter, A., Klaassen, P. D., Mulders, G. D., Mendigutıa, I., Grady, C. A., Grankin,K., van Winckel, H., Bacciotti, F., Russell, R. W., Lynch, D. K., Hammel, H. B.,Beerman, L. C., Day, A. N., Huelsman, D. M., Werren, C., Henden, A., and Grind-lay, J. (2014). Relating jet structure to photometric variability: the Herbig Ae starHD 163296, A&A 563, A87, doi:10.1051/0004-6361/201323092, eprint 1401.3744.
Elvis, M. and Karovska, M. (2002). Quasar Parallax: A Method for Determining DirectGeometrical Distances to Quasars, ApJL 581, pp. L67–L70, doi:10.1086/346015,eprint astro-ph/0211385.
Fabas, N., Lebre, A., and Gillet, D. (2011). Shock-induced polarized hydrogen emissionlines in the Mira star o Ceti, A&A 535, A12, doi:10.1051/0004-6361/201117748,eprint 1109.6500.
Fernie, J. D. (1992). A new approach to the Cepheid period-luminosity law - Delta Scutistars as small Cepheids, AJ 103, pp. 1647–1651, doi:10.1086/116179.
Fernie, J. D., Evans, N. R., Beattie, B., and Seager, S. (1995). A Database of GalacticClassical Cepheids, Information Bulletin on Variable Stars 4148, p. 1.
Fernley, J. (1994). A revision to the absolute magnitudes of RR Lyrae stars from theBaade-Wesselink method, A&A 284, pp. L16–L18.
Fokin, A. B. (1991). On hydrogen line formation in the atmospheres of pulsating giants,MNRAS 250, pp. 258–269.
Fokin, A. B., Gillet, D., and Breitfellner, M. G. (1996). Pulsating motions and turbulencein δ Cephei. A&A 307, pp. 503–515.
Fouque, P., Arriagada, P., Storm, J., Barnes, T. G., Nardetto, N., Merand, A., Kervella, P.,Gieren, W., Bersier, D., Benedict, G. F., and McArthur, B. E. (2007). A new calibra-tion of Galactic Cepheid period-luminosity relations from B to K bands, and a com-parison to LMC relations, A&A 476, pp. 73–81, doi:10.1051/0004-6361:20078187,eprint 0709.3255.
Freedman, W. L., Madore, B. F., Gibson, B. K., Ferrarese, L., Kelson, D. D., Sakai, S.,Mould, J. R., Kennicutt, R. C., Jr., Ford, H. C., Graham, J. A., Huchra, J. P.,Hughes, S. M. G., Illingworth, G. D., Macri, L. M., and Stetson, P. B. (2001).Final Results from the Hubble Space Telescope Key Project to Measure the HubbleConstant, ApJ 553, pp. 47–72, doi:10.1086/320638, eprint astro-ph/0012376.

March 22, 2017 0:30 World Scientific Book - 9.75in x 6.5in Science˙cases˙visible page 108
108 Science cases for a visible interferometer
Gallenne, A., Kervella, P., and Merand, A. (2012). Thermal infrared properties of classicaland type II Cepheids. Diffraction limited 10 µm imaging with VLT/VISIR, A&A538, A24, doi:10.1051/0004-6361/201117307, eprint 1111.7215.
Gallenne, A., Kervella, P., Merand, A., Evans, N. R., Girard, J. H. V., Gieren, W.,and Pietrzynski, G. (2014a). Searching for visual companions of close Cepheids.VLT/NACO lucky imaging of Y Oph, FF Aql, X Sgr, W Sgr, and η Aql, A&A 567,A60, doi:10.1051/0004-6361/201423872, eprint 1406.0493.
Gallenne, A., Merand, A., Kervella, P., Breitfelder, J., Le Bouquin, J.-B., Monnier,J. D., Gieren, W., Pilecki, B., and Pietrzynski, G. (2014b). Multiplicity of Galac-tic Cepheids from long-baseline interferometry. II. The Companion of AX Circinirevealed with VLTI/PIONIER, A&A 561, L3, doi:10.1051/0004-6361/201322883,eprint 1312.1950.
Gallenne, A., Merand, A., Kervella, P., Chesneau, O., Breitfelder, J., and Gieren, W.(2013a). Extended envelopes around Galactic Cepheids. IV. T Monocerotis and XSagittarii from mid-infrared interferometry with VLTI/MIDI, A&A 558, A140, doi:10.1051/0004-6361/201322257, eprint 1309.0854.
Gallenne, A., Monnier, J. D., Merand, A., Kervella, P., Kraus, S., Schaefer, G. H., Gieren,W., Pietrzynski, G., Szabados, L., Che, X., Baron, F., Pedretti, E., McAlister, H.,ten Brummelaar, T., Sturmann, J., Sturmann, L., Turner, N., Farrington, C., andVargas, N. (2013b). Multiplicity of Galactic Cepheids from long-baseline interferom-etry. I. CHARA/MIRC detection of the companion of V1334 Cygni, A&A 552, A21,doi:10.1051/0004-6361/201321091, eprint 1302.1817.
Gastine, T., Morin, J., Duarte, L., Reiners, A., Christensen, U. R., and Wicht, J. (2013).What controls the magnetic geometry of M dwarfs? A&A 549, L5, doi:10.1051/0004-6361/201220317, eprint 1212.0136.
Gautschy-Loidl, R., Hofner, S., Jørgensen, U. G., and Hron, J. (2004). Dynamic modelatmospheres of AGB stars. IV. A comparison of synthetic carbon star spectra withobservations, A&A 422, pp. 289–306, doi:10.1051/0004-6361:20035860.
Gieren, W., Pietrzynski, G., Bresolin, F., Kudritzki, R.-P., Minniti, D., Urbaneja, M.,Soszynski, I., Storm, J., Fouque, P., Bono, G., Walker, A., and Garcia, J. (2005a).Measuring Improved Distances to Nearby Galaxies: The Araucaria Project, TheMessenger 121, pp. 23–28.
Gieren, W., Storm, J., Barnes, T. G., III, Fouque, P., Pietrzynski, G., and Kienzle, F.(2005b). Direct Distances to Cepheids in the Large Magellanic Cloud: Evidence fora Universal Slope of the Period-Luminosity Relation up to Solar Abundance, ApJ627, pp. 224–237, doi:10.1086/430496, eprint astro-ph/0503637.
Gorlova, N., Van Winckel, H., Gielen, C., Raskin, G., Prins, S., Pessemier, W.,Waelkens, C., Fremat, Y., Hensberge, H., Dumortier, L., Jorissen, A., and VanEck, S. (2012). Time-resolved spectroscopy of BD+46442: Gas streams and jetcreation in a newly discovered evolved binary with a disk, A&A 542, A27, doi:10.1051/0004-6361/201118727, eprint 1204.3004.
Grunhut, J. H., Wade, G. A., Hanes, D. A., and Alecian, E. (2010). Systematic detectionof magnetic fields in massive, late-type supergiants, MNRAS 408, pp. 2290–2297,doi:10.1111/j.1365-2966.2010.17275.x, eprint 1006.5891.
Guiglion, G., Nardetto, N., Mathias, P., Domiciano de Souza, A., Poretti, E., Rainer, M.,Fokin, A., Mourard, D., and Gieren, W. (2013). Understanding the dynamical struc-ture of pulsating stars: The Baade-Wesselink projection factor of the δ Scuti starsAI Velorum and β Cassiopeiae, A&A 550, L10, doi:10.1051/0004-6361/201220780,eprint 1301.2475.
Halbwachs, J.-L. (2009). Local effects in astrometric binary orbits: perspective transfor-mation and light-travel time, MNRAS 394, pp. 1075–1084, doi:10.1111/j.1365-2966.2009.14406.x, eprint 0812.3224.
Halbwachs, J.-L., Arenou, F., Pourbaix, D., Famaey, B., Guillout, P., Lebreton, Y., Sa-lomon, J.-B., Tal-Or, L., Ibata, R., and Mazeh, T. (2014). Masses of the compo-nents of SB2 binaries observed with Gaia - I. Selection of the sample and mass

March 22, 2017 0:30 World Scientific Book - 9.75in x 6.5in Science˙cases˙visible page 109
Bibliography 109
ratios of 20 new SB2s discovered with Sophie, MNRAS 445, pp. 2371–2377, doi:10.1093/mnras/stu1838, eprint 1409.1384.
Harper, G. M. and Brown, A. (2006). Electron Density and Turbulence Gradients withinthe Extended Atmosphere of the M Supergiant Betelgeuse (α Orionis), ApJ 646,pp. 1179–1202, doi:10.1086/505073.
Harper, G. M., Brown, A., and Lim, J. (2001). A Spatially Resolved, Semiempirical Modelfor the Extended Atmosphere of α Orionis (M2 Iab), ApJ 551, pp. 1073–1098,doi:10.1086/320215.
Hartmann, L. and Avrett, E. H. (1984). On the extended chromosphere of Alpha Orionis,ApJ 284, pp. 238–249, doi:10.1086/162402.
Haubois, X., Perrin, G., Lacour, S., Verhoelst, T., Meimon, S., Mugnier, L., Thiebaut,E., Berger, J. P., Ridgway, S. T., Monnier, J. D., Millan-Gabet, R., and Traub, W.(2009). Imaging the spotty surface of ¡ASTROBJ¿Betelgeuse¡/ASTROBJ¿ in the Hband, A&A 508, pp. 923–932, doi:10.1051/0004-6361/200912927, eprint 0910.4167.
Hillen, M., Menu, J., Van Winckel, H., Min, M., Gielen, C., Wevers, T., Mulders, G. D.,Regibo, S., and Verhoelst, T. (2014). An interferometric study of the post-AGBbinary 89 Herculis. II. Radiative transfer models of the circumbinary disk, A&A568, A12, doi:10.1051/0004-6361/201423749, eprint 1405.1960.
Hillen, M., Verhoelst, T., Van Winckel, H., Chesneau, O., Hummel, C. A., Monnier,J. D., Farrington, C., Tycner, C., Mourard, D., ten Brummelaar, T., Banerjee,D. P. K., and Zavala, R. T. (2013). An interferometric study of the post-AGB binary89 Herculis. I. Spatially resolving the continuum circumstellar environment at opticaland near-IR wavelengths with the VLTI, NPOI, IOTA, PTI, and the CHARA Array,A&A 559, A111, doi:10.1051/0004-6361/201321616, eprint 1308.6715.
Hofner, S. (2008). Winds of M-type AGB stars driven by micron-sized grains, A&A 491,pp. L1–L4, doi:10.1051/0004-6361:200810641.
Honig, S. F., Watson, D., Kishimoto, M., and Hjorth, J. (2014). A dust-parallax distanceof 19 megaparsecs to the supermassive black hole in NGC 4151, Nature 515, pp.528–530, doi:10.1038/nature13914, eprint 1411.7032.
Huber, D., Ireland, M. J., Bedding, T. R., Brandao, I. M., Piau, L., Maestro, V., White,T. R., Bruntt, H., Casagrande, L., Molenda-Zakowicz, J., Silva Aguirre, V., Sousa,S. G., Barclay, T., Burke, C. J., Chaplin, W. J., Christensen-Dalsgaard, J., Cunha,M. S., De Ridder, J., Farrington, C. D., Frasca, A., Garcıa, R. A., Gilliland, R. L.,Goldfinger, P. J., Hekker, S., Kawaler, S. D., Kjeldsen, H., McAlister, H. A., Met-calfe, T. S., Miglio, A., Monteiro, M. J. P. F. G., Pinsonneault, M. H., Schaefer,G. H., Stello, D., Stumpe, M. C., Sturmann, J., Sturmann, L., ten Brummelaar,T. A., Thompson, M. J., Turner, N., and Uytterhoeven, K. (2012). FundamentalProperties of Stars Using Asteroseismology from Kepler and CoRoT and Interfer-ometry from the CHARA Array, ApJ 760, 32, doi:10.1088/0004-637X/760/1/32,eprint 1210.0012.
Ireland, M. J., Merand, A., ten Brummelaar, T. A., Tuthill, P. G., Schaefer, G. H., Turner,N. H., Sturmann, J., Sturmann, L., and McAlister, H. A. (2008). Sensitive visibleinterferometry with PAVO, in Society of Photo-Optical Instrumentation Engineers(SPIE) Conference Series, Vol. 7013, doi:10.1117/12.788386.
Jankov, S., Domiciano de Souza, A., Jr., Stehle, C., Vakili, F., Perraut-Rousselet, K., andChesneau, O. (2003). Interferometric-Doppler imaging of stellar surface abundances,in W. A. Traub (ed.), Interferometry for Optical Astronomy II, Society of Photo-Optical Instrumentation Engineers (SPIE) Conference Series, Vol. 4838, pp. 587–593.
Jankov, S., Vakili, F., Domiciano de Souza, A., Jr., and Janot-Pacheco, E. (2001).Interferometric-Doppler imaging of stellar surface structure, A&A 377, pp. 721–734,doi:10.1051/0004-6361:20011047.
Jofre, P., Heiter, U., Soubiran, C., Blanco-Cuaresma, S., Worley, C. C., Pancino, E.,Cantat-Gaudin, T., Magrini, L., Bergemann, M., Gonzalez Hernandez, J. I., Hill,V., Lardo, C., de Laverny, P., Lind, K., Masseron, T., Montes, D., Mucciarelli, A.,

March 22, 2017 0:30 World Scientific Book - 9.75in x 6.5in Science˙cases˙visible page 110
110 Science cases for a visible interferometer
Nordlander, T., Recio Blanco, A., Sobeck, J., Sordo, R., Sousa, S. G., Tabernero,H., Vallenari, A., and Van Eck, S. (2014). Gaia FGK benchmark stars: Metallicity,A&A 564, A133, doi:10.1051/0004-6361/201322440, eprint 1309.1099.
Josselin, E. and Plez, B. (2007). Atmospheric dynamics and the mass loss process in redsupergiant stars, A&A 469, pp. 671–680, doi:10.1051/0004-6361:20066353, eprint0705.0266.
Kamath, D., Wood, P. R., and Van Winckel, H. (2014). Optically visible post-AGB/RGBstars and young stellar objects in the Small Magellanic Cloud: candidate selec-tion, spectral energy distributions and spectroscopic examination, MNRAS 439,pp. 2211–2270, doi:10.1093/mnras/stt2033, eprint 1402.5954.
Kaspi, S., Brandt, W. N., Maoz, D., Netzer, H., Schneider, D. P., and Shemmer, O. (2007).Reverberation Mapping of High-Luminosity Quasars: First Results, ApJ 659, pp.997–1007, doi:10.1086/512094, eprint astro-ph/0612722.
Keller, S. C. (2008). Cepheid Mass loss and the Pulsation-Evolutionary Mass Discrepancy,ApJ 677, pp. 483–487, doi:10.1086/529366, eprint 0801.1342.
Kervella, P., Gallenne, A., and Merand, A. (2013). Circumstellar envelopes of Cepheids:a possible bias affecting the distance scale? in R. de Grijs (ed.), IAU Symposium,IAU Symposium, Vol. 289, pp. 157–160, doi:10.1017/S1743921312021291.
Kervella, P., Nardetto, N., Bersier, D., Mourard, D., and Coude du Foresto, V. (2004a).Cepheid distances from infrared long-baseline interferometry. I. VINCI/VLTI obser-vations of seven Galactic Cepheids, A&A 416, pp. 941–953, doi:10.1051/0004-6361:20031743, eprint astro-ph/0311525.
Kervella, P., Thevenin, F., Di Folco, E., and Segransan, D. (2004b). The angular sizes ofdwarf stars and subgiants. Surface brightness relations calibrated by interferometry,A&A 426, pp. 297–307, doi:10.1051/0004-6361:20035930, eprint astro-ph/0404180.
Kochukhov, O., Adelman, S. J., Gulliver, A. F., and Piskunov, N. (2007). Weather instellar atmosphere revealed by the dynamics of mercury clouds in α Andromedae,Nature Physics 3, pp. 526–529, doi:10.1038/nphys648, eprint 0705.4469.
Kochukhov, O. and Wade, G. A. (2010). Magnetic Doppler imaging of α2 Canum Venati-corum in all four Stokes parameters. Unveiling the hidden complexity of stellar mag-netic fields, A&A 513, A13, doi:10.1051/0004-6361/200913860, eprint 1002.0025.
Koechlin, L. and Rabbia, Y. (1985). Stellar diameter measurements with the CERGAoptical interferometer - Recent developments and results, A&A 153, pp. 91–98.
Kraus, M., Oksala, M. E., Nickeler, D. H., Muratore, M. F., Borges Fernandes, M., Aret,A., Cidale, L. S., and de Wit, W. J. (2013). Molecular emission from GG Cari-nae’s circumbinary disk, A&A 549, A28, doi:10.1051/0004-6361/201220442, eprint1211.5149.
Kraus, S., Calvet, N., Hartmann, L., Hofmann, K.-H., Kreplin, A., Monnier, J. D., andWeigelt, G. (2012a). On the Nature of the Herbig B[e] Star Binary System V921Scorpii: Discovery of a Close Companion and Relation to the Large-scale BipolarNebula, ApJL 746, L2, doi:10.1088/2041-8205/746/1/L2, eprint 1201.2420.
Kraus, S., Calvet, N., Hartmann, L., Hofmann, K.-H., Kreplin, A., Monnier, J. D., andWeigelt, G. (2012b). On the Nature of the Herbig B[e] Star Binary System V921Scorpii: Geometry and Kinematics of the Circumprimary Disk on Sub-AU Scales,ApJ 752, 11, doi:10.1088/0004-637X/752/1/11, eprint 1204.1969.
Kuschnig, R., Ryabchikova, T. A., Piskunov, N. E., Weiss, W. W., and Gelbmann, M. J.(1999). Multi element Doppler imaging of AP stars. I. He, Mg, Si, CR and Fe surfacedistribution for CU Virginis, A&A 348, pp. 924–932.
Lamers, H. J. G. L. M., Zickgraf, F.-J., de Winter, D., Houziaux, L., and Zorec, J. (1998).An improved classification of B[e]-type stars, A&A 340, pp. 117–128.
Le Bouquin, J.-B., Berger, J.-P., Lazareff, B., Zins, G., Haguenauer, P., Jocou, L., Kern,P., Millan-Gabet, R., Traub, W., Absil, O., Augereau, J.-C., Benisty, M., Blind,N., Bonfils, X., Bourget, P., Delboulbe, A., Feautrier, P., Germain, M., Gitton,P., Gillier, D., Kiekebusch, M., Kluska, J., Knudstrup, J., Labeye, P., Lizon, J.-L., Monin, J.-L., Magnard, Y., Malbet, F., Maurel, D., Menard, F., Micallef, M.,

March 22, 2017 0:30 World Scientific Book - 9.75in x 6.5in Science˙cases˙visible page 111
Bibliography 111
Michaud, L., Montagnier, G., Morel, S., Moulin, T., Perraut, K., Popovic, D.,Rabou, P., Rochat, S., Rojas, C., Roussel, F., Roux, A., Stadler, E., Stefl, S.,Tatulli, E., and Ventura, N. (2011). PIONIER: a 4-telescope visitor instrument atVLTI, A&A 535, A67, doi:10.1051/0004-6361/201117586, eprint 1109.1918.
Leinert, C., Graser, U., Przygodda, F., Waters, L. B. F. M., Perrin, G., Jaffe, W., Lopez,B., Bakker, E. J., Bohm, A., Chesneau, O., Cotton, W. D., Damstra, S., de Jong,J., Glazenborg-Kluttig, A. W., Grimm, B., Hanenburg, H., Laun, W., Lenzen, R.,Ligori, S., Mathar, R. J., Meisner, J., Morel, S., Morr, W., Neumann, U., Pel, J.-W.,Schuller, P., Rohloff, R.-R., Stecklum, B., Storz, C., von der Luhe, O., and Wagner,K. (2003). MIDI - the 10 \mum instrument on the VLTI, AP&SS 286, pp. 73–83,doi:10.1023/A:1026158127732.
Levesque, E. M. (2010). The physical properties of red supergiants, New Astronomy Review54, pp. 1–12, doi:10.1016/j.newar.2009.10.002, eprint 0911.4720.
Levesque, E. M., Massey, P., Olsen, K. A. G., Plez, B., Josselin, E., Maeder, A., andMeynet, G. (2005). The Effective Temperature Scale of Galactic Red Supergiants:Cool, but Not As Cool As We Thought, ApJ 628, pp. 973–985, doi:10.1086/430901,eprint arXiv:astro-ph/0504337.
Ligi, R., Mourard, D., Lagrange, A.-M., Perraut, K., and Chiavassa, A. (2014). On thecharacterization of transiting exoplanets and magnetic spots with optical interfer-ometry, ArXiv e-prints eprint 1410.5333.
Ligi, R., Mourard, D., Lagrange, A.-M., Perraut, K., and Chiavassa, A. (2015). Transitingexoplanets and magnetic spots characterized with optical interferometry, A&A 574,A69, doi:10.1051/0004-6361/201424013, eprint 1410.5333.
Ligi, R., Mourard, D., Nardetto, N., and Clausse, J.-M. (2013). The operation ofvega/chara: From the scientific idea to the final products, Journal of Astronom-ical Instrumentation 02, 02, p. 1340003, doi:10.1142/S2251171713400035, eprinthttp://www.worldscientific.com/doi/pdf/10.1142/S2251171713400035.
Lopez, B., Lagarde, S., Jaffe, W., Petrov, R., Scholler, M., Antonelli, P., Beckman, U.,Berio, P., Bettonvil, F., Graser, U., Millour, F., Robbe-Dubois, S., Venema, L., Wolf,S., Bristow, P., Glindemann, A., Gonzalez, J.-C., Lanz, T., Henning, T., Weigelt,G., Agocs, T., Augereau, J.-C., Avila, G., Bailet, C., Behrend, J., Berger, J.-P., vonBoekel, R., Bonhomme, S., Bourget, P., Brast, R., Bresson, Y., Clausse, J. M., Ches-neau, O., Csepany, G., Connot, C., Crida, A., Danchi, W. C., Delbo, M., Delplancke,F., Dominik, C., Dugue, M., Elswijk, E., Fanteı, Y., Finger, G., Gabasch, A., Gi-rard, P., Girault, V., Gitton, P., Glazenborg, A., Gonte, F., Guitton, F., Guniat,S., De Haan, M., Haguenauer, P., Hanenburg, H., Heininger, M., Hofmann, K.-H.,Hogerheijde, M., ter Horst, R., Hron, J., Hughes, Y., Ives, D., Jakob, G., Jasko,A., Jolley, P., Kragt, J., Kohler, R., Kroener, T., Kroes, G., Labadie, L., Laun, W.,Lehmitz, M., Leinert, C., Lizon, J. L., Lucuix, C., Marcotto, A., Martinache, F.,Matter, A., Martinot-Lagarde, G., Mauclert, N., Mehrgan, L., Meilland, A., Mellein,M., Menardi, S., Menut, J. L., Meisenheimer, K., Morel, S., Mosoni, L., Navarro,R., Neumann, U., Nussbaum, E., Ottogalli, S., Palsa, R., Panduro, J., Pantin, E.,Percheron, I., Duc, T. P., Pott, J.-U., Pozna, E., Przygodda, F., Richichi, A., Rigal,F., Rupprecht, G., Schertl, D., Stegmeier, J., Thiam, L., Tromp, N., Vannier, M.,Vakili, F., van Belle, G., Wagner, K., and Woillez, J. (2014). MATISSE status reportand science forecast, in Society of Photo-Optical Instrumentation Engineers (SPIE)Conference Series, Society of Photo-Optical Instrumentation Engineers (SPIE) Con-ference Series, Vol. 9146, p. 0, doi:10.1117/12.2056419.
Luftinger, T., Kochukhov, O., Ryabchikova, T., Piskunov, N., Weiss, W. W., and Ilyin,I. (2010). Magnetic Doppler imaging of the roAp star HD 24712, A&A 509, A71,doi:10.1051/0004-6361/200811545, eprint 0910.5556.
Maercker, M., Mohamed, S., Vlemmings, W. H. T., Ramstedt, S., Groenewegen, M. A. T.,Humphreys, E., Kerschbaum, F., Lindqvist, M., Olofsson, H., Paladini, C., Wit-tkowski, M., de Gregorio-Monsalvo, I., and Nyman, L.-A. (2012). Unexpectedlylarge mass loss during the thermal pulse cycle of the red giant star R Sculptoris,

March 22, 2017 0:30 World Scientific Book - 9.75in x 6.5in Science˙cases˙visible page 112
112 Science cases for a visible interferometer
Nature 490, pp. 232–234, doi:10.1038/nature11511, eprint 1210.3030.Maestro, V., Che, X., Huber, D., Ireland, M. J., Monnier, J. D., White, T. R., Kok, Y.,
Robertson, J. G., Schaefer, G. H., ten Brummelaar, T. A., and Tuthill, P. G. (2013).Optical interferometry of early-type stars with PAVO@CHARA - I. Fundamentalstellar properties, MNRAS 434, pp. 1321–1331, doi:10.1093/mnras/stt1092, eprint1306.5937.
McAlister, H. A., ten Brummelaar, T. A., Ridgway, S. T., Gies, D. R., Sturmann, J.,Sturmann, L., Turner, N. H., Schaefer, G. H., Boyajian, T. S., Farrington, C. D.,Goldfinger, P. J., and Webster, L. (2012). Recent technical and scientific highlightsfrom the CHARA Array, in Society of Photo-Optical Instrumentation Engineers(SPIE) Conference Series, Vol. 8445, doi:10.1117/12.926452.
McNamara, D. H., Clementini, G., and Marconi, M. (2007). A δ Scuti Distance to theLarge Magellanic Cloud, AJ 133, pp. 2752–2763, doi:10.1086/513717, eprint astro-ph/0702107.
Mehner, A., Davidson, K., Humphreys, R. M., Walter, F. M., Baade, D., de Wit, W. J.,Martin, J., Ishibashi, K., Rivinius, T., Martayan, C., Ruiz, M. T., and Weis, K.(2015). Eta Carinae’s 2014.6 spectroscopic event: Clues to the long-term recoveryfrom its Great Eruption, A&A 578, A122, doi:10.1051/0004-6361/201425522, eprint1504.04940.
Meilland, A., Kanaan, S., Borges Fernandes, M., Chesneau, O., Millour, F., Stee, P.,and Lopez, B. (2010). Resolving the dusty circumstellar environment of the A[e]supergiant HD 62623 with the VLTI/MIDI, A&A 512, A73, doi:10.1051/0004-6361/200913640, eprint 0912.1954.
Merand, A., Aufdenberg, J. P., Kervella, P., Foresto, V. C. d., ten Brummelaar, T. A.,McAlister, H. A., Sturmann, L., Sturmann, J., and Turner, N. H. (2007). Ex-tended Envelopes around Galactic Cepheids. III. Y Ophiuchi and α Persei fromNear-Infrared Interferometry with CHARA/FLUOR, ApJ 664, pp. 1093–1101, doi:10.1086/518597, eprint 0704.1825.
Merand, A., Kervella, P., Coude du Foresto, V., Ridgway, S. T., Aufdenberg, J. P., tenBrummelaar, T. A., Berger, D. H., Sturmann, J., Sturmann, L., Turner, N. H.,and McAlister, H. A. (2005). The projection factor of δ Cephei. A calibration ofthe Baade-Wesselink method using the CHARA Array, A&A 438, pp. L9–L12, doi:10.1051/0004-6361:200500139.
Mermilliod, J.-C., Andersen, J., Latham, D. W., and Mayor, M. (2007). Red giants inopen clusters. XIII. Orbital elements of 156 spectroscopic binaries, A&A 473, pp.829–845, doi:10.1051/0004-6361:20078007.
Metcalfe, T. S., Creevey, O. L., Dogan, G., Mathur, S., Xu, H., Bedding, T. R., Chaplin,W. J., Christensen-Dalsgaard, J., Karoff, C., Trampedach, R., Benomar, O., Brown,B. P., Buzasi, D. L., Campante, T. L., Celik, Z., Cunha, M. S., Davies, G. R.,Deheuvels, S., Derekas, A., Di Mauro, M. P., Garcıa, R. A., Guzik, J. A., Howe,R., MacGregor, K. B., Mazumdar, A., Montalban, J., Monteiro, M. J. P. F. G.,Salabert, D., Serenelli, A., Stello, D., Stesacute, licki, M., Suran, M. D., Yıldız,M., Aksoy, C., Elsworth, Y., Gruberbauer, M., Guenther, D. B., Lebreton, Y.,Molaverdikhani, K., Pricopi, D., Simoniello, R., and White, T. R. (2014). Propertiesof 42 Solar-type Kepler Targets from the Asteroseismic Modeling Portal, ApJS 214,27, doi:10.1088/0067-0049/214/2/27, eprint 1402.3614.
Michaud, G. (1970). Diffusion Processes in Peculiar a Stars, ApJ 160, p. 641, doi:10.1086/150459.
Miglio, A., Chiappini, C., Morel, T., Barbieri, M., Chaplin, W. J., Girardi, L., Montalban,J., Valentini, M., Mosser, B., Baudin, F., Casagrande, L., Fossati, L., Aguirre,V. S., and Baglin, A. (2013). Galactic archaeology: mapping and dating stellarpopulations with asteroseismology of red-giant stars, MNRAS 429, pp. 423–428,doi:10.1093/mnras/sts345, eprint 1211.0146.
Millour, F., Chesneau, O., Borges Fernandes, M., Meilland, A., Mars, G., Benoist, C.,Thiebaut, E., Stee, P., Hofmann, K.-H., Baron, F., Young, J., Bendjoya, P., Carciofi,

March 22, 2017 0:30 World Scientific Book - 9.75in x 6.5in Science˙cases˙visible page 113
Bibliography 113
A., Domiciano de Souza, A., Driebe, T., Jankov, S., Kervella, P., Petrov, R. G.,Robbe-Dubois, S., Vakili, F., Waters, L. B. F. M., and Weigelt, G. (2009). A binaryengine fuelling HD 87643’s complex circumstellar environment. Determined usingAMBER/VLTI imaging, A&A 507, pp. 317–326, doi:10.1051/0004-6361/200811592,eprint 0908.0227.
Millour, F., Chesneau, O., Meilland, A., and Nardetto, N. (2014). Optical Interferome-try and Adaptive Optics of Bright Transients, in P. R. Wozniak, M. J. Graham,A. A. Mahabal, and R. Seaman (eds.), The Third Hot-wiring the Transient UniverseWorkshop, pp. 177–183, eprint 1407.5153.
Millour, F., Meilland, A., Chesneau, O., Stee, P., Kanaan, S., Petrov, R., Mourard, D.,and Kraus, S. (2011). Imaging the spinning gas and dust in the disc around thesupergiant A[e] star HD 62623, A&A 526, A107, doi:10.1051/0004-6361/201016193,eprint 1012.2957.
Milone, E. F., Wilson, W. J. F., Fry, D. J. I., and Schiller, S. J. (1994). Studies oflarge-amplitude Delta Scuti variables. 2: DY Herculis, PASP 106, pp. 1120–1133,doi:10.1086/133488.
Miroshnichenko, A. S. (2007). Toward Understanding the B[e] Phenomenon. I. Definitionof the Galactic FS CMa Stars, ApJ 667, pp. 497–504, doi:10.1086/520798.
Monnier, J. D., Zhao, M., Pedretti, E., Thureau, N., Ireland, M., Muirhead, P., Berger, J.-P., Millan-Gabet, R., Van Belle, G., ten Brummelaar, T., McAlister, H., Ridgway, S.,Turner, N., Sturmann, L., Sturmann, J., and Berger, D. (2007). Imaging the Surfaceof Altair, Science 317, pp. 342–, doi:10.1126/science.1143205, eprint 0706.0867.
Monnier, J. D., Zhao, M., Pedretti, E., Thureau, N., Ireland, M., Muirhead, P., Berger,J.-P., Millan-Gabet, R., Van Belle, G., ten Brummelaar, T., McAlister, H., Ridg-way, S., Turner, N., Sturmann, L., Sturmann, J., Berger, D., Tannirkulam, A.,and Blum, J. (2008). Imaging the surface of Altair and a MIRC update, in Societyof Photo-Optical Instrumentation Engineers (SPIE) Conference Series, Society ofPhoto-Optical Instrumentation Engineers (SPIE) Conference Series, Vol. 7013, p. 2,doi:10.1117/12.789754.
Mourard, D., Berio, P., Perraut, K., Ligi, R., Blazit, A., Clausse, J. M., Nardetto, N.,Spang, A., Tallon-Bosc, I., Bonneau, D., Chesneau, O., Delaa, O., Millour, F., Stee,P., Le Bouquin, J. B., ten Brummelaar, T., Farrington, C., Goldfinger, P. J., andMonnier, J. D. (2011). Spatio-spectral encoding of fringes in optical long-baselineinterferometry. Example of the 3T and 4T recombining mode of VEGA/CHARA,A&A 531, A110, doi:10.1051/0004-6361/201116976.
Mourard, D., Clausse, J. M., Marcotto, A., Perraut, K., Tallon-Bosc, I., Berio, P., Blazit,A., Bonneau, D., Bosio, S., Bresson, Y., Chesneau, O., Delaa, O., Henault, F.,Hughes, Y., Lagarde, S., Merlin, G., Roussel, A., Spang, A., Stee, P., Tallon, M.,Antonelli, P., Foy, R., Kervella, P., Petrov, R., Thiebaut, E., Vakili, F., McAlister,H., ten Brummelaar, T., Sturmann, J., Sturmann, L., Turner, N., Farrington, C.,and Goldfinger, P. J. (2009a). VEGA: Visible spEctroGraph and polArimeter for theCHARA array: principle and performance, A&A 508, pp. 1073–1083, doi:10.1051/0004-6361/200913016.
Mourard, D., Clausse, J. M., Marcotto, A., Perraut, K., Tallon-Bosc, I., Berio, P., Blazit,A., Bonneau, D., Bosio, S., Bresson, Y., Chesneau, O., Delaa, O., Henault, F.,Hughes, Y., Lagarde, S., Merlin, G., Roussel, A., Spang, A., Stee, P., Tallon, M.,Antonelli, P., Foy, R., Kervella, P., Petrov, R., Thiebaut, E., Vakili, F., McAlister,H., ten Brummelaar, T., Sturmann, J., Sturmann, L., Turner, N., Farrington, C.,and Goldfinger, P. J. (2009b). VEGA: Visible spEctroGraph and polArimeter forthe CHARA array: principle and performance, A&A 508, pp. 1073–1083, doi:10.1051/0004-6361/200913016.
Mourard, D. and Nardetto, N. (2006). Prospects for direct distance determination of LMCCepheids by differential interferometry, Mem. Societa Astronomica Italiana 77, p.555.
Muratore, M. F., Kraus, M., Oksala, M. E., Arias, M. L., Cidale, L., Borges Fernandes,

March 22, 2017 0:30 World Scientific Book - 9.75in x 6.5in Science˙cases˙visible page 114
114 Science cases for a visible interferometer
M., and Liermann, A. (2015). Evidence of the Evolved Nature of the B[e] Star MWC137, AJ 149, 13, doi:10.1088/0004-6256/149/1/13, eprint 1409.7550.
Nagae, T., Oka, K., Matsuda, T., Fujiwara, H., Hachisu, I., and Boffin, H. M. J. (2004).Wind accretion in binary stars. I. Mass accretion ratio, A&A 419, pp. 335–343,doi:10.1051/0004-6361:20040070, eprint astro-ph/0403329.
Nardetto, N., Fokin, A., Fouque, P., Storm, J., Gieren, W., Pietrzynski, G., Mourard, D.,and Kervella, P. (2011). The Baade-Wesselink p-factor applicable to LMC Cepheids,A&A 534, L16, doi:10.1051/0004-6361/201117459, eprint 1109.6763.
Nardetto, N., Fokin, A., Mourard, D., and Mathias, P. (2006). Probing the dynamicalstructure of δ Cephei atmosphere, A&A 454, pp. 327–332, doi:10.1051/0004-6361:20054274.
Nardetto, N., Fokin, A., Mourard, D., Mathias, P., Kervella, P., and Bersier, D. (2004).Self consistent modelling of the projection factor for interferometric distance deter-mination, A&A 428, pp. 131–137, doi:10.1051/0004-6361:20041419.
Nardetto, N., Gieren, W., Kervella, P., Fouque, P., Storm, J., Pietrzynski, G., Mourard,D., and Queloz, D. (2009). High-resolution spectroscopy for Cepheids distancedetermination. V. Impact of the cross-correlation method on the p-factor andthe γ-velocities, A&A 502, pp. 951–956, doi:10.1051/0004-6361/200912333, eprint0905.4540.
Nardetto, N., Mourard, D., Mathias, P., Fokin, A., and Gillet, D. (2007). High-resolutionspectroscopy for Cepheids distance determination. II. A period-projection factorrelation, A&A 471, pp. 661–669, doi:10.1051/0004-6361:20066853, eprint 0804.1331.
Nardetto, N., Poretti, E., Rainer, M., Guiglion, G., Scardia, M., Schmid, V. S., and Math-ias, P. (2014). Understanding the dynamical structure of pulsating stars. HARPSspectroscopy of the δ Scuti stars ρ Puppis and DX Ceti, A&A 561, A151, doi:10.1051/0004-6361/201322356, eprint 1401.2089.
Neilson, H. R., Cantiello, M., and Langer, N. (2011). The Cepheid mass discrepancy andpulsation-driven mass loss, A&A 529, L9, doi:10.1051/0004-6361/201116920, eprint1104.1638.
Nesvacil, N., Luftinger, T., Shulyak, D., Obbrugger, M., Weiss, W., Drake, N. A., Hubrig,S., Ryabchikova, T., Kochukhov, O., Piskunov, N., and Polosukhina, N. (2012).Multi-element Doppler imaging of the CP2 star HD 3980, A&A 537, A151, doi:10.1051/0004-6361/201117097.
Norris, B. R. M., Tuthill, P. G., Ireland, M. J., Lacour, S., Zijlstra, A. A., Lykou, F., Evans,T. M., Stewart, P., and Bedding, T. R. (2012). A close halo of large transparent grainsaround extreme red giant stars, Nature 484, pp. 220–222, doi:10.1038/nature10935,eprint 1204.2640.
Nowotny, W., Lebzelter, T., Hron, J., and Hofner, S. (2005). Atmospheric dynamics incarbon-rich Miras. II. Models meet observations, A&A 437, pp. 285–296, doi:10.1051/0004-6361:20042572, eprint astro-ph/0503653.
Ohnaka, K. (2014). Imaging the outward motions of clumpy dust clouds around thered supergiant Antares with VLT/VISIR, A&A 568, A17, doi:10.1051/0004-6361/201423893, eprint 1407.0715.
Ohnaka, K., Hofmann, K., Benisty, M., Chelli, A., Driebe, T., Millour, F., Petrov,R., Schertl, D., Stee, P., Vakili, F., and Weigelt, G. (2009). Spatially resolv-ing the inhomogeneous structure of the dynamical atmosphere of Betelgeuse withVLTI/AMBER, A&A 503, pp. 183–195, doi:10.1051/0004-6361/200912247, eprint0906.4792.
Ohnaka, K., Hofmann, K.-H., Schertl, D., Weigelt, G., Baffa, C., Chelli, A., Petrov,R., and Robbe-Dubois, S. (2013). High spectral resolution imaging of the dy-namical atmosphere of the red supergiant Antares in the CO first overtone lineswith VLTI/AMBER, A&A 555, A24, doi:10.1051/0004-6361/201321063, eprint1304.4800.
Ohnaka, K., Weigelt, G., Millour, F., Hofmann, K.-H., Driebe, T., Schertl, D., Chelli, A.,Massi, F., Petrov, R., and Stee, P. (2011a). Imaging the dynamical atmosphere of

March 22, 2017 0:30 World Scientific Book - 9.75in x 6.5in Science˙cases˙visible page 115
Bibliography 115
the red supergiant Betelgeuse in the CO first overtone lines with VLTI/AMBER,A&A 529, A163, doi:10.1051/0004-6361/201016279, eprint 1104.0958.
Ohnaka, K., Weigelt, G., Millour, F., Hofmann, K.-H., Driebe, T., Schertl, D., Chelli, A.,Massi, F., Petrov, R., and Stee, P. (2011b). Imaging the dynamical atmosphere ofthe red supergiant Betelgeuse in the CO first overtone lines with VLTI/AMBER,A&A 529, p. A163, doi:10.1051/0004-6361/201016279, eprint 1104.0958.
Oksala, M. E., Kraus, M., Arias, M. L., Borges Fernandes, M., Cidale, L., Muratore,M. F., and Cure, M. (2012). The sudden appearance of CO emission in LHA 115-S 65,MNRAS 426, pp. L56–L60, doi:10.1111/j.1745-3933.2012.01323.x, eprint 1207.6294.
Perraut, K., Borgniet, S., Cunha, M., Bigot, L., Brandao, I., Mourard, D., Nardetto, N.,Chesneau, O., McAlister, H., ten Brummelaar, T. A., Sturmann, J., Sturmann, L.,Turner, N., Farrington, C., and Goldfinger, P. J. (2013). The fundamental parame-ters of the roAp star 10 Aquilae, A&A 559, A21, doi:10.1051/0004-6361/201321849,eprint 1309.4423.
Perraut, K., Brandao, I., Mourard, D., Cunha, M., Berio, P., Bonneau, D., Chesneau, O.,Clausse, J. M., Delaa, O., Marcotto, A., Roussel, A., Spang, A., Stee, P., Tallon-Bosc, I., McAlister, H., ten Brummelaar, T., Sturmann, J., Sturmann, L., Turner,N., Farrington, C., and Goldfinger, P. J. (2011). The fundamental parameters ofthe roAp star γ Equulei, A&A 526, A89, doi:10.1051/0004-6361/201015801, eprint1011.2028.
Persson, S. E., Madore, B. F., Krzeminski, W., Freedman, W. L., Roth, M., and Murphy,D. C. (2004). New Cepheid Period-Luminosity Relations for the Large MagellanicCloud: 92 Near-Infrared Light Curves, AJ 128, pp. 2239–2264, doi:10.1086/424934.
Petersen, J. O. and Hog, E. (1998). HIPPARCOS parallaxes and period-luminosity rela-tions of high-amplitude delta Scuti stars, A&A 331, pp. 989–994.
Petrov, R. G. (1988). Differential Interferometry, in D. M. Alloin and J.-M. Mariotti (eds.),Diffraction-Limit.Imaging/ Very Large Telescopes, p. 249.
Petrov, R. G., Malbet, F., Weigelt, G., Antonelli, P., Beckmann, U., Bresson, Y., Chelli,A., Dugue, M., Duvert, G., Gennari, S., Gluck, L., Kern, P., Lagarde, S., Le Coarer,E., Lisi, F., Millour, F., Perraut, K., Puget, P., Rantakyro, F., Robbe-Dubois, S.,Roussel, A., Salinari, P., Tatulli, E., Zins, G., Accardo, M., Acke, B., Agabi, K., Al-tariba, E., Arezki, B., Aristidi, E., Baffa, C., Behrend, J., Blocker, T., Bonhomme,S., Busoni, S., Cassaing, F., Clausse, J.-M., Colin, J., Connot, C., Delboulbe, A.,Domiciano de Souza, A., Driebe, T., Feautrier, P., Ferruzzi, D., Forveille, T., Fos-sat, E., Foy, R., Fraix-Burnet, D., Gallardo, A., Giani, E., Gil, C., Glentzlin, A.,Heiden, M., Heininger, M., Hernandez Utrera, O., Hofmann, K.-H., Kamm, D.,Kiekebusch, M., Kraus, S., Le Contel, D., Le Contel, J.-M., Lesourd, T., Lopez, B.,Lopez, M., Magnard, Y., Marconi, A., Mars, G., Martinot-Lagarde, G., Mathias,P., Mege, P., Monin, J.-L., Mouillet, D., Mourard, D., Nussbaum, E., Ohnaka, K.,Pacheco, J., Perrier, C., Rabbia, Y., Rebattu, S., Reynaud, F., Richichi, A., Robini,A., Sacchettini, M., Schertl, D., Scholler, M., Solscheid, W., Spang, A., Stee, P., Ste-fanini, P., Tallon, M., Tallon-Bosc, I., Tasso, D., Testi, L., Vakili, F., von der Luhe,O., Valtier, J.-C., Vannier, M., and Ventura, N. (2007). AMBER, the near-infraredspectro-interferometric three-telescope VLTI instrument, A&A 464, pp. 1–12, doi:10.1051/0004-6361:20066496.
Petrov, R. G., Millour, F., Lagarde, S., Vannier, M., Rakshit, S., Marconi, A., and weigelt,G. (2012). VLTI/AMBER differential interferometry of the broad-line region of thequasar 3C273, in Society of Photo-Optical Instrumentation Engineers (SPIE) Con-ference Series, Society of Photo-Optical Instrumentation Engineers (SPIE) Confer-ence Series, Vol. 8445, p. 0, doi:10.1117/12.926595, eprint 1410.3108.
Pietrzynski, G., Graczyk, D., Gieren, W., Thompson, I. B., Pilecki, B., Udalski, A.,Soszynski, I., Koz lowski, S., Konorski, P., Suchomska, K., Bono, G., Moroni, P. G. P.,Villanova, S., Nardetto, N., Bresolin, F., Kudritzki, R. P., Storm, J., Gallenne, A.,Smolec, R., Minniti, D., Kubiak, M., Szymanski, M. K., Poleski, R., Wyrzykowski, L., Ulaczyk, K., Pietrukowicz, P., Gorski, M., and Karczmarek, P. (2013). An

March 22, 2017 0:30 World Scientific Book - 9.75in x 6.5in Science˙cases˙visible page 116
116 Science cases for a visible interferometer
eclipsing-binary distance to the Large Magellanic Cloud accurate to two per cent,Nature 495, pp. 76–79, doi:10.1038/nature11878, eprint 1303.2063.
Pijpers, F. P. and Hearn, A. G. (1989). A model for a stellar wind driven by linear acousticwaves, A&A 209, pp. 198–210.
Pilecki, B., Graczyk, D., Pietrzynski, G., Gieren, W., Thompson, I. B., Freedman,W. L., Scowcroft, V., Madore, B. F., Udalski, A., Soszynski, I., Konorski, P.,Smolec, R., Nardetto, N., Bono, G., Prada Moroni, P. G., Storm, J., and Gal-lenne, A. (2013). Physical parameters and the projection factor of the classicalCepheid in the binary system OGLE-LMC-CEP-0227, MNRAS 436, pp. 953–967,doi:10.1093/mnras/stt1529, eprint 1308.5023.
Quirrenbach, A., Mozurkewich, D., Armstrong, J. T., Buscher, D. F., and Hummel, C. A.(1993). Angular diameter measurements of cool giant stars in strong TiO bands andin the continuum, ApJ 406, pp. 215–219, doi:10.1086/172432.
Quirrenbach, A., Mozurkewich, D., Armstrong, J. T., Johnston, K. J., Colavita, M. M.,and Shao, M. (1992). Interferometric observations of Mira (Omicron Ceti), A&A259, pp. L19–L22.
Quirrenbach, A., Mozurkewich, D., Hummel, C. A., Buscher, D. F., and Armstrong, J. T.(1994). Angular diameters of the carbon stars UU Aurigae, Y Canum Venaticorum,and TX PISCIUM from optical long-baseline interferometry, A&A 285, pp. 541–546.
Raghavan, D., McAlister, H. A., Henry, T. J., Latham, D. W., Marcy, G. W., Mason,B. D., Gies, D. R., White, R. J., and ten Brummelaar, T. A. (2010). A Survey ofStellar Families: Multiplicity of Solar-type Stars, ApJS 190, pp. 1–42, doi:10.1088/0067-0049/190/1/1, eprint 1007.0414.
Rakshit, S., Petrov, R. G., Meilland, A., and Honig, S. F. (2015). Differential inter-ferometry of QSO broad-line regions - I. Improving the reverberation mappingmodel fits and black hole mass estimates, MNRAS 447, pp. 2420–2436, doi:10.1093/mnras/stu2613, eprint 1410.4837.
Riess, A. G., Macri, L., Casertano, S., Lampeitl, H., Ferguson, H. C., Filippenko, A. V.,Jha, S. W., Li, W., and Chornock, R. (2011). A 3% Solution: Determination of theHubble Constant with the Hubble Space Telescope and Wide Field Camera 3, ApJ730, 119, doi:10.1088/0004-637X/730/2/119, eprint 1103.2976.
Riess, A. G., Macri, L., Casertano, S., Sosey, M., Lampeitl, H., Ferguson, H. C., Filip-penko, A. V., Jha, S. W., Li, W., Chornock, R., and Sarkar, D. (2009a). A Redetermi-nation of the Hubble Constant with the Hubble Space Telescope from a DifferentialDistance Ladder, ApJ 699, pp. 539–563, doi:10.1088/0004-637X/699/1/539, eprint0905.0695.
Riess, A. G., Macri, L., Li, W., Lampeitl, H., Casertano, S., Ferguson, H. C., Filip-penko, A. V., Jha, S. W., Chornock, R., Greenhill, L., Mutchler, M., Ganeshal-ingham, M., and Hicken, M. (2009b). Cepheid Calibrations of Modern Type IaSupernovae: Implications for the Hubble Constant, ApJS 183, pp. 109–141, doi:10.1088/0067-0049/183/1/109, eprint 0905.0697.
Roelofs, G. H. A., Rau, A., Marsh, T. R., Steeghs, D., Groot, P. J., and Nelemans, G.(2010). Spectroscopic Evidence for a 5.4 Minute Orbital Period in HM Cancri, ApJL711, pp. L138–L142, doi:10.1088/2041-8205/711/2/L138, eprint 1003.0658.
Rousselet-Perraut, K., Stehle, C., Lanz, T., Le Bouquin, J. B., Boudoyen, T., Kilbinger,M., Kochukhov, O., and Jankov, S. (2004). Stellar activity and magnetism studiedby optical interferometry, A&A 422, pp. 193–203, doi:10.1051/0004-6361:20040151.
Ryde, N., Lambert, J., Farzone, M., Richter, M. J., Josselin, E., Harper, G. M., Eriksson,K., and Greathouse, T. K. (2014). Systematic trend of water vapour absorption inred giant atmospheres revealed by high resolution TEXES 12 micron spectra, ArXive-prints eprint 1410.3999.
Sacuto, S., Aringer, B., Hron, J., Nowotny, W., Paladini, C., Verhoelst, T., and Hofner,S. (2011). Observing and modeling the dynamic atmosphere of the low mass-loss C-star R Sculptoris at high angular resolution, A&A 525, A42, doi:10.1051/0004-6361/200913786, eprint 1010.1350.

March 22, 2017 0:30 World Scientific Book - 9.75in x 6.5in Science˙cases˙visible page 117
Bibliography 117
Sacuto, S., Ramstedt, S., Hofner, S., Olofsson, H., Bladh, S., Eriksson, K., Aringer,B., Klotz, D., and Maercker, M. (2013). The wind of the M-type AGB star ¡AS-TROBJ¿RT Virginis¡/ASTROBJ¿ probed by VLTI/MIDI, A&A 551, A72, doi:10.1051/0004-6361/201220524, eprint 1301.5872.
Sana, H., de Mink, S. E., de Koter, A., Langer, N., Evans, C. J., Gieles, M., Gosset, E.,Izzard, R. G., Le Bouquin, J.-B., and Schneider, F. R. N. (2012). Binary InteractionDominates the Evolution of Massive Stars, Science 337, pp. 444–, doi:10.1126/science.1223344, eprint 1207.6397.
Shulyak, D., Paladini, C., Causi, G. L., Perraut, K., and Kochukhov, O. (2014). Inter-ferometry of chemically peculiar stars: theoretical predictions versus modern ob-serving facilities, MNRAS 443, pp. 1629–1642, doi:10.1093/mnras/stu1259, eprint1406.6093.
Shulyak, D., Sokoloff, D., Kitchatinov, L., and Moss, D. (2015). Towards understanding dy-namo action in M dwarfs, MNRAS 449, pp. 3471–3478, doi:10.1093/mnras/stv585,eprint 1503.04971.
Soubiran, C., Le Campion, J.-F., Cayrel de Strobel, G., and Caillo, A. (2010). ThePASTEL catalogue of stellar parameters, A&A 515, A111, doi:10.1051/0004-6361/201014247, eprint 1004.1069.
Stamford, P. A. and Watson, R. D. (1981). Baade-Wesselink and related techniques formode discrimination in nonradial stellar pulsations, AP&SS 77, pp. 131–158, doi:10.1007/BF00648762.
Stee, P., Delaa, O., Monnier, J. D., Meilland, A., Perraut, K., Mourard, D., Che, X.,Schaefer, G. H., Pedretti, E., Smith, M. A., Lopes de Oliveira, R., Motch, C.,Henry, G. W., Richardson, N. D., Bjorkman, K. S., Bucke, R., Pollmann, E., Zorec,J., Gies, D. R., ten Brummelaar, T., McAlister, H. A., Turner, N. H., Sturmann, J.,Sturmann, L., and Ridgway, S. T. (2012). The relationship between γ Cassiopeiae’sX-ray emission and its circumstellar environment. II. Geometry and kinematics ofthe disk from MIRC and VEGA instruments on the CHARA Array, A&A 545, A59,doi:10.1051/0004-6361/201219234.
Storm, J., Gieren, W., Fouque, P., Barnes, T. G., Pietrzynski, G., Nardetto, N., Weber,M., Granzer, T., and Strassmeier, K. G. (2011a). Calibrating the Cepheid period-luminosity relation from the infrared surface brightness technique. I. The p-factor,the Milky Way relations, and a universal K-band relation, A&A 534, A94, doi:10.1051/0004-6361/201117155, eprint 1109.2017.
Storm, J., Gieren, W., Fouque, P., Barnes, T. G., Soszynski, I., Pietrzynski, G., Nardetto,N., and Queloz, D. (2011b). Calibrating the Cepheid period-luminosity relation fromthe infrared surface brightness technique. II. The effect of metallicity and the distanceto the LMC, A&A 534, A95, doi:10.1051/0004-6361/201117154, eprint 1109.2016.
Theuns, T., Boffin, H. M. J., and Jorissen, A. (1996). Wind accretion in binary stars - II.Accretion rates, MNRAS 280, pp. 1264–1276, eprint astro-ph/9602089.
Thomas, J. D., Witt, A. N., Aufdenberg, J. P., Bjorkman, J. E., Dahlstrom, J. A., Hobbs,L. M., and York, D. G. (2013). Geometry and velocity structure of HD 44179’sbipolar jet, MNRAS , p. 585doi:10.1093/mnras/sts693, eprint 1212.5735.
Torres, G., Andersen, J., and Gimenez, A. (2010). Accurate masses and radii of nor-mal stars: modern results and applications, A&AR 18, pp. 67–126, doi:10.1007/s00159-009-0025-1, eprint 0908.2624.
Tout, C. A. and Eggleton, P. P. (1988). Tidal enhancement by a binary companion ofstellar winds from cool giants, MNRAS 231, pp. 823–831.
Tuthill, P. G., Haniff, C. A., and Baldwin, J. E. (1997). Hotspots on late-type supergiants,MNRAS 285, pp. 529–539.
Urry, C. M. and Padovani, P. (1995). Unified Schemes for Radio-Loud Active GalacticNuclei, PASP 107, p. 803, doi:10.1086/133630, eprint astro-ph/9506063.
Vakili, F. and Percheron, I. (1991). On the Possibility to Detect NRP’s by Optical In-terferometry, in D. Baade (ed.), European Southern Observatory Conference andWorkshop Proceedings, European Southern Observatory Conference and Workshop

March 22, 2017 0:30 World Scientific Book - 9.75in x 6.5in Science˙cases˙visible page 118
118 Science cases for a visible interferometer
Proceedings, Vol. 36, p. 77.van Leeuwen, F. (2007). Validation of the new Hipparcos reduction, A&A 474, pp. 653–
664, doi:10.1051/0004-6361:20078357, eprint 0708.1752.van Leeuwen, F., Feast, M. W., Whitelock, P. A., and Laney, C. D. (2007). Cepheid paral-
laxes and the Hubble constant, MNRAS 379, pp. 723–737, doi:10.1111/j.1365-2966.2007.11972.x, eprint 0705.1592.
VandenBerg, D. A., Bond, H. E., Nelan, E. P., Nissen, P. E., Schaefer, G. H., and Harmer,D. (2014). Three Ancient Halo Subgiants: Precise Parallaxes, Compositions, Ages,and Implications for Globular Clusters, ApJ 792, 110, doi:10.1088/0004-637X/792/2/110, eprint 1407.7591.
von Zeipel, H. (1924). The radiative equilibrium of a rotating system of gaseous masses,MNRAS 84, pp. 665–683.
Vural, J., Kraus, S., Kreplin, A., Weigelt, G., Fossat, E., Massi, F., Perraut, K., and Vakili,F. (2014). Study of the sub-AU disk of the Herbig B[e] star HD 85567 with near-infrared interferometry, A&A 569, A25, doi:10.1051/0004-6361/201424214, eprint1407.8190.
Wang, Y., Weigelt, G., Kreplin, A., Hofmann, K.-H., Kraus, S., Miroshnichenko, A. S.,Schertl, D., Chelli, A., Domiciano de Souza, A., Massi, F., and Robbe-Dubois, S.(2012). AMBER/VLTI observations of the B[e] star MWC 300, A&A 545, L10,doi:10.1051/0004-6361/201219800, eprint 1208.5882.
Wheelwright, H. E., de Wit, W. J., Oudmaijer, R. D., and Vink, J. S. (2012a).VLTI/AMBER observations of the binary B[e] supergiant HD 327083, A&A 538,A6, doi:10.1051/0004-6361/201117766, eprint 1201.2866.
Wheelwright, H. E., de Wit, W. J., Weigelt, G., Oudmaijer, R. D., and Ilee, J. D. (2012b).AMBER and CRIRES observations of the binary sgB[e] star HD 327083: evidenceof a gaseous disc traced by CO bandhead emission, A&A 543, A77, doi:10.1051/0004-6361/201219325, eprint 1206.6252.
Wheelwright, H. E., Weigelt, G., Caratti o Garatti, A., and Garcia Lopez, R. (2013).HD 85567: A Herbig B[e] star or an interacting B[e] binary?. Resolving HD 85567’scircumstellar environment with the VLTI and AMBER, A&A 558, A116, doi:10.1051/0004-6361/201322128, eprint 1308.6000.
White, T. R., Huber, D., Maestro, V., Bedding, T. R., Ireland, M. J., Baron, F., Boyajian,T. S., Che, X., Monnier, J. D., Pope, B. J. S., Roettenbacher, R. M., Stello, D.,Tuthill, P. G., Farrington, C. D., Goldfinger, P. J., McAlister, H. A., Schaefer,G. H., Sturmann, J., Sturmann, L., ten Brummelaar, T. A., and Turner, N. H.(2013). Interferometric radii of bright Kepler stars with the CHARA Array: θ Cygniand 16 Cygni A and B, MNRAS 433, pp. 1262–1270, doi:10.1093/mnras/stt802,eprint 1305.1934.
Wilson, R. W., Baldwin, J. E., Buscher, D. F., and Warner, P. J. (1992). High-resolutionimaging of Betelgeuse and Mira, MNRAS 257, pp. 369–376.
Wilson, R. W., Dhillon, V. S., and Haniff, C. A. (1997). The changing face of Betelgeuse,MNRAS 291, p. 819.
Wilson, W. J. F., Milone, E. F., and Fry, D. J. I. (1993). Studies of large-amplitudeDelta Scuti variables. I - A case study of EH Librae, PASP 105, pp. 809–820, doi:10.1086/133237.
Wilson, W. J. F., Milone, E. F., Fry, D. J. I., and van Leeuwen, J. (1998). Studies ofLarge-Amplitude delta Scuti Variables. III. DY Pegasi, PASP 110, pp. 433–450,doi:10.1086/316148.
Wittkowski, M., Scholler, M., Hubrig, S., Posselt, B., and von der Luhe, O. (2002). Measur-ing starspots on magnetically active stars with the VLTI, Astronomische Nachrichten323, pp. 241–250, doi:10.1002/1521-3994(200208)323:3/4〈241::AID-ASNA241〉3.0.CO;2-D, eprint astro-ph/0206090.
Yadav, R. K., Gastine, T., Christensen, U. R., and Reiners, A. (2015). Formation ofstarspots in self-consistent global dynamo models: Polar spots on cool stars, A&A573, A68, doi:10.1051/0004-6361/201424589, eprint 1407.3187.

March 22, 2017 0:30 World Scientific Book - 9.75in x 6.5in Science˙cases˙visible page 119
Bibliography 119
Young, J. S., Baldwin, J. E., Boysen, R. C., Haniff, C. A., Lawson, P. R., Mackay, C. D.,Pearson, D., Rogers, J., St.-Jacques, D., Warner, P. J., Wilson, D. M. A., andWilson, R. W. (2000). New views of Betelgeuse: multi-wavelength surface imagingand implications for models of hotspot generation, MNRAS 315, pp. 635–645.
Zhao, M., Monnier, J. D., Pedretti, E., Thureau, N., Merand, A., ten Brummelaar, T.,McAlister, H., Ridgway, S. T., Turner, N., Sturmann, J., Sturmann, L., Goldfinger,P. J., and Farrington, C. (2009). Imaging and Modeling Rapidly Rotating Stars: αCephei and α Ophiuchi, ApJ 701, pp. 209–224, doi:10.1088/0004-637X/701/1/209,eprint 0906.2241.
Zickgraf, F.-J., Wolf, B., Stahl, O., Leitherer, C., and Klare, G. (1985). The hybrid spec-trum of the LMC hypergiant R126, A&A 143, pp. 421–430.