science highlights finding hidden supermassive black … · 2 noao newsletter september 2011...
TRANSCRIPT

2 NOAO Newsletter September 2011
Science Highlights
Finding Hidden Supermassive Black Holes in Distant GalaxiesStéphanie Juneau (University of Arizona)
Stéphanie Juneau and collaborators Mark Dickinson (NOAO), David M. Alexander (Durham University), and Samir Salim (Indiana University) have developed a new method to identify
a population of active galactic nuclei (AGN) that had been missed in earlier surveys of distant galaxies. Their observations find AGN that have X-ray emission too faint to be securely identified in even the most sensitive X-ray surveys to date. Of particular interest, their approach has identified a sample of “Compton-thick” AGN candidates at the extreme end of X-ray obscuration. A key part of their program is based on observations obtained at the KPNO Mayall 4-m telescope with Mosaic and the Florida Multi-Object Imaging Near-Infrared Grism Observational Spectrometer (FLAMINGOS).
The heart of the program undertaken by Juneau and collaborators was the development of a Mass-Excitation (MEx) diagnostic diagram, which is a modification of a well-understood diagnostic that used emission lines to determine the excitation conditions of ionized atomic gas in galactic nuclei. Key observations included photometry over a broad range of wavelengths and optical spectra to measure the [O III]λ5007 and Hβ emission lines. U, J, and Ks band photometry obtained with Mosaic and FLAMINGOS played a crucial role in determining the stellar masses of the distant galaxies hosting the AGN. The galaxy sample was provided by the Great Observatories Origins Deep Survey North (GOODS-N) program, and spectra were obtained with the Keck Deep Imaging Multi-Object Spectrograph (DEIMOS) instrument.
It is known that most if not all galaxies harbor a supermassive black hole in their center. Whether the observed correlations between black-hole mass and host galaxy properties (such as stellar velocity dispersion) result from a true causal relationship remains a topic of debate. If so, then black holes regulate galaxy growth or vice versa. The answer is unclear because we lack a complete census of black holes that are actively growing by accreting gas in the nucleus of their host galaxies. There is clear evidence for a missing population of such active black holes, a large number of which are suspected to lie at redshifts 0.5 < z < 1 when the Universe was half to two-thirds of its current age. Identifying these hidden AGN is important to complete the galaxy evolution picture.
The original “Baldwin, Phillips & Terlevich” (BPT) diagram (Baldwin et al. 1981), which was used to calibrate the MEx diagram, probes gas metallicity and ionization parameters, distinguishing gas that is excited by newly formed stars from that excited by the more energetic photons produced around the accretion disks surrounding the supermassive black hole in an AGN. The [N II]λ6584 and Hα emission lines used in the BPT diagram are redshifted beyond the optical band at z > 0.4. These lines were replaced with stellar mass, allowing the new diagnostic to be applied out to z ~ 1, thus reaching much more distant galaxies (Figure 1).
The MEx diagnostic diagram includes a novel approach to galaxy classification based on the probability that a given [O III]λ5007/Hβ ratio and stellar mass is associated with a galaxy hosting an AGN. Setting the threshold of P(AGN) > 30% was necessary to identify the majority of the X-ray faint black holes, suggesting that some of the galaxies containing obscured AGN have both star formation and a hidden black hole. (The combination of the two processes results in a more ambiguous AGN signal because of dilution with star-formation, thus a lower AGN
probability. A probabilistic approach is more useful than a “clear-cut” method to identify such composite galaxies.)
X-ray obscuration was inferred by comparing the observed X-ray signal (luminosity at energies 2–10 keV) to the total signal from gas ionized
Figure 1: (top) Mass-Excitation (MEx) diagram to identify the presence of AGN in galaxies out to z ~ 1. The probability that an AGN is present, P(AGN), is indicated with the color bar and in-creases toward higher values of [O III]λ5007/Hβ and stellar mass. (bottom) The BPT diagnostic is traditionally used to identify the presence of AGN. It was generated to calibrate the MEx diagram using >100,000 galaxies from the Sloan Digital Sky Survey (density contours shown here).
continued
NOAO Newsletter September 2011 3
Science Highlights
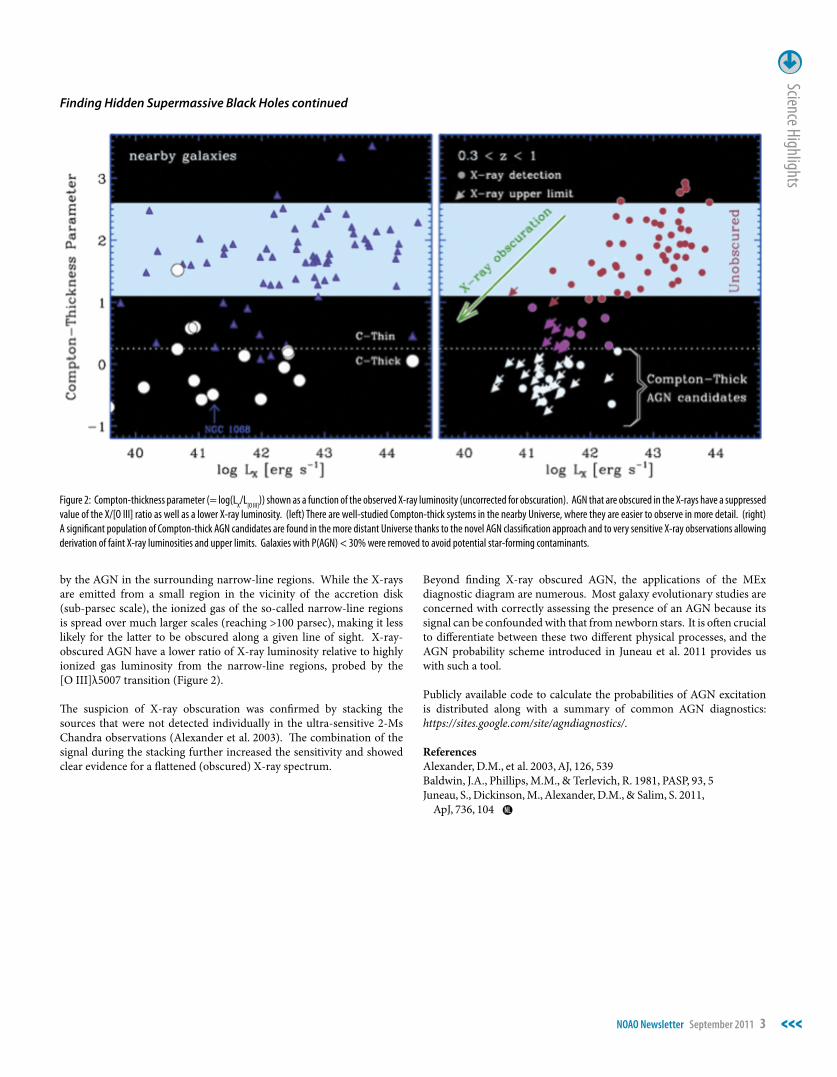
by the AGN in the surrounding narrow-line regions. While the X-rays are emitted from a small region in the vicinity of the accretion disk (sub-parsec scale), the ionized gas of the so-called narrow-line regions is spread over much larger scales (reaching >100 parsec), making it less likely for the latter to be obscured along a given line of sight. X-ray-obscured AGN have a lower ratio of X-ray luminosity relative to highly ionized gas luminosity from the narrow-line regions, probed by the [O III]λ5007 transition (Figure 2).
The suspicion of X-ray obscuration was confirmed by stacking the sources that were not detected individually in the ultra-sensitive 2-Ms Chandra observations (Alexander et al. 2003). The combination of the signal during the stacking further increased the sensitivity and showed clear evidence for a flattened (obscured) X-ray spectrum.
Finding Hidden Supermassive Black Holes continued
Figure 2: Compton-thickness parameter (= log(LX/L[O III])) shown as a function of the observed X-ray luminosity (uncorrected for obscuration). AGN that are obscured in the X-rays have a suppressed value of the X/[O III] ratio as well as a lower X-ray luminosity. (left) There are well-studied Compton-thick systems in the nearby Universe, where they are easier to observe in more detail. (right) A significant population of Compton-thick AGN candidates are found in the more distant Universe thanks to the novel AGN classification approach and to very sensitive X-ray observations allowing derivation of faint X-ray luminosities and upper limits. Galaxies with P(AGN) < 30% were removed to avoid potential star-forming contaminants.
Beyond finding X-ray obscured AGN, the applications of the MEx diagnostic diagram are numerous. Most galaxy evolutionary studies are concerned with correctly assessing the presence of an AGN because its signal can be confounded with that from newborn stars. It is often crucial to differentiate between these two different physical processes, and the AGN probability scheme introduced in Juneau et al. 2011 provides us with such a tool.
Publicly available code to calculate the probabilities of AGN excitation is distributed along with a summary of common AGN diagnostics: https://sites.google.com/site/agndiagnostics/.
ReferencesAlexander, D.M., et al. 2003, AJ, 126, 539Baldwin, J.A., Phillips, M.M., & Terlevich, R. 1981, PASP, 93, 5Juneau, S., Dickinson, M., Alexander, D.M., & Salim, S. 2011, ApJ, 736, 104 NL

4 NOAO Newsletter September 2011
Scien
ce H
ighlig
hts
Star Formation Rises with Time in UV-Bright Galaxies over the First Two Billion YearsKyoung-Soo Lee (Yale University)
Kyoung-Soo Lee and a team of collaborators that includes Arjun Dey (NOAO), Buell Jannuzi (NOAO), Naveen Reddy (NOAO), and Anthony Gonzalez (University of Florida) used broadband
imagery obtained by the NOAO Deep Wide-Field Survey (NDWFS) and the Infrared Boötes Imaging Survey (IBIS) to measure the rate of star formation in a sample of young galaxies in the early Universe. Using the strength of ultraviolet (UV) emission of the galaxies as a proxy for intensity of star formation, they conclude that the star formation rate in the galaxies is actually rising smoothly with time as the Universe ages. This result is important for understanding the mass growth and evolution of galaxies at early times.
The average star formation history (SFH) constrains how galaxies assembled their mass over cosmic time, and thus is of fundamental importance to the theory of galaxy formation. While significant progress has been made in characterizing some of the general physical properties of the high-redshift galaxy population, major questions remain about the details of how these galaxies form their stars. We do not know yet whether their SFH is dominated by a series of short but intense bursts, perhaps driven by major mergers, or a long continuous accretion of gas converted into stars. Putting constraints on the SFH of galaxies also demonstrates how much fuel is available for star formation, and hence their gas accretion history (Papovich et al. 2011). Such uncertainties pose challenges in our understanding of the evolutionary sequence of galaxies observed at different cosmic epochs and can lead to large systematic bias in stellar population parameters (e.g., ages and stellar mass, Maraston et al. 2010).
To improve our understanding of the SFH of young galaxies, Lee and collaborators studied the average physical properties of the most UV-luminous galaxies at z ~ 4. Their hypothesis was that if star formation is a smooth function of time, the observed star formation rates (SFRs) should correlate strongly with the existing stellar mass in these galaxies. Conversely, if galaxies grow mainly via intense starbursts, the same correlation would be much weaker or non-existent. Naturally, the most UV-luminous (and thus most actively star-forming) galaxies provide the best candidates to test these scenarios as intense starbursts imply high star formation rates. The sample was selected in the optical (BW, R, I) data of the NDWFS (Jannuzi & Dey 1999), sampling the rest-frame far-ultraviolet portion of the galaxy spectra. The galaxy sample, containing 1,906 galaxies in total, is then sorted according to their UV luminosity (I-band magnitude as proxy, which samples the rest-frame ~1700 Å), and the average spectral energy distribution is measured by combining the multi-wavelength data in the Boötes field. These include the IBIS data (J, H, and KS) taken with the NEWFIRM wide-field infrared imager on the Kitt Peak National Observatory, Spitzer Deep Wide-Field Survey data (3.6 μm, 4.5 μm, 5.8 μm, and 8 μm), and the Large Binocular Telescope U-band data. The combination of these data sets provides a wide wavelength baseline (out to the rest-frame 2 μm) to robustly determine the stellar population properties such as age, stellar mass, star formation rates (SFRs), and the amount of internal dust.
Figure 1 summarizes the main results. The average spectra of galaxies in six UV luminosity bins appear remarkably similar to one another except the overall normalization. In other words, more UV-luminous galaxies are, on average, also more luminous at longer wavelengths. Furthermore, galaxies in all UV bins have a relatively weak Balmer break (at ~4000 Å), which is an age indicator. When stellar population models are used to derive the average physical properties based on these stacked spectra, the physical implications are: (1) star formation rates (SFRs) scale closely with stellar mass and that more UV-luminous galaxies are also more massive, and (2) the median ages of the stellar populations are relatively young (<0.4 billion years) and show little correlation with UV luminosity (Figure 2). Intriguingly, the two main implications are at odds with each other as the former (the tight correlation between SFR and stellar mass) suggests that these galaxies have been assembling their mass smoothly over a long time while the latter implies that these galaxies started to form at the tail end of the time window of their sample (zform = 4.2–4.5). Furthermore, Lee et al. (2011) argued that the only way to explain both phenomena using conventional SFHs, in which SFR either declines exponentially with time or remains constant, is by assuming a synchronized formation epoch for all the observed galaxies at z = 4.2–4.5. Such a scenario is unphysical not only because z = 4.2 is an arbitrary number of no particular significance, but also because it contradicts itself by further requiring that star formation in all galaxies at higher redshift (z > 4.5) must be turned off before the new epoch of synchronized formation begins (hence, star formation is not so continuous after all!). Lee and collaborators proposed that the average SFH of these galaxies rises with cosmic time on the contrary to the conventional assumptions.
Figure 1: The image illustrates the average spectral energy distributions of star-forming galaxies at z ~ 3.7 at different UV luminosities. More UV-luminous galaxies are on average also more luminous at longer wavelengths. (Lee et al. 2011, reproduced by permission of AAS.)
continued

NOAO Newsletter September 2011 5
Science Highlights
They argued that a smoothly rising SFH provides a more natural solution to explain the two main observations. The tight SFR-M
correlation
is preserved because all galaxies form smoothly over time, while the population ages appear young at all epochs because galaxies are always dominated by recently formed stars (Lee et al. 2011).
A rising SFH has interesting implications for the fate of these UV-luminous galaxies (also see Renzini 2009, Papovich et al. 2011). If the SFRs of these galaxies rise at the current rates, these galaxies will double their mass every 300 million years. This means that galaxies with stellar mass 1010 M
will grow into 2.5 × 10¹¹ M
by z = 2 (1.5 billion years
later). It is not clear if such growth in the SFR is sustainable either by the fuel supply within a galaxy or by the physical mechanisms of star formation. More detailed studies of individual galaxies can shed light on the gas content and fueling of star formation and the feedback processes (due to activity from accretion into a nuclear black hole), which may play an important role in shutting down the star formation.
ReferencesJannuzi, B.T. & Dey, A. 1999, Astronomical Society of the Pacific Conference Series, 111Lee, K.S., et al. 2011, ApJ, 733, 99Maraston, C., et al. 2010, MNRAS, 407, 830 (arXiv:1004.4546)Papovich, C., Finkelstein, S.L., Ferguson, H.C., Lotz, J.M., & Giavalisco, M. 2011, MNRAS, 412, 1123Renzini, A. 2009, MNRAS, 398, L58
Star Formation Rises with Time in UV-Bright Galaxies continued
Figure 2: The population synthesis modeling indicates that star formation rates scale closely with stellar mass, and the median ages of the stellar populations are relatively young (< 400 million years) at all luminosities. The combination of this observation with that illustrated by Figure 1 can be explained naturally only by a rising star formation history. (Lee et al. 2011, reproduced by permission of AAS.)
Gemini/GMOS—Spectroscopy of a Large Sampleof Strong Lensing Selected Galaxy ClustersMatthew Bayliss (University of Chicago)
Matthew Bayliss and collaborators Michael Gladders (Universi-ty of Chicago), Joseph Hennawi (Max-Planck Institute for As-tronomy), and Masamune Oguri (IMPU/University of Tokyo)
used the Gemini Multi Object Spectrograph (GMOS) at Gemini North to study 26 strong-lensing galaxy clusters. The clusters are the largest virialized structures in the Universe and serve as natural telescopes for zooming in on the distant Universe to depths that are inaccessible to field surveys. The masses of the clusters measured from the spectros-copy are in agreement with simulations that predict the properties of strong-lensing clusters, while the redshift distribution of the background galaxies that are “lensed” into arcs appears to resolve a conflict between observations and theory on the expected prevalence of the arcs.
Strong gravitational lensing in the cores of galaxy clusters is sensitive to the dark matter structure of galaxy clusters and encodes informa-tion about the mass of the cluster lenses (e.g., Broadhurst et al. 2000, Sand et al. 2002), while the statistics of background galaxies that are strongly lensed into bright giant arcs can provide an independent test of cosmological structure models (e. g., Bartelmann et al. 1998, Oguri
et al. 2003). Additionally, the strongly lensed galaxies themselves are excellent laboratories for studying galaxy structure and evolution at z > 1, with a signal-to-noise ratio that is dramatically boosted by the lens magnification (e.g., Pettini et al. 2000, Siana et al. 2009).
However, galaxy clusters exhibiting strong lensing are extremely rare, and the small number of known systems has limited their practical value. Bayliss and collaborators have worked with other groups in the US and abroad to address the persistent lack of a large, well-selected sample of galaxy cluster strong lenses. Together they have defined a sample of sev-eral hundred cluster lenses by systematically searching two large imag-ing surveys, the Sloan Digital Sky Survey (SDSS) (Hennawi et al. 2008, Bayliss et al. 2011) and Red Sequence Cluster Survey 2 (RCS2) (Wuyts et al. 2010). These two samples will ultimately provide a catalog of gi-ant arcs that will nail down the absolute abundance of giant arcs on the observational side (examples of giant arcs identified in three clusters are shown in Figure 1). A catalog of hundreds of arcs will also be useful for testing higher-order giant arc statistics, such as the distribution of azi-muthal angular separations between giant arcs on the sky and the major
continued
NL
6 NOAO Newsletter September 2011
Scien
ce H
ighlig
hts
axes of the foreground lenses, which is a clean, direct probe of the average shape of the projected two-dimensional density profile in the cores of lensing clusters (Dalal et al. 2004, Rozo et al. 2008).
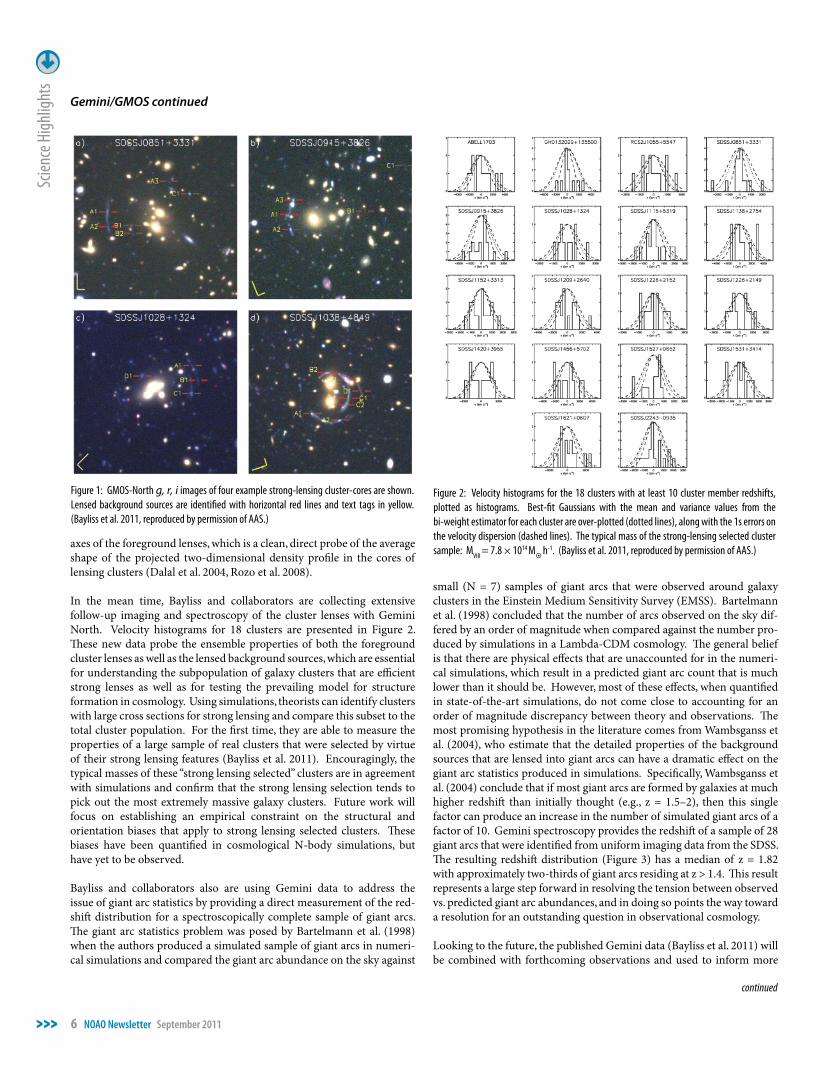
In the mean time, Bayliss and collaborators are collecting extensive follow-up imaging and spectroscopy of the cluster lenses with Gemini North. Velocity histograms for 18 clusters are presented in Figure 2. These new data probe the ensemble properties of both the foreground cluster lenses as well as the lensed background sources, which are essential for understanding the subpopulation of galaxy clusters that are efficient strong lenses as well as for testing the prevailing model for structure formation in cosmology. Using simulations, theorists can identify clusters with large cross sections for strong lensing and compare this subset to the total cluster population. For the first time, they are able to measure the properties of a large sample of real clusters that were selected by virtue of their strong lensing features (Bayliss et al. 2011). Encouragingly, the typical masses of these “strong lensing selected” clusters are in agreement with simulations and confirm that the strong lensing selection tends to pick out the most extremely massive galaxy clusters. Future work will focus on establishing an empirical constraint on the structural and orientation biases that apply to strong lensing selected clusters. These biases have been quantified in cosmological N-body simulations, but have yet to be observed.
Bayliss and collaborators also are using Gemini data to address the issue of giant arc statistics by providing a direct measurement of the red-shift distribution for a spectroscopically complete sample of giant arcs. The giant arc statistics problem was posed by Bartelmann et al. (1998) when the authors produced a simulated sample of giant arcs in numeri-cal simulations and compared the giant arc abundance on the sky against
small (N = 7) samples of giant arcs that were observed around galaxy clusters in the Einstein Medium Sensitivity Survey (EMSS). Bartelmann et al. (1998) concluded that the number of arcs observed on the sky dif-fered by an order of magnitude when compared against the number pro-duced by simulations in a Lambda-CDM cosmology. The general belief is that there are physical effects that are unaccounted for in the numeri-cal simulations, which result in a predicted giant arc count that is much lower than it should be. However, most of these effects, when quantified in state-of-the-art simulations, do not come close to accounting for an order of magnitude discrepancy between theory and observations. The most promising hypothesis in the literature comes from Wambsganss et al. (2004), who estimate that the detailed properties of the background sources that are lensed into giant arcs can have a dramatic effect on the giant arc statistics produced in simulations. Specifically, Wambsganss et al. (2004) conclude that if most giant arcs are formed by galaxies at much higher redshift than initially thought (e.g., z = 1.5–2), then this single factor can produce an increase in the number of simulated giant arcs of a factor of 10. Gemini spectroscopy provides the redshift of a sample of 28 giant arcs that were identified from uniform imaging data from the SDSS. The resulting redshift distribution (Figure 3) has a median of z = 1.82 with approximately two-thirds of giant arcs residing at z > 1.4. This result represents a large step forward in resolving the tension between observed vs. predicted giant arc abundances, and in doing so points the way toward a resolution for an outstanding question in observational cosmology.
Looking to the future, the published Gemini data (Bayliss et al. 2011) will be combined with forthcoming observations and used to inform more
Gemini/GMOS continued
Figure 2: Velocity histograms for the 18 clusters with at least 10 cluster member redshifts, plotted as histograms. Best-fit Gaussians with the mean and variance values from the bi-weight estimator for each cluster are over-plotted (dotted lines), along with the 1s errors on the velocity dispersion (dashed lines). The typical mass of the strong-lensing selected cluster sample: MVIR = 7.8 × 10¹⁴ M
h-1. (Bayliss et al. 2011, reproduced by permission of AAS.)
Figure 1: GMOS-North g, r, i images of four example strong-lensing cluster-cores are shown. Lensed background sources are identified with horizontal red lines and text tags in yellow. (Bayliss et al. 2011, reproduced by permission of AAS.)
continued

NOAO Newsletter September 2011 7
Science Highlights
Gemini/GMOS continued
complex analyses, such as strong lens mass reconstruction. The Gemini-observed sample of strong lenses have data either planned or in-hand that will enable dynamical, Sunyaev-Zel’dovich (SZ), and weak lensing measurements of the cluster lenses, and these data will be used to test detailed predictions for cluster profile structure with a sample size of 30+. Strong lensing provides precise constraints on the mass in the cores of clusters, which, when combined with other virial-scale mass measure-ments, can be used to populate the mass-concentration relation for clus-ters. First results from these analyses have been published (e.g., Oguri et al. 2009, Gralla et al. 2011), and tests using larger samples are in progress (Oguri et al. 2011 in preparation).
ReferencesBartelmann, M., et al. 1998, A&A, 330, 1Bayliss, M.B., et al. 2011, ApJS, 193, 8Bayliss, M.B., et al. 2011b, ApJL, 727, L26Broadhurst, T., Huang, X., Frye, B., & Ellis, R. 2000, ApJL, 534, 15Dalal, N., Holder, G., & Hennawi, J.F. 2004, ApJ, 609, 50Gralla, M.B., et al. 2011, ArXiv: astro-ph/1011.6341Hennawi, J.F., et al. 2008, AJ, 135, 664Oguri, M., Lee., J., & Suto, Y. 2003, ApJ, 599, 7Oguri, M., et al. 2009, ApJ, 699, 1038Pettini, M., Steidel, C.C., Adelberger, K.L., Dickinson, M., & Giavalisco, M. 2000, ApJ, 528, 96Rozo, E., Nagai, D., Keeton, C., & Kravtsov, A. 2008, ApJ, 687, 22Sand, D.J., Treu, T., & Ellis, R.S., 2002, ApJL, 574, 129 Siana, B., et al. 2009, ApJ, 698, 1273Wambsganss, J., Bode, P., & Ostriker, J. 2004, ApJL, 606, 93Wuyts, E., et al. 2010, ApJ, 724, 1182
Figure 3: The distribution of redshifts for the primary giant arc sample. Arcs with redshift desert constraints are plotted as horizontal error bars indicating the upper and lower redshift limits for each. This primary giant arc sample constitutes the first spectroscopically complete giant arc sample ever measured. Kolmogorov-Smirnov tests confirm that the distribution can be described by physically motivated models (e.g., the dashed curve). (Bayliss, M. B. et al. 2011b, reproduced by permission of AAS.)
continued
Late-Time Light Curves of Type II Supernovae: Physical Properties of SNe and Their EnvironmentMasaaki Otsuka (Space Telescope Science Institute)
Masaaki Otsuka and a team of collaborators that includes, Margaret Meixner and Nino Panagia (STScI), Joanna Fabbri and Michael J. Barlow (University College London), Geoffrey
C. Clayton (Louisiana State University), Joseph S. Gallagher (Raymond Walters College), Ben E. K. Sugerman (Goucher College), Roger Wesson (UCL), Jennifer E. Andrews (LSU), Barbara Ercolano (Universitäts-Sternwarte München), and Douglas Welch (McMaster University) used the WIYN High-Resolution Infrared Camera (WHIRC) at WIYN and the Near-Infrared Imager (NIRI) and Gemini Multi Object Spectrograph (GMOS) at Gemini to observe the formation of dust in Type II Supernovae (SNe). The goal is to understand the role of SNe in generating dust in galaxies, particularly at high redshift where other dust formation mechanisms may be ineffective.
The origin of dust in high-redshift galaxies has been hotly debated since Bertoldi et al. (2003) discovered large amounts of dust (~4 × 10⁸ M
) in
the quasi-stellar object (QSO) J1148+5251 (z = 6.4). Core-collapse SNe such as Type II SNe and asymptotic giant branch (AGB) stars are the main dust producers (Gehrz et al. 1989) at the present epoch in our Galaxy. AGB stars are not likely to contribute significantly to dust production in young galaxies, however. Such low-mass stars evolve too slowly toward the AGB phase to produce dust within 1 Gyr. For example, ~1 M
stars
with solar metallicity take ~10 Gyr to evolve into thermally pulsing (TP) AGB. If the initial mass is ~5 M
, these stars can evolve into TP AGB
and might be able to be the main dust producers in young galaxies within ~1 Gyr (Valiante et al. 2009). However, massive stars can evolve into Type II SNe in time spans under 20 Myr. Theoretical interstellar medium
NL

8 NOAO Newsletter September 2011
Scien
ce H
ighlig
hts
(ISM) dust models by Dwek & Cherchneff (2011) predict that an average 20 M
(initial mass) SN has to make at least ~0.1–1 M
of dust to be a
viable source for the dust found in the QSO J1148+5251.
Since the discovery of SN 1987A, dust masses have been estimated in the ejecta of a handful of Type II SNe. However, there is large discrepancy between the model predictions and observations (from several × 10-4 to 0.02 M
). The import of dust formation in Type II SNe ejecta is still
unclear due to the paucity of observations. To properly assess dust formation by Type II SNe ejecta, it is essential to continue monitoring Type II SNe before and after dust formation started (i.e., day ~300, e.g., Kozasa et al. 2009), because other physical properties such as the nickel mass (56Ni) and light echoes from circumstellar and interstellar dust can be measured and disentangled from dust production effects. The early epoch evolution of Type II SNe before day ~300 has been relatively well studied. However at present, the evolution beyond day 300 has been poorly measured. Therefore, to improve the current situation, Otsuka and collaborators have been monitoring Type II SNe mainly using the near-infrared (IR) high-angular resolution camera WHIRC (Meixner et al. 2010) mounted to the WIYN 3.5-m telescope; the Gemini/NIRI/GMOS; and the Wide Field Planetary Camera 2 (WFPC2), Advanced Camera for Surveys, and Near Infrared Camera and Multi-Object Spectrometer (NICMOS) on the Hubble Space Telescope.
Thanks to these instruments, excellent seeing, and stable sky conditions, Otsuka and collaborators were successful in detecting the light from the SNe alone and in measuring magnitudes with less contamination from nearby stars. Combining their data with previously published data, they examined light curves at VRIJHK-bands and measured the rate of fading of SNe, γ, during four phases, namely, days ~30–100 (plateau phase), ~150–300 (radioactive decay phase), ~300–800 (dust forming phase), and >800. The J-band light curves is shown in Figure 1. Theses light curves are based on the collaboration data (filled circles) and data from the literature for each object (open circles). The data after
>600–1000 days are mainly from the former, and the data before this phase are mainly from the latter. The values in Figure 1 are de-reddened absolute magnitudes. As references, the light curves of SNe 1987A (Hamuy & Suntzeff 1990, Walker & Suntzeff 1991) and 1999em (Elmhamdi et al. 2003) are plotted, which are well-studied Type II SNe. In the WHIRC observations for SN 2002hh in the starburst galaxy NGC 6946, data for SN 2008S (e.g., Wesson et al. 2010) was obtained as well (Figure 2). SN 2008S is regarded as an SN impostor. The JHK-band light curves show that SN 2008S is quite different from Type II SNe: for example, there is no plateau phase and no clear level-off around day ~100. The SN 2008S may have evolved from a 6–8 M
AGB star and been formed not by
Fe-core collapse but by O-Ne-Mg core collapse by electron capture during the AGB phase (Botticella et al. 2009).
Light echoes, which may appear as flattening or increasing fluxes in the light curve, could arise during any of these phases depending on the location of the scattering material with respect to the SNe. The SNe 2002hh, 2003gd, 2004et, and 2006bc would have light echoes. The light curves of Type II SNe during the radioactive decay phase are powered by γ-rays generated from the radioactive decay of 56Co to 56Fe, at a rate corresponding to the e-folding lifetime of the 56Co decay (t56 = 111.3 days). The expected decay rate at V, γV, is 0.96 ±0.12 of t56 (Patat et al. 1994). The estimated γVRI except for SNe 2002hh and 2005cs are in good agreements with Patat et al. (1994). Two SNe might have additional power sources in this phase. Analysis shows that γJHK are ~1–1.4 for all objects. Beyond ~300 days, the fading rates are steeper than the 56Co decay, because the opacity to γ-rays is decreased and dust starts forming. This supports SN dust formation theory.
The light echo density around SN 2002hh (nH ~ 400 cm–3) is higher than a typical ISM density. This hydrogen density is closer to relatively dense
Late-Time Light Curves of Type II Supernovae continued
Figure 1: J-Band light curves of Type II SNe and an imposter SN 2008S on a de-reddened absolute magnitude scale. The open circles are from published papers, and the filled circles indicate our contributions. The broken lines are from published SN 1987A data.
Figure 2: WHIRC view of the SNe 2002hh and 2008S field in the H-band. The positions of SNe 2002hh and 2008S are indicated by the white tick marks. A close-up image of SN 2002hh is presented in the inner box (2 arcsec × 2 arcsec). This image was taken in a 2008 observing run.
continued
NOAO Newsletter September 2011 9
Science Highlights
gas density in such H II regions than that in interstellar space. Welch et al. (2007) suggests that most of the Spitzer mid-IR flux may have come from dust in the star formation region associated with the SN 2002hh precursor. In the case of SN 2004et, which has the light echo and is a member of NGC 6946, the apparent radius of the SN is ~0.1˝. For an adopted 0.1˝ radius in aperture photometry for SN 2002hh and a constraint that the inner radius of light echo is >0.1˝, approximately 80% of the total flux is from the light echo as of day 1717 (based on HST/WFPC2 observations). The interstellar density around the other SNe is 1–70 cm–3.
Estimated 56Ni masses (0.8–14 × 10-2 M
) were derived by comparing the SNe bolometric luminosity with SN 1987A (0.073 ±0.015 M
;
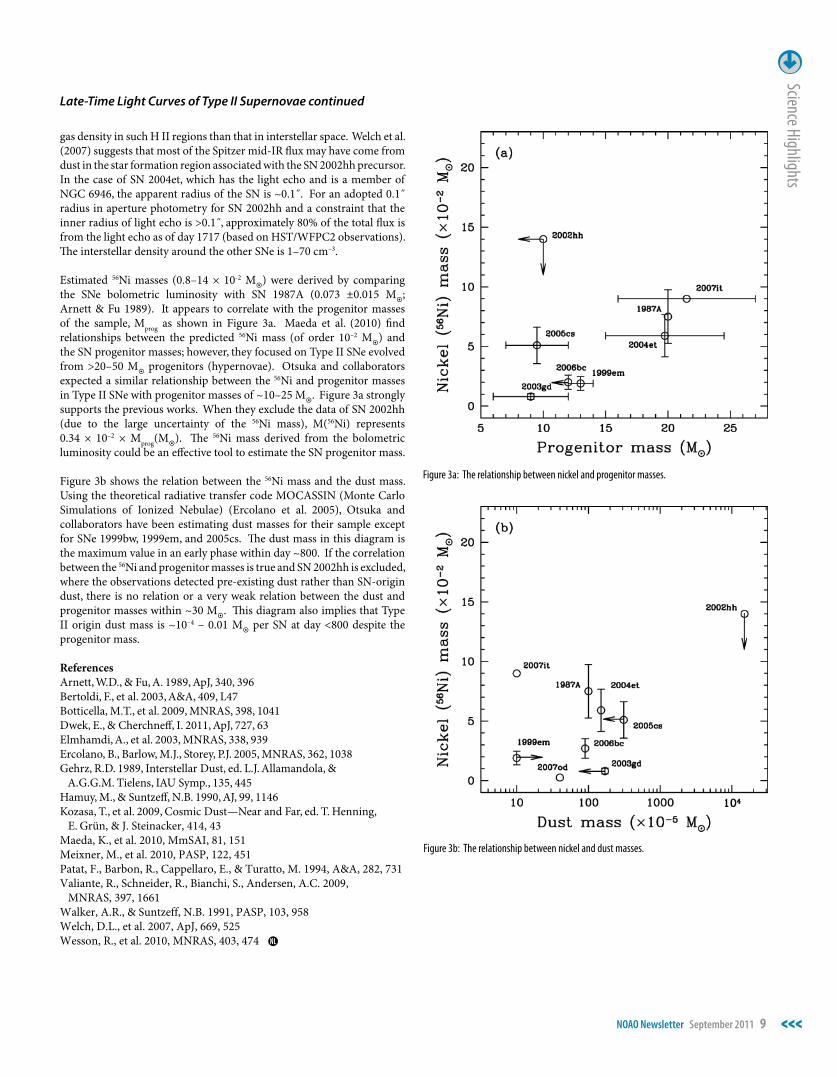
Arnett & Fu 1989). It appears to correlate with the progenitor masses of the sample, Mprog as shown in Figure 3a. Maeda et al. (2010) find relationships between the predicted 56Ni mass (of order 10–2 M
) and
the SN progenitor masses; however, they focused on Type II SNe evolved from >20–50 M
progenitors (hypernovae). Otsuka and collaborators
expected a similar relationship between the 56Ni and progenitor masses in Type II SNe with progenitor masses of ~10–25 M
. Figure 3a strongly
supports the previous works. When they exclude the data of SN 2002hh (due to the large uncertainty of the 56Ni mass), M(56Ni) represents 0.34 × 10⁻² × Mprog(M
). The 56Ni mass derived from the bolometric
luminosity could be an effective tool to estimate the SN progenitor mass.
Figure 3b shows the relation between the 56Ni mass and the dust mass. Using the theoretical radiative transfer code MOCASSIN (Monte Carlo Simulations of Ionized Nebulae) (Ercolano et al. 2005), Otsuka and collaborators have been estimating dust masses for their sample except for SNe 1999bw, 1999em, and 2005cs. The dust mass in this diagram is the maximum value in an early phase within day ~800. If the correlation between the 56Ni and progenitor masses is true and SN 2002hh is excluded, where the observations detected pre-existing dust rather than SN-origin dust, there is no relation or a very weak relation between the dust and progenitor masses within ~30 M
. This diagram also implies that Type
II origin dust mass is ~10–4 – 0.01 M
per SN at day <800 despite the progenitor mass.
ReferencesArnett, W.D., & Fu, A. 1989, ApJ, 340, 396 Bertoldi, F., et al. 2003, A&A, 409, L47Botticella, M.T., et al. 2009, MNRAS, 398, 1041 Dwek, E., & Cherchneff, I. 2011, ApJ, 727, 63 Elmhamdi, A., et al. 2003, MNRAS, 338, 939 Ercolano, B., Barlow, M.J., Storey, P.J. 2005, MNRAS, 362, 1038Gehrz, R.D. 1989, Interstellar Dust, ed. L.J. Allamandola, & A.G.G.M. Tielens, IAU Symp., 135, 445 Hamuy, M., & Suntzeff, N.B. 1990, AJ, 99, 1146 Kozasa, T., et al. 2009, Cosmic Dust—Near and Far, ed. T. Henning, E. Grün, & J. Steinacker, 414, 43Maeda, K., et al. 2010, MmSAI, 81, 151 Meixner, M., et al. 2010, PASP, 122, 451 Patat, F., Barbon, R., Cappellaro, E., & Turatto, M. 1994, A&A, 282, 731Valiante, R., Schneider, R., Bianchi, S., Andersen, A.C. 2009, MNRAS, 397, 1661 Walker, A.R., & Suntzeff, N.B. 1991, PASP, 103, 958 Welch, D.L., et al. 2007, ApJ, 669, 525 Wesson, R., et al. 2010, MNRAS, 403, 474
Late-Time Light Curves of Type II Supernovae continued
Figure 3a: The relationship between nickel and progenitor masses.
Figure 3b: The relationship between nickel and dust masses.
NL