science of the total environment - idadesal...review the state of desalination and brine production:...
TRANSCRIPT
Science of the Total Environment 657 (2019) 1343–1356
Contents lists available at ScienceDirect
Science of the Total Environment
j ourna l homepage: www.e lsev ie r .com/ locate /sc i totenv
Review
The state of desalination and brine production: A global outlook
Edward Jones a,b, Manzoor Qadir a,⁎, Michelle T.H. van Vliet b, Vladimir Smakhtin a, Seong-mu Kang a,c
a United Nations University: Institute for Water, Environment and Health (UNU-INWEH), Canadab Water Systems and Global Change, Wageningen University, the Netherlandsc Gwangju Institute of Science and Technology (GIST), South Korea
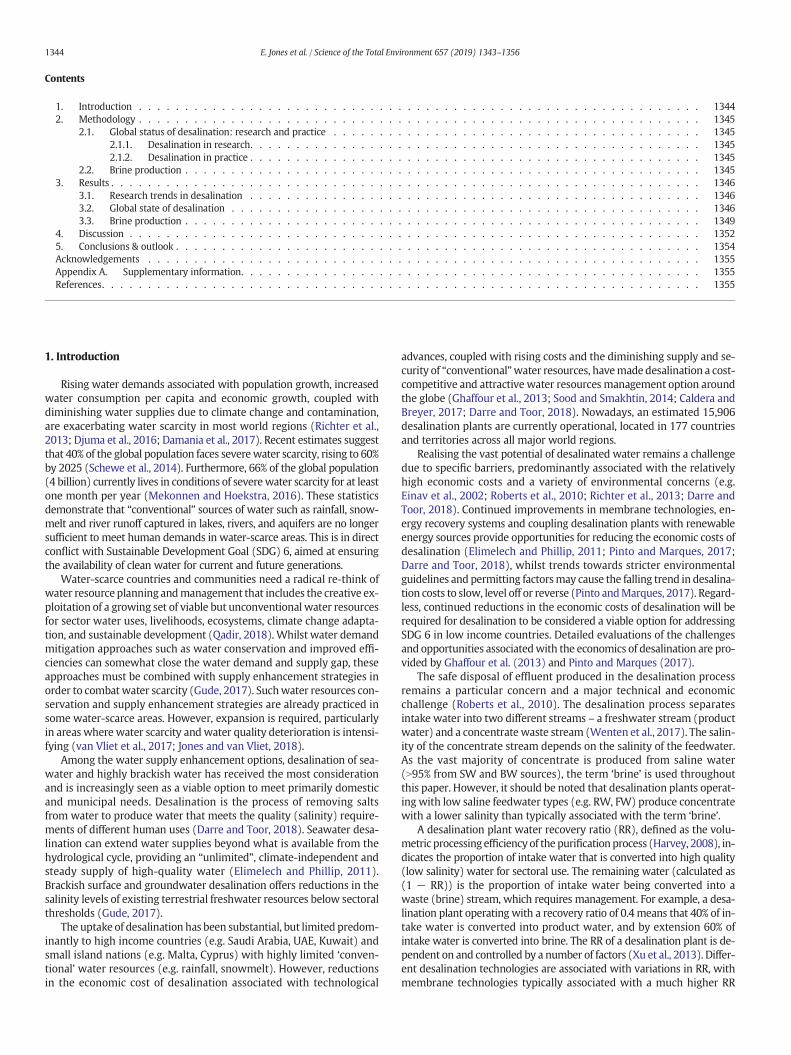
H I G H L I G H T S G R A P H I C A L A B S T R A C T
• Unconventional water resources are keyto support SDG 6 achievement.
• Desalinated water production is95.37 million m3/day.
• Brine production and energy consump-tion are key barriers to desalination ex-pansion.
• Brine production is 141.5millionm3/day,50% greater than previous estimates.
• Innovation and developments in brinemanagement and disposal options arerequired.
⁎ Corresponding author.E-mail address: [email protected] (M. Qadir).
https://doi.org/10.1016/j.scitotenv.2018.12.0760048-9697/© 2018 Elsevier B.V. All rights reserved.
a b s t r a c t
a r t i c l e i n f oArticle history:Received 31 August 2018Received in revised form 5 December 2018Accepted 5 December 2018Available online 07 December 2018
Editor: Ashantha Goonetilleke
Rising water demands and diminishing water supplies are exacerbating water scarcity in most world regions.Conventional approaches relying on rainfall and river runoff in water scarce areas are no longer sufficient tomeet human demands. Unconventional water resources, such as desalinated water, are expected to play a keyrole in narrowing the water demand-supply gap. Our synthesis of desalination data suggests that there are15,906 operational desalination plants producing around 95 million m3/day of desalinated water for humanuse, of which 48% is produced in the Middle East and North Africa region. A major challenge associated with de-salination technologies is the production of a typically hypersaline concentrate (termed ‘brine’) discharge that re-quires disposal, which is both costly and associated with negative environmental impacts. Our estimates revealbrine production to be around 142 million m3/day, approximately 50% greater than previous quantifications.Brine production in Saudi Arabia, UAE, Kuwait and Qatar accounts for 55% of the total global share. Improvedbrinemanagement strategies are required to limit the negative environmental impacts and reduce the economiccost of disposal, thereby stimulating further developments in desalination facilities to safeguard water suppliesfor current and future generations.
© 2018 Elsevier B.V. All rights reserved.
Keywords:Recovery ratioFeedwater typeDesalination technologyProduct waterConcentrate stream
1344 E. Jones et al. / Science of the Total Environment 657 (2019) 1343–1356
Contents
1. Introduction . . . . . . . . . . . . . . . . . . . . . . . . . . . . . . . . . . . . . . . . . . . . . . . . . . . . . . . . . . . . . 13442. Methodology . . . . . . . . . . . . . . . . . . . . . . . . . . . . . . . . . . . . . . . . . . . . . . . . . . . . . . . . . . . . . 1345
2.1. Global status of desalination: research and practice . . . . . . . . . . . . . . . . . . . . . . . . . . . . . . . . . . . . . . . . 13452.1.1. Desalination in research. . . . . . . . . . . . . . . . . . . . . . . . . . . . . . . . . . . . . . . . . . . . . . . . . 13452.1.2. Desalination in practice . . . . . . . . . . . . . . . . . . . . . . . . . . . . . . . . . . . . . . . . . . . . . . . . . 1345
2.2. Brine production . . . . . . . . . . . . . . . . . . . . . . . . . . . . . . . . . . . . . . . . . . . . . . . . . . . . . . . . 13453. Results . . . . . . . . . . . . . . . . . . . . . . . . . . . . . . . . . . . . . . . . . . . . . . . . . . . . . . . . . . . . . . . . 1346
3.1. Research trends in desalination . . . . . . . . . . . . . . . . . . . . . . . . . . . . . . . . . . . . . . . . . . . . . . . . . 13463.2. Global state of desalination . . . . . . . . . . . . . . . . . . . . . . . . . . . . . . . . . . . . . . . . . . . . . . . . . . . 13463.3. Brine production . . . . . . . . . . . . . . . . . . . . . . . . . . . . . . . . . . . . . . . . . . . . . . . . . . . . . . . . 1349
4. Discussion . . . . . . . . . . . . . . . . . . . . . . . . . . . . . . . . . . . . . . . . . . . . . . . . . . . . . . . . . . . . . . 13525. Conclusions & outlook . . . . . . . . . . . . . . . . . . . . . . . . . . . . . . . . . . . . . . . . . . . . . . . . . . . . . . . . . 1354Acknowledgements . . . . . . . . . . . . . . . . . . . . . . . . . . . . . . . . . . . . . . . . . . . . . . . . . . . . . . . . . . . . 1355Appendix A. Supplementary information. . . . . . . . . . . . . . . . . . . . . . . . . . . . . . . . . . . . . . . . . . . . . . . . . . 1355References. . . . . . . . . . . . . . . . . . . . . . . . . . . . . . . . . . . . . . . . . . . . . . . . . . . . . . . . . . . . . . . . . 1355
1. Introduction
Rising water demands associated with population growth, increasedwater consumption per capita and economic growth, coupled withdiminishing water supplies due to climate change and contamination,are exacerbating water scarcity in most world regions (Richter et al.,2013; Djuma et al., 2016; Damania et al., 2017). Recent estimates suggestthat 40% of the global population faces severewater scarcity, rising to 60%by 2025 (Schewe et al., 2014). Furthermore, 66% of the global population(4 billion) currently lives in conditions of severewater scarcity for at leastone month per year (Mekonnen and Hoekstra, 2016). These statisticsdemonstrate that “conventional” sources of water such as rainfall, snow-melt and river runoff captured in lakes, rivers, and aquifers are no longersufficient to meet human demands in water-scarce areas. This is in directconflict with Sustainable Development Goal (SDG) 6, aimed at ensuringthe availability of clean water for current and future generations.
Water-scarce countries and communities need a radical re-think ofwater resource planning andmanagement that includes the creative ex-ploitation of a growing set of viable but unconventional water resourcesfor sector water uses, livelihoods, ecosystems, climate change adapta-tion, and sustainable development (Qadir, 2018). Whilst water demandmitigation approaches such as water conservation and improved effi-ciencies can somewhat close the water demand and supply gap, theseapproaches must be combined with supply enhancement strategies inorder to combatwater scarcity (Gude, 2017). Suchwater resources con-servation and supply enhancement strategies are already practiced insome water-scarce areas. However, expansion is required, particularlyin areas where water scarcity andwater quality deterioration is intensi-fying (van Vliet et al., 2017; Jones and van Vliet, 2018).
Among the water supply enhancement options, desalination of sea-water and highly brackish water has received the most considerationand is increasingly seen as a viable option to meet primarily domesticand municipal needs. Desalination is the process of removing saltsfrom water to produce water that meets the quality (salinity) require-ments of different human uses (Darre and Toor, 2018). Seawater desa-lination can extend water supplies beyond what is available from thehydrological cycle, providing an “unlimited”, climate-independent andsteady supply of high-quality water (Elimelech and Phillip, 2011).Brackish surface and groundwater desalination offers reductions in thesalinity levels of existing terrestrial freshwater resources below sectoralthresholds (Gude, 2017).
The uptake of desalination has been substantial, but limited predom-inantly to high income countries (e.g. Saudi Arabia, UAE, Kuwait) andsmall island nations (e.g. Malta, Cyprus) with highly limited ‘conven-tional’ water resources (e.g. rainfall, snowmelt). However, reductionsin the economic cost of desalination associated with technological
advances, coupled with rising costs and the diminishing supply and se-curity of “conventional”water resources, havemade desalination a cost-competitive and attractive water resources management option aroundthe globe (Ghaffour et al., 2013; Sood and Smakhtin, 2014; Caldera andBreyer, 2017; Darre and Toor, 2018). Nowadays, an estimated 15,906desalination plants are currently operational, located in 177 countriesand territories across all major world regions.
Realising the vast potential of desalinated water remains a challengedue to specific barriers, predominantly associated with the relativelyhigh economic costs and a variety of environmental concerns (e.g.Einav et al., 2002; Roberts et al., 2010; Richter et al., 2013; Darre andToor, 2018). Continued improvements in membrane technologies, en-ergy recovery systems and coupling desalination plants with renewableenergy sources provide opportunities for reducing the economic costs ofdesalination (Elimelech and Phillip, 2011; Pinto and Marques, 2017;Darre and Toor, 2018), whilst trends towards stricter environmentalguidelines and permitting factorsmay cause the falling trend in desalina-tion costs to slow, level off or reverse (Pinto andMarques, 2017). Regard-less, continued reductions in the economic costs of desalination will berequired for desalination to be considered a viable option for addressingSDG 6 in low income countries. Detailed evaluations of the challengesand opportunities associatedwith the economics of desalination are pro-vided by Ghaffour et al. (2013) and Pinto and Marques (2017).
The safe disposal of effluent produced in the desalination processremains a particular concern and a major technical and economicchallenge (Roberts et al., 2010). The desalination process separatesintake water into two different streams – a freshwater stream (productwater) and a concentratewaste stream (Wenten et al., 2017). The salin-ity of the concentrate stream depends on the salinity of the feedwater.As the vast majority of concentrate is produced from saline water(N95% from SW and BW sources), the term ‘brine’ is used throughoutthis paper. However, it should be noted that desalination plants operat-ing with low saline feedwater types (e.g. RW, FW) produce concentratewith a lower salinity than typically associated with the term ‘brine’.
A desalination plant water recovery ratio (RR), defined as the volu-metric processing efficiency of the purificationprocess (Harvey, 2008), in-dicates the proportion of intake water that is converted into high quality(low salinity) water for sectoral use. The remaining water (calculated as(1 − RR)) is the proportion of intake water being converted into awaste (brine) stream, which requires management. For example, a desa-lination plant operating with a recovery ratio of 0.4 means that 40% of in-take water is converted into product water, and by extension 60% ofintake water is converted into brine. The RR of a desalination plant is de-pendent on and controlled by a number of factors (Xu et al., 2013). Differ-ent desalination technologies are associated with variations in RR, withmembrane technologies typically associated with a much higher RR
1345E. Jones et al. / Science of the Total Environment 657 (2019) 1343–1356
than possible with thermal technologies (Xu et al., 2013). The feedwaterquality is also important, with it being much more difficult (and expen-sive) to operate desalination plants at a high level of water recoverywhen the feedwater salinity is high (Harvey, 2008).
With the aim of providing a global assessment of the research andpractice around desalination, the objectives of this study are to:(1) share an insight into the historical development of desalination;(2)providea state-of-the-art outlookon the statusof desalination, consid-ering the number of desalination facilities and their associated treatmentcapacity with regards to aspects such as geographical distribution, desali-nation technologies, feedwater types andwater uses; and (3) assess brineproduction from desalination facilities and the management implicationsof the produced brine. This study therefore seeks to update the literatureon the state of desalination in both research and practice, which is out-dated. Furthermore, this studymakes the first comprehensive quantifica-tion of the volume of brine produced by desalination facilities, employinga novel methodology that considers the efficiency of desalination plantsbased on both their operating technology and the feedwater type.
2. Methodology
2.1. Global status of desalination: research and practice
2.1.1. Desalination in researchA bibliometric analysis was conducted to evaluate the major re-
search trends in the field of desalination. The Science Citation Index Ex-panded (SCI-EXPANDED) from the Web of Science Core collection wasused for the time period 1980 to 2018. This study firstly categorises de-salination publications based on major research theme (‘technology’,‘environment’, ‘economic and energy’ and ‘social interests’). Subse-quently, considering the ‘technology’ category, trends in research onspecific technologies (‘Reverse Osmosis’, ‘Multi-Effect Distillation’,‘Multi-Stage Flash’, ‘Electrodialysis’, ‘Emerging’ and ‘Other’) were exam-ined. ‘Emerging’ refers to technologies largely in the R&D phase (For-ward Osmosis, Membrane Distillation and Nanofiltration) whereasolder, less prevalent technologies were categorised as ‘other’ (Humidifi-cation-Dehumidification, Solar Stills and Vapour Compression). Theprecise methodology adopted for the bibliometric study is presentedin the Supplementary material.
2.1.2. Desalination in practiceA global database containing information on approximately 20,000
desalination plants (version of 2018) was obtained from Global WaterIntelligence (GWI) (https://www.desaldata.com). The database con-tains information on the plant status, operational year, plant capacity,geographic location (region, country, coordinates), customer type, desa-lination technology and feedwater type of each individual desalinationplant. The precise geographic location of each desalination plant wasplotted in ArcGIS using latitude and longitude data. The rest of thedata was tabulated using pivot tables in Microsoft Excel to assess statis-tics ofmultiple desalination plants per region, technology and other cat-egories. Desalination data (number and capacity of plants) wassubsequently analysed at the global, regional and national scale. Thespecifics within each category by which the global state of desalinationwas analysed are as follows.
Plant statuswas categorised as either 1)Online; 2) Presumedonline;3) Construction; 4) Presumed offline; or 5) Offline. In this study, desali-nation plants were considered ‘Operational’ if they were classified as ei-ther ‘Online’, ‘Presumed online’ or ‘Construction’. Operational yearrefers to the year in which the desalination plant opened, assignedunanimously as 2020 for all plants currently in construction. Plant desa-lination capacity, or the volume of high quality product water producedfor human use, is provided in m3/day for each desalination plant.
Eight geographic regions were identified: 1) East Asia & Pacific;2) Eastern Europe & Central Asia; 3) Latin America & Caribbean; 4)Mid-dle East & North Africa; 5) North America; 6) Southern Asia; 7) Sub-
SaharanAfrica; and 8)Western Europe. Country datawas used to assigneach desalination plant to one of four economic levels based on the2018World Bank Income groups, whereby GNI per capita ($) is estimatedusing the World Bank Atlas method. Countries are assigned to one offour economic classifications: 1) High income (N$12,056 GNI percapita); 2) Upper middle income ($3896 to $12,055); 3) Lower middleincome ($966 to $3895); and 4) Low income (b$995).
The sector (or ‘customer type’) for each desalination plant was sep-arated into six categories: 1) Municipal (including tourist drinkingwater facilities); 2) Industry; 3) Power stations; 4) Irrigation; 5) Mili-tary; and 6) Other. ‘Other’ comprises uses of Demonstration, Processand Water Injection, which are not considered separately as they ac-count for b0.2% of total desalinated water use.
Feedwater type is separated into six categories in DesalData (2018)expressed in ppm Total Dissolved Solids (TDS): 1) Seawater (SW)[20,000–50,000 ppm TDS]; 2) Brackish water (BW) [3000–20,000 ppmTDS]; 3) River water (RW) [500–3000 ppm TDS]; 4) Pure water (PW)[b500 ppm TDS]; 5) Brine (BR) [N50,000 ppm TDS]; and 6) Wastewater(WW). Despite having a typically high base quality (low salinity), desali-nation of RW is practiced for a range of different sectoral uses (e.g. drink-ing water, irrigation) to reduce water salinity below specific sectoralthresholds. PWas a feedwater source is typically used for industrial appli-cations which require very high quality (low salinity) water, such as thepharmaceutical and food production industries.
Desalination technology was separated into seven categories: 1) Re-verse Osmosis (RO); 2) Multi-Stage Flash (MSF); 3) Multi-Effect Distil-lation (MED); 4) Nanofiltration (NF); 5) Electrodialysis/ElectrodialysisReversal (ED); (6) Electrodeionization (EDI); and 7) Other. ‘Other’ in-cluded avariety of technologies suchas1) ForwardOsmosis (FO); 2)Hy-brid (HYB); 3) Membrane distillation (MD); 4) Vapour compression(VP); and 5) Unknown. As the technologies grouped together underthe ‘Other’ category contribute a total of b1% of the total desalinatedwater produced, these technologies were not considered individually.
2.2. Brine production
The volume of brine produced was determined at each individual(operational) desalination plant using three factors contained inDesalData (2018) - feedwater type, desalination technology and treat-ment capacity (m3/day). We consider the water recovery ratios associ-ated with different feedwater-desalination technology combinationsand calculate the brine production based on this recovery ratio andthe plant capacity using Eq. (1).
Qb ¼ QdRR
� 1−RRð Þ ð1Þ
whereby Qb is the volume of brine produced (m3/day); Qd is the desa-lination plant treatment capacity (m3/day) and; RR is the recovery ratio.
In total, 41 different feedwater type and desalination technologycombinations are currently operational. The recovery ratio associatedwith each of these feedwater-technology combinationswas determinedusing twomethods. Firstly, a literature study was conducted in order toidentify values of recovery ratios (or % water efficiency) for differenttechnologies and feedwater types reported in existing studies. Whenrecovery ratios were expressed as a range, the midpoint was used. Intotal, 89 recovery ratios were found in the literature across a range offeedwater-technology combinations. Secondly, influent and effluentsalinity data from individual desalination plants operating withmembrane technologies was used to estimate recovery ratios usingEqs. (2) and (3) (Bashitialshaaer et al., 2009).
Sb ¼ Sf1−RR
ð2Þ
RR ¼ 1−SfSb
ð3Þ
1346 E. Jones et al. / Science of the Total Environment 657 (2019) 1343–1356
whereby Sb is the brine salinity and Sf is the feedwater salinity, withboth salinities expressed in the same units (e.g. mS/cm for EC, mg/l forTDS).
We obtained 30 additional recovery ratios using this method, whichwere combined with recovery ratios identified in the literature to pro-duce 119 records. From this, average recovery ratios could be identifiedfor 18 of the 41 technology-feedwater. Whilst this coverage mightseem low, desalination-technology combinations are not all equallyprevalent in terms of number of plants and desalination capacity.These 14 combinations account for N80% of the total desalinated waterproduced globally, with the top three combinations (seawater (SW)-RO, brackish water (BW)-RO and SW-MSF) accounting for 70% of theproduced desalinated water alone. In order to determine recovery ratiosfor the remaining feedwater-technology combinations, a number of as-sumptions and estimations were made (Table 1).
Latitude and longitude data was used to calculate the distance ofeach desalination plant from the nearest coastline using the Spatial An-alyst tool in ArcGIS. Combined with the estimated brine production foreach desalination plant, we calculated the volume of brine producedat different distances from the coastline to consider the implicationsfor brine management.
3. Results
3.1. Research trends in desalination
Trends in the research history of desalination are displayed in Fig. 1.Approximately 16,500 publications were found to have been producedon the topic of desalination since 1980. Research in desalination hasgrown exponentially, with the total number of publications approxi-mately doubling with each five-year period (e.g. ~5000 in 2010 to~11,000 in 2015). The largemajority of publications focus on technolog-ical aspects of desalination (e.g. 75% in 2005). As such, desalination lit-erature focusing on technological aspects has driven the overall trendin desalination research.Whilst the proportion of desalination literaturecovering technological aspects is still high (72%), there has been anemergence of literature covering alternative aspects of desalination,particularly related to economics and energy and environmental con-cerns. The number of publications considering economic aspects of de-salination has increased dramatically in recent decades, from b400 in2000 to N5000 in 2018. Historically, the environmental impacts of desa-lination were severely neglected, with just 118 publications before2000. However, literature published in this category is now increasingat the fastest rate, with an additional ~2000 publications since 2000.The number of publications addressing socio-political aspects of desali-nation is relatively low. Desalination is not typically associated with so-cial opposition and conflict associatedwith other water supply schemes
Table 1Assumptions and estimations used determining the recovery ratios of feedwater-technol-ogy combinations used in operational desalination plants.
Assumption1 When brackish water (BW) recovery is known, the water recovery ratio of
brine (BR) (TDS N50,000 ppm), seawater (SW) (TDS 20,000–50,000 ppm),river water (RW) (TDS 500–3000 ppm) and pure water (PW) (TDS b500 ppm)is assumed to be the 95th, 90th, 10th and 5th percentiles of brackish watertechnologies respectively.
2 When brackish water (BW) recovery is unknown but seawater water (SW)recovery is known, the water recovery ratio of brine water (BR), brackishwater (BW), river water (RW) and pure water (PW) is assumed to be the 90th,25th, 10th and 5th percentiles of seawater technologies respectively.
3 The recovery rate of wastewater (WW) for each technology is assumed to beequal to the recovery rate of brackish water for the same technology.
Estimation1 Other technologies cover a range of different technologies. An estimated 40% water
recovery ratio was assigned for highly saline water (above 20,000 ppm) and 60%recovery for brackish and slightly saline water sources (below 20,000 ppm).
such as river regulation (e.g. dambuildings) andwater transfers (Marchet al., 2014), whichmay in part explain the lack of publications. Further-more, desalination operations are not typically associated with thegender issues and community-based factors associated with other un-conventional water resources, such as fog water harvesting (Qadiret al., 2018; Lucier and Qadir, 2018). However, desalinated operationsare associated with some important (and under-researched) policy-related aspects, such as the lack of specific water standards for desali-nated water for both the municipal (Chen et al., 2015) and agriculturalsectors (Martinez-Alvarez et al., 2016). As desalination continues to be-come a more prevalent water resources management technology in thefuture, the number of publications across all categories, and especiallyenvironmental and socio-political themes, is expected to increaserapidly.
Publications addressing technological aspects have dominated theresearch history of desalination (Fig. 1). Fig. 2 further explores thistrend by categorising ‘technological’ publications by specific technol-ogy. RO is the most researched technology throughout the entire timeperiod, with the number of publications approximately doubling eachfive-year period. Research into ‘emerging’ technologies (FO, MD andNF) is increasing at the most rapid pace with increasing recognisationof their potential advantages over existing commercial technologies.These include factors such as operating at higher water recovery ratiosand requiring less and/or sustainable energy (Subramani and Jacangelo,2015). Thermal technologies (MED and MSF), despite accounting for asignificant share in the amount of desalinatedwater produced, have re-ceived comparatively little attention in recent literature.Whilst publica-tions addressingMSF andMED accounted for a significant proportion ofresearch in the 1980s and 1990s, they are now the overall leastresearched technologies. Concerns over the energy costs, efficiencyand environmental impacts of thermal processes, and the developmentof more efficient membrane technologies and techniques (particularlyRO), likely explain this trend.
3.2. Global state of desalination
There are 15,906 operational desalination plants with a totaldesalination capacity of approximately 95.37 million m3/day(34.81 billion m3/year), constituting 81% and 93% of the total num-ber and capacity of desalination plants ever built respectively(Fig. 3a). Early desalination plants predominantly utilised thermaltechnologies, located in oil-rich but water scarce regions, espe-cially in the Middle East. For example, prior to the 1980s, 84% ofall global desalinated water was being produced by the two majorthermal technologies (MSF, MED). The rise in the use of membranetechnologies post-1980, in particular RO, gradually shifted the dominanceaway from thermal technologies. In 2000, the volumes of desalinatedwater produced by thermal technologies (dominated by MSF) and ROwere approximately equal at 11.6 million m3/day and 11.4 m3/day re-spectively, together accounting for 93% of the total volume of desalinatedwater produced (Fig. 3b). Since 2000, both the number and capacity of ROplants has risen exponentially, whilst thermal technologies have only ex-perienced marginal increases (Fig. 3b). The current production of desali-nated water from reverse osmosis now stands at 65.5 million m3/day,accounting for 69% of the volume of desalinated water produced.
The spatial distribution, size and customer type of desalination facil-ities (N1000m3/day) are displayed in Fig. 4. Large numbers of desalina-tion facilities are located in the United States, China and Australia andacross the regions of Europe, North Africa and the Middle East. Rela-tively few desalination facilities are located in South America andAfrica, with existing facilities predominantly designed to produce desa-linated water for the industrial sector. Desalination plants globally areconcentrated on and around the coastline, with coastal desalinationplants also tending to be larger than inland desalination plants. Plantsproducing municipal water are located worldwide, but are particularlydominant in the Middle East & North Africa region. Comparatively,
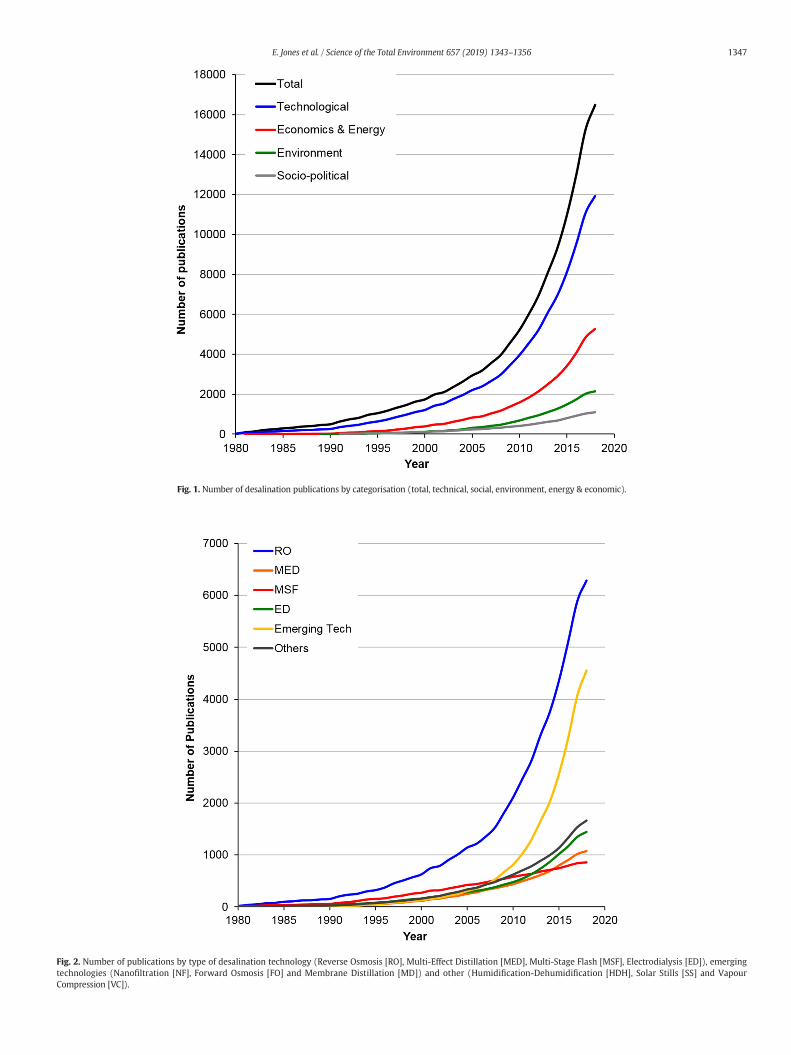
Fig. 1. Number of desalination publications by categorisation (total, technical, social, environment, energy & economic).
Fig. 2. Number of publications by type of desalination technology (Reverse Osmosis [RO], Multi-Effect Distillation [MED], Multi-Stage Flash [MSF], Electrodialysis [ED]), emergingtechnologies (Nanofiltration [NF], Forward Osmosis [FO] and Membrane Distillation [MD]) and other (Humidification-Dehumidification [HDH], Solar Stills [SS] and VapourCompression [VC]).
1347E. Jones et al. / Science of the Total Environment 657 (2019) 1343–1356
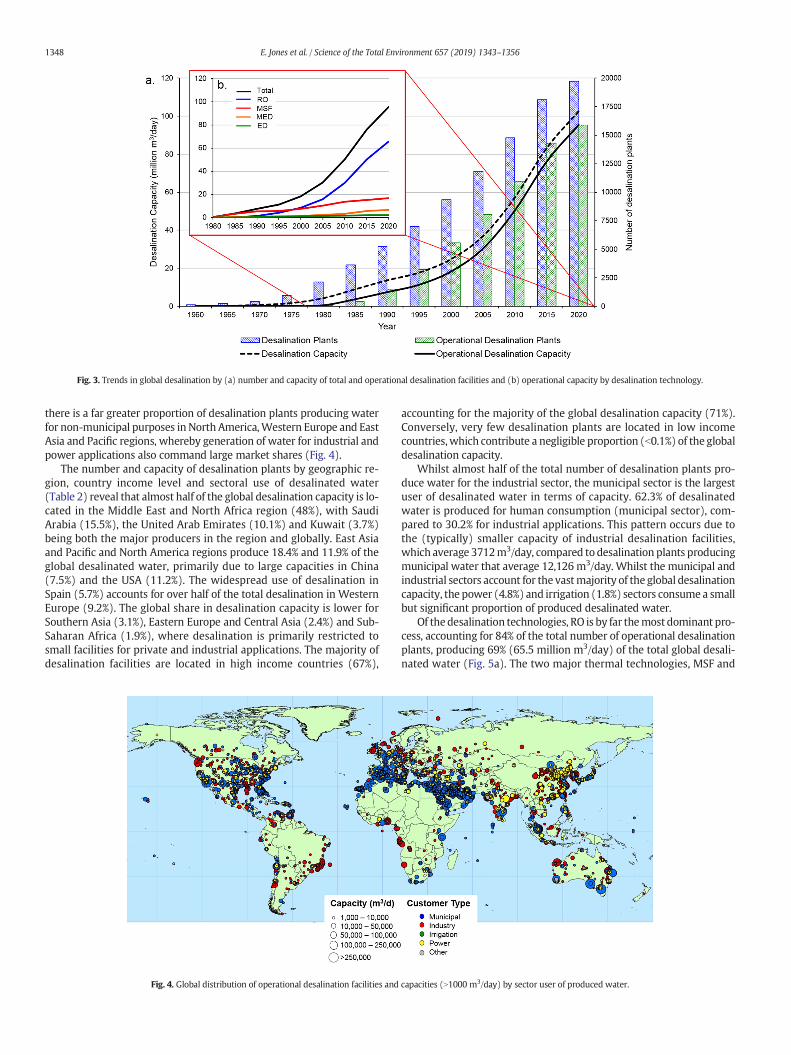
Fig. 3. Trends in global desalination by (a) number and capacity of total and operational desalination facilities and (b) operational capacity by desalination technology.
1348 E. Jones et al. / Science of the Total Environment 657 (2019) 1343–1356
there is a far greater proportion of desalination plants producing waterfor non-municipal purposes in North America,Western Europe and EastAsia and Pacific regions, whereby generation of water for industrial andpower applications also command large market shares (Fig. 4).
The number and capacity of desalination plants by geographic re-gion, country income level and sectoral use of desalinated water(Table 2) reveal that almost half of the global desalination capacity is lo-cated in the Middle East and North Africa region (48%), with SaudiArabia (15.5%), the United Arab Emirates (10.1%) and Kuwait (3.7%)being both the major producers in the region and globally. East Asiaand Pacific and North America regions produce 18.4% and 11.9% of theglobal desalinated water, primarily due to large capacities in China(7.5%) and the USA (11.2%). The widespread use of desalination inSpain (5.7%) accounts for over half of the total desalination in WesternEurope (9.2%). The global share in desalination capacity is lower forSouthern Asia (3.1%), Eastern Europe and Central Asia (2.4%) and Sub-Saharan Africa (1.9%), where desalination is primarily restricted tosmall facilities for private and industrial applications. The majority ofdesalination facilities are located in high income countries (67%),
Fig. 4. Global distribution of operational desalination facilities and
accounting for the majority of the global desalination capacity (71%).Conversely, very few desalination plants are located in low incomecountries,which contribute a negligible proportion (b0.1%) of the globaldesalination capacity.
Whilst almost half of the total number of desalination plants pro-duce water for the industrial sector, the municipal sector is the largestuser of desalinated water in terms of capacity. 62.3% of desalinatedwater is produced for human consumption (municipal sector), com-pared to 30.2% for industrial applications. This pattern occurs due tothe (typically) smaller capacity of industrial desalination facilities,which average 3712m3/day, compared to desalination plants producingmunicipal water that average 12,126 m3/day. Whilst the municipal andindustrial sectors account for the vastmajority of the global desalinationcapacity, the power (4.8%) and irrigation (1.8%) sectors consume a smallbut significant proportion of produced desalinated water.
Of thedesalination technologies, RO is by far themost dominant pro-cess, accounting for 84% of the total number of operational desalinationplants, producing 69% (65.5 million m3/day) of the total global desali-nated water (Fig. 5a). The two major thermal technologies, MSF and
capacities (N1000 m3/day) by sector user of produced water.
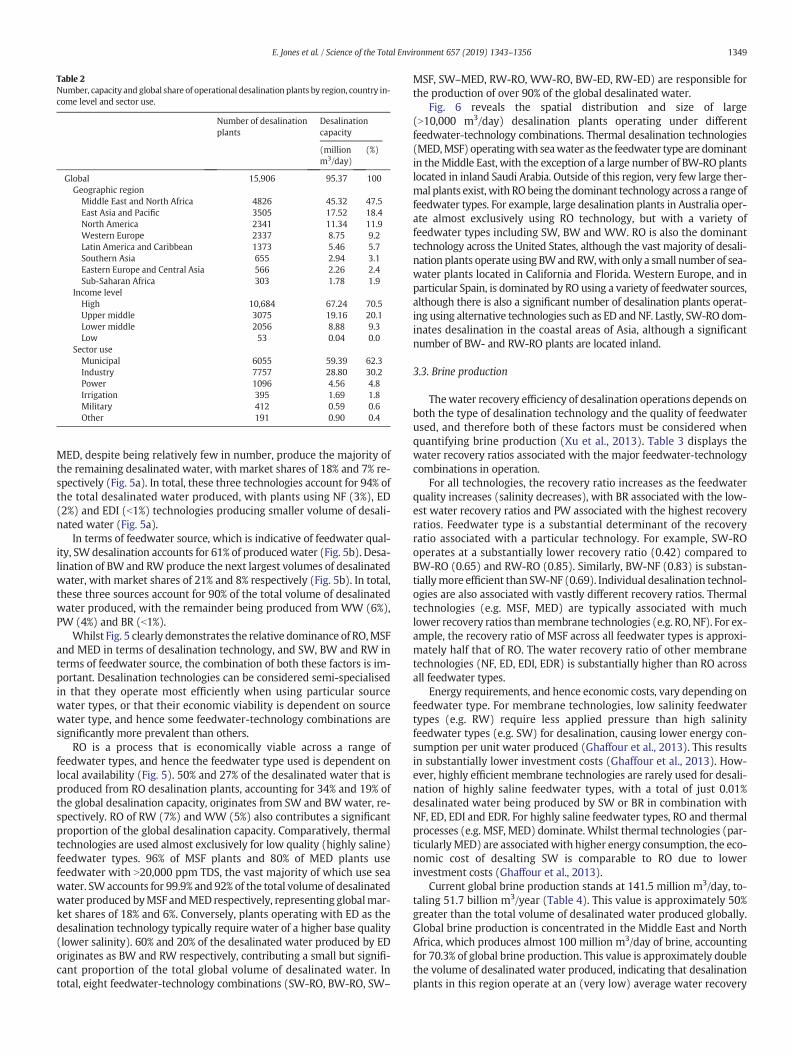
Table 2Number, capacity and global share of operational desalination plants by region, country in-come level and sector use.
Number of desalinationplants
Desalinationcapacity
(millionm3/day)
(%)
Global 15,906 95.37 100Geographic regionMiddle East and North Africa 4826 45.32 47.5East Asia and Pacific 3505 17.52 18.4North America 2341 11.34 11.9Western Europe 2337 8.75 9.2Latin America and Caribbean 1373 5.46 5.7Southern Asia 655 2.94 3.1Eastern Europe and Central Asia 566 2.26 2.4Sub-Saharan Africa 303 1.78 1.9
Income levelHigh 10,684 67.24 70.5Upper middle 3075 19.16 20.1Lower middle 2056 8.88 9.3Low 53 0.04 0.0
Sector useMunicipal 6055 59.39 62.3Industry 7757 28.80 30.2Power 1096 4.56 4.8Irrigation 395 1.69 1.8Military 412 0.59 0.6Other 191 0.90 0.4
1349E. Jones et al. / Science of the Total Environment 657 (2019) 1343–1356
MED, despite being relatively few in number, produce the majority ofthe remaining desalinated water, with market shares of 18% and 7% re-spectively (Fig. 5a). In total, these three technologies account for 94% ofthe total desalinated water produced, with plants using NF (3%), ED(2%) and EDI (b1%) technologies producing smaller volume of desali-nated water (Fig. 5a).
In terms of feedwater source, which is indicative of feedwater qual-ity, SW desalination accounts for 61% of producedwater (Fig. 5b). Desa-lination of BW and RW produce the next largest volumes of desalinatedwater, with market shares of 21% and 8% respectively (Fig. 5b). In total,these three sources account for 90% of the total volume of desalinatedwater produced, with the remainder being produced from WW (6%),PW (4%) and BR (b1%).
Whilst Fig. 5 clearly demonstrates the relative dominance of RO,MSFand MED in terms of desalination technology, and SW, BW and RW interms of feedwater source, the combination of both these factors is im-portant. Desalination technologies can be considered semi-specialisedin that they operate most efficiently when using particular sourcewater types, or that their economic viability is dependent on sourcewater type, and hence some feedwater-technology combinations aresignificantly more prevalent than others.
RO is a process that is economically viable across a range offeedwater types, and hence the feedwater type used is dependent onlocal availability (Fig. 5). 50% and 27% of the desalinated water that isproduced from RO desalination plants, accounting for 34% and 19% ofthe global desalination capacity, originates from SW and BWwater, re-spectively. RO of RW (7%) and WW (5%) also contributes a significantproportion of the global desalination capacity. Comparatively, thermaltechnologies are used almost exclusively for low quality (highly saline)feedwater types. 96% of MSF plants and 80% of MED plants usefeedwater with N20,000 ppm TDS, the vast majority of which use seawater. SWaccounts for 99.9% and 92% of the total volume of desalinatedwater produced byMSF andMED respectively, representing globalmar-ket shares of 18% and 6%. Conversely, plants operating with ED as thedesalination technology typically require water of a higher base quality(lower salinity). 60% and 20% of the desalinated water produced by EDoriginates as BW and RW respectively, contributing a small but signifi-cant proportion of the total global volume of desalinated water. Intotal, eight feedwater-technology combinations (SW-RO, BW-RO, SW–
MSF, SW–MED, RW-RO, WW-RO, BW-ED, RW-ED) are responsible forthe production of over 90% of the global desalinated water.
Fig. 6 reveals the spatial distribution and size of large(N10,000 m3/day) desalination plants operating under differentfeedwater-technology combinations. Thermal desalination technologies(MED,MSF) operatingwith seawater as the feedwater type are dominantin theMiddle East, with the exception of a large number of BW-RO plantslocated in inland Saudi Arabia. Outside of this region, very few large ther-mal plants exist, with RObeing the dominant technology across a range offeedwater types. For example, large desalination plants in Australia oper-ate almost exclusively using RO technology, but with a variety offeedwater types including SW, BW and WW. RO is also the dominanttechnology across the United States, although the vast majority of desali-nation plants operate using BWandRW,with only a small number of sea-water plants located in California and Florida. Western Europe, and inparticular Spain, is dominated by RO using a variety of feedwater sources,although there is also a significant number of desalination plants operat-ing using alternative technologies such as ED andNF. Lastly, SW-RO dom-inates desalination in the coastal areas of Asia, although a significantnumber of BW- and RW-RO plants are located inland.
3.3. Brine production
Thewater recovery efficiency of desalination operations depends onboth the type of desalination technology and the quality of feedwaterused, and therefore both of these factors must be considered whenquantifying brine production (Xu et al., 2013). Table 3 displays thewater recovery ratios associated with the major feedwater-technologycombinations in operation.
For all technologies, the recovery ratio increases as the feedwaterquality increases (salinity decreases), with BR associated with the low-est water recovery ratios and PW associated with the highest recoveryratios. Feedwater type is a substantial determinant of the recoveryratio associated with a particular technology. For example, SW-ROoperates at a substantially lower recovery ratio (0.42) compared toBW-RO (0.65) and RW-RO (0.85). Similarly, BW-NF (0.83) is substan-tiallymore efficient than SW-NF (0.69). Individual desalination technol-ogies are also associated with vastly different recovery ratios. Thermaltechnologies (e.g. MSF, MED) are typically associated with muchlower recovery ratios thanmembrane technologies (e.g. RO, NF). For ex-ample, the recovery ratio of MSF across all feedwater types is approxi-mately half that of RO. The water recovery ratio of other membranetechnologies (NF, ED, EDI, EDR) is substantially higher than RO acrossall feedwater types.
Energy requirements, and hence economic costs, vary depending onfeedwater type. For membrane technologies, low salinity feedwatertypes (e.g. RW) require less applied pressure than high salinityfeedwater types (e.g. SW) for desalination, causing lower energy con-sumption per unit water produced (Ghaffour et al., 2013). This resultsin substantially lower investment costs (Ghaffour et al., 2013). How-ever, highly efficient membrane technologies are rarely used for desali-nation of highly saline feedwater types, with a total of just 0.01%desalinated water being produced by SW or BR in combination withNF, ED, EDI and EDR. For highly saline feedwater types, RO and thermalprocesses (e.g. MSF, MED) dominate. Whilst thermal technologies (par-ticularlyMED) are associatedwith higher energy consumption, the eco-nomic cost of desalting SW is comparable to RO due to lowerinvestment costs (Ghaffour et al., 2013).
Current global brine production stands at 141.5 million m3/day, to-taling 51.7 billion m3/year (Table 4). This value is approximately 50%greater than the total volume of desalinated water produced globally.Global brine production is concentrated in the Middle East and NorthAfrica, which produces almost 100 million m3/day of brine, accountingfor 70.3% of global brine production. This value is approximately doublethe volume of desalinated water produced, indicating that desalinationplants in this region operate at an (very low) average water recovery
Fig. 5. Number and capacity of operational desalination facilities by (a) technology and (b) feedwater type.
1350 E. Jones et al. / Science of the Total Environment 657 (2019) 1343–1356
ratio of 0.25. Comparatively, all other regions produce substantiallylower volumes of brine, with East Asia and Pacific (10.5%), WesternEurope (5.9%) and North America (3.9%) having the next largest shares.Interestingly, these regions produce a substantially lower volume ofbrine than the amount of desalinated water they produce, indicatingthat recovery ratios are generally high. This is particularly apparent forNorth America, which produces a substantially lower volume of brinethan it does desalinatedwater, suggesting that desalination facilities op-erate at an average recovery ratio of 0.75. In other geographical regions,brine production is approximately equivalent to desalinated water pro-duction (i.e. RR = 0.5).
As with desalinated water production, high income countries pro-duce the vast majority of global brine (77.9%). It should be noted that‘high income’ includes both countries from both highly developedworld regions (e.g. North America, Western Europe), whose brine pro-duction tends to be smaller relative to the desalinatedwater production,and the oil-rich Gulf nationswho typically employ thermal desalinationtechnologies with low recovery ratios, hence high brine production. Forexample, Saudi Arabia alone produces 31.53 million m3/day brine,
accounting for 22.2% of the global share. The next three largest pro-ducers of brine are also oil-rich countries, with the UAE, Kuwait andQatar having 20.2%, 6.6% and 5.8% shares in global brine production re-spectively. Together, these four nations produce 32% of global desali-nated water and 55% of the total brine. Comparatively, the USAproduces 10.91 million m3/day of desalinated water (11.4% globalshare) but produces just 5.28 million m3/day of brine (3.7% globalshare). Upper middle income, lower middle income and low incomecountries tend to produce quantities of brine similar to that of their re-spective desalination capacities.
Water produced for the municipal sector is by far the largest pro-ducer of both desalinated water and brine, although the quantity ofbrine produced is much greater. This pattern arises primarily due tothe vast quantity of desalinated drinking water produced for the Gulfnations, whereby thermal technologies operating with SW dominate.Both the industrial and agricultural sectors produce lower quantitiesof brine than desalinated water, indicating desalinated water for thesesectors is produced by feedwater-technology combinations with higherwater recovery ratios. This is particularly pronounced in the agricultural
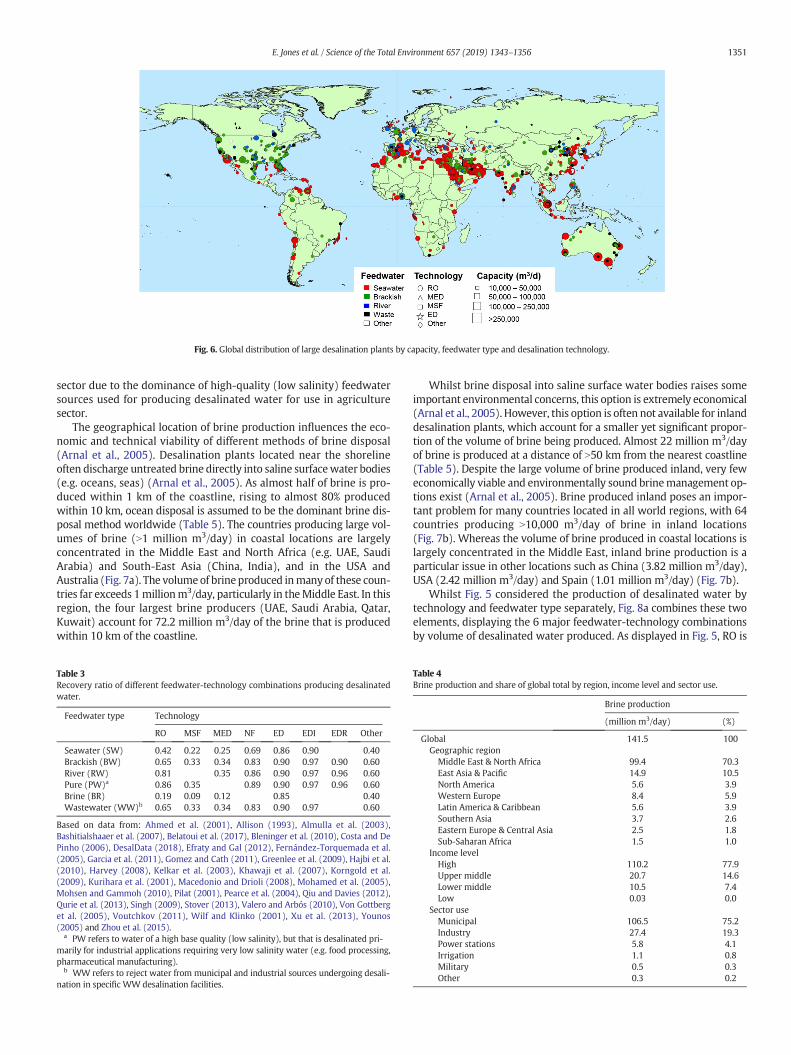
Fig. 6. Global distribution of large desalination plants by capacity, feedwater type and desalination technology.
1351E. Jones et al. / Science of the Total Environment 657 (2019) 1343–1356
sector due to the dominance of high-quality (low salinity) feedwatersources used for producing desalinated water for use in agriculturesector.
The geographical location of brine production influences the eco-nomic and technical viability of different methods of brine disposal(Arnal et al., 2005). Desalination plants located near the shorelineoften discharge untreated brine directly into saline surfacewater bodies(e.g. oceans, seas) (Arnal et al., 2005). As almost half of brine is pro-duced within 1 km of the coastline, rising to almost 80% producedwithin 10 km, ocean disposal is assumed to be the dominant brine dis-posal method worldwide (Table 5). The countries producing large vol-umes of brine (N1 million m3/day) in coastal locations are largelyconcentrated in the Middle East and North Africa (e.g. UAE, SaudiArabia) and South-East Asia (China, India), and in the USA andAustralia (Fig. 7a). The volumeof brineproduced inmany of these coun-tries far exceeds 1millionm3/day, particularly in theMiddle East. In thisregion, the four largest brine producers (UAE, Saudi Arabia, Qatar,Kuwait) account for 72.2 million m3/day of the brine that is producedwithin 10 km of the coastline.
Table 3Recovery ratio of different feedwater-technology combinations producing desalinatedwater.
Feedwater type Technology
RO MSF MED NF ED EDI EDR Other
Seawater (SW) 0.42 0.22 0.25 0.69 0.86 0.90 0.40Brackish (BW) 0.65 0.33 0.34 0.83 0.90 0.97 0.90 0.60River (RW) 0.81 0.35 0.86 0.90 0.97 0.96 0.60Pure (PW)a 0.86 0.35 0.89 0.90 0.97 0.96 0.60Brine (BR) 0.19 0.09 0.12 0.85 0.40Wastewater (WW)b 0.65 0.33 0.34 0.83 0.90 0.97 0.60
Based on data from: Ahmed et al. (2001), Allison (1993), Almulla et al. (2003),Bashitialshaaer et al. (2007), Belatoui et al. (2017), Bleninger et al. (2010), Costa and DePinho (2006), DesalData (2018), Efraty and Gal (2012), Fernández-Torquemada et al.(2005), Garcia et al. (2011), Gomez and Cath (2011), Greenlee et al. (2009), Hajbi et al.(2010), Harvey (2008), Kelkar et al. (2003), Khawaji et al. (2007), Korngold et al.(2009), Kurihara et al. (2001), Macedonio and Drioli (2008), Mohamed et al. (2005),Mohsen and Gammoh (2010), Pilat (2001), Pearce et al. (2004), Qiu and Davies (2012),Qurie et al. (2013), Singh (2009), Stover (2013), Valero and Arbós (2010), Von Gottberget al. (2005), Voutchkov (2011), Wilf and Klinko (2001), Xu et al. (2013), Younos(2005) and Zhou et al. (2015).
a PW refers to water of a high base quality (low salinity), but that is desalinated pri-marily for industrial applications requiring very low salinity water (e.g. food processing,pharmaceutical manufacturing).
b WW refers to reject water from municipal and industrial sources undergoing desali-nation in specific WW desalination facilities.
Whilst brine disposal into saline surface water bodies raises someimportant environmental concerns, this option is extremely economical(Arnal et al., 2005). However, this option is often not available for inlanddesalination plants, which account for a smaller yet significant propor-tion of the volume of brine being produced. Almost 22 million m3/dayof brine is produced at a distance of N50 km from the nearest coastline(Table 5). Despite the large volume of brine produced inland, very feweconomically viable and environmentally sound brinemanagement op-tions exist (Arnal et al., 2005). Brine produced inland poses an impor-tant problem for many countries located in all world regions, with 64countries producing N10,000 m3/day of brine in inland locations(Fig. 7b). Whereas the volume of brine produced in coastal locations islargely concentrated in the Middle East, inland brine production is aparticular issue in other locations such as China (3.82 million m3/day),USA (2.42 million m3/day) and Spain (1.01 million m3/day) (Fig. 7b).
Whilst Fig. 5 considered the production of desalinated water bytechnology and feedwater type separately, Fig. 8a combines these twoelements, displaying the 6 major feedwater-technology combinationsby volume of desalinated water produced. As displayed in Fig. 5, RO is
Table 4Brine production and share of global total by region, income level and sector use.
Brine production
(million m3/day) (%)
Global 141.5 100Geographic regionMiddle East & North Africa 99.4 70.3East Asia & Pacific 14.9 10.5North America 5.6 3.9Western Europe 8.4 5.9Latin America & Caribbean 5.6 3.9Southern Asia 3.7 2.6Eastern Europe & Central Asia 2.5 1.8Sub-Saharan Africa 1.5 1.0
Income levelHigh 110.2 77.9Upper middle 20.7 14.6Lower middle 10.5 7.4Low 0.03 0.0
Sector useMunicipal 106.5 75.2Industry 27.4 19.3Power stations 5.8 4.1Irrigation 1.1 0.8Military 0.5 0.3Other 0.3 0.2
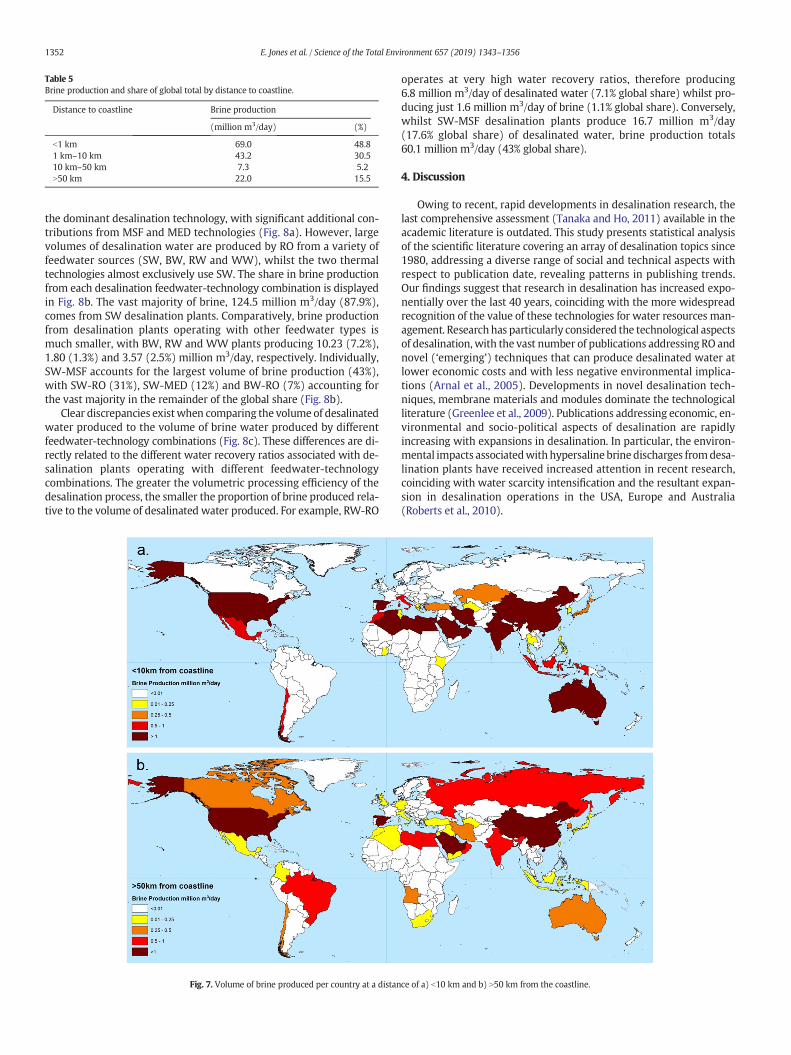
Table 5Brine production and share of global total by distance to coastline.
Distance to coastline Brine production
(million m3/day) (%)
b1 km 69.0 48.81 km–10 km 43.2 30.510 km–50 km 7.3 5.2N50 km 22.0 15.5
1352 E. Jones et al. / Science of the Total Environment 657 (2019) 1343–1356
the dominant desalination technology, with significant additional con-tributions from MSF and MED technologies (Fig. 8a). However, largevolumes of desalination water are produced by RO from a variety offeedwater sources (SW, BW, RW and WW), whilst the two thermaltechnologies almost exclusively use SW. The share in brine productionfrom each desalination feedwater-technology combination is displayedin Fig. 8b. The vast majority of brine, 124.5 million m3/day (87.9%),comes from SW desalination plants. Comparatively, brine productionfrom desalination plants operating with other feedwater types ismuch smaller, with BW, RW and WW plants producing 10.23 (7.2%),1.80 (1.3%) and 3.57 (2.5%) million m3/day, respectively. Individually,SW-MSF accounts for the largest volume of brine production (43%),with SW-RO (31%), SW-MED (12%) and BW-RO (7%) accounting forthe vast majority in the remainder of the global share (Fig. 8b).
Clear discrepancies existwhen comparing the volume of desalinatedwater produced to the volume of brine water produced by differentfeedwater-technology combinations (Fig. 8c). These differences are di-rectly related to the different water recovery ratios associated with de-salination plants operating with different feedwater-technologycombinations. The greater the volumetric processing efficiency of thedesalination process, the smaller the proportion of brine produced rela-tive to the volume of desalinated water produced. For example, RW-RO
Fig. 7. Volume of brine produced per country at a distan
operates at very high water recovery ratios, therefore producing6.8 million m3/day of desalinated water (7.1% global share) whilst pro-ducing just 1.6 million m3/day of brine (1.1% global share). Conversely,whilst SW-MSF desalination plants produce 16.7 million m3/day(17.6% global share) of desalinated water, brine production totals60.1 million m3/day (43% global share).
4. Discussion
Owing to recent, rapid developments in desalination research, thelast comprehensive assessment (Tanaka and Ho, 2011) available in theacademic literature is outdated. This study presents statistical analysisof the scientific literature covering an array of desalination topics since1980, addressing a diverse range of social and technical aspects withrespect to publication date, revealing patterns in publishing trends.Our findings suggest that research in desalination has increased expo-nentially over the last 40 years, coinciding with the more widespreadrecognition of the value of these technologies for water resources man-agement. Researchhas particularly considered the technological aspectsof desalination,with the vast number of publications addressing RO andnovel (‘emerging’) techniques that can produce desalinated water atlower economic costs and with less negative environmental implica-tions (Arnal et al., 2005). Developments in novel desalination tech-niques, membrane materials and modules dominate the technologicalliterature (Greenlee et al., 2009). Publications addressing economic, en-vironmental and socio-political aspects of desalination are rapidlyincreasing with expansions in desalination. In particular, the environ-mental impacts associatedwithhypersaline brinedischarges fromdesa-lination plants have received increased attention in recent research,coinciding with water scarcity intensification and the resultant expan-sion in desalination operations in the USA, Europe and Australia(Roberts et al., 2010).
ce of a) b10 km and b) N50 km from the coastline.
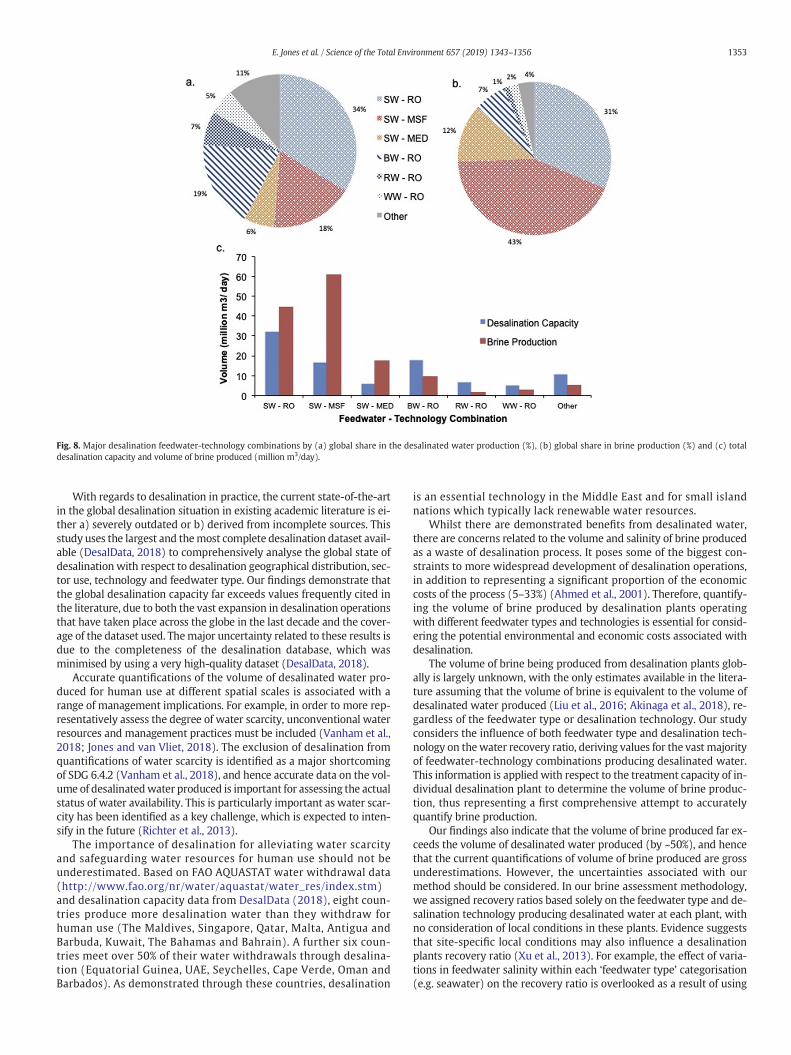
Fig. 8. Major desalination feedwater-technology combinations by (a) global share in the desalinated water production (%), (b) global share in brine production (%) and (c) totaldesalination capacity and volume of brine produced (million m3/day).
1353E. Jones et al. / Science of the Total Environment 657 (2019) 1343–1356
With regards to desalination in practice, the current state-of-the-artin the global desalination situation in existing academic literature is ei-ther a) severely outdated or b) derived from incomplete sources. Thisstudy uses the largest and themost complete desalination dataset avail-able (DesalData, 2018) to comprehensively analyse the global state ofdesalination with respect to desalination geographical distribution, sec-tor use, technology and feedwater type. Our findings demonstrate thatthe global desalination capacity far exceeds values frequently cited inthe literature, due to both the vast expansion in desalination operationsthat have taken place across the globe in the last decade and the cover-age of the dataset used. Themajor uncertainty related to these results isdue to the completeness of the desalination database, which wasminimised by using a very high-quality dataset (DesalData, 2018).
Accurate quantifications of the volume of desalinated water pro-duced for human use at different spatial scales is associated with arange of management implications. For example, in order to more rep-resentatively assess the degree of water scarcity, unconventional waterresources and management practices must be included (Vanham et al.,2018; Jones and van Vliet, 2018). The exclusion of desalination fromquantifications of water scarcity is identified as a major shortcomingof SDG 6.4.2 (Vanham et al., 2018), and hence accurate data on the vol-ume of desalinatedwater produced is important for assessing the actualstatus of water availability. This is particularly important as water scar-city has been identified as a key challenge, which is expected to inten-sify in the future (Richter et al., 2013).
The importance of desalination for alleviating water scarcityand safeguarding water resources for human use should not beunderestimated. Based on FAO AQUASTAT water withdrawal data(http://www.fao.org/nr/water/aquastat/water_res/index.stm)and desalination capacity data from DesalData (2018), eight coun-tries produce more desalination water than they withdraw forhuman use (The Maldives, Singapore, Qatar, Malta, Antigua andBarbuda, Kuwait, The Bahamas and Bahrain). A further six coun-tries meet over 50% of their water withdrawals through desalina-tion (Equatorial Guinea, UAE, Seychelles, Cape Verde, Oman andBarbados). As demonstrated through these countries, desalination
is an essential technology in the Middle East and for small islandnations which typically lack renewable water resources.
Whilst there are demonstrated benefits from desalinated water,there are concerns related to the volume and salinity of brine producedas a waste of desalination process. It poses some of the biggest con-straints to more widespread development of desalination operations,in addition to representing a significant proportion of the economiccosts of the process (5–33%) (Ahmed et al., 2001). Therefore, quantify-ing the volume of brine produced by desalination plants operatingwith different feedwater types and technologies is essential for consid-ering the potential environmental and economic costs associated withdesalination.
The volume of brine being produced from desalination plants glob-ally is largely unknown, with the only estimates available in the litera-ture assuming that the volume of brine is equivalent to the volume ofdesalinated water produced (Liu et al., 2016; Akinaga et al., 2018), re-gardless of the feedwater type or desalination technology. Our studyconsiders the influence of both feedwater type and desalination tech-nology on thewater recovery ratio, deriving values for the vast majorityof feedwater-technology combinations producing desalinated water.This information is applied with respect to the treatment capacity of in-dividual desalination plant to determine the volume of brine produc-tion, thus representing a first comprehensive attempt to accuratelyquantify brine production.
Our findings also indicate that the volume of brine produced far ex-ceeds the volume of desalinated water produced (by ~50%), and hencethat the current quantifications of volume of brine produced are grossunderestimations. However, the uncertainties associated with ourmethod should be considered. In our brine assessment methodology,we assigned recovery ratios based solely on the feedwater type and de-salination technology producing desalinated water at each plant, withno consideration of local conditions in these plants. Evidence suggeststhat site-specific local conditions may also influence a desalinationplants recovery ratio (Xu et al., 2013). For example, the effect of varia-tions in feedwater salinity within each ‘feedwater type’ categorisation(e.g. seawater) on the recovery ratio is overlooked as a result of using
1354 E. Jones et al. / Science of the Total Environment 657 (2019) 1343–1356
the average. Other factors that may influence the specific recovery ofeach individual desalination plant include specific plant design (e.g.type of membrane used in desalination process), product water qualityrequirements (e.g. salinity), energy source and brine disposal method-ology. Furthermore, whilst desalination plant recovery ratios are avail-able in the literature, the number of values used for determiningrecovery ratios for some feedwater-technology combinations was low.For some feedwater-technology combinations, no values were foundin the literature, and therefore a number of assumptions and estima-tions had to be made (Table 1). This uncertainty was minimised as re-covery ratios were found in the literature for all major feedwater-technology combinations, capturing the vast majority of the total desa-lination capacity (N80%).
With increasingwater demands coupledwithwater scarcity intensi-fication, desalination is expected to expand rapidly in the future. The ex-pected expansion in desalination capacity will be commensurate withan increase in the volume of brine produced. Management of the rejectbrine is the still a major problem of desalination (Roberts et al., 2010;Elimelech and Phillip, 2011; Mezher et al., 2011; Wenten, 2016), con-taining both elevated salinity (relative to feedwater type) and chemicalsused during pre- and post-treatment phases in the desalination opera-tion (Wenten et al., 2016). Traditionally, a variety of brine disposalmethods have been used, including direct discharge into oceans, surfacewater or sewers, deep well injection and brine evaporation ponds(Morillo et al., 2014). The geographical location at which brine is pro-duced influences the brine disposal method – desalination plants lo-cated near to large surface saline water bodies (ocean, seas) oftendischarge untreated waste brine directly into these water bodies(Arnal et al., 2005). Conversely, desalination plants located inland maynot have a surface water discharge option available, and hence alterna-tive brine disposal methods are required, of which there are few eco-nomically viable options (Arnal et al., 2005; Brady et al., 2005; Morilloet al., 2014).
Whilst the majority of brine is produced near to the coastline(Fig. 7a), with almost 80% of brine produced within 10 km (Table 5), asubstantial volume of brine is produced in geographic locations wheresurface water discharge is likely not possible (Fig. 7b, Table 5). In addi-tion, there are a variety of environmental concerns associated with thedischarge of hypersaline brine into surface water bodies (Einav et al.,2002; Roberts et al., 2010; Palomar and Losada, 2011). Major concernsare related to the ecological effects associated with physio-chemical al-terations (e.g. increased salinity) to seawater around brine dischargeoutlets and the discharge of toxic chemicals used in water pre-treatment or as anti-scalants and anti-foulants in the desalination pro-cess (Einav et al., 2002; Roberts et al., 2010; Ketsetzi et al., 2008).When continually discharged to surface waters, these factors poserisks to ocean life and marine ecosystems (Gacia et al., 2007; Palomarand Losada, 2011;Meneses et al., 2010). The high salinity of brine causeselevated density in comparison to the salinity of the receiving waters,which can form “brine underflows” that deplete dissolved oxygen(DO) in the receiving waters. High salinity and reduced DO levels canhave profound impacts on benthic organisms, which can translate intoecological effects observable throughout the food chain (Rabinowitz,2016; Frank et al., 2017). A combination of these factors necessitatesthe development of new brine management strategies that are botheconomically feasible and environmentally sound.
Recent efforts have focused on ways to treat or use brine in order tominimise or eliminate the negative environmental impacts associatedwith brine disposal (Morillo et al., 2014; Wenten et al., 2017) and/orto partially or fully offset the economic costs associated with brine dis-posal (Kesieme et al., 2013; Morillo et al., 2014). These efforts cover arange of techniques with variable levels of complexity and cost. For ex-ample, mixing brine with alternative water sources of a lower salinity(e.g. treated wastewater, power-plant cooling water) can reduce brinesalinity by dilution (Giwa et al., 2017). Pressurised dispersion nozzlescan promote mixing of brine waters with receiving waters, restricting
bottomponding (Roberts, 2015). Techniques such as bipolarmembraneelectrodialysis (BMED) can convert brine into acid andbase products forreuse, such as NaOH and HCl (Ibáñez et al., 2013; Morillo et al., 2014).Metal recovery from brine offers a valuable source of many scarcemetals (e.g. uranium), whilst potentially reducing environmental im-pacts associated with mining (Morillo et al., 2014; Loganathan et al.,2017). The high economic costs and energy demands of brine treatmentand mineral recovery methods remain a significant barrier to morewidespread application (Kaplan et al., 2017). Comprehensive reviewsof the recent techniques, technologies and innovations in brinemanage-ment are provided by Morillo et al. (2014) and Giwa et al. (2017).
Other potential economic opportunities associated with brine pro-duction have also sparked a wave in innovation in brine managementthat seeks to turn an environmental problem into an economic opportu-nity (Sánchez et al., 2015). For example, Blackwell et al. (2005) identi-fied sequential biological concentration (SBC) of saline drainagestreams creating a number of financial opportunities, whilst concentrat-ing thewaste stream into amanageable volume. Qadir et al. (2015) sug-gested that integrating agriculture and aquaculture systems based onthe SBC system using saline drainage water sequentially has the poten-tial for commercial, social and environmental gains. Reject brine hasbeen used for aquaculture, with increases in fish biomass of 300%achieved (ICBA, 2018). Reject brine has also been successfully used forSpirulina cultivation and the irrigation of halophytic forage shrubs andcrops although this method was unable to prevent progressive landsalinisation (Sánchez et al., 2015).
Aside from treating or using reject brine, a method to reduce thevolume of brine produced is to improve the water recovery ratio of de-salination plants. Desalination plants operating with a high RR arefavourable in that they both maximise the use of (often scarce) waterresources as in the case of river and brackish water desalination plantsand create a lower volume of concentrate for disposal (Harvey, 2008),reducing the economic costs associatedwith brine disposal. High recov-ery rates can also reduce the cost of pre-treatment prior to desalinationand post-treatment of brine (Lachish, 2002). However, attaining higherRRs generally increases energy demands and hence treatment costs(Lachish, 2002), increasing greenhouse gas emissions if the desalinationplant is powered by fossil fuels (Martin-Gorriz et al., 2014; Darre andToor, 2018).Whilst the reduced volume of brine associated with higherRRsmight have positive environmental implications, the brine salt con-centration will be increased (Ahmed et al., 2001) which could poten-tially pose harmful risks to the aquatic environment following disposal(Bashitialshaaer et al., 2009). Determining the optimal recovery ratiofor desalination plants is therefore an economic, environmental andtechnical challenge, requiring consideration on a site-by-site basis.
5. Conclusions & outlook
Against the backdrop of increasing globalwater scarcity, desalinatedwater is increasingly becoming a viable option to narrow the waterdemand-supply gap, particularly in addressing domestic andmunicipalneeds. Desalinated water can substantially extend the volume of high-quality water supplies available for human use. A steady and assuredsupply of high-quality water is crucially important in an era when theworld at large is embarking on the Sustainable Development Agendato ensure access to safe water for all by 2030, and for the achievementof SDG 6 to safeguardwater supplies for current and future generations.In addition to SDG 6, a variety of other SDGs are inextricably linkedwithwater resources management, such as SDG 2 aiming at zero hunger,SDG 3 ensuring healthy lives, SDG 8 promoting sustainable economicgrowth, SDG 11 making cities and human settlements inclusive, andSDG 13 combating climate change. These SDGs have water-related tar-gets that must be achieved before their ultimate realisation is possible.
Although desalination can provide an unlimited, climate-independentand steady supply of high-quality water, there are specific challenges toharness the vast potential of desalinated water, such as relatively high
1355E. Jones et al. / Science of the Total Environment 657 (2019) 1343–1356
economic costs and a variety of environmental concerns. A major envi-ronmental concern arises from the large volume of brine produced inthe desalination process that requires management. Brine managementis both economically expensive and technically difficult, and hence mostdesalination plants discharge untreated brine directly into the environ-ment. Addressing these challenges, research studies have demonstratedthat there are economic opportunities associatedwith brine, such as com-mercial salt and metal recovery and use of brine in fish and halophyteproduction systems. There is a need to translate such research to convertan environmental problem into an economic opportunity. This is particu-larly important in countries producing large volumes of brine with rela-tively low efficiencies, such as Saudi Arabia, UAE, Kuwait and Qatar.
Although smaller amounts of desalinated water are used for thepower and irrigation sectors, water is desalinated primarily for mu-nicipal and industrial purposes. In this regard, desalinated waterprovides a safe and sustainable source of good-quality water for do-mestic purposes. Such potable water supplies are critically impor-tant in water scarce areas where water quality deterioration is alsoon the increase. The use of desalinated water in producing high-value crops and crop commodities would be another avenue whilstconsidering expansion of desalinated water to other sectors (Silberet al., 2015).
Due primarily to the relatively high economic costs, desalination iscurrently concentrated in high income and developed countries. Thereis a need tomake desalination technologiesmore affordable and extendthem to low income and lower middle income countries, increasing theviability of desalination for addressing SDG 6 in areas that develop-ments have previously been limited by high economic costs. To dothis, technological refinement for low environmental impacts and eco-nomic costs, along with innovative financial mechanisms to supportthe sustainability of desalination schemes, will likely be required. Theexpansion pattern and economics of desalination facilities in recent de-cades suggest a positive and promising outlook for expansion in desali-nation facilities around the world.
Acknowledgements
This work is part of the UNU-INWEH's project on UnconventionalWater Resources. UNU-INWEH is supported by the Government ofCanada through Global Affairs Canada. Michelle van Vliet was finan-cially supported by a Veni-grant (project no. 863.14.008) of NWO Earthand Life Sciences (ALW).
Conflicting interests
The authors declare no conflict of interest.
Appendix A. Supplementary information
Supplementary data to this article can be found online at https://doi.org/10.1016/j.scitotenv.2018.12.076.
References
Ahmed, M., Shayya, W.H., Hoey, D., Al-Handaly, J., 2001. Brine disposal from reverse os-mosis desalination plants in Oman and the United Arab Emirates. Desalination 133(2), 135–147.
Akinaga, T., Generalis, S.C., Paton, C., Igobo, O.N., Davies, P.A., 2018. Brine utilisation forcooling and salt production in wind-driven seawater greenhouses: design andmodelling. Desalination 426, 135–154.
Allison, R.P., 1993. High water recovery with electrodialysis reversal. ProceedingsAmerican Water Works Assoc. Membrane Conference, pp. 1–4.
Almulla, A., Eid, M., Côté, P., Coburn, J., 2003. Developments in high recovery brackishwater desalination plants as part of the solution to water quantity problems. Desali-nation 153 (1–3), 237–243.
Arnal, J.M., Sancho, M., Iborra, I., Gozálvez, J.M., Santafé, A., Lora, J., 2005. Concentration ofbrines from RO desalination plants by natural evaporation. Desalination 182 (1–3),435–439.
Bashitialshaaer, R., Persson, K.M., Larson, M., Ergil, M., 2007. Impact of brine disposal fromEMU desalination plant on seawater composition. IDA World Congress Maspalomas,Gran Canaria–Spain October, pp. 21–26.
Bashitialshaaer, R., Flyborg, L., Persson, K.M., 2009. Environmental assessment of brinedischarge including wastewater collection in the Arabian gulf. Proceedings 12thIDA World Congress & Water Reuse, Nov. 7–12.
Belatoui, A., Bouabessalam, H., Rouane Hacene, O., De-la-Ossa-Carretero, J.A., Martinez-Garcia, E., Sanchez-Liza, J.L., 2017. Environmental effects of brine discharge fromtwo desalination plants in Algeria (South Western Mediterranean). Desalin. WaterTreat. 76, 311–318.
Blackwell, J., Jayawardane, N., Biswas, T.K., Christen, E.W., 2005. Evaluation of a sequentialbiological concentration system in natural resource management of a saline irrigatedarea. Aust. J. Water Resour. 9, 169–176.
Bleninger, T., Niepelt, A., Jirka, G., 2010. Desalination plant discharge calculator. Desalin.Water Treat. 13 (1–3), 156–173.
Brady, P.V., Kottenstette, R.J., Mayer, T.M., Hightower, M.M., 2005. Inland desalination:challenges and research needs. J. Contemp. Water Res. Educ. 132 (1), 46–51.
Caldera, U., Breyer, C., 2017. Learning curve for seawater reverse osmosis desalinationplants: capital cost trend of the past, present, and future. Water Resour. Res. 53(12), 10523–10538.
Chen, T., Wang, Q., Qin, Y., Chen, X., Yang, X., Lou, W., Zhou, M., He, G., Lu, K., 2015. Knowl-edge, attitudes and practice of desalinated water among professionals in health andwater departments in Shengsi, China: a qualitative study. PLoS One 10 (4), e0118360.
Costa, A.R., De Pinho, M.N., 2006. Performance and cost estimation of nanofiltration forsurfacewater treatment in drinkingwater production. Desalination 196 (1–3), 55–65.
Damania, R., Desbureaux, S., Hyland, M., Islam, A., Moore, S., Rodella, A.S., Russ, J., Zaveri,E., 2017. Uncharted Waters: The New Economics of Water Scarcity and Variability.World Bank, Washington, DC (© World Bank. https://openknowledge.worldbank.org/handle/10986/28096 License: CC BY 3.0 IGO).
Darre, N.C., Toor, G.S., 2018. Desalination of water: a review. Curr. Pollut. Rep. 1–8.DesalData, 2018. GWI/DESALDATA. Available at:. https://www.desaldata.com/, Accessed
date: 7 May 2018.Djuma, H., Bruggeman, A., Eliades, M., Lange, M.A., 2016. Non-conventional water re-
sources research in semi-arid countries of the Middle East. Desalin. Water Treat. 57(5), 2290–2303.
Efraty, A., Gal, Z., 2012. Closed circuit desalination series no 7: retrofit design for improvedperformance of conventional BWRO system. Desalin.Water Treat. 41 (1–3), 301–307.
Einav, R., Harussi, K., Perry, D., 2002. The footprint of the desalination processes on the en-vironment. Desalination 152 (1–3), 141–154.
Elimelech, M., Phillip, W.A., 2011. The future of seawater desalination: energy, technol-ogy, and the environment. Science 333 (6043), 712–717.
Fernández-Torquemada, Y., Sánchez-Lizaso, J.L., González-Correa, J.M., 2005. Preliminaryresults of the monitoring of the brine discharge produced by the SWRO desalinationplant of Alicante (SE Spain). Desalination 182 (1–3), 395–402.
Frank, H., Rahav, E., Bar-Zeev, E., 2017. Short-term effects of SWRO desalination brine onbenthic heterotrophic microbial communities. Desalination 417, 52–59.
Gacia, E., Invers, O., Manzanera, M., Ballesteros, E., Romero, J., 2007. Impact of the brinefrom a desalination plant on a shallow seagrass (Posidonia oceanica) meadow. Estuar.Coast. Shelf Sci. 72 (4), 579–590.
Garcia, C.,Molina, F., Zarzo, D., 2011. 7 year operation of a BWROplantwith rawwater from acoastal aquifer for agricultural irrigation. Desalin. Water Treat. 31 (1–3), 331–338.
Ghaffour, N., Missimer, T.M., Amy, G.L., 2013. Technical review and evaluation of the eco-nomics of water desalination: current and future challenges for better water supplysustainability. Desalination 309, 197–207.
Giwa, A., Dufour, V., Al Marzooqi, F., Al Kaabi, M., Hasan, S.W., 2017. Brine managementmethods: recent innovations and current status. Desalination 407, 1–23.
Gomez, J.D., Cath, T.Y., 2011. Assessment of Osmotic Mechanisms Pairing DesalinationConcentrate and Wastewater Treatment. CH2M HILL.
Greenlee, L.F., Lawler, D.F., Freeman, B.D., Marrot, B., Moulin, P., 2009. Reverse osmosis de-salination: water sources, technology, and today's challenges. Water Res. 43 (9),2317–2348.
Gude, V.G., 2017. Desalination and water reuse to address global water scarcity. Rev. En-viron. Sci. Biotechnol. 16 (4), 591–609.
Hajbi, F., Hammi, H., M'nif, A., 2010. Reuse of RO desalination plant reject brine. J. PhaseEquilib. Diffus. 31 (4), 341–347.
Harvey,W., 2008. Desalination efficiency: energy, water and other resources. Available at:. Suez Water Technologies & Solutionshttps://www.suezwatertechnologies.com/kcpguest/salesedge/...Cust/.../TP1154EN.pdf, Accessed date: 26 July 2018.
Ibáñez, R., Pérez-González, A., Gómez, P., Urtiaga, A.M., Ortiz, I., 2013. Acid and base recov-ery from softened reverse osmosis (RO) brines. Experimental assessment usingmodel concentrates. Desalination 309, 165–170.
International Center for Biosaline Agriculture [ICBA], 2018. ICBA scientists manage to in-crease fish biomass by 300% using reject brine. Available at:. https://www.biosaline.org/news/2018-06-07-6506, Accessed date: 8 February 2018.
Jones, E., van Vliet, M.T.H., 2018. Drought impacts on river salinity in the southern US: im-plications for water scarcity. Sci. Total Environ. 644, 844–853. https://doi.org/10.1016/j.scitotenv.2018.06.373.
Kaplan, R., Mamrosh, D., Salih, H.H., Dastgheib, S.A., 2017. Assessment of desalinationtechnologies for treatment of a highly saline brine from a potential CO2 storage site.Desalination 404, 87–101.
Kelkar, P.S., Joshi, V.A., Ansari, M.H., Manivel, U., 2003. Performance evaluation of reverseosmosis desalination plants for rural water supply in a developing country–a casestudy. Environ. Monit. Assess. 89 (3), 243–261.
Kesieme, U.K., Milne, N., Aral, H., Cheng, C.Y., Duke, M., 2013. Economic analysis of desa-lination technologies in the context of carbon pricing, and opportunities for mem-brane distillation. Desalination 323, 66–74.
1356 E. Jones et al. / Science of the Total Environment 657 (2019) 1343–1356
Ketsetzi, A., Stathoulopoulou, A., Demadis, K.D., 2008. Being “green” in chemical watertreatment technologies: issues, challenges and developments. Desalination 223(1–3), 487–493.
Khawaji, A.D., Kutubkhanah, I.K., Wie, J.M., 2007. A 13.3 MGD seawater RO desalinationplant for Yanbu Industrial City. Desalination 203 (1–3), 176–188.
Korngold, E., Aronov, L., Daltrophe, N., 2009. Electrodialysis of brine solutions dischargedfrom an RO plant. Desalination 242 (1–3), 215–227.
Kurihara, M., Yamamura, H., Nakanishi, T., Jinno, S., 2001. Operation and reliability of veryhigh-recovery seawater desalination technologies by brine conversion two-stage ROdesalination system. Desalination 138 (1–3), 191–199.
Lachish, U., 2002. Optimizing the efficiency of reverse osmosis seawater. Desalinationhttps://doi.org/10.13140/RG.2.2.12099.20003.
Liu, J., Yuan, J., Ji, Z., Wang, B., Hao, Y., Guo, X., 2016. Concentrating brine from seawaterdesalination process by nanofiltration–electrodialysis integrated membrane technol-ogy. Desalination 390, 53–61.
Loganathan, P., Naidu, G., Vigneswaran, S., 2017.Mining valuable minerals from seawater:a critical review. Environ. Sci.: Water Res. Technol. 3 (1), 37–53.
Lucier, K., Qadir, M., 2018. Gender and community mainstreaming in fog water collectionsystems. Water 10 (10), 1472.
Macedonio, F., Drioli, E., 2008. Pressure-driven membrane operations and membrane dis-tillation technology integration for water purification. Desalination 223 (1–3),396–409.
March, H., Saurí, D., Rico-Amorós, A.M., 2014. The end of scarcity? Water desalination asthe new cornucopia for Mediterranean Spain. J. Hydrol. 519, 2642–2651.
Martinez-Alvarez, V., Martin-Gorriz, B., Soto-García, M., 2016. Seawater desalination forcrop irrigation—a review of current experiences and revealed key issues. Desalination381, 58–70.
Martin-Gorriz, B., Soto-García, M., Martínez-Alvarez, V., 2014. Energy and greenhouse-gasemissions in irrigated agriculture of SE (southeast) Spain. Effects of alternative watersupply scenarios. Energy 77, 478–488.
Mekonnen, M.M., Hoekstra, A.Y., 2016. Four billion people facing severe water scarcity.Sci. Adv. 2 (2), e1500323.
Meneses, M., Pasqualino, J.C., Céspedes-Sánchez, R., Castells, F., 2010. Alternatives for re-ducing the environmental impact of the main residue from a desalination plant.J. Ind. Ecol. 14 (3), 512–527.
Mezher, T., Fath, H., Abbas, Z., Khaled, A., 2011. Techno-economic assessment and envi-ronmental impacts of desalination technologies. Desalination 266 (1–3), 263–273.
Mohamed, A.M.O., Maraqa, M., Al Handhaly, J., 2005. Impact of land disposal of rejectbrine from desalination plants on soil and groundwater. Desalination 182 (1–3),411–433.
Mohsen, M.S., Gammoh, S., 2010. Performance evaluation of reverse osmosis desalinationplant: a case study of Wadi Ma'in, Zara and Mujib plant. Desalin. Water Treat. 14(1–3), 265–272.
Morillo, J., Usero, J., Rosado, D., El Bakouri, H., Riaza, A., Bernaola, F.J., 2014. Comparativestudy of brine management technologies for desalination plants. Desalination 336,32–49.
Palomar, P., Losada, I.J., 2011. Impacts of brine discharge on the marine environment.Modelling as a Predictive Tool, Desalination Michael Schorr. IntechOpen https://doi.org/10.5772/14880 Available from:. https://www.intechopen.com/books/desali-nation-trends-and-technologies/impacts-of-brine-discharge-on-the-marine-envi-ronment-modelling-as-a-predictive-tool.
Pearce, G., Talo, S., Chida, K., Basha, A., Gulamhusein, A., 2004. Pretreatment options forlarge scale SWRO plants: case studies of OF trials at Kindasa, Saudi Arabia, and con-ventional pretreatment in Spain. Desalination 167, 175–189.
Pilat, B., 2001. Practice of water desalination by electrodialysis. Desalination 139 (1–3),385–392.
Pinto, F.S., Marques, R.C., 2017. Desalination projects economic feasibility: a standardiza-tion of cost determinants. Renew. Sust. Energ. Rev. 78, 904–915.
Qadir, M., 2018. Addressing trade-offs to promote safely managed wastewater in devel-oping countries. Water Econ. Pol. 4 (2), 1871002 (10 pages).
Qadir, M., Noble, A.D., Karajeh, F., George, B., 2015. Potential business opportunities fromsaline water and salt-affected land resources. Resource Recovery and Reuse Series 5vol. 5. International Water Management Institute (IWMI). CGIAR Research Programon Water, Land and Ecosystems (WLE). https://doi.org/10.5337/2015.206 (29 pp.).
Qadir, M., Jiménez, G.C., Farnum, R.L., Dodson, L.L., Smakhtin, V., 2018. Fog water collec-tion: challenges beyond technology. Water 10 (4), 372.
Qiu, T., Davies, P.A., 2012. Comparison of configurations for high-recovery inland desali-nation systems. Water 4 (3), 690–706.
Qurie, M., Abbadi, J., Scrano, L., Mecca, G., Bufo, S.A., Khamis, M., Karaman, R., 2013. Inlandtreatment of the brine generated from reverse osmosis advanced membrane
wastewater treatment plant using epuvalisation system. Int. J. Mol. Sci. 14 (7),13808–13825.
Rabinowitz, O., 2016. Nuclear energy and desalination in Israel. Bull. At. Sci. 72 (1), 32–38.Richter, B.D., Abell, D., Bacha, E., Brauman, K., Calos, S., Cohn, A., Disla, C., Friedlander
O'Brien, S., Hodges, D., Kaiser, S., Loughran, M., Mestre, C., Reardon, M., Siegfried, E.,2013. Tapped out: how can cities secure their water future? Water Policy 15 (3),335–363.
Roberts, P.J., 2015. Near field flowdynamics of concentrate discharges and diffuser design.Intakes and Outfalls for Seawater Reverse-osmosis Desalination Facilities. Springer,Cham, pp. 369–396.
Roberts, D.A., Johnston, E.L., Knott, N.A., 2010. Impacts of desalination plant discharges onthe marine environment: a critical review of published studies. Water Res. 44 (18),5117–5128.
Sánchez, A.S., Nogueira, I.B.R., Kalid, R.A., 2015. Uses of the reject brine from inland desa-lination for fish farming, Spirulina cultivation, and irrigation of forage shrub andcrops. Desalination 364, 96–107.
Schewe, J., Heinke, J., Gerten, D., Haddeland, I., Arnell, N.W., Clark, D.B., Dankers, R., Eisner,S., Fekete, B.M., Colon-Gonzalez, F.J., Gosling, S.N., Kim, H., Liu, X., Masaki, Y.,Portmann, F., Satoh, Y., Stacke, T., Tang, Q., Wada, Y., Wisser, D., Albrecht, T., Frieler,K., Piontek, F., Warszawski, L., Kabat, P., 2014. Multimodel assessment of water scar-city under climate change. Proc. Natl. Acad. Sci. 111 (9), 3245–3250.
Silber, A., Israeli, Y., Elingold, I., Levi, M., Levkovitch, I., Russo, D., Assouline, S., 2015. Irri-gationwith desalinated water: a step toward increasingwater saving and crop yields.Water Resour. Res. 51 (1), 450–464.
Singh, R., 2009. Analysis of high recovery brackish water desalination processes using fuelcells. Sep. Sci. Technol. 44 (3), 585–598.
Sood, A., Smakhtin, V., 2014. Can desalinization and clean energy combined help to alle-viate global water scarcity? J. Am. Water Resour. Assoc. https://doi.org/10.1111/jawr.12174.
Stover, R.L., 2013. Industrial and brackish water treatment with closed circuit reverse os-mosis. Desalin. Water Treat. 51 (4–6), 1124–1130.
Subramani, A., Jacangelo, J.G., 2015. Emerging desalination technologies for water treat-ment: a critical review. Water Res. 75, 164–187.
Tanaka, H., Ho, Y.S., 2011. Global trends and performances of desalination research.Desalin. Water Treat. 25 (1–3), 1–12.
Valero, F., Arbós, R., 2010. Desalination of brackish riverwater using Electrodialysis Rever-sal (EDR): control of the THMs formation in the Barcelona (NE Spain) area. Desalina-tion 253 (1–3), 170–174.
van Vliet, M.T., Flörke, M., Wada, Y., 2017. Quality matters for water scarcity. Nat. Geosci.10 (11), 800.
Vanham, D., Hoekstra, A.Y., Wada, Y., Bouraoui, F., de Roo, A., Mekonnen, M.M., van deBund, W.J., Batelaan, O., Pavelic, P., Bastiaanssen, W.G.M., Kummu, M., Rockstrom,K., Liu, J., Bisselink, B., Ronco, P., Pistocchi, A., Bidoglio, G., 2018. Physical water scar-city metrics for monitoring progress towards SDG target 6.4: an evaluation of indica-tor 6.4. 2 “level of water stress”. Sci. Total Environ. 613, 218–232.
Von Gottberg, A., Pang, A., Talavera, J.L., 2005. Optimizing water recovery and energy con-sumption for seawater RO systems. GE Water Process Technol., TP1021EN. 510,pp. 1–5.
Voutchkov, N., 2011. Overview of seawater concentrate disposal alternatives. Desalina-tion 273 (1), 205–219.
Wenten, I.G., 2016. Reverse osmosis applications: prospect and challenges. Desalination391, 112–125.
Wenten, I.G., Khoiruddin, K., Aryanti, P.T.P., Hakim, A.N., 2016. Scale-up Strategies forMembrane-Based Desalination Processes: A Review. J. Membr. Sci. Res. 2 (2), 42–58.
Wenten, I.G., Ariono, D., Purwasasmita, M., Khoirudin, 2017. Integrated processes for de-salination and salt production: a mini-review. AIP Conference Proceedings. vol. 1818(No. 1). AIP Publishing, p. 020065.
Wilf, M., Klinko, K., 2001. Optimization of seawater RO systems design. Desalination 138(1–3), 299–306.
Xu, P., Cath, T.Y., Robertson, A.P., Reinhard, M., Leckie, J.O., Drewes, J.E., 2013. Critical re-view of desalination concentratemanagement, treatment and beneficial use. Environ.Eng. Sci. 30 (8), 502–514.
Younos, T., 2005. Environmental issues of desalination. J. Contemp. Water Res. Educ. 132(1), 11–18.
Zhou, D., Zhu, L., Fu, Y., Zhu, M., Xue, L., 2015. Development of lower cost seawater desa-lination processes using nanofiltration technologies—a review. Desalination 376,109–116.