science, technology, engineering, and mathematics · pdf filescience, technology, engineering,...
TRANSCRIPT

Order Code RL33434
Science, Technology, Engineering, andMathematics (STEM) Education: Background,
Federal Policy, and Legislative Action
Updated March 21, 2008
Jeffrey J. KuenziSpecialist in Education Policy
Domestic Social Policy Division
Science, Technology, Engineering, and Mathematics(STEM) Education: Background, Federal Policy, and
Legislative Action
Summary
There is growing concern that the United States is not preparing a sufficientnumber of students, teachers, and practitioners in the areas of science, technology,engineering, and mathematics (STEM). A large majority of secondary schoolstudents fail to reach proficiency in math and science, and many are taught byteachers lacking adequate subject matter knowledge.
When compared to other nations, the math and science achievement of U.S.pupils and the rate of STEM degree attainment appear inconsistent with a nationconsidered the world leader in scientific innovation. In a recent internationalassessment of 15-year-old students, the U.S. ranked 28th in math literacy and 24th inscience literacy. Moreover, the U.S. ranks 20th among all nations in the proportionof 24-year-olds who earn degrees in natural science or engineering.
A 2005 study by the Government Accountability Office found that 207 distinctfederal STEM education programs were appropriated nearly $3 billion in FY2004.Nearly three-quarters of those funds and nearly half of the STEM programs were intwo agencies: the National Institutes of Health and the National Science Foundation.Still, the study concluded that these programs are highly decentralized and requirebetter coordination. Though uncovering many fewer individual programs, a 2007inventory compiled by the American Competitiveness Council also put the federalSTEM effort at $3 billion and concurred with many of the GAO findings regardingdecentralization and coordination.
STEM education (and competitiveness) issues have received a lot of attentionin recent years. Several high-profile proposals were forwarded by the academic andbusiness communities. In February of 2006, the President released the AmericanCompetitiveness Initiative. During the 109th Congress, three somewhat modestSTEM education programs were passed and signed into law. Finally, in the springand summer of 2007, some of the major STEM education legislative proposals werecombined into the America Competes Act of 2007, passed by the 110th Congress andsigned by the President on August 9, 2007.
This report provides the background and context to understand these legislativedevelopments. The report first presents data on the state of STEM education in theUnited States. It then examines the federal role in promoting STEM education. Thereport concludes with a discussion of the legislative actions recently taken to addressfederal STEM education policy.

Contents
Introduction . . . . . . . . . . . . . . . . . . . . . . . . . . . . . . . . . . . . . . . . . . . . . . . . . . . . . . 1
STEM Education in the United States . . . . . . . . . . . . . . . . . . . . . . . . . . . . . . . . . . 3Elementary and Secondary Education . . . . . . . . . . . . . . . . . . . . . . . . . . . . . . 3
Assessments of Math and Science Knowledge . . . . . . . . . . . . . . . . . . . 3U.S. Students Compared to Students in Other Nations . . . . . . . . . . . . . 5
Math and Science Teacher Quality . . . . . . . . . . . . . . . . . . . . . . . . . . . . . . . 10Postsecondary Education . . . . . . . . . . . . . . . . . . . . . . . . . . . . . . . . . . . . . . . 11
STEM Degrees Awarded in the United States . . . . . . . . . . . . . . . . . . . 11U.S. Degrees Awarded to Foreign Students . . . . . . . . . . . . . . . . . . . . 15International Postsecondary Educational Attainment . . . . . . . . . . . . . 15International Comparisons in STEM Education . . . . . . . . . . . . . . . . . 18
Federal Programs that Promote STEM Education . . . . . . . . . . . . . . . . . . . . . . . . 19Government Accountability Office Study . . . . . . . . . . . . . . . . . . . . . . . . . . 19Academic Competitiveness Council Study . . . . . . . . . . . . . . . . . . . . . . . . . 20
Program Effectiveness . . . . . . . . . . . . . . . . . . . . . . . . . . . . . . . . . . . . . 22Description of Selected Federal STEM Programs . . . . . . . . . . . . . . . . . . . . 23
NIH Ruth L. Kirschstein National Research Service Awards . . . . . . . 23NSF Graduate Research Fellowships . . . . . . . . . . . . . . . . . . . . . . . . . . 24NSF Mathematics and Science Partnerships . . . . . . . . . . . . . . . . . . . . 24NSF Research Experiences for Undergraduates . . . . . . . . . . . . . . . . . 26ED Science and Mathematics Access to Retain Talent Grants . . . . . . 26ED Mathematics and Science Partnerships . . . . . . . . . . . . . . . . . . . . . 26
Recommendations to Improve Federal STEM Education Policy . . . . . . . . 27
Legislation Action on STEM Education Policy . . . . . . . . . . . . . . . . . . . . . . . . . . 29Major Legislative Actions in the 109th Congress . . . . . . . . . . . . . . . . . . . . . 29The America COMPETES Act . . . . . . . . . . . . . . . . . . . . . . . . . . . . . . . . . . 30
Department of Energy . . . . . . . . . . . . . . . . . . . . . . . . . . . . . . . . . . . . . 30Education Department . . . . . . . . . . . . . . . . . . . . . . . . . . . . . . . . . . . . . 30National Science Foundation . . . . . . . . . . . . . . . . . . . . . . . . . . . . . . . . 31
List of Figures
Figure 1. NAEP Math Scores, Selected Years: 1990-2005 . . . . . . . . . . . . . . . . . 4Figure 2. STEM Degrees Awarded, 1970-2003 . . . . . . . . . . . . . . . . . . . . . . . . . 14Figure 3. Tertiary Education by Country, 1980 and 2000 . . . . . . . . . . . . . . . . . . 17Figure 4. Federal STEM Education Funding FY2006, by Agency . . . . . . . . . . . 21
List of Tables
Table 1. TIMSS Scores by Grade and Country/Jurisdiction, 2003 . . . . . . . . . . . . 6Table 2. PISA Math and Science Scores, 2003 . . . . . . . . . . . . . . . . . . . . . . . . . . . 9Table 3. Teachers Lacking a Major or Minor in Subject Taught, 1999-2000 . . . 11Table 4. Degrees Conferred by Level and Field of Study, 2002-2003 . . . . . . . . 13Table 5. Field of Study, by Selected Region and Country, 2002 . . . . . . . . . . . . 18

1 In 2005 and early 2006, at least six major reports were released by highly respected U.S.academic, scientific, and business organizations on the need to improve science andmathematics education: The Education Commission of the States, Keeping AmericaCompetitive: Five Strategies To Improve Mathematics and Science Education, July 2005;The Association of American Universities, National Defense Education and InnovationInitiative, Meeting America’s Economic and Security Challenges in the 21st Century,January 2006; The National Academy of Sciences, Committee on Science, Engineering, andPublic Policy, Rising Above the Gathering Storm: Energizing and Employing America fora Brighter Economic Future, February 2006; The National Summit on Competitiveness,Statement of the National Summit on Competitiveness: Investing in U.S. Innovation,December 2005; The Business Roundtable, Tapping America’s Potential: The Educationfor Innovation Initiative, July 2005; the Center for Strategic and International Studies,Waiting for Sputnik, 2005.
Science, Technology, Engineering, andMathematics (STEM) Education:Background, Federal Policy, and
Legislative Action
Introduction
There is growing concern that the United States is not preparing a sufficientnumber of students, teachers, and professionals in the areas of science, technology,engineering, and mathematics (STEM).1 Although the most recent NationalAssessment of Educational Progress (NAEP) results show improvement in U.S.pupils’ knowledge of math and science, the large majority of students still fail toreach adequate levels of proficiency. When compared to other nations, theachievement of U.S. pupils appears inconsistent with the nation’s role as a worldleader in scientific innovation. For example, among the 40 countries participatingin the 2003 Program for International Student Assessment (PISA), the U.S. ranked28th in math literacy and 24th in science literacy.
Some attribute poor student performance to an inadequate supply of qualifiedteachers. This appears to be the case with respect to subject-matter knowledge:many U.S. math and science teachers lack an undergraduate major or minor in thosefields — as many as half of those teaching in middle school math. Indeed, post-secondary degrees in math and physical science have steadily decreased in recentdecades as a proportion of all STEM degrees awarded. Although degrees in someSTEM fields (particularly biology and computer science) have increased in recentdecades, the overall proportion of STEM degrees awarded in the United States hashistorically remained at about 17% of all postsecondary degrees awarded.Meanwhile, many other nations have seen rapid growth in postsecondary educational

CRS-2
2 U.S. Government Accountability Office, Federal Science, Technology, Engineering, andMathematics Programs and Related Trends, GAO-06-114, October 2005. 3 The ACC was created by the Deficit Reduction Act of 2005 (P.L. 109-171) and chargedwith conducting a year-long study to identify all federal STEM education programs. U.S.Department of Education, Report of the Academic Competitiveness Council, Washington,D.C., 2007 [http://www.ed.gov/about/inits/ed/competitiveness/acc-mathscience/index.html].4 U.S. Department of Education, Report of the Academic Competitiveness Council,Washington, D.C., 2007, p. 11.5 These points were reiterated by Cornelia M. Ashby, Director of GAO’s Education,Workforce, and Income Security Team. Her testimony can be found on the GAO websiteat [http://www.gao.gov/new.items/d06702t.pdf].6 U.S. Department of Education, Report of the Academic Competitiveness Council,Washington, D.C., 2007, p. 3.
attainment — with particularly high growth in the number of STEM degreesawarded. According to the National Science Foundation, the United States currentlyranks 20th among all nations in the proportion of 24-year-olds who earn degrees innatural science or engineering. Once a leader in STEM education, the United Statesis now far behind many countries on several measures.
What has been the federal role in promoting STEM education? A study by theGovernment Accountability Office (GAO) found 207 distinct federal STEMeducation programs that were appropriated nearly $3 billion in FY2004.2 A morerecent study by the newly established Academic Competitiveness Council (ACC)found 105 STEM education programs that were appropriated just over $3 billion inFY2006.3 The ACC report attributed the difference between the number of programsfound by the two inventories to (1) programmatic changes, (2) differing definitionsof what constitutes a “program,” and (3) GAO’s reliance on unverified, agency-reported data.4 Apart from these differences, both reports came to similarconclusions. Both found that federal STEM education programs had multiple goals,provided multiple types of assistance, and were targeted at multiple groups, but thatthe bulk of this effort supports graduate and post-doctoral study in the form offellowships to improve the nation’s research capacity. Both studies concluded thatthe federal effort is highly decentralized and could benefit from strongercoordination, while noting that the creation of the National Science and TechnologyCouncil in 1993 was a step in the right direction.5 The ACC study also contained anevaluative portion and concluded that “there is a general dearth of evidence ofeffective practices and activities in STEM education.”6
Several pieces of legislation have been introduced in the 110th Congress thatwould support STEM education in the United States. Many of the proposals in thesebills have been influenced by the recommendations of several reports recently issuedby the scientific, business, and policy-making communities. Of particular influencehas been a report issued by the National Academy of Sciences (NAS), Rising Abovethe Gathering Storm: Energizing and Employing America for a Brighter EconomicFuture — also known as the “Augustine” report. Many of the recommendationsappearing in the NAS report are also contained in the Administration’s American

CRS-3
7 Office of Science and Technology Policy, Domestic Policy Council, AmericanCompetitiveness Initiative — Leading the World In Innovation, February 2006.8 For more information on NAEP and other assessments, see CRS Report RL31407,Educational Testing: Implementation of ESEA Title I-A Requirements Under the No ChildLeft Behind Act, by Wayne C. Riddle.
Competitiveness Initiative.7 Among the report’s many recommendations, five aretargeted at improving STEM education. These five recommendations seek toincrease the supply of new STEM teachers, improve the skills of current STEMteachers, enlarge the pre-collegiate pipeline, increase postsecondary degreeattainment, and enhance support for graduate and early-career research.
The purpose of this report is to put these legislative proposals into a usefulcontext. The first section analyzes data from various sources to build a morethorough understanding of the status of STEM education in the United States. Thesecond section looks at the federal role in promoting STEM education, providing abroad overview of nearly all of the programs in federal agencies and a detailed lookat a few selected programs. Finally, the third section discusses legislative optionscurrently being considered to improve STEM education. This discussion focusesprimarily on the proposals that have seen congressional action to date.
STEM Education in the United States
Elementary and Secondary Education
Assessments of Math and Science Knowledge. National-levelassessment of U.S. students’ knowledge of math and science is a relatively recentphenomenon, and assessments in other countries that provide for internationalcomparisons are even more recent. Yet the limited information available thus far isbeginning to reveal results that concern many individuals interested in the U.S.educational system and the economy’s future competitiveness. The most recentassessments show improvement in U.S. pupils’ knowledge of math and science;however, the large majority still fail to reach adequate levels of proficiency.Moreover, when compared to other nations, the achievement of U.S. students is seenby many as inconsistent with the nation’s role as a world leader in scientificinnovation.
The National Assessment of Educational Progress (NAEP) is the only nationallyrepresentative, continuing assessment of elementary and secondary students’ mathand science knowledge. Since 1969, NAEP has assessed students from both publicand nonpublic schools at grades 4, 8, and 12. Students’ performance on theassessment is measured on a 0-500 scale, and beginning in 1990 has been reportedin terms of the percentages of students attaining three achievement levels: basic,proficient, and advanced.8
Proficient is the level identified by the National Assessment Governing Boardas the degree of academic achievement that all students should reach, and “represents

CRS-4
9 The National Assessment Governing Board is an independent, bipartisan group created byCongress in 1988 to set policy for the NAEP. More information on the board and NAEPachievement levels can be found at [http://www.nagb.org/].10 U.S. Department of Education, National Center for Education Statistics, The Nation’sReport Card: Mathematics 2005, (NCES 2006-453), October 2005, p. 3.
solid academic performance. Students reaching this level have demonstratedcompetency over challenging subject matter.” In contrast, the board states that“Basic denotes partial mastery of the knowledge and skills that are fundamental forproficient work at a given grade.”9
The most recent NAEP administration occurred in 2005. Figure 1 displays theavailable results from the NAEP math tests administered between 1990 and 2005.Although the proportion of 4th and 8th grade students achieving the proficient levelor above has been increasing each year, overall math performance in these grades hasbeen quite low. The percentage performing at the basic level has not improved in 15years. About two in five students continue to achieve only partial mastery of math.In 2005, only about one-third of 4th and 8th grade students performed at the proficientlevel in math — 36% and 30%, respectively.10 The remainder of students —approximately 20% of 4th graders and just over 30% of 8th graders — scored belowthe basic level.
Source: U.S. Department of Education, National Center for Education Statistics, The Nation’s ReportCard, various years.
0%
10%
20%
30%
40%
50%
60%
70%
80%
90%
1990 1992 1996 2000 2003 2005 1990 1992 1996 2000 2003 2005 1990 1992 1996 2000 2005
4th Grade 8th Grade 12th Grade
At Basic Proficient or Above
Figure 1. NAEP Math Scores, Selected Years: 1990-2005

CRS-5
11 The 2005 mathematics framework for grade 12 introduced changes from the previousframework in order to reflect adjustments in curricular emphases and to ensure anappropriate balance of content. For further information on these changes, go to[http://nationsreportcard.gov/reading_math_grade12_2005/s0413.asp].12 U.S. Department of Education, National Center for Education Statistics, The Nation’sReport Card: Science 2005 (NCES 2006-466) May 2006, Figures 4, 14, and 24.13 More information on the development of this assessment can be found in archived CRSReport 86-683, Comparison of the Achievement of American Elementary and SecondaryPupils with Those Abroad — The Examinations Sponsored by the International Associationfor the Evaluation of Educational Achievement (IEA), by Wayne C. Riddle (available onrequest).14 Performance on the 1995 TIMSS assessment was normalized on a scale in which theaverage was set at 500 and the standard deviation at 100. Each country was weighted so thatits students contributed equally to the mean and standard deviation of the scale. To providetrend estimates, subsequent TIMSS assessments are pegged to the 1995 average.15 All the TIMSS results in this report were taken from, Patrick Gonzales, Juan CarlosGuzmán, Lisette Partelow, Erin Pahlke, Leslie Jocelyn, David Kastberg, and TrevorWilliams, Highlights From the Trends in International Mathematics and Science Study(TIMSS) 2003 (NCES 2005 — 005), December 2004.
The results among 12th grade students are mixed. Although the percent scoringat the basic level is higher among these students than among 4th and 8th gradestudents, the percent scoring proficient or above is smaller. Moreover, the resultsfrom recent years indicate that these percentages are in decline. [Note: changes in thetesting instrument may account for much if not all of this drop.11]
Similarly low levels of achievement have been found with regard to knowledgeof science. Less than one-third of 4th and 8th grade students and less than one-fifthof 12th grade students score at or above proficient in science. In 2005, the percentageof 4th, 8th, and 12th grade students scoring proficient or above was 29%, 29%, and18%, respectively; compared to 27%, 30%, and 18% in 2000 and 28%, 29%, and21% in 1996.12
U.S. Students Compared to Students in Other Nations. Anotherrelatively recent development in the area of academic assessment has been the effortby a number of nations to produce reliable cross-national comparison data.13 TheTrends in International Mathematics and Science Study (TIMSS) assessesachievement in these subjects at grades 4 and 8 among students in several countriesaround the world. TIMSS has been administered to 4th grade students on twooccasions (1995 and 2003) and to 8th grade students on three occasions (1995, 1999,and 2003). In the latest administration, 25 countries participated in assessments oftheir 4th grade students, and 45 countries participated in assessments of their 8th gradestudents. Unlike NAEP, TIMSS results are reported only in terms of numericalscores, not achievement levels.
U.S. 4th grade pupils outscored the international average on the most recentTIMSS assessment.14 The international average score for all countries participatingin the 2003 4th grade TIMSS was 495 in math and 489 in science.15 The averagescore for U.S. students was 518 in math and 536 in science. U.S. 4th grade students
CRS-6
outscored students in 13 of the 24 countries participating in the math assessment in2003. In science, U.S. students outperformed students in 16 of the 24 countries.Among the 10 Organization for Economic Co-operation and Development (OECD)member states participating in the 2003 TIMSS, U.S. 4th grade students ranked fourthin math and tied for second in science.
U.S. 8th grade pupils also outscored the international average. Among 8th gradestudents, the international average on the 2003 TIMSS was 466 in math and 473 inscience. The average score for U.S. students was 504 in math and 527 in science.Among the 44 countries participating in the 8th grade assessments in 2003, U.S.students outscored students in 25 countries in math and 32 countries in science.Twelve OECD countries participated in the 8th grade TIMSS in 2003 — fiveoutscored the United States in math and three outscored the United States in science.
TIMSS previously assessed students at grade 4 in 1995 and grade 8 in 1995 and1999. Although there was no measurable difference between U.S. 4th graders’average scores in 1995 and 2003, the standing of the United States declined relativeto that of the 14 other countries participating in both math and science assessments.In math, U.S. 4th graders outperformed students in nine of these countries in 1995,on average, compared to six countries in 2003. In science, U.S. 4th gradersoutperformed students in 13 of these countries in 1995, on average, compared toeight countries in 2003.
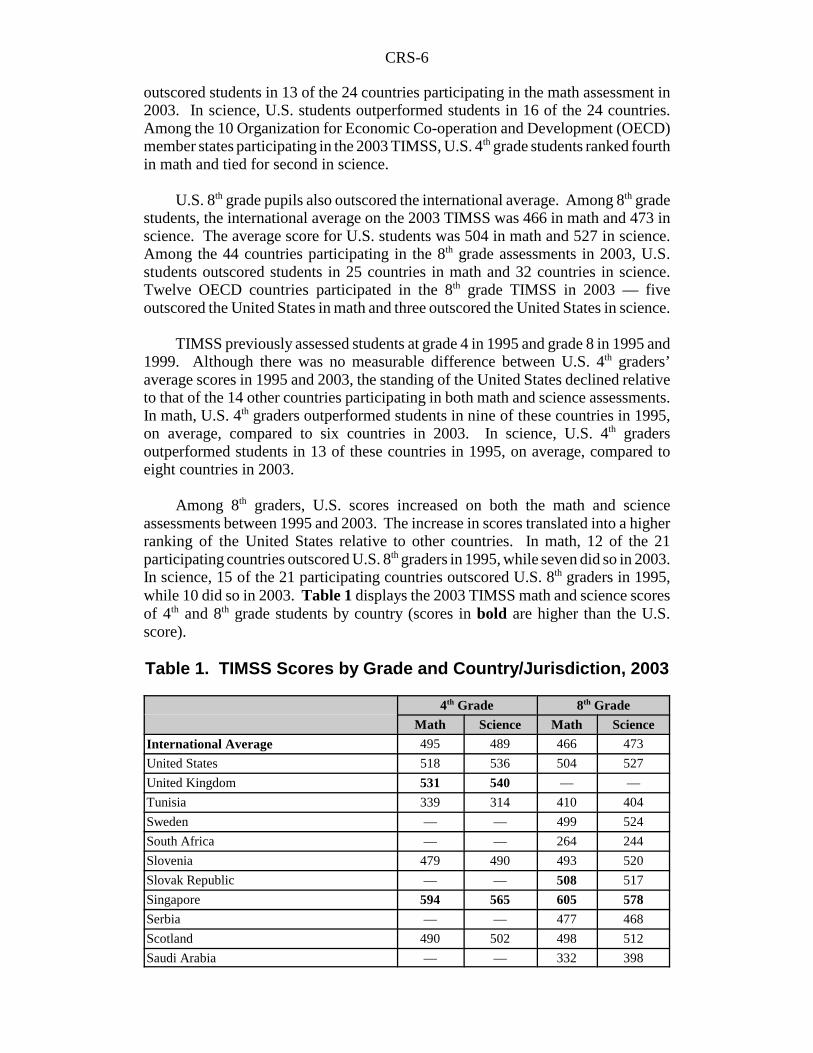
Among 8th graders, U.S. scores increased on both the math and scienceassessments between 1995 and 2003. The increase in scores translated into a higherranking of the United States relative to other countries. In math, 12 of the 21participating countries outscored U.S. 8th graders in 1995, while seven did so in 2003.In science, 15 of the 21 participating countries outscored U.S. 8th graders in 1995,while 10 did so in 2003. Table 1 displays the 2003 TIMSS math and science scoresof 4th and 8th grade students by country (scores in bold are higher than the U.S.score).
Table 1. TIMSS Scores by Grade and Country/Jurisdiction, 2003
4th Grade 8th Grade
Math Science Math Science
International Average 495 489 466 473
United States 518 536 504 527
United Kingdom 531 540 — —
Tunisia 339 314 410 404
Sweden — — 499 524
South Africa — — 264 244
Slovenia 479 490 493 520
Slovak Republic — — 508 517
Singapore 594 565 605 578
Serbia — — 477 468
Scotland 490 502 498 512
Saudi Arabia — — 332 398

CRS-7
4th Grade 8th Grade
Math Science Math Science
Russian Federation 532 526 508 514
Romania — — 475 470
Philippines 358 332 378 377
Palestinian National Authority — — 390 435
Norway 451 466 461 494
New Zealand 493 520 494 520
Netherlands 540 525 536 536
Morocco 347 304 387 396
Moldova, Republic of 504 496 460 472
Malaysia — — 508 510
Macedonia, Republic of — — 435 449
Lithuania 534 512 502 519
Lebanon — — 433 393
Latvia 536 532 508 512
Korea, Republic of — — 589 558
Jordan — — 424 475
Japan 565 543 570 552
Italy 503 516 484 491
Israel — — 496 488
Iran, Islamic Republic of 389 414 411 453
Indonesia — — 411 420
Hungary 529 530 529 543
Hong Kong SAR 575 542 586 556
Ghana — — 276 255
Estonia — — 531 552
Egypt — — 406 421
Cyprus 510 480 459 441
Chinese Taipei 564 551 585 571
Chile — — 387 413
Bulgaria — — 476 479
Botswana — — 366 365
Belgium-Flemish 551 518 537 516
Bahrain — — 401 438
Australia 499 521 505 527
Armenia 456 437 478 461
Source: U.S. Department of Education, National Center for Education Statistics, Highlights Fromthe Trends in International Mathematics and Science Study (TIMSS) 2003, NCES 2005-005, Dec.2004.

CRS-8
16 Like the TIMSS, PISA results are normalized on a scale with 500 as the average score,and results are not reported in terms of achievement levels. In 2003, PISA assessments wereadministered in just over 40 countries.
The Program for International Student Assessment (PISA) is an OECD-developed effort to measure, among other things, mathematical and scientific literacyamong students 15 years of age, that is, roughly at the end of their compulsoryeducation.16 In 2003, U.S. students scored an average of 483 on math literacy —behind 23 of the 29 OECD member states that participated and behind four of the 11non-OECD countries. The average U.S. student scored 491 on science literacy —behind 19 of the 29 OECD countries and behind three of the 11 non-OECDcountries. Table 2 displays the 2003 PISA scores on math and science literacy bycountry (scores in bold are higher than the U.S. score).

CRS-9
Table 2. PISA Math and Science Scores, 2003
2003Math Science
OECD Average 500 500United States 483 491Turkey 423 434Switzerland 527 513Sweden 509 506Spain 485 487Slovak Republic 498 495Portugal 466 468Poland 490 498Norway 495 484New Zealand 524 521Netherlands 538 524Mexico 385 405Luxembourg 493 483Korea, Republic of 542 538Japan 534 548Italy 466 487Ireland 503 505Iceland 515 495Hungary 490 503Greece 445 481Germany 503 502France 511 511Finland 544 548Denmark 514 475Czech Republic 517 523Canada 533 519Belgium 529 509Austria 506 491Australia 524 525Non-OECD CountriesUruguay 422 438United Kingdom 508 518Tunisia 359 385Thailand 417 429Serbia and Montenegro 437 436Russian Federation 468 489Macao SAR 527 525Liechtenstein 536 525Latvia 483 489Indonesia 360 395Hong Kong SAR 550 540
Source: U.S. Department of Education, National Center for Education Statistics, InternationalOutcomes of Learning in Mathematics Literacy and Problem Solving, NCES 2005-003, Dec. 2004.
CRS-10
17 Michael B. Allen, Eight Questions on Teacher Preparation: What Does the ResearchSay?, Education Commission of the States, July 2003.18 The sample is drawn from the Department of Education Common Core of Data, whichcontains virtually every school in the country.19 U.S. Department of Education, Digest of Education Statistics, 2004, NCES 2005-025,October 2005, Table 67.20 CRS analysis of Schools and Staffing Survey data, March 29, 2006.21 U.S. Department of Education, Qualifications of the Public School Teacher Workforce,May 2002, Tables B-11 and B-12.
Math and Science Teacher Quality
Many observers look to the nation’s teaching force as a source of nationalshortcomings in student math and science achievement. A recent review of theresearch on teacher quality conducted over the last 20 years revealed that, amongthose who teach math and science, having a major in the subject taught has asignificant positive impact on student achievement.17 Unfortunately, many U.S. mathand science teachers lack this credential. The Schools and Staffing Survey (SASS)is the only nationally representative survey that collects detailed data on teachers’preparation and subject assignments.18 The most recent administration of the surveyfor which public data are available took place during the 1999-2000 school year.That year, there were just under 3 million teachers in U.S. schools, about evenly splitbetween the elementary and secondary levels. Among the nation’s 1.4 million publicsecondary school teachers, 13.7% reported math as their main teaching assignmentand 11.4% reported science as their main teaching assignment.19
Nearly all public secondary school math and science teachers held at least abaccalaureate degree (99.7%), and most had some form of state teaching certification(86.2%) at the time of the survey.20 However, many of those who taught middleschool (classified as grades 5-8) math and science lacked an undergraduate orgraduate major or minor in the subject they taught. Among middle-school teachers,51.5% of those who taught math and 40.0% of those who taught science did not havea major or minor in these subjects. By contrast, few of those who taught high school(classified as grades 9-12) math or science lacked an undergraduate or graduate majoror minor in that subject. Among high school teachers, 14.5% of those who taughtmath and 11.2% of those who taught science did not have a major or minor in thesesubjects.21 Table 3 displays these statistics for teachers in eight subject areas.

CRS-11
22 Through various “completions” surveys of postsecondary institutions administeredannually since 1960, ED enumerates the number of degrees earned in each field during theprevious academic year. 23 U.S. Department of Education, National Center for Education Statistics, Digest ofEducation Statistics, 2004, NCES 2005-025, October 2005, Table 169.24 Includes Ph.D., Ed.D., and comparable degrees at the doctoral level, but excludesfirst-professional degrees, such as M.D., D.D.S., and law degrees.
Table 3. Teachers Lacking a Major or Minor in Subject Taught,1999-2000
Middle School High School
English 44.8% 13.3%
Foreign language 27.2% 28.3%
Mathematics 51.5% 14.5%
Science 40.0% 11.2%
Social science 29.6% 10.5%
ESL/bilingual education 57.6% 59.4%
Arts and music 6.8% 6.1%
Physical/health education 12.6% 9.5%
Source: U.S. Department of Education, National Center for Education Statistics, Qualifications ofthe Public School Teacher Workforce: Prevalence of Out-of-Field Teaching 1987-88 to 1999-2000,NCES 2002-603, May 2002.
Given the link between teachers’ undergraduate majors and student achievementin math and science, these data appear to comport with some of the NAEP findingsdiscussed earlier. Recall that those assessments revealed that only about one-thirdof 4th and 8th grade students performed at the proficient or higher level in math andscience. On the other hand, at the high school level, the data seem to diverge. Whilefour-fifths of math and science teachers at this level have a major in the subject, onlytwo-fifths of high school students scored proficient or above on the NAEP in thosesubjects.
Postsecondary Education
STEM Degrees Awarded in the United States. The number of studentsattaining STEM postsecondary degrees in the U.S. more than doubled between 1960and 2000; however, as a proportion of degrees in all fields, STEM degree awardshave stagnated during this period.22 In the 2002-2003 academic year, more than 2.5million degrees were awarded by postsecondary institutions in the United States.23
That year, just under 16% (399,465) of all degrees were conferred in STEM fields;all STEM degrees comprised 14.6% of associate degrees, 16.7% of baccalaureatedegrees, 12.9% of master’s degrees, and 34.8% of doctoral degrees.24 Table 4displays the distribution of degrees granted by academic level and field of study.
At the associate and baccalaureate levels, the number of STEM degrees awardedwas roughly equivalent to the number awarded in business. In 2002-2003, 92,640

CRS-12
associate degrees and 224,911 baccalaureate degrees were awarded in STEM fields,compared to 102,157 and 293,545, respectively, in business. However, nearly twiceas many master’s degrees were granted in business (127,545) as in STEM (65,897),and an even larger number of master’s degrees were awarded in education (147,448).At the doctoral level, STEM plays a larger role. Doctoral degrees awarded in STEMfields account for more than one-third of all degrees awarded at this level. Educationis the only field in which more doctoral degrees (6,835) were awarded than in thelargest three STEM fields — biology, engineering, and the physical sciences (5,003,5,333, and 3,858, respectively).
Specialization within STEM fields also varies by academic level. Engineeringwas among the most common STEM specialties at all levels of study in 2002-2003.Biology was a common specialization at the baccalaureate and doctoral levels, butnot at the master’s level. Computer science was common at all but the doctoral level.Physical sciences was a common specialization only at the doctoral level.
Figure 2 displays the trends in STEM degrees awarded over the last threedecades (excluding associate degrees). The solid line represents the number ofSTEM degrees awarded as a proportion of the total number of degrees awarded in allfields of study. The flat line indicates that the ratio of STEM degrees to all degreesawarded has historically hovered at around 17%. The bars represent the number ofdegrees awarded in each STEM sub-field as a proportion of all STEM degreesawarded. The top two segments of each bar reveal a consistent decline, since 1970,in the number of degrees awarded in math and the physical sciences. The bottomsegment of each bar shows a history of fluctuation in the number of degrees awardedin biology over the last 30 years. The middle two segments in the figure representthe proportion of degrees awarded in engineering and computer science. The figurereveals a steady decline in the proportion of STEM degrees awarded in engineeringsince 1980, and a steady increase in computer science degrees (except for acontraction that occurred in the late 1980s following a rapid expansion in the early1980s).

CRS-13
Table 4. Degrees Conferred by Level and Field of Study, 2002-2003
Associate Baccalaureate Master’s Doctoral Total
All fields 632,912 1,348,503 512,645 46,024 2,540,084
STEM fields, total 92,640 224,911 65,897 16,017 399,465
STEM, percentage of all fields 14.6% 16.7% 12.9% 34.8% 15.7%
Biological and biomedical sciences 1,496 60,072 6,990 5,003 73,561
Computer and information sciences 46,089 57,439 19,503 816 123,847
Engineering and engineering technologies 42,133 76,967 30,669 5,333 155,102
Mathematics and statistics 732 12,493 3,626 1,007 17,858
Physical sciences and science technologies 2,190 17,940 5,109 3,858 29,097
Non-STEM fields, total 540,272 1,123,592 446,748 30,007 2,140,619
Business 102,157 293,545 127,545 1,251 524,498
Education 11,199 105,790 147,448 6,835 271,272
English language and literature/letters 896 53,670 7,413 1,246 63,225
Foreign languages and area studies 1,176 23,530 4,558 1,228 30,492
Liberal arts and sciences, general studies, and humanities 216,814 40,221 3,312 78 260,425
Philosophy, theology, and religious studies/vocations 804 18,270 6,677 1,983 27,734
Psychology 1,784 78,613 17,123 4,831 102,351
Social sciences 5,422 115,488 12,109 2,989 136,008
History 316 27,730 2,525 861 31,432
Other 199,704 366,735 118,038 8,705 693,182
Source: U.S. Department of Education, National Center for Education Statistics, Digest of Education Statistics, 2004, NCES 2005-025, Oct. 2005, Table 249-252..

CRS-14Figure 2. STEM Degrees Awarded, 1970-2003
CRS-15
25 National Science Board, Science and Engineering Indicators, 2006, (NSB 06-1).Arlington, VA: National Science Foundation, January 2006, p. O-15.26 For more information on issues related to foreign students and foreign technical workers,see the following: CRS Report 97-746, Foreign Science and Engineering Presence in U.S.Institutions and the Labor Force, by Christine M. Matthews; CRS Report RL31973,Programs Funded by the H-1B Visa Education and Training Fee and Labor MarketConditions for Information Technology (IT) Workers, by Linda Levine; and CRS ReportRL30498, Immigration: Legislative Issues on Nonimmigrant Professional Specialty (H-1B)Workers, by Ruth Ellen Wasem.27 Organization for Economic Co-operation and Development, Education at a Glance, OECDIndicators 2005, Paris, France, September 2005. The OECD compiles annual data fromnational labor force surveys on educational attainment for the 30 OECD member countries,as well as 13 non-OECD countries that participate in the World Education Indicators (WEI)program. More information on sources and methods can be found at [http://www.oecd.org/dataoecd/36/39/35324864.pdf].
U.S. Degrees Awarded to Foreign Students. The increased presence offoreign students in graduate science and engineering programs and in the scientificworkforce has been and continues to be of concern to some in the scientificcommunity. Enrollment of U.S. citizens in graduate science and engineeringprograms has not kept pace with that of foreign students in these programs.According to the National Science Foundation (NSF) Survey of Earned Doctorates,foreign students earned one-third of all doctoral degrees awarded in 2003.
Doctoral degrees awarded to foreign students were concentrated in STEM fields.The NSF reports that foreign students earned “more than half of those [awarded] inengineering, 44% of those in mathematics and computer science, and 35% of thosein the physical sciences.”25 Many of these degree recipients remain in the UnitedStates to work. The same NSF report indicates that 53% of those who earned adoctorate in 1993 remained in the U.S. as of 1997, and 61% of the 1998 cohort werestill working in the United States in 2003. In addition to the number of foreignstudents in graduate science and engineering programs, a significant number ofuniversity faculty in the scientific disciplines are foreign, and foreign doctorates areemployed in large numbers by industry.26
International Postsecondary Educational Attainment. The UnitedStates has one of the highest rates of postsecondary educational attainment in theworld. In 2003, the most recent academic year for which international data areavailable, 38% of the U.S. population aged 25-64 held a postsecondary degree — 9%at the tertiary-type B (vocational level) and 29% at the tertiary-type A (universitylevel) or above. The OECD compiled comparison data from 30 OECD memberstates and 13 other nations. Three countries (Canada, Israel, and the RussianFederation) had larger shares at the two tertiary levels combined; however, all threehad lower rates at the tertiary-type A level. At the tertiary-type A level, only onecountry (Norway) had a rate as high as the United States. The average for OECDmember states was 16% at tertiary-type A and 8% at tertiary-type B.27
China and India were not included in the OECD data. Reliable information onpostsecondary educational attainment is very difficult to obtain for these countries.

CRS-16
28 The World Bank, Constructing Knowledge Societies: new challenges for tertiaryeducation, Washington, D.C., October 2002. Available at [http://siteresources.worldbank.org/EDUCATION/Resources/278200-1099079877269/547664-1099079956815/ConstructingKnowledgeSocieties.pdf].29 Unlike the OECD data, which are based on labor-force surveys of households andindividuals, the CID data are based on the United Nations Educational, Scientific andCultural Organization (UNESCO) census and survey data of the entire population.Documentation describing methodology as well as data files for the CID data is availableat [http://www.cid.harvard.edu/ciddata/ciddata.html].
The World Bank estimates that, in 1998, tertiary enrollment of the populationbetween 18 and 24 years old was 6% in China and 8% in India, up from 1.7% and5.2%, respectively, in 1980.28 Based on measures constructed by faculty at theCenter for International Development (CID), the National Science Foundation (NSF)has generated an estimate of the distribution of the world’s population that possessesa tertiary education.29 The NSF estimates that the number of people in the world whohad a tertiary education more than doubled from 73 million in 1980 to 194 millionin 2000. Moreover, the two fastest-growing countries were China and India. Chinahoused 5.4% of the world’s tertiary degree holders in 1980, and India had 4.1%; by2000, the share in these countries was 10.5% and 7.7%, respectively. Indeed, asFigure 3 indicates, China and India were the only countries to substantially increasetheir share of the world’s tertiary degree-holders during that period.

CRS-17
Figure 3. Tertiary Education by Country, 1980 and 2000
Source: National Science Foundation, Science and Engineering Indicators, 2006, Volume 1,Arlington, VA, NSB 06-01, Jan. 2006.

CRS-18
30 First university degrees are those designated Level 5A by the International StandardClassification of Education (ISCED 97), and usually require less than five years to complete.More information on this classification and the ISCED is available at [http://www.unesco.org/education/information/nfsunesco/doc/isced_1997.htm].
International Comparisons in STEM Education. The NSF has compileddata for many countries on the share of first university degrees awarded in STEMfields.30 According to these data, the United States has one of the lowest rates ofSTEM to non-STEM degree production in the world. In 2002, STEM degreesaccounted for 16.8% of all first university degrees awarded in the United States (thesame NCES figure reported at the outset of this section). The international averagefor the ratio of STEM to non-STEM degrees was 26.4% in 2002. Table 5 displaysthe field of first university degrees for regions and countries that award more than200,000 university degrees annually. Among these nations, only Brazil awards asmaller share (15.5%) of STEM degrees than the United States. By contrast, theworld leaders in the proportion of STEM degrees awarded are Japan (64.0%) andChina (52.1%). Although the U.S. ranks near the bottom in the proportion of STEMdegrees, it ranks third (behind Japan and China) in the absolute number of STEMdegrees awarded.
Table 5. Field of Study, by Selected Region and Country, 2002(or the Most Recent Year Available)
Region/Country All Fields STEM Fields Percent STEM
All Regions 9,057,193 2,395,238 26.4%
Asia 3,224,593 1,073,369 33.3%
China 929,598 484,704 52.1%
India 750,000 176,036 23.5%
Japan 548,897 351,299 64.0%
South Korea 239,793 97,307 40.6%
Middle East 445,488 104,974 23.6%
Europe 2,682,448 713,274 26.6%
France 309,009 83,984 27.2%
Spain 211,979 55,418 26.1%
United Kingdom 282,380 72,810 25.8%
Central/Eastern Europe 1,176,898 319,188 27.1%
Russia 554,814 183,729 33.1%
North/Central America 1,827,226 341,526 18.7%
Mexico 321,799 80,315 25.0%
United States 1,305,730 219,175 16.8%
South America 543,805 96,724 17.8%
Brazil 395,988 61,281 15.5%
Source: National Science Foundation, Science and Engineering Indicators, 2006, Volume 1,Arlington, VA, NSB 06-01, January 2006, Table 2-37.

CRS-19
31 U.S. Government Accountability Office, Federal Science, Technology, Engineering, andMathematics Programs and Related Trends, GAO-06-114, October 2005. The GAO studydoes not include programs in the Department of Defense because the department decidednot to participate. Other programs were omitted from the report for various reasons;typically because they did not meet the GAO criteria for a STEM-related educationalprogram (according to an April 26, 2006 conversation with the report’s lead author, TimHall).32 Attrition rates among college students majoring in STEM fields combined with the growthof foreign students in U.S. graduate STEM programs suggest that pre-college STEMeducation may be a major source of the nation’s difficulty in this area.
Federal Programs that Promote STEM Education
Government Accountability Office Study
According to a 2005 Government Accountability Office (GAO) survey of 13federal civilian agencies, in FY2004 there were 207 federal education programsdesigned to increase the number of students studying in STEM fields and/or improvethe quality of STEM education.31 About $2.8 billion was appropriated for theseprograms that year, and about 71% ($2 billion) of those funds supported 99 programsin two agencies. In 2004, the National Institutes of Health (NIH) received $998million that funded 51 programs, and the National Science Foundation (NSF)received $997 million that funded 48 programs. Seven of the 13 agencies had morethan five STEM-related education programs. In addition to the NIH and NSF, onlythree other agencies received more than $100 million for STEM-related educationprograms. In FY2004, the National Aeronautics and Space Administration (NASA)received $231 million that funded five programs, the Department of Education (ED)received $221 million that funded four programs, and the Environmental ProtectionAgency (EPA) received $121 million that funded 21 programs.
The GAO study found that most of the 207 programs had multiple goals,provided multiple types of assistance, and were targeted at multiple groups. Theanalysis identified six major program goals, four main types of assistance, and 11target groups. The findings revealed that federal STEM education programs areheavily geared toward attracting college graduates into pursuing careers in STEMfields by providing financial assistance at the graduate and postdoctoral levels.Moreover, improving K-12 teacher education in STEM areas was the least frequentof the major goals, improving infrastructure was the least frequent of the main typesof assistance, and elementary and secondary students were the least frequent grouptargeted by federal STEM education programs.32
The major goals of these programs were found by GAO to be the following (thenumber of programs with this goal is shown in parentheses):
! attract and prepare students at all educational levels to pursuecoursework in STEM areas (114),
! attract students to pursue STEM postsecondary degrees (two-yearthrough Ph.D.) and postdoctoral appointments (137),
CRS-20
! provide growth and research opportunities for college and graduatestudents in STEM fields (103),
! attract graduates to pursue careers in STEM fields (131),! improve teacher education in STEM areas (73), and! improve or expand the capacity of institutions to promote STEM
fields (90).
The four main types of assistance provided by these programs were as follows(the number of programs providing this service is shown in parentheses):
! financial support for students or scholars (131),! institutional support to improve educational quality (76),! support for teacher and faculty development (84), and ! institutional physical infrastructure support (27).
The 11 target groups served by these programs were the following (the numberof programs targeting them is shown in parentheses):
! elementary school students (28),! middle school students (34),! high school students (53),! two-year college students (58),! four-year college students (96),! graduate students (100),! postdoctoral scholars (70),! elementary school teachers (39),! secondary school teachers (50),! college faculty or instructional staff (79), and! institutions (82).
Academic Competitiveness Council Study
The Academic Competitiveness Council (ACC) was created by the DeficitReduction Act of 2005 (P.L. 109-171). Section 401A(a)(2)(B) of the act charged theACC with conducting a year-long study to
(i) identify all federal programs with a mathematics or science focus; (ii) identify the target populations being served by such programs; (iii) determine the effectiveness of such programs; (iv) identify areas of overlap or duplication in such programs; and (v) recommend ways to efficiently integrate and coordinate such programs.

CRS-21
33 U.S. Department of Education, Report of the Academic Competitiveness Council,Washington, D.C., 2007, at [http://www.ed.gov/about/inits/ed/competitiveness/acc-mathscience/index.html].34 U.S. Department of Education, Report of the Academic Competitiveness Council,Washington, D.C., 2007, p. 11.
The ACC found 105 STEM education programs that were appropriated just over$3 billion in FY2006.33 The authors of the ACC report attributed the differencebetween the number of programs found by the GAO and ACC inventories to haveoccurred for three reasons:
First, programmatic changes occurred between the time of the GAO study andthe time of the ACC effort. Second, the ACC program inventory and GAOreport used different definitions and guidelines for program inclusion.Specifically, the ACC effort included all federal agencies that supported STEMeducation programs while the GAO report did not. Lastly, differences in theprogram inventories arose because the GAO report was based solely onagency-reported data, whereas the ACC program inventory was also verified bythe Office of Management and Budget.34
According to the ACC inventory, three agencies account for nearly 80% of allfederal STEM education spending in FY2006. Figure 4 displays total federalspending for that year by agency. According to the ACC, 29% ($924 million) of totalfederal STEM funds went to NSF, 27% ($855 million) went to NIH (through theDepartment of Health and Human Services (HHS)), and 23% ($706 million) went toED.
Source: U.S. Department of Education, Report of the AcademicCompetitiveness Council, Washington, D.C., 2007
Figure 4. Federal STEM Education FundingFY2006, by Agency

CRS-22
35 These points were reiterated by Cornelia M. Ashby, Director of GAO’s Education,Workforce, and Income Security Team. Her testimony can be found on the GAO websiteat [http://www.gao.gov/new.items/d06702t.pdf].36 Ibid.37 Ibid, pp. 21-29.38 U.S. Department of Education, Report of the Academic Competitiveness Council,Washington, D.C., 2007, p. 3.
Apart from these differences, both the GAO and ACC studies came to similarfindings and conclusions about the state of the federal effort to promote STEMeducation. Both found that federal STEM education programs had multiple goals,provided multiple types of assistance, and were targeted at multiple groups. Bothconcluded that the federal effort is highly decentralized and could benefit fromstronger coordination, while noting that the creation of the National Science andTechnology Council in 1993 was a step in the right direction.35 The ACC reportstates that these programs
support activities in a wide variety of areas, including STEM curriculumdevelopment; teacher professional development, recruitment, and retention;institutional support (including programs to strengthen the educationalcapabilities of minority-serving or similar institutions); mentoring; studentfinancial assistance; outreach and recognition to motivate interest in or continuedwork in STEM fields; and research aimed at improving STEM education.36
Like the GAO results, the ACC study found that much of the federal effort inthis area comes through NSF and NIH support for graduate and post-doctoral studyin the form of fellowships to improve the nation’s research capacity. The ACCidentified 27 federally funded STEM graduate and post-doctoral fellowship andtraineeship programs with a total funding of $1.46 billion in FY2006, which is 47%of the total FY2006 federal funding in STEM education. The ACC found anadditional 43 STEM programs in nine agencies primarily focused on improvingundergraduate education that received 30% ($943 million) of the total FY2006 funds.The remaining 23% of federal STEM education funds went to 24 K-12 programs($574 million) and 11 STEM “informal education and outreach” programs ($137million).37
Program Effectiveness. The ACC study went beyond the scope of the GAOstudy in one key area: the ACC was asked to evaluative the effectiveness of federalSTEM education programs. Due to the short time frame allotted to the study, theACC could not conduct its own evaluations and, instead, had to solicit examples ofevaluations from the agencies administering the programs. After a review of theexamples submitted, the ACC concluded that “there is a general dearth of evidenceof effective practices and activities in STEM education.”38
In particular, the report states that, “Of the 115 examples submitted: 10evaluations were scientifically rigorous evaluations that produced preliminary

CRS-23
39 Ibid, p. 26.40 Ibid, p. 28.41 Appendix III of the GAO report provides very brief descriptions of programs funded at$10 million or more and the ACC report briefly describes the five largest programs in itsinventory.42 More information on the NRSA program is available at [http://grants.nih.gov/training/nrsa.htm].
findings about a program or project’s impact on education outcomes.”39 Of the tenevaluations that were considered to be “scientifically rigorous,” only three had beencompleted, were found to have a “meaningful positive impact,” and had publishedresults in academic journals. The report’s critique continued by stating that, “eventhese well-designed studies with seemingly positive impacts would require additionalreplication and validation before they could be useful” in determining what policiesand programs to promote.40
Description of Selected Federal STEM Programs
The GAO and ACC reports did not provide much detail on specific federalSTEM programs.41 This section describes the major federal STEM educationprograms including the kinds of activities they support and how they operate at thefederal, state, and/or local levels. These are the largest STEM education programsadministered by the agencies with the largest STEM education budgets, includingNIH, NSF, and ED.
NIH Ruth L. Kirschstein National Research Service Awards. Firstfunded in 1975, the Kirschstein National Research Service Awards (KNRSA)constitute the large majority of HHS/NIH’s spending on STEM education.42 Mostof these funds are used to support the Kirschstein Training Grants that providegraduate and postdoctoral fellowships in health-related fields. About 15-20% of thefunds support the Kirschstein Postdoctoral Fellowships and Kirschstein PredoctoralFellowships. The Training Grants are awarded to institutions to develop or enhanceresearch training opportunities for individuals, selected by the institution, who aretraining for careers in specified areas of interest to the institution or principalinvestigator. The Fellowship Grants are awarded directly to individuals from variousorganizations within the NIH (e.g., the National Institute on Aging) to support theparticular research interests of the individual receiving the award.
Kirschstein Award applicants must be U.S. citizens or nationals, or permanentresident aliens of the United States — individuals on temporary or student visas arenot eligible. Predoctoral trainees must have received a baccalaureate degree by thestarting date of their appointment, and must be training at the postbaccalaureate leveland be enrolled in a program leading to a Ph.D. in science or in an equivalentresearch doctoral degree program. Health-profession students who wish to interrupttheir studies for a year or more to engage in full-time research training beforecompleting their professional degrees are also eligible. Postdoctoral trainees musthave received, as of the beginning date of their appointment, a Ph.D., M.D., orcomparable doctoral degree from an accredited domestic or foreign institution.

CRS-24
43 A list of NSF-supported fields of study can be found at [http://www.nsf.gov/pubs/2005/nsf05601/nsf05601.htm#study].
Institutional grants are made for a five-year period. Trainee appointments arenormally made in 12-month increments, although short-term (two- to three-month)awards are available. No individual trainee may receive more than five years ofaggregate Kirschstein support at the predoctoral level or three years of support at thepostdoctoral level, including any combination of support from institutional traininggrants and individual fellowship awards. The annual stipend for predoctoral traineesin 2005 was about $12,000, and the postdoctoral stipend was between $20,000 and$32,000 (depending on years of experience).
In FY2004, Training Grants were awarded to 293 institutions in all but sixstates. A total of 2,356 grants were awarded, which funded nearly 9,000 predoctoralfellowships and nearly 5,500 postdoctoral fellowships. The Fellowship Grantprograms supported around 2,500 pre- and postdoctoral students in 2004. The largemajority of the Training Grants were awarded through the National Institute ofGeneral Medical Sciences.
NSF Graduate Research Fellowships. The NSF Graduate ResearchFellowships is the largest of that agency’s STEM education programs. Thesefellowships also represent one of the longest-running federal STEM programs(enacted in 1952). The purpose of this program is to increase the size and diversityof the U.S. workforce in science and engineering. The program provides three yearsof support to approximately 1,000 graduate students annually in STEM disciplineswho are pursuing research-based master’s and doctoral degrees, with additional focuson women in engineering and computer and information sciences. In 2006, 907awards were given to graduate students studying in nine major fields at 150instituions.
Applicants must be U.S. citizens or nationals, or permanent resident aliens ofthe United States; must have completed no more than twelve months of full-timegraduate study at the time of their application; and must be pursuing an advanceddegree in a STEM field supported by the National Science Foundation.43 Thefellows’ affiliated institution receives a $40,500 award — $30,000 for a 12-monthstipend and $10,500 for an annual cost-of-education allowance. These awards arefor a maximum of three years and usable over a five-year period, and provide aone-time $1,000 International Research Travel Allowance. All discipline-basedreview panels, made up of professors, researchers, and others respected in theirfields, convene for three days each year to read and evaluate applications in theirareas of expertise. In 2005, there were 29 such panels made up of more than 500experts.
NSF Mathematics and Science Partnerships. The Mathematics andScience Partnerships program is among the NSF’s largest STEM education programs.Since its inception in 2002, this program has awarded grants that support four typesof projects (the number of awards is shown in parentheses):

CRS-25
! Comprehensive Partnership projects (12) to implement change inmathematics and science education across the K-12 continuum;
! Targeted Partnership projects (28) to improve K-12 studentachievement in a narrower grade range or disciplinary focus inmathematics and/or science;
! Institute Partnership projects (8) to focus on improving middle andhigh school mathematics and science through the development ofschool-based intellectual leaders and master teachers; and
! Research, Evaluation & Technical Assistance projects (22) to buildresearch, evaluation, and infrastructure capacity for the MSP.
One of the Comprehensive Partnership projects is between the BaltimoreCounty Public Schools (BCPS) and the University of Maryland, Baltimore County(UMBC). The two main goals of the UMBC-BCPS STEM Partnership are to (1)facilitate the implementation, testing, refinement, and dissemination of promisingpractices for improving STEM student achievement, and (2) improve teacher qualityand retention in selected high-need elementary, middle, and high schools inBaltimore County Public Schools. Centered on creating and evaluatingperformance-based pre-service (internship) teacher education programs andsustainable professional development programs for teachers and administrators, theproject is designed to increase K-12 student achievement in STEM areas byincreasing teacher and administrator knowledge. Ongoing assessments of studentwork and the differentiation of instruction based upon these assessments serve toevaluate and refine instruction, curricula and assessments, professional developmentprograms, administrative leadership strategies, and directions for overall schoolimprovement in STEM areas. UMBC and BCPS collaboration is facilitated by thecreation of the Center for Excellence in STEM Education, where UMBC faculty andBCPS teachers and administrators develop projects to serve the needs of the BCPSdistrict and the university. At the center, faculty and teachers work together tosimultaneously improve the university’s STEM and teacher education departmentsand the teaching and learning culture in the BCPS.
One of the Targeted Partnership grants supports the Promoting ReflectiveInquiry in Mathematics Education Partnership, which includes Black Hills StateUniversity, Technology and Innovations in Education (TIE) of the Black HillsSpecial Services Cooperative, and the Rapid City School District in South Dakota.The overall goal of the partnership is aimed at improving achievement inmathematics for all students in Rapid City schools, with a particular goal of reducingthe achievement gap between Native American and non-Native American students.The project seeks to improve the professional capacity and sustain the quality ofK-12 in-service teachers of mathematics in the Rapid City School District, andstudent teachers of mathematics from Black Hills State University in order to provideeffective, inquiry-based mathematics instruction. Objectives include reducing thenumber of high school students taking non-college preparatory mathematics,increasing the number of students taking upper level mathematics, and increasingstudent performance on college entrance exams. To accomplish these goals, theproject provides 100 hours of professional development in combination withcontent-based workshops at the district level, and building-based activities involvingmodeling of effective lessons, peer mentoring and coaching, and lesson study.Mathematics education and discipline faculty from Black Hills State University are

CRS-26
involved in district-wide professional development activities. A cadre ofbuilding-based Mathematics Lead Teachers convenes learning teams composed ofmathematics teachers, mathematics student teachers, school counselors, and buildingadministrators to identify key issues in mathematics curriculum and instruction.
NSF Research Experiences for Undergraduates. The ResearchExperiences for Undergraduates (REU) program is the largest of the NSF STEMeducation programs that supports active research participation by undergraduatestudents. REU projects involve students in research through two avenues. REUSites are based on independent proposals to initiate and conduct projects that engagea number of students in research. REU Supplements are requested for ongoingNSF-funded research projects or are included as a component of proposals for newor renewal NSF grants or cooperative agreements. REU projects may be based in asingle discipline or academic department, or on interdisciplinary or multi-departmentresearch opportunities with a coherent intellectual theme. Undergraduate studentparticipants in either Sites or Supplements must be citizens or permanent residentsof the United States or its possessions. Students apply directly to REU Sites (ratherthat to the NSF) to participate in the program.
One of the grantees under this program is the REU Site in Microbiology at theUniversity of Iowa. The goals of this project are to (1) recruit and select brightstudents, including women, individuals with diverse backgrounds with respect togeographic origin and ethnicity, and students from non-Ph.D.-granting institutionswhere research possibilities are limited; (2) involve students in basic, experimentalresearch in microbiology; (3) expose students to a broad range of bioscience research;(4) develop each student’s critical-thinking skills; and (5) develop each student’sability to record, analyze, and present scientific information. The student participantsare integrated into faculty research programs and expected to perform like beginninggraduate students. Informal faculty-student discussions and weekly seminarssupplement laboratory research. Weekly informal lunches, two picnics, and abanquet facilitate social and scientific interactions. At the end of each summer’sprogram, the students prepare oral presentations to be given at a Summer ProgramSymposium. Each student also prepares a written research report under the guidanceof a mentor.
ED Science and Mathematics Access to Retain Talent Grants. Theestablishment of the Science and Mathematics Access to Retain Talent (SMART)Grants through the Deficit Reduction Act of 2005 (P.L. 109-171) nearly doubled theSTEM education effort under ED. In its first year of funding, FY2006, the SMARTGrants accounted for over half of ED’s STEM education spending. The SMARTGrant provides up to $4,000 for each of the third and fourth years of undergraduatestudy and is in addition to the student’s Pell Grant award.
To be eligible to receive a SMART Grant a student must be a citizen, eligibleto receive a Pell Grant, have a 3.0 cumulative grade point average, and enrolled asa full-time third or fourth year student in a science-related baccalaureate degreeprogram.
ED Mathematics and Science Partnerships. Prior to creation of theSMART Grants, the Mathematics and Science Partnership (MSP) program was the

CRS-27
44 Analysts at the Brookings Institution conducted a survey of 266 winning MSP projectsfrom 41 states. Results of the survey are available at [http://www.ed.gov/programs/mathsci/proposalreview.doc].
ED’s largest STEM program. The MSP is intended to increase the academicachievement of students in mathematics and science by enhancing the contentknowledge and teaching skills of classroom teachers. These partnerships — betweenstate education agencies, high-need school districts, and STEM faculty in institutionsof higher education — are supported by state-administered formula grants and carriedout in collaboration with the NSF-MSP program. Partnerships must use their grantsfor one or more of several specific activities. Among them are the following:
! professional development to improve math and science teachers’subject knowledge;
! activities to promote strong teaching skills among these teachers andteacher educators;
! math and science summer workshops or institutes with academic-year followup;
! recruitment of math, science, and engineering majors to teachingjobs through signing and performance incentives, stipends foralternative certification, and scholarships for advanced course work;
! development and redesign of more rigorous, standards-aligned mathand science curricula;
! distance-learning programs for math and science teachers;! and opportunities for math and science teachers to have contact with
working mathematicians, scientists, and engineers.
A review of projects funded in FY2004 revealed that most grantees focus onmath (as opposed to science) instruction in middle schools, and provide professionaldevelopment to roughly 46 teachers over a period of about 21 months.44 The surveyfound that most projects link content to state standards, and that algebra, geometry,and problem-solving are the top three math topics addressed by professionaldevelopment activities. Most projects administer content knowledge tests toteachers, conduct observations, and make pre-and post-test comparisons. About halfof the projects develop their own tests for teachers, and most rely on state tests ofacademic achievement to measure student knowledge.
Recommendations to Improve Federal STEM Education Policy
Many prominent reports from the scientific community have received seriousconsideration and their recommendations have been incorporated into legislativeproposals that have ultimately gained passage. These recommendations concernevery aspect of the educational pipeline. All of the recent reports issuing STEMeducation policy recommendations focus on five areas: improving elementary andsecondary preparation in math and science, recruiting new elementary and secondarymath and science teachers, retooling current math and science teachers, increasingthe number of undergraduate STEM degrees awarded, and supporting graduate andearly-career research.

CRS-28
As mentioned at the outset of this report, one report that has been of particularinfluence in the STEM debate is from the National Academy of Sciences (NAS) —Rising Above the Gathering Storm. This influence is perhaps due to the clear targetsand concrete programs laid out in the report. The NAS report’s fiverecommendations to improve STEM education are to
! quadruple middle- and high-school math and science course-takingby 2010,
! recruit 10,000 new math and science teachers per year,! strengthen the skills of 250,000 current math and science teachers,! increase the number of STEM baccalaureate degrees awarded, and! support graduate and early-career research in STEM fields.
To enlarge the pipeline of future STEM degree recipients, NAS sets a goal of
quadrupling the number of middle and high school students taking AdvancedPlacement (AP) or International Baccalaureate (IB) math or science courses, from thecurrent 1.1 million to 4.5 million by 2010. NAS further sets a goal of increasing thenumber of students who pass either the AP or IB tests to 700,000 by 2010. Toenlarge the pipeline, NAS also supports the expansion of programs such as statewidespecialty high schools for STEM immersion and inquiry-based learning throughlaboratory experience, summer internships, and other research opportunities.
To recruit 10,000 new STEM teachers, NAS advocates the creation of acompetitive grant program to award merit-based scholarships to obtain a four-yearSTEM degree in conjunction with certification as a K-12 mathematics or scienceteacher. These $10,000 to $20,000 awards could be used only for educationalexpenses and would require a five-year service commitment. An additional $10,000annual bonus would be awarded to participating teachers in underserved schools ininner cities and rural areas. In further support of this scholarship program, NASrecommends that five-year, $1 million matching grants be awarded to postsecondaryinstitutions to encourage the creation of programs that integrate the obtainment of aSTEM bachelor’s degree with teacher certification.
NAS proposes four approaches to achieving the goal of strengthening the skillsof 250,000 current STEM teachers. First, NAS proposes that matching grants beawarded to support the establishment of state and regional summer institutes forSTEM teachers modeled after the Merck Institute for Science Education. Second,NAS proposes that additional grants go to postsecondary institutions that supportSTEM master’s degree programs for current STEM teachers (with or without STEMbachelor’s degrees) modeled after the University of Pennsylvania Science TeachersInstitute. Third, NAS proposes that programs be created to train current teachers toprovide AP, IB, and pre-AP or pre-IB instruction modeled after the AdvancedPlacement Initiative and the Laying the Foundation programs. Fourth, NAS proposesthe creation of a national panel to collect, evaluate, and develop rigorous K-12 STEMcurricula modeled after Project Lead the Way.
To increase STEM bachelor’s degree attainment, NAS proposes providing25,000 new scholarships each year. These Undergraduate Scholar Awards inScience, Technology, Engineering, and Mathematics (USA-STEM) would bedistributed to each state in proportion with its population, and awarded to students

CRS-29
45 The Education Commission of the States, Keeping America Competitive: Five StrategiesTo Improve Mathematics and Science Education, July 2005; The Association of AmericanUniversities, National Defense Education and Innovation Initiative, Meeting America’sEconomic and Security Challenges in the 21st Century, January 2006; The NationalAcademy of Sciences, Committee on Science, Engineering, and Public Policy, Rising Abovethe Gathering Storm: Energizing and Employing America for a Brighter Economic Future,February 2006; The National Summit on Competitiveness, Statement of the National Summiton Competitiveness: Investing in U.S. Innovation, December 2005; The BusinessRoundtable, Tapping America’s Potential: The Education for Innovation Initiative, July2005; The Center for Strategic and International Studies, Waiting for Sputnik, 2005.
based on competitive national exams. The $20,000 scholarships could only go toU.S. citizens, and could only be used for the payment of tuition and fees in pursuitof a STEM degree at a U.S. postsecondary institution.
To increase graduate study in areas of national need, including STEM, NASproposes the creation of 5,000 new fellowships each year to U.S. citizens pursuingdoctoral degrees. The fellowships would be administered by the National ScienceFoundation, which would also draw on the advice of several federal agencies indetermining the areas of need. An annual stipend of $30,000 would be accompaniedby an additional $20,000 annually to cover the cost of tuition and fees. Thesefellowships would also be portable, so that students could choose to study at aparticular institution without the influence of faculty research grants.
Legislation Action on STEM Education Policy
In recent years, several pieces of legislation have been introduced with thepurpose of improving STEM education in the United States. As has been noted,many of the proposals in these bills have been influenced by the recommendationsof several reports recently issued by leading academic, scientific, and businessorganizations.45 These recommendations, particularly those from the businesscommunity, are not limited to the educational system. This report does not discussthese non-educational policy recommendations (e.g., immigration policies that affectthe supply of foreign workers to fill U.S. demand in STEM occupations or policiesdesigned to incent private-sector research and development). Rather, this concludingsection reviews proposals that have gained passage in the 109th and 110th Congressesthat seek to improve the various STEM education outcomes discussed at the outsetof this report.
Major Legislative Actions in the 109th Congress
Three bills containing STEM education-related proposals were passed in the109th Congress and signed into law. The National Aeronautics and SpaceAdministration Authorization Act of 2005 (P.L. 109-155) directed the Administratorto develop, expand, and evaluate educational outreach programs in science and spacethat serve elementary and secondary schools. The National Defense AuthorizationAct of 2006 (P.L. 109-163) made permanent the Science, Mathematics and Researchfor Transformation pilot program initiated by the Defense Act of 2005 to address

CRS-30
deficiencies of scientists and engineers in the national security workforce. TheDeficit Reduction Act of 2005 (P.L. 109-171) established the AcademicCompetitiveness Grants and the National Science and Mathematics Access to RetainTalent Grants programs, which supplement Pell Grants for students studyingmathematics, technology, engineering, critical foreign languages, and physical, life,and computer sciences. The act also established the Academic CompetitivenessCouncil, chaired by the Secretary of Education and charged with identifying andevaluating all federal STEM programs, and recommending reforms to improveprogram integration and coordination. The Council released the findings of its studyin May 2007 (discussed earlier in this report).
The America COMPETES Act
The 110th Congress passed the America Creating Opportunities to MeaningfullyPromote Excellence in Technology, Education, and Science Act (known as theAmerica COMPETES Act) which was signed into law on August 9, 2007 (P.L. 110-69). The act expands existing STEM education programs and establishes severalnew programs under the Department of Energy (DOE), Department of Education(ED), and the National Science Foundation (NSF). A brief discussion of the majorprovisions of the act follows.
Department of Energy. Title V of the act establishes several STEMeducation programs under the DOE. In an effort to draw middle and secondaryschool students into the STEM educational pipeline, the act creates (1) a pilotprogram that awards grants to states to help establish or expand statewide SpecialtySchools for Mathematics and Science and (2) a program to provide internships tosupport Experiential-Based Learning Opportunities for middle and high-schoolstudents at the national labs, with priority given to students from high-needs schools.To improve K-12 teaching, the act creates (1) a program to establish a Center ofExcellence in each national laboratory region in order to develop and disseminatebest practices in STEM education and (2) a program to support Summer Institutes atthe national labs and partner universities in order to improve the STEM contentknowledge of current teachers. To encourage the pursuit of STEM fields amongadvanced students and young scholars, the act creates (1) grants to promote theestablishment of Talent Expansion academic programs in nuclear and hydrocarbonstudies, (2) PACE Graduate Fellowships for those studying a “mission area of theDepartment,” and (3) Early Career Awards for new STEM research scientists. Theact also appoints a new Director for STEM Education at the Department who wouldcoordinate DOE education activities and serve as an interagency liaison for K-12STEM education.
Education Department. Title VI of the act authorizes several new grantprograms in ED to enhance STEM education. Subtitle A authorizes three newprograms to improve K-12 teaching: (1) a Baccalaureate Degrees program thatencourages STEM majors to concurrently obtain teaching certification, (2) a Master’sDegrees program to upgrade the skills of current teachers through two to three yearsof part-time study or to support one-year programs to bring STEM professionals intoteaching, and (3) a program to increase the number of Advanced Placement andInternational Baccalaureate teachers by 70,000. Subtitle B establishes three newprograms specifically directed at improving students’ math achievement. These
CRS-31
programs award competitive grants to LEAs (through states) and include the MathNow program to improve math instruction at elementary schools with low mathperformance, the Summer Term Education program to provide additional instructionin high-need LEAs, and the Secondary School program that funds the hiring of mathcoaches. Subtitle D authorizes a new competitive state grant program to improve theAlignment of Secondary School Graduation Requirements with postsecondary andworkforce demands and develop P-16 Data Systems. Subtitle E providesMathematics and Science Partnership Bonus Grants for high-poverty elementary andsecondary schools in each state.
National Science Foundation. Title VII of the act seeks to double spendingon NSF STEM education programs in seven years. Most of these funds are directedat a number of existing STEM education programs at NSF. These programs includethe Robert Noyce Teacher Scholarship program that recruits and trains math andscience teachers, the Math and Science Education Partnerships program, the STEMTalent Expansion program to increase the number of students receiving associate orbaccalaureate degrees, the Advanced Technological Education program to promoteimprovement in the education of science and engineering technicians at theundergraduate and secondary school levels, the Graduate Research Fellowshipprogram that provides three years of support for graduate study in STEM fieldsleading to research-based master’s or doctoral degrees, and the Integrative GraduateEducation and Research Traineeship program that supports collaborative researchthat transcends traditional disciplinary boundaries. The act amends the MSP programto add a new Teacher Institutes for the 21st Century program that provides additionalprofessional development to STEM teachers in high-need schools and amends theNoyce Scholarship program to add a new Teaching Fellowships program thatprovides salary supplements. The act further creates a Laboratory Science Pilotprogram to award grants to improve laboratories at the secondary school level anda program to award grants to institutions of higher education to develop ProfessionalScience Master’s Degree programs.