science,’monitoring’and’predic0on’ ofelniñoinperu’ · fenómeno el niño (enfen),...
TRANSCRIPT
Science, monitoring and predic0on of El Niño in Peru Ken Takahashi, Ph.D.
IRI, NY, November 16, 2015
Scientific researcher, Instituto Geofísico del Perú Technical Coordinator of the Multisectoral Committee for the
National Study of El Niño (ENFEN)
1

Monthly rainfall in El Salto (3°S; mm/day)
Sea surface temperature in Pto. Chicama (7°S; °C)
Mean sea level in Callao (12°S; cm)
Extreme
Moderate
Extreme
Mod. W Weak W W
El Niño in the Peruvian coast
2 The extreme El Niño cost 7% (1982-83) and 4.5% (1997-98)
of Peru’s gross national product (CAF 2000).
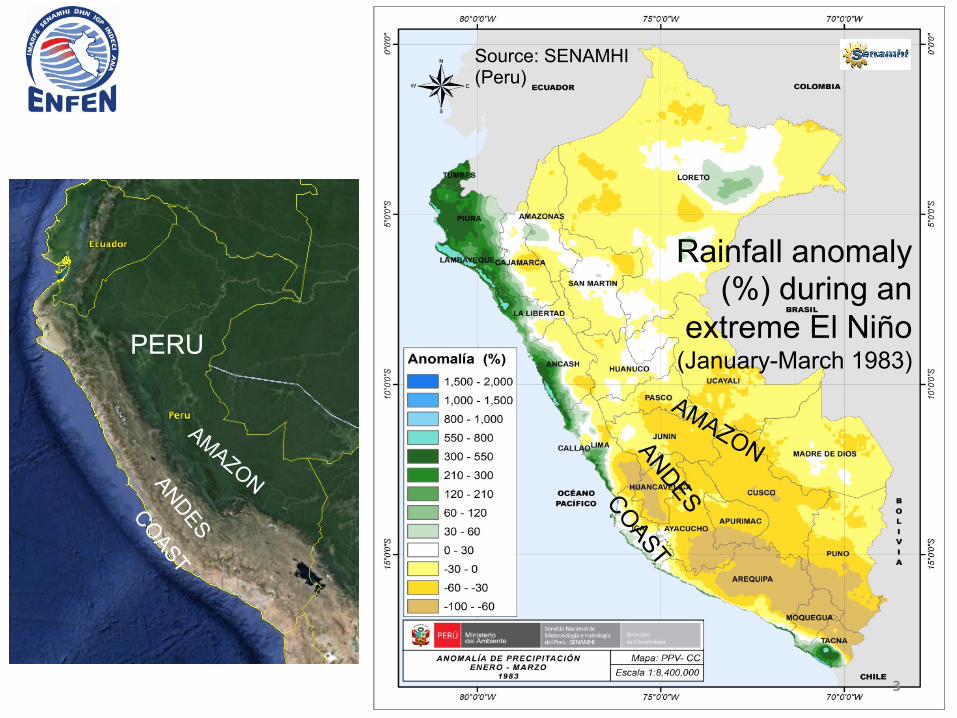
Source: SENAMHI (Peru)
Rainfall anomaly (%) during an
extreme El Niño (January-March 1983)
3
PERU
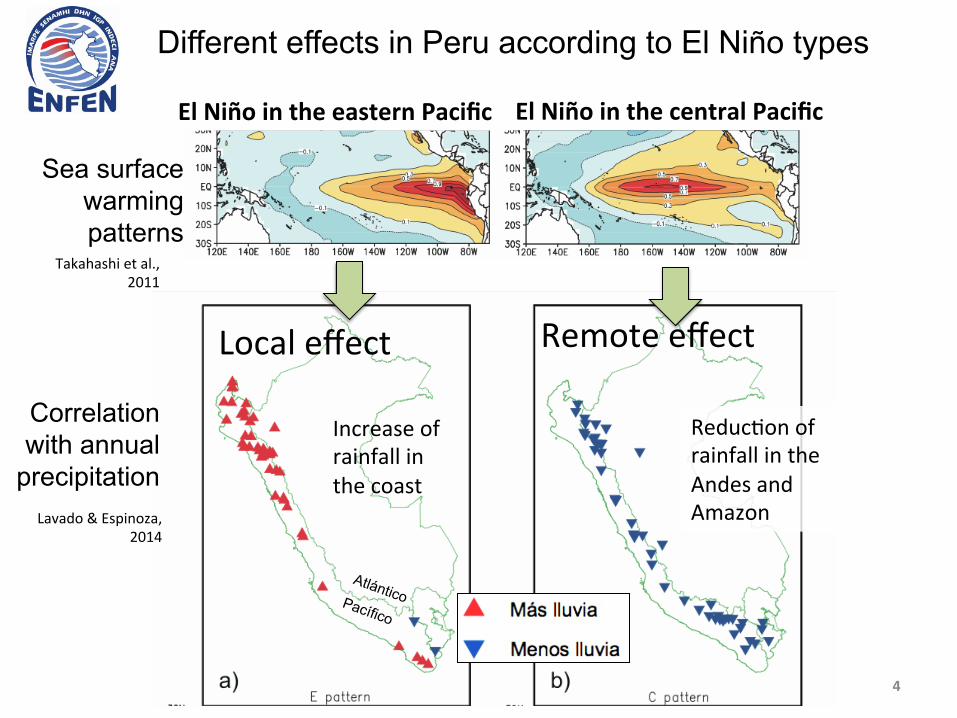
Sea surface warming patterns
El Niño in the eastern Pacific El Niño in the central Pacific
Lavado & Espinoza, 2014
Increase of rainfall in the coast
Reduc0on of rainfall in the Andes and Amazon
Takahashi et al., 2011
Correlation with annual
precipitation
Local effect Remote effect
4
Different effects in Peru according to El Niño types

Some types of El Niño
December-February sea surface temperature anomalies (°C)
“Extreme El Niño”
“Canonical El Niño” (Rasmusson & Carpenter 1982)
“Dateline/Warm pool/Modoki/Central Pacific El
Niño”
Takahashi, 2014
3Boletín Técnico - Vol. 1 Nº 1 Enero del 2014
El Programa Presupuestal por Resultados (PPR) es una estrategia de gestión pública que vincula la asignación de recursos a productos y resultados medibles a favor de la población. Dichos resultados se vienen implementando progresivamente a través de los programas presupuestales, las acciones de seguimiento del desempeño sobre la base de indicadores, las evaluaciones y los incentivos a la gestión, entre otros instrumentos que determina el Ministerio de Economía y Finanzas (MEF) a través de la Dirección General de Presupuesto Público, en colaboración con las demás entidades del Estado.
El Instituto Geofísico del Perú (IGP) viene participando en el Programa Presupuestal por Resultados 068: “Reducción de vulnerabilidad y atención de emergencias por desastres”. A partir del año 2014, algunas de las instituciones integrantes del Comité Multisectorial para el Estudio Nacional del Fenómeno El Niño (ENFEN) participan en este PPR con el producto denominado “Entidades informadas en forma permanente y con pronósticos frente al Fenómeno El Niño”, que consiste en la entrega en forma oportuna de información científica sobre el monitoreo y pronóstico de este evento natural oceáno-atmosférico, mediante informes técnicos mensuales, que permitan la toma de decisiones a autoridades a nivel nacional y regional.
A este producto, el IGP contribuye con la actividad “Generación de modelos climáticos para el pronóstico de la ocurrencia del Fenómeno El Niño”, la cual incluye la síntesis y evaluación de los pronósticos de modelos climáticos internacionales, el desarrollo y validación de nuevos modelos de pronóstico, así como el desarrollo de investigación científica que fortalecerá en forma continua la capacidad para este fin.
El presente Boletín tiene como objetivo difundir conocimientos científicos, avances de investigación y noticias relacionadas a este tema, con la finalidad de mantener informados a los usuarios y proporcionarles las herramientas para un uso óptimo de la información presentada. Además, comparte una versión resumida del Informe Técnico que el IGP elabora mensualmente para cumplir con los compromisos asumidos en el marco del PpR 068. Dicho Informe contiene información actualizada operativamente y proporcionada por el IGP como insumo para que el ENFEN genere en forma colegiada la evaluación final que será diseminada a los usuarios. Se advierte que, en caso de discrepancias, el Informe Técnico del ENFEN prevalecerá.
Los resultados de esta actividad están disponibles en: www.igp.gob.pe/sysppr.
“Programa Presupuestal por Resultados Nº 68 “Reducción de vulnerabilidad y atención de emergencias por desastres”.Producto: Entidades Informadas en forma permanente y con pronósticos frente al Fenómeno del El Niño. Actividad: Generación de modelos climáticos para el pronóstico de la ocurrencia del Fenómeno El Niño.
Manuel Pulgar VidalMinistro del Ambiente
Ronald Woodman Presidente Ejecutivo IGP
José Macharé Director Técnico IGP
Ken TakahashiResponsable Producto El Niño - IGP
Equipo de investigación: Ken Takahashi, Kobi Mosquera, Jorge Reupo, Berlín Segura
Edición: Cristiana LeucciDiseño y Diagramación: Dante Guerra
Editado por: Instituto Geofísico del PerúCalle Badajoz 169 Mayorazgo IV Etapa - AteTeléfono: (511) 3172300
Impreso por: Lettera Gráfica SACJr. Emilio Althaus 460 linceTeléfono: (511) 471 0700
Lima, febrero del 2014
Hecho el Depósito Legal en laBiblioteca Nacional del Perú Nº 2014-02860
IGP ENFEN
ENFEN
El Instituto Geofísico del Perú es una institución pública al servicio del país, adscrito al Ministerio del Ambiente, que genera, utiliza \� WUDQV¿HUH� FRQRFLPLHQWRV� H� LQIRUPDFLyQ�FLHQWt¿FD� \� WHFQROyJLFD� HQ� HO� FDPSR� GH� OD�JHRItVLFD�\�FLHQFLDV�D¿QHV�� IRUPD�SDUWH�GH� OD�FRPXQLGDG�FLHQWt¿FD�LQWHUQDFLRQDO�\�FRQWULEX\H�a la gestión del ambiente geofísico con énfasis en la prevención y mitigación de desastres naturales y de origen antrópico. En el marco del Comité Multisectorial para el Estudio Nacional del Fenómeno El Niño (ENFEN), el IGP rutinariamente aporta información experta sobre modelos y pronósticos relacionados con El Niño y fenómenos asociados.
El Comité Multisectorial para el Estudio Nacional del Fenómeno El Niño (ENFEN), conformado por representantes de IMARPE, DHN, IGP, SENAMHI, ANA e INDECI, es el ente TXH�JHQHUD�OD�LQIRUPDFLyQ�R¿FLDO�GH�PRQLWRUHR�\�SURQyVWLFR�del Fenómeno El Niño y otros asociados.
Según Resolución Ministerial 761-97-PE, el ENFEN tiene entre sus funciones el “mantener informado sobre la posible ocurrencia del Fenómeno El Niño, para que con ello se permita adoptar decisiones para adecuar y proteger la infraestructura existente en los distintos sectores, en prevención a los posibles daños que pudiera causar este fenómeno a la economía nacional y la población peruana”, así como “orientar a los diversos sectores medidas pragmáticas de previsión que permitan reducir daños y/o DSURYHFKDU�EHQH¿FLRV´�
3DUD�HVWH�¿Q��HO�(1)(1�UHDOL]D�HO�SURQyVWLFR��PRQLWRUHR�\�estudio continuo de las anomalías del océano y la atmósfera del mar peruano y a nivel global, a través de la elaboración GH�HVWXGLRV�\�DQiOLVLV�FLHQWt¿FRV�EDVDGRV�HQ�OD�LQIRUPDFLyQ�proveniente de diversas redes de observación y modelos GH� YDULDEOHV�RFHDQRJUi¿FDV��PHWHRUROyJLFDV�� KLGUROyJLFDV�y biológico-pesqueras. También, al menos mensualmente, emite pronunciamientos que son “preparados FROHJLDGDPHQWH��DFRSLDQGR� OD�PHMRU� LQIRUPDFLyQ�FLHQWt¿FD�disponible y de competencia de cada institución respecto de su sector y genera la información técnica en forma colegiada para su difusión a los usuarios”.
Además, un objetivo central del ENFEN es “estudiar HO� )HQyPHQR� (O� 1LxR�� FRQ� HO� ¿Q� GH� ORJUDU� XQD� PHMRU�comprensión del mismo, poder predecirlo y determinar sus probables consecuencias”, lo cual se desarrolla mediante la LQYHVWLJDFLyQ�FLHQWt¿FD�
El ENFEN es el
ente que genera la información oficial de
monitoreo y pronóstico del Fenómeno del
Niño y otros asociados.
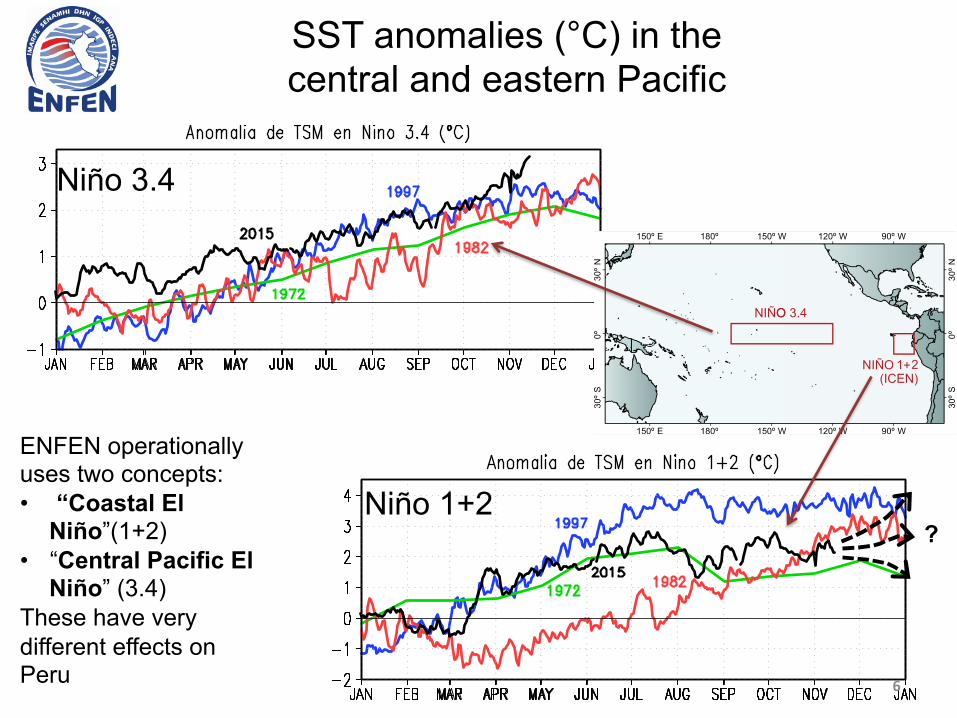
El mapa muestra las dos UHJLRQHV� TXH� GH¿QHQ� ORV�principales índices de WHPSHUDWXUD� VXSHU¿FLDO� GHO�PDU�utilizadas para monitorizar El Niño y La Niña. La región Niño 1+2 (90º-80ºW, 10ºS-0), en la que se basa el Índice Costero El Niño (ICEN), se relaciona con impactos en la costa peruana, mientras que la región Niño 3.4 (5ºS-5ºN, 170ºW-120ºW) se asocia a impactos remotos en todo el mundo, incluyendo los Andes y Amazonía peruana.
90º W
90º W
120º W
120º W
150º W
150º W
180º
180º
150º E
150º E
30º N
30º N
0º
0º
30º S
30º S
NIÑO(ICEN)
NIÑOO 3.4
+ 21
SST anomalies (°C) in the central and eastern Pacific
Niño 3.4
ENFEN operationally uses two concepts: • “Coastal El
Niño”(1+2) • “Central Pacific El
Niño” (3.4) These have very different effects on Peru
?
6
Niño 1+2
Reupo & Takahashi,
2014
10 PPR / El Niño - IGP
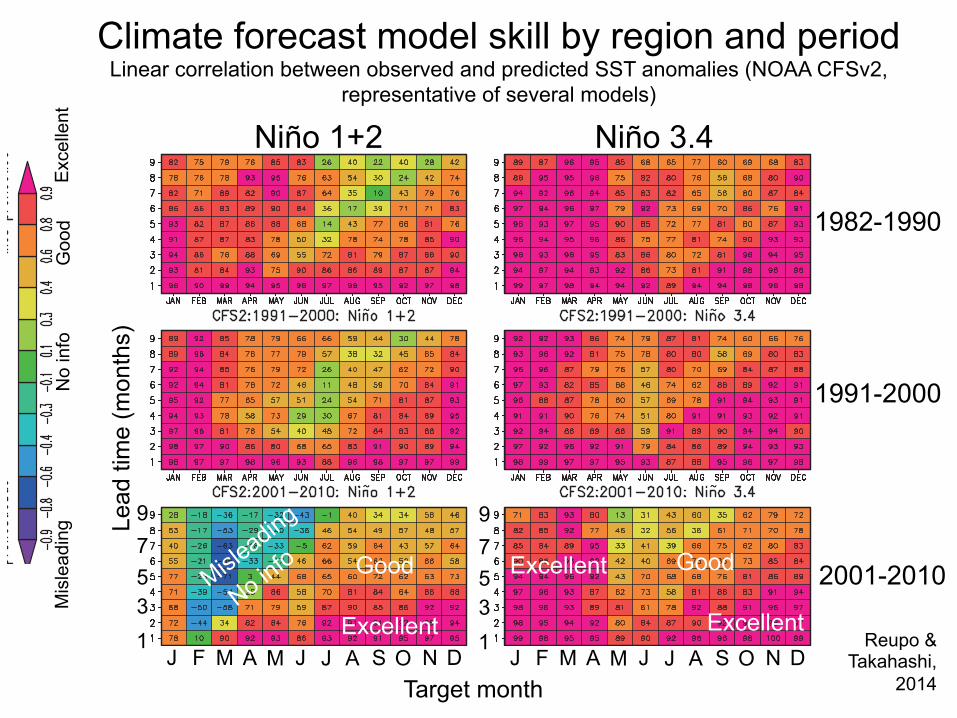
)LJXUD����&RH¿FLHQWHV�GH�FRUUHODFLyQ�OLQHDO�HQWUH�HO�SURQyVWLFR�PHQVXDO�GH�anomalía de TSM del modelo NOAA NCEP CFS v2 y observaciones (OI SST v2 de NOAA) en las regiones Niño 1+2 (izquierda) y 3.4 (derecha) para los periodos 1982-1990 (arriba), 1991-2000 (medio) y 2001-2010 (abajo); los valores indicados en texto fueron multiplicados por el factor 100.
Figura 2. Similar a la Figura 1, pero para el modelo NASA GEOS5.
DiscusiónEn resumen, las correlaciones entre los pronósticos y lo observado son sustancialmente menores para el periodo 2001-2010
valores menores de estos meses se observan en el modelo GFDL). En el segundo periodo se observan índices de correlación entre 0.6 y 1 para los cuatro primeros leads, sus valores descienden en los últimos leads de los meses entre junio y octubre. En el último periodo los índices de correlación disminuyen solo en los leads entre siete y nueve, comparándolos con los dos periodos anteriores con valores entre 0.3 y 0.1 en los meses de mayo a octubre.
comparado con los dos anteriores (1982-1990 y 1991-2000), siendo la reducción más dramática para la región Niño 1+2, frente a Sudamérica. Inclusivo las correlaciones llegan a ser negativas en los meses de febrero y marzo, señalando una baja predictibilidad para el periodo de lluvias en la costa norte. La implicancia práctica de este resultado es que, si bien los modelos continúan siendo la principal herramienta de pronóstico con varios meses de anticipación, se debe ser muy cuidadoso con cómo se interpretan los resultados, teniendo en mente las posibles fuentes de error, monitoreando el desempeño de los pronósticos, y aplicando un ¿UPH�FRQRFLPLHQWR�WHyULFR�GH�ORV�SURFHVRV�ItVLFRV�TXH�VXE\DFHQ�D�estos pronósticos.
Esta baja correlación podría estar asociada a la predominancia de ORV�HYHQWRV� ³(O�1LxR�0RGRNL´� �$VKRN�HW�DO���������YHU�7DNDKDVKL��2014), una de cuyas características incluye anomalías de WHPSHUDWXUD�VXSHU¿FLDO�SULQFLSDOPHQWH�HQ�HO�3DFt¿FR�FHQWUDO�\�XQD�débil señal frente a Sudamérica. El cambio en las características de El Niño y su predictibilidad podría estar asociado a cambios GHFDGDOHV�HQ�HO�FOLPD�GHO�3DFL¿FR��TXH�SRGUtDQ�VHU�WDQWR�QDWXUDOHV�como producidos por el hombre. Barnston y Tippett (2013), quienes encontraron resultados similares para el modelo CFS2 y su versión anterior, atribuyen los cambios en predictibilidad a las variaciones decadales en los errores promedio del modelo. Los efectos de la variabilidad decadal y el cambio climático sobre El Niño y su predictibilidad es un tema de estudio actual.
Referencias Ashok, K., S.K. Behera, S.A. Rao, H. Weng, and T. Yamagata, 2007: El Nino Modoki and its possible teleconnections, Journal of Geophysical Research, 112.
Barnston, A. G., M. K. Tippett, 2013: Predictions of Nino3.4 SST in CFSv1 and CFSv2: a diagnostic comparison, Climate Dynamics, 41, 1615–1633, doi:10.1007/s00382-013-1845-2.
Kirtman, B. P. y coautores, 2013: The North American Multi-Model Ensemble (NMME): Phase-1 Seasonal to interannual prediction, Phase-2 Toward developing intra-seasonal prediction, Bulletin of the American Meteorological Society, doi:10.1175/ BAMS-D-12-00050.1.
Reupo, J. y K. Takahashi, 2014: Validación de pronósticos con modelos globales: Correlaciones de TSM (1982-2010), Boletín Técnico “Generación de modelos climáticos para el pronóstico de la ocurrencia del Fenómeno El Niño”, Vol. 1, N°1, Enero, Instituto Geofísico del Perú.
Takahashi, K., 2014: Variedades de El Niño, Boletín Técnico “Generación de modelos climáticos para el pronóstico de la ocurrencia del Fenómeno El Niño”, Vol. 1, No.2, Febrero, Instituto Geofísico del Perú.
Takahashi, K., K. Mosquera, J. Reupo, 2014: El Índice Costero El Niño (ICEN): historia y actualización, Boletín Técnico “Generación de modelos climáticos para el pronóstico de la ocurrencia del fenómeno El Niño” ,Vol. 1, No.2, Febrero, Instituto Geofísico del Perú.
Variabilidad decadal de la bondad de los pronósticos con modelos climáticos globales Reupo J.��7DNDKDVKL�K.
Climate forecast model skill by region and period Linear correlation between observed and predicted SST anomalies (NOAA CFSv2,
representative of several models)
Niño 1+2 Niño 3.4
1982-1990
1991-2000
2001-2010
Lead
tim
e (m
onth
s)
10PPR
/ El Ni
ño - IGP
)LJXUD
����&RH¿
FLHQWHV�
GH�FRUUH
ODFLyQ�O
LQHDO�HQ
WUH�HO�S
URQyVWL
FR�PHQV
XDO�GH�
anom
alía d
e TSM
del m
odelo
NOA
A NCE
P CFS
v2 y
obse
rvacio
nes (
OI
SST v
2 de N
OAA)
en la
s reg
iones
Niño
1+2 (
izquie
rda) y
3.4 (
derec
ha)
para
los p
eriod
os 1
982-1
990
(arrib
a), 1
991-2
000
(med
io) y
2001
-2010
(ab
ajo); l
os va
lores
indic
ados
en te
xto fu
eron m
ultipli
cado
s por
el fac
tor
100.
Figura
2. Si
milar
a la
Figura
1, pe
ro pa
ra el
mode
lo NA
SA G
EOS5
.
Discus
iónEn
resumen
, las cor
relacion
es entre
los pro
nóstico
s y lo o
bservad
o son
susta
ncialme
nte men
ores p
ara el
periodo
2001
-2010
valores
menores
de esto
s mese
s se obs
ervan en
el mode
lo GFDL
). En
el segu
ndo pe
riodo s
e obse
rvan índ
ices de
correla
ción en
tre 0.6
y 1 para
los cua
tro prim
eros lea
ds, sus
valores
descien
den en
los
últimos l
eads
de los
meses
entre
junio y
octubre.
En el
último
periodo
los índ
ices de
correla
ción dis
minuye
n solo
en los
leads
entr
e siete
y nueve
, compa
rándolos
con los
dos per
iodos an
teriores
con val
ores ent
re 0.3 y
0.1 en
los mes
es de m
ayo a o
ctubre.
compara
do con
los do
s anter
iores (
1982-19
90 y 1
991-200
0), sien
do la re
ducción
más dr
amática
para la
región
Niño 1+
2, frente
a S
udamér
ica. Inc
lusivo l
as corre
lacione
s llegan
a ser n
egativa
s en
los mes
es de fe
brero y
marzo,
señalan
do una
baja p
redictib
ilidad
para el p
eriodo d
e lluvias
en la c
osta nor
te. La im
plicanc
ia práct
ica de
este res
ultado
es que
, si bien
los mo
delos c
ontinúa
n siend
o la
principa
l herra
mienta
de pron
óstico
con va
rios m
eses d
e anti
cipación
, se deb
e ser m
uy cuida
doso co
n cómo
se inter
pretan
los resu
ltados,
teniend
o en m
ente las
posibl
es fuen
tes de
error,
monitore
ando e
l desem
peño d
e los p
ronóstic
os, y a
plicand
o un
¿UPH�FR
QRFLPLH
QWR�WHyU
LFR�GH�O
RV�SURFH
VRV�ItVL
FRV�TXH
�VXE\DF
HQ�D�
estos pr
onóstic
os.
Esta baj
a correla
ción pod
ría esta
r asocia
da a la p
redomin
ancia d
e ORV�
HYHQWRV
�³(O�1Lx
R�0RGR
NL´��$VK
RN�HW�D
O�������
��YHU�7D
NDKDVK
L��201
4), una
de cu
yas ca
racterís
ticas i
ncluye
anomal
ías de
WHPSHUD
WXUD�VXS
HU¿FLDO�S
ULQFLSDO
PHQWH�H
Q�HO�3D
Ft¿FR�FH
QWUDO�\�X
QD�déb
il señal
frente a
Sudam
érica. E
l cambi
o en la
s caract
erística
s de
El Niño
y su p
redictib
ilidad p
odría e
star as
ociado
a camb
ios GHF
DGDOHV�
HQ�HO�FOLP
D�GHO�3D
FL¿FR��T
XH�SRGUt
DQ�VHU�WD
QWR�QDWX
UDOHV�
como pr
oducido
s por el
hombre.
Barnst
on y Tip
pett (20
13), qui
enes
encontr
aron res
ultados
similare
s para e
l modelo
CFS2
y su ver
sión
anterior,
atribuy
en los
cambios
en pre
dictibilid
ad a la
s variac
iones
decada
les en
los erro
res prom
edio de
l mode
lo. Los
efectos
de
la varia
bilidad
decada
l y el c
ambio c
limático
sobre
El Niño
y su
predictib
ilidad es
un tem
a de est
udio act
ual.
Refere
ncias
Asho
k, K.,
S.K.
Behe
ra, S.
A. Ra
o, H.
Weng
, and
T. Ya
maga
ta, 20
07: E
l Nin
o Mod
oki a
nd its
possi
ble te
lecon
nectio
ns, J
ourna
l of G
eoph
ysica
l Re
searc
h, 11
2.
Barns
ton, A
. G.,
M. K
. Tipp
ett, 2
013:
Predic
tions
of N
ino3.4
SST
in
CFSv
1 an
d CF
Sv2:
a dia
gnos
tic co
mpari
son,
Clima
te Dy
nami
cs, 4
1, 16
15–1
633,
doi:1
0.100
7/s00
382-0
13-18
45-2.
Kirtm
an, B
. P. y
coa
utores
, 201
3: Th
e No
rth A
meric
an M
ulti-M
odel
Ense
mble (
NMME
): Pha
se-1
Seas
onal t
o inter
annu
al pred
iction
, Pha
se-2
Towa
rd de
velop
ing in
tra-se
ason
al pre
dictio
n, Bu
lletin
of the
Ameri
can M
eteoro
logica
l Socie
ty, do
i:10.1
175/ B
AMS-D
-12-00
050.1
.
Reup
o, J.
y K.
Taka
hash
i, 20
14:
Valida
ción
de p
ronós
ticos
con
mode
los gl
obale
s: Co
rrelac
iones
de TS
M (19
82-20
10), B
oletín
Técn
ico
“Gen
eració
n de m
odelo
s clim
ático
s para
el pr
onós
tico de
la oc
urren
cia
del F
enóm
eno E
l Niño
”, Vol.
1, N°
1, En
ero, In
stituto
Geo
físico
del P
erú.
Taka
hash
i, K., 2
014:
Varie
dade
s de E
l Niño
, Bole
tín Té
cnico
“Gen
eració
n de
mod
elos c
limáti
cos p
ara el
pron
óstico
de la
ocurr
encia
del F
enóm
eno
El Niñ
o”, Vo
l. 1, N
o.2, F
ebrer
o, Ins
tituto
Geofí
sico d
el Pe
rú.
Taka
hash
i, K., K
. Mos
quera
, J. R
eupo
, 201
4: El
Índice
Cos
tero E
l Niño
(IC
EN): h
istoria
y actu
alizac
ión, B
oletín
Téc
nico “
Gene
ración
de m
odelo
s clim
ático
s para
el pr
onós
tico de
la oc
urren
cia de
l fenó
meno
El Ni
ño” ,V
ol.
1, No
.2, Fe
brero,
Instit
uto G
eofís
ico de
l Perú
.
Variabi
lidad d
ecadal
de la bo
ndad d
e los pr
onóstic
os con
modelo
s clim
áticos g
lobales
Reupo J
.��7DN
DKDVKL�
K.
J F M A M J J A S O N D J F M A M J J A S O N D Target month
Exc
elle
nt
No
info
M
isle
adin
g G
ood
Excellent
Good Excellent
Excellent
Good
1 3 5 7 9
1 3 5 7 9

Predicting El Niño in Peru
Climate model forecasts
Observational data
Expert assessment
8
Prediction ENSO regimes: Reinterpreting the canonical and Modoki El Niño
K. Takahashi,1 A. Montecinos,2 K. Goubanova,1,3 and B. Dewitte1,3
Received 7 March 2011; revised 16 April 2011; accepted 19 April 2011; published 27 May 2011.
[1] We propose that the first two empirical orthogonalfunction (EOF) modes of tropical Pacific sea surface tem-perature (SST) anomalies do not describe different phenom-ena (i.e., El Niño‐Southern Oscillation (ENSO) and “El NiñoModoki”) but rather the nonlinear evolution of ENSO. Weintroduce two new uncorrelated indices (E and C), basedon the leading EOFs, that respectively account for extremewarm events in the eastern and cold/moderate warm events inthe central equatorial Pacific, corresponding to regimes withdifferent evolution. Recent trends in ENSO can be describedas an increase in the central Pacific (C) variability that isassociated with stronger cold events, as well as a reduction inthe eastern Pacific (E) variability within the cold/moderatewarm regime, consistent with model projections. However,little can be said observationally with respect to the extremewarm regime. Citation: Takahashi, K., A. Montecinos, K. Gou-banova, and B. Dewitte (2011), ENSO regimes: Reinterpreting thecanonical and Modoki El Niño, Geophys. Res. Lett., 38, L10704,doi:10.1029/2011GL047364.
1. Introduction
[2] It is well known that “no two El Niño events are quitealike” [Wyrtki, 1975], yet the typical evolution of suchan event was thought to consist in an initial warming offSouth America and later in the central equatorial Pacificduring austral summer (DJF) [Wyrtki, 1975; Rasmusson andCarpenter, 1982]. This belief changed with the extraordinary1982–83 and 1997–98 El Niño events, which had largeamplitudes and different evolutions with respect to the“canonical” composite [Cane, 1983], particularly as themaximum anomalies occurred simultaneously in the easternand central equatorial Pacific during austral summer. Thismotivated descriptions of El Niño based on a single patternand index (see discussion by Larkin and Harrison [2002]).Trenberth and Stepaniak [2001] proposed an additional indexto regain the ability to describe the evolution of El Niño andits diversity of patterns (Trans‐Niño Index or TNI).[3] Recently, several studies argue for the existence of a
different type of El Niño with SST anomalies concentrated inthe central equatorial Pacific, [Larkin and Harrison, 2005;Ashok et al., 2007; Kug et al., 2009; Kao and Yu, 2009], evenarguing that it is a phenomenon distinct from ENSO [Ashoket al., 2007], and there has been an increasing interest indetermining the characteristics of its evolution, dynamics and
associated teleconnections [e.g., Weng et al., 2007; Kao andYu, 2009; Kug et al., 2009; Yu and Kim, 2010].[4] Furthermore, there is evidence that this type of El Niño
has been more frequent during the last decades [Yeh et al.,2009; Lee and McPhaden, 2010]. Moreover, some climatemodels indicate an increase in the frequency of occurrenceof this new El Niño under anthropogenic climate change [Yehet al., 2009].[5] The present study is aimed at providing a new inter-
pretation of the various Niño indices and classifications and atimproving our understanding of the relationship between thecentral Pacific type of El Niño, the “canonical” El Niño andthe extraordinary events. In particular, we present evidencethat suggests that these are all part of the same non‐linearphenomenon rather than independent modes of variability.
2. Data and Methodology
[6] We calculated the EOF modes from monthly SSTanomalies from the Hadley Centre Global Sea Ice and SeaSurface Temperature (HadISST) dataset version 1.1 [Rayneret al., 2003] in an equatorial Pacific domain, bounded by10°S–10°N and the lateral coasts. We take 1979–2009 as thebase period for all climatologies, EOFs and correlations,approximately the same as Ashok et al. [2007]. We thenprojected the entire dataset (January 1870–August 2010) onthe EOF patterns to obtain the principal components (PC) forthis longer period. The PCs were normalized by the standarddeviation for the base period and smoothedwith a 1‐2‐1 filter.Dimensional spatial SST patterns were then obtained bylinearly regressing the SST anomaly fields onto these PCs.Our domain is more confined to the equator than the one usedby Ashok et al. [2007], as tests showed that it resulted in EOFmodes that were less sensitive to the time domain considered.[7] We performed a similar EOF decomposition on the SST
data from three numerical climate models: 500 years from thepre‐industrial unforced control run from the NOAA GFDLCM2.1 climate model [Wittenberg et al., 2006; Kug et al.,2010], a 1200‐year run with Zebiak and Cane’s [1987]intermediate coupled ocean‐atmosphere model (ICM) forthe tropical Pacific, and a 800‐year run with the LODCAICM [Dewitte and Gushchina, 2010] in which the oceanmodel described by Dewitte [2000] is coupled to the QTCMatmosphere model [Neelin and Zeng, 2000; Zeng et al.,2000]. These models are considered because they accountfor the diversity of physics and complexity for modeling thetropical Pacific interannual variability.
3. Analysis and Results
[8] The first two PCs combined explain most of thevariance (68% and 14%, respectively) in the domain. Usingmultiple regression, we linearly combined the PCs to estimatethe values of El Niño indices (traditional Niño indices [e.g.,
1Instituto Geofısico del Peru, Lima, Perú.2Departamento de Geofısica, Universidad de Concepción, Concepción,
Chile.3Laboratoire d’Etudes en Geophysique et Oceanographie Spatiale,
CNES/CNRS/IRD/UPS, Toulouse, France.
Copyright 2011 by the American Geophysical Union.0094‐8276/11/2011GL047364
GEOPHYSICAL RESEARCH LETTERS, VOL. 38, L10704, doi:10.1029/2011GL047364, 2011
L10704 1 of 5
1 3
DOI 10.1007/s00382-015-2665-3Clim Dyn
Strong and moderate nonlinear El Niño regimes
Ken Takahashi1 · Boris Dewitte2
Received: 17 November 2014 / Accepted: 16 May 2015 © The Author(s) 2015. This article is published with open access at Springerlink.com
nonlinearity could make the EN regimes very sensitive to stochastic forcing. Observations and model agree that the westerly wind stress anomaly in the central equatorial Pacific in late boreal summer has a substantial role deter-mining the EN regime in the following winter and it is sug-gested that a stochastic component at this time was key for the development of the strong EN towards the end of 1982.
Keywords ENSO · El Niño · Eastern Pacific · Nonlinear dynamics · Bjerknes feedback · GFDL CM2.1
1 Introduction
Recent studies indicate that two types of El Niño (EN) have occurred over the last five decades, one with SST anoma-lies peaking in the eastern Pacific and the other peaking in the central equatorial Pacific (Larkin and Harrison 2005; Ashok et al. 2007; Kug et al. 2009). Whether the two types of events have distinct dynamics remains unclear, although ENSO positive skewness, a property arising from eastern Pacific events, could be associated with oceanic nonlinear advection (An and Jin 2004). Stochastically forced lin-ear models fitted to observations are able to capture some aspects of the ENSO diversity (e.g. Newman et al. 2011b), but linear dynamics alone can not generate the nonlinear relation between the first two dominant statistical modes of equatorial Pacific SST anomalies, which has been proposed to emerge from dual EN regimes, with the 1982–1983 and 1997–1998 events corresponding to different dynamics from the other EN (Takahashi et al. 2011; Capotondi et al. 2015).
There have been various theories to explain the under-lying physics of strong EN events, including oceanic non-linear advection (Timmermann et al. 2003), nonlinear
Abstract It has been previously proposed that two El Niño (EN) regimes, strong and moderate, exist but the historical observational record is too short to establish this conclusively. Here, 1200 years of simulations with the GFDL CM2.1 model allowed us to demonstrate their existence in this model and, by showing that the relevant dynamics are also evident in observations, we present a stronger case for their existence in nature. In CM2.1, the robust bimodal probability distribution of equatorial Pacific sea surface temperature (SST) indices during EN peaks provides evidence for the existence of the regimes, which is also supported by a cluster analysis of these same indices. The observations agree with this distribution, with the EN of 1982–1983 and 1997–1998 corresponding to the strong EN regime and all the other observed EN to the moderate regime. The temporal evolution of various indices during the observed strong EN agrees very well with the events in CM2.1, providing further validation of this model as a proxy for nature. The two regimes differ strongly in the magnitude of the eastern Pacific warming but not much in the central Pacific. Observations and model agree in the existence of a finite positive threshold in the SST anomaly above which the zonal wind response to warm-ing is strongly enhanced. Such nonlinearity in the Bjerknes feedback, which increases the growth rate of EN events if they reach sufficiently large amplitude, is very likely the essential mechanism that gives rise to the existence of the two EN regimes. Oceanic nonlinear advection does not appear essential for the onset of strong EN. The threshold
* Ken Takahashi [email protected]
1 Instituto Geofísico del Perú, Lima, Perú2 IRD/LEGOS, Toulouse, France
RESEARCH ARTICLE10.1002/2014JC010044
The Central Pacific El Ni~no intraseasonal Kelvin wave
K. Mosquera-V!asquez1, B. Dewitte2, and Serena Illig2
1Instituto Geof!ısico del Per!u, Lima, Per!u, 2Laboratoire d’Etudes en G!eophysique et Oc!eanographie Spatiales, Toulouse,France
Abstract In this study, we document and interpret the characteristics of the IntraSeasonal Kelvin wave(ISKw) in the Pacific over the 1989–2011 period, based on observations, a linear model, and the outputs ofan Ocean General Circulation Model (OGCM). We focus on the wave activity during the Central Pacific (CP)El Ni~no events contrasting with the extraordinary El Ni~no of 1997/1998. We find that the ISKw activity isenhanced in Austral summer (spring) in the central Pacific (west of !120"W) during CP El Ni~no events. Thelinear model experiment indicates that the Austral summer peak is wind-forced, while the Austral springpeak is not and consequently results from nonlinear processes. In addition, a strong dissipation of the ISKwsis observed east of 120"W which cannot be accounted for by a linear model using a Rayleigh friction. A ver-tical and horizontal mode decomposition of the OGCM simulation further confirms the sharp changes incharacteristics of the ISKws as well as the reflection of the latter into first-meridional Rossby wave at the lon-gitude where the maximum zonal gradient of the thermocline is found (!120"W). Our analysis suggeststhat the confinement of CP El Ni~no warming in the central Pacific may result from the reinforcement of thezonal gradient in stratification associated with the La Ni~na-like conditions since the late of the 1990s, lead-ing to scattering of the energy of the ISKws in the eastern Pacific.
1. Introduction
Recent studies have reported the existence of at least two types of El Ni~no events [Ashok et al., 2007; Kaoand Yu, 2009; Kug et al., 2009]: one with anomalies peaking in the eastern Pacific (i.e., Eastern Pacific (EP) ElNi~no or cold tongue El Ni~no) like in 1997/1998, and one having its center of action in the central Pacificreferred to as Modoki El Ni~no or Central Pacific (CP) El Ni~no (as referred hereafter) or warm pool El Ni~no. Theexact nature and mechanism of the latter have been the subject of debate in the community [Capotondi etal., 2014] due in part to its apparent increase in occurrence in recent decades [Yeh et al., 2009; Lee andMcPhaden, 2010] and the difficulty to interpret these two types of events as the expression of either two dis-tinct regimes [Takahashi et al., 2011] or a continuum in the ENSO variability [Giese and Ray, 2011; Johnson,2013]. There have been also some difficulties in interpreting the recent El Ni~no events from current ENSOtheories [Xiang et al., 2013]. For instance, although Ren and Jin [2013] suggest that CP El Ni~no can be under-stood to a large extent by the recharge oscillator mechanism, Kug et al. [2009] indicate that CP El Ni~no arecharacterized by a weak recharge-discharge process and the phase relationship between the two dominantmodes of the thermocline variability (i.e., the so-called tilt and warm water volume modes) has changed atthe beginning of the 21st century [McPhaden, 2012]. In term of thermodynamical processes within themixed-layer, CP El Ni~no events tend to be dominated by the zonal advective feedback in the central Pacificwith a weak contribution from thermocline feedback in the eastern equatorial Pacific [Kug et al., 2009; Renand Jin, 2013]. On the other hand, CP El Ni~no events are also associated with equatorial Kelvin wave dynam-ics [Dewitte et al., 2012a] that have the potential to produce anomalous vertical advection in the easternPacific [Mosquera-V!asquez et al., 2013]. The former studies, however, do not explain why the SST warmingremains confined in the central Pacific, calling for the investigation of other processes including nonlinearones [Xiang et al., 2013; Dommenget et al., 2012]. The fact that the recharge-discharge process is weak dur-ing CP El Ni~no, implying that the ocean state prior to its development is weakly influential, suggests that CPEl Ni~no evolution are more likely to be influenced by random atmospheric forcing during its developmentphase. Random atmospheric noise usually refers to the components of the Intraseasonal atmospheric Tropi-cal Variability (ITV) [Wheeler and Kiladis, 1999] including the Madden Julian Oscillation (MJO) [Madden and
Key Points:# Intraseasonal temperature variability
is dominant in the vicinity of thethermocline# CP El Ni~no is associated with an
increase in intraseasonal equatorialKelvin activity# Intraseasonal Kelvin wave starts
strongly dissipating around 120"W
Correspondence to:K. Mosquera-V!asquez,[email protected]
Citation:Mosquera-V!asquez, K., B. Dewitte, andS. Illig (2014), The Central Pacific ElNi~no intraseasonal Kelvin wave, J.Geophys. Res. Oceans, 119, doi:10.1002/2014JC010044.
Received 10 APR 2014Accepted 27 AUG 2014Accepted article online 2 SEP 2014
MOSQUERA-V!ASQUEZ ET AL. VC 2014. American Geophysical Union. All Rights Reserved. 1
Journal of Geophysical Research: Oceans
PUBLICATIONS
Scientific knowledge

Probabilistic forecast for Dec 2015-Mar 2016
Coastal El Niño
50% of El Niño like 1982-83 or 1997-98
Comunicado Oficial ENFEN 19-2015 Nov 4, 2015

Dictan medidas para la ejecución de intervenciones ante el periodo de lluvias 2015-2016 y la ocurrencia del Fenómeno
El Niño
10
Jun 1
Sep 7
Sep 2 July 5
Sep 25
Oct 27
Some Government Decrees for preparation for El Niño and intense
rainfall in 2015-2016 (Based explicitly on ENFEN
assessments)
Summary
• Extreme El Niño have dispropor0onally large impacts on Peru. • El Niño warming along the coast and in the central Pacific
have dis0nct impacts on Peru. • El Niño diversity implies that the link is not necessarily strong
between the central and eastern Pacific. • ENFEN focuses mainly in the eastern Pacific but also in the
central. Foreign news focusing in the laQer can be misleading. • Predic0on in the eastern Pacific is more difficult. Models have
longstanding biases in this region. • Scien0fic input from ENFEN is explictly used for decision
making in Peru, par0cularly by the government.
11