scientific communication exploring urban …€¦ · · 2017-10-09urban fabric, agriculture and...
TRANSCRIPT
MORAVIAN GEOGRAPHICAL REPORTS 2017, 25(2)
208
MORAVIAN GEOGRAPHICAL REPORTS 2017, 25(3): 208–218
208
Institute of Geonics, The Czech Academy of Sciences
journal homepage: http://www.geonika.cz/mgr.html
doi: 10.1515/mgr-2017-0018
MORAVIAN GEOGRAPHICAL REPORTS
MORAVIANGEOGRAPHICAL REPORTS
Vol. 23/2015 No. 4
Illustrations to the paper by S. Kurek et al.
Figures 8, 9: New small terrace houses in Wieliczka town, the Kraków metropolitan area (Photo: S. Kurek)
SCIENTIFIC COMMUNICATION
Exploring urban agriculture as a component of multifunctional green infrastructure: Application
of figure-ground plans as a spatial analysis tool
Attila TÓTH a *, Axel TIMPE b
AbstractUsing ́ Urban Atlas´ as a data source, the authors present and critically discuss in this paper the application of figure-ground plans in combination with complex land-use maps as a tool for spatial analysis of urban agriculture in European cities and their multifunctional green infrastructure. The selected cities and metropolitan areas (including Dublin, Ruhr Metropolis, Geneva and Sofia) represent different regions in Europe from the Northwest to the Southeast. Urban fabric, agriculture and non-agricultural open spaces have been analysed and compared as the main land-use components. Agricultural open spaces include arable land with annual crops and permanent crops, such as vineyards, fruit trees and olive groves; pastures; as well as complex and mixed cultivation patterns. The results reveal the scale and land-use diversity of metropolitan regions and different spatial patterns of urban agriculture at the regional level and in central urban areas.
Keywords: Urban agriculture; figure-ground plans; spatial analysis; green infrastructure
Article history: Received 16 October 2016; Accepted 20 September 2017; Published 30 September 2017
1 Department of Garden and Landscape Architecture, Faculty of Horticulture and Landscape Engineering, Slovak University of Agriculture in Nitra, Slovakia (*corresponding author: A. Tóth, e-mail: [email protected])
2 Department of Landscape Architecture, RWTH Aachen University, Germany
1. IntroductionGreen infrastructure of European cities includes
productive agricultural landscapes, such as agricultural parks, allotment gardens, productive greenbelts or other forms of urban agriculture. These characterise Europe's cities and agglomerations (Lohrberg and Simon-Rojo, 2016) and significantly co-create contemporary European urban landscapes, while forming novel urban design models (Timpe, 2016).
In this paper, the scale, diversity and specifics of urban agricultural landscapes in selected European cities are mapped and analysed, while considering functional and systematic linkages between the concepts of green infrastructure and urban agriculture. A methodological aim of the paper is to contribute to the existing geographical research by new inspiration in the form of figure-ground plans or figure-ground analysis, which is a widely used analytical tool in landscape architecture and landscape planning. This article relies on the empirical basis of maps
created from the datased of the 'Urban Atlas 2012' of the European Environment Agency (see Copernicus Land Monitoring Services 2015; 2016a; 2016b). Creation of figure-ground plans and their description and visual interpretation are done based on this new dataset, which in its present form was newly introduced in 2016. We use description and interpretation of maps and plans, which are two major research strategies in landscape architecture (Deming and Swaffield, 2011) and explain this method in more detail in the next chapters.
The hypothesis is tested on four European cities with metropolitan urban landscapes, including Dublin (Ireland), Ruhr Metropolis (Germany), Geneva (Switzerland) and Sofia (Bulgaria). These four model areas (Large Urban Zones) were selected as case studies because they were reference regions and objects of analyses within the COST Action TD1106 ‘Urban Agriculture Europe’ (hereinafter UAE) and at the same time, their comparable land use and land cover GIS data are available in the ´Urban Atlas of the
2017, 25(2) MORAVIAN GEOGRAPHICAL REPORTS
209
2017, 25(3): 208–218 MORAVIAN GEOGRAPHICAL REPORTS
209
European Environment Agency´, which provides material for comparative land use structure and green infrastructure system analyses using the figure-ground method.
2. Theoretical departures
2.1 Definition of urban agriculture and green infrastructureAgriculture has been an inherent component of cities
since the earliest records of urban development (Vejre et al., 2016; Lička and Maldonado, 2016; Branduini et al., 2016). It takes place in all urban contexts, from the built-up downtowns to the open spaces of peri-urban areas (Yokohari et al., 2000) and it is as much connected to the built environment as it is to the open landscape (Kuczman, 2014; Lička and Maldonado, 2016). Urban agriculture has been driven and shaped by diverse global driving forces, such as peri-urbanisation and suburbanisation, political and economic crises, poverty or industrialisation (Bryant et al., 2016). When compared to other forms of agriculture, urban agriculture is spatially and functionally more deeply integrated in the urban system and urban areas (Vejre et al., 2016). It is of great interest in finding new answers for how cities can master recent social, economic, and ecological challenges (Duží et al., 2014; Lohrberg, 2016).
The European Commission perceives green infrastructure as ‘a strategically planned network of natural and semi-natural areas with other environmental features designed and managed to deliver a wide range of ecosystem services. It incorporates green spaces and other physical features in terrestrial and marine areas. On land, green infrastructure is present in rural and urban settings’ (European Commission, 2013, p. 3). As a planning concept, green infrastructure bases on the contemporary model of multifunctionality (Brandt and Vejre, 2004; Brenken et al., 2005), which considers all landscape functions and services (Timpe et al., 2016), including agriculture.
2.2 Urban agriculture as part of the urban green infrastructure
Urban space is used for a wide set of functions, one of which is agricultural production. The spatial quality of agriculture in urban settings is strongly related to the built environment as well as to the green infrastructure of the city (Halajová et al., 2013). In many cases, urban agriculture areas constitute the major part of the urban open landscape and form green wedges (surrounding and penetrating the urban area), green belts (surrounding the urban area), or individual intraurban spots or networks, such as urban farms (Recasens et al., 2016), urban fruit trees (Bakay, 2014), linear tree formations (Supuka, 2013) or even rooftop farms (Sanyé-Mengual, 2016). Many urban agricultural sites were not originally conceived as urban (green) open spaces, but have gradually become an essential part of the urban green infrastructure (Rzepielová and Feriancová, 2014; Paradis et al., 2016). Where existing agricultural areas have been integrated into the city through its expansion over time, they usually contain important structures and elements of cultural and landscape heritage (Lička and Maldonado, 2016; Paradis et al., 2016).
The localisation of urban agriculture is a result of the overall urban development. In many European cities, there are large areas of urban agriculture that are important components of urban landscapes and make significant contributions to green infrastructure (Paradis et al., 2016). Urban agriculture areas are spatially connected to other
urban landscape functions and elements (Lička and Maldonado, 2016). In contrast to most green spaces, urban agriculture areas provide the potential for temporal land occupation, which is important in rapidly changing cityscapes (Paradis et al., 2016). Urban agriculture can be perceived as an efficient urban development tool also in the context of brownfield regeneration in urban landscapes, which is a major challenge in contemporary spatial development of cities (Frantál et al., 2013). In case of brownfields, with an agricultural origin located at the urban periphery, urban agriculture plays a key role as a potential urban planning tool for a revival of the agricultural legacy of the area, since brownfield regeneration in these areas is still undynamic (Frantál et al., 2015). Urban agriculture can be understood as a planning tool that helps stabilising and forming neighbourhoods and driving urban change, since providing an important space for social interaction and inclusion and positively affecting urban quality of life (Sanesi et al., 2016).
2.3 Ecosystem services provided by urban agricultureUrban agriculture provides a wide range of ecosystem
services that are of great value and importance for human well-being and urban resilience (Gómez-Baggethun et al., 2013). The functional dimension of urban ecosystem services provided by urban agriculture is very complex and diverse (Haase et al., 2014). Besides the most obvious production function, urban agriculture provides also a wide range of societal benefits (Pölling et al., 2016), cultural services related to recreation, education or health (Vejre et al., 2016), as well as provisioning services, regulation services and habitat benefits. Timpe et al. (2016) give a structured overview of ecosystem services and green infrastructure benefits that can be provided by urban agriculture and define urban agriculture types that are especially relevant.
When integrating agriculture and green infrastructure, a mutual benefit of ecological stability and agricultural sustainability can be achieved within and around urban environments (Martino et al., 2016). Urban agriculture can significantly enhance green infrastructure through placemaking strategies (Timpe et al., 2016). It is an approach towards management of urban cultural landscapes that enhances social and cultural valuation of ecosystem services (Plieninger et al., 2015). Moreover, it helps developing resilient food systems in metropolitan areas (Tóth et al., 2016), which makes food chains more sustainable (Berčík and Gálová, 2013).
2.4 Typologies of urban agriculture in urban landscapesSpatial forms and qualities of urban agriculture result
from environmental conditions, as well as from the farming methods, technology, and crops (Paradis et al., 2016). Simon-Rojo et al. (2016) divide urban agriculture into two main categories – 1) urban food gardening and 2) urban farming. Urban farming has a rich tradition in Western and Central Europe, for instance in Germany and Switzerland. Urban gardening is represented by two main traditions – allotment tradition and food gardening tradition, which are present throughout Europe (Keyzlarová, 2010; Lohrberg and Simon-Rojo, 2016; Keshavarz and Bell, 2016).
Based on the localisation, Paradis et al. (2016) distinguish 1) fringe agricultural landscapes (periurban localisation), 2) mix of urban and agricultural landscapes (transurban localisation), and 3) productive enclave landscapes (intraurban localisation). These can consist of:
MORAVIAN GEOGRAPHICAL REPORTS 2017, 25(2)
210
MORAVIAN GEOGRAPHICAL REPORTS 2017, 25(3): 208–218
210
a. large-scale units, such as entrepreneurial farms or agricultural parks;
b. medium-scale units, such as allotments; and
c. small-scale agricultural spots, such as production-oriented family gardens.
Timpe et al. (2016) categorise five different types of green infrastructure systems in European metropolitan areas, in which urban agriculture is spatially integrated as part of a green belt; as a green corridor; as a green network; as a green patch; and as a green matrix.
3. Data and methodsThe article uses the 'Urban Atlas 2012' GIS database
of the European Environment Agency (Copernicus Land Monitoring Services 2015; 2016a; 2016b), which provides comparable land use and land cover data of the chosen Large Urban Zones. The available GIS database and metadata were used as basic materials for conducting figure ground analyses and interpretations of urban green infrastructure systems in the selected model areas. The figure ground analysis is complemented by graphical interpretation and percentual quantification of the overall land use structure (Fig. 3), in order to support the statements and conclusions.
3.1 The Urban Atlas as a tool for comparing urban agriculture in European city regions
The most important precondition for comparing the presence and quantitative importance of agriculture as a land use in different European city regions is a consistent and comparable data base. The comparison cannot be done in a reliable way with local land-use survey as geographical data base because the surveys would provide different land-use categories which, more importantly, were also collected with different methods. Land-use surveys which cover the whole territory of the EU are not detailed enough to assess green infrastructure and urban agriculture in city regions, which are touched by the phenomenon of urban sprawl and a strong fragmentation of land-use units. CORINE land cover, an important tool for land-use monitoring on the EU level has minimum mapping units of 25 ha size and 100 m width (Copernicus Land Monitoring Services, 2016a).
A solution to fill the knowledge gap on land-use with green infrastructure potential in city regions is the Urban Atlas. This land-use survey has been elaborated for the first time in 2006 by the European Environment Agency (EEA, 2016) and covers Large Urban Zones (LUZ) in Europe. The Urban Atlas is much more precise than other pan-european land-use mappings with a minimum mapping unit of 0.25 ha and 10 m width (Copernicus Land Monitoring Services, 2016b, p. 7). It is elaborated on the basis of Earth Observation by satellite, topographic maps and navigation data (ibid, p. 3–4). Detailed information on methodology and availability of Urban Atlas 2012 is provided by Copernicus Land Monitoring Services (2015).
While the Urban Atlas 2006 was insensitive to the importance of agriculture in city regions by integrating “Agricultural areas, semi-natural areas and wetlands” under one land-use category, the Urban Atlas 2012, which is currently under elaboration, delineates a larger variety of agricultural land uses: (i) Arable land (annual crops), (ii) Permanent crops (vineyards, fruit trees, olive groves), (iii) Pastures, and (iv) Complex and mixed cultivation patterns. With 695 Large Urban Zones the 2012 edition also will cover a lot more regions than the 2006 edition (306 LUZ) did.
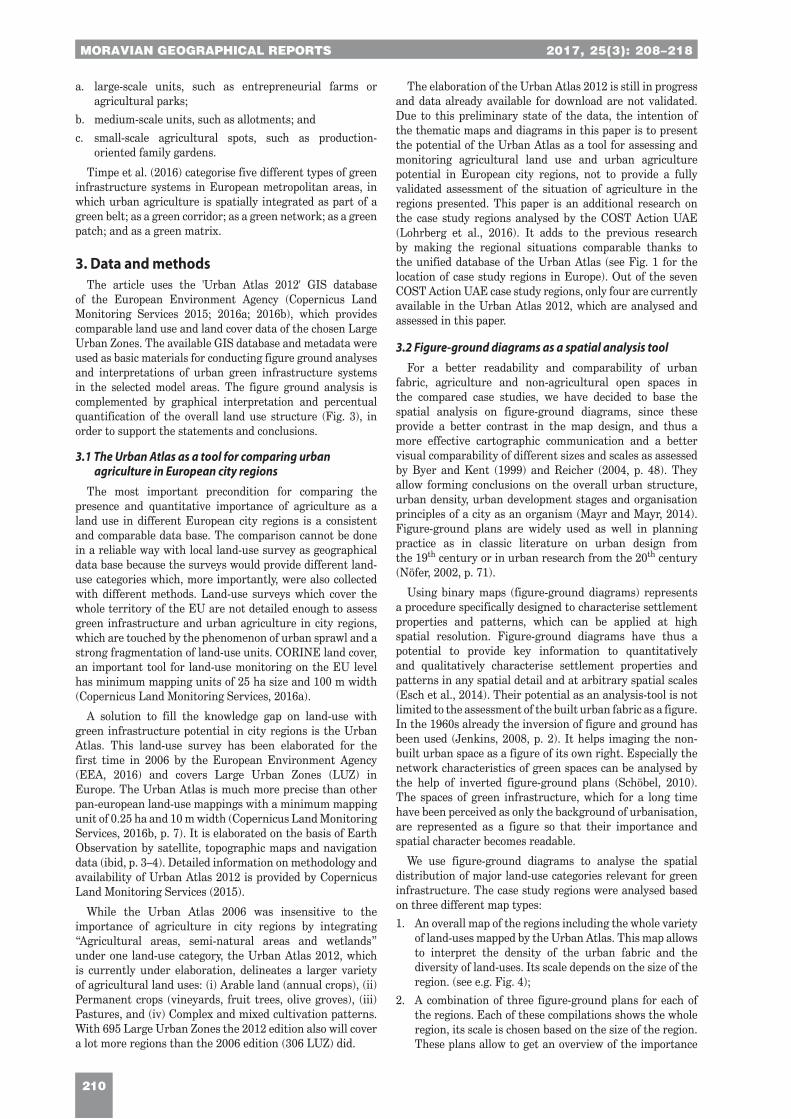
The elaboration of the Urban Atlas 2012 is still in progress and data already available for download are not validated. Due to this preliminary state of the data, the intention of the thematic maps and diagrams in this paper is to present the potential of the Urban Atlas as a tool for assessing and monitoring agricultural land use and urban agriculture potential in European city regions, not to provide a fully validated assessment of the situation of agriculture in the regions presented. This paper is an additional research on the case study regions analysed by the COST Action UAE (Lohrberg et al., 2016). It adds to the previous research by making the regional situations comparable thanks to the unified database of the Urban Atlas (see Fig. 1 for the location of case study regions in Europe). Out of the seven COST Action UAE case study regions, only four are currently available in the Urban Atlas 2012, which are analysed and assessed in this paper.
3.2 Figure-ground diagrams as a spatial analysis toolFor a better readability and comparability of urban
fabric, agriculture and non-agricultural open spaces in the compared case studies, we have decided to base the spatial analysis on figure-ground diagrams, since these provide a better contrast in the map design, and thus a more effective cartographic communication and a better visual comparability of different sizes and scales as assessed by Byer and Kent (1999) and Reicher (2004, p. 48). They allow forming conclusions on the overall urban structure, urban density, urban development stages and organisation principles of a city as an organism (Mayr and Mayr, 2014). Figure-ground plans are widely used as well in planning practice as in classic literature on urban design from the 19th century or in urban research from the 20th century (Nöfer, 2002, p. 71).
Using binary maps (figure-ground diagrams) represents a procedure specifically designed to characterise settlement properties and patterns, which can be applied at high spatial resolution. Figure-ground diagrams have thus a potential to provide key information to quantitatively and qualitatively characterise settlement properties and patterns in any spatial detail and at arbitrary spatial scales (Esch et al., 2014). Their potential as an analysis-tool is not limited to the assessment of the built urban fabric as a figure. In the 1960s already the inversion of figure and ground has been used (Jenkins, 2008, p. 2). It helps imaging the non-built urban space as a figure of its own right. Especially the network characteristics of green spaces can be analysed by the help of inverted figure-ground plans (Schöbel, 2010). The spaces of green infrastructure, which for a long time have been perceived as only the background of urbanisation, are represented as a figure so that their importance and spatial character becomes readable.
We use figure-ground diagrams to analyse the spatial distribution of major land-use categories relevant for green infrastructure. The case study regions were analysed based on three different map types:
1. An overall map of the regions including the whole variety of land-uses mapped by the Urban Atlas. This map allows to interpret the density of the urban fabric and the diversity of land-uses. Its scale depends on the size of the region. (see e.g. Fig. 4);
2. A combination of three figure-ground plans for each of the regions. Each of these compilations shows the whole region, its scale is chosen based on the size of the region. These plans allow to get an overview of the importance
2017, 25(2) MORAVIAN GEOGRAPHICAL REPORTS
211
2017, 25(3): 208–218 MORAVIAN GEOGRAPHICAL REPORTS
211
of agricultural land-use and other land-uses which could be a part of green infrastructure in the regions (see Figs. 5, 7, 8 and 9);
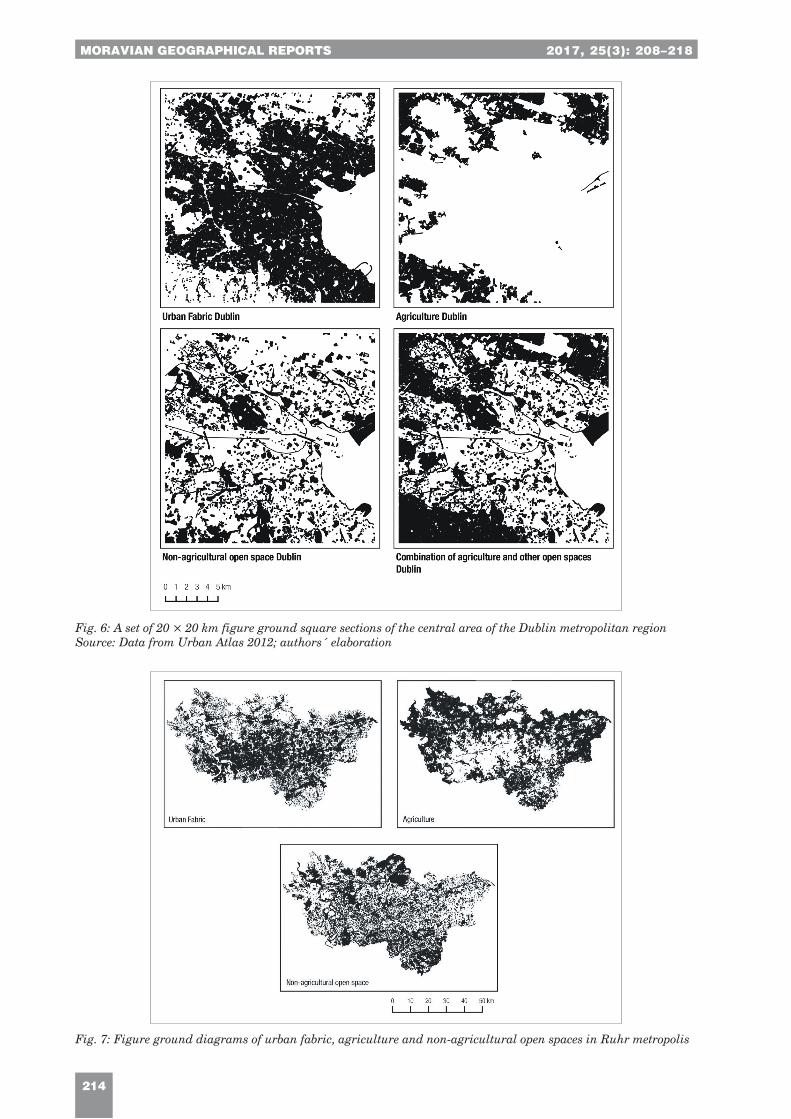
3. A combination of four figure ground plans of the central area of the analysed cities. These maps show a square of 20 on 20 km measured from the city centre, which in the case of Dublin has been moved from the city centre towards west to include more land instead of sea surface. This compilation of figure-ground plans allows to interpret the spatial structure of green infrastructure at the local level. The separate and overlaid representation of agricultural land-use and other open space land-uses allows to assess the importance of agriculture in the local green infrastructure network (see e.g. Fig. 6).
4. Results
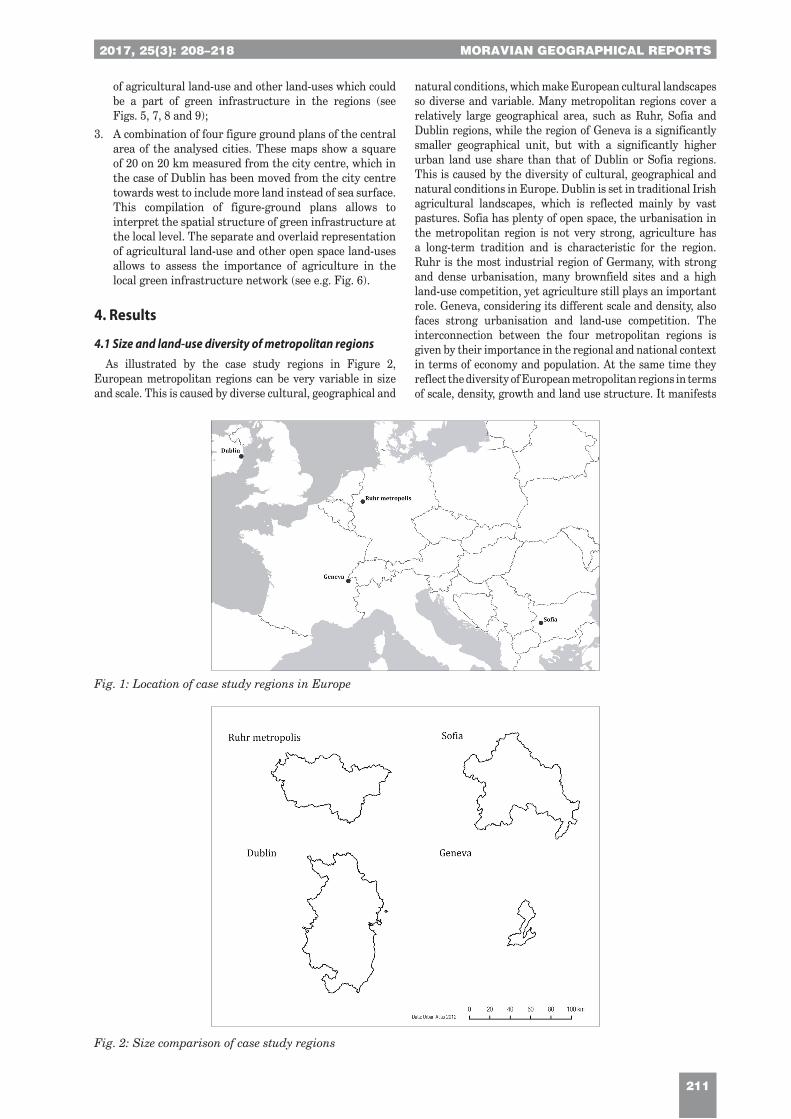
4.1 Size and land-use diversity of metropolitan regionsAs illustrated by the case study regions in Figure 2,
European metropolitan regions can be very variable in size and scale. This is caused by diverse cultural, geographical and
natural conditions, which make European cultural landscapes so diverse and variable. Many metropolitan regions cover a relatively large geographical area, such as Ruhr, Sofia and Dublin regions, while the region of Geneva is a significantly smaller geographical unit, but with a significantly higher urban land use share than that of Dublin or Sofia regions. This is caused by the diversity of cultural, geographical and natural conditions in Europe. Dublin is set in traditional Irish agricultural landscapes, which is reflected mainly by vast pastures. Sofia has plenty of open space, the urbanisation in the metropolitan region is not very strong, agriculture has a long-term tradition and is characteristic for the region. Ruhr is the most industrial region of Germany, with strong and dense urbanisation, many brownfield sites and a high land-use competition, yet agriculture still plays an important role. Geneva, considering its different scale and density, also faces strong urbanisation and land-use competition. The interconnection between the four metropolitan regions is given by their importance in the regional and national context in terms of economy and population. At the same time they reflect the diversity of European metropolitan regions in terms of scale, density, growth and land use structure. It manifests
Fig. 1: Location of case study regions in Europe
Fig. 2: Size comparison of case study regions
MORAVIAN GEOGRAPHICAL REPORTS 2017, 25(2)
212
MORAVIAN GEOGRAPHICAL REPORTS 2017, 25(3): 208–218
212
the fact, that independently from diverse geographical and cultural conditions, urban agricultural landscapes play a crucial role in building resilient and multifunctional metropolitan green infrastructures. Figure ground analyses prove that agricultural landscapes increase the connectivity and spatial distribution of urban green infrastructure in all four research samples.
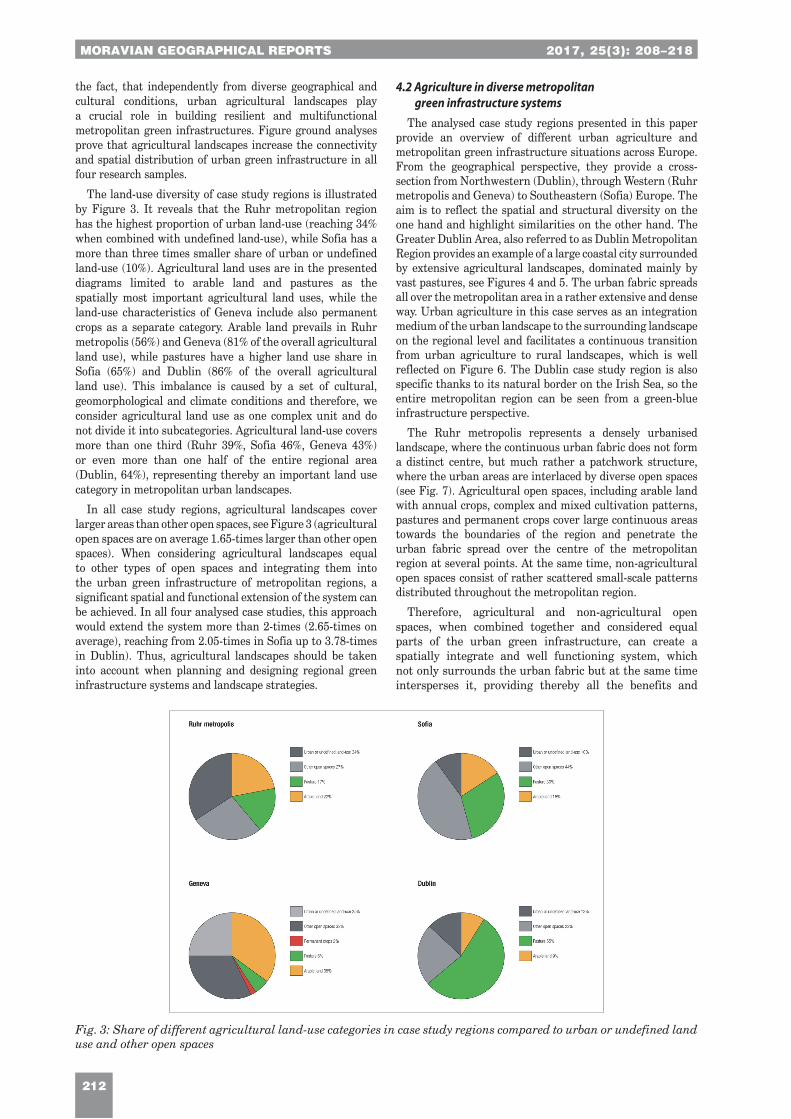
The land-use diversity of case study regions is illustrated by Figure 3. It reveals that the Ruhr metropolitan region has the highest proportion of urban land-use (reaching 34% when combined with undefined land-use), while Sofia has a more than three times smaller share of urban or undefined land-use (10%). Agricultural land uses are in the presented diagrams limited to arable land and pastures as the spatially most important agricultural land uses, while the land-use characteristics of Geneva include also permanent crops as a separate category. Arable land prevails in Ruhr metropolis (56%) and Geneva (81% of the overall agricultural land use), while pastures have a higher land use share in Sofia (65%) and Dublin (86% of the overall agricultural land use). This imbalance is caused by a set of cultural, geomorphological and climate conditions and therefore, we consider agricultural land use as one complex unit and do not divide it into subcategories. Agricultural land-use covers more than one third (Ruhr 39%, Sofia 46%, Geneva 43%) or even more than one half of the entire regional area (Dublin, 64%), representing thereby an important land use category in metropolitan urban landscapes.
In all case study regions, agricultural landscapes cover larger areas than other open spaces, see Figure 3 (agricultural open spaces are on average 1.65-times larger than other open spaces). When considering agricultural landscapes equal to other types of open spaces and integrating them into the urban green infrastructure of metropolitan regions, a significant spatial and functional extension of the system can be achieved. In all four analysed case studies, this approach would extend the system more than 2-times (2.65-times on average), reaching from 2.05-times in Sofia up to 3.78-times in Dublin). Thus, agricultural landscapes should be taken into account when planning and designing regional green infrastructure systems and landscape strategies.
4.2 Agriculture in diverse metropolitan green infrastructure systems
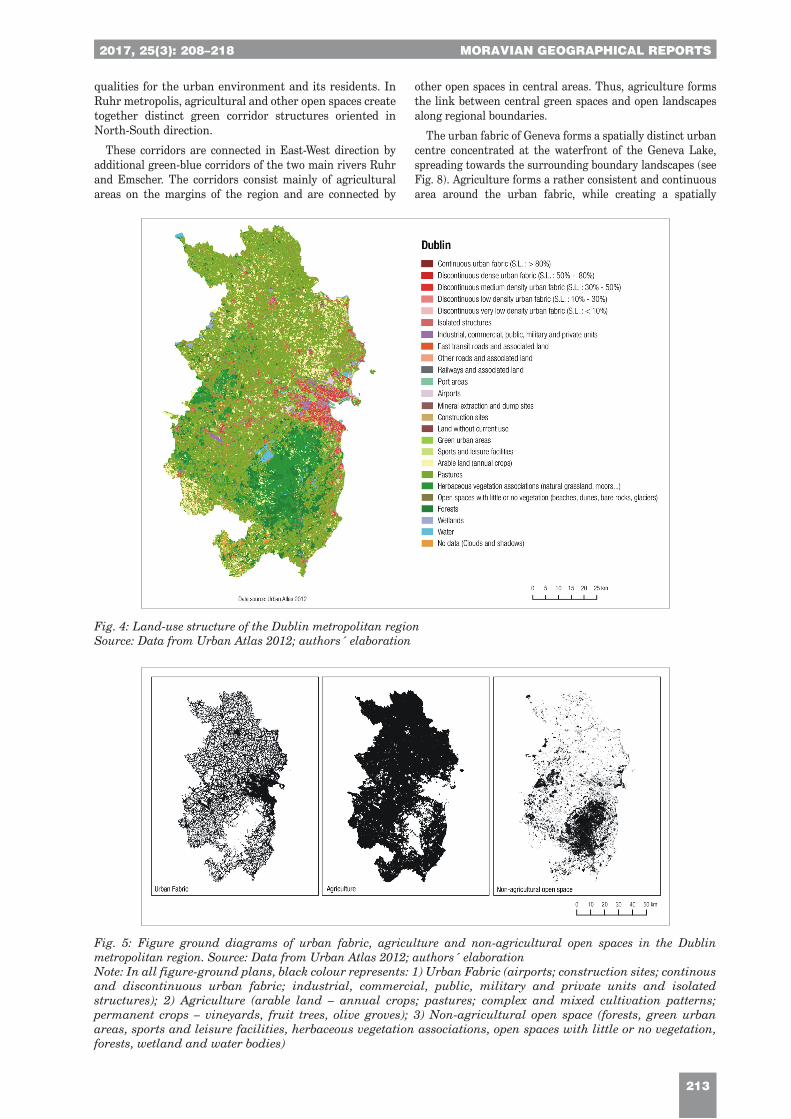
The analysed case study regions presented in this paper provide an overview of different urban agriculture and metropolitan green infrastructure situations across Europe. From the geographical perspective, they provide a cross-section from Northwestern (Dublin), through Western (Ruhr metropolis and Geneva) to Southeastern (Sofia) Europe. The aim is to reflect the spatial and structural diversity on the one hand and highlight similarities on the other hand. The Greater Dublin Area, also referred to as Dublin Metropolitan Region provides an example of a large coastal city surrounded by extensive agricultural landscapes, dominated mainly by vast pastures, see Figures 4 and 5. The urban fabric spreads all over the metropolitan area in a rather extensive and dense way. Urban agriculture in this case serves as an integration medium of the urban landscape to the surrounding landscape on the regional level and facilitates a continuous transition from urban agriculture to rural landscapes, which is well reflected on Figure 6. The Dublin case study region is also specific thanks to its natural border on the Irish Sea, so the entire metropolitan region can be seen from a green-blue infrastructure perspective.
The Ruhr metropolis represents a densely urbanised landscape, where the continuous urban fabric does not form a distinct centre, but much rather a patchwork structure, where the urban areas are interlaced by diverse open spaces (see Fig. 7). Agricultural open spaces, including arable land with annual crops, complex and mixed cultivation patterns, pastures and permanent crops cover large continuous areas towards the boundaries of the region and penetrate the urban fabric spread over the centre of the metropolitan region at several points. At the same time, non-agricultural open spaces consist of rather scattered small-scale patterns distributed throughout the metropolitan region.
Therefore, agricultural and non-agricultural open spaces, when combined together and considered equal parts of the urban green infrastructure, can create a spatially integrate and well functioning system, which not only surrounds the urban fabric but at the same time intersperses it, providing thereby all the benefits and
Fig. 3: Share of different agricultural land-use categories in case study regions compared to urban or undefined land use and other open spaces
2017, 25(2) MORAVIAN GEOGRAPHICAL REPORTS
213
2017, 25(3): 208–218 MORAVIAN GEOGRAPHICAL REPORTS
213
Fig. 4: Land-use structure of the Dublin metropolitan regionSource: Data from Urban Atlas 2012; authors´ elaboration
qualities for the urban environment and its residents. In Ruhr metropolis, agricultural and other open spaces create together distinct green corridor structures oriented in North-South direction.
These corridors are connected in East-West direction by additional green-blue corridors of the two main rivers Ruhr and Emscher. The corridors consist mainly of agricultural areas on the margins of the region and are connected by
other open spaces in central areas. Thus, agriculture forms the link between central green spaces and open landscapes along regional boundaries.
The urban fabric of Geneva forms a spatially distinct urban centre concentrated at the waterfront of the Geneva Lake, spreading towards the surrounding boundary landscapes (see Fig. 8). Agriculture forms a rather consistent and continuous area around the urban fabric, while creating a spatially
Fig. 5: Figure ground diagrams of urban fabric, agriculture and non-agricultural open spaces in the Dublin metropolitan region. Source: Data from Urban Atlas 2012; authors´ elaborationNote: In all figure-ground plans, black colour represents: 1) Urban Fabric (airports; construction sites; continous and discontinuous urban fabric; industrial, commercial, public, military and private units and isolated structures); 2) Agriculture (arable land – annual crops; pastures; complex and mixed cultivation patterns; permanent crops – vineyards, fruit trees, olive groves); 3) Non-agricultural open space (forests, green urban areas, sports and leisure facilities, herbaceous vegetation associations, open spaces with little or no vegetation, forests, wetland and water bodies)
MORAVIAN GEOGRAPHICAL REPORTS 2017, 25(2)
214
MORAVIAN GEOGRAPHICAL REPORTS 2017, 25(3): 208–218
214
Fig. 7: Figure ground diagrams of urban fabric, agriculture and non-agricultural open spaces in Ruhr metropolis
Fig. 6: A set of 20 × 20 km figure ground square sections of the central area of the Dublin metropolitan regionSource: Data from Urban Atlas 2012; authors´ elaboration
2017, 25(2) MORAVIAN GEOGRAPHICAL REPORTS
215
2017, 25(3): 208–218 MORAVIAN GEOGRAPHICAL REPORTS
215
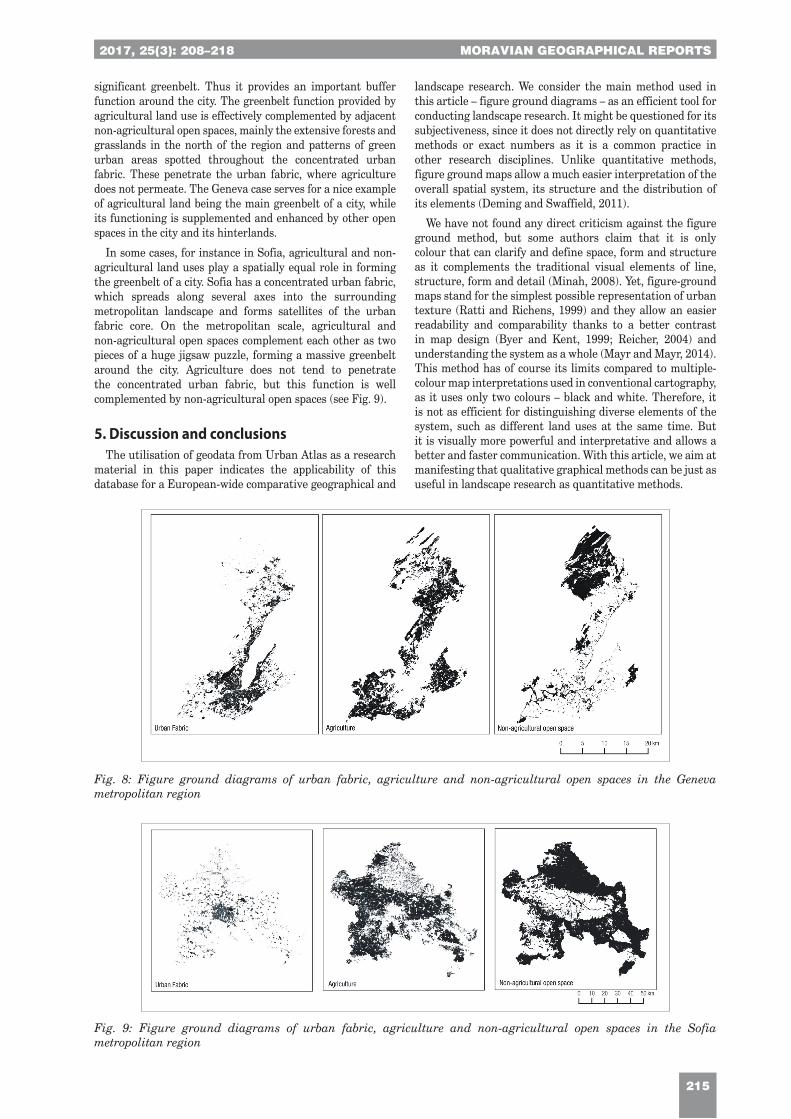
significant greenbelt. Thus it provides an important buffer function around the city. The greenbelt function provided by agricultural land use is effectively complemented by adjacent non-agricultural open spaces, mainly the extensive forests and grasslands in the north of the region and patterns of green urban areas spotted throughout the concentrated urban fabric. These penetrate the urban fabric, where agriculture does not permeate. The Geneva case serves for a nice example of agricultural land being the main greenbelt of a city, while its functioning is supplemented and enhanced by other open spaces in the city and its hinterlands.
In some cases, for instance in Sofia, agricultural and non-agricultural land uses play a spatially equal role in forming the greenbelt of a city. Sofia has a concentrated urban fabric, which spreads along several axes into the surrounding metropolitan landscape and forms satellites of the urban fabric core. On the metropolitan scale, agricultural and non-agricultural open spaces complement each other as two pieces of a huge jigsaw puzzle, forming a massive greenbelt around the city. Agriculture does not tend to penetrate the concentrated urban fabric, but this function is well complemented by non-agricultural open spaces (see Fig. 9).
5. Discussion and conclusionsThe utilisation of geodata from Urban Atlas as a research
material in this paper indicates the applicability of this database for a European-wide comparative geographical and
landscape research. We consider the main method used in this article – figure ground diagrams – as an efficient tool for conducting landscape research. It might be questioned for its subjectiveness, since it does not directly rely on quantitative methods or exact numbers as it is a common practice in other research disciplines. Unlike quantitative methods, figure ground maps allow a much easier interpretation of the overall spatial system, its structure and the distribution of its elements (Deming and Swaffield, 2011).
We have not found any direct criticism against the figure ground method, but some authors claim that it is only colour that can clarify and define space, form and structure as it complements the traditional visual elements of line, structure, form and detail (Minah, 2008). Yet, figure-ground maps stand for the simplest possible representation of urban texture (Ratti and Richens, 1999) and they allow an easier readability and comparability thanks to a better contrast in map design (Byer and Kent, 1999; Reicher, 2004) and understanding the system as a whole (Mayr and Mayr, 2014). This method has of course its limits compared to multiple-colour map interpretations used in conventional cartography, as it uses only two colours – black and white. Therefore, it is not as efficient for distinguishing diverse elements of the system, such as different land uses at the same time. But it is visually more powerful and interpretative and allows a better and faster communication. With this article, we aim at manifesting that qualitative graphical methods can be just as useful in landscape research as quantitative methods.
Fig. 8: Figure ground diagrams of urban fabric, agriculture and non-agricultural open spaces in the Geneva metropolitan region
Fig. 9: Figure ground diagrams of urban fabric, agriculture and non-agricultural open spaces in the Sofia metropolitan region
MORAVIAN GEOGRAPHICAL REPORTS 2017, 25(2)
216
MORAVIAN GEOGRAPHICAL REPORTS 2017, 25(3): 208–218
216
It is obvious that agriculture has a significant land-use share in metropolitan urban landscapes across Europe and thus it has the potential to enhance different green infrastructure concepts and strategies, such as green belts, green wedges or green corridors. These green infrastructure systems make sense only if agriculture is considered an integral part of them. The figure-ground grids of Dublin (Fig. 6) clearly show that the inclusion of agriculture significantly enhances the spatial integrity and connectivity of green infrastructure, which consequently facilitates the functioning of urban ecosystems and increases their capacity to provide ecosystem services. In many cases, agriculture forms the link between central green spaces and landscapes along regional boundaries. This role of agriculture can be observed in Ruhr Metropolis and in a similar way on the local green infrastructure of Sofia and Dublin. Without the inclusion of agricultural areas in green infrastructure, a junction between inner city green spaces and larger green belts would not be made. The synergic effect of this inclusion is also represented by the Geneva region, where non-agricultural spaces create a linkage between two large-scale agricultural land units.
As a policy implication resulting from the analysis of case study regions, it can be suggested that agriculture should be considered an equal part of green infrastructure planning concepts and documents on the regional and local level. This goal can be implemented in master plans, landscape plans or similar planning schemes, including their thematically relevant parts, such as green space plans. Considering future research agenda in this field, it can be suggested to extend the database of Urban Atlas by other European cities, metropolitan areas and regions, in order to develop a database of comparable map data. A promising feature for monitoring of agricultural land-use in urban regions is the comparison of different editions of the Urban Atlas.
The 2012 edition includes this possibility for the first time. An identification of loss or gain of agricultural surfaces and the location of these changes in the urban landscape will be useful to discuss opportunities and threats for urban agriculture on the European level. As the 2006 edition did not yet differentiate between agriculture and other semi-natural spaces, this analysis could not be provided in this paper, but will make future editions of the Urban Atlas especially important for the further development of urban agriculture as a part of green infrastructure. Furthermore, the application of figure grounds in future geographical and landscape related research should be strongly considered, since these allow a visual simplification of map data and thereby an easier analysis of different aspects, such as land-use categories.
AcknowledgementResearch presented in this paper was supported by the
COST Action TD1106 Urban Agriculture Europe and by the Ministry of Education, Science, Research and Sport of the Slovak Republic (KEGA 001SPU-4/2017; KEGA 008SPU-4/2016).
ReferencesBAKAY, L. (2014): Fruitmap and falling fruit – tools for
mapping urban fruit trees in the city of Nitra. In: Raček, M. [ed.]: Plants in urban areas and landscape Nitra (pp. 67–69). Nitra, Slovak University of Agriculture.
BERČÍK, J., GÁLOVÁ, J. (2013): Selected aspects of sustainable issues in food chain. In: Human Capital and Corporate Responsibility (pp. 7–26). Czestochowa, Sekcja Wydaw. WZ PCzęst.
BRANDT, J., VEJRE, H. (2004): Multifunctional landscapes – motives, concepts and perspectives. In: Brandt, J., Vejre H. [eds.]: Multifunctional Landscapes Volume I: Theory, Values and History, Advances in ecological sciences (pp. 3–31). Southampton, WIT Press.
BRANDUINI, P., LAVISCIO, R., SCAZZOSI, L., SUPUKA, J., TÓTH, A. (2016): Urban Agriculture and Cultural Heritage: A Historical and Spatial Relationship. In: Lohrberg, F., et al. [eds.]: Urban Agriculture Europe (pp. 138–147). Berlin, Jovis.
BRENKEN, H., RODE, M., VON HAAREN, C. (2005): Konflikte und Synergien zwischen unterschiedlichen Ansprüchen an die Landschaft und Landschaftsfunktionen. In: Rode, M., Von Haaren, C. [eds.]: Multifunktionale Landnutzung am Stadtrand: Innovative Landschaftsentwicklung durch Integration von Naturschutz, Landwirtschaft und Naherholung am Beispiel Hannover-Kronsberg (pp. 152–171). Bonn, Bundesamt für Naturschutz.
BRYANT, C., PEÑA DÍAZ, J., KERAITA, B., LOHRBERG, F., YOKOHARI, M. (2016): Urban Agriculture from a Global Perspective. In: Lohrberg, F., et al. [eds.]: Urban Agriculture Europe (pp. 30–37). Berlin, Jovis.
BYER SMITH, A. L., KENT, R. B. (1999): Map use in comprehensive city plans. Applied Geographic Studies, 3(1): 45–61.
COPERNICUS LAND MONITORING SERVICES (2015): Urban Atlas [online]. [cit. 01.09.2015]. Available at: http://land.copernicus.eu/local/urban-atlas
COPERNICUS LAND MONITORING SERVICES (2016a): CORINE Land Cover [online]. [cit. 04.10.2016]. Available at http://land.copernicus.eu/pan-european/corine-land-cover
COPERNICUS LAND MONITORING SERVICES (2016b): Mapping Guide for a European Urban Atlas. [online]. [cit. 04.10.2016]. Available at: http://land.copernicus.eu/user-corner/technical-library/urban-atlas-mapping-guide
DUŽÍ, B., TÓTH, A., BIHUŇOVÁ, M., STOJANOV, R. (2014): Challenges of Urban Agriculture: Highlights on the Czech and Slovak Republic Specifics. In: Vávra, J., et al. [eds.]: Current challenges of Central Europe: Society and Environment (pp. 82–107). Prague, Charles University.
EEA (2016): Urban Atlas [online]. [cit. 04.10.2016]. Available at: http://www.eea.europa.eu/data-and-maps/data/urban-atlas#tab-metadata
ESCH, T., MARCONCINI, M., MARMANIS, D., ZEIDLER, J., ELSAYED, S., METZ, A., MÜLLER, A., DECH, S. (2014): Dimensioning urbanization – An advanced procedure for characterizing human settlement properties and patterns using spatial network analysis. Applied Geography, 55: 212–228.
EUROPEAN COMMISSION (2013): Green Infrastructure (GI) – Enhancing Europe's Natural Capital, Communication from the Commission No. COM(2013) 249 final.
2017, 25(2) MORAVIAN GEOGRAPHICAL REPORTS
217
2017, 25(3): 208–218 MORAVIAN GEOGRAPHICAL REPORTS
217
FRANTÁL, B., KUNC, J., NOVÁKOVÁ, E., KLUSÁČEK, P., MARTINÁT, S., OSMAN, R. (2013): Location matters! exploring brownfields regeneration in a spatial context (A case study of the South Moravian Region, Czech Republic). Moravian Geographical Reports, 21(2): 5–19.
FRANTÁL, B., GREER-WOOTTEN, B., KLUSÁČEK, P., KREJČÍ, T., KUNC, J., MARTINÁT, S. (2015): Exploring spatial patterns of urban brownfields regeneration: The case of Brno, Czech Republic. Cities, 44: 9–18.
GÓMEZ-BAGGETHUN, E., GREN, �., BARTON, D. N., LANGEMEYER, J., MCPHEARSON, T., O’FARRELL, P., ANDERSSON, E., HAMSTEAD, Z., KREMER, P. (2013): Urban ecosystem services. In: Elmqvist, T., et al. [eds.]: Urbanization, Biodiversity and Ecosystem Services: Challenges and Opportunities: A Global Assessment (pp. 175–251). Dordrecht, Heidelberg, New York, London, Springer.
HAASE, D., LARONDELLE, N., ANDERSSON, E., ARTMANN, M., BORGSTRÖM, S., BREUSTE, J., GOMEZ-BAGGETHUN, E., GREN, A., HAMSTEAD, Z., HANSEN, R., KABISCH, N., KREMER, P., LANGEMEYER, J., RALL, E. L., MCPHEARSON, T., PAULEIT, S., QURESHI, S., SCHWARZ, N., VOIGT, A., WURSTER, D., ELMQVIST, T. (2014): A quantitative review of urban ecosystem service assessments: Concepts, models, and implementation. Ambio, 43(4): 413–433.
HALAJOVÁ, D., HALAJ, P., FERIANCOVÁ, Ľ., SUPUKA, J. (2013): Analysis of greenery in territories of Nitra town. In: GeoConference SGEM 2013 (pp. 563–570). Sofia, STEP 92 Technology Ltd.
JENKINS, E. J. (2008): To Scale: one hundred urban plans. New York, NY, Routledge.
KESHAVARZ, N., BELL, S. and contributing authors (2016): The Idea of Allotment Gardens and the Role of Spatial and Urban Planning. In: Bell, S., et al. [eds.]: Urban Allotment Gardens in Europe (pp. 8–32). New York, Routledge.
KEYZLAROVÁ, S. (2010): Land-use changes in urban landscape by the example of allotment garden colonies in Brno (CZ) and Vienna (A). Geoscape: Alternative Approaches to Middle-European Geography – The Professional Issue, 5(1): 100–105.
KUCZMAN, G. (2014): Landscape Structure and Biodiversity of Woody Plants in the Cadastral Territory of Kolíňany. Journal of Environmental Protection, Safety and Management, 4(2): 25–32.
LIČKA, L., MALDONADO, L. (2016): Space: Introduction. In: Lohrberg, F., et al. [eds.]: Urban Agriculture Europe (pp. 116–119). Berlin, Jovis.
LOHRBERG, F., LIČKA, L., SCAZZOSI, L., TIMPE, A. [eds.] (2016): Urban Agriculture Europe. Berlin, Jovis.
LOHRBERG, F. (2016): Urban Agriculture Europe: Agriculture Interacting with the Urban Sphere. In: Lohrberg, F., et al. [eds.]: Urban Agriculture Europe (pp. 8–13). Berlin, Jovis.
LOHRBERG, F., SIMON-ROJO, M. (2016): Mapping Urban Agriculture on the European Scale. In: Lohrberg, F., et al. [eds.]: Urban Agriculture Europe (pp. 194–200). Berlin, Jovis.
MARTINO, G., GIACCH�, G., ROSSETTI, E. (2016): Organizing the co-production of health and environmental values in food producti on: The constitutional processes in the relationships between italian solidarity purchasing groups and farmers. Sustainability (Switzerland), 8(4): 1–22.
MAYR, M., MAYR, R. (2014): Schwarzplan: Open Street Map basierte Schwarzpläne. Berlin.
MINAH, G. (2008): Colour as Idea: The Conceptual Basis for Using Colour in Architecture and Urban Design. Colour: Design & Creativity, 2(3): 1–9.
NÖFER, T. (2002): Über die Pläne. In: Hans Stimmann (ed.): Die gezeichnete Stadt. Die Physiognomie der Berliner Innenstadt in Schwarz- und Parzellenplänen 1940–2010 (pp. 71–73) Berlin.
PARADIS, S., CIESZEWSKA, A., TÓTH, A., ŠUKLJE-ERJAVEC, I. (2016): Agriculture in Urban Space. In: Lohrberg, F., et al. [eds.]: Urban Agriculture Europe (pp. 120–125). Berlin, Jovis.
PLIENINGER, T., BIELING, C., FAGERHOLM, N., BYG, A., HARTEL, T., HURLEY, P., LÓPEZ-SANTIAGO, C. A., NAGABHATLA, N., OTEROS-ROZAS, E., RAYMOND, C. M., VAN DER HORST, D., HUNTSINGER, L. (2015): The role of cultural ecosystem services in landscape management and planning. Current Opinion in Environmental Sustainability, 14: 28–33.
PÖLLING, B., ALFRANCA, Ó., ALVES, E., ANDERSSON, G., BRANDUINI, P., PAULEN, O. (2016): Creating added value: societal benefits of urban agriculture. In: Lohrberg, F., et al. [eds.]: Urban Agriculture Europe (pp. 92–100). Berlin, Jovis.
RATTI, C., RICHENS, P. (1999): Urban Texture Analysis with Image Processing Techniques. In: Augenbroe, G., Eastman, Ch. [eds.]: Computers in Building: Proceedings of the CAADfutures ´99 (pp. 50–51). Atlanta, Springer Science+Business Media, LLC
RECASENS, X., ALFRANCA, O., MALDONADO, L. (2016): The adaptation of urban farms to cities: The case of the Alella wine region within the Barcelona Metropolitan Region. Land Use Policy, 56: 158–168.
REICHER, C. (2012): Städtebauliches Entwerfen. Wiesbaden.
RZEPIELOVÁ, M., FERIANCOVÁ, Ľ. (2014): Potential of urban agriculture in Nitra. In: Lackóová, L. [ed.]: Veda mladých 2014 (pp. 20–28). Krakow, SUA Nitra.
SANESI, G., COLANGELO, G., LAFORTEZZA, R., CALVO, E., DAVIES, C. (2016): Urban green infrastructure and urban forests: a case study of the Metropolitan Area of Milan. Landscape Research, pp. 1–12.
SCHÖBEL, S. (2010): TU München – Fachgebiet für Landschaftsarchitektur regionaler Freiräume. Forschungsprojekt Schwarzplan Grün. [online] [cit. 15.09.2015]. Available at http://www.lareg.wzw.tum.de/fileadmin/html_data/fo-fr-sg.html
SIMON-ROJO, M., RECASENS, X., CALLAU, S., DUŽÍ, B., EITER, S., HERNÁNDEZ-JIMÉNEZ, V., KETTLE, P., LAVISCIO, R., LOHRBERG, F., PICKARD, D., SCAZZOSI, L., VEJRE, H. (2016): From Urban Food Gardening to Urban Farming. In: Lohrberg, F., et al. [eds.]: Urban Agriculture Europe (pp. 22–28). Berlin, Jovis.
MORAVIAN GEOGRAPHICAL REPORTS 2017, 25(2)
218
MORAVIAN GEOGRAPHICAL REPORTS 2017, 25(3): 208–218
218
SANYÉ-MENGUAL, E., ANGUELOVSKI, I., OLIVER-SOLÀ, J., MONTERO, J. I., RIERADEVALL, J. (2016): Resolving differing stakeholder perceptions of urban rooftop farming in Mediterranean cities: promoting food production as a driver for innovative forms of urban agriculture. Agriculture and Human Values, 33(1): 101–120.
SUPUKA, J. (2013): Development, changes and assessment of tree alleys in town streets. Folia oecologica, 40(2): 266–271.
TEEB – The Economics of Ecosystems and Biodiversity [online]. [cit. 16.04.2013]. Available at: http://www.teebweb.org
TIMPE, A. (2016): Produktive Parks entwerfen Geschichte und aktuelle Praxis biologischer Produktion in europäischen Parks. Dissertation, Aachen, Rheinisch-Westfälische Technische Hochschule.
TIMPE, A., CIESZEWSKA, A., SUPUKA, J., TÓTH, A. (2016): Urban Agriculture Goes Green Infrastructure. In: Lohrberg, F., et al. [eds.]: Urban Agriculture Europe (pp. 126–137). Berlin, Jovis.
TÓTH, A., RENDALL, S., REITSMA, F. (2016): Resilient food systems: a qualitative tool for measuring food resilience. Urban Ecosystems, 19(1): 19–43.
VEJRE, H., EITER, S., HERNÁNDEZ-JIMÉNEZ, V., LOHRBERG, F., LOUPA-RAMOS, I., RECASENS, X., PICKARD, D., SCAZZOSI, L., SIMON-ROJO, M. (2016): Can Agriculture be Urban? In: Lohrberg, F., et al. [eds.]: Urban Agriculture Europe (pp. 18–21). Berlin, Jovis.
YOKOHARI, M., TAKEUCHI, K., WATANABE, T., YOKOTA, S. (2000): Beyond greenbelts and zoning: A new planning concept for the environment of Asian mega-cities. Landscape and Urban Planning, 47(3–4): 159–171.
Please cite this article as:
TÓTH, A., TIMPE, A. (2017): Exploring urban agriculture as a component of multifunctional green infrastructure: Application of figure-ground plans as a spatial analysis tool. Moravian Geographical Reports, 25(3): 208–218. Doi: 10.1515/mgr-2017-0018.