scientific explanations: a comparative case study of
TRANSCRIPT

Electronic Journal of Science Education Vol. 19, No. 5 (2015)
© 2015 Electronic Journal of Science Education (Southwestern University/Texas Christian University) Retrieved from http://ejse.southwestern.edu
Scientific explanations: A comparative case study of teacher practice and student performance
Rebecca Hoffenberg
Portland Public Schools, USA
Emily Saxton
Portland State University, USA
Abstract
A Framework for K-12 Science Education, the foundation for the Next Generation
Science Standards (NGSS), identifies scientific explanation as one of the eight practices
“essential for learning science” (National Research Council, 2012, p. 41). In order to design
professional development so teachers can implement these new standards, we need to assess
students’ current skill levels in explanation construction, characterize current teacher practice
surrounding it, and identify best practices for supporting students in explanation construction.
This case study investigated teacher practice in two high school science inquiry units in the
Portland metro area and the scientific explanations the students produced in their work samples.
Teacher Instructional Portfolios (TIPs) were analyzed qualitatively based on best practices in
teaching science inquiry and a qualitative coding scheme. Written scientific explanations were
analyzed with an explanation rubric and qualitative codes. Relationships between instructional
practices and explanation quality were examined, and five factors that support students in
producing scientific explanations that align with the NGSS were identified: (1) strong content
knowledge regarding the theory underlying the science inquiry investigation, (2) balanced
pedagogical techniques, (3) previous experience conducting science inquiry, (4) an open-ended
investigation topic, and (5) clear expectations for explanation construction aligned with relevant
standards.
Correspondence concerning this article should be addressed to: Rebecca Hoffenberg, 5565 SE
Stark St., Portland, OR 97215. Email: [email protected]
Key Words: science teacher professional development; scientific explanation; science inquiry;
Next Generation Science Standards; scientific argumentation; scientific practices
Introduction
A Framework for K-12 Science Education: Practices, Crosscutting Concepts and Core
Ideas (National Research Council, 2012) (hereafter referred to as “the Framework”) supports an
approach to science education that does not merely value scientific facts for their own sakes, but
which helps students see science as a body of practices and the product of “many hundreds of
years of creative human endeavor” (p. 9). The Framework and the Next Generation Science
Standards (NGSS), based on the Framework, emphasize scientific explanation construction as
one of the eight essential skills for students learning science (National Research Council, 2012;
NGSS Lead States, 2013). In states that adopt the NGSS, science educators will need to adapt
their curricula to incorporate the practices, crosscutting concepts and core ideas on which the

Hoffenberg and Saxton 2
Electronic Journal of Science Education ejse.southwestern.edu
standards are based (National Research Council, 2012). Teachers will need considerable support
from professional development providers to become familiar with the new standards and to
implement them effectively.
Before the adoption of the NGSS, many state science standards were based on the
American Association for the Advancement of Science (AAAS) Benchmarks for Science
Literacy (AAAS, 1993), and the National Science Education Standards (NSES) (National
Research Council, 1996). The teachers who participated in this study were practicing in Oregon,
which was among these states (Oregon Department of Education, 2009a). While the Oregon
standards mention constructing scientific explanations, explanation is combined with other
inquiry skills and not identified as a separate practice (Oregon Department of Education, 2009b).
The standards are not as explicit as the NGSS in emphasizing explanation construction as an
essential skill. Many other states’ scientific inquiry standards are similarly vague (Porter-Magee,
Wright, & Horn, 2013).
Scientific explanation is one of the goals of science inquiry, and students will be more
successful in inquiry activities if they understand this goal (Sandoval, 2003). However, the
education literature demonstrates that secondary students have difficulty in producing high
quality scientific explanations. Sandoval (2003) showed that students do not understand the
importance of citing data to support a claim. Kuhn and Reiser (2005) demonstrated that students
need support in defending claims and arguments, and Ruiz-Primo, Li, Tsai, and Schneider (2010)
found that students’ written explanations often lacked the three crucial elements of a full
explanation: claim, evidence and reasoning. Studies have also found that the teaching of
scientific explanation is inconsistent, and that teachers need support in their instructional
practices around this skill (McNeill & Krajcik, 2008; Ruiz-Primo, Li, Tsai, & Schneider, 2010).
Literature Review
Importance of Explanation
Explanation engages students’ higher order thinking skills, and supports content
understanding and model-based reasoning, all of which are considered 21st Century skills (Silva,
2009). As noted in the introduction, the Framework (National Research Council, 2012) is
explicit about the importance of scientific explanation in science inquiry, identifying it as one of
the eight practices deemed “essential elements of the K-12 science and engineering curriculum”
(p. 41). In learning how to construct explanations, students will develop an understanding of the
scientific meanings of “theory,” “hypothesis” and “model” and how they compare to the
everyday usage, a source of considerable confusion and obfuscation in current policy debates
involving scientific issues. In constructing explanations, students will also gain deeper
knowledge of the major theories and models underlying current scientific knowledge, such as the
theory of evolution, kinetic-molecular theory and the greenhouse-gas model of climate change;
and how these models can explain data patterns or observed phenomena. Competing
explanations for phenomena such as climate change can lead to rich discussions in the classroom
about how well each explanation is supported by the data, is parsimonious and satisfies other
scientific values. Constructing model-based or data-based explanations is a powerful skill that

A comparative case study of teacher practice and student performance 3
Electronic Journal of Science Education ejse.southwestern.edu
gives students opportunities to learn science content more deeply and gain profound insight into
the nature of science and the practices and values of professional scientists.
In their study of epistemic and conceptual scaffolds for science inquiry activities,
Sandoval and Reiser (2004) argue that helping students develop an understanding of how
scientific knowledge is created is one of the primary goals of science inquiry activities. These
researchers focus on scientific explanation as one of the most important aspects of scientific
epistemology. Convincing scientific explanations, they say, have a clear causal claim and data to
support the claim. The type of causal reasoning needed varies according to the theory that
frames the investigation and the scientific discipline to which it belongs. For example, a claim
that natural selection has acted to change a trait in a species requires a certain type of argument
framed by the theory of natural selection, which would necessarily include evidence of an
environmental stressor and a variation in traits in a population. A claim that the results of an
experiment support a theory or model in a physics inquiry would require a theoretical prediction
of an experimental result derived from that model and verification of the prediction with
experimental data. Students will learn more about the nature of science and the mental habits of
scientists if they practice developing scientific explanations that conform to these criteria.
Sandoval and Reiser (2004) extensively develop the rationale for why supporting
students in creating scientific explanations and supporting them using argumentation teaches
them how scientific knowledge is built by working scientists, and why this is crucial in
disabusing students of the idea that science is a collection of facts to be memorized and not
questioned. If students understand how scientific knowledge is built, they can become more
sophisticated consumers of science knowledge and more critical of scientific claims in popular
culture.
In another study, Kuhn and Reiser (2005) describe scientific explanation as the
culmination of the cognitive processes of “sense making,” or constructing personal explanations
for natural phenomena; articulating explanations, and defending them. In this study, the
concepts of explanation and argumentation were tightly linked. This study of student difficulties
with these processes, described in detail below, found that the defense criterion was where many
students stumbled, and concludes with ideas about why claim defense is important. Scientific
knowledge is based on consensus in the scientific community, where claims are “critiqued,
debated and revised” (Kuhn & Reiser, 2005, p. 4). Teaching students how to defend scientific
claims, and giving them opportunities to develop their argumentation skills among their peers, is
engaging and helps emphasize the importance of this scientific practice.
Student Difficulties with Explanation
Sandoval (2003) probed student difficulties with scientific explanation and argumentation
using a software program he developed to scaffold explanation construction of evolutionary
phenomena using natural selection. He explored students’ “epistemologies of science: beliefs
about the nature of science and scientific knowledge” (Sandoval, 2003, p. 8). Sandoval (2003)
clarified that “…students’ epistemologies of science include their ideas about what scientific
theories and explanations are, how they are generated, and how they are evaluated as knowledge
claims” (p. 8). He concluded that students understood the importance of showing causal
mechanisms and causal links in a scientific explanation, but viewed data as “something to be

Hoffenberg and Saxton 4
Electronic Journal of Science Education ejse.southwestern.edu
explained, but not necessarily as a necessary component of an argument” (Sandoval, 2003, p.
41). They also did not view lack of data as an argument against a claim.
Kuhn and Reiser (2005) also studied student difficulties with producing scientific
explanations and arguments in the context of a middle school science inquiry unit that the
authors helped design. When the researchers analyzed the written explanations for two of the
science inquiry activities in the curriculum, they noticed that students generally were able to
make sense of the phenomena and articulate explanations, but they struggled with the “defense”
criterion. The authors identified two aspects of explanations that supported explanation defense:
differentiation between evidence and inference, and inclusion of overtly persuasive statements.
The best defenses, Kuhn and Reiser (2005) argue, have a clear differentiation between
data and interpretation, so that the audience can discern which statements come directly from
data sources and which are the scientists’ interpretation of the data. The authors found that 45%
of the explanations analyzed lacked a clear distinction between data and inference. Though overt
statements of correctness (“My hypothesis is correct because…”) were not required as part of an
explanation, the researchers evaluated them as a clear attempt to persuade, thus showing that the
students were attending to the defense requirements. Only 29% of the explanations contained
persuasive statements.
Ruiz-Primo, Li, Tsai and Schneider (2010) documented difficulties students had in
writing scientific explanations in SI activities. The authors developed a rubric to evaluate the
quality of scientific explanations in students’ science notebooks in an SI unit on density. Using
their rubric, the authors found that only 18% of the notebooks contained scientific explanations
with the three required elements of claim, evidence and reasoning; 40% of the explanations were
claims without any supporting evidence.
The authors concluded that the ability to construct high-quality scientific explanations
might be linked to student learning as measured by summative assessments. They also
characterized some aspects of students’ science notebooks and teachers’ guidance in using the
notebooks that make them more useful in developing and assessing students’ understanding of
science inquiry activities.
Instructional Practices to Support Explanation
Researchers have also investigated interventions and instructional practices related to
student performance in scientific explanation. McNeill and Krajcik (2008) investigated
instructional practices related to teaching middle school students how to write scientific
explanations. They videotaped thirteen teachers presenting a lesson in a chemistry unit that
focused on how to construct complete scientific explanations. The researchers rated the teachers
on four aspects of instructional practice in the lesson: defining, modeling, and explaining the
rationale for scientific explanations, and making connections between scientific and everyday
explanations. The authors also collected pretest and posttest data to evaluate students’ progress
toward the learning goals, and calculated correlations among the quality of the implementation of
the four practices and student achievement.

A comparative case study of teacher practice and student performance 5
Electronic Journal of Science Education ejse.southwestern.edu
The study found that the largest positive effect on student achievement, as measured by
posttest scores on the three open-ended explanation items, came from explaining the rationale for
science explanations. Connecting scientific explanation to everyday experience had a negative
effect on learning. Defining scientific explanation in isolation also had a negative effect on
learning, but when teachers combined the defining practice with providing an explicit rationale
for scientific explanations, there was a positive effect. Modeling scientific explanation did not
have a significant effect on student learning.
The authors pointed out that small sample size may have affected their analysis of the
practices of providing rationale and everyday examples. Since the curriculum materials provided
by the researchers did not instruct teachers to state an explicit rationale for scientific explanation,
only two of the thirteen teachers did so. Only three of the teachers connected science
explanation to everyday explanation. Because of the surprising results surrounding these two
practices, the authors point to these as important areas of future research.
In the study by Ruiz-Primo, Li, Tsai and Schneider (2010) of scientific explanations in an
SI unit on density, described above, the authors found that students from the same classroom
tended to produce similar patterns of explanation quality, suggesting that the teachers’ practice
influenced the students’ ability to produce them. The authors concluded that despite emphasis in
the standards on constructing scientific explanations in science inquiry, teachers are not
consistently teaching this skill, or not stressing all the required components.
Both Ruiz-Primo, Li, Tsai, and Schneider (2010) and Sandoval (2003) commented on
how the degree of scaffolding or the use of teacher-provided templates influences students’
explanations. Sandoval (2003) showed that scaffolding and prompting can help students develop
coherent causal chains that can plausibly explain data, but teachers need to use the results from
science inquiry activities to drive classroom discussions about using data and citing it explicitly
to support scientific claims. Ruiz-Primo, Li, Tsai, and Schneider (2010) commented that
instructions limited to sections headings such as “Conclusions” or “My Claim” were insufficient
to focus students’ responses, whereas a template with a very high level of guidance tended to
discourage students from relying on their own thinking.
These studies raise some broad questions about secondary teaching and learning of
scientific explanations prior to the implementation of NGSS: What are teachers currently doing
in classrooms to support students’ skills in scientific explanation construction? How effective
are current teaching practices in helping students meet the current science inquiry standards, and
do they address the explanation standards articulated in the Framework and the NGSS? And,
how can we support students in achieving the standard of producing complete scientific
explanations as part of their science inquiry experiences? The current study was motivated by
these questions.
Research Questions
This study used SI instructional units implemented by two teachers, along with student
work produced during these units, to investigate the following questions: What instructional
strategies were evident in teacher instructional portfolios (TIP) for supporting high school
students in constructing written scientific explanations? What was the quality of the

Hoffenberg and Saxton 6
Electronic Journal of Science Education ejse.southwestern.edu
explanations the students produced in summative work samples? What are the connections
between the teachers’ instructional strategies and their students’ explanation?
Methods
Overview
This research used a case study design that drew from mixed types of evidence
(quantitative and qualitative) and employed a case-comparison approach for inter-case analysis
(Yin, 1981). In this case study, cases were defined as the teaching and learning that occurred in
two different classrooms environments. The two contrasting cases were chosen to clearly and
succinctly highlight the most important findings from a larger multiple case study that was
previously conducted and included eight classrooms in total (Hoffenberg, 2013).
Study Context and Participants.
The teachers in this study were participating in a professional development workshop in
the fall of 2010 in which they collaborated to design units that culminated in a science inquiry or
engineering design work sample. After implementing the units, the participating teachers
submitted TIPs and students’ work samples (SWS) for further analysis. The classroom-level
demographics of the two cases including the class size, ethnic composition and percent English
language learners (ELLs) are found in Table 1. Teacher demographics are summarized in Table
2. Finally, the grade levels, content areas and inquiry topics varied between the two classroom
cases without any influence by the researchers (Table 3).
Table 1: Class demographics
Class-
room*
Num-
ber of
stu-
dents
(s)
%
female
(d)
%
White
(d)
%
Black
(d)
%
Latino(a)
(d)
%
Asian /
Pacific
Islander
(d)
%
Indian /
Alaska
Native
(d)
%
Multi-
ethnic
(d)
% ELL
(S)
Joe 35 37 66 9 11 11 3 0 ≤ 10
Sonia 28 82 57 0 8 31 23 0 ≤ 10
*The names assigned to the classroom teachers are pseudonyms, here and throughout the study.
(s) - Data were obtained from Surveys of Enacted Curriculum (SEC) (Wisconsin Center for
Education Research, 2010); (d) - Data were provided by the districts.
Table 2: Demographics, experience and education of participating teachers from SEC.
Class-
room
Gen-
der Ethnicity
Teaching
experience
(years)
Years
teaching
at
current
school
Highest
degree
Major
field of
study for
bachelor’s
degree
Major field
for highest
degree

A comparative case study of teacher practice and student performance 7
Electronic Journal of Science Education ejse.southwestern.edu
Table 2: Demographics, experience and education of participating teachers from SEC.
Class-
room
Gen-
der Ethnicity
Teaching
experience
(years)
Years
teaching
at
current
school
Highest
degree
Major
field of
study for
bachelor’s
degree
Major field
for highest
degree
Joe M White <1 <1 Multiple
Master’s Science Sci Ed
Sonia F White 6-8 6-8 Master’s Science Sci Ed
Table 3 – Unit information for participating classrooms
Classroom Grade
Level
Content
Area Unit topic SI Activity
Joe 10 Chemistry
Chemical
Reactions
and Reaction
Rates
Alka-seltzer / water reaction time with
various conditions
Sonia 12 Biology
(IB*)
Anatomy and
physiology
Relationship between changes in the
cardiovascular system relative to changes
in body position or stimuli.
*IB stand for “International Baccalaureate”
SWS sampling method.
This study used a parallel sampling design, which is a sampling technique that
“facilitate(s) credible comparisons of two or more different subgroups” (Onwuegbuzie & Leech,
2007, p. 239) with the subgroups in this study being the two groups of students from the two
classroom cases. Onwuegbuzie and Leech (2007) recommend that at least three members of each
subgroup should be sampled in a parallel sampling design. In order to surpass these minimum
guidelines and ensure a richer picture of student explanations for each case in this study, eight
samples were selected from each classroom for a total of 16 SWSs across the two cases. There
were no demographic or past achievement data available at the individual student level, so a
purposeful sampling scheme was not possible, therefore, a simple random sampling scheme was
used. If a work sample appeared incomplete, then an alternative SWS was chosen at random for
analysis.
Instruments
Teacher Instructional Portfolio (TIP). The TIP is an artifact-based instrument designed
for measuring effective teacher instructional practices by allowing teachers to document their
implementation of full units of instruction. The TIP is a binder with instructions for teachers to
document their instructional units with artifacts including unit goals, lessons and activities,
assessments and prompts for teacher pedagogical reflections. The TIP instrument is currently
being investigated for reliability and validity; however, the literature review associated with the
TIP served as a teacher instructional practices framework allowing for qualitative coding of the
TIPs from this study and the subsequent generation of case descriptions with details about the
unit content, activities and assessments.

Hoffenberg and Saxton 8
Electronic Journal of Science Education ejse.southwestern.edu
The teacher instructional practices framework is derived from literature on effective
practices in science, engineering, and mathematics instruction (Saxton et al., 2014; Saxton &
Rigelman, Unpublished). This framework includes an emphasis on three instructional practices
that were used as codes of general teaching practices: classroom roles, content and cognitive
skills, and assessment for learning. The classroom roles instructional practice is defined as a shift
from teacher-centered instruction to student-centered instruction, in which the teacher acts more
as a guide to help students construct their own knowledge rather than as a transmitter of
knowledge from a position of authority (Anderson, 2002; Fortus, Dershimer, Krajcik, Marx, &
Mamlok-Naaman, 2004; Marshall, 2009; Mehalik, Doppelt, & Schuun, 2008; Miner, Levy, &
Century, 2010). The content and cognitive skills instructional practice emphasizes an integration
of higher-order cognitive skills (or practices) with content knowledge (Apedoe, Reynolds,
Ellefson & Schunn, 2008; Aschbacher & Roth, 2002; Gallagher, 2000; Miner et al., 2010;
Stephens, McRobbie & Lucas, 1999; Zimmerman, 2007) and the implementation of multiple and
diverse opportunities for students to develop both content knowledge and cognitive skills
(Anderson, 2002; Aschbacher & Roth, 2002; Prain & Waldrip, 2006). The assessment for
learning instructional practice is focused on assessment practices that gather data to improve
teaching and learning (as opposed to measuring learning solely for the purposes of grading) (Bell
& Cowie, 2001; Black & Wiliam, 1998; 2009; Miner, Levy, & Century, 2010). Please see
Appendix A for a more detailed version of the framework including example criteria of what was
looked for in each TIP.
Explanation-specific instructional practices. To examine explanation-specific
instructional practices, the first author coded each TIP with qualitative codes; the explanation-
specific codes were drawn from McNeill and Krajcik (2008), but additional codes were added
based on trends in the data set (Table 4, Appendix B).
Table 4: TIP Qualitative Codes and Definitions
TIP Qualititative Codes
Defining explanation (M)
Making rationale explicit (M)
Modeling explanation (M)
Connecting science explanation to everyday explanation (M)
Explanation mentioned in TIP? (T)
Degree of scaffolding evident in TIP (T)
(M) Codes based on McNeill & Krajcik (2008); (T) Codes added based on trends seen in this study
Student work sample (SWS). The student work sample instrument was composed of the
teacher developed science inquiry task, the student generated responses, and the explanation
rubric (Appendix C). The explanation rubric is based on the study by Ruiz-Primo, Li, Tsai and
Schneider (2010). Ruiz-Primo, Li, Tsai and Schneider (2010) found positive correlations
between explanation scores and student performance on other types of assessments such as
performance questions, multiple choice items, predict-observe-explain tasks and open-ended
questions on the end-of-unit test, bolstering the validity of the instrument. For the purposes of

A comparative case study of teacher practice and student performance 9
Electronic Journal of Science Education ejse.southwestern.edu
this study, the rubric was generalized to be applicable across the range of work sample tasks in
the larger study.
A score of 3 on each aspect of the explanation rubric was considered ‘adequate’ for high
school science students in this study because this level of performance is roughly aligned with
the expectations for secondary students in the NGSS. For example, the NGSS says that students
in grades 9-12 should be able to write explanations that:
Make a quantitative and/or qualitative claim regarding the relationship between
dependent and independent variables.
Construct and revise an explanation based on valid and reliable evidence obtained
from a variety of sources (including students’ own investigations, models,
theories, simulations, peer review) and the assumption that theories and laws that
describe the natural world operate today as they did in the past and will continue
to do so in the future.
Apply scientific ideas, principles, and/or evidence to provide an explanation of
phenomena and solve design problems, taking into account possible unanticipated
effects.
Apply scientific reasoning, theory, and/or models to link evidence to the claims to
assess the extent to which the reasoning and data support the explanation or
conclusion. (NGSS Lead States, 2013, pp. 11-12)
The level 3 in each of the claim, evidence and reasoning categories of the explanation rubric was
construed to meet these expectations in the context of the SWS.
The qualitative coding scheme was adapted from Ruiz-Primo, Li, Tsai and Schneider
(2010), Kuhn and Reiser (2005) and additional codes developed for this study based on trends in
our data set. See Appendix D for the qualitative coding scheme.
Analysis
This study followed the within-case and between-case analysis techniques as described
by Yin (1981) to answer its research questions. For research question 1, the Teacher Instructional
Portfolio (TIP) for each case was evaluated in two ways: 1) general effective teaching practices
were coded using the Teacher Instructional Practices framework and 2) explanation specific
teaching practices were qualitatively coded. Regarding the coding for general effective teaching
practices, the second author trained three members of the research team on how to interpret
documents in the TIP as evidence of the three instructional practices of the Teacher Instructional
Practices framework (described above and in Appendix A). This training included practice
analyses using TIPs that were not included in the larger multiple case study (or this study) and
consensus discussion of those practice TIPs. The three raters then worked independently to
analyze the TIPs for this study, taking detailed field notes indicating which documents in each
TIP were interpreted as evidence of the three instructional practices. After the independent
analyses were completed, the research team discussed each TIP and reached consensus about the
general teaching practices evident in the TIP. The research team’s collective field notes and the
result of the consensus discussion informed the case descriptions of teacher’s general teaching
practices. The first author coded each teacher’s explanation specific teaching practices; therefore,

Hoffenberg and Saxton 10
Electronic Journal of Science Education ejse.southwestern.edu
no inter-coder reliability or consensus was obtained for the explanation-specific analysis of the
TIPs.
For research question 2, eight students’ science inquiry work samples were chosen at
random from each case and the student’s scientific explanations contained within those work
samples were quantitatively scored with an explanation rubric (Appendix C) adapted from Ruiz-
Primo, Li, Tsai and Schneider (2010) and qualitatively coded with categories adapted from the
research literature. Only the portion of each work sample where the explanation would be
expected (typically labeled “Discussion”) was analyzed. The research team completed scoring
training prior to investigating inter-rater reliability. Then using student work samples that were
not part of the larger multiple case study (or this study), the research team independently scored
the same set of work samples to investigate inter-rater reliability. The intraclass correlation
coefficients (ICCs) for the three explanation rubric categories and the sum were calculated in
SPSS using the two-way random, single measure and absolute agreement analysis (Landers,
2011). The intraclass correlation coefficients were 0.325 for claim, 0.710 for evidence, 0.964 for
reasoning, and 0.893 for composite score (the sum of all three categories). Claim was the only
category in which the acceptable level of 0.700 was not achieved. The reasoning score reliability
was likely inflated due to the considerable number of explanations in the practice set which
contained no reasoning at all and scored zero. Next, the first author scored all student work
samples that were included in this study with both the quantitative explanation rubric and also
applied a qualitative coding scheme to the student explanations. For research question 3,
relationships between teachers’ instructional practices and the students’ scientific explanation
scores were explored, and the two cases compared, to identify possible links between teacher
instruction and the quality of students’ explanations.
Results
Qualitative TIP Analysis
Joe’s TIP had evidence that he provided students with definitions of claim and evidence
and modeled claims and evidence. In the examples of a good and bad knowledge claim, Joe
combined claim with evidence under the heading “knowledge claim,” resulting in ‘2’ score on
‘Modeling Claim’ for “identifying too much” and a ‘1’ score on ‘Modeling Evidence’ for “does
not identify” (Appendix B). There was no evidence in the TIPs that Joe stated an explicit
rationale for scientific explanation, nor did he connect it to everyday examples. Sonia did not
explicitly cover explanation at all in her instruction (Table 5).

A comparative case study of teacher practice and student performance 11
Electronic Journal of Science Education ejse.southwestern.edu
Table 5 – Qualitative coding of TIPs for instruction related to scientific explanation
Class Joe Sonia
Defining explanation: (1)
Defined claim* 5 0
Defined evidence* 3 0
Defined reasoning* 0 0
Making rationale explicit (1) 0 0
Modeling explanation: (1)
Modeling claim 2 0
Modeling evidence 1 0
Modeling reasoning 0 0
Connecting science explanation to
everyday explanation (1) 0 0
Explanation mentioned in TIP Yes No
Degree of scaffolding evident in TIP Low Low
(1) Codes from McNeill and Krajcik (2008)
*For these scores, use of the words "claim," "evidence" or "reasoning," were not required,
only whether an equivalent of the component was evident.
Student Work Samples
Goal 2 of this study was to evaluate the quality and characteristics of the scientific
explanations present in the students’ (SI) work samples. The results are presented below.
Quantitative analysis. Table 6 summarizes the student work sample results for both
cases in the study. Both Sonia’s and Joe’s classes had average Claim scores rounded to a ‘3,’
considered ‘adequate,’ indicating that in general students included a claim that was explicitly
stated in the explanation section, related to the research question and supported by the data.
Very few students achieved a ‘4,’ which would have indicated that the claim’s relevance to the
research question was explicitly stated and that the claim was proximate to the evidence and
reasoning as part of a cohesive argument (Table 6).
Table 6: Mean Student Work Sample Explanation Scores by Class*
Joe Sonia
Claim mean 3 3
Evidence mean 2 4
Reasoning mean 1 3
Composite mean 6 9
*Because of rounding, the composite mean displayed is not necessarily the sum of the
displayed component scores.
In the ‘Evidence’ category, Joe’s class scored an average of ‘2.’ This shows that most of
the students in his class either neglected to identify a pattern in the data to adequately support a
claim, or used data in a flawed or unscientific manner. Sonia’s students had an average score
which rounded to ‘4,’ indicating that most of her students included language describing a pattern,
and the description was supported with data from the experiment explicitly intended to support
the pattern (Table 6).
Hoffenberg and Saxton 12
Electronic Journal of Science Education ejse.southwestern.edu
In the ‘Reasoning’ category, Joe’s class averaged a ‘1.’ In his classes, four of the eight
students in the sample brought neither logical reasoning nor science content into their
explanations, thus earning a ‘0’ for that category. Sonia’s class scored an average of ‘3’ in
Reasoning, showing that most of the students had reasoning in their explanations that were
aligned with their claim. Their failure to achieve a ‘4’ indicates that generally either the
language of the explanation did not flow together to make a convincing argument, or that there
were important pieces of content missing (Table 6).
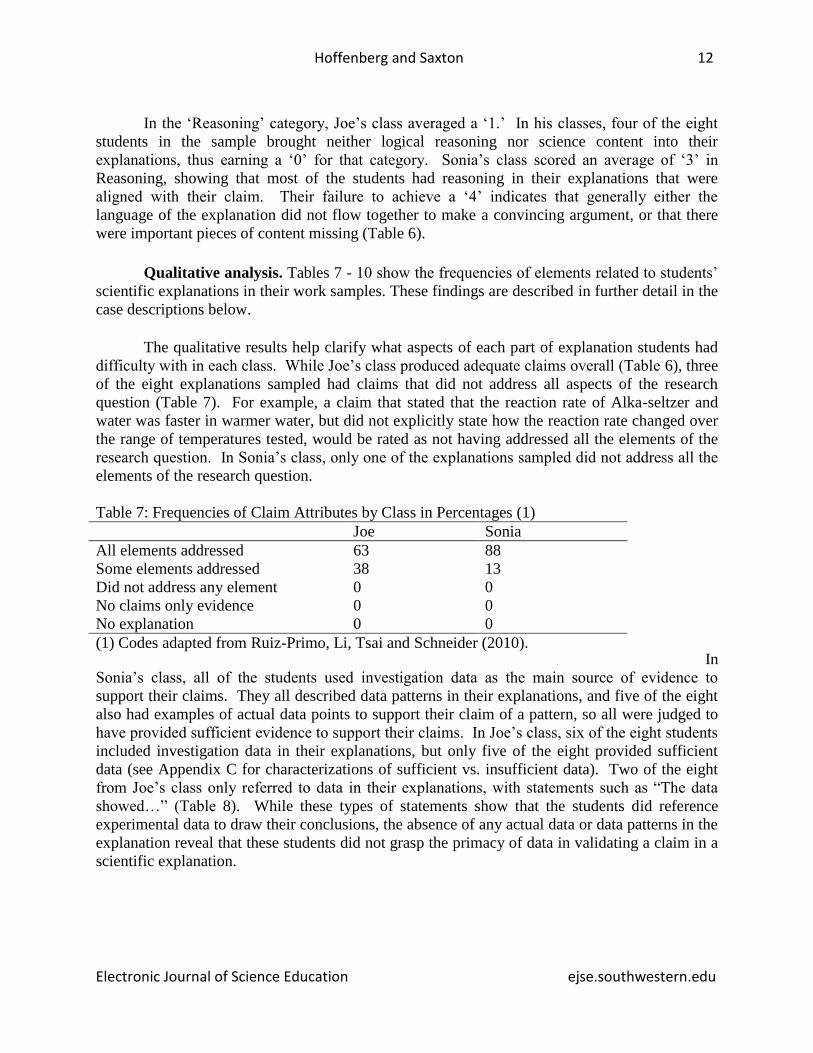
Qualitative analysis. Tables 7 - 10 show the frequencies of elements related to students’
scientific explanations in their work samples. These findings are described in further detail in the
case descriptions below.
The qualitative results help clarify what aspects of each part of explanation students had
difficulty with in each class. While Joe’s class produced adequate claims overall (Table 6), three
of the eight explanations sampled had claims that did not address all aspects of the research
question (Table 7). For example, a claim that stated that the reaction rate of Alka-seltzer and
water was faster in warmer water, but did not explicitly state how the reaction rate changed over
the range of temperatures tested, would be rated as not having addressed all the elements of the
research question. In Sonia’s class, only one of the explanations sampled did not address all the
elements of the research question.
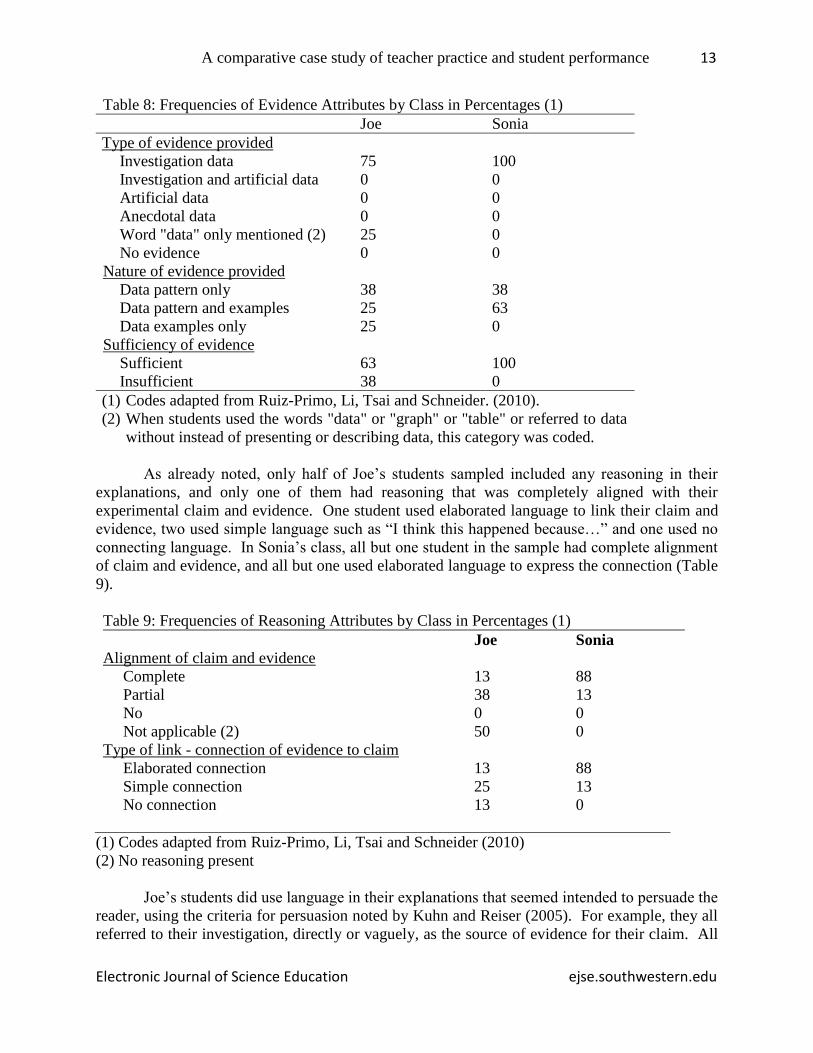
In
Sonia’s class, all of the students used investigation data as the main source of evidence to
support their claims. They all described data patterns in their explanations, and five of the eight
also had examples of actual data points to support their claim of a pattern, so all were judged to
have provided sufficient evidence to support their claims. In Joe’s class, six of the eight students
included investigation data in their explanations, but only five of the eight provided sufficient
data (see Appendix C for characterizations of sufficient vs. insufficient data). Two of the eight
from Joe’s class only referred to data in their explanations, with statements such as “The data
showed…” (Table 8). While these types of statements show that the students did reference
experimental data to draw their conclusions, the absence of any actual data or data patterns in the
explanation reveal that these students did not grasp the primacy of data in validating a claim in a
scientific explanation.
Table 7: Frequencies of Claim Attributes by Class in Percentages (1)
Joe Sonia
All elements addressed 63 88
Some elements addressed 38 13
Did not address any element 0 0
No claims only evidence 0 0
No explanation 0 0
(1) Codes adapted from Ruiz-Primo, Li, Tsai and Schneider (2010).
A comparative case study of teacher practice and student performance 13
Electronic Journal of Science Education ejse.southwestern.edu
Table 8: Frequencies of Evidence Attributes by Class in Percentages (1)
Joe Sonia
Type of evidence provided
Investigation data 75 100
Investigation and artificial data 0 0
Artificial data 0 0
Anecdotal data 0 0
Word "data" only mentioned (2) 25 0
No evidence 0 0
Nature of evidence provided
Data pattern only 38 38
Data pattern and examples 25 63
Data examples only 25 0
Sufficiency of evidence
Sufficient 63 100
Insufficient 38 0
(1) Codes adapted from Ruiz-Primo, Li, Tsai and Schneider. (2010).
(2) When students used the words "data" or "graph" or "table" or referred to data
without instead of presenting or describing data, this category was coded.
As already noted, only half of Joe’s students sampled included any reasoning in their
explanations, and only one of them had reasoning that was completely aligned with their
experimental claim and evidence. One student used elaborated language to link their claim and
evidence, two used simple language such as “I think this happened because…” and one used no
connecting language. In Sonia’s class, all but one student in the sample had complete alignment
of claim and evidence, and all but one used elaborated language to express the connection (Table
9).
Table 9: Frequencies of Reasoning Attributes by Class in Percentages (1)
Joe Sonia
Alignment of claim and evidence
Complete 13 88
Partial 38 13
No 0 0
Not applicable (2) 50 0
Type of link - connection of evidence to claim
Elaborated connection 13 88
Simple connection 25 13
No connection 13 0
(1) Codes adapted from Ruiz-Primo, Li, Tsai and Schneider (2010)
(2) No reasoning present
Joe’s students did use language in their explanations that seemed intended to persuade the
reader, using the criteria for persuasion noted by Kuhn and Reiser (2005). For example, they all
referred to their investigation, directly or vaguely, as the source of evidence for their claim. All
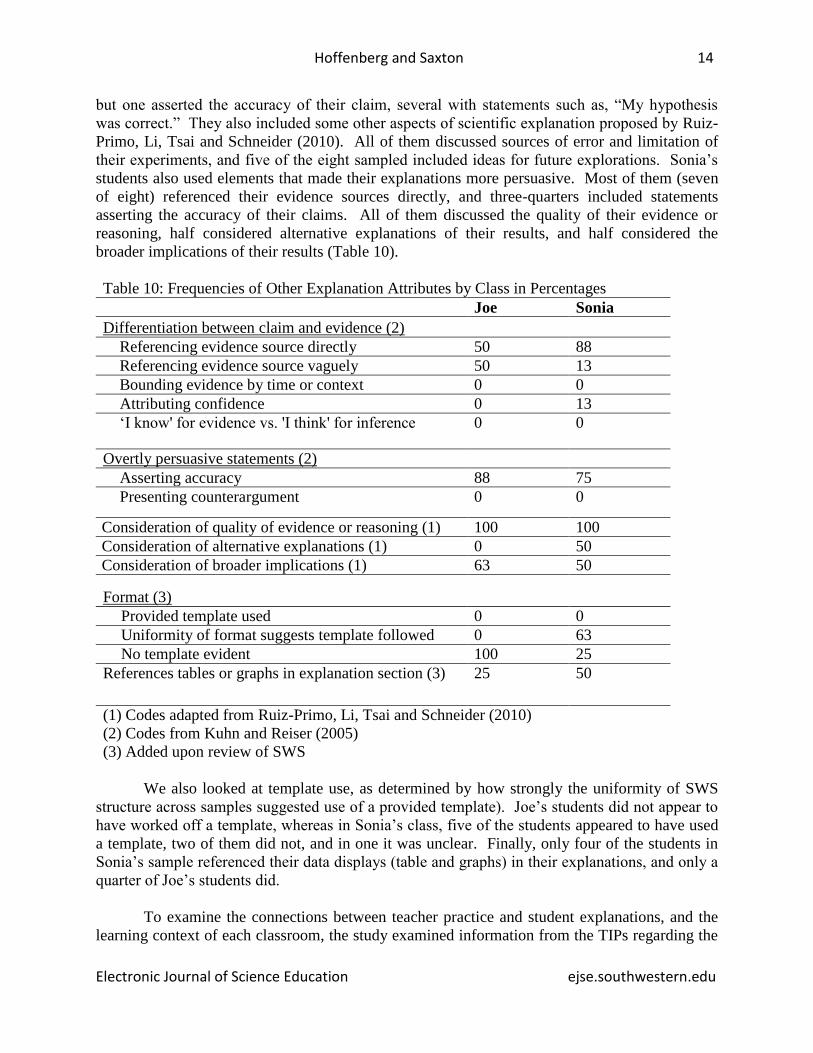
Hoffenberg and Saxton 14
Electronic Journal of Science Education ejse.southwestern.edu
but one asserted the accuracy of their claim, several with statements such as, “My hypothesis
was correct.” They also included some other aspects of scientific explanation proposed by Ruiz-
Primo, Li, Tsai and Schneider (2010). All of them discussed sources of error and limitation of
their experiments, and five of the eight sampled included ideas for future explorations. Sonia’s
students also used elements that made their explanations more persuasive. Most of them (seven
of eight) referenced their evidence sources directly, and three-quarters included statements
asserting the accuracy of their claims. All of them discussed the quality of their evidence or
reasoning, half considered alternative explanations of their results, and half considered the
broader implications of their results (Table 10).
Table 10: Frequencies of Other Explanation Attributes by Class in Percentages
Joe Sonia
Differentiation between claim and evidence (2)
Referencing evidence source directly 50 88
Referencing evidence source vaguely 50 13
Bounding evidence by time or context 0 0
Attributing confidence 0 13
‘I know' for evidence vs. 'I think' for inference 0 0
Overtly persuasive statements (2)
Asserting accuracy 88 75
Presenting counterargument 0 0
Consideration of quality of evidence or reasoning (1) 100 100
Consideration of alternative explanations (1) 0 50
Consideration of broader implications (1) 63 50
Format (3)
Provided template used 0 0
Uniformity of format suggests template followed 0 63
No template evident 100 25
References tables or graphs in explanation section (3) 25 50
(1) Codes adapted from Ruiz-Primo, Li, Tsai and Schneider (2010)
(2) Codes from Kuhn and Reiser (2005)
(3) Added upon review of SWS
We also looked at template use, as determined by how strongly the uniformity of SWS
structure across samples suggested use of a provided template). Joe’s students did not appear to
have worked off a template, whereas in Sonia’s class, five of the students appeared to have used
a template, two of them did not, and in one it was unclear. Finally, only four of the students in
Sonia’s sample referenced their data displays (table and graphs) in their explanations, and only a
quarter of Joe’s students did.
To examine the connections between teacher practice and student explanations, and the
learning context of each classroom, the study examined information from the TIPs regarding the

A comparative case study of teacher practice and student performance 15
Electronic Journal of Science Education ejse.southwestern.edu
sequencing, themes and topics of instruction and how the SI SWS fit into the unit flow. The
study also examined instructions and rubrics provided for other class activities to assess students’
prior experience with aspects of explanation construction within the unit. To those ends, detailed
case descriptions of each classroom were developed.
Case Description – Sonia’s Class
Sonia’s class was 12th
-grade IB biology. Information about class and teacher
demographics is found in Tables 1 and 2. The content topic for the unit was anatomy and
physiology, including digestive, circulatory and respiratory systems. Out of the 27 days of the
unit, 11 were spent partly or entirely on lab activities (including 6 days on the SI project where
the SWSs were generated), and 13 were spent partly or entirely on lecture, note taking, watching
videos and answering questions in worksheet packets. The students also spent two days on a
poster project, one on test review, and two on testing. The SI activity leading to the science
work sample took place in the middle of the unit. Before the mid-unit SI, the students
experienced lectures, videos and worksheet packets on digestion, nutrition and digestive health,
circulation and blood, blood clotting, and a lecture on the cardiovascular system. Lab activities
preceding the mid-unit SI were the “Taste Lab” and a calorimetry lab. After the mid-unit SI, the
students had lectures, video and/or worksheet packets on other organ systems. They also did a
lab activity on lung volumes and a poster project involving one of the post-SI content topics.
The last day of the unit was devoted to peer editing of work samples. The SWS, which was the
write-up for the mid-unit SI project, was not due until after the end of unit.
The “Taste Lab” investigated the differences in taste sensitivity among a sample of the
student population. This lab had specific questions for students to answer, primarily about data
interpretation. However, some of the questions did prompt students for answers that would
allow students to practice the claim and reasoning aspects of scientific explanation, but did not
ask students to include evidence in the answer. In the calorimetry lab, the students followed
prescribed procedures, filled out a provided data table, and had no opportunities to practice
explanation.
After their mid-unit SI activity, they completed a “lung lab” in which the procedures
were prescribed. This activity included several questions that required students to apply their
learning in various hypothetical situations, but did little to engage students’ explanation skills.
In addition to the lab activities, the TIP indicated that the students watched PowerPoint
presentations, videos and completed worksheet packets on topics including gas exchange, the
heart and circulation, blood, the kidneys and digestion. These slide sets were content-focused,
with no obvious breaks for discussion or application worked in, aside from some diagrams which
may have presented opportunities for discussion and interpretation. There were six days with
videos shown during the unit. In total, there were 10 days of students participating in relatively
passive note taking, video watching, and worksheets with no other activities noted on the
calendar. One homework packet the students completed had content to read with mostly
content-recall questions to answer, though each topic had one or two content-application
questions included. Another packet was very dense with questions and exercises, primarily
content recall or look-up, and required no application of content, or of higher-order thinking.

Hoffenberg and Saxton 16
Electronic Journal of Science Education ejse.southwestern.edu
For the summative SI work sample, the teacher wrote instructions that the topic was “To
design and implement a lab looking at the relationship between changes in heart rate relative to
changes in body position.” However, based on the SWSs reviewed for this study, the students
had wide latitude to choose a topic of interest related to changes in heart rate or blood pressure.
The topics of the SWSs evaluated included the effects of various historical factors (e.g. type or
degree of athletic participation, years of experience in a particular sport), physiological factors
(age, gender) or stimuli (e.g. cold press, jumping rope) on physiological measurements such as
heart rate and blood pressure. Some examples of topics in the study sample were the differences
in heart rate changes after physical activity in athletes vs. non-athletes, and the relationship of
swimming experience on swimmers’ heart rates after a measured sprint. The lab instruction
sheet had a rubric, which included in the Conclusion and Evaluation criterion the required
aspect: “States a conclusion, with justification, based on a reasonable interpretation.” While
students would presumably need some guidance in interpreting this aspect, it is roughly
equivalent to the claims-evidence-reasoning explanation structure discussed above.
In her pedagogical reflection, Sonia estimated that the class spent 22% of the time
watching PowerPoint presentations, 26% on pair work for labs and poster projects, 23% on
videos and class discussion, 25% of inquiry activities, and 4% on cooperative learning for test
review. She explained that the International Baccalaureate (IB) Biology curriculum is provided
by the IB organization, and that a large amount of direct instruction is required to cover all the
content. She also noted the value of pair work and cooperative learning to give students
opportunities to discuss content and support each other, and stated that class discussions and
videos “[provided] a forum for students to ask clarifying questions.”
Sonia’s TIP analysis. Sonia’s instruction was aligned with the general teacher
instructional practices framework in two of the three categories that were considered. In the
Content and Cognitive Skills category, two of the lab activities in her unit, the taste threshold
investigation and the lung lab, gave students opportunities to practice content and
cognitive/inquiry skills together. The variety of activities and instruction delivery modes,
including lecture, pair and group work, videos, class discussions and open-ended inquiry, when
taken together, presented multiple opportunities for students to learn and apply content and
practice higher-order cognitive skills throughout the unit.
In the Assessment for Learning category, the unit included multiple types of assessments.
Sonia regarded the worksheet packets, class discussions, a pop quiz, video analysis, the poster
project and the labs as formative assessments. The TIP did not include materials demonstrating
how the video analysis and class discussions were conducted, nor were there any details about
the poster project. The assessments were aligned with the learning targets, though the content
knowledge was assessed more frequently and thoroughly than the cognitive skills. The lab
activities offered opportunities for formative assessment of higher-order cognitive skills such as
data interpretation, inference and error analysis, but did not provide data on students’ abilities in
scientific explanation. The poster presentation may have allowed the teacher to assess students’
abilities in communication about science with peers. The bulk of the formative assessment,
however, was of content knowledge. The pop quiz was content focused, and most of the
questions in the homework packets and quizzes were low order content drilling, though there
were some occasional questions targeting application of content.

A comparative case study of teacher practice and student performance 17
Electronic Journal of Science Education ejse.southwestern.edu
There were multiple forms of self- and peer assessments worked into the unit. The
students were given rubrics for their lab activities and learning targets in some of the lecture slide
sets. The unit calendar had peer editing of student work samples the day before the work
samples were due. Throughout the many PowerPoint lectures, the relevant learning target was
printed on nearly every slide. The summative assessments for the unit were two written content
tests and the SI SWSs.
The area of the TIP analysis in which this unit was least aligned with best practices as
defined in the TIP framework was Classroom Roles. For about half of the instructional time, the
students relied on external sources, such as their teacher, textbook, informational packets and
videos, for content knowledge more than their own reasoning. With the exception of the
summative SI activity, the lab activities were scripted, with prescribed procedures and formatting
dictated by the handouts.
As already discussed, the TIP analysis was formulated to look at instruction across a
variety of content and cognitive skills, and was not focused solely on the skill of scientific
explanation. For the purposes of this study, another analysis of the TIPs looked more narrowly
at instruction relating to explanation. There was no evidence in Sonia’s TIP that she explicitly
covered explanation at all in her instruction (Table 4), but she did note that the IB Biology
students had had a great deal of practice with science inquiry in the past, and this SI was their
third of the program. As noted in the case description, the students had inconsistent
opportunities to practice explanation skills, including claim, evidence and reasoning, in this unit.
There were prompts in some of the activities that seemed designed to elicit parts of explanation,
such as asking students to speculate as to why their results turned out the way they did, but these
were mostly problematic in that they did not ask for evidence, asked questions that students
could not answer using the data they had collected in their labs, or did not tie the explanation
piece to the research question.
Sonia’s SWS Analysis. The SI topic in Sonia’s class was the most open-ended in the
study. Students were given a broad area of inquiry: physiological changes that can be easily
measured in the classroom (such as heart rate and blood pressure) under various conditions.
When evaluated using the quantitative explanation rubric (Appendix A), Sonia’s class scored
well overall, with a ‘3’ in Claim, a ‘4’ in Evidence and a ‘3’ in Reasoning (Table 5). An
example typical of Sonia’s class is a work sample addressing the research question: “Is the
change in heart rate in athletes and non-athletes caused by physical activity statistically
significant?” The conclusion section included the following passage:
When looking at the data, it can be concluded the difference between the changes in heart
rates of the athletes compared to the non-athletes was not statistically significant. This
statistical insignificance can be attributed to the varying levels of effort exerted between
the athletes and the non-athletes. Over the period of 30 seconds when the subjects were
asked to jump rope the athletes tended not only to exert more energy as shown by faster
jumping and less stumbling and more general agility. While watching the non-athlete test
subjects jumping rope it was acknowledged there was slower jumping even when
prompted to go faster and less agility as demonstrated by more tripping, stumbling and
starting over. … In table 2, it can be seen that with an average of an increase of 60.9
Hoffenberg and Saxton 18
Electronic Journal of Science Education ejse.southwestern.edu
beats per minute athletes had a greater increase in heart rate than the non-athletes who on
average raised their heart beats by 58.5 beats per minute. These results yielded a p value
of .6924, which means that the null hypothesis is accepted, and the slight difference in
change in heart rate can be attributed to coincidence caused by random sampling, this
would mean that the difference between the changes in hear rates before and after
physical activity do not demonstrate a big enough difference to be significant to society.
(from student work sample – Sonia’s class)
In this explanation, the claim directly addressed the research question, but the reader had
to wait until the end of the paragraph to discover the p-value, the focus of the research question.
The evidence presented was strong; the student included both observations and quantitative data.
The average values for the two groups were presented and there was a convincing discussion of
the meaning of the p-value. The student offered some plausible reasons why no difference was
found between the two groups, but the explanation lacked grounding in physiological reasoning
as to why a difference might have been expected. A reference to some academic literature or a
textbook source to present what others have found and why this experiment had different results
would have made it a richer explanation and may not have led the student to conclude that fitness
does not make a difference in heart rate recovery in general.
Evaluation using the qualitative codes for Sonia’s class showed that only one of the
explanations sampled did not address all the elements of the research question (Table 6). All of
the students used investigation data as the main source of evidence to support their claims (Table
7). They all described data patterns in their explanations, and five of the eight also had examples
of actual data points to support their claim of a pattern, so all were judged to have provided
sufficient evidence to support their claims (see Appendix A for characterizations of sufficient vs.
insufficient data) (Table 7).
In Sonia’s class, all but one student in the sample had complete alignment of claim and
evidence, and all but one used elaborated language to express the connection (Table 8). Sonia’s
students also used elements that made their explanations more persuasive. Most students (seven
of eight) referenced their evidence sources directly, and three-quarters included statements
asserting the accuracy of their claims. All students discussed the quality of their evidence or
reasoning, half considered alternative explanations of their results, and half considered the
broader implications of their results (Table 9).
Evidence of work sample template use by Sonia was also examined, as determined by
how uniformly students structured their SWS which suggested the use of a provided template,
and whether students referenced their data displays (tables, chart, graphs) in their explanations.
In Sonia’s class, five of the students appeared to have used a template, two of them did not, and
for one student, it was unclear. Only four of the students in Sonia’s sample referenced their data
displays (table and graphs) in their explanations (Table 9).
Because strong explanations use scientific knowledge to connect claims and evidence,
and these SI topics were closely connected to the content in the units, these students had the tools
to reason their way from claims to evidence using scientific knowledge. However, the overall
scores in Sonia’s class failed to reach the top score. It is notable that while students in this class

A comparative case study of teacher practice and student performance 19
Electronic Journal of Science Education ejse.southwestern.edu
had opportunities to practice cognitive skills such as inference and data analysis during the unit,
these did not include practice specifically in formulating scientific explanations. While students
were exposed to science content in multimedia formats in the two weeks before their SI activity,
only two of those days involved content directly related to the SI topic, and the students did not
have practice in using science content (e.g. the detailed physiology they were learning in class)
to explain experimental results, the essence of the reasoning aspect of scientific explanation.
This sometimes resulted, as seen in the SWS excerpt above, in explanations that gave plausible
reasons for the patterns seen in the data in the experimental context but did not include
physiological descriptions that would have explained the findings in the context of a scientific
theory or model.
Case Description - Joe’s Class
Joe’s class was a 10th
-grade chemistry class. Information about class and teacher
demographics are found in Tables 1 and 2. The content topic for the fourteen-day unit was
chemical reactions, including stoichiometry, limiting reagents and factors affecting reaction
rates. Nine of the unit days (not including the three SI data collection days) included some
instruction and practice in higher-order skills, including designing an inquiry, hypothesizing,
predicting, explaining observed phenomena, and writing knowledge claims in their lab write-ups
and SWSs. Eight days included content instruction and activities; there were only two days
during the unit in which content instruction and practice were the sole focuses.
The unit began with a lab in which the students determined the mass percentages of
cream filling in sandwich cookies. The instruction surrounding the lab was focused on teaching
students skills useful in science inquiry, including hypothesizing, designing and conducting an
experiment, writing scientific procedures, and producing knowledge claims. Joe modeled these
skills using “good” and “bad” examples. He placed the most emphasis on knowledge claims.
The teacher defined a knowledge claim as “a generalizable assertion explaining a scientific
phenomenon that is based upon supporting experimental evidence.” The example of a good
knowledge claim included an assertion with experimental evidence to support it. There was no
clear differentiation between claim and evidence in this model, and no reasoning. The class
spent time over the next two days peer-editing their knowledge claims from the cookie lab, and
discussing the contents of their ‘Results’ and ‘Conclusion’ sections, which included the
knowledge claims.
In the lab exercise about limiting reagents, the students received a handout with the
procedures and data table prepared by the teacher and list of questions at the end that did not
require any scientific explanation. However, included with the lab materials was a “Lab Report
Checklist” which detailed the contents and expected writing style of each section of the lab
report, including modeling of good and bad examples of titles, data tables and graphs. This
checklist again included a knowledge claim, defined as above, for the Results and Conclusion
section. Interestingly, in the lab introduction, Joe required the students to include “background,
theory, concept and/or principles of the experiment,” and to “present preliminary reasoning or
justification for hypothesis.” These statements prompt students for scientific reasoning, much
like what was assessed in the Reasoning section of the explanation rubric. However, there is no
such prompting for reasoning in the Results and Conclusion section proximate to the knowledge
claims and incorporated into an explanation of the results of the experiment. The lab report

Hoffenberg and Saxton 20
Electronic Journal of Science Education ejse.southwestern.edu
checklist also instructed students to “Discuss any limits of experiment or knowledge claim,
sources of error or problems with procedure, [and] suggestions for future refinement of
procedure or future research.” Students conducted peer assessments of the conclusion sections
from the limiting reagent lab.
In the three class periods leading up to the SI activity on reaction rates, the students spent
70 minutes on demonstrations using kinetic molecular theory (KMT). These demonstrations
involved students working in pairs to observe a phenomenon and explain their observations. In
his pedagogical reflection, Joe identified this activity as the most effective in the unit for
enhancing content understanding. He described it thus:
Demonstrations of phenomena followed by allowing students social time to discuss
scientific explanations in partner pairs seemed to provide the largest learning gains. This
format forced students to witness a phenomena that challenged their current
understanding of the world, develop an explanation for that phenomena, obtain further
observations or ask for missing knowledge, then refine their initial explanations. All
done with first-hand guidance and feedback from their instructor. This created a rich
learning environment for most students. (From TIP, Joe’s class)
The students also practiced the skill of forming testable hypotheses on three of the days
before their SI data collection began, and discussed the works sample writing procedures. The
day before they began their SI activity, they spent 20 minutes of lecture on KMT, five minutes
on KMT animations, and 10 minutes brainstorming factors affecting reaction rate.
The SWSs investigated the effects of various conditions on the reaction rate of Alka-
Seltzer with water. The SWSs in this study all varied the temperature of the water, the degree of
agitation and/or the surface area of the Alka-Seltzer (by crushing it, grinding it or leaving it as a
whole tablet). After the three days of data collection, the students saw a 30-minute video on
KMT, received the SWS scoring rubrics, practice scoring example papers and participated in
peer review and SWS revisions. Unfortunately, the rubric given to the students to assess their
SWSs was not included in the TIP, so it could not be determined what emphasis, if any, the
Oregon Department of Education (ODE) rubric for SI work samples had on scientific
explanations.
The teacher estimated that he spent 10% of the class time on lecture, 30% on group
discussions, 20% on group work, 10% on group data collection, 20% on demonstrations, 5% on
peer-peer reviews and 5% on videos.
Joe’s TIP analysis
Joe’s instruction was aligned with general effective practices framework for teaching
science with inquiry in all the areas considered. In the Classroom Roles category, Joe
emphasized group and pair work, discussions, cooperative data collection and peer review,
suggesting that students were encouraged to rely on their own and their peers’ reasoning for
content learning. The class spent a small percentage of the class time listening to lectures about
content and watching videos.

A comparative case study of teacher practice and student performance 21
Electronic Journal of Science Education ejse.southwestern.edu
In the Content and Cognitive Skills category, the students had many opportunities
throughout the unit to practice both, though there were some missed opportunities to combine
these in the same activity, as required in scientific explanation. The cookie lab was designed to
have students practice some aspects of explanation; however, the lab activity was not aligned
with any of the content goals of the unit. The limiting reagent lab was closely aligned with
content goals and targeted skills in scientific reasoning (as part of the introduction), data analysis
and presentation, and knowledge claims. The demonstrations related to KMT were structured in
an observe-explain format, which may have been an effective platform for practicing those
higher-order skills while developing an understanding of KMT. Overall, this study found that
this unit struck a good balance between content and cognitive skills.
In the Assessment for Learning category, Joe used several techniques he regarded as
formative assessments, such as practice problems from the textbook, informal lab write-ups,
collective class problem solving with teacher observation, a formative stoichiometry test, calling
on students and class polling. There were ample opportunities for students to engage in peer
review and self-assessment. Joe wrote that class polling was a chance for students to assess their
“knowledge/comfort level with various topics.” For the labs and SI, Joe provided his students
with a lab report checklist to help them structure their work samples and include all the necessary
parts. Overall, these assessment practices were frequent, varied, and gave students many
chances to assess themselves and each other and demonstrate their learning.
Specific to scientific explanation, Joe’s TIP had evidence that he provided students with
definitions and some modeling of claim and evidence. There was no evidence that he stated an
explicit rationale for scientific explanation, nor that he connected it to everyday examples (Table
4).
Joe’s pedagogical reflection revealed that he intentionally included scientific explanation
as one of the goals of instruction, specifically in the pair observations/explanations of the KMT
demonstrations. However, his instruction and checklists in the context of his labs and SI work
samples have students writing “knowledge claims” in their Results and Conclusion sections,
which Joe defines as including a claim and evidence to support it, but no scientific reasoning.
Thus, it is likely that Joe’s own understanding of how a scientific explanation should be
structured, what elements it should include, its importance as a central goal of an SI activity,
and/or its relationship to the other elements in the summary section of a SWS are not aligned
with the structure and content of this study’s explanation rubric nor, by extension, with the
scientific explanation literature or the NGSS.
As McNeill and Krajcik (2007) pointed out, content knowledge related to the
phenomenon under investigation is important in helping students produce strong explanations.
The unit plan for Joe’s class showed that the class spent approximately 70 minutes of class time
working in pairs on observing and explaining demonstrated phenomena related to kinetic
molecular theory (KMT), the accepted theory to explain the phenomena observed in the SI
activity. The instruction included 25 minutes of lecture and animation on KMT theory. Thus,
the majority of content instruction specific to the SI topic was student-centered with “firsthand
guidance and feedback from their instructor,” as noted in the TIP.

Hoffenberg and Saxton 22
Electronic Journal of Science Education ejse.southwestern.edu
Joe’s SWS Analysis. Table 5 shows the quantitative SWS results for this unit. Joe’s
students scored ‘3’ overall on Claim, ‘2’ in Evidence and ‘1’ in Reasoning. Four out of the eight
SWS explanations in this unit contained no reasoning, and two only earned a 1 in Reasoning.
Examples that exhibit a range of claim and evidence quality, but a consistent lack of reasoning,
follow:
From the data collected, it can be concluded that the hypothesis was correct. Heat speeds
up the reaction time of a chemical reaction. At 70 Degrees Celsius, the highest
temperature used in this experiment, the average rate of reaction was 17.64 seconds. At
55 Degrees Celsius, the average rate of reaction was 20.59 seconds. At 40 Degrees
Celsius, the average rate of reaction was 25.05 seconds. And at Room Temperature, the
average rate of reaction was 116.80 seconds. Because of this data, it can be concluded
that heat increases the rate of a reaction. (From SWS, Joe’s class)
By looking at the average speed of the reaction it can be concluded that the temperature of
a reaction is a cofactor and greatly influences a reaction both positively and negatively.
With these findings, it can be inferred that the time necessary to complete the reaction will
increase given that the temperature decreases. (From SWS, Joe’s class)
Based on the data that was collected, the faster the agitation, the faster the reaction time
was. The data also supported the hypothesis. (From SWS, Joe’s class)
In the first example, the student made an explicit claim (though it did not specify the
reaction studied) and gave adequate evidence in the form of examples with a pattern implied, but
attempted no reasoning. This is a good example of a “knowledge claim” as defined and modeled
by the teacher, in that it includes “a generalizable assertion explaining a scientific phenomenon
that is based upon supporting experimental evidence.” However, the explanation is lacking in
any scientific reasoning positing why this might be so or relating it to KMT. The other two
examples referred to data collected in the experiment but did not bring any of it into the
explanations, and also contained no reasoning. Despite the repeated practice with knowledge
claims and the reminder in the lab checklist, these students were able to make claims but faltered
on the evidence requirement.
The qualitative results help clarify what aspects of each part of explanation students had
difficulty with. While Joe’s class produced adequate claims overall (Table 5), three of the eight
explanations sampled had claims that did not address all aspects of the research question (Table
6). For example, a claim that stated that the reaction rate of Alka-seltzer and water was faster in
warmer water, but did not explicitly state how the reaction rate changed over the range of
temperatures tested, would be rated as not having addressed all the elements of the research
question.
Six of the eight students included investigation data in their explanations, but only five of
the eight provided sufficient data. Two of the eight from Joe’s class only referred to data in their
explanations, with statements such as “The data showed…” (Table 7). While these types of
statements show that the students did reference experimental data to draw their conclusions, the

A comparative case study of teacher practice and student performance 23
Electronic Journal of Science Education ejse.southwestern.edu
absence of any actual data or data patterns in the explanation reveal that these students did not
grasp the primacy of data in validating a claim in a scientific explanation.
As already noted, only half of Joe’s students sampled included any reasoning in their
explanations, and only one of them had reasoning that was completely aligned with their
experimental claim and evidence. One student used elaborated language to link their claim and
evidence, two used simple language such as “I think this happened because…” and one used no
connecting language (Table 8).
Joe’s students did use language in their explanations that seemed intended to persuade the
reader, using the criteria for persuasion noted by Kuhn and Reiser (2005). For example, they all
referred to their investigation, directly or vaguely, as the source of evidence for their claim. All
but one asserted the accuracy of their claim, several with statements such as, “My hypothesis
was correct.” They also included some other aspects of scientific explanation proposed by Ruiz-
Primo, Li, Tsai and Schneider (2010). All of them discussed sources of error and limitation of
their experiments, and five of the eight sampled included ideas for future explorations. Joe’s
students did not appear to have worked off a template. Only a quarter of them referenced their
data displays in their explanations (Table 9).
Summary
In the TIP analyses, the study found that while their content areas and pedagogical styles
differed, both Sonia and Joe provided instruction in their units that was mostly aligned with the
general effective practices framework for teaching science with inquiry. The resulting
explanations in their students’ summative SI work samples, however, were very different.
Sonia’s students produced mostly high quality explanations, while Joe’s students, on average,
did not demonstrate proficiency with explanation construction.
Approximately half of Sonia’s instructional time relied on lecture, video and worksheets
for content delivery, while Joe emphasized pair and group work. Both teachers provided many
opportunities for practicing higher order cognitive skills and content during the unit, and both
employed varied and appropriate assessment practices. Sonia’s TIP did not mention practice
related to explanation in her unit, but she noted that the students had multiple experiences with
SI in the IB program, and the IB SWS rubric provided in the TIP is aligned with this study’s
definition of “scientific explanation.” Joe specifically targeted what he regarded as explanation.
However, the TIP analysis revealed that his conception of scientific explanation was limited to
“knowledge claims” involving claim and evidence, leaving out reasoning. He used the term
“scientific explanation” specifically in his reflection on the observe-explain KMT demonstration
activity, but did not include a description of what he regarded as adequate explanations in this
context.
Sonia’s students’ explanations scores were adequate, on average, in all three aspects of
explanation, while Joe’s students did well on claim but struggled in evidence and fell well below
proficiency in reasoning, with half his students sampled for this study including no scientific
reasoning at all in their explanation sections.
Hoffenberg and Saxton 24
Electronic Journal of Science Education ejse.southwestern.edu
Discussion
There are initially four demographic or contextual differences that could account for the
findings: age (Sonia’s seniors vs. Joe’s sophomores), class size, IB vs. non-IB, and teacher
experience, but all four were ruled out with other cases in the larger study (Hoffenberg, 2013).
Some likely explanations for the differences in explanation performance between these two
classes were depth of content coverage, pedagogical style, students’ previous experience with
writing scientific explanations in an SI context, the nature of the SI task, and the teacher’s beliefs
about the definition of explanation and its role in the SWS.
Content Coverage. Sonia’s unit covered content related to the digestive, cardiovascular
and respiratory systems in depth. Sonia’s students had multiple and diverse opportunities to
engage with the science content through homework packets, lectures, class discussions, videos,
labs and the poster project. However, their inability to reach the top score on the explanation
rubric may have been related to the limited exposure to science content directly applicable to
their SI topic. While the homework packets did contain some exercises that involved application
of science content for each topic, the PowerPoint presentations and the bulk of the worksheet
packets involved intensive content presentation and review. As McNeill and Krajcik (2007)
found, students with stronger content understanding constructed stronger explanations. This
suggests that strong content knowledge is important to appropriately take part in scientific
inquiry practices such as accurately constructing scientific explanations. Students may be unable
to apply their understanding of a scientific inquiry practice to a context without an understanding
of the particular science content.
Joe’s class spent three periods leading up to their SI on KMT, the currently-accepted
theory for explaining the differences in chemical reaction rate for the variables the students were
exploring. While this is more time than Sonia’s class spent on content focused on their SI topic,
the majority of this content time in Joe’s class was spent with the observe-explain activity related
to the demonstrations described above – 70 minutes on observe-explain, with only 20 minutes on
lecture and 10 minutes on class brainstorming. Joe thought the observe-explain activity
produced the highest learning gains and gave students rich practice with explanation. According
to the unit calendar, the students did not have any instruction in KMT before undertaking these
observations, so it is unclear whether students had any content knowledge with which to explain
their observations; however, the pedagogical reflection noted “first-hand guidance” from the
teacher, suggesting that the Joe may have provided direct instruction to support content
acquisition during the phenomenological observations to support students’ explanations. Though
this activity may have supported students’ abilities in writing scientific claims in their SWSs,
more was needed to support complete explanations. There was no information from the TIP as
to what Joe expected from the explanations of the KMT demonstrations, and it does not appear
that he used the word “explanation” when laying out the instructions for lab write-ups or SWSs.
According to Anderson (2002), students need several and various experiences with the
same content to gain understanding. Nuthall (2007) argues that students need at least three
experiences with the same content that are sequenced strategically for increasing complexity and
rigor. Feltovich, Spiro and Coulson (1993) designated a variety of experiences with content as a
“design principle for effective instruction” for supporting students’ application of conceptual

A comparative case study of teacher practice and student performance 25
Electronic Journal of Science Education ejse.southwestern.edu
knowledge, a crucial skill for the reasoning component of scientific explanation. By these
standards, the activities Joe used for teaching KMT were likely insufficient to prepare them to
write complete explanations for their SWSs. In contrast Sonia’s instruction around the content
specific to the SI task better aligns to the multiple opportunities advocated for in the literature.
Pedagogical Style. In a related matter, Sonia’s and Joe’s pedagogical styles may have
affected their students’ achievements in explanation. According to her pedagogical reflection,
Sonia spent about 50% of the class time on direct or teacher-centered instruction, including
lecture, video and class discussion, and about 50% on student-centered activities. The content
related to the SI topic was delivered via PowerPoint lectures and the homework packets
described above. There were lab activities prior to the mid-unit SI task that connected with the
unit content but not directly with SWS topic. This balance was associated with better
explanation results. In contrast, Joe’s approach was heavily weighted towards a particular
instructional format. His class spent 15% of their class time on direct or teacher-centered
instruction, and about 85% on pair and group learning. The larger multiple-case study found that
classes that had a nearly equal split between the two instructional approaches produced stronger
explanations, whereas classes that experienced 85-95% of their instruction in one instructional
mode had lower average explanation scores (Hoffenberg, 2013).
While group and pair work can be effective pedagogical tools, teachers need to ensure
that it is implemented in a strategic and balanced manner. Students need a firm grip on the
science content, and for some students, direct instruction may be called for to attain this. For
example, Fradd and Lee (1999) argue that explicit instruction in science inquiry classrooms
benefits students from diverse language backgrounds. Also, it could not be determined from
Joe’s TIP materials whether the students were paired strategically. As Webb (2009) wrote,
“most researchers agree that simply placing students in small groups does not guarantee that
learning will take place.”
This finding is consistent with Stephens, McRobbie and Lucas’ (1999) study that found
that students’ ability to engage in higher-level model-based reasoning to explain the results of SI
investigations required “considerably more guidance” than students in their study received,
despite students’ having received instruction in the relevant model prior to their investigations
and having carried out careful, successful investigations that helped them develop correct
empirical relationships regarding the phenomena of interest. The literature confirms that a
variety of pedagogical techniques, including teacher-centered or direct content instruction and
student-centered instruction, is most effective for supporting students in producing strong
explanations.
Previous experience. As noted above, research has shown that students need multiple
and diverse experiences with a skill or concept to attain proficiency with it (Anderson, 2002;
Nuthall, 2007; Feltovich, Spiro and Coulson, 1993). There is also some suggestion in the
literature that students need multiple opportunities to develop higher order skills, such as
scientific explanation (Aschbacher & Roth, 2002; McNeill & Kracjik, 2008). Given that the state
legislature in this study’s location mandates that all students complete at least one SI per school
year, it is a reasonable assumption that students in this study who are in their senior year have
had more opportunities to engage in SI. While it is beyond the scope of the current study to

Hoffenberg and Saxton 26
Electronic Journal of Science Education ejse.southwestern.edu
know anything about the nature or quality of the instruction around those previous SI activities, it
can nonetheless be concluded that students in Sonia’s class had more opportunities to engage in
some form of SI tasks. Therefore, Sonia’s students’ more extensive experience with SI could
further explain the differences in student scientific explanations skills.
Also, some of the activities in the unit included items requiring students to apply their
content knowledge to unfamiliar situations, analyze data and make inferences using patterns in
data (taste lab). Given that Nuthall (2007) established a minimum of three experiences as
sufficient for a particular skill or concept, Sonia’s students’ practice with higher-order thinking
skills related to explanation, along with their previous experiences with producing SI work
samples in the IB program, likely helped prepare them to produce adequate explanations.
Joe’s students had multiple experiences producing knowledge claims during his unit,
including the cookie lab and the limiting reagent lab. The SI was their third task involving
knowledge claims in the unit, and in fact the students did produce adequate claims overall. They
had less practice with evidence, and none with reasoning, and the explanation results showed that
they struggled in these areas. Multiple experiences with a skill over time do appear to support
students in writing adequate explanations.
Nature of SI Task. The SI activity for Sonia’s class allowed students to ask research
questions of their own choosing related to the cardiovascular system. Studies have found that
open-ended inquiries tend to engage students in higher-order thinking and produce better
explanations (Concannon & Brown, 2008; Katchevich, Hofstein & Mamlok-Naaman, 2013).
Also, the content covered in the unit prepared the students to ask relevant questions and explain
their findings using scientific theories and knowledge they possessed. Students need strong
content knowledge to participate fully in scientific explanation, which requires application of
science content to make sense of the results of an experiment (McNeill &Krajcik, 2007). Open-
ended inquiry tasks also offer a way to differentiate instruction for diverse learners. Rosebery,
Warren and Conant (1992) demonstrated that teaching science with open-ended inquiry activities
helps English language learners engage in science classes and reason more like scientists. It is
possible that the same techniques that help ELLs are also effective differentiation strategies for
other types of learners.
The science inquiry activity Joe’s students performed was fairly prescribed. Students did
have a choice about which property of their solution they wanted to vary, but the question, the
property’s effect on reaction rate, was chosen by the teacher. Their lack of multiple modes of
accessing the content prior to the SI may have left them unable to ask investigable questions
about reaction rate, even if they had wanted to. This may have contributed to their overall lack
of skill in explanation. While there are management and assessment challenges related to
allowing students more latitude in choosing what questions to investigate, the research literature
and this study suggest that open-ended investigations are associated with better performance in
the higher-order skill of scientific explanation.
Alignment of teacher conception of explanation with NGSS definition. The students’
skill in scientific explanation may also be linked to the teachers’ conception about what an
explanation should contain, explanation’s position or role in the SWS, and how those align with

A comparative case study of teacher practice and student performance 27
Electronic Journal of Science Education ejse.southwestern.edu
the NGSS. Sonia’s TIP did not reveal her thinking regarding explanation; in fact, the topic was
not specifically mentioned. However, the IB rubric for assessing students’ SI works samples,
provided in the TIP, included criteria similar to the complete conception of explanation used for
this study. The rubric was issued by the IB program, and the students had a copy of the IB rubric
as part of their “Lab Instructions.” Sonia’s students’ previous experience in IB gave them at
least two chances in the past to produce work samples consistent with this rubric.
In contrast, Joe’s TIP had several references to scientific explanation, and Joe explicitly
addressed explanation in this unit; however, his students did poorly overall on their explanations
and particularly on their reasoning. Part of the reason his instruction did not results in adequate
explanations may lie in his conception of scientific explanation. Joe’s conception of explanation
was likely guided by the Oregon science standards, which address explanation only in the
context of other inquiry skills and do not emphasize it as a separate practice. The definitions and
modeling that Joe provided around explanation did not differentiate between claim and evidence,
lumping them together as a “knowledge claim,” and did not include reasoning, the part of the
explanation in which students use scientific theories to make sense of their results. The ‘1’ in
reasoning from the explanation rubric is likely the result of Joe’s lack of emphasis on this
element of a scientific explanation in a SWS. This study was conducted before the release of the
Framework and the Next Generation Science Standards, so Joe was likely unaware that his
conception of scientific explanation was not aligned to science education research’s definition of
scientific explanation. In this light, it is not surprising that his students’ explanations scored low
in reasoning. Also, while Joe was the only teacher in the overall study that provided definitions
with modeling of claim and evidence in explanation, this did not result in adequate evidence
scores. McNeill and Krajcik (2008) also found that modeling components of scientific
explanation had no significant effect on student performance. These findings suggest that one
focus of professional development should be aligning teachers’ conception of explanation with
the NGSS definition.
Conclusion
The Next Generation Science Standards promote a conception of science education that is
not based merely on recall of content, but rather asks students to weave science content with “the
practices of science and engineering (NGSS Lead States, 2013, p. 1)This study investigated high
school students’ performance on one of these practices, scientific explanation, and the teaching
practices connected with student success in explanation.
Our comparison of two classes’ written explanations in their SI work samples and the
teaching practices evident in the instructional unit in which they were produced yielded five
themes. Student success in explanation was associated with (1) teaching that armed students
with strong content knowledge in the scientific theory or model that frames the inquiry (2)
through balanced pedagogical techniques that relied approximately equally on direct instruction
and student-centered instruction, (3) previous experience conducting science inquiry, (4) an
open-ended SI topic, and (5) expectations for explanation structure and content that are aligned
with relevant standards.
These findings are based on a limited comparative case study of two teachers’ practices
around scientific explanation and a sampling of their students’ performance. As such, these must

Hoffenberg and Saxton 28
Electronic Journal of Science Education ejse.southwestern.edu
be regarded as preliminary findings that suggest future directions for research, and require
further empirical tests to determine if they are more broadly generalizable. Another limitation of
this study includes the low inter-rater reliability for the quantitative analysis of students' written
claims. This was due to disagreement among members of the research team about which
statements in the SWS could be construed as a claim. More practice and discussion would
possibly have ameliorated this weakness, though practical constraints prevented this. Also, the
first author was the only coder for the explanation-specific attributes of teacher practice and also
of the student work samples chosen for analysis. Finally, one of the teachers in study, Joe, was
in his first year of teaching. While he may have struggled more with management and
organizational issues because of this, the larger case study did not find any relationship between
years of experience and the dimensions assessed in this study.
Implications for teaching and professional development
Teacher education and professional development will play a big role in whether our
nation’s students achieve the goals embraced by the Framework and the Next Generation
Science Standards. This study’s findings suggest that teachers’ understanding of the scientific
practice of explanation is linked to students’ successful demonstration of that practice.
Therefore, teachers need explicit professional development experiences that help them build a
deep understanding of what is meant by terms like “scientific explanation” and examples of what
proficient student explanations should look like in various contexts.
This study also suggests that purposeful unit planning to support inquiry also plays a role.
For a rich experience, students should have enough background in the content to generate
questions that are interesting to them and are amenable to investigation and student explanation
of results. The larger case study (Hoffenberg, 2013), and the two cases in this study illustrate,
that the content should be delivered in a balanced manner, with methods utilizing direct
instruction and student-centered learning sharing approximately equal class time. Teachers
should have professional development time to collaborate on unit planning that incorporates
these principles, as well as time for reflection and modification of unit content and activities to
improve their practice in these methods.
Also, for a SI work sample, the topic of the investigation should be fairly open ended. In
a professional development context, teachers should have access to resources and ideas for open-
ended inquiry activities that are age-appropriate, and have the opportunity to share ideas with
other teachers and researchers on how to implement activities that are less teacher-guided but
still maintain safety and an emphasis on learning goals. Because open-ended inquiry projects
will be more difficult to assess, teachers will need assessment strategies that place value on
scientific processes and content while allowing students to flounder and go off in tangential
directions as they pursue their own ideas. These inquiry activities also require more time
investment than a teacher-structured activity, so teachers will need support in how to structure
their activities to keep the class on track with content coverage.
Finally, students need multiple experiences over time to practice science inquiry and
explanation. It is the intent of the Framework and the NGSS that inquiry skills, including
scientific explanation, will be developed throughout the grades, so that by the time students reach
high school they will have had sufficient experiences to be successful (National Research

A comparative case study of teacher practice and student performance 29
Electronic Journal of Science Education ejse.southwestern.edu
Council, 2012). Thus, professional development should include not just collaboration with other
teachers at same grade level teaching in the same content strand, but also collaboration across
grade levels (elementary and secondary) and content strands to structure SI activities in a
progressive, age-appropriate way with increasing rigor as students move through the grades.
References
American Association for the Advancements of Science (AAAS). (1993). Benchmarks for
science literacy. Retrieved April 6, 2015, from
http://www.project2061.org/publications/bsl/online/index.php
Apedoe, X.S., Reynolds, B., Ellefson, M.R., & Schunn, C.D. (2008). Bringing Engineering
Design into High School Science Classrooms: The Heating/Cooling Unit. Journal of Science
Education and Technology, 17, 454-465.
Anderson, A. (2002). Reforming science teaching: What research says about inquiry. Journal of
Science Teacher Education, 13(1), 1-12.
Aschbacher, P. R., & Roth, E. J. (2002). What’s Happening in the Elementary Inquiry Science
Classroom and Why? Examining Patterns of Practice and District Factors Affecting Science
Reforms. In paper presented as part of a symposium, Policy Levers for Urban Systemic
Mathematics and Science Reform: Impact Studies from Four Sites, at the annual meeting of
the American Educational Research Association, New Orleans.
Bell, B. & Cowie, B. (2001). The characteristics of formative assessment in science education.
Science Education, 85, 536-553.
Black, P. & Wiliam, D. (1998). Assessment and Classroom Learning. Assessment in Education:
Principles, Policy & Practice, 5(1), 7-75.
Black, P. & Wiliam, D. (2009). Developing the theory of formative assessment. Educational
Assessment and Evaluation, 21, 5-31.
Concannon, J., & Brown, P. L. (2008). Transforming osmosis: Labs to address standards for
inquiry. Science Activities , 45 (3), 23.
Feltovich, P., Spiro, R.J., & Coulson, R.L. (1993). Learning, teaching and testing for complex
conceptual understanding. In N. Fredricksen & I. Behar (Eds.), Test theory for a new
generation of tests (pp. 181-217). Hillsdale, NJ: Lawrence Earlbaum Assoc.
Fortus, D., Dershimer, R.C., Krajcik, J., Marx, R.W., & Mamlok-Naaman, R. (2004). Design-
Base Science and Student Learning. Journal of Research in Science Teaching, 41(10), 1081-
1110.
Fradd, S., & Lee, O. (1999). Teachers’ roles in promoting science inquiry with students from
diverse language backgrounds. Educational Researcher , 18, 14–20.
Gallagher, J.J. (2000). Teaching for Understanding and Application of Science Knowledge.
School Science and Mathematics, 100(6), 310-18.
Hoffenberg, R. (2013). An Investigation into Teacher Support of Science Explanation in High
School Science Inquiry Units. (Paper 1103). Dissertations and Theses. Retrieved from
http://pdxscholar.library.pdx.edu/open_access_etds/1103.
Katchevich, D., Hofstein, A., & Mamlok-Naaman, R. (2013). Argumentation in the Chemistry
Laboratory: Inquiry and Confirmatory Experiments. Research in Science Education , 43, 317-
345.
Hoffenberg and Saxton 30
Electronic Journal of Science Education ejse.southwestern.edu
Kuhn, L., & Reiser, B. (2005). Students constructing and defending evidence-based scientific
explanations. National Associations for Research in Science Teaching. Dallas, TX.
Landers, R. N. (2011, November 16). Computing intraclass correlations (ICC) as estimates of
interrater reliability in SPSS . Retrieved from NeoAcademic: Technology, education and
training research from an industrial/organizational (I/O) psychologist in the ivory tower:
http://neoacademic.com/2011/11/16/computing-intraclass-correlations-icc-as-estimates-of-
interrater-reliability-in-spss/
Marshall, J. C. (2009). The creation, validation, and reliability associated with the EQUIP
(Electronic Quality of Inquiry Protocol): A measure of inquiry-based instruction. In National
Association of Researchers of Science Teaching (NARST) Conference. Orange County, CA.
Mehalik, M.M., Doppelt, Y., Schuun, C.D. (2008). Middle-School Science Through Design-
Based Learning versus Scripted Inquiry: Better Overall Science Concept Learning
and Equity Gap Reduction. Journal of Engineering Education, 97(1), 71-85.
Miner, D.D., Levy, A.J., & Century, J. (2010). Inquiry-based science instruction – what is it and
does it matter? Results from a research synthesis years 1984 to 2002. Journal of Research in
Science Teaching, 47(4), 474-496.
McNeill, K., & Krajcik, J. (2007). Middle school students' use of appropriate and inappropriate
evidence in writing scientific explanations. In M. Lovett, & P. Shah (Eds.), Thinking with data
(pp. 233-265). New York, NY: Taylor & Francis Group, LLC.
McNeill, K., & Krajcik, J. (2008). Scientific explanations: Characterizing and evaluating the
effects of teachers' instructional practices on student learning. Journal of Research in Science
Teaching , 45 (1), 53-78.
National Research Council. (2012). A framework for K-12 science education: Practices,
crosscutting concepts and core ideas. Washington, D.C.: The National Academies Press.
National Research Council. (1996). National science education standards. Retrieved April 6,
2015, from http://www.nap.edu/openbook.php?record_id=4962
NGSS Lead States. (2013). Appendix F - Science and engineering practices in the NGSS.
Retrieved from Next Generation Science Standards:
http://www.nextgenscience.org/sites/ngss/files/Appendix%20F_Science%20%20Engineering
%20Practice%20-%20FINAL.pdf
Nuthall, G. (2007). The hidden lives of learners. Wellington, New Zealand: NZCER Press.
Onwuegbuzie, A. J., & Leech, N. L. (2007). Sampling designs in qualitative tesearch: Making
the sampling process more public. The Qualitative Report , 12 (2), 238-254.
Oregon Department of Education. (2009a). Oregon Science K-HS Content Standards. Retrieved
from http://www.ode.state.or.us/teachlearn/subjects/science/curriculum/2009-adopted-k-h-
science-standards-final.pdf
Oregon Department of Education. (2009b). Standards by design: High school for science.
Retrieved from http://www.ode.state.or.us/teachlearn/real/standards/sbd.aspx
Porter-Magee, K., Wright, B., & Horn, L. (Eds.). (2013, 08 20). Exemplary Science Standards:
How Does Your State Compare? Retrieved 06 06, 2014, from http://edex.s3-us-west-
2.amazonaws.com/publication/pdfs/20130820-NGSS-Exemplary-Science-Standards-How-
Does-Your-State-Compare-FINAL.pdf
Prain, V. & Waldrip, B. (2006). An Exploratory Study of Teachers’ and Students’ Use of Multi-
modal Representations of Concepts in Primary Science. International Journal of Science
Education, 28(15), 1843-1866.

A comparative case study of teacher practice and student performance 31
Electronic Journal of Science Education ejse.southwestern.edu
Rosebery, A., Warren, B., & Conant, F. (1992). Appropriating scientific discourse: Findings
from language minority classrooms. The Journal of the Learning Sciences , 2, 61–94.
Ruiz-Primo, M., Li, M., Tsai, S., & Schneider, J. (2010). Testing one premise of scientific
inquiry in science classrooms: Examining students' scientific explanations and student
learning. Journal of Research in Science Teaching , 47 (5), 583.
Sandoval, W. (2003). Conceptual and Epistemic Aspects of Students' Scientific Explanations.
The Journal of the Learning Sciences , 12 (1), 5-51.
Sandoval, W., & Reiser, B. (2004). Explanation-driven inquiry: Integrating conceptual and
epistemic scaffolds for scientific inquiry. Science Education , 88, 345-372.
Saxton, E., Burns, R., Holveck, S., Kelley, S., Prince, D., Rigelman, N., & Skinner, E. (2014). A
Common Measurement System for K-12 STEM Education: adopting an educational
evaluation methodology that elevates theoretical foundations and systems thinking. Studies in
Educational Evaluation, 40, 18-35.
Saxton, E., & Rigelman, N. (Unpublished). Connect2Math-Connect2Science: Intructional vision
and teacher practice assessment tools. Unpublished manuscript.
Silva, E. (2009). Measuring Skills for 21st Century Learning. Phi Delta Kappan , 90 (9), 630-
634.
Stephens, S., McRobbie, C.J., & Lucas, K.B. (1999). Model-based Reasoning in a Year 10
Classroom. Research in Science Education, 29(2), 189-208.
Webb, N. (2009). A teacher's role in promoting collaborative dialogue in the classroom. British
Journal of Educational Psychology , 79, 21-29.
Wisconsin Center for Education Research. (2010, November 9). Surveys of enacted curriculum:
State collaborative on assessment and student standards. Retrieved from Welcome to SEC
cnline: https://secure.wceruw.org/seconline/secWebHome.htm
Yin, R.K. (1981), The case study crisis: some answers. Administrative Science Quarterly, 26(1),
58-65.
Zimmerman, C. (2007). The development of scientific thinking skills in elementary and middle
school. Developmental Review, 27, 172-223.

Hoffenberg and Saxton 32
Electronic Journal of Science Education ejse.southwestern.edu
Appendix A
Teacher instructional practices framework
Effective instructional practices: definitions Examples of criteria looked for in TIP
Classroom Roles:
Teachers facilitate active engagement of
students in their learning.
a. Teachers assume the role of
facilitator rather than authority
figure
b. Students assume the role of active
learners
Lessons and activities require students
mainly rely on their observations and
reasoning to determine the accuracy of their
results; teachers occasionally take the lead to
facilitate learning by posing or answering
questions or focusing attention on an
important concept or a contradiction.
Lessons and activities require students to
participate in inquiry and problem solving to
explore concepts, after having completed
tasks/activities the teacher structures to
provide scaffolding of concepts and/or
skills.
Activities/investigations are staged so that
students are mostly active participants
contributing their own ideas, applying skills
previously learned to a new context, or
making connection to concepts previously
learned.
Content and Cognitive Skills:
Teachers emphasize deep content knowledge
and higher-order cognitive skills by addressing
learning goals in both areas.
Teachers create and implement multiple and
diverse opportunities for students to develop
conceptual knowledge and cognitive skills.
The unit as implemented targets both
content and higher-order cognitive skills
with frequent opportunities for students to
use both content knowledge and cognitive
skills in the same activities, lessons, or
investigation(s).
Lessons, activities, and investigation(s) in
the unit, when taken together, represent
multiple opportunities for students to
construct meaning, apply content, and
practice higher-order cognitive skills.
Assessment for Learning:
Teachers use frequent formative assessments
(and summative assessments) to facilitate
diagnostic teaching and learning.
a) Teachers and students are both
stakeholders in the assessment process.
a1. Teacher’s Role is to set clear,
developmentally-appropriate
learning targets/performance
criteria, and to select/develop
formative assessment tasks that
Student conceptions are frequently
assessed prior to, during, and after lessons
through intentional selection of formative
and summative assessments that link
clearly to learning goals.
The unit is structured with periodic
opportunities for students to self-assess,
reflect on their observations,
understanding, or teacher/peer feedback,
and monitor their progress toward learning
targets.

A comparative case study of teacher practice and student performance 33
Electronic Journal of Science Education ejse.southwestern.edu
align with learning goals
a2. Student’s Role is to assume ownership
over learning, and to engage in
metacognitive activities
The unit’s assessments primarily have
developmentally appropriate
cognitive demand, represent
appropriate learning progressions,
are aligned with designated learning
goals and standards, and generate
evidence of performance criteria for
meeting those goals.
Appendix B
TIP Qualitative Codes and Definitions
Is there evidence in the TIP that the teacher’s instruction included:
Class
Practice
Joe Sonia
Defining explanation
Making rationale explicit
Modeling explanation
Connecting science explanation to everyday
explanation
Explanation mentioned in TIP?
Degree of scaffolding evident in TIP

Hoffenberg and Saxton 34
Electronic Journal of Science Education ejse.southwestern.edu

A comparative case study of teacher practice and student performance 35
Electronic Journal of Science Education ejse.southwestern.edu
Note: Tables 1 – 4 in this appendix were transferred directly from McNeill and Krajcik
(2008)

Hoffenberg and Saxton 36
Electronic Journal of Science Education ejse.southwestern.edu
Appendix C
Explanation Rubric
Is there evidence? – Data referenced or explicitly cited that supports or seems intended to support
the claim (or could support a claim if claim is missing).
If no, score zero. If yes, pick evidence score (choose one for highest level present):
1 pt - Words ‘data,’ ‘table,’ ‘graph’ or other indication that data were considered are present;
&/or Evidence consists of anecdotal data – stories, past experience, or analogies
&/or Data pattern or examples cited but source could not be found in SWS
&/or There are serious flaws with the use of data.
2 pt - Only examples or means explicitly cited (no pattern referenced or described)
&/or data descriptors or rankings cited without language indicating a pattern.
3 pt - Pattern of data described – qualitative or quantitative – at least one descriptor of trends
in the data. Pattern language may be implicit or vague. To be a pattern, language must
incorporate at least three data points and describe a trend. (Vague reference to multiple trials
sufficient for at least three data points.) Data points may not be explicitly cited for this
category. Pattern cannot be merely a restatement of the claim.
4 pt - Pattern (qual or quant) + at least 1 data point to support pattern description. – Pattern
language must be explicit, and data example must be proximate to pattern description and
explicitly cited as support for pattern.
Is there reasoning that purports to support the claim? – Relevant science content or other logical
statements that bolster the claim
Is there a claim? – Statement(s) in the explanation section that addresses the hypothesis or
answers the research question. Note: If no data are found in the work sample, still score claim as
if there are data. If the claim is scientifically plausible, score as if supported by the data.
If no, score zero. If yes, pick claim score (choose one):
1 pt - Claim does not address the research question or hypothesis, or is self-contradictory or
unintelligible. (If it is unclear what is claimed, score 1). Note: Any statement akin to, “My
hypothesis was correct” without any restatement of the hypothesis can only earn a 1.
2 pt - Claim does not contain all of the relevant parts (e.g. only dependent variable trend
described, or experimental result stated without reference to purpose of investigation), or is
implicit.
&/or Incorrectly addresses the hypothesis or research question, or is not supported by the
data
3 pt - Claim is explicit, related to the research question and is supported by the data, but may
have to be pieced together, or may be found in data analysis or error analysis section.
4 pt - Claim is explicit, and relationship to research question or hypothesis is explicitly
stated. Claim is in the same section as the evidence and reasoning (if evidence and/or
reasoning present), and does not have to be “pieced together” from disparate parts of the
analysis/conclusion section.

A comparative case study of teacher practice and student performance 37
Electronic Journal of Science Education ejse.southwestern.edu
If no, score zero. If yes, pick reasoning score (choose one for highest level present):
1 pt - Reasoning is all or mostly irrelevant, uses mostly incorrect science content or science
content is very weak or is unintelligible
2 pt - Reasoning is partially aligned with claim, i.e. contains some incorrect, irrelevant or
tangential statements but also some correct, relevant content or statements that bolster the
claim.
Note: For 2 pt, at least one relevant, reasonable explanation or speculation must be present,
i.e. at least one reasonable “because” type statement.
3 pt - Reasoning is aligned with claim, and all or most statements in explanation section are
relevant to claim.
Reasoning may presented separately from the claim, or the statements are disconnected or
don’t flow together to make a convincing argument.
&/or Some important pieces of content are missing.
4 pt - Reasoning is completely aligned with claim, i.e. all or most statements are relevant and
statements flow together to make a convincing argument with no important pieces missing.
Some science content used correctly is required.

Hoffenberg and Saxton 38
Electronic Journal of Science Education ejse.southwestern.edu
Appendix D
Definitions and Guidance for Qualitative Codes
Definitions and Guidance for Explanation Qualitative Codes
I. Claim - How well does the claim address the question posed?
a. All aspects of claim expected for the work sample topic were addressed.
b. Some parts of expected claim were left out but some were addressed.
c. Claim did not address research question.
d. No claim was present.
II. Evidence
a. Type: What type of evidence was provided?
i. Investigation-based: Data can be tracked to tables or graphs in SWS
ii. Artificial – data could not be found in the SWS
iii. Anecdotal
iv. Word ‘data’ only mentioned = only words “data” “table” or “graph”
without citing any actual data
b. Nature: Were the data presented as patterns or isolated examples?
i. Patterns (qualitative or quantitative) only
ii. Patterns and examples
iii. Examples only
c. Sufficiency: Was there enough evidence to support the claim? Data considered to
be sufficient if:
i. Investigation-based and described as a pattern, OR
ii. Investigation based and at least two examples for each part of the claim (in
paper, claim in two parts => at least 4 examples)
III. Reasoning
a. Alignment – Is the evidence linked to the claim or are they presented as separate
entities?
i. Alignment is complete; reasoning in explanation connects evidence to
claim without tangential or irrelevant statements.
ii. Partial – Some reasoning statements not accurate and/or not related to
claim.
iii. No – Reasoning statements completely incorrect and/or not related to
claim.
b. Quality of the link – How was the evidence linked to the claim? For example,
with an elaborated statement, or with only a “because” or a “for example” link?
IV. Other
a. Was there differentiation between claims and evidence?
i. Naming evidence source (“The graph of conc. vs.time showed…”)
ii. Generally referencing evidence (“The data showed…”)
iii. Referencing time or context (“When the rainfall dropped…”)
iv. Attributing confidence (“I know this because…”)
v. Implication that evidence is something they know, but inference is
something they think (“Because the rainfall dropped, I think the finches
regular food source died…”)

A comparative case study of teacher practice and student performance 39
Electronic Journal of Science Education ejse.southwestern.edu
b. Were there overtly persuasive statements?
i. Statements or phrases such as “I was right” or “My hypothesis was
correct.”
ii. Refuted counterarguments such as “I first thought x to be true but my
results showed it wasn’t.”
c. Did the student consider the quality of the evidence, such as identifying sources of
error, stating that evidence was missing, that sh/e ran out of time to do more
trials?
d. Did the student consider alternative explanations?
e. Did the student consider broader implications such as:
i. Possible follow-up questions or experiments
ii. Relatedness to other topics or content studied
iii. Real-life applications of findings
iv. Limitations of the findings