scientific guide - global warming and climate … are raising co levels 2 when you look through the...
TRANSCRIPT
TheScientific Guideto Global Warming
Skepticism
John Cookskeptical .comscience
Acknowledgements
• Dr. John Abraham, Associate Professor of
Engineering, University of St. Thomas, St. Paul,
Minnesota
• Paul Beckwith, Laboratory for paleoclimatology and
climatology, Department of Geography, University
of Ottawa, Canada
• Prof. Andrew Dessler, Department of Atmospheric
Science, Texas A&M University
• Prof. Ove Hoegh-Guldberg, Director, Global
Change Institute, University of Queensland
• Prof. David Karoly, School of Earth Sciences,
University of Melbourne
• Prof. Scott Mandia, Physical Sciences, Suffolk
County Community College
• Dana Nuccitelli - Environmental Scientist, Tetra
Tech, Inc.
• James Prall, The Edward S. Rogers Sr. Department
of Electrical and Computer Engineering, University
of Toronto
• Dr. John Price, www.grandkidzfuture.com
• Corinne Le Quéré, Professor of Environmental
Sciences, University of East Anglia, UK
• Prof. Peter Reich, Sr. Chair in Forest Ecology and
Tree Physiology, University of Minnesota
• Prof. Riccardo Reitano, Department of Physics and
Astronomy, University of Catania, Italy
• Prof. Christian Shorey, Geology and Geologic
Engineering, Colorado School of Mines
• Suffolk County Community College MET101
students
• Glenn Tamblyn, B Eng (Mech), Melbourne
University, Australia
• Dr. André Viau, Laboratory for paleoclimatology and
climatology, Department of Geography, University
of Ottawa, Canada
• Dr. Haydn Washington, Environmental Scientist
• Robert Way, Department of Geography, Memorial
University of Newfoundland, Canada
• Dr. Ray Weymann, Director Emeritus and Staff
Member Emeritus, Carnegie Observatories,
Pasadena, California; Member, National Academy
of Sciences
• James Wight
• Bärbel Winkler, Germany
First published in December 2010
For more information or to comment on this Guide, visit www.skepticalscience.com
The Scientific Guide to Global Warming Skepticism is licensed under a Creative Commons
Attribution-NonCommercial 3.0 Unported License. Extracts may be reproduced provided
Skeptical Science is attributed with a link to www.skepticalscience.com.
The Scientific Guide to Global Warming Skepticism was written by John Cook (www.skepticalscience.com).
Acknowledgements to the following who contributed and commented on this document:
1
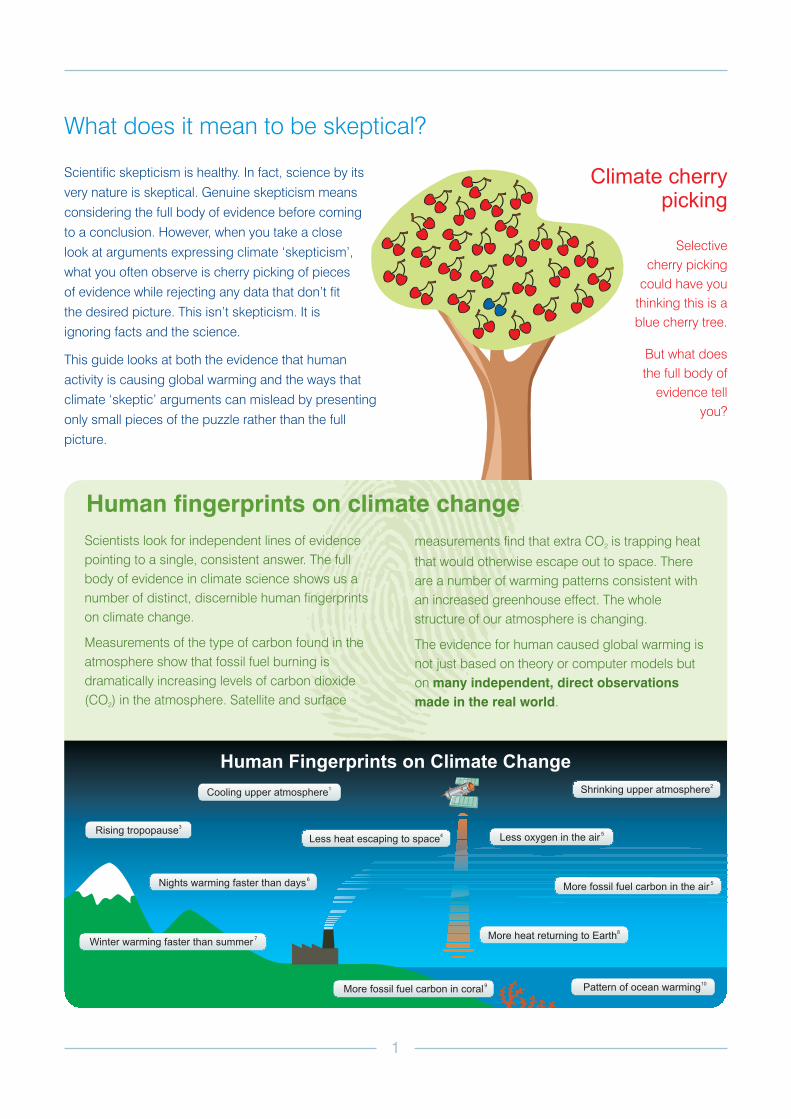
Scientific skepticism is healthy. In fact, science by its
very nature is skeptical. Genuine skepticism means
considering the full body of evidence before coming
to a conclusion. However, when you take a close
look at arguments expressing climate ‘skepticism’,
what you often observe is cherry picking of pieces
of evidence while rejecting any data that don’t fit
the desired picture. This isn’t skepticism. It is
ignoring facts and the science.
This guide looks at both the evidence that human
activity is causing global warming and the ways that
climate ‘skeptic’ arguments can mislead by presenting
only small pieces of the puzzle rather than the full
picture.
What does it mean to be skeptical?
Climate cherrypicking
Selective
cherry picking
could have you
thinking this is a
blue cherry tree.
But what does
the full body of
evidence tell
you?
Scientists look for independent lines of evidence
pointing to a single, consistent answer. The full
body of evidence in climate science shows us a
number of distinct, discernible human fingerprints
on climate change.
Measurements of the type of carbon found in the
atmosphere show that fossil fuel burning is
dramatically increasing levels of carbon dioxide
(CO ) in the atmosphere. Satellite and surface2
Human fingerprints on climate change
measurements find that extra CO is trapping heat
that would otherwise escape out to space. There
are a number of warming patterns consistent with
an increased greenhouse effect. The whole
structure of our atmosphere is changing.
The evidence for human caused global warming is
not just based on theory or computer models but
on
.
2
many independent, direct observations
made in the real world
Less heat escaping to space4
Cooling upper atmosphere1
More heat returning to Earth8
Shrinking upper atmosphere2
Rising tropopause3
More fossil fuel carbon in coral9
Human Fingerprints on Climate Change
More fossil fuel carbon in the air5
Less oxygen in the air5
Pattern of ocean warming10
Winter warming faster than summer7
Nights warming faster than days6
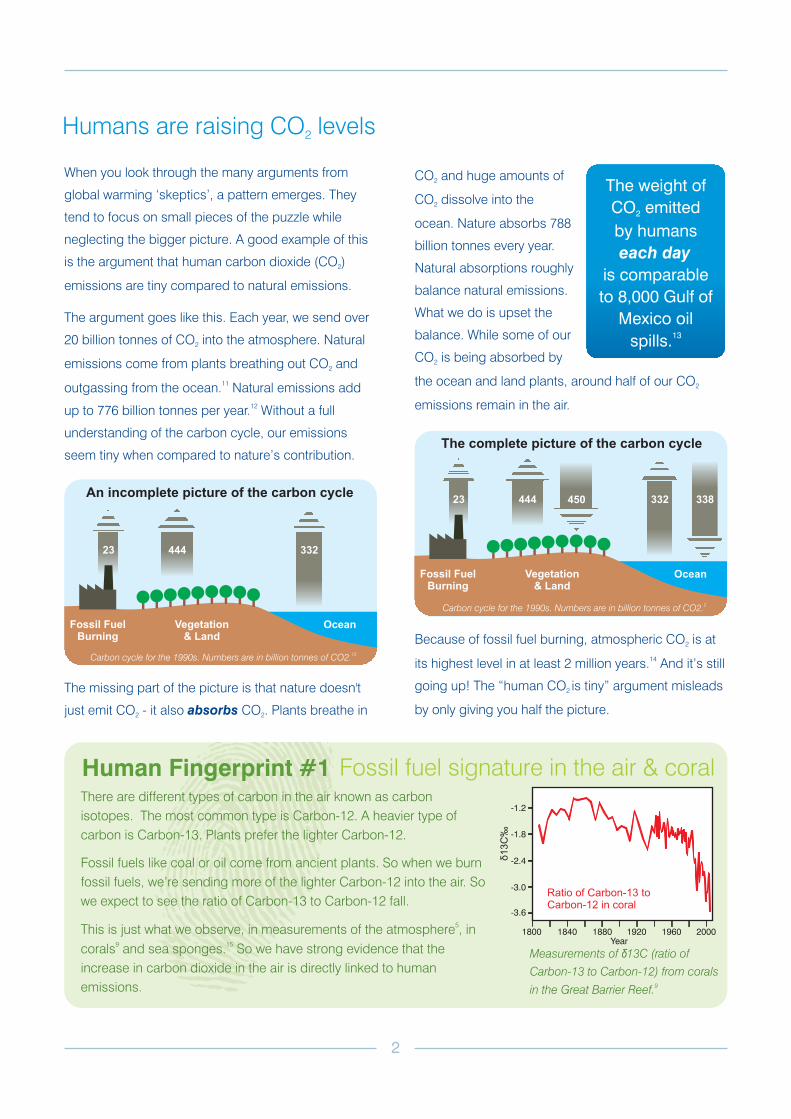
Humans are raising CO levels2
When you look through the many arguments from
global warming ‘skeptics’, a pattern emerges. They
tend to focus on small pieces of the puzzle while
neglecting the bigger picture. A good example of this
is the argument that human carbon dioxide (CO )
emissions are tiny compared to natural emissions.
The argument goes like this. Each year, we send over
20 billion tonnes of CO into the atmosphere. Natural
emissions come from plants breathing out CO and
outgassing from the ocean. Natural emissions add
up to 776 billion tonnes per year. Without a full
understanding of the carbon cycle, our emissions
seem tiny when compared to nature’s contribution.
The missing part of the picture is that nature doesn't
just emit CO - it also CO . Plants breathe in
2
2
2
2 2
11
12
absorbs
Human Fingerprint #1 Fossil fuel signature in the air & coral
CO and huge amounts of
CO dissolve into the
ocean. Nature absorbs 788
billion tonnes every year.
Natural absorptions roughly
balance natural emissions.
What we do is upset the
balance. While some of our
CO is being absorbed by
the ocean and land plants, around half of our CO
emissions remain in the air.
Because of fossil fuel burning, atmospheric CO is at
its highest level in at least 2 million years. And it’s still
going up! The “human CO is tiny” argument misleads
by only giving you half the picture.
2
2
2
2
2
2
14
Measurements of 13C (ratio of
Carbon-13 to Carbon-12) from corals
in the Great Barrier Reef.
δ
9
33244423
332 338444 45023
2
1800 1840 1880 1920 1960 2000Year
-3.6
-3.0
-2.4
-1.8
-1.2
δ1
3C
‰
Ratio of Carbon-13 toCarbon-12 in coral
There are different types of carbon in the air known as carbon
isotopes. The most common type is Carbon-12. A heavier type of
carbon is Carbon-13. Plants prefer the lighter Carbon-12.
Fossil fuels like coal or oil come from ancient plants. So when we burn
fossil fuels, we’re sending more of the lighter Carbon-12 into the air. So
we expect to see the ratio of Carbon-13 to Carbon-12 fall.
This is just what we observe, in measurements of the atmosphere , in
corals and sea sponges. So we have strong evidence that the
increase in carbon dioxide in the air is directly linked to human
emissions.
5
9 15
The weight of
CO emitted
by humans
is comparable
to 8,000 Gulf of
Mexico oil
spills.
2
each day
13
OceanVegetation& Land
Fossil FuelBurning
An incomplete picture of the carbon cycle
Carbon cycle for the 1990s. Numbers are in billion tonnes of CO2.12
OceanVegetation& Land
Fossil FuelBurning
The complete picture of the carbon cycle
Carbon cycle for the 1990s. Numbers are in billion tonnes of CO2.2
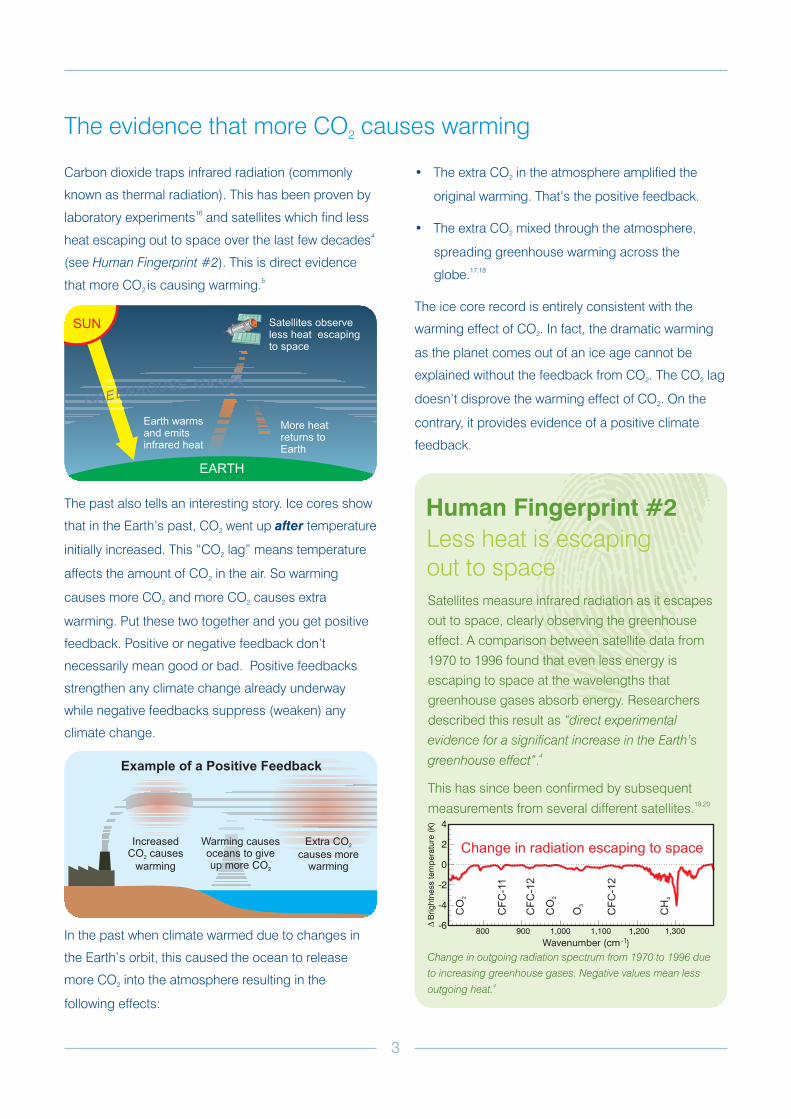
Carbon dioxide traps infrared radiation (commonly
known as thermal radiation). This has been proven by
laboratory experiments and satellites which find less
heat escaping out to space over the last few decades
(see ). This is direct evidence
that more CO is causing warming.
The past also tells an interesting story. Ice cores show
that in the Earth’s past, CO went up temperature
initially increased. This “CO lag” means temperature
affects the amount of CO in the air. So warming
causes more CO and more CO causes extra
warming. Put these two together and you get positive
feedback. Positive or negative feedback don’t
necessarily mean good or bad. Positive feedbacks
strengthen any climate change already underway
while negative feedbacks suppress (weaken) any
climate change.
In the past when climate warmed due to changes in
the Earth’s orbit, this caused the ocean to release
more CO into the atmosphere resulting in the
following effects:
16
4
5
Human Fingerprint #2
2
2
2
2
2 2
2
after
The evidence that more CO causes warming2
• The extra CO in the atmosphere amplified the
original warming. That’s the positive feedback.
• The extra CO mixed through the atmosphere,
spreading greenhouse warming across the
globe.
The ice core record is entirely consistent with the
warming effect of CO . In fact, the dramatic warming
as the planet comes out of an ice age cannot be
explained without the feedback from CO . The CO lag
doesn’t disprove the warming effect of CO . On the
contrary, it provides evidence of a positive climate
feedback.
2
2
2
2 2
2
17,18
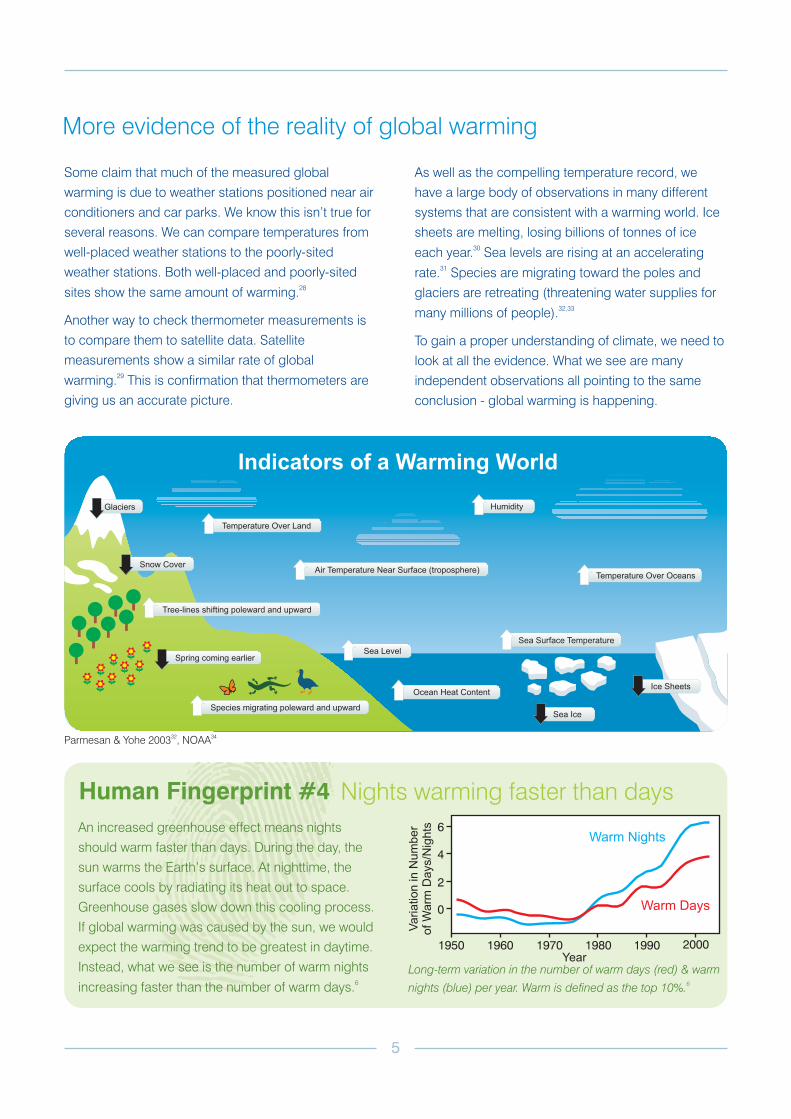
Human Fingerprint #2
Less heat is escapingout to spaceSatellites measure infrared radiation as it escapes
out to space, clearly observing the greenhouse
effect. A comparison between satellite data from
1970 to 1996 found that even less energy is
escaping to space at the wavelengths that
greenhouse gases absorb energy. Researchers
described this result as
.
This has since been confirmed by subsequent
measurements from several different satellites.
“direct experimental
evidence for a significant increase in the Earth’s
greenhouse effect”4
19,20
Change in outgoing radiation spectrum from 1970 to 1996 due
to increasing greenhouse gases. Negative values mean less
outgoing heat.4
3
4
2
0
-2
-4
-6800 900 1,000 1,100 1,200 1,300
Wavenumber (cm -1)
�B
rig
htn
ess
tem
pera
ture
(K)
Change in radiation escaping to space
CF
C-1
1
CF
C-1
2
CF
C-1
2
SUN
Earth warmsand emitsinfrared heat
EARTH
Satellites observeless heat escapingto space
More heatreturns toEarth
Example of a Positive Feedback
Warming causesoceans to giveup more CO2
Extra CO
causes morewarming
2IncreasedCO causes
warming2
The evidence that global warming is happening
One ‘skeptic’ argument is so misleading, it requires
three levels of cherry picking. This argument is “global
warming stopped in 1998”.
The first cherry pick is that it relies on temperature
records that don’t cover the entire globe, such as data
from the Hadley Centre in the U.K. The Hadley
Centre record doesn’t include the Arctic region where
the fastest warming on the planet is occurring.
Records covering the entire planet find the hottest
calendar year on record is 2005. The hottest 12
months were June 2009 to May 2010.
The second cherry pick is asserting a long-term trend
based on selected end-point years. Ocean cycles like
El Niño exchange massive amounts of heat between
the ocean and atmosphere, so surface temperature
jumps up and down from year to year. To work out the
long-term trend, scientists use techniques such as
moving averages or linear regression that take into
account . These show that surface
temperatures continue to rise since 1998.
The third cherry pick is looking only at surface
temperature, which is a measurement of atmospheric
temperature. Over 80% of the extra energy from the
increased greenhouse effect goes into warming the
oceans. To find out if global warming continued past
1998, look at all the heat accumulating in the climate
21
22
23
23,25
12 month running average of global temperature variations.24
all the data
system. When we add up the heat going into the
oceans, warming the land and air and melting the ice,
we see the planet continues to accumulate heat.26
Human Fingerprint #3
The ocean warming patternThe world’s oceans have steadily been building
up heat over the past 40 years. The specific
pattern of ocean warming, with heat penetrating
from the surface, can only be explained by
greenhouse warming.10
Observed ocean temperature (red) compared to model
results that include greenhouse warming (green).10
Cumulative heat for the Earth since 1950. The rate of energy
building up since 1970 is equivalent to 2.5 Hiroshima bombs
every second.
26
27
4
Build-up in Earth's Total Heat Content
0
40
80
120
160
200
Ocean Heating
Land & Atmosphere Heating
Land + Atmosphere
OceanHeating
1950 1960 1970 1980 1990 2000
Va
ria
tio
nin
He
at
Co
nte
nt
sin
ce
19
50
(10
Jo
ule
s)
21
Hottest 12 months on recordJune 2009 to May 2010
NASA GISS global temperature12 month running average
0.6
0.4
0.2
0
-0.2
-0.4
1880 1900 1920 1940 1960 1980 2000
Tem
pera
ture
Variation
(°C
)
Year
Year
Some claim that much of the measured global
warming is due to weather stations positioned near air
conditioners and car parks. We know this isn’t true for
several reasons. We can compare temperatures from
well-placed weather stations to the poorly-sited
weather stations. Both well-placed and poorly-sited
sites show the same amount of warming.
Another way to check thermometer measurements is
to compare them to satellite data. Satellite
measurements show a similar rate of global
warming. This is confirmation that thermometers are
giving us an accurate picture.
28
29
More evidence of the reality of global warming
Human Fingerprint #4 Nights warming faster than days
An increased greenhouse effect means nights
should warm faster than days. During the day, the
sun warms the Earth’s surface. At nighttime, the
surface cools by radiating its heat out to space.
Greenhouse gases slow down this cooling process.
If global warming was caused by the sun, we would
expect the warming trend to be greatest in daytime.
Instead, what we see is the number of warm nights
increasing faster than the number of warm days.6
As well as the compelling temperature record, we
have a large body of observations in many different
systems that are consistent with a warming world. Ice
sheets are melting, losing billions of tonnes of ice
each year. Sea levels are rising at an accelerating
rate. Species are migrating toward the poles and
glaciers are retreating (threatening water supplies for
many millions of people).
To gain a proper understanding of climate, we need to
look at all the evidence. What we see are many
independent observations all pointing to the same
conclusion - global warming is happening.
30
31
32,33
Long-term variation in the number of warm days (red) & warm
nights (blue) per year. Warm is defined as the top 10%.6
Air Temperature Near Surface (troposphere)
Indicators of a Warming World
Snow Cover
Ocean Heat Content
Temperature Over Land
Humidity
Parmesan & Yohe 2003 , NOAA32 34
Sea Surface Temperature
Sea Ice
Glaciers
Sea LevelSpring coming earlier
Species migrating poleward and upward
Tree-lines shifting poleward and upward
Temperature Over Oceans
5
Ice Sheets
1950 1960 1970 1980 1990 2000
0
2
4
6Warm Nights
Warm Days
Variation
inN
um
ber
ofW
arm
Days/N
ights
Year
Hockey stick or hockey league?
Combined climate forcing from solar variations, CO and
aerosols - the short-term effects of volcanoes are omitted.
Northern hemisphere temperature reconstruction (blue)
plus instrumental measurements of northern hemisphere
land temperature (red - 5 year average).
Various northern hemisphere temperature reconstructions.
2
38
39
21
40
This shows our climate has been building up heat in
recent times. We see a corresponding warming:
Over the last decade, a number of independent
studies have reconstructed temperature over the last
1800 years, using a multitude of data and different
data analysis techniques.
All these hockey sticks tell a similar and consistent
story - humans have caused a profound and rapid
disturbance to our climate system.
40
6
The ‘hockey stick’ commonly refers to a reconstruction
of temperature going back over the last millennium.
The steep warming in recent times is seen as the
blade of the stick. However, there are many hockey
sticks found in climate science. The amount of CO
emitted by humans, mostly through the burning of
fossil fuels, has a distinct hockey stick shape over the
last 1000 years.
Climate forcing is a change in the planet’s energy
balance - when our climate builds up or loses heat.
Various factors cause these changes, such as
variations in solar activity, aerosols (tiny particles
suspended in the air), changes in the Earth’s orbit and
CO . Over the past 1000 years, the major drivers of
long-term climate change have been the sun, aerosols
and CO . The climate forcing from these
influences shows a familiar shape.
35
2
2
2
Total yearly CO emissions (billions of tonnes).
CO levels (parts per million) from ice cores at Law Dome,
East Antarctica (green) and direct measurements from
Mauna Loa, Hawaii (purple).
2
2
11
36
37
The dramatic increase in CO emissions is matched by
a steep rise in atmospheric CO levels, which have
now reached levels unseen for at least 2 million years.
2
2
14
combined
20001800
Clim
ate
Fo
rcin
g Net Climate Forcing: solar + CO + aerosols
(Watts per square metre)2
1000 1200 1400 1600Year
-0.5
0
0.5
1
1.5
2
2000
Human CO emissions
(billion metric tonnes of )2
CO2
18001000 1200 1400 1600Year
0
10
20
30
20001800
Atmospheric CO concentration
(parts per million)2
1000 1200 1400 1600Year
275
300
325
350
375
Northern Hemisphere Land Temperature
Moberg et al. 2005 Reconstruction (blue)
Instrumental Temperature (red)
20001800Te
mp
era
ture
Va
ria
tio
n(°
C)
1000 1200 1400 1600Year
-1
-0.5
0
0.5
200 400 600 800 1000 1200 1400 1600 1800 2000-1.2
-1
-0.8
-0.6
-0.4
-0.2
0
0.2
0.4
0.6
0.8
Year .
CPS land with uncertaintiesEIV land with uncertaintiesEIV land+ocn with uncertaintiesMann and Jones (2003)Esper et al. (2002)Moberg et al. (2005)
CRU Observed TrendHAD Observed Trend
Te
mp
era
ture
Ch
an
ge
(°C
)
A common ‘skeptic’ argument is that “climate has
changed naturally in the past and therefore recent
global warming can’t be caused by humans”. This
argument is like saying “forest fires have happened
naturally in the past so any recent forest fires can’t be
caused by humans”.
Scientists are well aware that climate has changed in
the past. In fact, the past gives us vital clues about
how our planet responds to the various drivers of
climate. We can see what happens when the Earth
builds up heat, whether it be due to more sunlight or
rising greenhouse gases. The crucial discovery from
examining different periods throughout Earth’s history
is that positive feedbacks amplify any initial warming.
This is why climate has changed so dramatically in the
past. Positive feedbacks take any temperature
changes and amplify them. Feedbacks are why our
climate is so sensitive to greenhouse gases, of which
CO is the most important driver of climate change.
41
42
2
What does past climate change tell us?
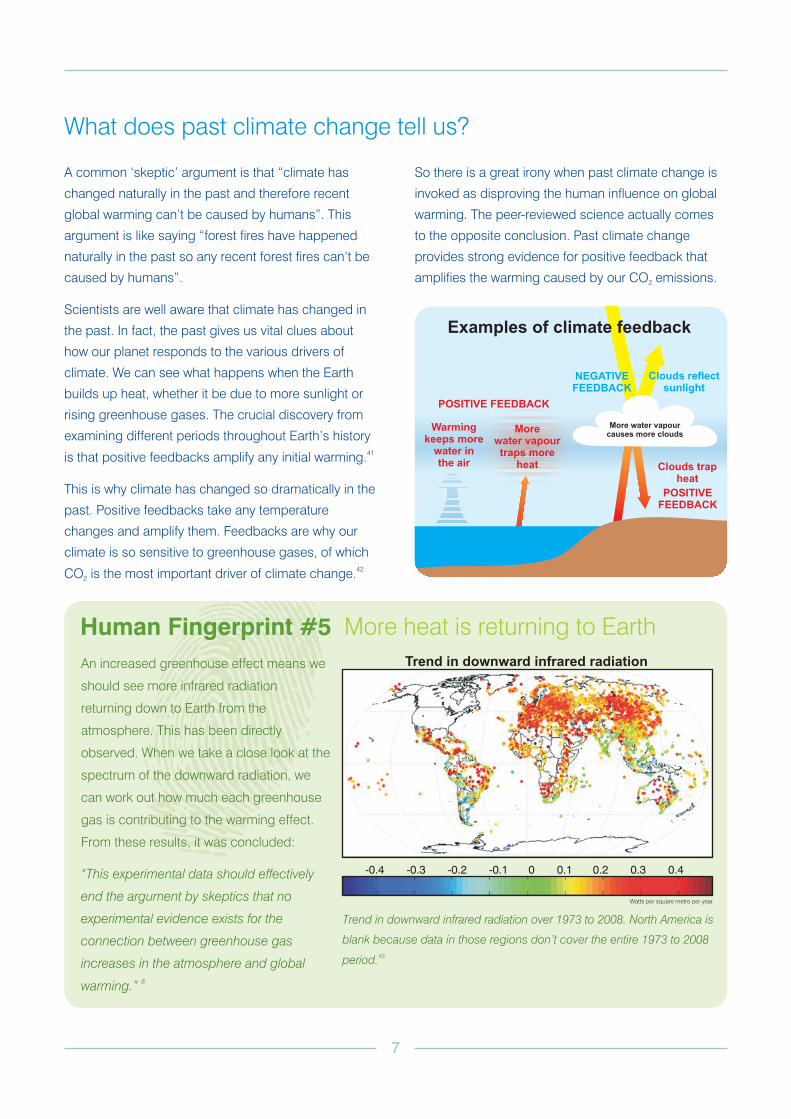
Human Fingerprint #5 More heat is returning to Earth
An increased greenhouse effect means we
should see more infrared radiation
returning down to Earth from the
atmosphere. This has been directly
observed. When we take a close look at the
spectrum of the downward radiation, we
can work out how much each greenhouse
gas is contributing to the warming effect.
From these results, it was concluded:
“This experimental data should effectively
end the argument by skeptics that no
experimental evidence exists for the
connection between greenhouse gas
increases in the atmosphere and global
warming.”8
Trend in downward infrared radiation
So there is a great irony when past climate change is
invoked as disproving the human influence on global
warming. The peer-reviewed science actually comes
to the opposite conclusion. Past climate change
provides strong evidence for positive feedback that
amplifies the warming caused by our CO emissions.2
Trend in downward infrared radiation over 1973 to 2008. North America is
blank because data in those regions don’t cover the entire 1973 to 2008
period.43
Watts per square metre per year
7
-0.4 -0.3 -0.2 -0.1 0 0.1 0.2 0.3 0.4
Examples of climate feedback
Clouds trapheat
Clouds reflectsunlight
More water vapourcauses more clouds
Morewater vapourtraps more
heat
POSITIVE FEEDBACK
POSITIVEFEEDBACK
NEGATIVEFEEDBACK
Warmingkeeps more
water inthe air
8
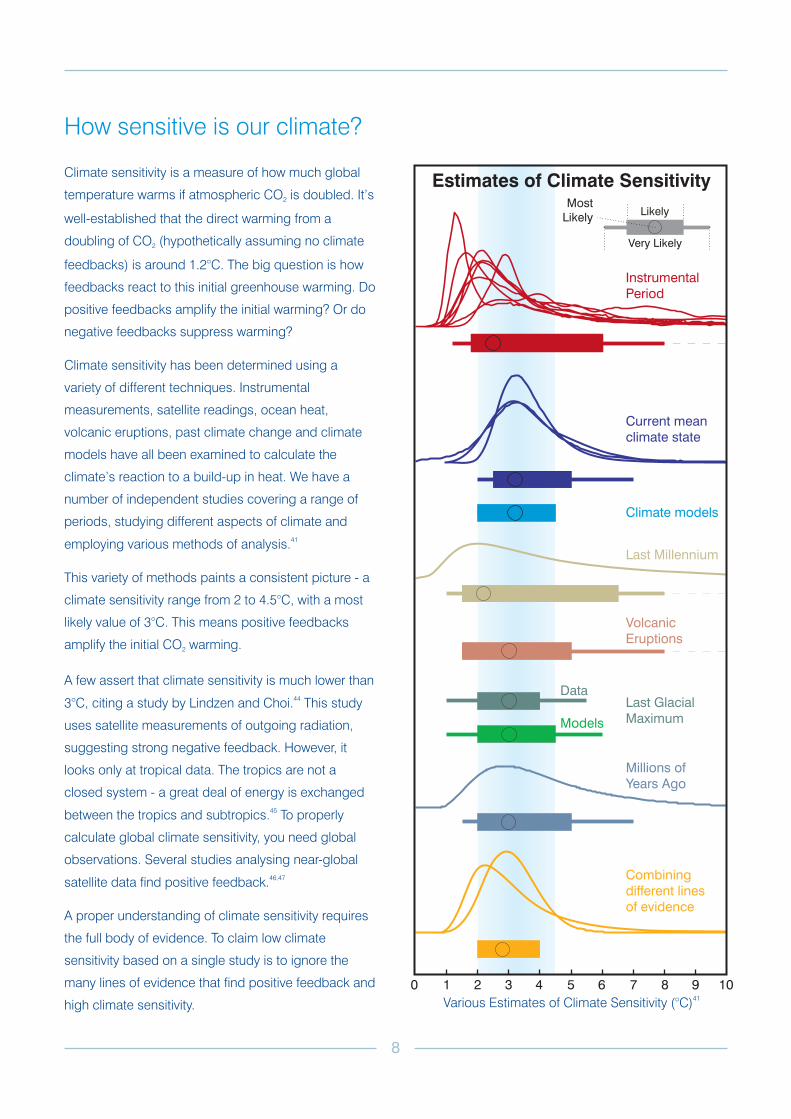
How sensitive is our climate?
Instrumental
Period
Current mean
climate state
Climate models
Last Millennium
Volcanic
Eruptions
Millions of
Years Ago
0 1 2 3 4 5 6 7 8 9 10
Various Estimates of Climate Sensitivity (°C)41
Climate sensitivity is a measure of how much global
temperature warms if atmospheric CO is doubled. It’s
well-established that the direct warming from a
doubling of CO (hypothetically assuming no climate
feedbacks) is around 1.2°C. The big question is how
feedbacks react to this initial greenhouse warming. Do
positive feedbacks amplify the initial warming? Or do
negative feedbacks suppress warming?
Climate sensitivity has been determined using a
variety of different techniques. Instrumental
measurements, satellite readings, ocean heat,
volcanic eruptions, past climate change and climate
models have all been examined to calculate the
climate’s reaction to a build-up in heat. We have a
number of independent studies covering a range of
periods, studying different aspects of climate and
employing various methods of analysis.
This variety of methods paints a consistent picture - a
climate sensitivity range from 2 to 4.5°C, with a most
likely value of 3°C. This means positive feedbacks
amplify the initial CO warming.
A few assert that climate sensitivity is much lower than
3°C, citing a study by Lindzen and Choi. This study
uses satellite measurements of outgoing radiation,
suggesting strong negative feedback. However, it
looks only at tropical data. The tropics are not a
closed system - a great deal of energy is exchanged
between the tropics and subtropics. To properly
calculate global climate sensitivity, you need global
observations. Several studies analysing near-global
satellite data find positive feedback.
A proper understanding of climate sensitivity requires
the full body of evidence. To claim low climate
sensitivity based on a single study is to ignore the
many lines of evidence that find positive feedback and
high climate sensitivity.
2
2
2
41
44
45
46,47
Last Glacial
Maximum
Data
Models
Combining
different lines
of evidence
Estimates of Climate Sensitivity
Likely
Very Likely
Most
Likely
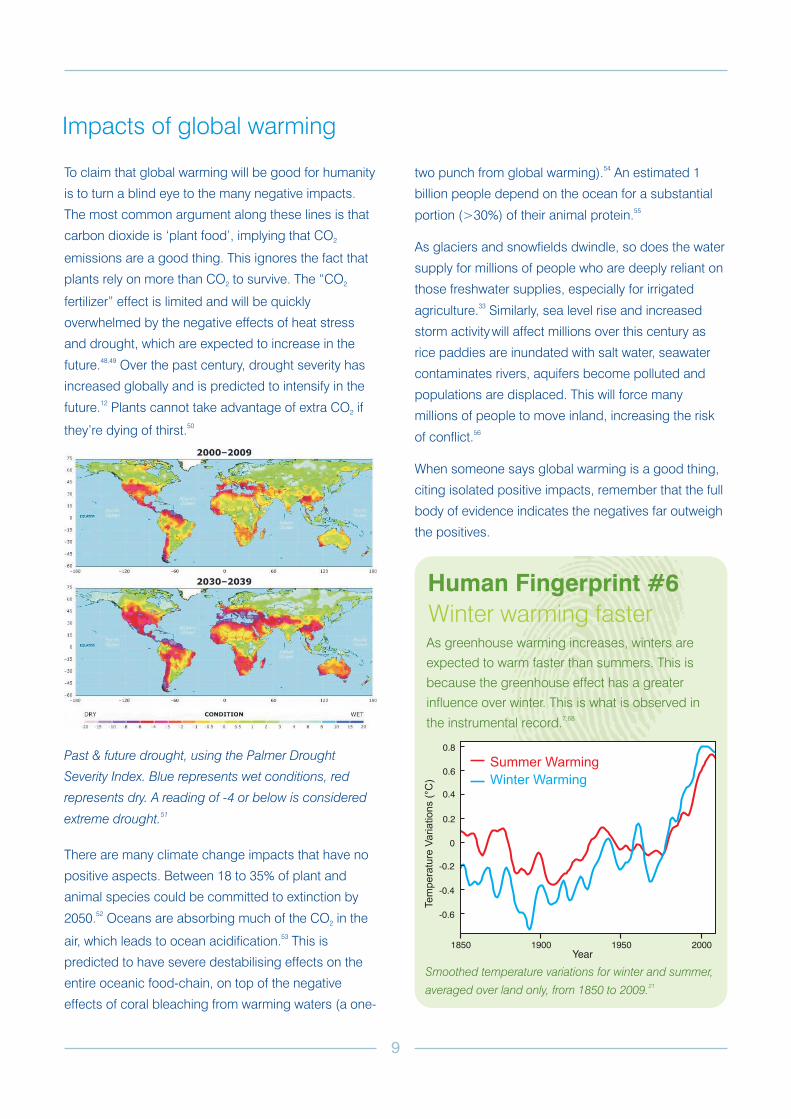
To claim that global warming will be good for humanity
is to turn a blind eye to the many negative impacts.
The most common argument along these lines is that
carbon dioxide is ‘plant food’, implying that CO
emissions are a good thing. This ignores the fact that
plants rely on more than CO to survive. The “CO
fertilizer” effect is limited and will be quickly
overwhelmed by the negative effects of heat stress
and drought, which are expected to increase in the
future. Over the past century, drought severity has
increased globally and is predicted to intensify in the
future. Plants cannot take advantage of extra CO if
they’re dying of thirst.
There are many climate change impacts that have no
positive aspects. Between 18 to 35% of plant and
animal species could be committed to extinction by
2050. Oceans are absorbing much of the CO in the
air, which leads to ocean acidification. This is
predicted to have severe destabilising effects on the
entire oceanic food-chain, on top of the negative
effects of coral bleaching from warming waters (a one-
2
2 2
2
2
48,49
12
50
52
53
Past & future drought, using the Palmer Drought
Severity Index. Blue represents wet conditions, red
represents dry. A reading of -4 or below is considered
extreme drought.51
Impacts of global warming
two punch from global warming). An estimated 1
billion people depend on the ocean for a substantial
portion (>30%) of their animal protein.
As glaciers and snowfields dwindle, so does the water
supply for millions of people who are deeply reliant on
those freshwater supplies, especially for irrigated
agriculture. Similarly, sea level rise and increased
storm activity will affect millions over this century as
rice paddies are inundated with salt water, seawater
contaminates rivers, aquifers become polluted and
populations are displaced. This will force many
millions of people to move inland, increasing the risk
of conflict.
When someone says global warming is a good thing,
citing isolated positive impacts, remember that the full
body of evidence indicates the negatives far outweigh
the positives.
54
55
33
56
Human Fingerprint #6
Winter warming fasterAs greenhouse warming increases, winters are
expected to warm faster than summers. This is
because the greenhouse effect has a greater
influence over winter. This is what is observed in
the instrumental record.7,68
Smoothed temperature variations for winter and summer,
averaged over land only, from 1850 to 2009.21
9
1850 1900 1950 2000
-0.6
-0.4
-0.2
0
0.2
0.4
0.6
0.8
Year
Tem
pera
ture
Variations
(°C
)
Summer Warming
Winter Warming
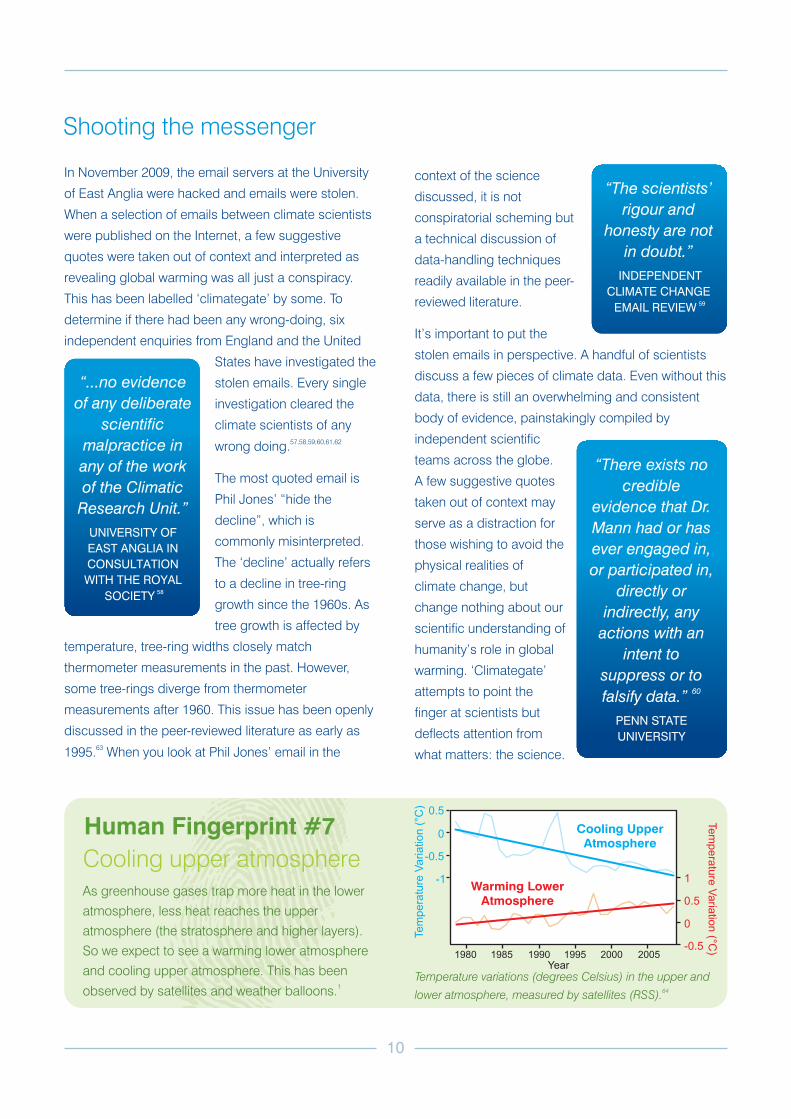
Shooting the messenger
In November 2009, the email servers at the University
of East Anglia were hacked and emails were stolen.
When a selection of emails between climate scientists
were published on the Internet, a few suggestive
quotes were taken out of context and interpreted as
revealing global warming was all just a conspiracy.
This has been labelled ‘climategate’ by some. To
determine if there had been any wrong-doing, six
independent enquiries from England and the United
States have investigated the
stolen emails. Every single
investigation cleared the
climate scientists of any
wrong doing.
The most quoted email is
Phil Jones’ “hide the
decline”, which is
commonly misinterpreted.
The ‘decline’ actually refers
to a decline in tree-ring
growth since the 1960s. As
tree growth is affected by
temperature, tree-ring widths closely match
thermometer measurements in the past. However,
some tree-rings diverge from thermometer
measurements after 1960. This issue has been openly
discussed in the peer-reviewed literature as early as
1995. When you look at Phil Jones’ email in the
57,58,59,60,61,62
63
Human Fingerprint #7
Cooling upper atmosphereAs greenhouse gases trap more heat in the lower
atmosphere, less heat reaches the upper
atmosphere (the stratosphere and higher layers).
So we expect to see a warming lower atmosphere
and cooling upper atmosphere. This has been
observed by satellites and weather balloons.1
“...no evidence
of any deliberate
scientific
malpractice in
any of the work
of the Climatic
Research Unit.”
UNIVERSITY OF
EAST ANGLIA IN
CONSULTATION
WITH THE ROYAL
SOCIETY58
context of the science
discussed, it is not
conspiratorial scheming but
a technical discussion of
data-handling techniques
readily available in the peer-
reviewed literature.
It’s important to put the
stolen emails in perspective. A handful of scientists
discuss a few pieces of climate data. Even without this
data, there is still an overwhelming and consistent
body of evidence, painstakingly compiled by
independent scientific
teams across the globe.
A few suggestive quotes
taken out of context may
serve as a distraction for
those wishing to avoid the
physical realities of
climate change, but
change nothing about our
scientific understanding of
humanity’s role in global
warming. ‘Climategate’
attempts to point the
finger at scientists but
deflects attention from
what matters: the science.
“The scientists’
rigour and
honesty are not
in doubt.”
INDEPENDENT
CLIMATE CHANGE
EMAIL REVIEW59
“There exists no
credible
evidence that Dr.
Mann had or has
ever engaged in,
or participated in,
directly or
indirectly, any
actions with an
intent to
suppress or to
falsify data.”60
PENN STATE
UNIVERSITY
10
-1
-0.5
0
0.5
-0.5
0
0.5
1
Tem
pera
ture
Variation
(°C
)
Tem
pera
ture
Varia
tion
(°C)
Temperature variations (degrees Celsius) in the upper and
lower atmosphere, measured by satellites (RSS).64
1980
Warming Lower
Atmosphere
1990 2000 200519951985
Cooling Upper
Atmosphere
Year
The scientific consensus on global warming
11
The consensus of evidence
The case for human-caused global warming isn’t
based on a show of hands but on direct
observations. Multiple, independent lines of
evidence all point to the same answer.
There’s a consensus of evidence that
humans are raising carbon dioxide levels
in the atmosphere. This is confirmed by
measuring the type of carbon in the air.
What we find is more of that carbon is
coming from fossil fuels.
There’s a consensus of evidence that
rising CO is causing warming. Satellites
measure less heat escaping to space.
Surface observations find more heat returning to
Earth. This is happening at the exact wavelengths
where CO traps heat - a distinct human fingerprint.
2
2
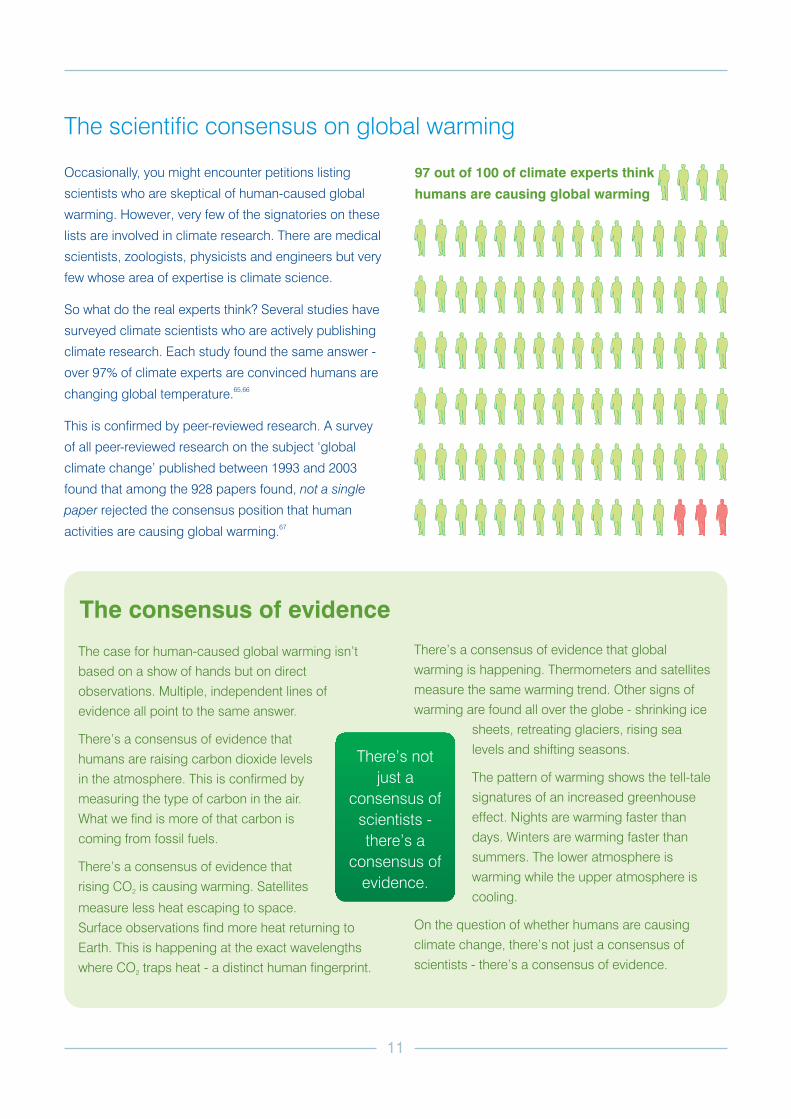
Occasionally, you might encounter petitions listing
scientists who are skeptical of human-caused global
warming. However, very few of the signatories on these
lists are involved in climate research. There are medical
scientists, zoologists, physicists and engineers but very
few whose area of expertise is climate science.
So what do the real experts think? Several studies have
surveyed climate scientists who are actively publishing
climate research. Each study found the same answer -
over 97% of climate experts are convinced humans are
changing global temperature.
This is confirmed by peer-reviewed research. A survey
of all peer-reviewed research on the subject ‘global
climate change’ published between 1993 and 2003
found that among the 928 papers found,
rejected the consensus position that human
activities are causing global warming.
65,66
67
not a single
paper
97 out of 100 of climate experts think
humans are causing global warming
There’s not
just a
consensus of
scientists -
there’s a
consensus of
evidence.
There’s a consensus of evidence that global
warming is happening. Thermometers and satellites
measure the same warming trend. Other signs of
warming are found all over the globe - shrinking ice
sheets, retreating glaciers, rising sea
levels and shifting seasons.
The pattern of warming shows the tell-tale
signatures of an increased greenhouse
effect. Nights are warming faster than
days. Winters are warming faster than
summers. The lower atmosphere is
warming while the upper atmosphere is
cooling.
On the question of whether humans are causing
climate change, there’s not just a consensus of
scientists - there’s a consensus of evidence.
1. Jones, G., Tett, S. & Stott, P., (2003): Causes of atmospheric temperature
change 1960-2000: A combined attribution analysis. Geophysical
Research Letters, 30, 1228
2. Laštovi , J., Akmaev, R. A., Beig, G., Bremer, J., and Emmert, J. T.
(2006). Global Change in the Upper Atmosphere. ,
314(5803):1253-1254.
3. Santer, B. D., Wehner, M. F., Wigley, T. M. L., Sausen, R., Meehl, G. A.,
Taylor, K. E., Ammann, C., Arblaster, J., Washington, W. M., Boyle, J. S.,
and Braggemann, W. (2003). Contributions of Anthropogenic and Natural
Forcing to Recent Tropopause Height Changes. , 301(5632):479-
483.
4. Harries, J. E., et al (2001). Increases in greenhouse forcing inferred from
the outgoing longwave radiation spectra of the Earth in 1970 and 1997.
, 410, 355 357.
5. Manning, A.C., Keeling, R.F. (2006). Global oceanic and land biotic carbon
sinks from the Scripps atmospheric oxygen flask sampling network. .
58:95–116
6. Alexander, L. V., Zhang, X., Peterson, T. C., Caesar, J., Gleason, B., Tank,
A. M. G. K., Haylock, M., Collins, D., Trewin, B., Rahimzadeh, F., Tagipour,
A., Kumar, K. R., Revadekar, J., Griffiths, G., Vincent, L., Stephenson, D.
B., Burn, J., Aguilar, E., Brunet, M., Taylor, M., New, M., Zhai, P., Rusticucci,
M., and Vazquez-Aguirre, J. L. (2006), Global observed changes in daily
climate extremes of temperature and precipitation.
, 111(D5):D05109+.
7. Braganza, K., D. Karoly, T. Hirst, M. E. Mann, P. Stott, R. J. Stouffer, and S.
Tett (2003), Indices of global climate variability and change: Part
I—Variability and correlation structure, , 20, 491–502.
8. Evans W. F. J., Puckrin E. (2006), Measurements of the Radiative Surface
Forcing of Climate, P1.7, AMS 18th Conference on Climate Variability and
Change.
9. Wei, G., McCulloch, M. T., Mortimer, G., Deng, W., and Xie, L., (2009),
Evidence for ocean acidification in the Great Barrier Reef of Australia,
, 73, 2332–2346.
10. Barnett, T. P., Pierce, D. W., Achutarao, K. M., Gleckler, P. J., Santer, B. D.,
Gregory, J. M., and Washington, W. M. (2005), Penetration of Human-
Induced Warming into the World's Oceans. , 309(5732):284-287.
11. Boden, T.A., G. Marland, and R.J. Andres. (2009). Global, Regional, and
National Fossil-Fuel CO Emissions. Carbon Dioxide Information Analysis
Center, Oak Ridge National Laboratory, U.S. Department of Energy, Oak
Ridge, Tenn., U.S.A. doi 10.3334/CDIAC/00001
12. IPCC, (2007). Climate Change 2007: The Physical Science Basis.
Contribution of Working Group I to the Fourth Assessment Report of the
Intergovernmental Panel on Climate Change (AR4). S. Solomon et al. eds
(Cambridge University Press, Cambridge, UK & New York, NY, USA).
13. Mandia, S. (2010), And You Think the Oil Spill is Bad?,
http://profmandia.wordpress.com/2010/06/17/and-you-think-the-oil-spill-
is-bad/
14. Tripati, A. K., Roberts, C. D., Eagle, R. A., (2009), Coupling of CO and ice
sheet stability over major climate transitions of the last 20 million years.
326 (5958), 1394-1397.
15. Swart, P. K., L. Greer, B. E. Rosenheim, C. S. Moses, A. J. Waite, A. Winter,
R. E. Dodge, and K. Helmle (2010), The 13C Suess effect in scleractinian
corals mirror changes in the anthropogenic CO inventory of the surface
oceans, , 37, L05604, doi:10.1029/2009GL041397.
16. Burch, D. E., (1970), Investigation of the absorption of infrared radiation by
atmospheric gases. , AFCRL, publication U-4784.
čka
Science
Science
Nature
Tellus
.
Journal of Geophysical
Research
Clim. Dyn.
Geochim. Cosmochim. Ac.
Science
Science
Geophys. Res. Lett.
Semi-Annual Tech. Rep.
2
2
2
17. Cuffey, K. M., and F. Vimeux (2001), Covariation of carbon dioxide and
temperature from the Vostok ice core after deuterium-excess correction,
, 412, 523–527.
18. Caillon N, Severinghaus J.P, Jouzel J, Barnola J.M, Kang J, Lipenkov V.Y
(2003), Timing of atmospheric CO and Antarctic temperature changes
across Termination III. . 299, 1728–1731.
19. Griggs, J. A., Harries, J. E. (2004). Comparison of spectrally resolved
outgoing longwave data between 1970 and present, , Vol. 5543,
164.
20. Chen, C., Harries, J., Brindley, H., & Ringer, M. (2007). Spectral signatures
of climate change in the Earth's infrared spectrum between 1970 and
2006. Retrieved October 13, 2009, from European Organisation for the
Exploitation of Meteorological Satellites (EUMETSAT) Web site:
http://www.eumetsat.eu/Home/Main/Publications/Conference_and_Works
hop_Proceedings/groups/cps/documents/document/pdf_conf_p50_s9_01
_harries_v.pdf .
Talk given to the 15th American Meteorological Society (AMS) Satellite
Meteorology and Oceanography Conference, Amsterdam, Sept 2007
21. HadCRUT3 global monthly surface air temperatures since 1850.
http://hadobs.metoffice.com/hadcrut3/index.html
22. Simmons, A. J., K. M. Willett, P. D. Jones, P. W. Thorne, and D. P. Dee
(2010), Low-frequency variations in surface atmospheric humidity,
temperature, and precipitation: Inferences from reanalyses and monthly
gridded observational data sets, , 115, D01110,
doi:10.1029/2009JD012442.
23. Hansen, J., Ruedy, R., Sato, M., Lo, K., (2010), ,
doi:10.1029/2010RG000345, in press
24. NASA GISS GLOBAL Land-Ocean Temperature Index, (2010),
http://data.giss.nasa.gov/gistemp/tabledata/GLB.Ts+dSST.txt
25. Fawcet, R., Jones, D. (2008), Waiting for Global Cooling,
, http://www.aussmc.org/documents/waiting-for-
global-cooling.pdf
26. Murphy, D. M., S. Solomon, R. W. Portmann, K. H. Rosenlof, P. M. Forster,
and T. Wong, (2009), An observationally based energy balance for the
Earth since 1950. , 114 , D17107+. Figure redrawn on
data from this paper supplied by Murphy
27. Malik, J., (1985). The Yields of the Hiroshima and Nagasaki Nuclear
Explosions, , LA-
8819.
28. Menne, M. J., C. N. Williams Jr., and M. A. Palecki (2010), On the reliability
of the U.S. surface temperature record, , 115, D11108
29. Karl, T. R., Hassol, S. J., Miller, C. D. and Murray, W. L. (2006). Temperature
Trends in the Lower Atmosphere: Steps for Understanding and
Reconciling Differences.
, Washington,
DC.
30. Velicogna, I. (2009). ‘Increasing rates of ice mass loss from the Greenland
and Antarctic ice sheets revealed by GRACE’, , 36
31. Church, J., White, N., Aarup, T., Wilson, W., Woodworth, P., Domingues, C.,
Hunter, J. and Lambeck, K. (2008), Understanding global sea levels: past,
present and future. , 3(1), 922.
32. Parmesan, C., Yohe, G. (2003), A globally coherent fingerprint of climate
change impacts across natural systems. , 421 (6918), 37-42.
33. Immerzeel, W. W., van Beek, L. P. H., and Bierkens, M. F. P. (2010). Climate
change will affect the Asian water towers, , 328(5984):1382-1385
Nature
Science
Proc. SPIE
J. Geophys. Res.
Rev. Geophys.
Australian
Science Medical Centre
J. Geophys. Res.
Los Alamos, New Mexico: Los Alamos National Laboratory
J. Geophys. Res.
A Report by the Climate Change Science
Program and the Subcommittee on Global Change Research
Geophys. Res. Lett.
Sustainability Science
Nature
Science
2
12
References
13
34. NOAA National Climatic Data Center, State of the Climate: Global Analysis
for September 2010, published online October 2010, retrieved on October
30, 2010 from http://www.ncdc.noaa.gov/bams-state-of-the-
climate/2009.php
35. Mann, M., Bradley, R. and Hughes, M. (1998), Global-Scale Temperature
Patterns and Climate Forcing Over the Past Six Centuries, ,
392:779-787
36. Etheridge, D.M., Steele, L.P., Langenfelds, R.J., Francey, R.L., Barnola, J.-
M. and Morgan, V.I. (1998), Historical CO records from the Law Dome
DE08, DE08-2, and DSS ice cores. In Trends: A Compendium of Data on
Global Change. Carbon Dioxide Information Analysis Center, Oak Ridge
National Laboratory, U.S. Department of Energy, Oak Ridge, Tenn., U.S.A.
37. Tans, P., (2009), Trends in Atmospheric Carbon Dioxide - Mauna Loa,
NOAA/ESRL. www.esrl.noaa.gov/gmd/ccgg/trends.
38. Crowley, T.J., (2000), Causes of Climate Change Over the Past 1000
Years, IGBP PAGES/World Data Center for Paleoclimatology Data
Contribution Series #2000-045. NOAA/NGDC Paleoclimatology Program,
Boulder CO, USA.
39. Moberg, A., et al. (2005), 2,000-Year Northern Hemisphere Temperature
Reconstruction. IGBP PAGES/World Data Center for Paleoclimatology
Data Contribution Series # 2005-019. NOAA/NGDC Paleoclimatology
Program, Boulder CO, USA.
40. Mann, M., Zhang, Z., Hughes, M., Bradley, R., Miller, S., Rutherford, S. and
Ni, F. (2008), Proxy-based reconstructions of hemispheric and global
surface temperature variations over the past two millennia,
, 105(36):13252-13257
41. Knutti, R., Hegerl, G. C., (2008), The equilibrium sensitivity of the earth's
temperature to radiation changes. , 1 (11), 735-743.
42. Lacis, A. A., Schmidt, G. A., Rind, D., and Ruedy, R. A., (2010).
Atmospheric CO2: Principal Control Knob Governing Earth's Temperature.
Science, 330(6002):356-359
43. Wang, K., Liang, S., (2009), Global atmospheric downward longwave
radiation over land surface under all-sky conditions from 1973 to 2008.
, 114 (D19).
44. Lindzen, R. S., and Y.-S. Choi (2009), On the determination of climate
feedbacks from ERBE data, , 36, L16705,
doi:10.1029/2009GL039628.
45. Trenberth, K. E., J. T. Fasullo, C. O'Dell, and T. Wong (2010), Relationships
between tropical sea surface temperature and top-of-atmosphere
radiation, Geophys. Res. Lett., 37, L03702, doi:10.1029/2009GL042314.
46. Murphy, D. M. (2010), Constraining climate sensitivity with linear fits to
outgoing radiation, Geophys. Res. Lett., 37, L09704,
doi:10.1029/2010GL042911.
47. Chung, E.-S., B. J. Soden, and B.-J. Sohn (2010), Revisiting the
determination of climate sensitivity from relationships between surface
temperature and radiative fluxes, Geophys. Res. Lett., 37, L10703,
doi:10.1029/2010GL043051.
48. Challinor, A. J., Simelton, E. S., Fraser, E. D. G., Hemming, D., and Collins,
M., (2010). Increased crop failure due to climate change: assessing
adaptation options using models and socio-economic data for wheat in
China. , 5(3):034012+.
49. Tubiello, F. N., Soussana, J.-F., and Howden, S. M. (2007). Crop and
pasture response to climate change.
, 104(50):19686-19690.
50. Zhao, M. and Running, S. W. (2010). Drought-Induced Reduction in Global
Terrestrial Net Primary Production from 2000 Through 2009. ,
329(5994):940-943.
51. University Corporation for Atmospheric Research.
http://www2.ucar.edu/news/2904/climate-change-drought-may-threaten-
much-globe-within-decades
Nature
Proceedings of
the National Academy of Sciences
Nature Geoscience
Journal of Geophysical Research
Geophys. Res. Lett.
Environmental Research Letters
Proceedings of the National
Academy of Sciences
Science
2
52. Thomas, C. D. et al. (2004), Extinction risk from climate change. ,
427: 145/148.
53. Hoegh-Guldberg, O., Mumby, P. J., Hooten, A. J., Steneck, R. S.,
Greenfield, P., Gomez, E., Harvell, C. D., Sale, P. F., Edwards, A. J.,
Caldeira, K., Knowlton, N., Eakin, C. M., Iglesias-Prieto, R., Muthiga, N.,
Bradbury, R. H., Dubi, A., and Hatziolos, M. E. (2007), Coral Reefs Under
Rapid Climate Change and Ocean Acidification. Science, 318(5857):1737-
1742.
54. Hoegh-Guldberg, O. & Bruno, J. (2010). Impacts of climate change on the
world's marine ecosystems. , 328, 1523-1528.
55. Tibbets, J. (2004). The State of the Oceans, Part 1. Eating Away at a
Global Food Source. , 112(5):A282-
A291
56. Dasgupta, S., Laplante, B., Meisner, C., Wheeler, D. and Yan, J. (2007) The
impact of sea-level rise on developing countries: a comparative analysis,
World Bank Policy Research Working Paper No 4136, February
57. Willis, P., Blackman-Woods, R., Boswell, T., Cawsey, I., Dorries, N., Harris,
E., Iddon, B., Marsden, G., Naysmith, D., Spink, B., Stewart, I., Stringer, G.,
Turner, D. and Wilson, R. (2010), The disclosure of climate data from the
Climatic Research Unit at the University of East Anglia,
, see:
http://www.publications.parliament.uk/pa/cm200910/cmselect/cmsctech/3
87/387i.pdf
58. Oxburgh, R. (2010), Report of the International Panel set up by the
University of East Anglia to examine the research of the Climatic Research
Unit, see:
http://www.uea.ac.uk/mac/comm/media/press/CRUstatements/SAP
59. Russell, M., Boulton, G., Clarke, P., Eyton, D. and Norton, J. (2010), The
Independent Climate Change E-mails Review. See: http://www.cce-
review.org/pdf/FINAL%20REPORT.pdf
60. Foley, H., Scaroni, A., Yekel, C. (2010), RA-10 Inquiry Report: Concerning
the Allegations of Research Misconduct Against Dr. Michael E. Mann,
Department of Meteorology, College of Earth and Mineral Sciences, The
Pennsylvania State University. See
http://theprojectonclimatescience.org/wp-
content/uploads/2010/04/Findings_Mann_Inquiry.pdf
61. Secretary of State for Energy and Climate Change, (2010). Government
Response to the House of Commons Science and Technology Committee
8th Report of Session 2009-10: The disclosure of climate data from the
Climatic Research Unit at the University of East Anglia. See
http://www.official-documents.gov.uk/document/cm79/7934/7934.pdf
62. Assmann, S., Castleman, W., Irwin, M., Jablonski, N., Vondracek, F.,
(2010). RA-1O Final Investigation Report Involving Dr. Michael E, Mann.
See
http://live.psu.edu/fullimg/userpics/10026/Final_Investigation_Report.pdf
63. Jacoby, G. and D'Arrigo, R. (1995), Tree ring width and density evidence of
climatic and potential forest change in Alaska, Glob. Biogeochem. Cycles,
9:22734
64. Mears, C., Wentz, F. (2009), Construction of the Remote Sensing Systems
V3.2 atmospheric temperature records from the MSU and AMSU
microwave sounders. , 26: 1040-1056.
65. Doran, P. and Zimmerman, M. (2009), Examining the Scientific Consensus
on Climate Change, , 90(3)
66. Anderegg, W., Prall, J., Harold, J. and Schneider, S. (2010), Expert
credibility in climate change.
, 107(27):12107-12109
67. Oreskes, N. (2004), Beyond the ivory tower: the scientific consensus on
climate change, , 306:1686
68. Braganza, K., D. J. Karoly, A. C. Hirst, P. Stott, R. J. Stouffer, and S. F. B.
Tett (2004), Simple indices of global climate variability and change: Part II:
Attribution of climate change during the twentieth century, , 22,
823– 838, doi:10.007/s00382-004-0413-1
Nature
Science
Environmental Health Perspectives
House of
Commons Science and Technology Committee
J. Atmos. Ocean. Tech.
Eos Trans. AGU
Proceedings of the National Academy of
Sciences
Science
Clim. Dyn.
For more information, visit:
SkepticalSciencewww.skeptical .comscience
The case for human-caused global warming is based on many
independent lines of evidence. Global warming ‘skepticism’ often
focuses on narrow pieces of the puzzle while denying the full body
of evidence.
Our climate is changing and we are the major cause through our
emissions of greenhouse gases. The facts about climate change
are essential to understand the world around us, and to make
informed decisions about the future.