scoping exercise to support sustainable urban sanitation
TRANSCRIPT

Scoping Exercise to Support Sustainable Urban Sanitation in TN: Primary Study Report | March 2016 i
Scoping Exercise to Support Sustainable Urban Sanitation in Tamil Nadu PRIMARY STUDY REPORT
March 2016


Scoping Exercise to Support Sustainable Urban Sanitation in TN: Primary Study Report | March 2016 iii
Scoping Exercise to Support Sustainable
Urban Sanitation in Tamil Nadu
PRIMARY STUDY REPORT
March 2016

Scoping Exercise to Support Sustainable Urban Sanitation in TN: Primary Study Report | March 2016 iv
For Citation: TNUSSP, 2016. Scoping Exercise to Support Sustainable Urban Sanitation
in Tamil Nadu, Primary Study Report
DOI: https://doi.org/10.24943/tnusspv1.03.2016
This document is produced as part of Tamil Nadu Urban Sanitation Support Programme (TNUSSP).
TNUSSP supports the Government of Tamil Nadu (GoTN) and cities in making improvements along
the entire urban sanitation chain. The TNUSSP is being implemented by a consortium of organisations
led by the Indian Institute for Human Settlements (IIHS), in association with CDD Society, Gramalaya,
and Keystone Foundation.
Document Team: Chaya Ravishankar, Devi Kalyani, Geetika Anand, Krishnagopal, Rajiv Raman,
Shivaram K.N.V., Vishnu M.J.
Editing: Word Lab, IIHS, Bengaluru
Production: Shaheena Manoj, Krishnapriyaa P., Govardhan Seshachalam
Team Leader: Kavita Wankhade
Project Director: Somnath Sen
1. CC license terms: This research and data has been published under the Creative Commons
Attribution 4.0 license. Under the aforementioned license, you are free to:
Share — copy and redistribute the material in any medium or format
Adapt — remix, transform, and build upon the material for any purpose, even commercially.
This license is acceptable for Free Cultural Works. The licensor cannot revoke these freedoms as long
as you follow the license terms.
Under the following terms:
Attribution — you must give appropriate credit, provide a link to the license, and indicate if changes
were made. You may do so in any reasonable manner, but not in any way that suggests the licensor
endorses you or your use.
No additional restrictions — you may not apply legal terms or technological measures that legally restrict
others from doing anything the license permits.
Notices:
You do not have to comply with the license for elements of the material in the public domain or where
your use is permitted by an applicable exception or limitation. No warranties are given. The license may
not give you all of the permissions necessary for your intended use. For example, other rights such as
publicity, privacy, or moral rights may limit how you use the material.
2. BMGF funding acknowledgement: This Research / Work was supported by Bill & Melinda Gates
Foundation.
3. Logo use: ''The IIHS logo, name and all graphics on the IIHS website are trademarks of IIHS. Use,
reproduction, copying or redistribution of trademarks, without the written permission of IIHS is
prohibited. All other trademarks marks or service marks appearing on this report are the marks of their
respective owners.''
www.tnussp.co.in | www.iihs.co.in
Scoping Exercise to Support Sustainable Urban Sanitation in TN: Primary Study Report | March 2016 v
Table of Contents
Abbreviations…………………………………………………………………………………………………….V
1 Study Background ................................................................................................................................ 1
1.1 Urban Sanitation in Tamil Nadu .............................................................................................. 3
1.2 Project Objectives and Scope of Work ................................................................................... 3
1.3 Scope and Structure of this Document ................................................................................... 4
1.4 Scoping and Limitations .......................................................................................................... 7
2 City Profile of Pammal .......................................................................................................................... 9
2.1 Location of Pammal .............................................................................................................. 11
2.1.1 Location and Regional Context ..................................................................................... 11
2.1.2 Linkages and Connectivity ............................................................................................ 11
2.1.3 Physiography and Topology .......................................................................................... 12
2.2 Demographic and Socio-Economic Profile of Pammal ......................................................... 13
2.2.1 Population and Growth .................................................................................................. 13
2.2.2 Literacy and Education .................................................................................................. 13
2.2.3 Social Composition........................................................................................................ 13
2.2.4 Workforce Participation ................................................................................................. 13
2.3 In-city Transportation ............................................................................................................ 14
2.4 Settlement Patterns, Housing and Slums ............................................................................. 14
2.4.1 Settlement pattern and Housing Typologies ................................................................. 14
2.4.2 Slums ............................................................................................................................ 17
3 Urban Environmental Services in Pammal ........................................................................................ 20
3.1 Water Supply ......................................................................................................................... 22
3.1.1 Household Arrangements ............................................................................................. 22
3.1.2 Household Arrangements for potable water ................................................................. 22
3.1.3 Household Arrangements for non-potable water .......................................................... 24
3.1.4 Water Tariffs .................................................................................................................. 28
3.2 Sanitation .............................................................................................................................. 29
3.2.1 Household Arrangements ............................................................................................. 29
3.2.2 Household Arrangements in Study households ............................................................ 30
3.2.3 Types of Septic Tanks ................................................................................................... 32
3.2.4 Transportation of Septage ............................................................................................. 38
3.2.5 Treatment of Septage ................................................................................................... 39
3.3 Solid Waste Management ..................................................................................................... 40
3.4 Storm Water Drainage .......................................................................................................... 42
4 Profile of the Town Panchayats ......................................................................................................... 45
4.1 Location of Town Panchayats Cluster .................................................................................. 47

Scoping Exercise to Support Sustainable Urban Sanitation in TN: Primary Study Report | March 2016 vi
4.1.1 Location and Regional Context ..................................................................................... 47
4.1.2 Linkages and Connectivity ............................................................................................ 48
4.1.3 Physiography and Topology .......................................................................................... 48
4.2 Demographic and Socio-Economic Profile of Town Panchayats .......................................... 48
4.2.1 Population and Growth .................................................................................................. 48
4.2.2 Literacy and Education .................................................................................................. 49
4.2.3 Social Composition........................................................................................................ 49
4.2.4 Workforce Participation ................................................................................................. 50
4.3 Connectivity and Transportation ........................................................................................... 50
4.3.1 Public Transport System ............................................................................................... 50
4.3.2 Individual Transport System .......................................................................................... 50
4.4 Housing and Slums ............................................................................................................... 50
4.4.1 Housing ......................................................................................................................... 50
4.4.2 Slums ............................................................................................................................ 52
5 Urban Environmental Services in Selected Town Panchayat Cluster in Coimbatore........................ 53
5.1 Water Supply ......................................................................................................................... 55
5.1.1 Household Arrangements for Water Supply ................................................................. 55
5.1.2 Arrangements for potable water .................................................................................... 56
5.1.3 Arrangements for non-potable water............................................................................. 57
5.1.4 Water Tariffs .................................................................................................................. 58
5.2 Sanitation .............................................................................................................................. 58
5.2.1 Household Arrangements for Sanitation ....................................................................... 58
5.2.2 Household Arrangements in Study Households ........................................................... 59
5.2.3 On-site systems ............................................................................................................. 60
5.2.4 Transportation of Septage in Study TPs ....................................................................... 68
5.2.5 Treatment of Septage ................................................................................................... 68
5.3 Solid Waste Management ..................................................................................................... 71
5.4 Storm Water Drainage .......................................................................................................... 73
6 Conclusions ....................................................................................................................................... 77
Bibliography .......................................................................................................................................... 79

Scoping Exercise to Support Sustainable Urban Sanitation in TN: Primary Study Report | March 2016 vii
List of Tables
Table 1-1: Distribution of Study Households across building types and sanitation arrangements:
Pammal ................................................................................................................................................... 4
Table 1-2: Distribution of Study households across various building typologies and sanitation
arrangements: Coimbatore TPs. ............................................................................................................. 5
Table 2-1 Decadal Population Growth Rates of Pammal and surrounding towns ................................ 13
Table 2-2 List of Slums in Pammal ....................................................................................................... 17
Table 3-1 Comparison of Water Supply Arrangements in Pammal, Urban TN & Urban India ............. 22
Table 3-2 Location of source of drinking water – Pammal and urban Tamil Nadu ............................... 22
Table 3-3 Water Storage Infrastructure and Distribution in Pammal .................................................... 25
Table 3-4 Water Supply Connection Costs in Pammal ......................................................................... 28
Table 3-5 : Comparison of Sanitation Arrangements between Pammal, Urban TN & Urban India ...... 30
Table 3-6 : Types of septic tanks .......................................................................................................... 32
Table 3-7 : Design Norms vs Construction in Practice of Septic tanks................................................. 35
Table 3-8 : Summary of on-site systems observed through household survey .................................... 37
Table 3-9 : Summary of construction practice by builders and masons ............................................... 37
Table 4-1 Population of Studied Town Panchayats .............................................................................. 49
Table 4-2 Population Growth in Periyanaicken-palayam & Narsimhanaicken-palayam....................... 49
Table 5-1 Comparison of Water Supply arrangements in TPs, Urban TN & Urban India .................... 55
Table 5-2 Location of water supply in TPs in comparison with Urban TN ............................................ 56
Table 5-3 Water Storage Infrastructure and Distribution in Periyanaicken-palayam ............................ 56
Table 5-4 Water Supply Connection Costs in TPs ............................................................................... 58
Table 5-5 : Types of On-site systems ................................................................................................... 61
Table 5-6 : Illustration and Description of Type of Septic Tanks .......................................................... 61
Table 5-7 : Design Norms vs Construction in Practice of Septic tanks................................................. 63
Table 5-8 : Cost Abstract of DPR for Septage Management Proposed by TWAD Board .................... 70
Table 5-9 Snapshot of Solid Waste Management in TPs ..................................................................... 72
List of Figures
Figure 2-1 Location of Pammal Town- .................................................................................................. 11
Figure 3-1 Source of water in Slums ..................................................................................................... 28
Figure 3-2: Household Sanitation Arrangements in Pammal................................................................ 29
Figure 3-3: Illustration and Description of Type of Septic Tanks .......................................................... 33
Figure 4-1 Location of Town Panchayats ............................................................................................. 47
Figure 4-2 Kurudi Hill Range on the western side of the TP cluster ..................................................... 48
List of Annexures Annexure 1 Instruments for Primary Study ...........................................................................................A3
Annexure 2 Note on Selection Criteria for Studies Towns ..................................................................A52
Annexure 3 Data Tables for Pammal ..................................................................................................A54
Annexure 4 Data Tables for Town Panchayats ..................................................................................A62

Scoping Exercise to Support Sustainable Urban Sanitation in TN: Primary Study Report | March 2016 viii
List of Plates
Plate 2-1 Chengaluneermalai hill on the western side of Pammal Town ............................................. 12
Plate 2-2 Settlement pattern and Photographs of the low & middle income housing .......................... 15
Plate 2-3 Settlement pattern and Photographs of the high income housing ....................................... 16
Plate 2-4 Settlement pattern and Photographs of the urban poor ....................................................... 17
Plate 3-1 Public Stand Posts delivering drinking water in Pammal ...................................................... 23
Plate 3-2: Mini Power Pumps for Non-potable Water in Pammal ......................................................... 24
Plate 3-3 Hand Pumps in Pammal ........................................................................................................ 25
Plate 3-4: Shankar Nagar OHT (0.3 MLD) in Pammal .......................................................................... 26
Plate 3-5: Shared Toilet in Pammal ...................................................................................................... 30
Plate 3-6: Typical Household Septic Tank in Pammal .......................................................................... 36
Plate 3-7: Vehicles used for solid waste collection in Pammal ............................................................. 40
Plate 3-8: Biomethanation plant for treatment of food waste in Pammal .............................................. 41
Plate 3-9: Drain cleaning by sanitary worker in Pammal ...................................................................... 41
Plate 3-10: Thirupunanthal Lake in Pammal ......................................................................................... 42
Plate 3-11: Main Storm Water Drains in Pammal ................................................................................. 42
Plate 3-12: Surface Storm Water Drains in Pammal ............................................................................ 43
Plate 4-1 Housing typologies in Town Panchayats ............................................................................... 51
Plate 4-2 Urban poor house typology in Town Panchayats .................................................................. 52
Plate 5-1 Public Stand Posts delivering drinking water in Anna Nagar ................................................ 57
Plate 5-2 Twin Pit System in Periyanaicken-palayam .......................................................................... 63
Plate 5-3 Various Septic Tanks observed in the Town Panchayats ..................................................... 65
Plate 5-4 Cess pits in TPs ..................................................................................................................... 66
Plate 5-5 Cess-Pool Vehicle operating in Idigarai ................................................................................ 68
Plate 5-6 Land Application of Septage in Farm Lands as Soil Conditioner in Periyanaicken-palayam 69
Plate 5-7 Flow Diagram proposed in Septage Management DPR ....................................................... 69
Plate 5-8 Vehicles used for solid waste collection in TPs ..................................................................... 71
Plate 5-9 Solid Waste Management sites in TPs .................................................................................. 72
Plate 5-10 Main Constructed Storm Water Drains in Periyanaicken-palayam and Narsimhanaicken-
palayam ................................................................................................................................................. 73
Plate 5-11 Surface Storm Water Drains in TPs .................................................................................... 74
List of Maps
Map 1 Location of Slums in Pammal .................................................................................................... 19
Map 2: Water Zones and Water Storage Infrastructure ........................................................................ 27
Map 3: Storm Water Drainage Pattern & Coverage of Constructed Drains in Pammal ....................... 44

Scoping Exercise to Support Sustainable Urban Sanitation in TN: Primary Study Report | March 2016 ix
Abbreviations
BMGF Bill and Melinda Gates Foundation
BSUP Basic Services to Urban Poor
CMA Commissionerate of Municipal Administration
CMWSSB Chennai Metro Water Supply and Sewerage Board
CPHEEO Central Public Health Environmental Engineering Organization
CRPF Central Reserve Police Force
CWSS Combined Water Supply Scheme
DTP Directorate of Town Panchayats
DTCP District Town and Country Planning
EO Executive Officer
GO Government Order
GoTN Government of Tamil Nadu
HH Household
IIHS Indian Institute for Human Settlements
ITI Industrial Training Institute
LPA Local Planning Authority
MLD Million Liters per Day
MoC Memorandum of Cooperation
MoUD Ministry of Urban Development
MT Metric Tonne
NH National Highway
NUSP National Urban Sanitation Policy
OD Open Defecation
OHT Over Head Tank
PSP Public Stand Post
PVC Poly Vinyl Chloride
RCC Reinforced Cement Concrete
RO Reverse Osmosis
STP Sewage Treatment Plant
SWM Solid Waste Management
TN Tamil Nadu
TNCWW Tamil Nadu Construction Workers Welfare (Board)
TP Town Panchayat
TWAD Tamil Nadu Water and Drainage (Board)
ULB Urban Local Body
WPR Workforce Participation Rati


1Study
Background1.1 Urban Sanitation in Tamil Nadu 3
1.2 Project Objectives and Scope of Work 3
1.3 Scope and Structure of this Document 4
1.4 Scoping and Limitations 7


Scoping Exercise to Support Sustainable Urban Sanitation in TN: Primary Study Report | March 2016 3
1 Study Background 1.1 Urban Sanitation in Tamil Nadu
Urban settlements in India are grappling with the challenge of severe deficits along the “full sanitation
chain”. While public systems in India have historically hailed sewerage as the sole solution for urban
households, it is a fact that nearly two-thirds of urban households depend on on-site systems, i.e. septic
tanks and pit latrines (Census of India, 2011a). Adequate attention needs to be paid to comprehensive
management of human excreta, whether sewage or septage, if the deficits of urban sanitation in India
are to be addressed. This has been highlighted in India’s National Urban Sanitation Policy (MoUD,
2008), the draft advisory and policy on Septage Management issued by the MoUD, and in the Septage
Management Operative Guidelines issued by the Govt. of Tamil Nadu (GoTN, 2014a).
Taking due cognisance of the predominance of on-site sanitation systems in the State, the Government
of Tamil Nadu (GoTN) committed to improving urban sanitation in mission mode, and issued the
Operative Guidelines for Septage Management across the State in September, 2014. These guidelines
underlined the importance of standardizing the design and construction of septic tanks, instituting
standard operating procedures for collection and transportation of septage, and implementing possible
co-treatment options at the existing under-utilized sewage treatment plants, apart from creating new
infrastructure and systems for comprehensive septage management.
The Bill & Melinda Gates Foundation (BMGF) came forward to assist the GoTN in developing and
implementing sustainable sanitation solutions for urban Tamil Nadu. The objectives of the Tamil Nadu
Sanitation Mission include elimination of open defecation; safe containment, treatment, and disposal of
human excreta, so that public health, hygiene and dignity can be achieved for urban households and
urban areas in the state. The BMGF signed a Memorandum of Cooperation (MoC) with GoTN for the
same, in August, 2015.
With a view to scope the tasks that need to be carried out under the TN Sanitation Mission, including
identification of the institutional arrangements and capacities required, the IIHS were commissioned to
carry out a scoping exercise (study). This scoping study comprises a secondary review, supplemented
with primary data collection in select urban areas, and the conduct of consultations with identified
stakeholders; to understand better the situation of sanitation in the urban areas of the State. The State-
level analyses are supplemented with primary studies and consultations in two urban locations in the
State: a town panchayat cluster, and a municipality.
This is the report for primary study conducted in Pammal Municipality and two Town Panchayats of
Periyanaicken-palayam and Narsimhanaicken-palayam in Coimbatore District in Tamil Nadu. It
provides a brief profile of these urban locations, with a focus on urban sanitation and water. This study
is based primarily on the primary data collection carried out by the IIHS team in 2015, supplemented by
secondary sources like Census.
1.2 Project Objectives and Scope of Work
The objectives of the project are:
• Carrying out a situational analysis of urban sanitation in Tamil Nadu (TN).
• Conducting an institutional, financial and legal analysis for sustainable urban sanitation solutions in Tamil Nadu State (and two pilot urban areas).
• Landscaping of key stakeholders, supporters, potential partners for the government’s efforts and ongoing initiatives on urban sanitation in TN.
• Facilitating engagement with relevant stakeholders, including, but not restricted to, government officials and community groups.
• Facilitating exposure visits to successful examples of FSM in similar contexts.

Scoping Exercise to Support Sustainable Urban Sanitation in TN: Primary Study Report | March 2016 4
• Develop recommendations for high level interventions by the Technical Support Unit that is going to be established by the Govt. of Tamil Nadu.
Building upon secondary study, primary study was be carried out in selected two locations to gain an in-depth understanding of the current arrangements and practices for the full-chain of sanitation- ranging from design and construction practices of on-site sanitation systems to septage collection and waste disposal. This included in-depth interviews with select households, masons and contractors, private business operators, as well as government officials. In addition, an in-depth institutional and financial analysis will be conducted including detailed stakeholder mapping.
1.3 Scope and Structure of this Document
For the Primary Study, the dimensions investigated for the two urban locations, were:
• Different types of toilets, collection / containment structures, and disposal/treatment systems in
the two locations, across different settlement types or housing typology
• Decision making process of constructing latrines with septic tanks or other on-site sanitation
systems
• Perceptions on functioning of septic tanks and their cleaning 0r de-sludging
• Frequency of de-sludging and expenditure incurred on cleaning the septic tanks
• Concerns or issues of respondents in respect of sanitation and other environmental conditions
First, based on secondary data, and reconnaissance, the team mapped identified the different types of
settlement and housing typologies. From each of the significant typologies, different types of household
and neighbourhood sanitation arrangements were sought to be covered.
In doing so, a purposive sampling was adopted for choosing study respondents, spread across different
on-site sanitation arrangements located in the relevant housing typologies.
The Primary Study used a mix of a map-based reconnaissance, discussions with selected household
respondents, and other stakeholders in the Study locations. In addition, observations and
documentation of built structures and systems was also undertaken. A semi-structured questionnaire
and a direct observation schedule were used.
Household Sanitation Arrangements across Housing Typologies Covered
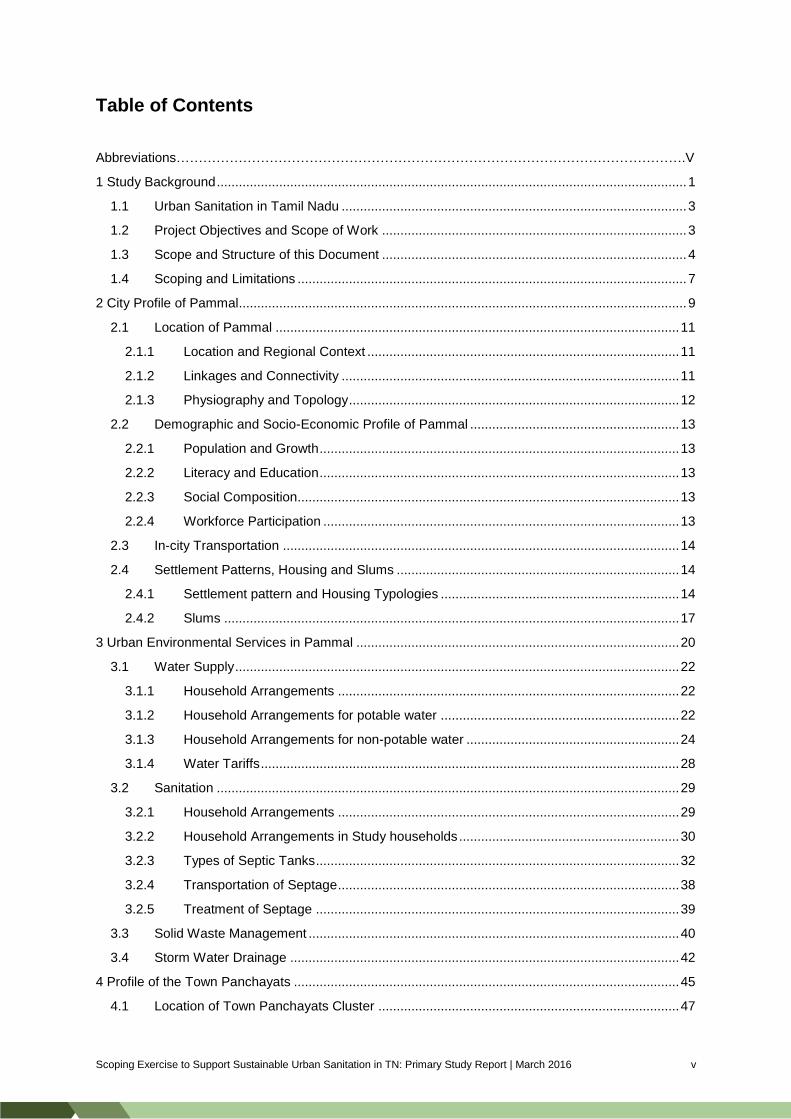
Table 1-1 presents the distribution of canvassed households across household typologies and with
different household sanitation arrangements in Pammal.
Table 1-1: Distribution of Study Households across building types and sanitation arrangements: Pammal
Sl. No.
Housing Typology
No. of
HHs Area Name
Ward No.
Sanitation Arrangements
01 Independent houses/villas
2 Pasumpon Nagar
6
Individual Household Latrine, Septic tank connected to soak pit
latrine and Septic tank
02 Multi-storey Apartments
1 Shankar Nagar
1 Individual Household Latrine, Septic tank connected to soak pit
Scoping Exercise to Support Sustainable Urban Sanitation in TN: Primary Study Report | March 2016 5
Table 1-1: Distribution of Study Households across building types and sanitation arrangements: Pammal
Sl. No.
Housing Typology
No. of
HHs Area Name
Ward No.
Sanitation Arrangements
03 Plotted development
2 Shankar Nagar
1 Individual Household Latrine, Septic tank connected to soak pit
04 Row housing with no side setbacks
2 Jagajeevan Ram Street
7 Individual Household Latrine, Septic tank
05 Low income houses
4
Shivshankaran Street
7
Individual Household Latrine, Septic tank
Individual Household Latrine, without Septic tank (Only Soak Pits)
Thiruvallur Street
5
Access to shared toilet (3 to 4 HHs)
Access to public toilet
06 Government Housing (BSUP)
1 Thiruvallur Street
5 Individual household toilet, Septic tank
07 Slums 4 Rajiv Gandhi Nagar, Fathima Nagar
1 Open Defecation
Source: IIHS Primary Study, 2015
The sample comprised respondents from diverse occupations including government service,
entrepreneurs, wage labour, etc. With an average household size of five members, 12 respondent
households owned the plot of land of which three houses were built 30 to 35 years ago and four houses
were built in the range of 4 years to 12 years. Respondents included five men and 8 women.
Table 1-2 presents the distribution of canvassed households across household typologies and with
different household sanitation arrangements in the Coimbatore Town Panchayats.
Table 1-2: Distribution of Study households across various building typologies and sanitation arrangements: Coimbatore TPs.
Sl. No.
Housing Typology
Name of the Town
No. of HHs
studied Area Name
Ward No
Sanitation Arrangements
01 Independent houses/villas
Periyanaicken-palayam
2
Seerkali Amman koil street,
4 Twin Pit latrine
JadalNaidu street 15 Twin Pit latrine

Scoping Exercise to Support Sustainable Urban Sanitation in TN: Primary Study Report | March 2016 6
Table 1-2: Distribution of Study households across various building typologies and sanitation arrangements: Coimbatore TPs.
Sl. No.
Housing Typology
Name of the Town
No. of HHs
studied Area Name
Ward No
Sanitation Arrangements
Narsimhanaicken-palayam
2 Ramaswamy Nagar,Surya Nagar
9 & 2 With latrine and cess pit
Idigarai 1 RamanujaNagar, 2nd street
- With latrine and septic tank
02 Multi-storey Apartments
Periyanaicken-palayam
1 - 1
With Latrine and Septic tank connected to soak pit
03 Plotted development
Periyanaicken-palayam
2 Ranganathapuram 13
With Latrine and Septic tank connected to soak pit
Narsimhanaicken-palayam
1 Priya Garden - With latrine and septic tank
04
Row housing near the storm water drain
Periyanaicken-palayam
2 Annanagar 7 Public toilets
05 Low income houses
Periyanaicken-palayam
1 Seerkali amman koil street 2
4
Earlier Open Defecation, built toilet one year ago
06 Government Housing (BSUP)
Periyanaicken-palayam
1 Kasthuri palyam 13 With latrine and septic tank
Idigarai 1 Amman colony - Open defecation
07 Slums
Periyanaicken-palayam
4
Vivekanandapuram
1 Open defecation
Veerapandi (No. 4)
2 Nandawana Nagar, Devinagar
6,10 Public toilets
Source: IIHS Primary Study , 2015
The sample from households comprised of people from diverse occupation like software engineer,
labourer, landlord, and driver, a maintenance manager of multi storey apartment and majorly employees
of LMW and Pricol industries in Periyanaicken-palayam.
The average household size was 5; one low income household in Periyanaicken-palayam has 9
members in the family. In comparison with households with latrines, Open defecation households tend
to be younger, have more children, include more female-headed households, and have less education.
The team interacted with an equal number of male and female respondents.

Scoping Exercise to Support Sustainable Urban Sanitation in TN: Primary Study Report | March 2016 7
Other Respondents Covered
In both the locations, the team interacted with the following other respondents to collect information on
sanitation:
a) Municipal Officers: from Pammal Municipality and four Town Panchayats in Coimbatore, were
consulted. In addition to the Executive Officers and Elected representatives from these ULBs,
the team also interacted with ULB staff, including engineers, sanitary workers, and other staff
involved to sanitation, health and related positions.
b) Cesspool Vehicle Operator: The team interacted with a private cesspool vehicle operator,
operating in and around Pammal. In addition, the team met with representatives from Cesspool
Operators’ Federation based out of Coimbatore, and active in the Town Panchayats.
c) Builders and developers: In both the locations, the team interacted with builders who had
executed housing projects ranging from small independent houses to multi-storeyed
apartments and layouts, over the last two to three decades that they have been in business.
d) Masons: In both the locations, two of three masons each were interviewed . These included
those for who this is a family tradition and they are from these areas, as well in a few cases, in-
migrant masons from other States.
1.4 Scoping and Limitations
• The current field-study was a scoping exercise and hence, the interactions were structured to
understand the different salient features of sanitation structures, practices and key
stakeholders. While numbers of interactions are mentioned, these do not purport to be a
quantitative survey, and the qualitative nature of findings needs to be kept in view.
• Primary study locations were limited to two areas: near Chennai and near Coimbatore. It is
expected that a much larger number of variations in systems and practices across the full chain
of sanitation, will be observable once the inquiry is expanded across the State. Even in these
two locations though, a large number of interesting practices have been captured. Some
generic lessons and challenges can be extracted from these.
• While there is information available from Census and NFHS on physical availability of toilets,
there is little information even with ULBs, on de-sludging, conveyance and treatment. These
aspects need a comprehensive baseline survey to be conducted.
• The current Study was able to commence the process of consulting masons, builders, de-
sludging operators, and other private and non-government agencies involved in urban
sanitation in the State, the findings may be treated with caution as detailed discussions are
needed to generate options for resolution of some of the difficult issues in practice, e.g. in
respect of regulation without adequate infrastructure for deposition of septage, and so on.


2City Profile
of Pammal2.1 Location of Pammal 11
2.2 Demographic and Socio-Economic
Profile of Pammal13
2.3 In-city Transportation 14
2.4 Settlement Patterns, Housing and Slums 12


Scoping Exercise to Support Sustainable Urban Sanitation in TN: Primary Study Report | March 2016 11
2 City Profile of Pammal 2.1 Location of Pammal
2.1.1 Location and Regional Context
Pammal is located in Kancheepuram district of Tamil Nadu. It is adjacent to the Chennai International
Airport and is considered a suburb of Chennai. The town is located next to NH45, which connects
Chennai to Tiruchirapalli in the south.
Figure 2-1 Location of Pammal Town
Source:(Wikipedia, 2016) and (Map, 2016)
2.1.2 Linkages and Connectivity
Being located next to Chennai, Pammal is well-connected by Road, Rail, and air transport. The town
falls between Chennai Bypass Road on the west and Tiruchi Chennai Highway (Irumbiliyur-Muduchur-
Oragadam Road) on the east. Pammal Main Road running across the town connects these two
highways and the settlements further west, including Periyapanicheri and Kovur. The Tiruneermalai
Scoping Exercise to Support Sustainable Urban Sanitation in TN: Primary Study Report | March 2016 12
Road on the southern part of the town, connects Pammal to the popular Ranganatha Temple situated
on the Tiruneermalai hill.
Pammal is very well connected with busses to surrounding areas like Pallavaram, Anakaputhur,
Tiruneermalai and Pozhichalur. The closest railway station to Pammal is the Pallavaram Railway
Station, local trains connecting Chennai and its sub-urban areas and trains going towards
Kancheepuram and further south, can be accessed here. Pammal is just 7 km away from the Chennai
International Airport operating flights to various parts in India and around the world.
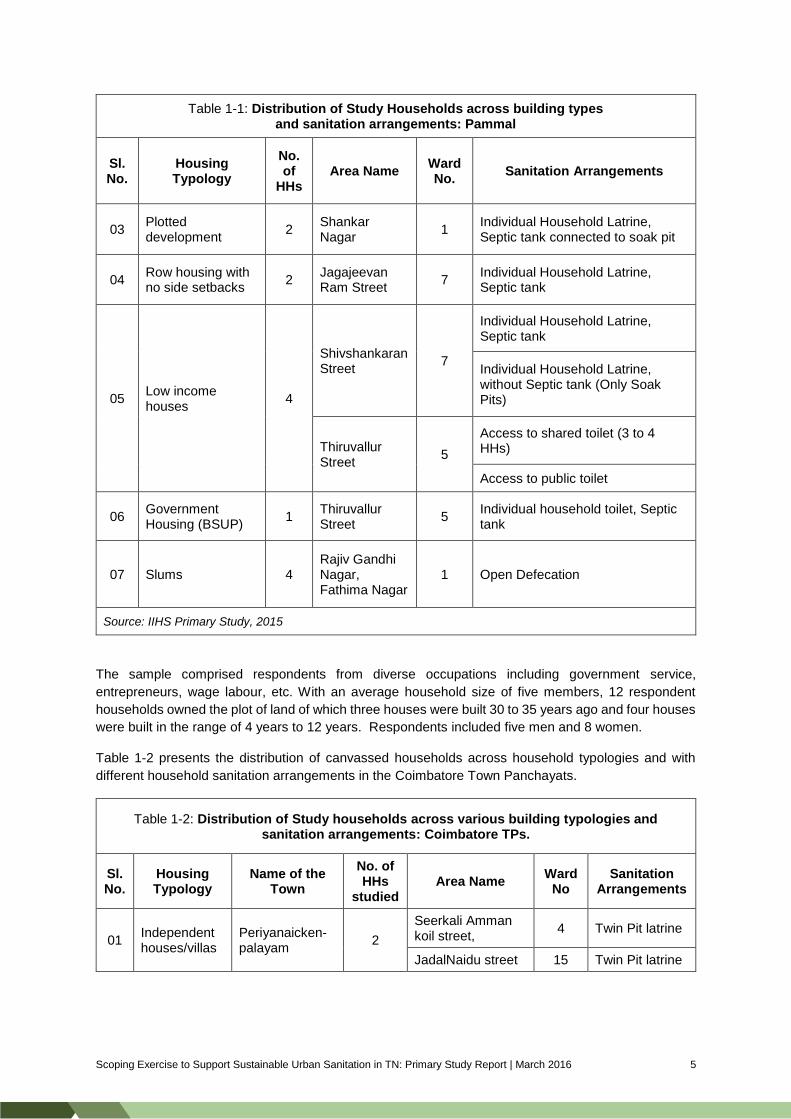
2.1.3 Physiography and Topology
Pammal town is mostly flat with a minimal slope. The areas close to the Chengaluneermalai hill are at
a higher altitude.
Plate 2-1 Chengaluneermalai hill on the western side of Pammal Town
Source: Photo - IIHS Primary Study, 2015, Map - Pammal Municipality

Scoping Exercise to Support Sustainable Urban Sanitation in TN: Primary Study Report | March 2016 13
2.2 Demographic and Socio-Economic Profile of Pammal
2.2.1 Population and Growth The Census of India, 2011 reported the population of Pammal to be 75,870 (about 19,000 households),
and its geographical area as 13.8 sq. km (Census, 2011). The town has witnessed rapid growth in
population through the past four decades, as presented in Table 2-1
Table 2-1 Decadal Population Growth Rates of Pammal and surrounding towns
Sl.
No. Town/City 1961-71 1971-81 1981-91 1991-2001 2001-11
Population
(2011)
01 Chennai 42.8 % 32.7 % 17.2 % 13.1 % 7.0 % 4,646,732
02 Pammal - 207.6 % 31.2 % 37.0 % 51.7 % 75,870
03 Anakaputhur 45.9 % 40.6 % 59.1 % 31.1 % 50.5 % 48,050
04 St.Thomas Mount
cum Pallavaram 74.2 % 21.3 % 19.1 % 6.1 % 3.9 % 43,795
05 Meenambakkam 57.0 % 23.4 % 23.0 % -5.1 % 18.8 % 24,334
Source: Town Directory, Census 2001 & PCA 2011
The average household size in Pammal is a little more than four persons, slightly higher than the
average for urban Tamil Nadu at 3.88 (Census, 2011). A tenth of the population is below 6 years of
age, similar to the state urban population cohorts. The sex ratio was 998.1, comparable to urban Tamil
Nadu’s 999.98 (Census, 2011). The sex ratio for population below 6 was 956.9, higher than the overall
state urban figure of 951.7 (Census, 2011).
2.2.2 Literacy and Education Ninety-one per cent of the population of the town above the age of 6 is literate (Census, 2011). The
corresponding figure for urban Tamil Nadu is 87 per cent. The male and female literacy rates are also
higher than the urban Tamil Nadu average, at 94 and 88 per cent respectively (Census, 2011). The
Census Town Directory of 2001 lists 35 schools and one polytechnic in the town.
2.2.3 Social Composition More than 19 per cent of the population in Pammal belongs to the Scheduled Castes, while 0.16 per
cent belongs to the Scheduled Tribes (Census, 2011). The figure for SC population is considerably
higher than the overall state urban figure of 14.2 per cent while for STs, the figure is marginally lower
than the state figure at 0.38 per cent (Census, 2011).
Adi Dravidas, Paraiyans, Arunthathiyars, Pallans and Adi Andhras were the most prominent scheduled
castes in the town, while Kaniyans, Kattunayakans and Irulas were the main scheduled tribes in
Pammal (Census Town Directory, 2001).
The Census, 2001 had reported 77 per cent of the town’s population being Hindus, while Christians and
Muslims made up 12 and 11 per cent respectively, of the population. Tamil is the dominant language in
the town, with 93 per cent of the residents speaking the language. Telugu, Urdu and Malayalam are
others languages spoken in the town.
2.2.4 Workforce Participation The workforce participation rate in the town is 43 per cent, marginally lower than the state urban figure
of 44.6 per cent (Census, 2011). Male and female work force participation rates are similar to the
average urban figures for the state, at 65 per cent and 21 per cent respectively (Census, 2011). About

Scoping Exercise to Support Sustainable Urban Sanitation in TN: Primary Study Report | March 2016 14
86 per cent of the workforce is engaged as main workers, comprising 37 per cent of the population
(Census, 2011).
Historically, Pammal and its neighboring settlements of Chromepet, Nagalkeni etc., have had a number
of leather tanneries. These are reported to have shut down in the last few years.
2.3 In-city Transportation The Pammal Main Road running between the Chennai Bypass Road and Tiruchi-Chennai Highway;
and the Tiruneermalai Road carry the maximum traffic load. Government and private buses run to
Chennai (via Pallavaram), Pozhichalur and Tiruneermalai. Auto rickshaws (sharing and private) are
also noted as a major means of transportation for people. More than 50 per cent of the households in
the town own a motorized two-wheeler, while the percentage of households with a car, jeep or van is 8
per cent (Census, 2011).
2.4 Settlement Patterns, Housing and Slums
2.4.1 Settlement pattern and Housing Typologies The northern part of town has low-rise high density stand-alone residential buildings restricted to a
height of G+2 floors. The pattern is similar to the southern side of the main Pammal road. Most of the
urban poor pockets are as a part of these settlements. The south-western part of town is an organized
layout-based development with individual bungalows/villas and apartment. The main commercial
establishments are along the Pammal main Road. The southernmost part of the town along the
Tiruneermalai Road, houses the industrial areas. The housing typologies across these settlement
patterns are described below.
The majority of the housing type in Pammal is low and middle income housing. The areas of VOC
Nagar, Bhavani Nagar & Nimnabad areas and most of the other localities house single and double
storied permanent buildings in the town. The materials used for construction of these houses are brick
and RCC, generally flat roof type. Sometimes small commercial settlements form a part of these
houses. The settlement pattern and the housing types are depicted in Plate 2-2 below.

Scoping Exercise to Support Sustainable Urban Sanitation in TN: Primary Study Report | March 2016 15
Plate 2-2 Settlement pattern and Photographs of the low & middle income housing
Source: Open Street Maps; IIHS Primary Study
The Shankar Nagar area inhabits higher income households in the town. The buildings are generally
individual villas or bungalows. There are also large group houses and apartments. The materials used
for construction of these houses are brick and RCC, generally flat roof type.

Scoping Exercise to Support Sustainable Urban Sanitation in TN: Primary Study Report | March 2016 16
Plate 2-3 Settlement pattern and Photographs of the high income housing
Source: Open Street Maps; IIHS Primary Study
Pammal Colony is a congregation of two slum pockets in Ward numbers 5 & 7. The houses are made
of single-storied, detached structures that are located without any order. The materials used for the
construction of these houses are exposed brick walls and have thatched or pitched roofs. A few houses
also have flat RCC roofs and brick walls with very little space between the dwelling units.

Scoping Exercise to Support Sustainable Urban Sanitation in TN: Primary Study Report | March 2016 17
Plate 2-4 Settlement pattern and Photographs of the urban poor
Source: Open Street Maps; IIHS Primary Study
2.4.2 Slums More than 17,000 people or approximately 23 per cent of the town’s population, live in slums (Census,
2011). The average household size of the slum population is 4.16, higher than the town average. The
sex ratio of slums was higher than the figure for the town, at 1013. The type of buildings in slums was
presented in the previous section.
According to the Pammal Municipality, there are 7 notified and four non-notified slums in the town, as
presented in Table (2-3) and Map 1.
Table 2-2 List of Slums in Pammal
Sl. No. Name of the Slum Ward No.
Notified:
01 Moovendhara Nagar 2
02 Pammal Colony 5
03 Pammal Colony 7
04 Moongil Eri 12
05 Kalyanipuram 18

Scoping Exercise to Support Sustainable Urban Sanitation in TN: Primary Study Report | March 2016 18
Table 2-2 List of Slums in Pammal
Sl. No. Name of the Slum Ward No.
06 Nagalkeni 19
07 Easwari Nagar (Thideer Nagar) 21
Non-Notified:
08 Easwaran Nagar 14
09 Rajiv Gandhi Nagar 15
10 Seit Sahib Lane 18
11 Adam Nagar 21
Source: Pammal Municipality

Scoping Exercise to Support Sustainable Urban Sanitation in TN: Primary Study Report | March 2016 19
Map 1 Location of Slums in Pammal
Source: Pammal Municipality and IIHS Primary Study, 2015
Proposed Slums in Phase I
Proposed Slums in Phase II
Pammal Colony
Moovendedhar
Nagar
Moongil Eri
Easwaran Nagar
Rajiv Gandhi Nagar
Kalyani Puram
Seit Sahib Lane
Nagalkeni Easwari Nagar
(Thideer Nagar)
Nagalkeni

3Urban
Environmental
Services in
Pammal3.1 Water Supply 22
3.2 Sanitation 29
3.3 Solid Waste Management 40
3.4 Storm Water Drainage 42


Scoping Exercise to support Sustainable Urban Sanitation in TN: Primary Study Report | March 2016 22
3 Urban Environmental Services in Pammal
3.1 Water Supply
3.1.1 Household Arrangements More than 80 per cent of households depend on tap water for their needs (Census, 2011). Of these, 51
per cent of households have access to treated tap water, usually public piped water supply. Almost a
third of the households have taps but with water coming from untreated sources. This is more than
double of the TN urban average for tap with untreated sources.
The other major source is groundwater, which provides water for more than 8 per cent of households.
A comparison between household water supply arrangements between Pammal and the average for
urban Tamil Nadu is presented in Table 3-1. While Pammal has a lower physical coverage of taps with
treated water, as compared to Urban TN and Urban, its dependency on hand pumps and bore wells is
similar to the Urban TN average, but much lower compared to National Urban figures.
Table 3-1 Comparison of Water Supply Arrangements in Pammal, Urban TN & Urban India
Sl. No. Source of Water Pammal Urban Tamil Nadu Urban India
01 Tap water from treated source 50.7 % 66.3 % 62.0 %
02 Tap Water from untreated source 31.3 % 14.0 % 8.6 %
03 Well 4.1 % 4.3 % 6.2 %
04 Hand pump/Tube well/Borehole 10.5 % 12.6 % 20.8 %
05 Surface water sources 0.4 % 0.4 % 0.7 %
06 Other sources 3.1 % 2.3 % 1.7 %
Source: Census of India, 2011
Location of source of water:
About 68 per cent of households in Pammal are reported to access to water supply arrangements within
their premises, while 29 per cent have access nearby their household premises. Table 3-2 shows that
Pammal households have better physical access than TN urban average.
Table 3-2 Location of source of drinking water – Pammal and urban Tamil Nadu
Sl. No. Location Pammal Urban TN
01 Within the premises 68.2 % 54.0 %
02 Near the premises 28.5 % 40.2 %
03 Away 3.3 % 5.7 %
Source: Census of India, 2011
3.1.2 Household Arrangements for potable water
a. Supply from Chennai Metro water
The main source of drinking water supplied by Pammal Municipality is from a Combined Water Supply
Scheme (CWSS) from Alandur, by the Chennai Metro Water Supply and Sewerage Board (CMWSSB,
or Metro water). Water is supplied once in 6 days for 2.5 hours only. Municipal officers estimate a supply
of 50 lpcd from this source.
Scoping Exercise to support Sustainable Urban Sanitation in TN: Primary Study Report | March 2016 23
At present, there are 10,189 house service connections (HSCs), 15 commercial and 19 industrial water
supply connection in the town. Ward No. 3 has the highest number of house service connections (806)
in the town. (cf. Annexure 3 for ward-wise water connections).
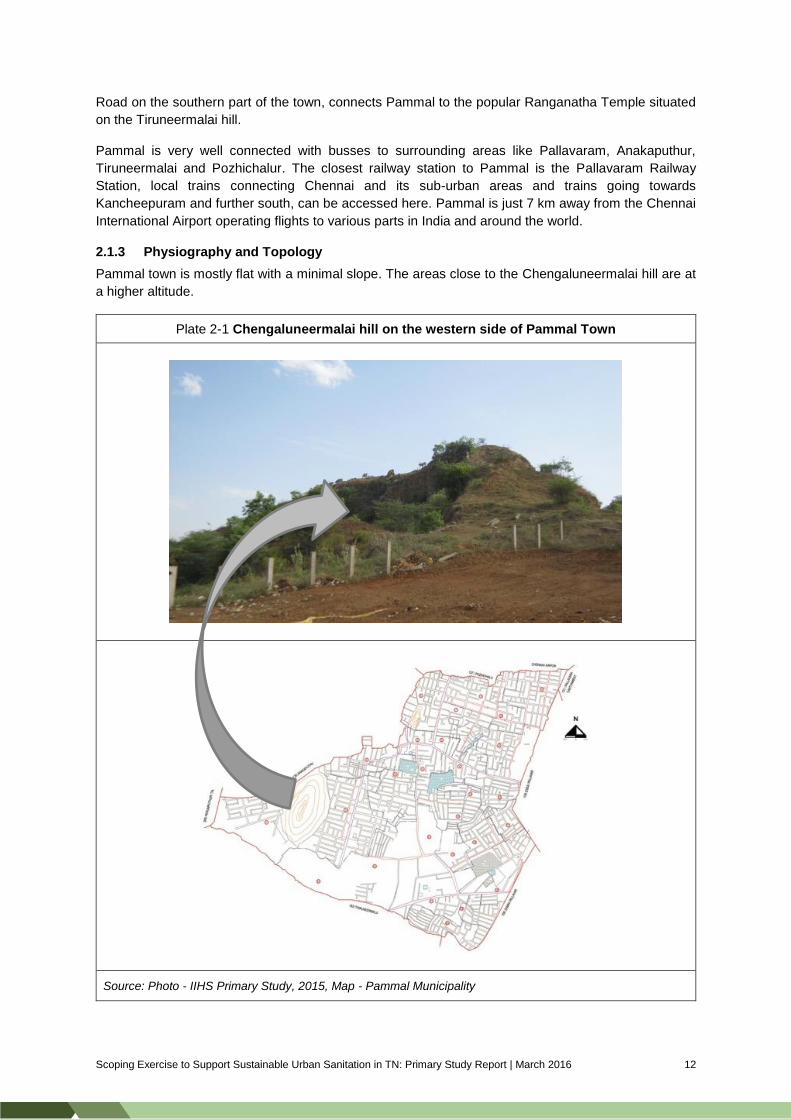
b. Supplementary Public Provisioning
Since the supply of drinking water under CWSS is intermittent (once in 6 days), to facilitate regular
drinking water supply, 619 public stand posts (PSPs) are provided at various locations in the town for
to supply drinking water to the people who cannot afford to have a house service connection (Refer to
Annexure 3 for a ward-wise list of PSPs).
Mini power pumps connected to Reverse Osmosis (RO) plants with storage tanks, have been installed
in Pammal (cf. Annexure 3). In this arrangement, water drawn from the bore well through submersed
pump is connected to the RO plant and the treated water is stored in a PVC tank (1000 lit capacity) and
users draw water from it.
Plate 3-1 Public Stand Posts delivering drinking water in Pammal
Source: IIHS Primary Study, 2015
There are 25 such installation across the town (refer to Annexure 3 for ward-wise details), especially
close to the urban poor settlements. The pumps are operated by the local residents themselves and
use them on need basis.
Scoping Exercise to support Sustainable Urban Sanitation in TN: Primary Study Report | March 2016 24
3.1.3 Household Arrangements for non-potable water
a. Self-Supply
Due to limited and intermittent municipal water supply, many households have private open wells or
bore wells within their premises.
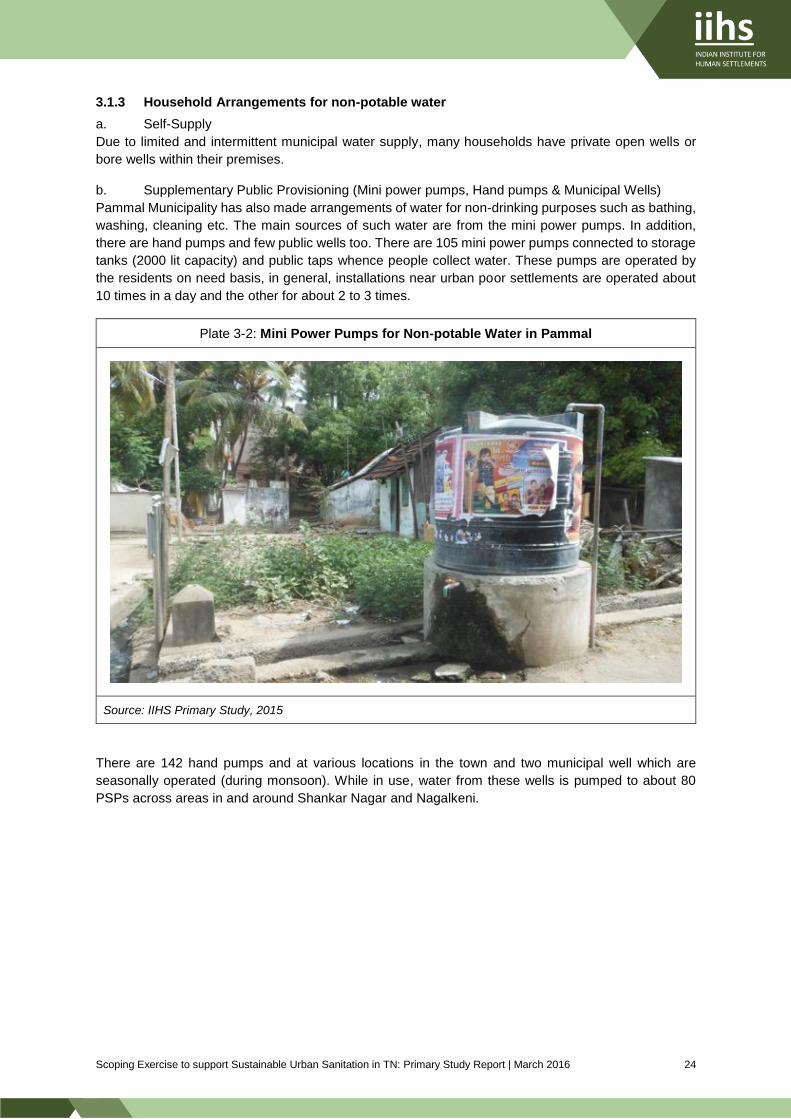
b. Supplementary Public Provisioning (Mini power pumps, Hand pumps & Municipal Wells)
Pammal Municipality has also made arrangements of water for non-drinking purposes such as bathing,
washing, cleaning etc. The main sources of such water are from the mini power pumps. In addition,
there are hand pumps and few public wells too. There are 105 mini power pumps connected to storage
tanks (2000 lit capacity) and public taps whence people collect water. These pumps are operated by
the residents on need basis, in general, installations near urban poor settlements are operated about
10 times in a day and the other for about 2 to 3 times.
Plate 3-2: Mini Power Pumps for Non-potable Water in Pammal
Source: IIHS Primary Study, 2015
There are 142 hand pumps and at various locations in the town and two municipal well which are
seasonally operated (during monsoon). While in use, water from these wells is pumped to about 80
PSPs across areas in and around Shankar Nagar and Nagalkeni.

Scoping Exercise to support Sustainable Urban Sanitation in TN: Primary Study Report | March 2016 25
Plate 3-3 Hand Pumps in Pammal
Source: IIHS Primary Study, 2015
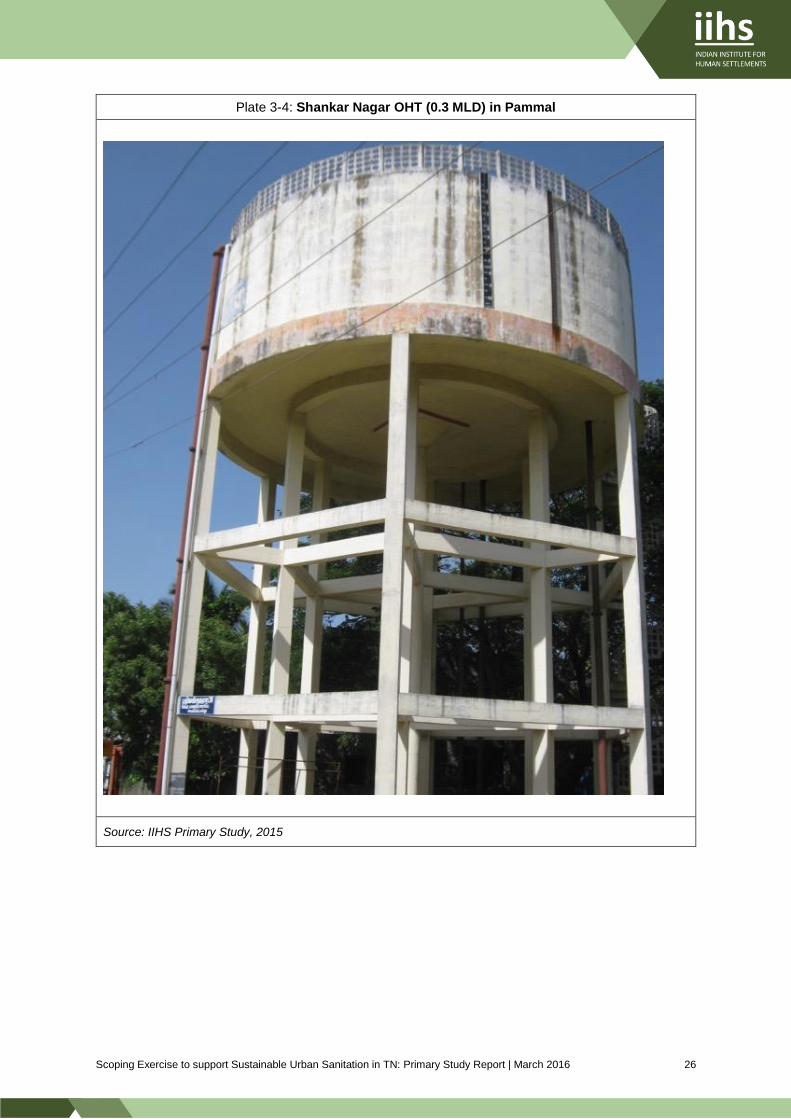
City Level Water Infrastructure
The main source of water to this scheme is from the Chembarambakkam Lake. Though treated water
is supplied, for additional safety, water is further disinfected using iodine and chlorine at the storage
sump (1 MLD capacity) situated in HL colony in Pammal regularly. Water is pumped in to three overhead
tanks in the town serving to three water zones. Since it is a combined water supply scheme, water is
pumped to the adjacent town of Anakaputhur from the same sump. Table 3-3 and Map 2 presents
details of storage infrastructure and distribution zones in Pammal town.
Table 3-3 Water Storage Infrastructure and Distribution in Pammal
Sl. No. Location of OHT Capacity Zone Wards covered
01 Municipal Office 0.3 MLD 1 4, 5, 6, 7, 8 9, 10, 11 and parts of 3 & 12
02 Shankar Nagar 0.3 MLD 2 1, 2, 3, 13, 14 and parts of 3, 12, 17 & 21
03 Nagalkeni 0.15 MLD 3 15, 16, 18, 19, 20 and parts of 17 & 21
Source: Pammal Municipality
Scoping Exercise to support Sustainable Urban Sanitation in TN: Primary Study Report | March 2016 26
Plate 3-4: Shankar Nagar OHT (0.3 MLD) in Pammal
Source: IIHS Primary Study, 2015

Scoping Exercise to support Sustainable Urban Sanitation in TN: Primary Study Report | March 2016 27
Map 2: Water Zones and Water Storage Infrastructure
Source: Pammal Municipality and IIHS Primary Study, 2015
Discussions with municipal officers indicate that the overhead storage tanks are filled 3 to 4 times in a
day indicating about 2.25 to 3 MLD of water being put in to distribution.
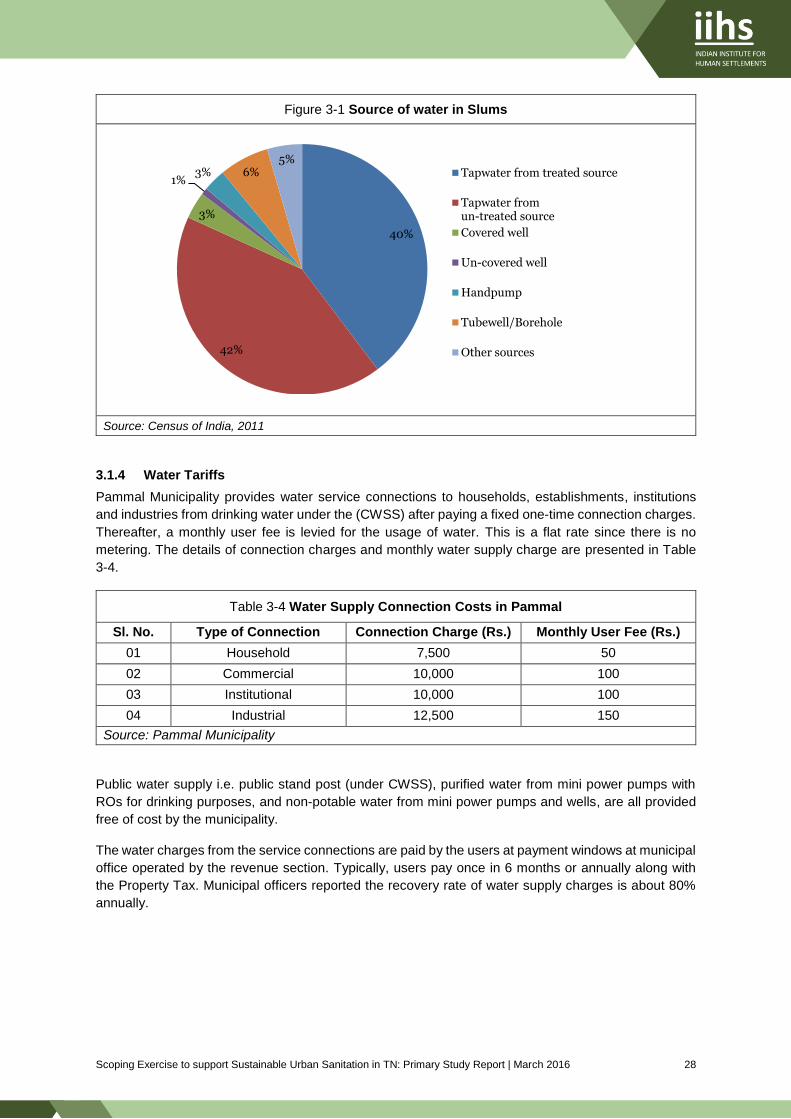
Water Supply in Slums:
The major source of water in the slum settlements in the town, is through the piped water supply
provided by the Municipality. However, more than half of the water from piped supply is from an un-
treated source. A few households depend on underground water sources like tube wells, hand pumps
and wells.
c
c
Over Head Tanks
Underground Sump
Zone I
Zone II
Zone III
Nagalkeni OHT
Shankar Nagar OHT
Municipl Office OHT
HL Colony Sump
Scoping Exercise to support Sustainable Urban Sanitation in TN: Primary Study Report | March 2016 28
Figure 3-1 Source of water in Slums
Source: Census of India, 2011
3.1.4 Water Tariffs
Pammal Municipality provides water service connections to households, establishments, institutions
and industries from drinking water under the (CWSS) after paying a fixed one-time connection charges.
Thereafter, a monthly user fee is levied for the usage of water. This is a flat rate since there is no
metering. The details of connection charges and monthly water supply charge are presented in Table
3-4.
Table 3-4 Water Supply Connection Costs in Pammal
Sl. No. Type of Connection Connection Charge (Rs.) Monthly User Fee (Rs.)
01 Household 7,500 50
02 Commercial 10,000 100
03 Institutional 10,000 100
04 Industrial 12,500 150
Source: Pammal Municipality
Public water supply i.e. public stand post (under CWSS), purified water from mini power pumps with
ROs for drinking purposes, and non-potable water from mini power pumps and wells, are all provided
free of cost by the municipality.
The water charges from the service connections are paid by the users at payment windows at municipal
office operated by the revenue section. Typically, users pay once in 6 months or annually along with
the Property Tax. Municipal officers reported the recovery rate of water supply charges is about 80%
annually.
40%
42%
3%
1%3% 6%
5%Tapwater from treated source
Tapwater fromun-treated source
Covered well
Un-covered well
Handpump
Tubewell/Borehole
Other sources

Scoping Exercise to support Sustainable Urban Sanitation in TN: Primary Study Report | March 2016 29
3.2 Sanitation
3.2.1 Household Arrangements
About 96 per cent of households in Pammal report having an individual household latrine within their
premises. Almost 92 per cent of households have a flush or pour/flush toilet, with the majority 77 per
cent depending on “septic” tanks (Census, 2011). Though Census reports that 14 per cent of
households are connected to a piped sewer network, the primary study does not validate this claim.
Figure 3-2 presents household sanitation arrangements in Pammal.
Figure 3-2: Household Sanitation Arrangements in Pammal
Source: Census of India, 2011
Slum Sanitation:
About 88 per cent of slum households in Pammal have access to a latrine within their premises (Census
2011). Of the remaining 12 per cent, 8 per cent of households rely on public latrines while four per cent
resort to open defecation (Census 2011). Amongst households with latrines, the most predominant
arrangement is the use of “septic” tanks – 61 per cent of slum households report having these
structures.
A comparison of sanitation arrangements in Pammal, with urban TN and urban India averages,
presented in Table 3-5, shows that Pammal households have higher proportion of physical access to
individual households, “septic” tanks being predominant, a lower incidence of open defecation or use
of public latrines. The Primary Study showed however near-absence of sewerage and perhaps a mis-
classification of toilets of other categories into this – that could also explain a small proportion of pit
latrines being reported. These are discussed later.
15%
77% 0%
4%
0%
0%
0%
0%2%2%
Piped sewer system Septic tank Other system
With slab/ ventilated improved pit Without slab/ open pit Night soil disposed into open drain
Night soil removed by human Night soil serviced by animal Public Latrine
Open Defecation

Scoping Exercise to support Sustainable Urban Sanitation in TN: Primary Study Report | March 2016 30
Table 3-5 : Comparison of Sanitation Arrangements between Pammal, Urban TN & Urban India
Sl. No. Sanitation Arrangements Pammal Urban TN Urban India
01 Latrine within premise 95.9 % 75.1 % 81 %
02 No latrine within premise 4.1 % 24.9 % 19 %
03 Piped sewer system 14.4 % 27.4 % 33 %
04 Septic tank 77.4 % 37.9 % 38 %
05 Other system 0.1 % 1.1 % 2 %
06 With slab/ ventilated improved pit 3.9 % 6.6 % 6 %
07 Without slab/ open pit 0.1 % 0.3 % 1 %
08 Night soil disposed into open drain 0.0 % 1.5 % 1 %
09 Night soil removed by human 0.0 % 0.2 % 0 %
10 Night soil serviced by animal 0.0 % 0.2 % 0 %
11 Public Latrine 2.0 % 8.6 % 6 %
12 Open Defecation 2.1 % 16.2 % 13 %
Source: Census of India, 2011
3.2.2 Household Arrangements in Study households
a. Households with individual toilets
Independent houses have built latrines either as attached to the bedroom inside the house, or as
attached / separate structures. Out of 13 households studied, 8 have such attached toilet facilities.
Some have built toilets outside the house but within the premises which according to them is to cater
to even visitors or guests. Five houses have such latrines within the premises, whereas two houses
(Pasumpon Nagar) have both attached toilet and a common toilet for guest within the premises. Only
one of the low income houses (Thiruvallur street) had a latrine outside the premises. The latrines are
mostly Indian Pan type with pour flush arrangements. Only two houses had western-type toilets with
cistern flush.
All the eight houses with individual latrines have septic tanks
to collect sewage, and seem to be working condition. More
about their structure is discussed in the later section.
Since all the latrines were built during the construction of
house some time ago, respondents were unable to recall the
cost break-down separately for the toilet. One of the
respondents who built the attached toilet recently, reported
having spent Rs. 10,000- 15,000 on the western water
closet/cistern, with an additional Rs.5000 to provide a
pipeline connecting the western closet to Septic tank.
b. Households sharing toilets
The shared toilets are more prevalent in houses that are
rented. The tenants are unhappy with this since the owners
have individual toilets for their houses. Tenants also express
concerns about cleaning arrangements for these shared
toilets.
Plate 3-5: Shared Toilet in Pammal
Source: IIHS Primary Study, 2015

Scoping Exercise to support Sustainable Urban Sanitation in TN: Primary Study Report | March 2016 31
In Bhavani Nagar, near NSK Street, Ward No 13, a respondent has built four houses 15 years ago
within a single plot and has two toilets within the premises which are shared by all the four households.
The toilets are Indian type pour flush system connected to septic tank. Last year, the Government has
built Namma Toilet in front of her house but this was not acceptable to them. In order to avoid viewing
the users of Namma Toilet and the odour she raised a wall in front of her house.
c. Households dependent on public toilets
About 300 households depend on public toilets, according to ULB estimates. There are seven Public
toilets in Pammal - six of these also have a bathing facility (except Bajana Koil Street Public toilet).
These Public Toilets have four seats each for men and women and one for children. Water supply is
adequate in all the toilets. User fee is collected in one of the public toilets in Bajanai Koil Street. Refer
to Annexure 3 for details.
Box 1 Namma Toilets Users: a case from Pammal
Shivashankaran Street has two houses which depend on Public toilet at Bajanai Koil Street. The respondent from one of the house expressed her inability to afford constructing a toilet in her house. The house is 35 years old passed on by her grandparents to her. The household size is 7 with three children under the age group of 12 years and two each of male and female members. Her husband is a daily wage labourer who is the single earning member of the family. A sanitary worker taking care of a public toilet in Ward No. 7 says that about 150 people use the toilet. He cleans it twice a day. The major problem they face are that there are set of miscreants who get drunk at night and come and damage the property by breaking doors or stealing metal parts to sell them off.
Source: IIHS Primary Study, 2015
d. Open defecation
Rajiv Gandhi Nagar and Fathima Nagar are two notified slums where respondents reported that they
defecate in the open. The residents of Fathima Nagar defecate in the vacant land under the Chennai
bypass Flyover. The residents of Rajiv Gandhi Nagar use the vacant land near the old quarry of

Scoping Exercise to support Sustainable Urban Sanitation in TN: Primary Study Report | March 2016 32
Chengalneer Hills to defecate. The average time taken to go to the open defecation site one way is 15
minutes. The main reason reported for not possessing and using a toilet, was that these households
cannot afford the cost of construction. The other reason is irregular water supply in Rajiv Gandhi Nagar
where water is supplied once in 10 days. These household are willing to use public toilets provided
there is regular supply of water.
One of the most common problems stated by respondents, included the waiting period to avoid the
presence of passerby which is difficult near the crowded Chennai bypass; and the large presence of
construction workers mostly men, as there are buildings under construction in the vicinity.
One respondent who in a rented house claimed that the there are many houses without toilets are built
and rented out yet the owners would have toilets in their houses. All the respondents said that they did
not carry water for cleaning purpose, but would return home and wash in the Bathrooms.
Probing further on the health issues indicated that they were not aware of any illness related to open
defecation and only acknowledged that it was unhygienic. They are not willing to construct toilet citing
affordability constraints, and are expecting the Government to come forward and build toilets.
3.2.3 Types of Septic Tanks
According to Census 2011, 77 per cent of households have “septic: tanks. From field observations the
predominant on site sanitation system seen is septic tanks. The design of septic tanks submitted to the
municipality along with building plans for approval; conform to the standards as prescribed in Central
Public Health Environmental Engineering Organization (CPHEEO). However, during construction,
several modifications are made.
Based on the team’s interaction with the Building Inspector, builders, residents and local Masons, during
our site reconnaissance, septic tanks can be classified into different sub-types, as presented in Table
3-6.
Table 3-6 : Types of septic tanks
Sl. No. Type No. of Chambers Water tightness Outlet arrangements
01 Type I Single chamber Water tight No outlet
02 Type II Single chamber Water tight Soak pit
03 Type III Single chamber Porous Percolating to ground
04 Type IV Double Water tight Soak pit
05 Type V Double Porous Percolating to ground
06 Type VI Double Water tight No outlet
07 Type VII Triple Water tight Soak pit
08 Type VIII Triple Porous Soak pit
Source: IIHS primary study 2015

Scoping Exercise to support Sustainable Urban Sanitation in TN: Primary Study Report | March 2016 33
Figure 3-3: Illustration and Description of Type of Septic Tanks
Type 1: Type 2:
Dimension (LxBxD): 6’x 4’x 8’
Chambers: 1
Base: Non-Porous
Walls: Non-Porous
Top Slab: RCC
Access Cover (Y/N): Yes
Soak Pit: No
Other details: Generally noticed in single or double dwelling units (middle income group)
Dimension (LxBxD): 6’x 4’x 8’
Chambers: 1
Base: Non-Porous
Walls: Non-Porous
Top Slab: RCC
Access Cover (Y/N): Yes
Soak Pit: Yes (4’dia & 5’deep)
Other details: Generally noticed in single or double dwelling units (middle or high-income group)
Type 3: Type 4:
Dimension (LxBxD): 6’x 4’x 8’
Chambers: 1
Base: Porous
Walls: Porous or Non-Porous
Top Slab: RCC
Access Cover (Y/N): Yes
Soak Pit: No
Other details: Generally noticed in single or double dwelling units (low and middle income group)
Dimension (LxBxD): 8’x 5’x 10’
Chambers: 2 (partition wall at the center with holes)
Base: Non-Porous
Walls: Non-Porous
Top Slab: RCC
Access Cover (Y/N): Yes
Soak Pit: Yes (4’dia & 5’deep)
Other details: Generally noticed in single or double dwelling units (middle or high income group)
Scoping Exercise to support Sustainable Urban Sanitation in TN: Primary Study Report | March 2016 34
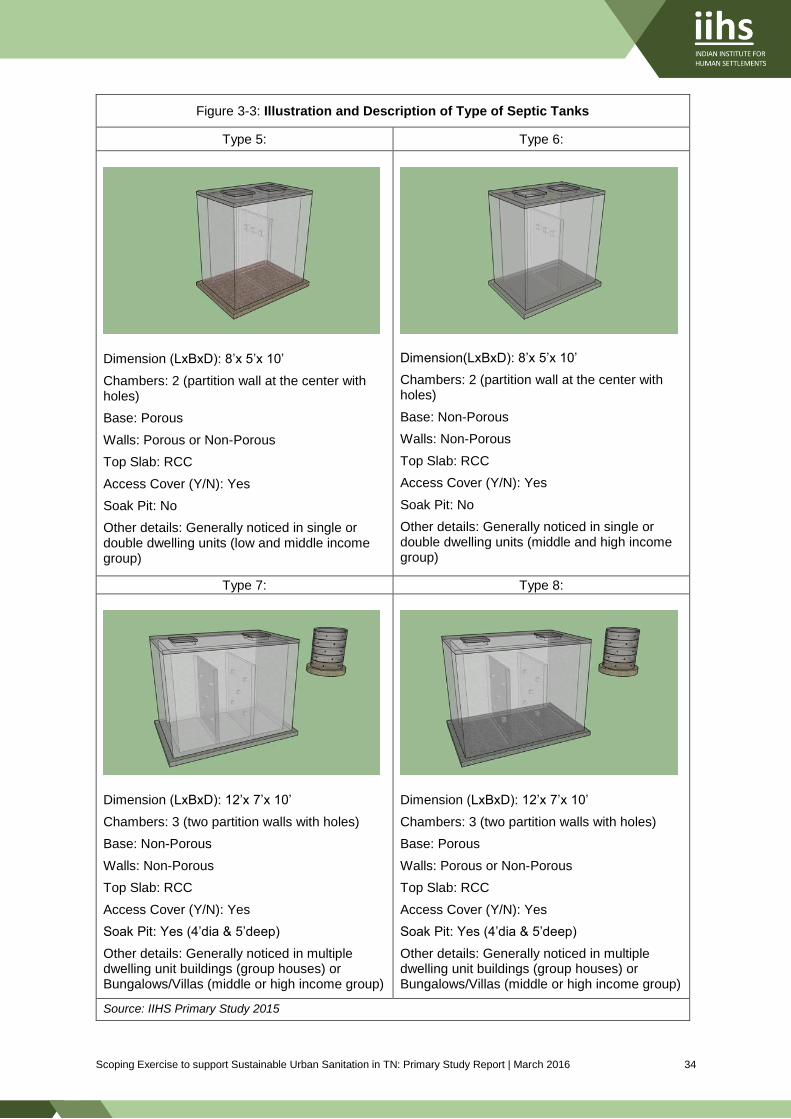
Figure 3-3: Illustration and Description of Type of Septic Tanks
Type 5: Type 6:
Dimension (LxBxD): 8’x 5’x 10’
Chambers: 2 (partition wall at the center with holes)
Base: Porous
Walls: Porous or Non-Porous
Top Slab: RCC
Access Cover (Y/N): Yes
Soak Pit: No
Other details: Generally noticed in single or double dwelling units (low and middle income group)
Dimension(LxBxD): 8’x 5’x 10’
Chambers: 2 (partition wall at the center with holes)
Base: Non-Porous
Walls: Non-Porous
Top Slab: RCC
Access Cover (Y/N): Yes
Soak Pit: No
Other details: Generally noticed in single or double dwelling units (middle and high income group)
Type 7: Type 8:
Dimension (LxBxD): 12’x 7’x 10’
Chambers: 3 (two partition walls with holes)
Base: Non-Porous
Walls: Non-Porous
Top Slab: RCC
Access Cover (Y/N): Yes
Soak Pit: Yes (4’dia & 5’deep)
Other details: Generally noticed in multiple dwelling unit buildings (group houses) or Bungalows/Villas (middle or high income group)
Dimension (LxBxD): 12’x 7’x 10’
Chambers: 3 (two partition walls with holes)
Base: Porous
Walls: Porous or Non-Porous
Top Slab: RCC
Access Cover (Y/N): Yes
Soak Pit: Yes (4’dia & 5’deep)
Other details: Generally noticed in multiple dwelling unit buildings (group houses) or Bungalows/Villas (middle or high income group)
Source: IIHS Primary Study 2015
Scoping Exercise to support Sustainable Urban Sanitation in TN: Primary Study Report | March 2016 35
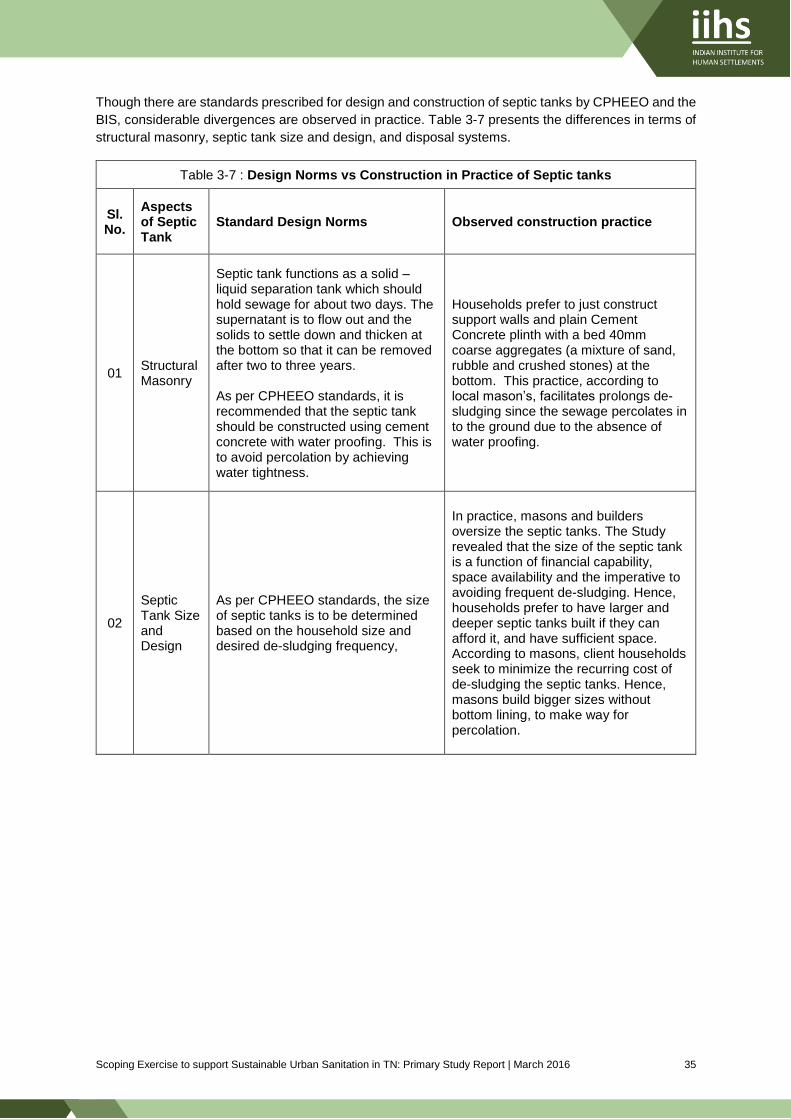
Though there are standards prescribed for design and construction of septic tanks by CPHEEO and the
BIS, considerable divergences are observed in practice. Table 3-7 presents the differences in terms of
structural masonry, septic tank size and design, and disposal systems.
Table 3-7 : Design Norms vs Construction in Practice of Septic tanks
Sl. No.
Aspects of Septic Tank
Standard Design Norms Observed construction practice
01 Structural Masonry
Septic tank functions as a solid –liquid separation tank which should hold sewage for about two days. The supernatant is to flow out and the solids to settle down and thicken at the bottom so that it can be removed after two to three years. As per CPHEEO standards, it is recommended that the septic tank should be constructed using cement concrete with water proofing. This is to avoid percolation by achieving water tightness.
Households prefer to just construct support walls and plain Cement Concrete plinth with a bed 40mm coarse aggregates (a mixture of sand, rubble and crushed stones) at the bottom. This practice, according to local mason’s, facilitates prolongs de-sludging since the sewage percolates in to the ground due to the absence of water proofing.
02
Septic Tank Size and Design
As per CPHEEO standards, the size of septic tanks is to be determined based on the household size and desired de-sludging frequency,
In practice, masons and builders oversize the septic tanks. The Study revealed that the size of the septic tank is a function of financial capability, space availability and the imperative to avoiding frequent de-sludging. Hence, households prefer to have larger and deeper septic tanks built if they can afford it, and have sufficient space. According to masons, client households seek to minimize the recurring cost of de-sludging the septic tanks. Hence, masons build bigger sizes without bottom lining, to make way for percolation.

Scoping Exercise to support Sustainable Urban Sanitation in TN: Primary Study Report | March 2016 36
Table 3-7 : Design Norms vs Construction in Practice of Septic tanks
Sl. No.
Aspects of Septic Tank
Standard Design Norms Observed construction practice
03 Disposal Systems
There are two types of wastes generated in septic tank 1. Liquid effluent which comes out
of outlet every day; 2. Settled solids in the form of
sludge that needs to be removed once in two or three years.
For the liquid effluent, treatment is deemed appropriate by methods like soak pits or dispersion trenches with the caution that these sub-soil dispersion systems shall be at least 20 m away from any drinking water source. The distance between the soak pit and adjacent dwelling is recommended to be at least 7 m to avoid any corrosive effect due to tank gases vented into atmosphere. Sludge needs to be emptied by mechanical vacuum tankers and should be sent for further treatment at sludge treatment units at sewage treatment plants or appropriate septage treatment facility. For this regular de-sludging, access covers need to be provided.
For liquid effluent, two categories of arrangements are observed in practice: 1. With outlet: earlier, septic tank
outlets were let into storm water drains. Now, the Municipality has attempted to ensuring that all the outlets are sealed, and the drains only receive sullage i.e. kitchen and bathroom wash water
2. Soak pits: outlets of septic tank are connected to soak pits in few buildings. Masons report providing soak pits at a distance of 10 feet from the septic tank and 20 feet away from the bore well in each house.
De-sludging is not reported to be done at regular intervals, and access covers are not provided in all the buildings including in establishments. The tank is covered with an RCC slab and whenever there is a backflow of sewage in toilets, the concrete slab is broken open - enough to let the vacuum pipe inside the tank for cleaning, and the hole is closed again with concrete. The reason for such construction practice is explained as avoiding sewage overflow and breeding of mosquitoes.
Source: CPHEEO, IIHS Primary Study 2015
Plate 3-6: Typical Household Septic Tank in Pammal
Source: IIHS Primary Study, 2015

Scoping Exercise to support Sustainable Urban Sanitation in TN: Primary Study Report | March 2016 37
The Table 3-8 below shows the details on the type of septic tanks observed during the household
survey.
Table 3-8 : Summary of on-site systems observed through household survey
Sl. No.
Household No.
Household Size
Age of the Building (years)
Shape of Septic Tank
Size of
Septic Tank
(cum)
No. of Chambers
Water tight Base (Y/N)
Openable Access Cover (Y/N)
Outlet
Frequency of
Desludging (Yearly)
Last Cleaned
01 H1 15 10 Rectangular 10 2 N Y Soak Pit
Twice 6
months ago
02 H2 7 4 Rectangular 17.1 2 N N No
Outlet Not
Required -
03 H3 6 5 Rectangular Could not determine as the septic tank was sealed underground and the respondent didn’t know any details
- - -
04 H4 3 30 Rectangular 8.3 1 N Y - - 2 years
ago
05 H5 2 20 Rectangular 3 1 Y Y Soak Pit
- 1 year ago
06 H6 2 30 Rectangular - 1 Y Y No
Outlet - -
07 H7 6 12 Rectangular 5.7 2 - - No
Outlet -
1 year ago
08 H8 4 - Rectangular 20 2 Y N No
Outlet - -
Note: All households surveyed were single storied buildings (only ground floor)
Source: IIHS Primary Study 2015
Table 3-9 : Summary of construction practice by builders and masons
Sl. No.
Respondent Number of buildings executed
Dimensions (LxBxD)
Avg. Capacity of Septic
Tank (cu. mt.)
Water Tight
No. of chambers
Design of Partition
Wall
Access covers
Outlet Avg. Cost
Side Walls
Bottom
01 Builder 1 12 8’x 4’x 6’ 6 Provided Provided 3 5 Holes on the 2nd wall
One To soak pit ` 50,000
02 Builder 2 300 Varies
10 to 12 HHs – 10
cu. mt. 4 HHs – 4 cu. mt.
Provided provided 1 Not applicable
Some sealed some have openable cover
Depending on client’s affordability, soak pit will be provided
` 65,000 to 75,000

Scoping Exercise to support Sustainable Urban Sanitation in TN: Primary Study Report | March 2016 38
Table 3-9 : Summary of construction practice by builders and masons
Sl. No.
Respondent Number of buildings executed
Dimensions (LxBxD)
Avg. Capacity of Septic
Tank (cu. mt.)
Water Tight
No. of chambers
Design of Partition
Wall
Access covers
Outlet Avg. Cost
Side Walls
Bottom
03 Mason 1 90 7’ x 4’x 10’ 8 Provided Not
provided 2
5 Holes on the 2nd wall
Some sealed some have openable cover
To soak pit ` 70,000 (incl. Soak Pit)
04 Mason 2 150 Provided Not
provided 2
5 Holes on the 2nd wall
Some sealed some have openable cover
Depending on space availability, soak pit will be provided
05 Mason 3 15 9’ x 10’ x 9’ 23 Provided Not
provided 1
Not applicable
Some sealed some have openable cover
Depending on space availability, soak pit will be provided
Was a part of the building cost (difficult to give separate cost)
Notes: All septic tanks are constructed in rectangular shape
Source: IIHS Primary Study 2015
The Tables (4-8, 4-9 & 4-10) above show that there are considerable differences between the standards
and designs prescribed, and what obtains in practice on ground. A number of local factors, and
perceptions and beliefs, appear to be playing a key role in driving practices that need to be analysed
further. These are re-visited again in the section describing the Coimbatore Town Panchayats.
3.2.4 Transportation of Septage
Septage from households is collected and transported by a private operator. There are three de-
sludging vehicles with capacities of 10,000 to 12,000 liters each, fitted with a 24 HP pump for vacuum
suction. A driver and a worker each are deployed for each of the vehicle to carry out the de-sludging
operations. Each vehicle is reported to have carried out three to four de-sludging operations in during
rainy days and two to three in dry season. According to the operator, the usual de-sludging frequency
varies from three to four years among households. The fee charged per trip varies between `1,200 and
1,800 depending on the size of the septic tank. The trip length was reported to be about 25 km.
The capital cost of the vehicle is about `20 lakh1. The vehicle is bought with open chassis and the
holding tank and the suction machinery is built locally.
1 Based on IIHS team’s interaction with the local private cess-pool operator
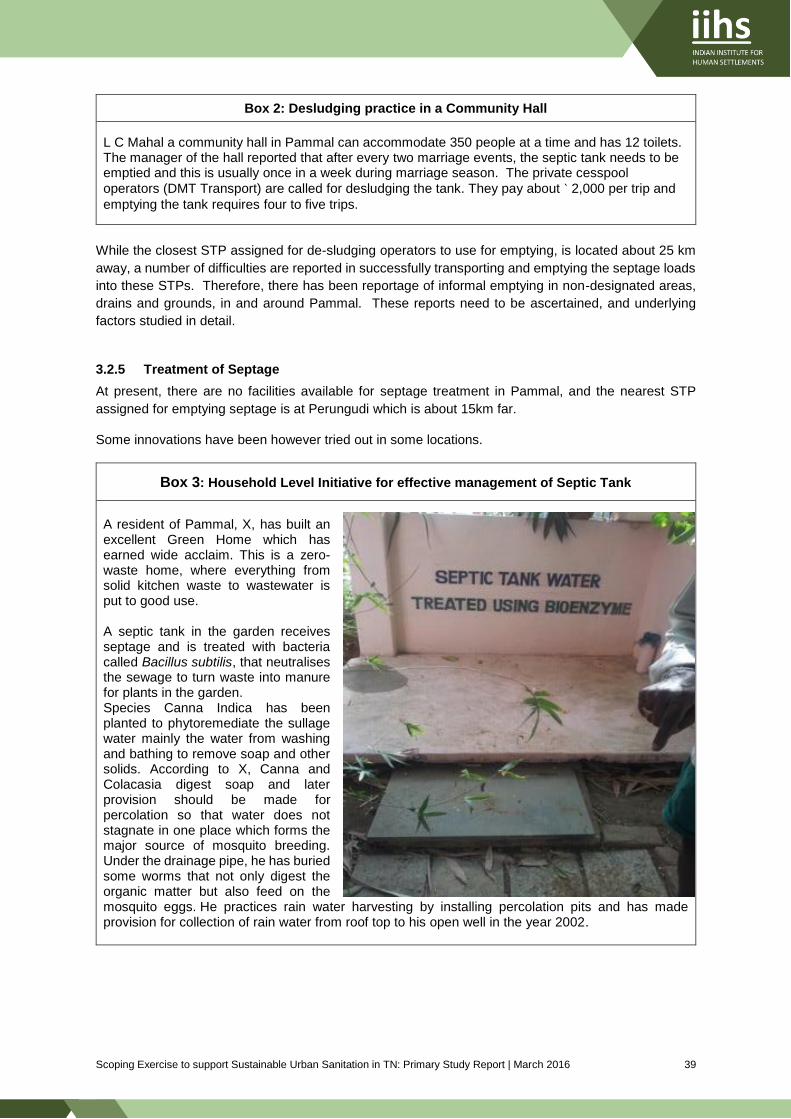
Scoping Exercise to support Sustainable Urban Sanitation in TN: Primary Study Report | March 2016 39
Box 2: Desludging practice in a Community Hall
L C Mahal a community hall in Pammal can accommodate 350 people at a time and has 12 toilets. The manager of the hall reported that after every two marriage events, the septic tank needs to be emptied and this is usually once in a week during marriage season. The private cesspool
operators (DMT Transport) are called for desludging the tank. They pay about ` 2,000 per trip and
emptying the tank requires four to five trips.
While the closest STP assigned for de-sludging operators to use for emptying, is located about 25 km
away, a number of difficulties are reported in successfully transporting and emptying the septage loads
into these STPs. Therefore, there has been reportage of informal emptying in non-designated areas,
drains and grounds, in and around Pammal. These reports need to be ascertained, and underlying
factors studied in detail.
3.2.5 Treatment of Septage
At present, there are no facilities available for septage treatment in Pammal, and the nearest STP
assigned for emptying septage is at Perungudi which is about 15km far.
Some innovations have been however tried out in some locations.
Box 3: Household Level Initiative for effective management of Septic Tank
A resident of Pammal, X, has built an excellent Green Home which has earned wide acclaim. This is a zero-waste home, where everything from solid kitchen waste to wastewater is put to good use. A septic tank in the garden receives septage and is treated with bacteria called Bacillus subtilis, that neutralises the sewage to turn waste into manure for plants in the garden. Species Canna Indica has been planted to phytoremediate the sullage water mainly the water from washing and bathing to remove soap and other solids. According to X, Canna and Colacasia digest soap and later provision should be made for percolation so that water does not stagnate in one place which forms the major source of mosquito breeding. Under the drainage pipe, he has buried some worms that not only digest the organic matter but also feed on the mosquito eggs. He practices rain water harvesting by installing percolation pits and has made provision for collection of rain water from roof top to his open well in the year 2002.

Scoping Exercise to support Sustainable Urban Sanitation in TN: Primary Study Report | March 2016 40
3.3 Solid Waste Management
Solid waste management is carried out by both municipality and a private agency in the town. Pammal
Municipality manages only 5 out of the 21 wards in the town (Ward Nos. 7, 8, 9, 10 & 11) and the other
16 wards are managed by the private agency. At present, no user fee is separately charged by the
Municipality for solid waste management.
a. Collection and Conveyance
In the municipal solid waste management system, the waste is collected through door to door collection
system. Tricycles are used for collection of waste from households. Two sanitary workers are deployed
for each tricycle to collect the waste from households and carry out street sweeping in parallel. Waste
from the tricycles is loaded in to lorry or tractors and is transported to the treatment plant/ disposal site.
(Cf. Annexure 3 for list of vehicles and tools available with the ULB for solid waste management).
Plate 3-7: Vehicles used for solid waste collection in Pammal
Tricycles for collecting door to door waste Tractor for collecting waste from tricycles, street sweeping and drain cleaning waste
Source: IIHS Primary Study, 2015
In addition to door to door collection, the municipality has also placed 60 community bins across the
town at various commercial spaces, markets, main roads etc. to collect solid wastes. These bins are
750 kg capacity made out of metal, that can be lifted and transported by the refuse collector vehicle
operated by the municipality.
The ULB officials estimate solid waste generation of 45 tonnes per day. About 40 tonnes is collected
every day, 10 by municipal staff and the rest by the private player.
b. Treatment and Disposal/Re-use
Treatment of solid waste is carried for a small portion of solid waste collected; only 5 MT of the total
waste collected in a day is treated at the Tiruneermalai Resource Recovery Park situated at
Vishweshwarapuram. The organic waste is treated by windrow and vermi-composting methods. The
compost produced is sold out to farmers in the surrounding areas.
In addition to the resource recovery park, a Bio-methanation plant has been established to treat food
waste from restaurants and vegetable and meat waste from markets. It is situated along the foot hill of
Changelnermalai (adjacent to Rajiv Gandhi Nagar Slum). The plant was sponsored and implemented
by SAM Foundation under the ExNoRa Green Pammal initiative and land was donated by Appaswamy
Builders.

Scoping Exercise to support Sustainable Urban Sanitation in TN: Primary Study Report | March 2016 41
Plate 3-8: Biomethanation plant for treatment of food waste in Pammal
Source: IIHS Primary Study, 2015
c. Drain Cleaning
Surface drains in the town are the main conveyors of storm-water in the town, often mixed with black
water i.e. with discharges from toilets in to these drains. Solid waste and silt finds its ways in to these
drains and often result in blockage and overflowing. To avoid this, municipal sanitary workers are
deployed for drain cleaning in the town. The sanitary workers remove solid waste and silt from the
drains using forks/pickers, and dump these along the road. Larger vehicles like a lorry or a tractor
running along collecting door to door waste from tricycles also lift this waste and transport it away to the
disposal site.
Plate 3-9: Drain cleaning by sanitary worker in Pammal
Source: IIHS Primary Study, 2015

Scoping Exercise to support Sustainable Urban Sanitation in TN: Primary Study Report | March 2016 42
3.4 Storm Water Drainage
a. Natural storm water
drainage
Pammal’s natural storm water
drainage pattern indicates that the
storm drain converges from the
surrounding areas of Anakaputhur
and Pallavaram. Storm water from
the southern part of the town flows
in to the Surya Amman Temple
Tank and the Thirupunanthal Lake
on the eastern side and to
previously existing Moongil Eri on
the western side. The main outlet
from the Thirupunanthal Lake is the
Nadavaivodai storm drain (along
Elumalai Street) collecting storm
water from either sides in the
northern part of the town and finally
draining out in to Adayar River near
the Airport on the North-Eastern part
of the town. Please refer to the
schematic Map 3 in the following
pages for the broad natural drainage
pattern in the town.
Plate 3-11: Main Storm Water Drains in Pammal
Main storm water drain from Thirupunanthal Nadavaivodai storm drain
Source: IIHS Primary Study, 2015
b. Constructed drains
There is a good coverage of constructed surface storm drains in the town. Except for wards 1, 2, 3, 18
and 21 with partial coverage, all other wards are fully covered with storm water drains.
Plate 3-10: Thirupunanthal Lake in Pammal
Source: IIHS Primary Study, 2015

Scoping Exercise to support Sustainable Urban Sanitation in TN: Primary Study Report | March 2016 43
Plate 3-12: Surface Storm Water Drains in Pammal
Source: IIHS Primary Study, 2015
During monsoon, the areas of Moongil Eri (Ward 12), Mumthamizh Nagar (Ward 11) and
Lakshminarayan Nagar (Ward 12) are prone to heavy water logging due to their proximity to the natural
storm water drains. Two rescue-camps are designated viz. Annai Velankanni School and Sri Shankara
Arts & Science College, for people to take shelter during heavy flood. Please refer to Map 3 for the
drainage pattern and the coverage of constructed storm drains in the town.
While Storm-water and grey water from the households and establishments flows in to the surface
drains in the town, it is common to observe a large number of toilets draining excreta into the drains
directly or indirectly. With the recent drive conducted by the municipality, if is claimed that all such toilets
and tanks, draining in to the open drains, have been plugged. However, visual evidence of toilets
directly draining into drain is not uncommon. In addition, given the construction and management
practices of toilets and the “septic” tanks, as described, it is highly likely that untreated fecal matter finds
its way into drains through sub-surface leakage.
In deployment of staff for “sanitary” functions, solid waste management accounts for the major share,
followed by drain-cleaning, as presented in Box 4.
Box 4: Staff Deployment in Public Health (Sanitation) Section in Pammal Municipality
One Sanitary Inspector is responsible for solid waste management in Pammal. He is assisted by two sanitary supervisors (one looking after wards 1 to 11 and the other 12 to 21). There are 93 sanitary workers operating under these supervisors. Out of the 93 workers, 25 are employed as office assistants and public toilet care-takers, three are on deputation and five to 10 remain absent each day leaving about 60 workers available each day. About 30 of them are deployed for solid waste collection in the 5 wards and the other 30 undertake drain cleaning in the entire town.
This means that monitoring the construction of toilets, as-built practices, and their regular de-sludging
and maintenance, enjoys little priority and competent staff, leading to their neglect in the limited
resources that the town has.

Scoping Exercise to support Sustainable Urban Sanitation in TN: Primary Study Report | March 2016 44
Map 3: Storm Water Drainage Pattern & Coverage of Constructed Drains in Pammal
Source: Pammal Municipality and IIHS Primary Study, 2015
Complete coverage of Storm Drains
Partial coverage of Storm Drains
To Adayar River
Moongil Eri
To Airport
Rescue Centers
Indudation Areas
Muthamizh Nagar
Lakshminarayana
Nagar
Sri Shankara Arts
& Science College
Annai Velankanni
School

4Profile of
the Town
Panchayats
4.1 Location of Town Panchayats Cluster 47
4.2 Demographic and Socio-Economic
Profile of Town Panchayats47
4.3 Connectivity and Transportation 50
4.4 Housing and Slums 50


Scoping Exercise to support Sustainable Urban Sanitation in TN: Primary Study Report | March 2016 47
4 Profile of the Town Panchayats 4.1 Location of Town Panchayats Cluster
4.1.1 Location and Regional Context
The contiguous cluster of town panchayats consisting of Periyanaicken-palayam, Narsimhanaicken-
palayam, Veerapandi (No. 4) and Idigarai are situated 17 km north of Coimbatore city. The Kousika
River flowing east to west divides Periyanaicken-palayam and Narsimhanaicken-palayam. Idigarai is
located in the east of the towns Periyanaicken-palayam and Narsimhanaicken-palayam and Veerapandi
(No.4) is on the northern side of Periyanaicken-palayam.
Figure 4-1 Location of Town Panchayats
Source: (Wikipedia, 2016) and TWAD Board

Scoping Exercise to support Sustainable Urban Sanitation in TN: Primary Study Report | March 2016 48
4.1.2 Linkages and Connectivity
The major road is the Highway No. 67 running from Coimbatore to Gundlupete (near Hosur) via Ooty
connects the towns of Periyanaicken-palayam and Narsimhanaicken-palayam to Coimbatore and
Mettupalayam. Local roads radiating to the east from the highway connect Veerapandi (No. 4) and
Idigarai. Veerapandi (No. 4) road running north to south connects Veerapandi (No. 4) to Periyanaicken-
palayam and Idigarai.
Periyanaicken-palayam and Narsimhanaicken-palayam along the highway are very well connected by
buses (both Govt. and Private buses) running between Coimbatore and Ooty and further north. Private
busses connect the towns internally. A railway line between Coimbatore and Mettupalayam runs almost
parallel to highway no. 67. A passenger train runs 5 times in a day. There is a railway station in
Periyanaicken-palayam and Narsimhanaicken-palayam. The nearest Airport is the Coimbatore Airport
which is well connected by domestic flights to various places in India and abroad.
4.1.3 Physiography and Topology
All the study towns are plain with a gradual slope from the west to the east. On the west is a Kurudi Hill
range draining the rainwater falling on it creating a natural drainage system of a small river and streams
passing through the study towns.
Figure 4-2: Kurudi Hill Range on the western side of the TP cluster
Source: IIHS Primary Study, 2015
4.2 Demographic and Socio-Economic Profile of Town Panchayats
4.2.1 Population and Growth
A cluster of four Town Panchayats were covered as a part of this Primary Study. Details about the four
Town Panchayats are not always comparable, but are being presented to provide a flavor of contexts
and issues. The population size of the town panchayats studied in Coimbatore ranges between 8,600
and 26,000 with an average household size of 4, similar to the State average.

Scoping Exercise to support Sustainable Urban Sanitation in TN: Primary Study Report | March 2016 49
Table 4-1 Population of Studied Town Panchayats
Sl. No. Name of the Town Panchayat Population (2011) No. of Households
01 Periyanaicken-palayam 25,930 7,377
02 Narsimhanaicken-palayam 17,858 5,023
03 Veerapandi (No. 4) 16,953 4,740
04 Idigarai 8,686 2,491
Source: Census 2011
Periyanaicken-palayam showed steady population growth at the rate between 20 to 30 per cent each
decade from 1971 to 2001 but slowed down to 14 per cent increase in the 2001-2011 decade.
Narsimhanaicken-palayam town’s population grew a maximum of 62 per cent between 1991 and 2001
and about 60 per cent in the following decade. It experienced steady growth of about 20 per cent
between 1971 and 1991 (refer to Table 4-2 for details). The decadal population details of Veerapandi
(No. 4) and Idigarai were not available.
Table 4-2 Population Growth in Periyanaicken-palayam & Narsimhanaicken-palayam
Sl. No
Year Periyanaicken-palayam Narsimhanaicken-palayam
Population Decadal Growth Rate Population Decadal Growth Rate
01 2011 25930 14 % 17858 58 %
02 2001 22844 27 % 11271 62 %
03 1991 18043 21 % 6972 21 %
04 1981 14914 22 % 5779 19 %
05 1971 12200 - 4843 -
Source: Town Directory, 2001; PCA 2011
There is a even distribution of men and women in each of the towns, sex ratio is in the range of 993 to
1000 which is equivalent to the state average of 1000. The population below the age of 6 is about 8 to
9 per cent of the total population, almost equal to the state average of 10 per cent. However, the sex
ration among children below 6 years varies in each town, Narsimhanaicken-palayam has the highest
ratio of 1017 and Periyanaicken-palayam is the lowest with 894.
4.2.2 Literacy and Education
Periyanaicken-palayam and Narsimhanaicken-palayam have literacy levels marginally higher than the
State average of 87 per cent, at 89 and 88 per cent respectively. Veerapandi (No. 4) has 85 per cent
literate population and Idigarai reported 80 per cent. Male literacy rates are near to the state average
of 92 per cent in Periyanaicken-palayam and Narsimhanaicken-palayam but a little lower in Veerapandi
(No. 4) and Idigarai. Female literacy is more than 80 per cent in 3 of the towns except Idigarai, having
only 74 per cent.
4.2.3 Social Composition
About 14.2 per cent of Urban Tamil Nadu belongs to Scheduled Castes; in urban Coimbatore the figure
drops slightly to 13.3 per cent. These figures are however, below the overall state average of 20 per
cent. In urban Tamil Nadu, Arunthatiyars constitute the largest single caste group, accounting for 50
per cent of the scheduled caste population. In urban Coimbatore, this group forms 38.7 per cent of the
total population of Scheduled Castes, with Adi Dravidas adding to 18 per cent of the total. The portion
of Scheduled Caste population in the study towns (Periyanaicken-palayam, Narsimhanaicken-palayam,
Scoping Exercise to support Sustainable Urban Sanitation in TN: Primary Study Report | March 2016 50
Veerapandi & Idigarai) is in the range of 6 to 16 per cent. In the study towns, these two castes –
Arunthathiyars and Adi Dravidas - again form the largest section according to Census 200 (Census
2011 data for Scheduled Castes and Tribes at the sub-district level, is awaited).
In the case of Scheduled Tribes, the figures for urban Tamil Nadu and urban Coimbatore stand at 0.4
per cent and 0.3 per cent. In contrast, the share of Scheduled Tribes in the overall state and district
population is 1.1 per cent and 0.8 per cent respectively. The study towns have an even lower share of
Scheduled Tribes in their populations- ranging from 0.03 per cent to 0.2 per cent. Kattunayakans and
Irulas are the largest Scheduled Tribes in the share of urban population in the state, forming 23 and 21
per cent of all Scheduled Tribes. In urban Coimbatore, Irulas and Malasars are the numerically dominant
amongst Scheduled Tribes, forming 26 and 25 per cent of all Scheduled Tribes. The Town Directory of
2001 lists Kurumans and Irulas as the largest tribal groups in the study areas.
Hindus are the dominant religious group, forming more than 90 per cent of the population in all the study
towns. Christians account for a small portion and very less portion of Muslims in the towns. More than
half of the people speak Tamil in 3 of the towns except Veerapandi (No. 4) where 90 per cent speak
Tamil. Telugu, Kannada, Malayalam and Urdu are also spoken in the study towns.
4.2.4 Workforce Participation
The workforce participation rate in the towns is in the range of 47 to 53 per cent, near to the State Urban
average of 44 per cent. Male workforce participation rate stands between 65 to 70 per cent, while female
workforce participation rate is in the range of 27 to 35 per cent. Idigarai leads in workforce participation
rate among the study towns.
Portion of main workers is in the range of 42 to 48 per cent of the total working population, about 60 per
cent are male and the rest female. Marginal workforce ranges between 3 to 5 per cent of the total
working population in the towns.
4.3 Connectivity and Transportation
4.3.1 Public Transport System
Periyanaicken-palayam and Narsimhanaicken-palayam have access to a good public transport system
as the highway connecting Coimbatore and Mettupalayam goes through the towns. The frequency of
buses to either ends is as high as one in every 10 minutes during the day time. The towns of Idigarai
and Veerapandi (No. 4) are moderately connected by private buses.
Railway Stations in Periyanaicken-palayam and Narsimhanaicken-palayam provide access to the
passenger train running five times a day between Coimbatore and Mettupalayam.
4.3.2 Individual Transport System
According to Census 2011, about half (44 to 51 per cent) of the households in the towns own a
motorized two wheeler. The ownership of a four-wheeler ranges between 5 to 9 per cent of the total
households in the study towns.
4.4 Housing and Slums
4.4.1 Housing
Majority of the houses in town panchayats are to a level of ground or ground plus one floor above.
There are few group houses and small apartments seen in Periyanaicken-palayam and
Narsimhanaicken-palayam. Census 2011 data reports the predominant material, more than 50 per cent

Scoping Exercise to support Sustainable Urban Sanitation in TN: Primary Study Report | March 2016 51
(except in Idigarai), for roof construction as concrete suggesting. Burnt bricks are mainly used for
construction of walls in the towns (50 to 77 per cent), but a good proportion of households also use un-
burnt or mud bricks for wall construction. Flooring is mainly made in cement or covered with mosaic or
floor tiles in the house in the studied towns. Please refer to Annexure 4 for details on materials used for
the construction of houses in the towns.
The housing and settlement typologies in the Study Town Panchayats include slum-type settlements
with structures (using thatch, tiles, cloth, etc. for roofing); stand-alone houses (with roofing materials of
tiles and brick walls); stand-alone houses (with Cement Concrete roofing and Burnt Brick walls); and
the emerging G+1/2 housing structures. This range of housing typologies probably corresponds to the
historical evolution of these town panchayat areas, but not necessarily amenable to planned/unplanned
classifications except in some cases.
Plate 4-1 Housing typologies in Town Panchayats
Stand Alone Houses – Semi-Permanent and Permanent Houses in TPs
G+1 Households in the towns

Scoping Exercise to support Sustainable Urban Sanitation in TN: Primary Study Report | March 2016 52
Plate 4-1 Housing typologies in Town Panchayats
Source: IIHS Primary Study, 2015
4.4.2 Slums
According to Census 2011, in the study towns, about 7 to 12 per cent of the population lives in slums.
The number of people living in any one slum ranges from 600 to 2000 across the towns. Veerapandi
(No. 4) has the maximum portion of its population living in slums (12 per cent). The average household
size of slums in all the towns is about 4 (not too disimilar to the towns’ average). Scheduled Caste
families are predominant (almost 100 per cent) in the towns of Narsimhanaicken-palayam and Idigarai.
In the other two towns, the portion of Scheduled Caste families ranges between 20 to 40 per cent.
Please refer Annexure 4 for details on Slums gathered from the respective town panchayat offices.
Plate 4-2 Urban poor house typology in Town Panchayats
Source: IIHS Primary Study, 2015

5Urban
Environmental
Services Selected
Town Panchayat
Cluster in
Coimbatore5.1 Water Supply 55
5.2 Sanitation 58
5.3 Solid Waste Management 71
5.4 Storm Water Drainage 73

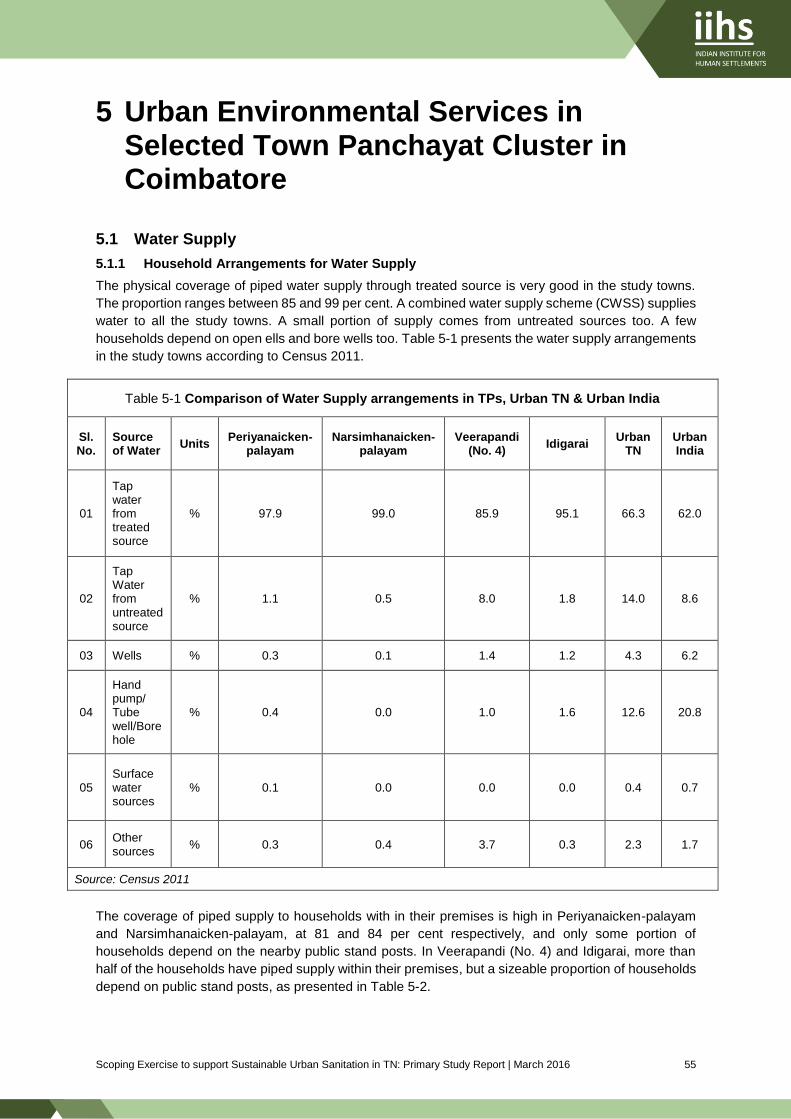
Scoping Exercise to support Sustainable Urban Sanitation in TN: Primary Study Report | March 2016 55
5 Urban Environmental Services in Selected Town Panchayat Cluster in Coimbatore
5.1 Water Supply
5.1.1 Household Arrangements for Water Supply
The physical coverage of piped water supply through treated source is very good in the study towns.
The proportion ranges between 85 and 99 per cent. A combined water supply scheme (CWSS) supplies
water to all the study towns. A small portion of supply comes from untreated sources too. A few
households depend on open ells and bore wells too. Table 5-1 presents the water supply arrangements
in the study towns according to Census 2011.
Table 5-1 Comparison of Water Supply arrangements in TPs, Urban TN & Urban India
Sl. No.
Source of Water
Units Periyanaicken-
palayam Narsimhanaicken-
palayam Veerapandi
(No. 4) Idigarai
Urban TN
Urban India
01
Tap water from treated source
% 97.9 99.0 85.9 95.1 66.3 62.0
02
Tap Water from untreated source
% 1.1 0.5 8.0 1.8 14.0 8.6
03 Wells % 0.3 0.1 1.4 1.2 4.3 6.2
04
Hand pump/ Tube well/Borehole
% 0.4 0.0 1.0 1.6 12.6 20.8
05 Surface water sources
% 0.1 0.0 0.0 0.0 0.4 0.7
06 Other sources
% 0.3 0.4 3.7 0.3 2.3 1.7
Source: Census 2011
The coverage of piped supply to households with in their premises is high in Periyanaicken-palayam
and Narsimhanaicken-palayam, at 81 and 84 per cent respectively, and only some portion of
households depend on the nearby public stand posts. In Veerapandi (No. 4) and Idigarai, more than
half of the households have piped supply within their premises, but a sizeable proportion of households
depend on public stand posts, as presented in Table 5-2.

Scoping Exercise to support Sustainable Urban Sanitation in TN: Primary Study Report | March 2016 56
Table 5-2 Location of water supply in TPs in comparison with Urban TN
Sl. No.
Source of Water
Units Periyanaicken-
palayam Narsimhanaicken-
palayam Veerapandi
(No. 4) Idigarai
Urban TN
01 Within the premises
% 81.4 84.2 65.4 50.6 54.0
02
Near the premises (within 100 m)
% 17.9 15.3 32.3 41.7 40.2
03 Away (> 100 m)
% 0.7 0.5 2.3 7.7 5.7
Source: Census 2011
5.1.2 Arrangements for potable water
a. Household Arrangements
The drinking water supply to the town is from a Combined Water Supply Scheme (CWSS) implemented
by TWAD Board. The main source of water is from Pilur Dam which is about 50 km away from the TP
cluster in The Nilgiris. Using the difference in altitude, water flows into the towns by gravity in to the
storage infrastructure, and further to the households and public taps.
In Periyanaicken-palayam, water reaching the town from the CWSS is stored in four overhead tanks
(OHTs) with a total installed capacity of 1.74 MLD situated at various locations in the town, as presented
in Table 5-3.
Table 5-3 Water Storage Infrastructure and Distribution in Periyanaicken-palayam
Sl. No. Location of OHT Capacity Zone Wards covered
01 Tiruvike Nagar 0.54 MLD 1 1, 2, 4, 18 and Part of 3
02 Raju Nagar 0.3 MLD 2 16, 17 and Part of 3
03 Housing Board 0.5 MLD 3 5, 11, 12, 13 and Parts of 10, 14 & 15
04 SRKV 0.4 MLD 4 6, 7, 8, 9 and Parts of 10, 14 & 15
Source: Periyanaicken-palayam Town Panchayat
The OHTs are filled up for about three times in a day, depending on the supply of water from the source,
and supplied to the households through house service connections and few public taps accessed by
urban poor. It is estimated by the TP officials that about 43 to 46 lakh liters of water is supplied through
this CWSS.
The frequency of supply to localities under each OHT is once in three days for a duration of about 2.5
hours. For example, if there are 10 to 15 streets or localities under each OHT, though the supply of
water to the OHT is continuous, the distribution to each locality is manually controlled and ensured that
each of the street or locality gets water at the frequency and duration mentioned above.

Scoping Exercise to support Sustainable Urban Sanitation in TN: Primary Study Report | March 2016 57
b. Public Provisioning
To provide access to drinking water to households who cannot afford to have a house service
connection, about 35 public stand posts are provided are convenient locations in the Periyanaicken-
palayam for the benefit of these households. The frequency and duration of supply is same as that
mentioned above.
Plate 5-1 Public Stand Posts delivering drinking water in Anna Nagar
Source: IIHS Primary Study, 2015
5.1.3 Arrangements for non-potable water
a. Household
A small proportion of households in the Study towns, have private bore wells or wells whence water is
pumped and used for non-potable purposes. Data is not available on the extent of these private
arrangements.
b. Public Provisioning
Since the water from CWSS is intermittent, in Periyanaicken-palayam, the Town Panchayat has
installed about 46 bore wells in the town to draw groundwater for non-potable use of public. Few of
these bore wells cater to public toilets, government buildings and institutions in the town, but the majority
deliver water to public stand posts across the town. There are about 2,500 such PSPs connected to
these bore wells and it is estimated that about 5,000 people depend on them in Periyanaicken-palayam.
In addition to the above mentioned bore wells, three public open wells with submersed pumps supply
water through PSP to three to four streets in the town. There are three hand pumps also in the town
used by the public.
Arrangement for water, both potable and non-potable purposes as described in sections 0 and 5.1.3
above are similar in the other study towns of Narsimhanaicken-palayam, Veerapandi (No. 4) and
Idigarai with variations in capacities and numbers.

Scoping Exercise to support Sustainable Urban Sanitation in TN: Primary Study Report | March 2016 58
5.1.4 Water Tariffs
The Town Panchayats provide water service connections to households, establishments and industries
from drinking water under the CWSS on paying a fixed one time connection charges. Thereafter, a
monthly user fee is levied for the usage of water. The rate fixed is a flat rate as volumetric metering is
not available. The tariffs for three Town Panchayats under study are presented in Table 5-4.
Table 5-4 Water Supply Connection Costs in TPs
Sl. No. Type of Connection Connection Charge (`) Monthly User Fee (`)
Periyanaicken-palayam:
01 Household 3,000 60
02 Commercial 5,000 140
03 Industrial 5,000 200
Narsimhanaicken-palayam:
01 Household 7,000 60
02 Commercial 11,000 135
03 Industrial 11,000 205
Idigarai:
01 Household 6,000 65
02 Commercial 12,000 125
03 Industrial 25,000 185
Source: Respective town panchayat offices, 2015
Public water supply i.e. through public stand post (under CWSS); and non-potable water from bore
wells, open wells and hand pumps; are all provided free of cost by the TPs.
5.2 Sanitation
5.2.1 Household Arrangements for Sanitation
According to Census 2011, close to 83 per cent of households have individual household latrines in
Periyanaicken-palayam. Of the remaining households, 13 per cent are dependent on public latrines
while more than three per cent engage in open defecation. Open defecation is reported to be common
in slums. For instance, the proximity of Vivekanandapuram and Kuppuchipalayam to railway tracks and
agricultural fields respectively, and difficulties in accessing individual and public toilets, are factors
explaining the continuance of open defecation in these locations.
In Narsimhanaicken-palayam, while 75 per cent of households in the town have individual household
latrines within their premises, close to 25 per cent do not own toilets. Public latrines are reported to be
serving more than 19 per cent of the town, leaving 5 per cent of households that practise open
defecation. Most of the households on Balavinayagar Nagar in this TP for instance, are reported to be
resorting to open defecation.
In Idigarai, only about 52 per cent of all households in the town have individual household latrines. Open
defecation is prevalent, with 26 per cent of households having no other sanitation option. The usage of
public latrines is also high, with 21 per cent of all households reported to be using these. Most
households in slum settlements do not have access to any sanitation facilities and defecate in the open.

Scoping Exercise to support Sustainable Urban Sanitation in TN: Primary Study Report | March 2016 59
About 72 per cent of households in Veerapandi (No. 4) have an individual household latrine. The
remaining 28 per cent of households are equally split between using public latrines and having to resort
to open defecation.
Slum Sanitation
Census 2011 reports that the slums of Idigarai have the highest open defecation rate of 96 per cent,
followed by Periyanaicken-palayam with 17 per cent of slum population defecating in the open.
Veerapandi (No. 4) and Narsimhanaicken-palayam have 14 per cent and 12 per cent of open defecation
being reported from the slums.
Only slums of the two towns of Periyanaicken-palayam and Veerapandi (No. 4) have individual
household latrines. The slums of Periyanaicken-palayam have the highest coverage of individual
household latrine i.e., 71 per cent of households have individual household latrines. In Idigarai, most
households in slum settlements do not have access to any sanitation facilities and defecate in the open.
The slums of Narsimhanaicken-palayam are heavily depending on public latrines, reported to be up to
88 per cent.
5.2.2 Household Arrangements in Study Households
a. Households with individual toilets
Among the ten households studied by the team, 8 households have Indian pour flush toilets and two
households have both western and Indian pan type. A rich landlord household (in Periyanaicken-
palayam) reported five toilets in their house of which four were cistern flush western type, and one an
Indian type within the premises for the visitors.
Three houses have recently constructed toilets in Periyanaicken-palayam and Narsimhanaicken-
palayam. In Periyanaicken-palayam, two of the households built have toilets five years ago. Earlier they
used to defecate in the open, and report that they needed time to plan financially and afford the
construction of toilet. They reported having spent about Rs. 50,000 on the construction of their toilets.
All the study houses have latrines in working condition. Since all the latrines were built during the
construction of the houses, with the exception of two households, respondents were unable to provide
cost break-down exclusively for their toilets.
b. Households dependent on public toilets
In Periyanaicken-palayam, the team interacted with four households who use public toilets at
Vivekanandapuram and Annanagar. The Vivekanandapuram public toilet has 6 seats for men, 6
women. One of the user families, with a house located about 200 m away, uses this toilet facility, but
they have a bathroom in their house which they use for bathing and washing.
In Ward no 7, Annanagar, about 450 houses are located along the stretch of the storm water drain built
on Poramboke Land2 according to the residents. Only four of these houses have built toilets, and other
households were constrained by lack of space, and are dependent on the public toilet provided at the
end of the street. Concerns raised by these users included:
i. The number of users is high and hence the loading rate is high per seat.
ii. Due to over-loading, there is continuous odor problem.
2 A class of land meaning Wasteland for grazing etc.

Scoping Exercise to support Sustainable Urban Sanitation in TN: Primary Study Report | March 2016 60
iii. The sanitary worker deployed to clean, comes only on alternate days. He is an old man and
suffers from illnesses and hence not able to look after the toilet adequately.
iv. Users also complained about irregular cleaning, and disinfectants not being used.
c. Households practicing Open defecation
In Veerapandi (No. 4), the team observed contrasting situations of people defecating in the open. Two
wards representing two different circumstances namely i. People who refuse to use public toilets; and
ii. People who continue to defecate in the open in spite of having individual toilets. Box 5 presents
some of the anecdotes of how open defecation is viewed by different stakeholder groups.
Box 5: Open Defecation – constraints and practices
Open defecation is a common sight along the railway station street in ward number 10 of Veerapandi (No. 4). The ward councilor for that ward (elected four years ago) has been struggling to convince and change the attitude of residents of Indranagar who refuse to use the public toilet built in Devinagar which is about 500 m away. Every day early morning she comes out for inspection but her efforts are in vain: “controlling 250 people from defecating in the open is a huge number for a single lady”. Ward X of Veerapandi (No. 4) has 250 households (with a population of 750) of which 50 houses have toilets. Of the remaining 200 households, about 150 households are from S-nagar who use the public toilet. The remaining houses are in Annanagar who refuse to use the public toilet and defecate in the open. They prefer usually early mornings from 5 am to 7 am, or late evenings when it is dark from 7 pm to 11 pm. The Town Panchayat Chairman also requested assistance from factory owners nearby but this is yet to bear fruit. The ward councilor of Ward No X admits that he and his family members do not use the toilet within their house. His family has shifted to this locality five years ago when government allocated land for people under the Basic Services for Urban Poor (BSUP) scheme. The toilet was built about a year ago and is connected to a soak pit. The family is not aware of how the toilet is constructed and the function of the soak pit hence, he feels by using the toilet, the wastewater from the toilet will overflow in front of his house as there is no drainage or provision made for sewage to flow. Now the toilet is used as a store room of fodder for cattle and sheep.
A detailed survey was conducted in Periyanaicken-palayam by the TP staff to identify households
without toilets to plan for benefits under SBM, and also as a baseline assessment for a septage
management project concept proposed by TWAD Board in 2014. It was identified that 1,118 households
in Periyanaicken-palayam do not have toilets, but 542 out of these do not have space for construction
of individual toilets. Therefore, a demand for construction of 576 individual toilets was proposed for this
town. Under SBM, for the year 2015-16, a target of 86 toilets has been set by the TP officials for
households. The applications were issued to the households, received and uploaded and are awaiting
sanction from the State Govt. Ward wise details of households without toilets are included in the
Annexure 4.
5.2.3 On-site systems
a. Type of on-site systems
From field observations, the predominant on site sanitation system appears to be the “septic tanks”.
Based on interactions with local masons and builders, these can be further classified into Septic Tanks,
Cess pits and twin pit latrines, as presented in Table 5-5.

Scoping Exercise to support Sustainable Urban Sanitation in TN: Primary Study Report | March 2016 61
Table 5-5 : Types of On-site systems
Sl. No.
Type Name of
the system Shape No. of Chambers
Water tightness
Outlet Arrangement
01 Type I Septic tank Rectangular Single chamber Porous No outlet
02 Type II Septic tank Rectangular Double chamber Water tight Soak pit
03 Type III Septic tank Rectangular Double chamber porous Soak pit
04 Type IV Twin Pit Circular Single chamber Porous No outlet
05 Type V Cess pit Circular Single chamber Porous Percolating to ground
Source: IIHS primary study 2015
Please refer to Table 5-6 for illustration of the above mentioned on-site containment systems prevalent
in the study town panchayats of Coimbatore.
Table 5-6 : Illustration and Description of Type of Septic Tanks
Type 1: Type 2:
Dimension (LxBxD): 6’x 4’x 8’
Chambers: 1
Base: Porous
Walls: Porous or Non-Porous
Top Slab: RCC
Access Cover (Y/N): Yes
Soak Pit: No
Other details: Generally noticed in single or double dwelling units (low and middle income group)
Dimension (LxBxD): 8’x 5’x 10’
Chambers: 2 (partition wall at the center with holes)
Base: Non-Porous
Walls: Non-Porous
Top Slab: RCC
Access Cover (Y/N): Yes
Soak Pit: Yes (4’dia & 5’deep)
Other details: Generally noticed in single or double dwelling units (middle or high income group)

Scoping Exercise to support Sustainable Urban Sanitation in TN: Primary Study Report | March 2016 62
Table 5-6 : Illustration and Description of Type of Septic Tanks
Type 3: Type 4:
Dimension (LxBxD): 8’x 5’x 10’
Chambers: 2 (partition wall at the center with holes)
Base: Porous
Walls: Porous or Non-Porous
Top Slab: RCC
Access Cover (Y/N): Yes
Soak Pit: No
Other details: Generally noticed in single or double dwelling units (low and middle income group)
Dimension (Diameter & Depth): 4’x 8’
Chambers: 2 (Twin Pits - used alternatively)
Base: Porous
Walls: Porous
Top Slab: RCC, Thatch, Wood etc.
Other details: Generally noticed in single or double dwelling units (low income group)
Type 5: Cess-Pit
Dimension (Diameter & Depth): 4’x 8’
Chambers: 1
Base: Porous
Walls: Porous (made of stone)
Top Slab: RCC, Thatch, Wood etc.
Other details: Generally noticed in single or double dwelling units (low income group)
Source: IIHS Primary Study 2015

Scoping Exercise to support Sustainable Urban Sanitation in TN: Primary Study Report | March 2016 63
Twin Pit Latrines
An example of a twin-pit latrine is to be seen in the house in Periyanaicken-palayam, who is a tenant in
the house built by a temple trustee since 7 years. This house has a twin pit latrine where twin pits are
laid adjacent to the toilet. Each pit is of 1.5 m Diameter and 6 feet deep. The first pit was cleaned 6
years back and the second pit was cleaned last year.
Plate 5-2 Twin Pit System in Periyanaicken-palayam
Source: IIHS Primary Study 2015
Septic Tanks
The standards prescribed for design and construction of septic tanks by CPHEEO and the BIS, and the
actual practice on ground in the Study Town Panchayats, in terms of structural masonry, septic tank
size and design, and disposal systems, are presented in Table 5-7.
Table 5-7 : Design Norms vs Construction in Practice of Septic tanks
Sl. No.
Aspects of Septic
Tank Standard Design Norms Observed construction practice
01 Structural Masonry
Septic tank functions as a solid –liquid separation tank which should hold sewage for about two days. The supernatant is to flow out and the solids to settle down and thicken at the bottom so that it can be removed after two to three years. As per CPHEEO standards, it is recommended that the septic tank should be constructed using cement concrete with water proofing. This is to avoid percolation by achieving water tightness.
Households prefer to just construct two walls and at the bottom use the Plain Cement Concrete plinth with a bed of 40mm coarse aggregates (a mixture of sand, rubble and crushed stones). This practice, according to local masons, facilitates increased holding time and delays period to de-sludging since sewage percolates due to the absence of water proofing.

Scoping Exercise to support Sustainable Urban Sanitation in TN: Primary Study Report | March 2016 64
Table 5-7 : Design Norms vs Construction in Practice of Septic tanks
Sl. No.
Aspects of Septic
Tank Standard Design Norms Observed construction practice
02
Septic Tank Size and Design
As per CPHEEO standards, the size of septic tanks is to be determined based on the household size and desired de-sludging frequency,
In practice, masons and builders are observed to oversize the septic tanks. The Study revealed that the size of the septic tank is a function of financial capability, space availability and the imperative to avoid frequent de-sludging. Hence, households prefer to build larger and deeper septic tanks if they can afford it and if they have sufficient space. According to masons, client households seek to avoid the recurring operational cost of de-sludging the septic tanks. Hence, masons build bigger tanks without bottom lining to make way for percolation. The de-sludging interval for ICC metal aggregates lined septic tank is expected to be once in four years.
03 Disposal Systems
There are two types of wastes generated in septic tank
1. Liquid effluent which comes out of outlet every day;
2. Settled solids in the form of sludge that needs to be removed once in two or three years.
For the liquid effluent, treatment is deemed appropriate by methods like soak pits or dispersion trenches with the caution that these sub-soil dispersion systems shall be at least 20 m away from any drinking water source. The distance between the soak pit and adjacent dwelling is recommended to be at least 7 m to avoid any corrosive effect due to tank gases vented into atmosphere. Sludge needs to be emptied by mechanical vacuum tankers and should be sent for further treatment at sludge treatment units at sewage treatment plants or appropriate septage treatment facility. For this regular de-sludging, access covers need to be provided.
For liquid effluent, there are two categories of arrangements with outlet: earlier the septic tank outlets were let into storm water drains to receive the liquid waste. Now, TPs are attempting to get all such outlets sealed, and the drains only receive the sullage i.e. kitchen and bathroom wash water. Soak pits: In order to avoid frequent de-sludging, the outlet of septic tank is connected to soak pits. Masons report providing soak pits at a distance of about 10 feet from the septic tank and about 20 feet away from the bore well in each house. One of the households, with G+1 floor has five toilets, for which a septic tank of L= 10ft X B = 8 ft X D = 10 ft is provided (at a construction cost of Rs. 70,000 approximately). The mason has acquired this knowledge from his father. The septic tank has no baffle walls. It is under the house structure, and the dimensions are based on an intended de-sludging frequency of about five years. A soak pit is not provided as it is perceived to be not good for soil and de-sludging using cess pool vehicle is considered safer practice.
Source: CPHEEO, IIHS Primary Study 2015
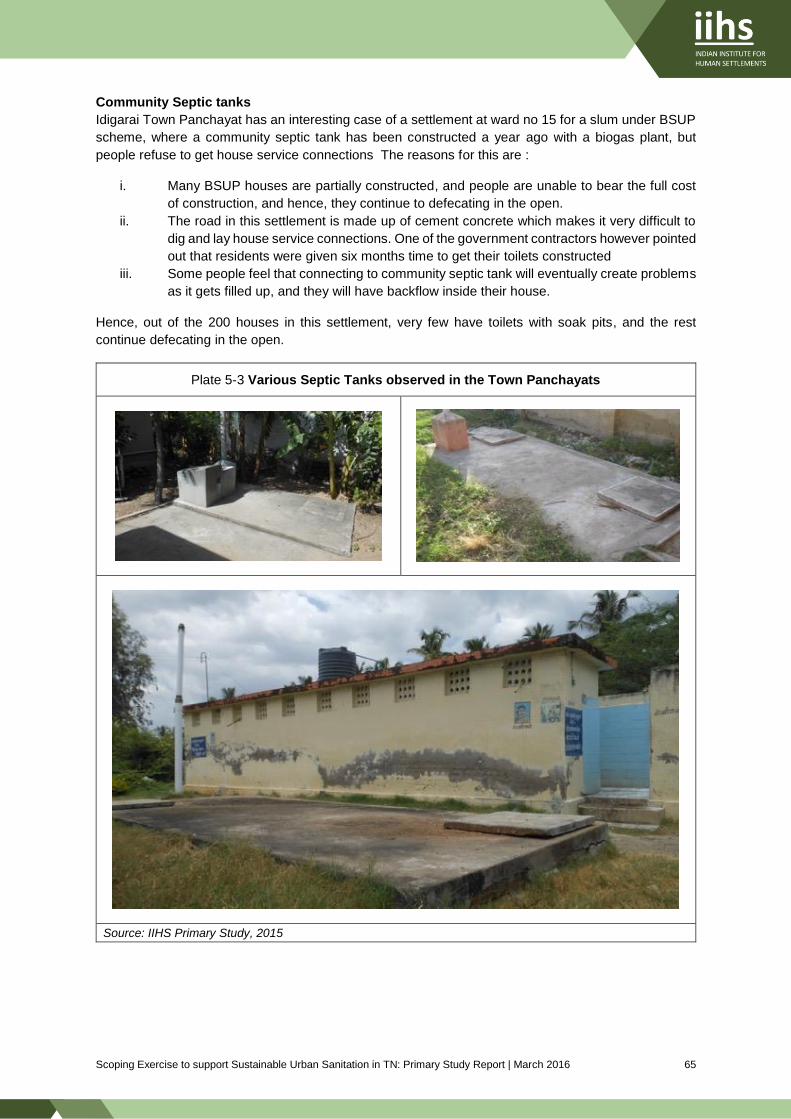
Scoping Exercise to support Sustainable Urban Sanitation in TN: Primary Study Report | March 2016 65
Community Septic tanks
Idigarai Town Panchayat has an interesting case of a settlement at ward no 15 for a slum under BSUP
scheme, where a community septic tank has been constructed a year ago with a biogas plant, but
people refuse to get house service connections The reasons for this are :
i. Many BSUP houses are partially constructed, and people are unable to bear the full cost
of construction, and hence, they continue to defecating in the open.
ii. The road in this settlement is made up of cement concrete which makes it very difficult to
dig and lay house service connections. One of the government contractors however pointed
out that residents were given six months time to get their toilets constructed
iii. Some people feel that connecting to community septic tank will eventually create problems
as it gets filled up, and they will have backflow inside their house.
Hence, out of the 200 houses in this settlement, very few have toilets with soak pits, and the rest
continue defecating in the open.
Plate 5-3 Various Septic Tanks observed in the Town Panchayats
Source: IIHS Primary Study, 2015

Scoping Exercise to support Sustainable Urban Sanitation in TN: Primary Study Report | March 2016 66
Cess Pool/ Cess Pits
A cesspool is a large structure consisting of concrete cylinder rings with an open bottom or perforated
sides. It is usually a meter in diameter and four to five meters deep. It is covered with a hatch, and the
sewage is kept in it till it is automatically biodegraded. The solids are settled deep inside the base of
the cesspool while the liquid percolates into the soil through the concrete. The difference between septic
tank and cess-pool appear to be:
* Cesspools do not treat wastewater while septic tanks have sewage treatment options.
* Cesspools are underground well-like containers used for the storage of biodegradable substances
while septic tanks are mainly used to store human waste and have a drainage facility. Plate 5-4 shows
the design of a typical cess pit
Plate 5-4 Cess pits in TPs
Source: IIHS Primary Study, 2015
Box 6 - Concrete rings for constructing cess-pits: at Idigarai
• Manufacturers of cess pit rings have started their business in Idigarai in recent months, after obtaining training in Singanallur. Concrete rings of different diameters ranging from 2 ft to 6 ft are made, for which pre-cast molds of these diameters are available. The materials used are cement, jelly, sand and reinforced steel. The mixture is poured and allowed to settle for one week, by cured.
• About 20 pieces are sold in one month at a price of Rs. 350 per ring, including delivery and installation.
• These rings are not only used in constructing cess pits but also in water-holding sumps.
• Rings used for cess pit, are provided with holes. Holes are provided for the convenience of lifting and installing, and to allow sewage percolation.
• Rings are preferred over stone structures since the earth filling between the walls tends to get damp resulting in collapse of the structure collapses. Concrete rings do not collapse, and become stronger by absorbing moisture.
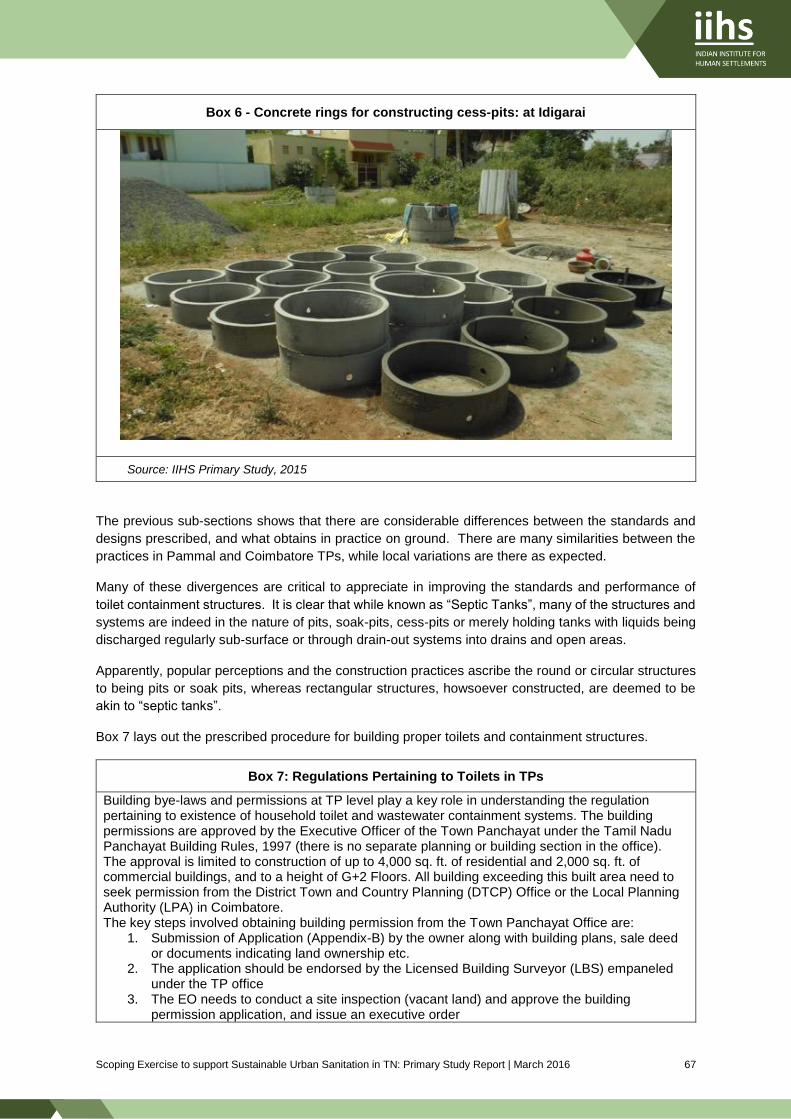
Scoping Exercise to support Sustainable Urban Sanitation in TN: Primary Study Report | March 2016 67
Box 6 - Concrete rings for constructing cess-pits: at Idigarai
Source: IIHS Primary Study, 2015
The previous sub-sections shows that there are considerable differences between the standards and
designs prescribed, and what obtains in practice on ground. There are many similarities between the
practices in Pammal and Coimbatore TPs, while local variations are there as expected.
Many of these divergences are critical to appreciate in improving the standards and performance of
toilet containment structures. It is clear that while known as “Septic Tanks”, many of the structures and
systems are indeed in the nature of pits, soak-pits, cess-pits or merely holding tanks with liquids being
discharged regularly sub-surface or through drain-out systems into drains and open areas.
Apparently, popular perceptions and the construction practices ascribe the round or circular structures
to being pits or soak pits, whereas rectangular structures, howsoever constructed, are deemed to be
akin to “septic tanks”.
Box 7 lays out the prescribed procedure for building proper toilets and containment structures.
Box 7: Regulations Pertaining to Toilets in TPs
Building bye-laws and permissions at TP level play a key role in understanding the regulation pertaining to existence of household toilet and wastewater containment systems. The building permissions are approved by the Executive Officer of the Town Panchayat under the Tamil Nadu Panchayat Building Rules, 1997 (there is no separate planning or building section in the office). The approval is limited to construction of up to 4,000 sq. ft. of residential and 2,000 sq. ft. of commercial buildings, and to a height of G+2 Floors. All building exceeding this built area need to seek permission from the District Town and Country Planning (DTCP) Office or the Local Planning Authority (LPA) in Coimbatore. The key steps involved obtaining building permission from the Town Panchayat Office are:
1. Submission of Application (Appendix-B) by the owner along with building plans, sale deed or documents indicating land ownership etc.
2. The application should be endorsed by the Licensed Building Surveyor (LBS) empaneled under the TP office
3. The EO needs to conduct a site inspection (vacant land) and approve the building permission application, and issue an executive order

Scoping Exercise to support Sustainable Urban Sanitation in TN: Primary Study Report | March 2016 68
Box 7: Regulations Pertaining to Toilets in TPs
4. The land owner needs to pay 1% of the building cost to the Manual Workers General Welfare Fund of the TNCWW Board Chennai before final approval
5. The owner of the land starts the construction of the building The presence of toilets and septic tank details in building application and drawings is a mandatory in both commercial and residential buildings proposed. However, the approval process needs much to be desired, and actual as-built construction of toilets or septic tanks is currently not monitored by the TP office before the building is put into use.
Hence, the above underlines the fact that households, masons and builders, as well as enforcement
agencies suffer from deficits that has resulted in the current situation. This also highlights the need for
considerable re-orientation and re-education of customers, masons and builders, as well as better
resourcing, staffing, and procedures of approving, enforcement and regulation agencies.
5.2.4 Transportation of Septage in Study TPs
About a decade ago, in Periyanaicken-palayam, septic tanks outflow was typically let out into open
drains. This practice was sought to be stopped by sealing such structures. However, many households
do not have properly constructed tanks. The town has a de-sludging truck but this is typically used for
removing the water from public toilet tanks. Much of this is reported to be disposed of in agricultural
fields with consent of the farmers. Apart from farm-lands, some of the de-sludging trucks are also
periodically reported to be disposing septage in open areas. In Narsimhanaicken-palayam, the TP is in
process of identifying land for disposal of septage.
Plate 5-5 Cess-Pool Vehicle operating in Idigarai
Source: IIHS Primary Study, 2015
5.2.5 Treatment of Septage
During the field visits it was observed that the septage from collected by the cess-pool vehicle (both
ULB’s and Private) discharge the waste in to agricultural lands. Farmers request for the septage as it is
rich in nutrients. The discharged septage is allowed to completely dry up and the land is ploughed and
cropped.

Scoping Exercise to support Sustainable Urban Sanitation in TN: Primary Study Report | March 2016 69
Plate 5-6 Land Application of Septage in Farm Lands as Soil Conditioner in Periyanaicken-palayam
Source: IIHS Primary Study, 2015
At present, there are no sewage or septage treatment facilities in or around these Town Panchayats
(Coimbatore STP being the closest facility). IIHS team’s interactions with the Assistant Engineer from
the ADTP office reveiled that the TWAD Board has proposed a concept plan for sewage management
in Periyanaicken-palayam in 2014. The main outfalls into Perumpallam Odai (main storm drain) are
identified, and it is proposed to intercept the flow at the check dam, collect the wastewater in an existing
well, and pumps it to the STP site. Refer to Plate 5-7 for the project concept diagram. The STP is
proposed to be situated at the old solid waste resource recovery park at Sathya Nagar (Cost details
shown in Table 5-8)
Plate 5-7 Flow Diagram proposed in Septage Management DPR
Source: Septage Management DPR, 2014

Scoping Exercise to support Sustainable Urban Sanitation in TN: Primary Study Report | March 2016 70
Table 5-8 : Cost Abstract of DPR for Septage Management Proposed by TWAD Board
Sl. No.
Description Amount
(`in Lakhs)
01 Cleaning, removal of debris, de-silting etc. at Perumpallam Odai 10.00
02 Pumping station at Lakshminagar 157.14
03 Pumping station at common collection well 51.87
04 Construction of STP 274.10
Sub-Total (1) 493.11
05 Contingency Charges @ 1% 4.93
06 Unforeseen Charges @about 2.5% 12.33
07 Provision for Road Restoration Charges to be paid to SH, NH, Railway Crossing etc.
107.00
Sub-Total (2) 617.37
08 Centage Charges @ 5% 30.87
Sub-Total (3) 648.24
09 Preparation of DPR @ 1% 6.48
Grand Total 654.72
Source: Asst. Engineer, ADTP – In-charge for Periyanaicken-palayam
The proposal is currently under consideration of the Govt. Small scale treatment systems are being
tried out in different locations in and around Coimbatore, one being a site inside a residential complex
in Idigarai.
Another example of innovation is observed in an integrated campus level management of wastewater
and re-use, Periyanaicken-palayam, as presented in Box 8.
Box 8- Sri Ramakrishna Mission – Industrial Training Institute in Periyanaicken-palayam
The Ramakrishna Mission has started a group of educational institutions from schools to diploma level in 150 acres of land on the main road of Periyanaicken-palayam. The interaction with one of the training officer there in ITI revealed that they have a full cycle of septage management in place. In ITI, the strength is 400 students with accommodation facility. The campus has 100 urinals and 10 toilets connected to a septic tank and two soak pits of 2 m dia. The septic tank was built ten years ago, and is 20 ft long and 20 ft deep. A separate collection tank is provided for wash water from urinals which is used for gardening. The Institution has its own cess-pool vehicle which desludges septic tanks and disposes the septage in their own agricultural land spanning 365 acres.
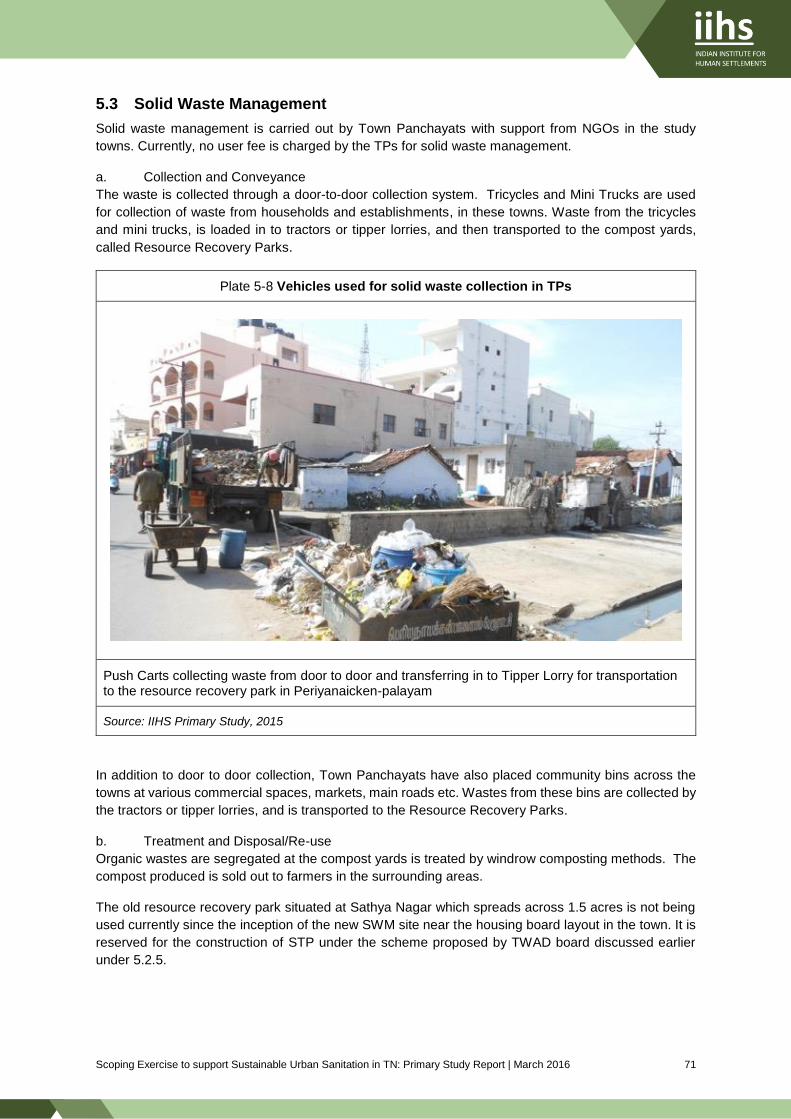
Scoping Exercise to support Sustainable Urban Sanitation in TN: Primary Study Report | March 2016 71
5.3 Solid Waste Management
Solid waste management is carried out by Town Panchayats with support from NGOs in the study
towns. Currently, no user fee is charged by the TPs for solid waste management.
a. Collection and Conveyance
The waste is collected through a door-to-door collection system. Tricycles and Mini Trucks are used
for collection of waste from households and establishments, in these towns. Waste from the tricycles
and mini trucks, is loaded in to tractors or tipper lorries, and then transported to the compost yards,
called Resource Recovery Parks.
Plate 5-8 Vehicles used for solid waste collection in TPs
Push Carts collecting waste from door to door and transferring in to Tipper Lorry for transportation to the resource recovery park in Periyanaicken-palayam
Source: IIHS Primary Study, 2015
In addition to door to door collection, Town Panchayats have also placed community bins across the
towns at various commercial spaces, markets, main roads etc. Wastes from these bins are collected by
the tractors or tipper lorries, and is transported to the Resource Recovery Parks.
b. Treatment and Disposal/Re-use
Organic wastes are segregated at the compost yards is treated by windrow composting methods. The
compost produced is sold out to farmers in the surrounding areas.
The old resource recovery park situated at Sathya Nagar which spreads across 1.5 acres is not being
used currently since the inception of the new SWM site near the housing board layout in the town. It is
reserved for the construction of STP under the scheme proposed by TWAD board discussed earlier
under 5.2.5.
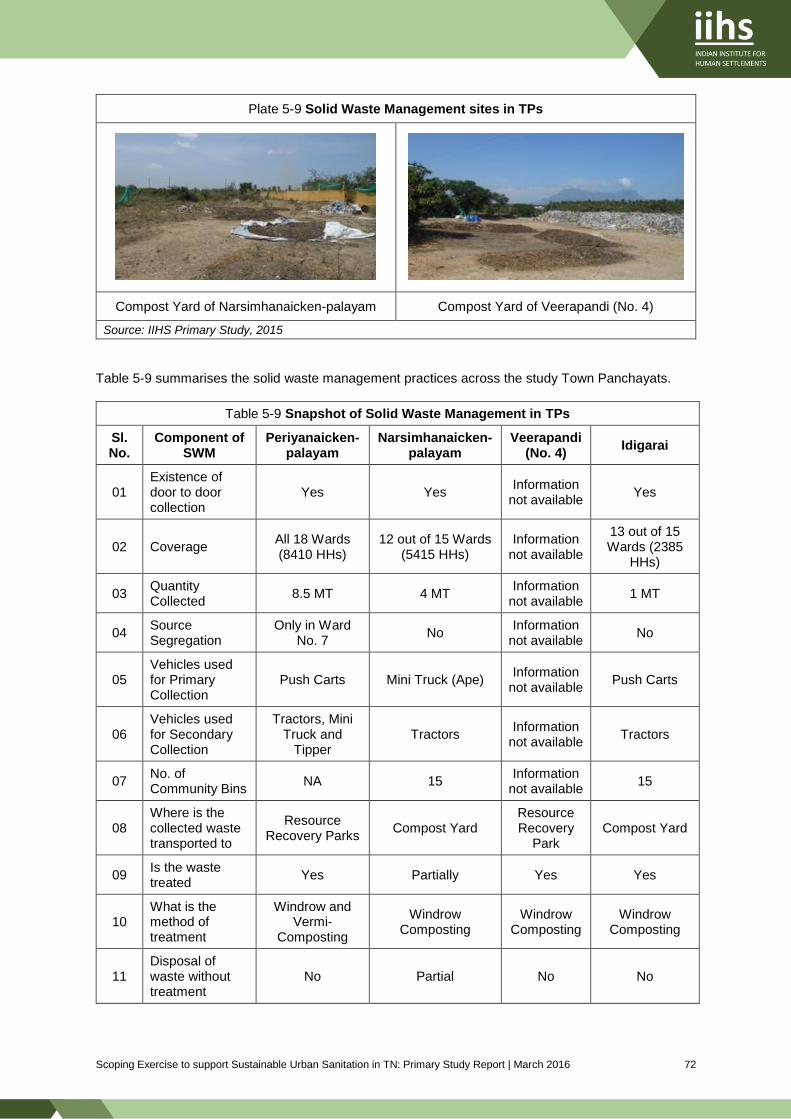
Scoping Exercise to support Sustainable Urban Sanitation in TN: Primary Study Report | March 2016 72
Plate 5-9 Solid Waste Management sites in TPs
Compost Yard of Narsimhanaicken-palayam Compost Yard of Veerapandi (No. 4)
Source: IIHS Primary Study, 2015
Table 5-9 summarises the solid waste management practices across the study Town Panchayats.
Table 5-9 Snapshot of Solid Waste Management in TPs
Sl. No.
Component of SWM
Periyanaicken-palayam
Narsimhanaicken-palayam
Veerapandi (No. 4)
Idigarai
01 Existence of door to door collection
Yes Yes Information
not available Yes
02 Coverage All 18 Wards (8410 HHs)
12 out of 15 Wards (5415 HHs)
Information not available
13 out of 15 Wards (2385
HHs)
03 Quantity Collected
8.5 MT 4 MT Information
not available 1 MT
04 Source Segregation
Only in Ward No. 7
No Information
not available No
05 Vehicles used for Primary Collection
Push Carts Mini Truck (Ape) Information
not available Push Carts
06 Vehicles used for Secondary Collection
Tractors, Mini Truck and
Tipper Tractors
Information not available
Tractors
07 No. of Community Bins
NA 15 Information
not available 15
08 Where is the collected waste transported to
Resource Recovery Parks
Compost Yard Resource Recovery
Park Compost Yard
09 Is the waste treated
Yes Partially Yes Yes
10 What is the method of treatment
Windrow and Vermi-
Composting
Windrow Composting
Windrow Composting
Windrow Composting
11 Disposal of waste without treatment
No Partial No No

Scoping Exercise to support Sustainable Urban Sanitation in TN: Primary Study Report | March 2016 73
Table 5-9 Snapshot of Solid Waste Management in TPs
Sl. No.
Component of SWM
Periyanaicken-palayam
Narsimhanaicken-palayam
Veerapandi (No. 4)
Idigarai
12 User fee for SWM services
No No No No
Source: Respective town panchayat offices, 2015
5.4 Storm Water Drainage
c. Natural storm water drainage
The surface run-off from the Kurudi Hill Range on the western side of the study Town Panchayats’
cluster, creates the dominant natural drainage pattern existing in the area. One of the main carrier is
the Kousika River that runs from the foot hill (north of the CRPF Training College in Narsimhanaicken-
palayam), dividing Periyanaicken-palayam and Narsimhanaicken-palayam, and flows eastwards
through Idigarai and further to as far as Tirrupur. Another stream originating from the foot hills, runs
north east to Periyanaicken-palayam and through Veerapandi (No. 4), and further to Karamadai and
beyond. A third stream flows from the hills through southern side of Narsimhanaicken-palayam and
drains in to the Kousika River.
Plate 5-10 Main Constructed Storm Water Drains in Periyanaicken-palayam and Narsimhanaicken-palayam
Main Storm Drain of Periyanaicken-palayam Main Storm Drain of Narsimhanaicken-
palayam
Check Dam on the Kousika River in Narsimhanaicken-palayam
Source: IIHS Primary Study, 2015

Scoping Exercise to support Sustainable Urban Sanitation in TN: Primary Study Report | March 2016 74
d. Constructed drains
There is a good coverage of constructed surface storm drains in all the study Town Panchayats, as
presented in photographs from these towns.
Plate 5-11 Surface Storm Water Drains in TPs
Source: IIHS Primary Study, 2015
6Conclusions


Scoping Exercise to support Sustainable Urban Sanitation in TN: Primary Study Report | March 2016 77
6 Conclusions The Secondary Review had highlighted the following issues for validation and further study as a part of
the Primary Study:
• Issues of Access
• Full Cycle sanitation
• Water Stress
• Public Health Outcomes
• Behaviour change
• Knowledge generation
• Institutional Priority to urban Sanitation and Financing
The fore-going Sections have highlighted a number of salient features in respect of access and the full
cycle of sanitation:
1) Open Defecation: It is quite clear that issues of access to sanitation, and the practice of open
defecation are important issues in urban Tamil Nadu. Study locations show that there are larger
deficits in the small Town Panchayats compared to the municipalities, but these also point to
two important issues. One, the nature of settlements, especially slums prevent individual
household toilets because of space and affordability constraints. These render communities to
be dependent on community and public toilets where these are available. Availability too may
not translate into regular use if these toilets are no maintained and managed properly, as
reported from many locations. Two, there is also reportage of members resorting to open
defecation even in households that have toilets. While cultural factors are used to explain such
behaviours, many are also related to perceived imperatives to reduce load on own toilets, and
hence prolong the period to de-sludging.
2) Toilet Design, Construction and Containment: In both the study locations, there is considerable
divergence noted between prescribed standards and actual practices. One, the Study shows
the considerable sub-types and variations of containment structures, a recurring theme being
porosity of base and side walls and typical over-design for size to avoid de-sludging for long
periods of time. Two, unlike popular perception, many of these structures are not “septic” or
safe containment mechanisms, but may be actually in the nature of pits, soak-pits, cess-pits or
merely holding tanks with liquids being discharged regularly sub-surface or through drain-out
systems into drains and open areas. Apparently, popular perceptions and the construction
practices ascribe the round or circular structures to being pits or soak pits, whereas rectangular
structures, howsoever constructed, are deemed to be akin to “septic tanks”.
3) De-sludging and Conveyance: at present, de-sludging services are provided by private
operators, and some ULBs have their own vehicles too. The equipment used include basic
trucks fitted with suction pumps, and safety gear does not seem to be used. Sludge operators
report a number of difficulties including unwillingness of households to clean regularly, non-
existence or very distant availability of locations to empty sewage, and other barriers to their
operations. Regulation has also reported to have been lax leading to disposal of sewage in
non-designated areas. De-sludging seems to be enjoying a negative perception amongst
households to be avoided as much as possible. This part of the chain requires considerable
strengthening both from the supply and demand side, supported by regulatory frameworks that
promote desirable safe conveyance practices.
4) Treatment and Safe Disposal: At present, there are only a few Sewage Treatment Plants in or
near the Study locations. Hence, the bulk of septage cleared from septic tanks is reported to
be emptied in farm fields with consent of farmers who utilize this as manure. The lack of STPs
or emptying points nearby seems to be the biggest constraint to safe treatment and disposal.

Scoping Exercise to support Sustainable Urban Sanitation in TN: Primary Study Report | March 2016 78
5) Linkage with other environmental services: the linkages of sanitation with other environmental
services viz. water supply, solid waste management, and drainage, are located in the urban
settlement pattern in these Study locations. The links of containment structures with drainage
is quite obvious when drains become repositories of not just sullage but also fecal matter.
Recent attempts to seal open discharge of toilets into drains appear to be bearing results, it is
not clear whether and to what extent sub-surface leakages find their way into drains, and pollute
groundwater. These issues will need further investigation.
6) Institutional and related issues: As highlighted in the Secondary analysis, the institutional
capacities of ULBs, especially the Town Panchayats, are limited. Further, the available
resources for sanitation are claimed a large measure by solid waste management, that is much
more visible to all stakeholders. It will take considerable effort, human and financial resources,
to accord institutional priority to the full chain of human excreta management, from improved
construction and maintenance of containment structure, to improved de-sludging and
conveyance, to finally, safe disposal and treatment.

Scoping Exercise to support Sustainable Urban Sanitation in TN: Primary Study Report | March 2016 79
Bibliography
Census of India. (2001). Town Directory. New Delhi: Office of the Registrar General of India.
Census of India. (2011a). Houselisting and Housing Census Data. Retrieved from:
http://www.censusindia.gov.in/2011census/hlo/HLO_Tables.html
Census of India. (2011b). Housing Stock, Amenities & Assets in Slums.
Census of India. (2011c). Primary Census Abstract. Retrieved from:
http://www.censusindia.gov.in/2011census/PCA/PCA_Highlights/pca_highlights_file/India/Chapter-
4.pdf
Census of India. (2011d). Primary Census Abstract for Slum Population. New Delhi: Office of the
Registrar General of India.
CPHEEO. (2013). Manual on Sewerage and Sewage Treatment Systems. New Delhi: Ministry of Urban
Development, Govt. of India.
GoTN. (2014). Operative Guidelines for Septage Management in Tamil Nadu. Chennai.
MoUD. (2008). National Urban Sanitation Policy. New Delhi Retrieved from
http://moud.gov.in/sites/upload_files/moud/files/NUSP_0.pdf.
WSP. (2014). Financial requirements of urban sanitation in India – An exploratory analysis. Retrieved
from New Delhi:
Map, O. S. (2016). Pammal. Retrieved March 5, 2016, from
http://www.openstreetmap.org/node/256202986#map=14/12.9738/80.1408
Wikipedia. (2016). Tamil Nadu. Retrieved March 5, 2016, from https://en.wikipedia.org/wiki/Tamil_Nadu

AnnexuresAnnexure 1 Instruments for Primary Study A3
Annexure 2 Note on Selection Criteria for Studies Towns A52
Annexure 3 Data Tables for Pammal A54
Annexure 4 Data Tables for Town Panchayats A62

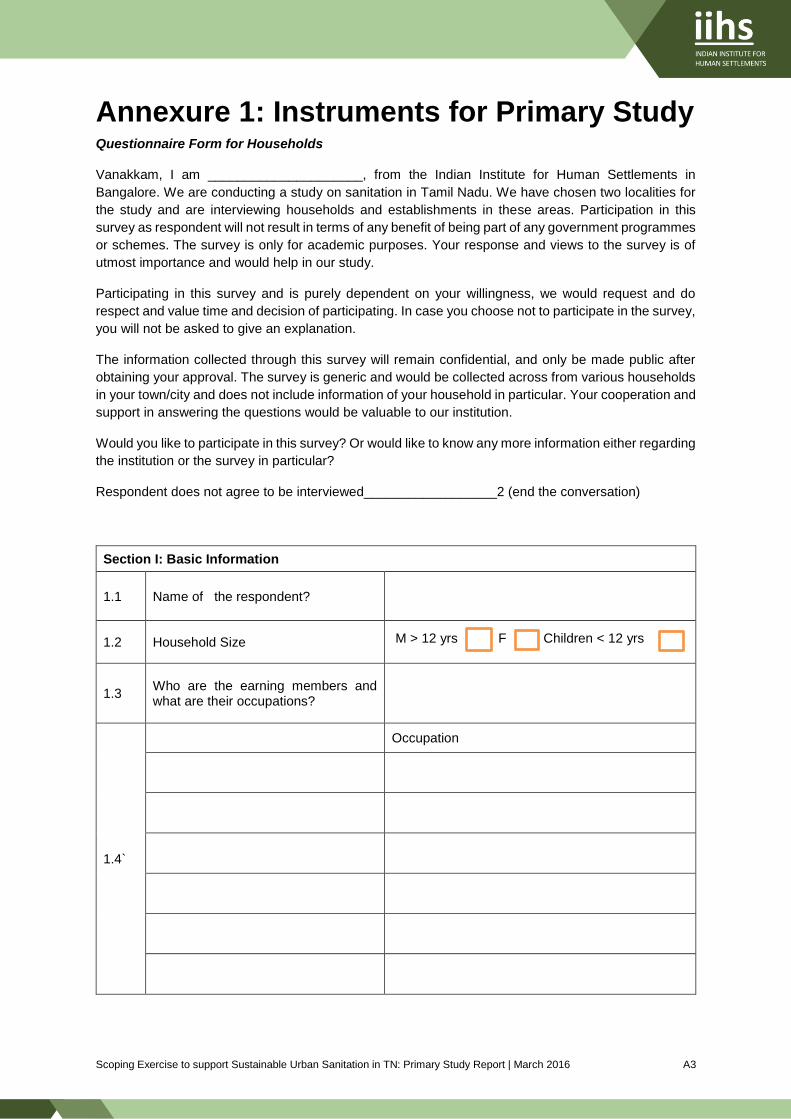
Scoping Exercise to support Sustainable Urban Sanitation in TN: Primary Study Report | March 2016 A3
Annexure 1: Instruments for Primary Study Questionnaire Form for Households
Vanakkam, I am _____________________, from the Indian Institute for Human Settlements in
Bangalore. We are conducting a study on sanitation in Tamil Nadu. We have chosen two localities for
the study and are interviewing households and establishments in these areas. Participation in this
survey as respondent will not result in terms of any benefit of being part of any government programmes
or schemes. The survey is only for academic purposes. Your response and views to the survey is of
utmost importance and would help in our study.
Participating in this survey and is purely dependent on your willingness, we would request and do
respect and value time and decision of participating. In case you choose not to participate in the survey,
you will not be asked to give an explanation.
The information collected through this survey will remain confidential, and only be made public after
obtaining your approval. The survey is generic and would be collected across from various households
in your town/city and does not include information of your household in particular. Your cooperation and
support in answering the questions would be valuable to our institution.
Would you like to participate in this survey? Or would like to know any more information either regarding
the institution or the survey in particular?
Respondent does not agree to be interviewed__________________2 (end the conversation)
Section I: Basic Information
1.1 Name of the respondent?
1.2 Household Size M > 12 yrs F Children < 12 yrs
1.3 Who are the earning members and what are their occupations?
1.4`
Occupation

Scoping Exercise to support Sustainable Urban Sanitation in TN: Primary Study Report | March 2016 A4
Section II – Housing
2.1. Do you own this house or is it rented?
Own
Rented/leased
Other _______________
2.2. How old is the building (in years)?
DKCS
2.3. Remarks

Scoping Exercise to support Sustainable Urban Sanitation in TN: Primary Study Report | March 2016 A5
Section III – Water Supply
3.1.
What are your major sources of water? (Mark all that are applicable)
Drinking and cooking Washing, Bathing, etc.
Summer
Other seasons Summer Other seasons
Piped water supply
Piped into dwelling
Piped into yard/plot
Public taps/ stand pipes
Tubewell or Borewell
Dug well
Protected
Unprotected
Water from Spring
Protected
Unprotected
Rainwater
Tanker/truck
Cart with small tank
3.2.
Surface water (river/dam/lake/pond/canal/ irrigation channel)
3.3. What is the distance to your primary source of water?
Within the house
Inside the compound
Outside the compound but within 200 m
Between 200 and500 m
Between 500 m and 1 km
Others (with remarks)
3.4.
What is the broad estimate of monthly expenditure on water and related expenses?
Piped water supply Remarks
Private water tankers
Informal water suppliers
Treated waste-water
Bottled water/cans
Others (Specify)
Total
Section IV: Individual Household Latrine

Scoping Exercise to support Sustainable Urban Sanitation in TN: Primary Study Report | March 2016 A6
4.1 Where is your latrine/s located?
Inside the house
Inside the premises
Outside the premises
4.2 What is the type of the latrine/s?
Improved Pit latrine
Unimproved pit latrine
Flush/Pour flush latrine connected to sewer system
Pour flush latrine connected to septic tank
Other flush/pour flush latrine
DKCS
Others (specify)______________
4.3 When was the latrine constructed?
4.4 Who was given the job of constructing the latrine?
Contractor
Mason
Self-made
Others specify) __________________
4.5 Who decided on the design, size and shape of the latrine?
Contractor
Mason
Self-made
Husband/ Wife
Decided together
Influenced by neighbour
Influenced by relative
Others specify) __________________
4.7 What was the time taken for constructing Septic tank?
4.8 What was the total expenditure in constructing the latrine?
4.9 Where does the waste water from the latrine go?
Stays inside the system
On to the street outside

Scoping Exercise to support Sustainable Urban Sanitation in TN: Primary Study Report | March 2016 A7
On to the drain outside
On to open areas outside
Others_______________
Others (specify) _________________________________
If the HH has a Pit Latrine, go to the following question. If the HH has a Septic Tank, go to question 4.22
4.17 What is the dimensions of the pit?
4.18 Is it single pit or a double pit? Single
Double
4.19 Have you ever cleaned the pit? Yes
No
Not required as of now
4.20 When was the pit last cleaned?
4.21 How was the pit cleaned? Manually
Mechanical (Vacuum truck etc.
Others_________________
4.22 Who owned the vacuum truck? Corporation
Private Operator
Others_________________
4.23 What was the expenditure for getting the tank cleaned?
4.24 Where is the sludge disposed of?
Treatment plant
Open field for drying
Open areas
Drains
DKCS
4.25 How long does the pit take to fill up? [In months/years]
DKCS
4.27 Remarks: if any other problems?
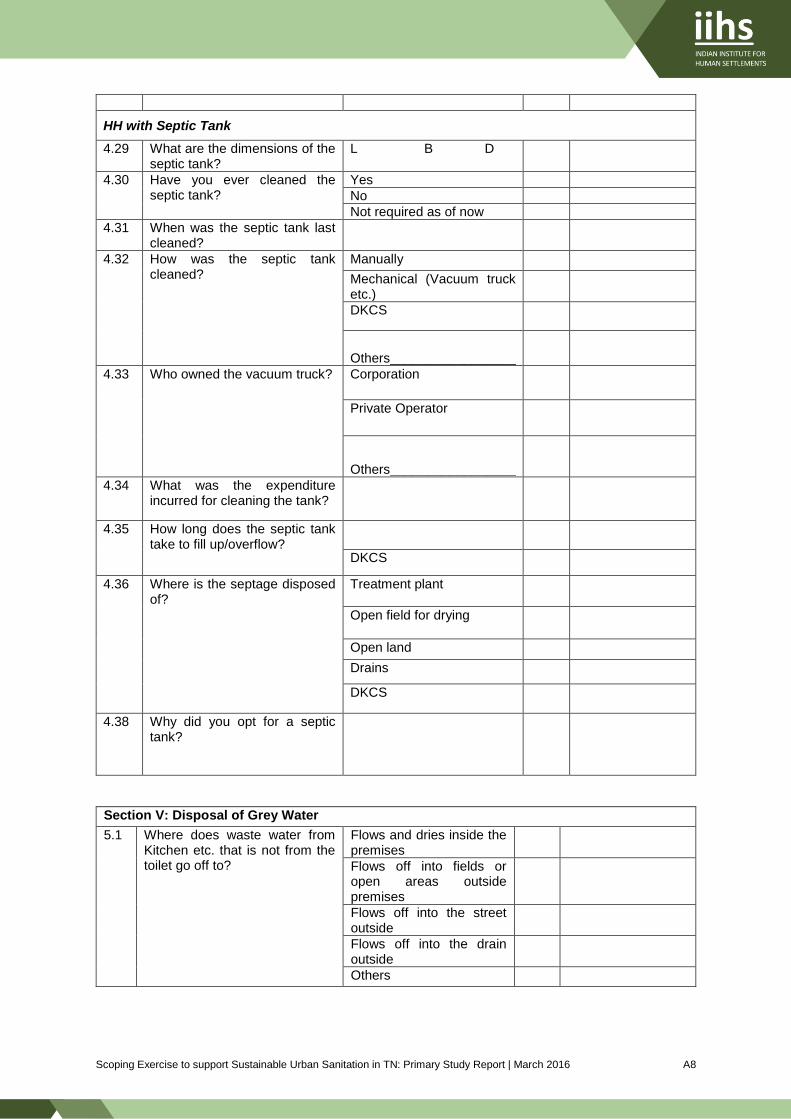
Scoping Exercise to support Sustainable Urban Sanitation in TN: Primary Study Report | March 2016 A8
HH with Septic Tank
4.29 What are the dimensions of the septic tank?
L B D
4.30 Have you ever cleaned the septic tank?
Yes
No
Not required as of now
4.31 When was the septic tank last cleaned?
4.32 How was the septic tank cleaned?
Manually
Mechanical (Vacuum truck etc.)
DKCS
Others_________________
4.33 Who owned the vacuum truck? Corporation
Private Operator
Others_________________
4.34 What was the expenditure incurred for cleaning the tank?
4.35 How long does the septic tank take to fill up/overflow?
DKCS
4.36 Where is the septage disposed of?
Treatment plant
Open field for drying
Open land
Drains
DKCS
4.38 Why did you opt for a septic tank?
Section V: Disposal of Grey Water
5.1 Where does waste water from Kitchen etc. that is not from the toilet go off to?
Flows and dries inside the premises
Flows off into fields or open areas outside premises
Flows off into the street outside
Flows off into the drain outside
Others

Scoping Exercise to support Sustainable Urban Sanitation in TN: Primary Study Report | March 2016 A9
Section VI: Observation schedule for Household latrine
Location of toilet
Within the house
Outside the house
Functional status
Working
Not in use
Used for storage
Working but leaks and breakages visible
Type of toilet
Flush/pour flush latrine connected to sewer
Flush /pour flush latrine connected to septic tank
Flush/pour flush latrine connected to other systems
Pit latrine with slab/ventilated improved pit
Pit latrine without slab/open pit
Type of toilet seat
Indian Pan
Western Commode
Platform with hole (Raised)
Platform with hole (on the floor)
Type of flush Cistern flush
Pour flush
Pan Material
Section VII: Observation Schedule for Pits
Location of the Pit Within the compound
Adjacent to the toilet
Below the toilet
Within the house
Design Single pit (unlined)
Single pit (lined)
Twin pit (unlined)
Twin pit (lined)
Size Length
Width
Depth
Material Bricks
Cement Concrete
Concrete rings
Others (specify)
Accessibility (by cesspool vehicle)
Yes
No

Scoping Exercise to support Sustainable Urban Sanitation in TN: Primary Study Report | March 2016 A10
Section VIII: Observation Schedule for Septic Tanks
Location of the Septic Tank Within the compound
Adjacent to the toilet
Below the toilet
Within the house
Design Single chamber (sealed)
Single chamber (with open able cover)
Double chamber (sealed)
Double chamber (with open able cover)
Size Length
Width
Depth
Can’t identify
Outlet connected to: Soak pit
Surface drain
Sewer line
Let out into open area
Can’t identify
Section IX: Observation Schedule for Housing
Observe and make note (ask questions wherever necessary)
Land use type Mixed use
Residential
Others
Building Typology Slum settlement
Government quarters/housing
Independent bungalows
Multi-storeyed individual apartments (< 5
storeys)
Multi-storeyed individual apartments (> 5
storeys)
Gated community complexes
Others
No. of storeys Ground (G)
G+1
G+2
b/w G+3 to G+6
G+6 and above
Total number of
units/households in the building
1
1 to 3
3 to 6
6 to 12
12 to 30
30 and above
Materials used for construction
of roof
Thatch
Asbestos/Aluminum sheet

Scoping Exercise to support Sustainable Urban Sanitation in TN: Primary Study Report | March 2016 A11
Tiles
Cement concrete
Plastic/Polythene
Others
Materials used for the
construction of walls
Stone
Brick – Load-bearing
Brick - Framework
Clay hollow blocks
Cement concrete
Plastic/Polythene
Aluminum sheets
Others

Scoping Exercise to support Sustainable Urban Sanitation in TN: Primary Study Report | March 2016 A12
Questionnaire Form for shared toilet Households
Vanakkam, I am _____________________, from the Indian Institute for Human Settlements in
Bangalore. We are conducting a study on sanitation in Tamil Nadu. We have chosen two localities for
the study and are interviewing households and establishments in these areas. Participation in this
survey as respondent will not result in terms of any benefit of being part of any government programmes
or schemes. The survey is only for academic purposes. Your response and views to the survey is of
utmost importance and would help in our study.
Participating in this survey and is purely dependent on your willingness, we would request and do
respect and value time and decision of participating. In case you choose not to participate in the survey,
you will not be asked to give an explanation.
The information collected through this survey will remain confidential, and only be made public after
obtaining your approval. The survey is generic and would be collected across from various households
in your town/city and does not include information of your household in particular. Your cooperation and
support in answering the questions would be valuable to our institution.
Would you like to participate in this survey? Or would like to know any more information either regarding
the institution or the survey in particular?
Section I: Basic Information
1.1 Name of the respondent?
1.2 Household Size M > 12 yrs F Children < 12 yrs
1.3
Who are the earning
members and what are their
occupations?
1.4
Occupation

Scoping Exercise to support Sustainable Urban Sanitation in TN: Primary Study Report | March 2016 A13
Section II – Housing
2.4.
Do you own this house or is it rented?
Own
Rented/leased
Other _______________
2.5. If rented, what is the monthly rent?
2.6.
Who is the owner of the land?
Self
Husband/ Wife
Parents/ Parents-in-law
Other family members
Government
Landlord
DKCS
Others
Don’t know
Other (with remarks)
2.7.
How old is the building (in years)?
Don’t know/Can’t say

Scoping Exercise to support Sustainable Urban Sanitation in TN: Primary Study Report | March 2016 A14
Section III – Water Supply
3.5.
What are your major sources of water? (Mark all that are applicable)
Drinking and cooking Washing, Bathing, etc.
Summer
Other seasons Summer Other seasons
Piped water supply
Piped into dwelling
Piped into yard/plot
Public taps/ stand pipes
Tubewell or Borewell
Dug well
Protected
Unprotected
Water from Spring
Protected
Unprotected
Rainwater
Tanker/truck
Cart with small tank
3.6.
Surface water (river/dam/lake/pond/canal/irrigation channel)
3.7. What is the distance to your primary source of water?
Within the house
Inside the compound
Outside the compound but within 200 m
Between 200 and 500 m
Between 500 m and 1 km
Others (with remarks)
3.8.
What is the broad estimate of monthly expenditure on water and related expenses?
Piped water supply Remarks
Private water tankers
Informal water suppliers
Treated waste-water
Bottled water/cans
Others (Specify)
Total

Scoping Exercise to support Sustainable Urban Sanitation in TN: Primary Study Report | March 2016 A15
If the shared toilet has a soakpit, go to the following question. If the toilet has a Septic Tank, go to question 4.25
4.15 What is the depth of the pit?
4.16 Have you ever cleaned the pit?
Yes
No
Not required as of now
Section IV: Shared latrine
4.1 How many other households use this latrine? Probe around loading of the Toilets
4.2 Where is the latrine located? Inside the plot
Outside the plot
4.3 How many seats are there? Male Female Children
4.3 What is the distance to the latrine? Less than 100m
Between 100m-200m
Between 200m-500m
Between 500m – 1 km
More than 1 km
DKCS
4.4 What is the type of latrine? Hole in the ground
Single pit
Double pit
Septic tank
Flush toilet connected to sewer system
Others________________
4.5 When was the latrine constructed? [Month, year]
4.10 Time taken for construction? (In days/months)
4.11 Total expenditure in constructing latrine?
4.12 Where does the waste water from the latrine go?
Stays inside the system
On to the street outside
On to the drain outside
DKCS
Others______________

Scoping Exercise to support Sustainable Urban Sanitation in TN: Primary Study Report | March 2016 A16
4.17 When was the pit last cleaned?
4.18 How was the pit cleaned? Manually
Mechanical (Vacuum truck etc.)
Others__________________
4.19 Who owned the vacuum truck?
Municipality
Private Operator
Others__________________
4.20 What was the expenditure?
4.21 How long does the pit take to fill up? [In months/years]
DKCS
4.22 Where is the septage disposed of?
Treatment plant
Open field for drying
Open areas
Drains
DKCS
4.23 Do you have any issues with your soakpit?
Yes
No
4.24 What are the issues?
Shared Toilet with Septic Tank
4.25 Have you ever cleaned the septic tank?
Yes
No
Not required as of now
4.26 When was the septic tank last cleaned?
4.27 How was the septic tank cleaned?
Manually
Mechanical (Vacuum truck etc.)
Others__________________
4.28 Who owned the vacuum truck? Municipality
Private Operator
Others__________________
4.29 What was the expenditure?
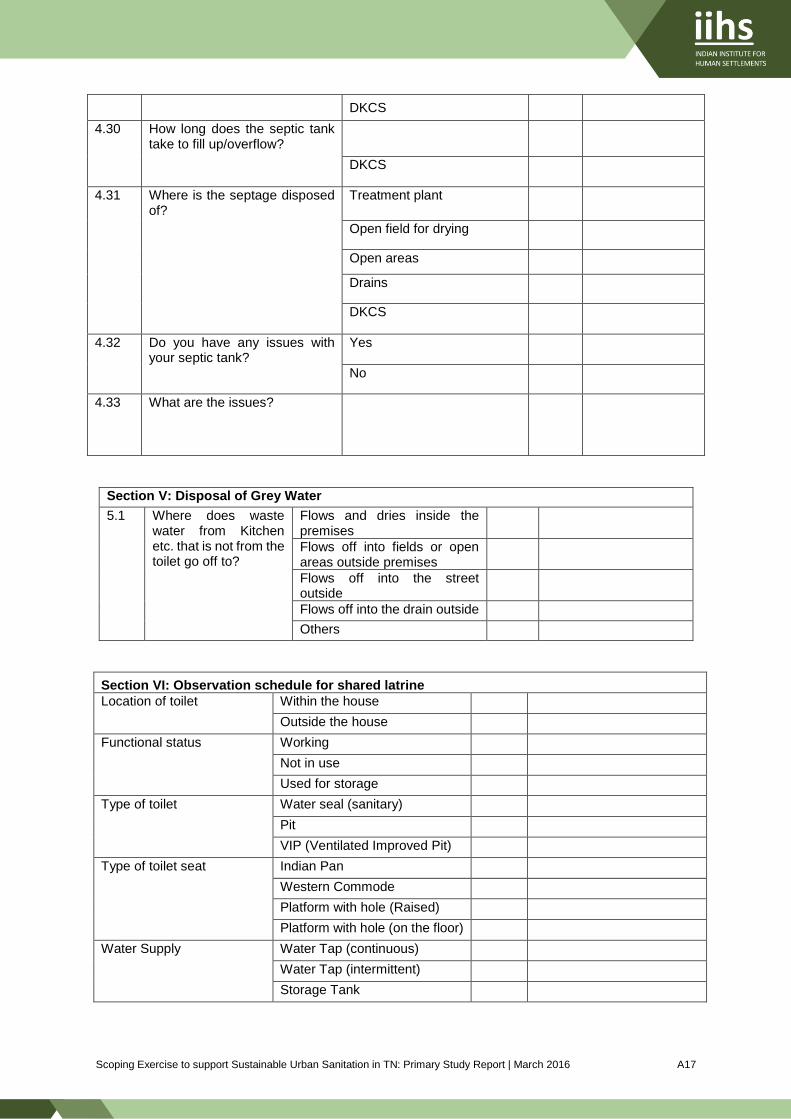
Scoping Exercise to support Sustainable Urban Sanitation in TN: Primary Study Report | March 2016 A17
DKCS
4.30 How long does the septic tank take to fill up/overflow?
DKCS
4.31 Where is the septage disposed of?
Treatment plant
Open field for drying
Open areas
Drains
DKCS
4.32 Do you have any issues with your septic tank?
Yes
No
4.33 What are the issues?
Section V: Disposal of Grey Water
5.1 Where does waste water from Kitchen etc. that is not from the toilet go off to?
Flows and dries inside the premises
Flows off into fields or open areas outside premises
Flows off into the street outside
Flows off into the drain outside
Others
Section VI: Observation schedule for shared latrine
Location of toilet Within the house
Outside the house
Functional status Working
Not in use
Used for storage
Type of toilet Water seal (sanitary)
Pit
VIP (Ventilated Improved Pit)
Type of toilet seat Indian Pan
Western Commode
Platform with hole (Raised)
Platform with hole (on the floor)
Water Supply Water Tap (continuous)
Water Tap (intermittent)
Storage Tank

Scoping Exercise to support Sustainable Urban Sanitation in TN: Primary Study Report | March 2016 A18
Type of flush Cistern flush
Pour flush
Collection System Pit
Ventilated Improved Pit
Twin pit
Septic tank
Sewer system
Structure Permanent
Temporary
Section VII: Observation Schedule for Septic Tanks
Location of the Septic Tank Within the compound
Adjacent to the toilet
Below the toilet
Within the house
Design Single chamber (sealed)
Single chamber (with open able cover)
Double chamber (sealed)
Double chamber (with open able cover)
Size Length
Width
Depth
Can’t identify
Water tightness (plastered inside & out)
Yes
No
Can’t identify
Distance from the nearest ground water source
Within 10 mts
Beyond 10 mts
Not Applicable
Accessibility (by cesspool vehicle)
Yes
No
Level Raised above the ground
Flushed to the ground
Below the ground
Ventilation (vent pipe) Yes
No
Can’t identify
Outlet connected to: Soak pit
Surface drain
Sewer line
Let out into open area
Can’t identify

Scoping Exercise to support Sustainable Urban Sanitation in TN: Primary Study Report | March 2016 A19
Section VIII: Observation Schedule for Pits
Location of the Pit Within the compound
Adjacent to the toilet
Below the toilet
Within the house
Design Single pit (unlined)
Single pit (lined)
Twin pit (unlined)
Twin pit (lined)
Size Length
Width
Depth
Can’t identify
Material Bricks
Cement Concrete
Concrete rings
Others (specify)
Accessibility (by cesspool vehicle)
Yes
No
Distance from the nearest ground water source
Within 10 mts
Beyond 10 mts
Not Applicable
Ventilation (vent pipe) Yes
No
Can’t identify

Scoping Exercise to support Sustainable Urban Sanitation in TN: Primary Study Report | March 2016 A20
Questionnaire Form for OD Households
Vanakkam, I am _____________________, from the Indian Institute for Human Settlements in
Bangalore. We are conducting a study on sanitation in Tamil Nadu. We have chosen two localities for
the study and are interviewing households and establishments in these areas. Participation in this
survey as respondent will not result in terms of any benefit of being part of any government programmes
or schemes. The survey is only for academic purposes. Your response and views to the survey is of
utmost importance and would help in our study.
Participating in this survey and is purely dependent on your willingness, we would request and do
respect and value time and decision of participating. In case you choose not to participate in the survey,
you will not be asked to give an explanation.
The information collected through this survey will remain confidential, and only be made public after
obtaining your approval. The survey is generic and would be collected across from various households
in your town/city and does not include information of your household in particular. Your cooperation and
support in answering the questions would be valuable to our institution.
Would you like to participate in this survey? Or would like to know any more information either regarding
the institution or the survey in particular?
Section I: Basic Information
1.1 Name of the respondent?
1.2 Household Size M > 12 yrs F Children < 12 yrs
1.3 Who are the earning members and what are their occupations?
1.4
Occupation

Scoping Exercise to support Sustainable Urban Sanitation in TN: Primary Study Report | March 2016 A21
Section II – Housing
2.8.
Do you own this house or is it rented?
Own
Rented/leased
Other _______________
2.9. If rented, what is the monthly rent?
2.10.
Who is the owner of the land?
Self
Husband/ Wife
Parents/ Parents-in-law
Other family members
Government
Landlord
DKCS
Others
Don’t know
Other (with remarks)
2.11.
How old is the building (in years)?
DKCS

Scoping Exercise to support Sustainable Urban Sanitation in TN: Primary Study Report | March 2016 A22
Section III – Water Supply
3.9.
What are your major sources of water? (Mark all that are applicable)
Drinking and cooking Washing, Bathing, etc.
Summer
Other seasons Summer Other seasons
Piped water supply
Piped into dwelling
Piped into yard/plot
Public taps/ stand pipes
Tubewell or Borewell
Dug well
Protected
Unprotected
Water from Spring
Protected
Unprotected
Rainwater
Tanker/truck
Cart with small tank
3.10.
Surface water (river/dam/lake/pond/canal/ irrigation channel)
3.11. What is the distance to your primary source of water?
Within the house
Inside the compound
Outside the compound but within 200 m
Between 200 and500 m
Between 500 m and 1 km
Others (with remarks)
3.12.
What is the broad estimate of monthly expenditure on water and related expenses?
Piped water supply Remarks
Private water tankers
Informal water suppliers
Treated waste-water
Bottled water/cans
Others (Specify)
Total

Scoping Exercise to support Sustainable Urban Sanitation in TN: Primary Study Report | March 2016 A23
Section V: Disposal of Grey Water
5.1 Where does waste water from washing, cleaning and bathing go off to?
Flows and dries inside the house
Flows off into fields or open areas
Flows off into the street outside
Flows off into the drain outside
Others
Section IV: Open Defecation
4.1 Why your family does not have access to Toilet?
4.2
Where do household members go for defecation? (tick all applicable)
Next to drain
On rail lines
Open fields
Field/ Bushes
Forested areas
Others
____________________
4.3 Do all members defecate un open?
4.4
How much time does it take
to reach there? (In
minutes)
4.5
Have you and your family
always defecated in the
open?
Yes
No
4.6
Where did you go earlier?
(Describe when, where)
4.7
What was the reason for the
change?
4.8 Do you face any problem in
defecating outside?
Yes
No
4.9
What kind of problems do
you face in defecating
outside?

Scoping Exercise to support Sustainable Urban Sanitation in TN: Primary Study Report | March 2016 A24
Section VI: Observation Schedule for building Observe and make note (ask questions wherever necessary)
Land use type Mixed use
Residential
Others
Building Typology Slum settlement
Government quarters/housing
Independent bungalows
Multi-storeyed individual apartments (< 5
storeys)
Multi-storeyed individual apartments (> 5
storeys)
Gated community complexes
Others
No. of storeys Ground (G)
G+1
G+2
b/w G+3 to G+6
G+6 and above
Total number of
units/households in the
building
1
1 to 3
3 to 6
6 to 12
12 to 30
30 and above
Materials used for
construction of roof
Thatch
Asbestos/Aluminum sheet
Tiles
Cement concrete
Plastic/Polythene
Others

Scoping Exercise to support Sustainable Urban Sanitation in TN: Primary Study Report | March 2016 A25
Materials used for the
construction of walls
Stone
Brick – Load-bearing
Brick - Framework
Clay hollow blocks
Cement concrete
Plastic/Polythene
Aluminum sheets
Others

Scoping Exercise to support Sustainable Urban Sanitation in TN: Primary Study Report | March 2016 A26
Checklist for Masons
(In first few questions, determine whether the respondent is a toilet mason or not, and continue with the
discussion only if they have experience in constructing toilets.)
Vanakkam, I am _____________________, from the Indian Institute for Human Settlements in
Bangalore. We are conducting a study on sanitation in Tamil Nadu in order to improve the full cycle of
access to toilets, safe collection and disposal/proper treatment of human excreta. We have chosen your
neighbourhood to understand the problems and issues in urban areas pertinent to sanitation, so that
appropriate improvements can be proposed. Your identity and responses shall not be disclosed to
anyone. Your cooperation and support in answering the questions would be valuable to our study.
1. What kind of buildings do you construct? (Single houses, Group houses, Apartments, Shops
etc.) and does toilet construction form a part of this work?
2. How many building have you constructed in the last year?
3. What are the localities /area you operate in?
4. How long have you been in the masonry business?
5. How did you come into this business?
6. How did you learn the trade?
7. Do you work alone or with some-one else? (Probe for mode of operation)
8. What kind of toilets do you construct (pits, septic tanks, others)?
9. On an average, how many toilets do you construct in a month? (Probe for seasonal variations)
In a year?
10. How do clients get in touch with you?
11. What are the standard type designs for Septic tanks that are constructed? (Probe for details,
before introducing sketch, and systems costing sheet)
12. How have the construction and design practices changed in the last ten years?
13. For the septic tanks, what is the most common arrangement for effluent outflow?
14. Generally, is there a soak away? If not, what is the most common arrangement? (Probe for how
these arrangements vary by different building typologies or across socio-economic classes?)
15. Typically, how long does it take to make a septic tank? (If there are variations, probe why there
are variations?)
16. Who decides the location of the septic tank vis-a-vis the building?
17. Who decides upon the design, size etc.? (Probe whether it is household, which members of the
household, builders etc.)
18. Who supervises the construction process?
19. Do you undertake repair work also? If yes, ask for details about what kind of repair work is
undertaken.
20. What are common problems faced by you as a mason? How can the above problems be
addressed?
21. Anything you would like to ask us?
Your Contact no:
End by thanking the respondent, and also asking for another appointment if needed.

Scoping Exercise to support Sustainable Urban Sanitation in TN: Primary Study Report | March 2016 A27
Checklist for Contractors
Vanakkam, I am _____________________, from the Indian Institute for Human Settlements in
Bangalore. We are conducting a study on sanitation in Tamil Nadu in order to improve the full cycle of
access to toilets, safe collection and disposal/proper treatment of human excreta. We have chosen your
neighbourhood to understand the problems and issues in urban areas pertinent to sanitation, so that
appropriate improvements can be proposed. Your identity and responses shall not be disclosed to
anyone. Your cooperation and support in answering the questions would be valuable to our study.
1. What are the different type of construction activities do you undertake? (Probe about what kind
of buildings, scale of buildings)
2. Do you undertake construction job on a turn-key basis? (Probe for mode of operation)
3. What are the localities /area you operate in?
4. What kind of buildings do you construct? (Single houses, Group houses, Apartments, Shops
etc.)
5. How did you come into this business?
6. How many of them did you construct in the last year?
7. In the building you construct, do you undertake toilet construction with your own people or is this
sub-contracted? (Probe for details)
8. Typically, what are different kind of sanitation systems are adopted in the town? (Probe for
differences according to housing type, Identify all types of systems).
For each type, ask set of following questions:
9. What are the different types of designs? (Additionally, for septic tank- get sketches)
10. How much does each of the building systems cost? (for septic tank, get detailed costing)
11. What are the disposal arrangements? (for effluent and sludge)
12. How much time is required for construction?
13. Who decides on type (design, size, location) of the sanitation system?
14. Who supervises the construction of the septic tanks and toilets?
15. What are the common arrangements for operations and maintenance of these sanitation
systems?
22. Tell us little bit about the problems facing your business? How can the above problems be
addressed?
Please share your Contact no:
End by thanking the respondent, and also asking for another appointment if needed.

Scoping Exercise to support Sustainable Urban Sanitation in TN: Primary Study Report | March 2016 A28
Checklist for Sanitary Workers
Vanakkam, I am _____________________, from the Indian Institute for Human Settlements in
Bangalore. We are conducting a study on sanitation in Tamil Nadu in order to improve the full cycle of
access to toilets, safe collection and disposal/proper treatment of human excreta. We have chosen your
neighbourhood to understand the problems and issues in urban areas pertinent to sanitation, so that
appropriate improvements can be proposed. Your identity and responses shall not be disclosed to
anyone. Your cooperation and support in answering the questions would be valuable to our study.
1. What kind of toilets do you clean? (pit latrines, septic tanks, etc.)
2. How many cleaning requests do you get in a month? (probe for seasonal variations if any at all)
3. How much do you get paid? Does this vary by type of client or type/size of installation?
4. Does the household provide any other benefits?
5. Approximately, how much do you earn in a month?
6. What are the different types of toilets prevalent in this area? (probe which are the predominant
ones)
7. How have the construction and design practices changed over the last ten years or so? (Probe
for details)
8. How long does it take to clean one pit larine or septic tank?
9. Where do you dispose of the sludge? (Gently probe for different methods of disposal)
10. Do you wear any gloves, masks, dresses etc. protective gear while cleaning? Do you take any
other precaution before cleaning?
11. Do you have any health concerns due to this?
12. What can make your job of cleaning more efficient?
End by thanking the respondent, and also asking for another appointment if needed.

Scoping Exercise to support Sustainable Urban Sanitation in TN: Primary Study Report | March 2016 A29
Checklist for Government Cesspool operators
Vanakkam, I am _____________________, from the Indian Institute for Human Settlements in
Bangalore. We are conducting a study on sanitation in Tamil Nadu in order to improve the full cycle of
access to toilets, safe collection and disposal/proper treatment of human excreta. We have chosen your
neighbourhood to understand the problems and issues in urban areas pertinent to sanitation, so that
appropriate improvements can be proposed. Your identity and responses shall not be disclosed to
anyone. Your cooperation and support in answering the questions would be valuable to our study.
1. How many honey suckers does the ULB own or hire?
2. What is the type and capacity of these vehicles? List number of vehicles by capacity, also note
whether these are modified trucks or specially made or equipped vehicles).
3. For how long have these vehicles been operational? (add age to the above list)
4. What kind of buildings/ clients do you service? (Households, institutions, commercial etc.) Is the
rate different for each of the above customer categories? (ask for rate card)
5. How do people get in touch with you?
6. On an average, how many cleaning requests do you get in a month? In a year?
7. How many trips do the vehicles make per month?
8. How are the routes decided?
9. In a normal trip, do you ensure the truck cleans the septic tank to its full capacity or do these have
to carry partial loads?
10. How is the rate decided? When did the rates last change?
11. What costs do you incur – including labour costs, transportation costs and others?
12. Does the ULB have any condition for collecting septage from a particular household or building
(such as property tax receipts)?
13. How is collected septage normally disposed?
14. If dumped, where is it disposed of?
15. Are there buyers of sewage? Ex: agriculturists etc.?
16. Do you provide any gloves, caps, suits, etc. protective gear to your workers?
17. How many private operators are there in the town? How many vehicles do they operate?
18. How many of them are registered with the ULB?
19. Are there any rules and regulations that are enforced upon them?
20. What are your suggestions to improving septage collection, transportation and treatment?
End by thanking the respondent, and also asking for another appointment if needed.

Scoping Exercise to support Sustainable Urban Sanitation in TN: Primary Study Report | March 2016 A30
Checklist for Private Cesspool vehicles
Vanakkam, I am _____________________, from the Indian Institute for Human Settlements in
Bangalore. We are conducting a study on sanitation in Tamil Nadu in order to improve the full cycle of
access to toilets, safe collection and disposal/proper treatment of human excreta. We have chosen your
neighbourhood to understand the problems and issues in urban areas pertinent to sanitation, so that
appropriate improvements can be proposed. Your identity and responses shall not be disclosed to
anyone. Your cooperation and support in answering the questions would be valuable to our study.
1. How many honey suckers do you own?
2. What is the total capacity of these vehicles?
3. How long have you been in this business?
4. How did you enter this business?
5. What is the area (localities) of operation?
6. What kind of buildings/ clients do you service? (households, institutions, commercial etc.)
7. How do people get in touch with you? (Probe for differences households, institutions, etc.)
8. On an average, how many cleaning requests do you get in a month?
9. What are the rates that you charge for cleaning? (probe for differences)
10. When did the rates last change? How is collected septage disposed of? Where? (Probe gently
whether there are designated locations and whether the actual practice differs from the
prescribed).
11. Do you provide any gloves, caps, suits, etc. protective gear to your workers?
12. How many other operators are there in the town or in the area? How many vehicles do they have?
13. Is there a process of registration or licensing that you have do? What are the steps involved?
14. What are the other rules and regulations that you are expected to follow?
15. Are there buyers of sewage? Ex: agriculturists etc.?
16. How many other private operators are there in the town? How many vehicles do they operate?
17. What are your suggestions to improving septage collection, transportation and treatment?
18. What has been your experience of interacting with officers of the ULB?
19. What are your major kinds of expenditure in a month? (personnel, labour, vehicle etc.)
20. What are the monthly costs that you incur – including labour costs, transportation costs and
others?
21. How much capital investment was needed? (Probe for details)
May we contact you again??

Scoping Exercise to support Sustainable Urban Sanitation in TN: Primary Study Report | March 2016 A31
Checklist for farmers
1. Do you regularly buy septage as manure/fertilizer in your farm?
2. What is the frequency at which you buy and put septage in your land? At what volume per acre?
3. What crops do you grow that specifically require input of septage?
4. How much do you pay for septage?
5. Are these private or public tankers? Is there a difference in their rates?
6. Do neighbouring farmers also use septage? (Probe for differences in arrangements, prices etc.)
7. How is the septage applied on the field?
8. Do you feel that the septage provides any benefit to the crop?
9. Are there any problems in using septage?

Scoping Exercise to support Sustainable Urban Sanitation in TN: Primary Study Report | March 2016 A32
Checklist for EO/ Municipal Commissioner and Chairperson
1. What are the key problems that you are faced with in keeping the town running?
(Conversation, quickly move on)
2. What is the economic base of the city? What are the main sources of employment? Location of
work and where do people live?
3. What are the roles and responsibilities of the ULB in providing water, sanitation, solid waste and
drainage arrangements?
4. What are chief concerns regarding water supply in the city?
5. What are chief concerns regarding sanitation in the city?
6. What are chief concerns regarding solid waste management in the city?
7. What are the ongoing projects in the above sectors? How are they funded?
8. What is the role of private sector in provisioning these services?
9. What are the main sources of revenue for the ULB? What are the main areas of expenditure?
10. What is the planning framework? How is the process? Who are the key players? (If at state
level, get names)
11. Slum overview? How many slums are there? How are they decided? Is there an area of
concentration? What are the chief concerns?
12. What is the relationship of the city/ district with nearby cities/ district?

Scoping Exercise to support Sustainable Urban Sanitation in TN: Primary Study Report | March 2016 A33
Checklist for Chief Engineer/ Other Technical Staff
1. Please can you tell us a little bit about the town? What is its importance? A brief on its geography,
administrative boundaries, connectivity, landmarks etc.
2. What are the broad settlement patterns in the town? (High, medium and low income groups or
high rise, low rise high density and slum pockets) (a broad distribution on the map)
3. What is the current water supply system in the town/city (source, collection, treatment, storage
and distribution)? Is there a map showing these zones, current treatment, storage and distribution
infrastructure? If no map is available, can we have a schematic of the current system (simple flow
diagram).
4. How many municipal water connections are present in the town/city (household, commercial &
bulk)? What is the cost of connection and monthly tariff? How is the user fee collected and at what
frequency?
5. What is the estimated distribution losses and non-revenue water?
6. What is coverage of individual toilets in the city (per cent) and how many of them exist (numbers).
What are most common type of individual toilets (pits, pour flush or flush toilets)
7. What is the general disposal patter of toilets (individual & public) in the city (Pits, septic tanks or
open drains)?
8. What is the general disposal pattern of sullage (greywater) in the town (left into open drains or
open areas)?
9. Do you have an underground sewerage system? If yes, to what extent (per cent of physical areas
covered)? Do you have sewer zones? Is there a map showing these zones, current network
coverage, treatment and disposal infrastructure? If no map is available, can be have a schematic
of the current system (simple flow diagram)
10. How many sewer connections are there in the town/city (household, commercial, industrial etc.)?
What is the cost of connection and monthly tariff? How is the user fee collected and at what
frequency?
11. If there is No underground sewerage, is there a system of regularly cleaning septic tanks and
treating septage in a designated facility?
(Probe for Details)
12. What are the roles and responsibilities of different departments?
13. What is the current staffing pattern (on pay roll & on contract) of the department against
sanctioned structure?
14. How many public and community toilets are present in the town/city? What disposal system are
they connected to? What is the current functional status? Who maintains them? What are the costs
and receipts and how are these managed?

Scoping Exercise to support Sustainable Urban Sanitation in TN: Primary Study Report | March 2016 A34
15. What is the current solid waste management system in the town/city (collection, transportation,
treatment and disposal/reuse)? Do you have zones demarcated for SWM? Is there a map showing
these zones, current treatment, storage locations and vehicle routing? If no map is available, can
be have a schematic of the current system (simple flow diagram)
16. How many households and establishments are covered under SWM? What is the monthly
tariff? How is the user fee collected and at what frequency? What is the general recovery rate?
17. Please give details on the natural storm water drainage system in the town/city (rivers, streams,
etc.). What is the coverage of man-made storm drains? Is there a map showing both natural and
man-made drains? If no map is available, can be have a schematic (simple flow diagram)
18. What are key concerns regarding environmental services in the town?
(Ask for each service)

Scoping Exercise to support Sustainable Urban Sanitation in TN: Primary Study Report | March 2016 A35
Secondary Data Checklist (To collect from ULB)
I. General Information:
1. Population
2. Area (in sq. km.) (Document recent changes in boundaries, if any)
3. Class (as per Census)
4. Grade (as per DTP)
5. Year of Establishment
6. No. of Wards (Document recent changes in boundaries, if any)
7. Groundwater levels (mts)
8. Soil type
II. Demography:
1. Population (2011)
2. Decadal Population (2001, 1991, 1981, 1971 & 1961)
3. Ward-wise population (Printout or soft copy)
4. Floating population (regular and seasonal)
5. Urban poor (Population & No. of HHs) (Attach list of Slums with Ward no. and Population)

Scoping Exercise to support Sustainable Urban Sanitation in TN: Primary Study Report | March 2016 A36
III. Water Supply:
1. Main sources for municipal supply
2. Distance from the town (in km)
3. How is the water conveyed? (gravity or pumping)
4. Details of Treatment Infrastructure
a. Location: b. Capacity (MLD): c. Treatment Technology: d. Current utilization level (%):
5. Coverage of water supply network
a. Physical coverage (%): b: No. of Households covered: c: Details of un-served areas (If any):
6. Quantity supplied (in MLD)
7. Frequency of supply (number of times in a day)
8. Duration of supply (hours per day)
9. Per capita supplied (lpcd)
10. Non-revenue water
a. Total NRW (quantity and per cent)

Scoping Exercise to support Sustainable Urban Sanitation in TN: Primary Study Report | March 2016 A37
b. Physical losses: i) Leakage from transmission and distribution mains ii) Leakage and overflow from utility reservoirs and storage tanks iii) Leakage in service connections c. Commercial/Apparent losses: i) Unmetered or free connections ii) Meter inaccuracy iii) Unauthorized consumption iv) Meter reading errors v) Data handling and accounting errors
11. Water Supply – Connection Details:
Sl. No.
Type of Connection No. of Connections Connection Charge Monthly Tariff
a Regular Household
b Slum Household
c Commercial
d Institutional
e Industrial
f Others (If any)
Note: Collect data at ward level for each type
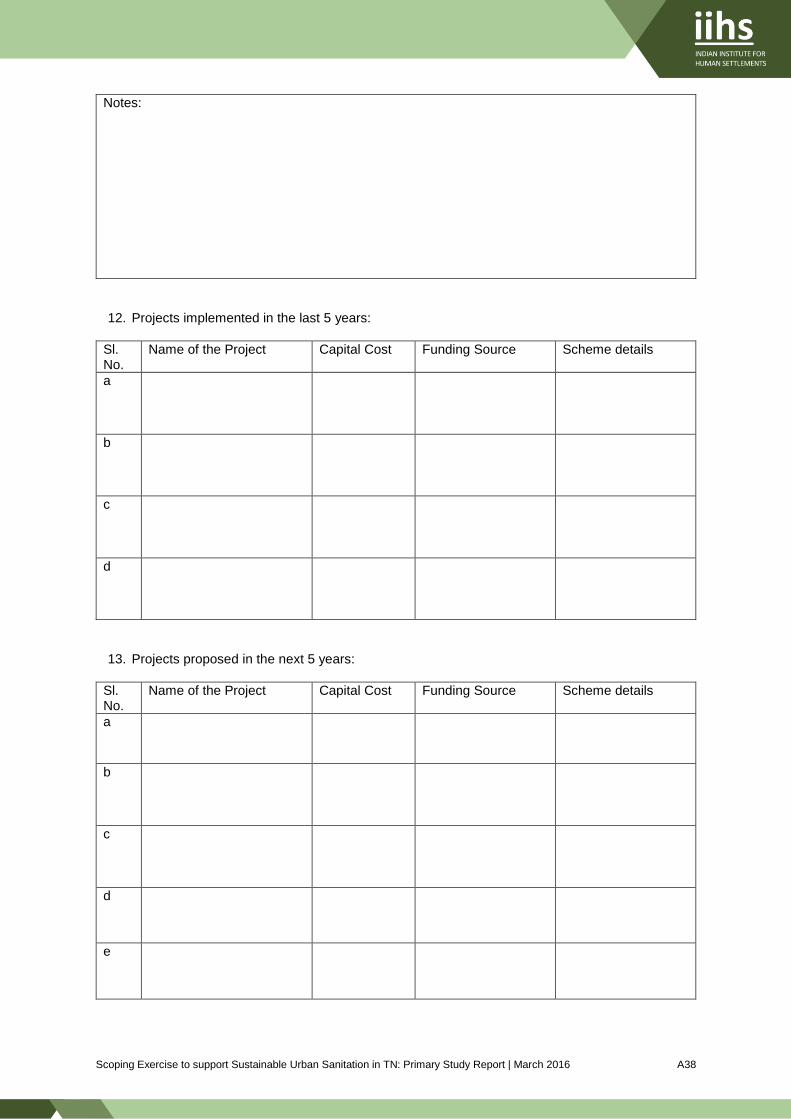
Scoping Exercise to support Sustainable Urban Sanitation in TN: Primary Study Report | March 2016 A38
Notes:
12. Projects implemented in the last 5 years:
Sl. No.
Name of the Project Capital Cost Funding Source Scheme details
a
b
c
d
13. Projects proposed in the next 5 years:
Sl. No.
Name of the Project Capital Cost Funding Source Scheme details
a
b
c
d
e

Scoping Exercise to support Sustainable Urban Sanitation in TN: Primary Study Report | March 2016 A39
14. Service Level Benchmarks – Water Supply:
Sl. No. Indicator Benchmark Proposed. 2016 2015 2014 2013 2012 2011 2010
1 Coverage of Water Supply Connections
100%
2 Per Capita Supply of Water
135 lpcd
3 Extent of Metering of Water Connections
100%
4 Extent of Non-Revenue Water
20%
5 Continuity of Water Supply
24 hrs
6 Quality of Water Supplied
100%
7 Efficiency in Redressal of Customer Complaints
80%
8 Cost Recovery in Water Supply Services
100%
9 Efficiency in Collection of Water Supply-related Charges
90%

Scoping Exercise to support Sustainable Urban Sanitation in TN: Primary Study Report | March 2016 A40
IV. Details of Public Toilets:
Sl. No.
Ward no.
Location of the Public Toilet
Water Supply
Toilet Seats Urinal O&M responsibility
User Fee (Y/N) If Y,?
Functional Status / Remarks
Male Female Child Male Female Child
1
2
3
4
5
6
7
8
9
10

Scoping Exercise to support Sustainable Urban Sanitation in TN: Primary Study Report | March 2016 A41
I. Details of Community Toilets:
Sl. No
Ward No.
Location of the Community Toilet
Water Supply
Water Closets Urinal Bath O&M respon.
User Fee (Y/N) If Y?
Functional Status/ Remarks
Male Female Child Male Female Child Male Female
1
2
3
4
5
6
7
8

Scoping Exercise to support Sustainable Urban Sanitation in TN: Primary Study Report | March 2016 A42
V. Wastewater Management:
1. Do you have a sewerage system (if yes, ask points 2 to 15 or skip to section VI)
2. How is sewage conveyed (gravity or pumping)
Coverage of sewer network (Physical extent and no. of households)
a. Physical coverage (%): b: No. of Households covered: c: Details of un-served areas (If any):
3. Details of Treatment Infrastructure (location, capacity & current utilization levels)
a. Location: b. Capacity (MLD): c. Treatment Technology: d. Current utilization level (%):
4. Quantity of sewage collected (in MLD)
5. Connection charges – Sewerage:
Sl. No.
Type of Connection No. of Connections Connection Charge Monthly Tariff
a Regular Household
b Slum Household
c Commercial
d Institutional
e Industrial

Scoping Exercise to support Sustainable Urban Sanitation in TN: Primary Study Report | March 2016 A43
Sl. No.
Type of Connection No. of Connections Connection Charge Monthly Tariff
f Others (If any)
Note: Collect a ward wise list for each type
Notes:
15. Projects implement in the last 5 years:
Sl. No.
Name of the Project Capital Cost Funding Source Scheme details
a
b
c
d
e

Scoping Exercise to support Sustainable Urban Sanitation in TN: Primary Study Report | March 2016 A44
16. Projects proposed in the next 5 years:
Sl. No.
Name of the Project Capital Cost Funding Source Scheme details
a
b
c
d
e

Scoping Exercise to support Sustainable Urban Sanitation in TN: Primary Study Report | March 2016 A45
17. Service Level Benchmarks – Sewage Management:
Sl. No. Indicator Benchmark
Proposed 2016
2015 2014 2013 2012 2011 2010
1 Coverage of Toilets 100%
2 Coverage of Sewage Network Services 100%
3 Collection Efficiency of the Sewage Network 100%
4 Adequacy of Sewage Treatment Capacity 100%
5 Quality of Sewage Treatment 100%
6 Extent of Reuse and Recycling of Sewage 20%
7 Efficiency in Redressal of Customer Complaints 80%
8 Extent of Cost Recovery in Sewage Management 100%
9 Efficiency in Collection of Sewage Charges 90%
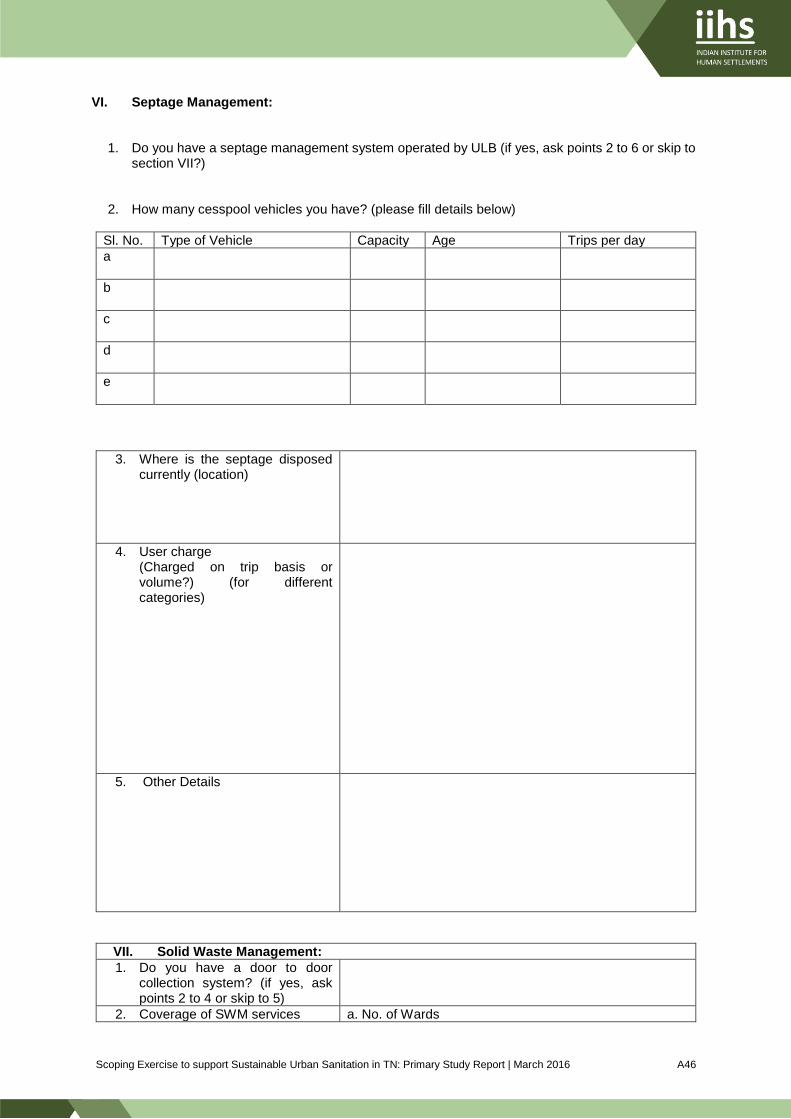
Scoping Exercise to support Sustainable Urban Sanitation in TN: Primary Study Report | March 2016 A46
VI. Septage Management:
1. Do you have a septage management system operated by ULB (if yes, ask points 2 to 6 or skip to section VII?)
2. How many cesspool vehicles you have? (please fill details below)
Sl. No. Type of Vehicle Capacity Age Trips per day
a
b
c
d
e
3. Where is the septage disposed currently (location)
4. User charge (Charged on trip basis or volume?) (for different categories)
5. Other Details
VII. Solid Waste Management:
1. Do you have a door to door collection system? (if yes, ask points 2 to 4 or skip to 5)
2. Coverage of SWM services a. No. of Wards

Scoping Exercise to support Sustainable Urban Sanitation in TN: Primary Study Report | March 2016 A47
b. No. of Households
3. Quantity of solid waste collected (in TPD)
4. How the solid waste collected (type of vehicles and instruments)?
Sl. No. Type of Vehicles/Tools Capacity Age Trips per day
a
b
c
d
e
f
g
h
i
j
5. How many community bins are there for collecting solid waste
6. Where is the waste transported and disposed to
7. Do you have a treatment plant (If yes fill 8 & 9, If no, record the current practice)
8. Details of Treatment Infrastructure (location, capacity & current utilization levels)
a. Location: b. Capacity (MLD):

Scoping Exercise to support Sustainable Urban Sanitation in TN: Primary Study Report | March 2016 A48
c. Treatment Technology: d. Current utilization level (%):
9. Quantity of solid waste treated (in TPD)
10. User charges – Solid Waste Collection:
Sl. No. Type of Connection Monthly User Charge
a Regular Household
b Slum Household
c Commercial
d Institutional
e Industrial
f Others (If any)

Scoping Exercise to support Sustainable Urban Sanitation in TN: Primary Study Report | March 2016 A49
11. Service Level Benchmarks – Solid Waste Management:
Sl. No. Indicator Benchmark
Proposed. 2016
2015 2014 2013 2012 2011 2010
1 Household Level Coverage of SWM Services 100%
2 Efficiency of Collection of Municipal Solid Waste 100%
3 Extent of Segregation of Municipal Solid Waste 100%
4 Extent of Municipal Solid Waste Recovered 80%
5 Extent of Scientific Disposal of Municipal Solid Waste 100%
6 Efficiency in Redressal of Customer Complaints 80%
7 Extent of Cost Recovery in SWM services 100%
8 Efficiency in Collection of SWM Charges 90%
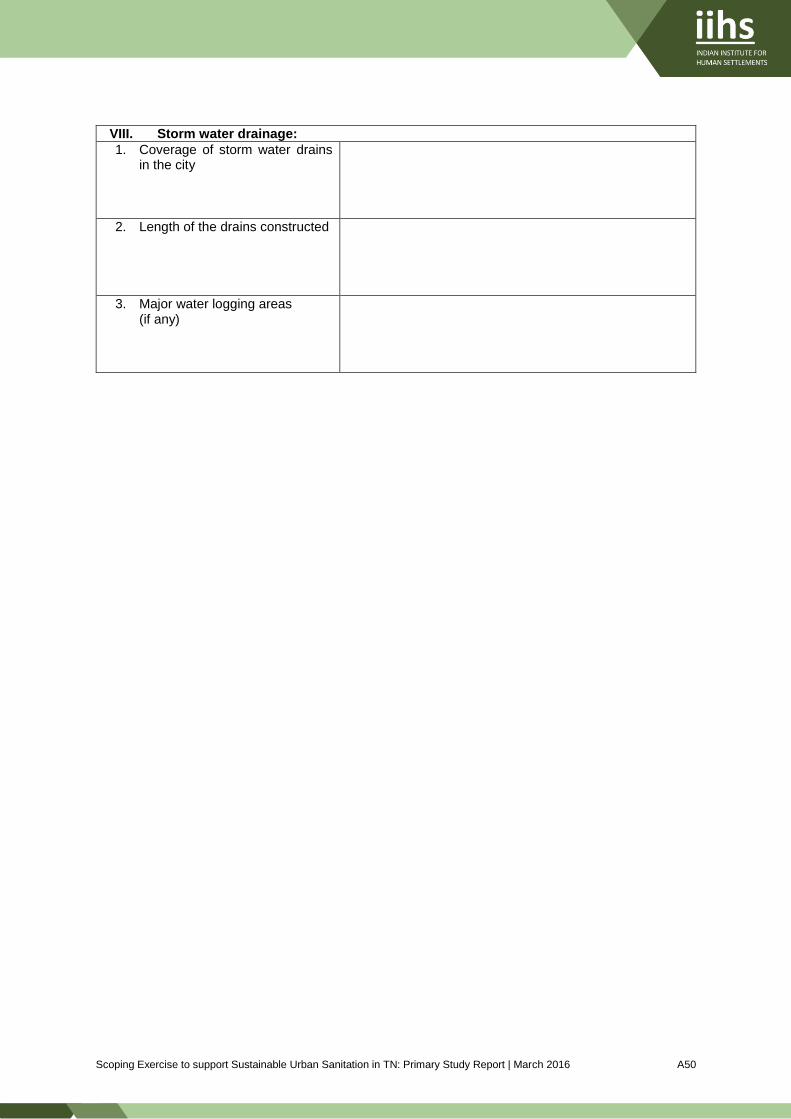
Scoping Exercise to support Sustainable Urban Sanitation in TN: Primary Study Report | March 2016 A50
VIII. Storm water drainage:
1. Coverage of storm water drains in the city
2. Length of the drains constructed
3. Major water logging areas (if any)
Scoping Exercise to support Sustainable Urban Sanitation in TN: Primary Study Report | March 2016 A51
List of documents to be collected from ULB and other agencies:
1. Demographic data:
a. Ward wise population
b. List of Slums
c. Slum population ward wise
2. Water Supply:
a. Ward wise list of HH connections
b. Council resolution on user charge
3. Sewerage system:
a. Ward wise list of HH connections
b. Council resolution on sewerage cess
4. Septage management
a. Movement record of cesspool vehicle
b. Council resolution on cost of emptying
5. SLB data for the last 3 years
6. Municipal Finance:
a. Annual Budgets for last 3 years
b. Property tax assessment for last 3 years
c. Collection efficiency for last 3 years
7. Institutional framework
a. Organogram
b. List of sanctioned positions verses filled positions (dept. wise)
List of Maps to be collected:
1. Administrative map,
2. Land use map
3. Topographic map,
4. Road and rail network map
5. Water Supply Map(s)
a. Location of source,
b. storage infrastructure and
c. distribution network
6. Sewerage System Map(s)
a. Catchment zones,
b. Distribution network
c. Location of treatment plant
7. Solid Waste Management Maps
a. Zones
b. collection route maps
c. location of treatment plant
8. Location of septage disposal (Designated by ULB and Illegal dumping places)
9. Major water logging areas (if any)
10. Storm water drainage maps (network map of constructed drains and natural drains)

Scoping Exercise to support Sustainable Urban Sanitation in TN: Primary Study Report | March 2016 A52
Annexure 2: Note on Selection Criteria for Studies Towns The purpose of selection is to assist in the systematic identification of the two urban areas that will be
selected for assistance in planning and implementation of the full cycle of sanitation and septage
management. It has been proposed that one of the towns will be a Municipality (less than 1 million
population), and another will be cluster of Town Panchayats (less than 100,000 population). Municipal
Corporations, Cantonment Boards, and Census Towns are not being considered in the choice set.
A two-step selection criterion has been suggested:
i. A preliminary analysis based on secondary data will carried out to generate a short-list of cities.
In discussions with GoTN, it was proposed that the selected cities would have high proportion
of households covered by some sanitation facilities (or smaller proportion of households without
individual toilets), and a high proportion of septic tanks so that early successes can be
demonstrated.
ii. After generating the lists from analysis of secondary data, it is proposed that the final selection
will be done based on criteria including availability of land for new treatment facilities, demand
from institutional and community stakeholders, assurance about financial allocations etc.
This note is based on the initial secondary analysis (above).
Selection of Municipality:
Two options are presented for selection of municipalities.
Option 1:
1. Proportion of households without toilets within premises (going out in the open) – less than 20
per cent
2. Proportion of households with toilets with septic tanks – more than 60 per cent, and 12,000 or
more (in number)
Option 2:
1. Proportion of Proportion of households without toilets within premises (going out in the open) –
less than 20 per cent
2. Proportion of households with toilets with septic tanks – more than 60 per cent and 15,000 or
more (in number)
Town Panchayats Cluster:
Selection criteria for the Town Panchayat clusters are as follows:
1. Proportion of Proportion of households without toilets within premises (going out in the open) –
less than 20 per cent
2. Proportion of households with toilets with septic tanks – more than 50 per cent and 1,500 ore
more (in number)
3. Clustering of TPs in the same Tehsil (as a proxy for distance)


Scoping Exercise to support Sustainable Urban Sanitation in TN: Primary Study Report | March 2016 A54
Annexure 3: Data Tables for Pammal Ward-wise Water Supply Connections in Pammal
Ward. No. Residential Commercial Industrial Total
1 651 4 0 655
2 508 0 0 508
3 806 0 0 806
4 411 4 0 415
5 478 0 0 478
6 492 0 0 492
7 523 0 1 524
8 730 0 0 730
9 594 0 0 594
10 367 0 0 367
11 540 1 1 542
12 435 0 0 435
13 377 0 0 377
14 605 0 0 605
15 140 0 1 141
16 499 1 1 501
17 435 1 0 436
18 261 2 4 267
19 193 0 1 194
20 534 0 0 534
21 610 2 10 622
Totals 10189 15 19 10223
Source: Pammal Municipality, June 2015
Ward-wise Public Stand Posts (PSP) in Pammal
Ward No. No. of Streets PSPs PSPs with RO
1 79 42 2
2 44 35 1
3 50 48 1
4 27 15 1
5 28 35 1
6 59 26 1
7 54 35 2
8 42 26 1

Scoping Exercise to support Sustainable Urban Sanitation in TN: Primary Study Report | March 2016 A55
Ward-wise Public Stand Posts (PSP) in Pammal
Ward No. No. of Streets PSPs PSPs with RO
9 42 32 1
10 19 23 1
11 48 28 1
12 34 26 1
13 23 27 1
14 35 26 1
15 27 26 1
16 24 20 1
17 31 25 1
18 35 26 2
19 29 35 1
20 45 28 1
21 102 35 2
Total 877 619 25
Source: Pammal Municipality (June 2015)
SLB Indicators for Water Supply in Pammal Municipality
Sl. No.
Indicator Benchmark 2015 2014 2013 2012
1 Coverage of Water Supply Connections
100% 55 51 48 43.17
2 Per Capita Supply of Water
135 lpcd 54 52 35 30.71
3 Extent of Metering of Water Connections
100% 0 0 0 0
4 Extent of Non-Revenue Water
20% 20 21 23 25.50
5 Continuity of Water Supply
24 hrs 2 2 2 2
6 Quality of Water Supplied
100% 100 100 100 100
7 Efficiency in Redressal of Customer Complaints
80% 85 80 80 66.66
8 Cost Recovery in Water Supply Services
100% 97 95 90 86.09

Scoping Exercise to support Sustainable Urban Sanitation in TN: Primary Study Report | March 2016 A56
SLB Indicators for Water Supply in Pammal Municipality
Sl. No.
Indicator Benchmark 2015 2014 2013 2012
9 Efficiency in Collection of Water Supply-related Charges
90% 82 80 75 71.67
Source: Pammal Municipality (June 2015)
SLB Indicators for SWM in Pammal Municipality
Sl.
No.
Indicator Benchmark 2015 2014 2013 2012
1 Household Level Coverage of SWM Services
100% 85 84 82 80
2 Efficiency of Collection of Municipal Solid Waste
100% 85 84 83 80
3 Extent of Segregation of Municipal Solid Waste
100% 40 35 30 25
4 Extent of Municipal Solid Waste Recovered
80% 70 65 60 53.57
5 Extent of Scientific Disposal of Municipal Solid Waste
100% 0 0 0 0
6 Efficiency in Redressal of Customer Complaints
80% 75 73 70 66.67
7 Extent of Cost Recovery in SWM services
100% 2.5 2 2 1.8
8 Efficiency in Collection of SWM Charges 90% 0 0 0 42.94 Source: Pammal Municipality (June 2015)

Scoping Exercise to support Sustainable Urban Sanitation in TN: Primary Study Report | March 2016 A57
List of Public Toilets in Pammal
Sl. No
Location of the Community Toilet
Water Supply
Water Closets Urinal Bath O&M respon.
User Fee (Y/N) If Y?
Functional Status/ Remarks
Male Female Child Male Female Child Male Female
1 Bajanai Koil Street Yes 4 4 - - - - - - ULB Y Functioning
1 Pasumpon Nagar
Yes 4 4 1 - - - 1 1 ULB N Functioning
2 Veeraswamy Nagar Yes 4 4 1 - - - 1 1 ULB N Functioning
3 Kalyanipuram
Yes 4 4 1 - - - 1 1 ULB N Functioning
4 Thideer Nagar
Yes 4 4 1 - - - 1 1 ULB N Functioning
5 Adam Nagar – 1
Yes 4 4 1 - - - 1 1 ULB N Functioning
6 Adam Nagar – 2
Yes 4 4 1 - - - 1 1 ULB N Functioning
Source: Pammal Municipality, June 2015

Scoping Exercise to support Sustainable Urban Sanitation in TN: Primary Study Report | March 2016 A58
Vehicle & Tools for SWM by Pammal Municipality
Sl. No. Type of Vehicles/Tools Capacity Age Trips per day
a Tricycle (70 nos.) 250 kg 3 years 2 trips within the ward
b Mini Lorry (1)
2 MT 8 Years 2 trips
c Tipper Lorry (1)
4 MT 10 years 2 trips
d Tractor (2)
1.5 MT 8 Years 2 trips
e Refuse Collector (1)
Picks community bins
5 MT 5 Years 2 trips
f Long Brooms (20) - As per ware and tare
-
g Forks/Pickers (30 - 35) - As per ware and tare
-
h Small Brooms (25 - 30)
- As per ware and tare
-
Source: Pammal Municipality (June 2015)
Sanctioned and Vacant Posts Matrix of Pammal Municipality
Sl. No.
Name of the Post
No. of Posts Date from which vacant Sanctioned
Staff in Position
Vacant
I General Service
1 Commissioner 1 0 1 01.08.2011
2 Manager (Class IV) 1 0 1 17.04.2015
3 Assistant 1 1 0
4 Junior Assistant 3 3 0
5 Revenue Assistant 3 3 0
6 Record Clerk 1 1 0
7 Office Assistant 1 1 0
8 Data Entry Operator 1 1 0
9 Night Watchman 1 1 0
10 Driver 1 1 0
Sub-Total 14 12 2
II Engineering Service
1 General

Scoping Exercise to support Sustainable Urban Sanitation in TN: Primary Study Report | March 2016 A59
a Municipal Engineer 1 1 0
b Public Work Overseer 2 2 0
c Work Inspector 1 1 0
d Sub-Total 4 4 0
2 Water supply
a Electrician Grade II 1 1 0
b Driver 3 3 0
c Helper (water supply) 1 1 0
d Fitter Gr.II 1 1 0
e Hand pump maintainer 1 1 0
f Turn cock 3 3 0
g Overhead tank watch man 1 1 0
h Wireman & Helper 2 2 0 02.10.2010 and 08.05.2015
i Sub-Total 13 13 0
III Health Service
a Sanitary Inspector 1 1 0
b Sanitary Supervisor 2 2 0
c Public Health Driver 5 5 0
d Sanitary workers 97 93 4 1 (05.05.2004), 1 (01.06.2007), 11 (1.04.2009), 1 (25.04.2009), 1 (12.01.2010), 1 (28.04.2010), 1 (01.02.2011)
e Community Organizer 1 1 0
Sub-Total 106 102 4
Grand Total 137 131 6
Source: Pammal Municipality (June 2015)
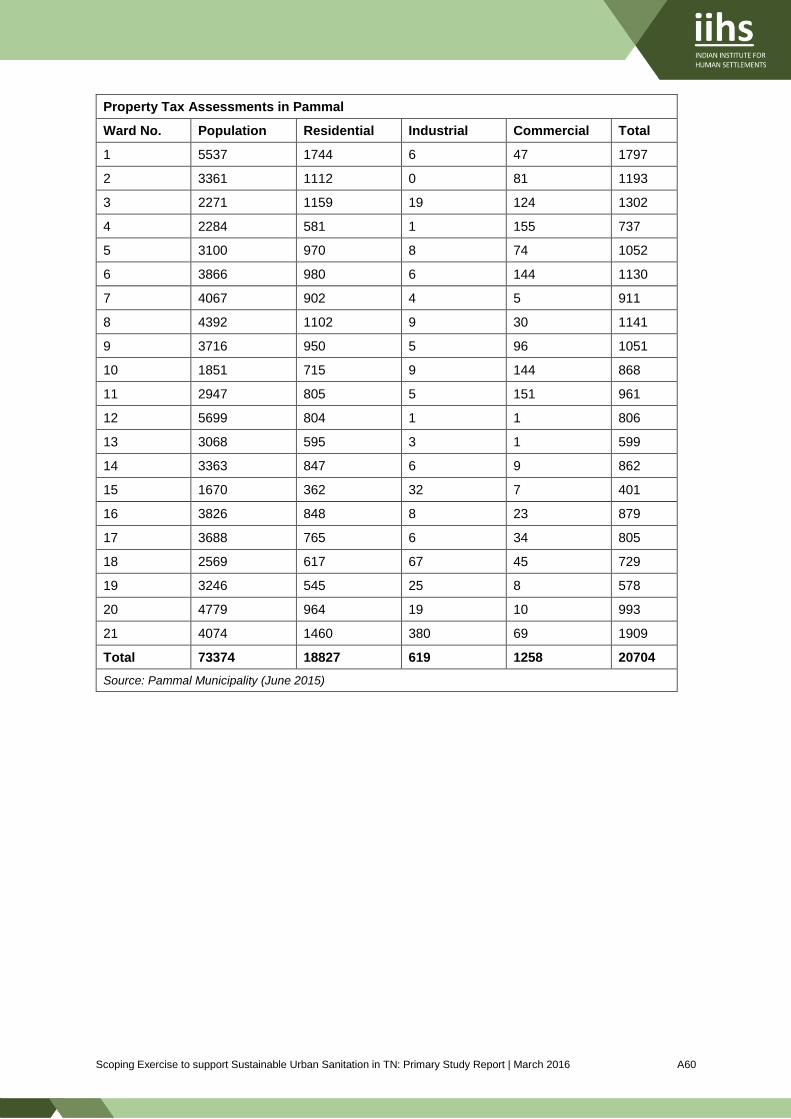
Scoping Exercise to support Sustainable Urban Sanitation in TN: Primary Study Report | March 2016 A60
Property Tax Assessments in Pammal
Ward No. Population Residential Industrial Commercial Total
1 5537 1744 6 47 1797
2 3361 1112 0 81 1193
3 2271 1159 19 124 1302
4 2284 581 1 155 737
5 3100 970 8 74 1052
6 3866 980 6 144 1130
7 4067 902 4 5 911
8 4392 1102 9 30 1141
9 3716 950 5 96 1051
10 1851 715 9 144 868
11 2947 805 5 151 961
12 5699 804 1 1 806
13 3068 595 3 1 599
14 3363 847 6 9 862
15 1670 362 32 7 401
16 3826 848 8 23 879
17 3688 765 6 34 805
18 2569 617 67 45 729
19 3246 545 25 8 578
20 4779 964 19 10 993
21 4074 1460 380 69 1909
Total 73374 18827 619 1258 20704
Source: Pammal Municipality (June 2015)
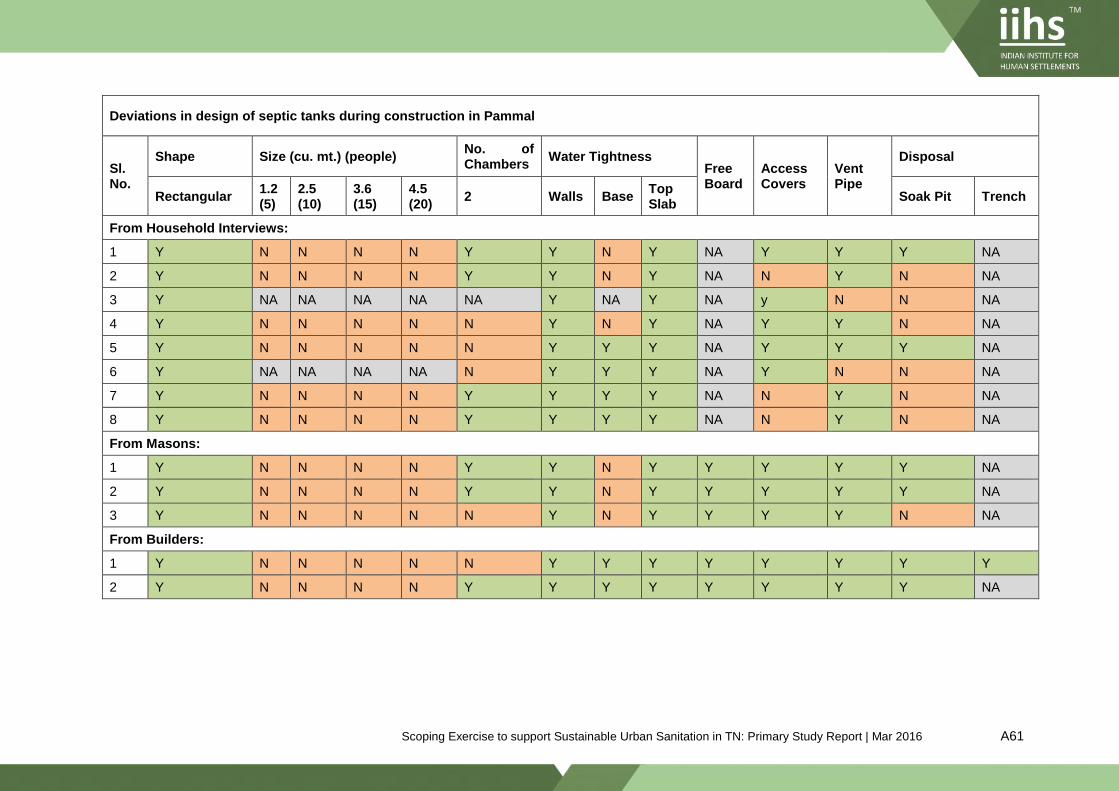
Scoping Exercise to support Sustainable Urban Sanitation in TN: Primary Study Report | Mar 2016 A61
Deviations in design of septic tanks during construction in Pammal
Sl. No.
Shape Size (cu. mt.) (people) No. of Chambers
Water Tightness Free Board
Access Covers
Vent Pipe
Disposal
Rectangular 1.2 (5)
2.5 (10)
3.6 (15)
4.5 (20)
2 Walls Base Top Slab
Soak Pit Trench
From Household Interviews:
1 Y N N N N Y Y N Y NA Y Y Y NA
2 Y N N N N Y Y N Y NA N Y N NA
3 Y NA NA NA NA NA Y NA Y NA y N N NA
4 Y N N N N N Y N Y NA Y Y N NA
5 Y N N N N N Y Y Y NA Y Y Y NA
6 Y NA NA NA NA N Y Y Y NA Y N N NA
7 Y N N N N Y Y Y Y NA N Y N NA
8 Y N N N N Y Y Y Y NA N Y N NA
From Masons:
1 Y N N N N Y Y N Y Y Y Y Y NA
2 Y N N N N Y Y N Y Y Y Y Y NA
3 Y N N N N N Y N Y Y Y Y N NA
From Builders:
1 Y N N N N N Y Y Y Y Y Y Y Y
2 Y N N N N Y Y Y Y Y Y Y Y NA
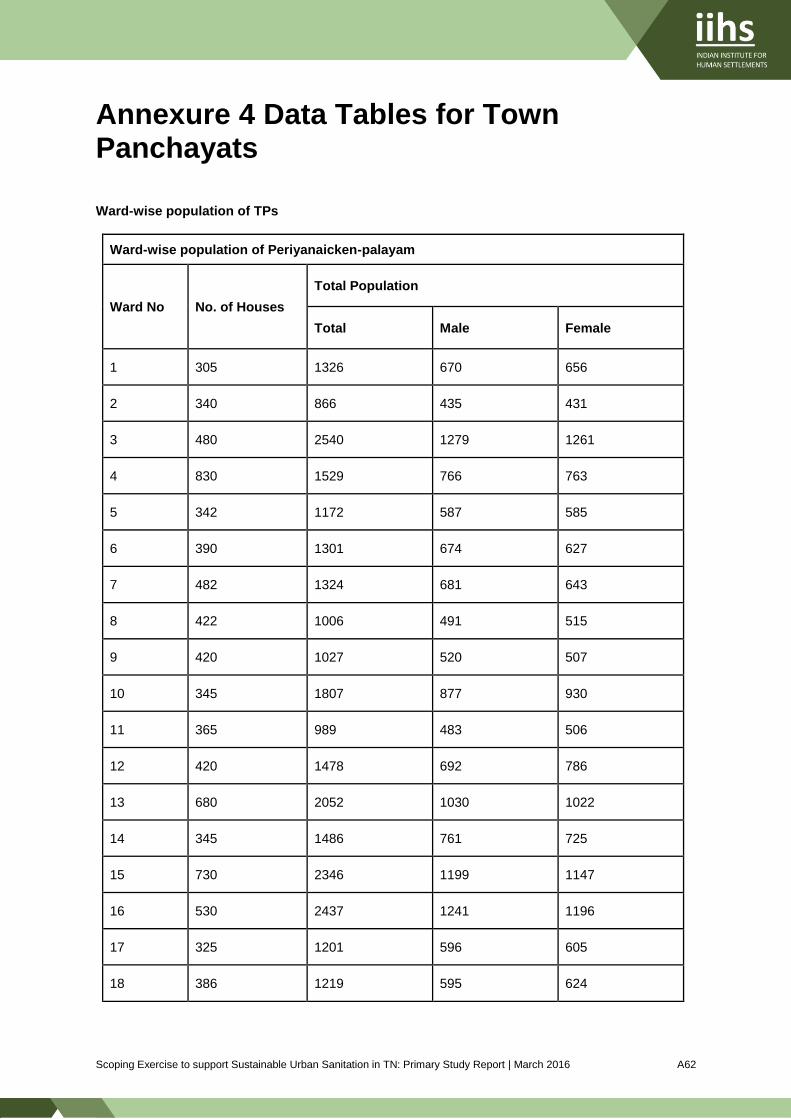
Scoping Exercise to support Sustainable Urban Sanitation in TN: Primary Study Report | March 2016 A62
Annexure 4 Data Tables for Town Panchayats
Ward-wise population of TPs
Ward-wise population of Periyanaicken-palayam
Ward No No. of Houses
Total Population
Total Male Female
1 305 1326 670 656
2 340 866 435 431
3 480 2540 1279 1261
4 830 1529 766 763
5 342 1172 587 585
6 390 1301 674 627
7 482 1324 681 643
8 422 1006 491 515
9 420 1027 520 507
10 345 1807 877 930
11 365 989 483 506
12 420 1478 692 786
13 680 2052 1030 1022
14 345 1486 761 725
15 730 2346 1199 1147
16 530 2437 1241 1196
17 325 1201 596 605
18 386 1219 595 624

Scoping Exercise to support Sustainable Urban Sanitation in TN: Primary Study Report | March 2016 A63
Ward-wise population of Periyanaicken-palayam
Ward No No. of Houses
Total Population
Total Male Female
8137 27106 13577 13529
Source: Periyanaicken-palayam Town Panchayat, 2015
Details of Slum Settlements in TPs
Details of Slum Settlements in Periyanaicken-palayam
Sl. No. Name of the Slum Ward No.
1 Kuppuchipalayam 5
2 Anna Nagar 7
3 Vivekanandapuram 13
Total Population is 1695 (973 males and 822 Females)
Source: Periyanaicken-palayam Town Panchayat, 2015
Details of Slum Settlements in Narsimhanaicken-palayam
Sl. No. Name of the Slum No. of HHs Population Male Female
1 MGR Nagar 32 150 78 72
2 Om Shakthi Nagar 52 163 69 94
3 Ambethkar Nagar 23 86 32 56
4 Arijana Colony 71 162 79 82
5 Chennamanaickenur 75 145 81 63
6 Balavinayagar Nagar 60 - 80 No Data No Data No Data
Totals 290 857 408 449
Source: Periyanaicken-palayam Town Panchayat, 2015
Ward-wise Water Supply Connections in TPs
Ward-wise Water Supply Connections in Periyanaicken-palayam
Ward No. Domestic Commercial Industries Total
1 457 9 2 468
2 188 1 0 189
3 453 12 7 472
4 304 0 0 304
5 360 3 7 370
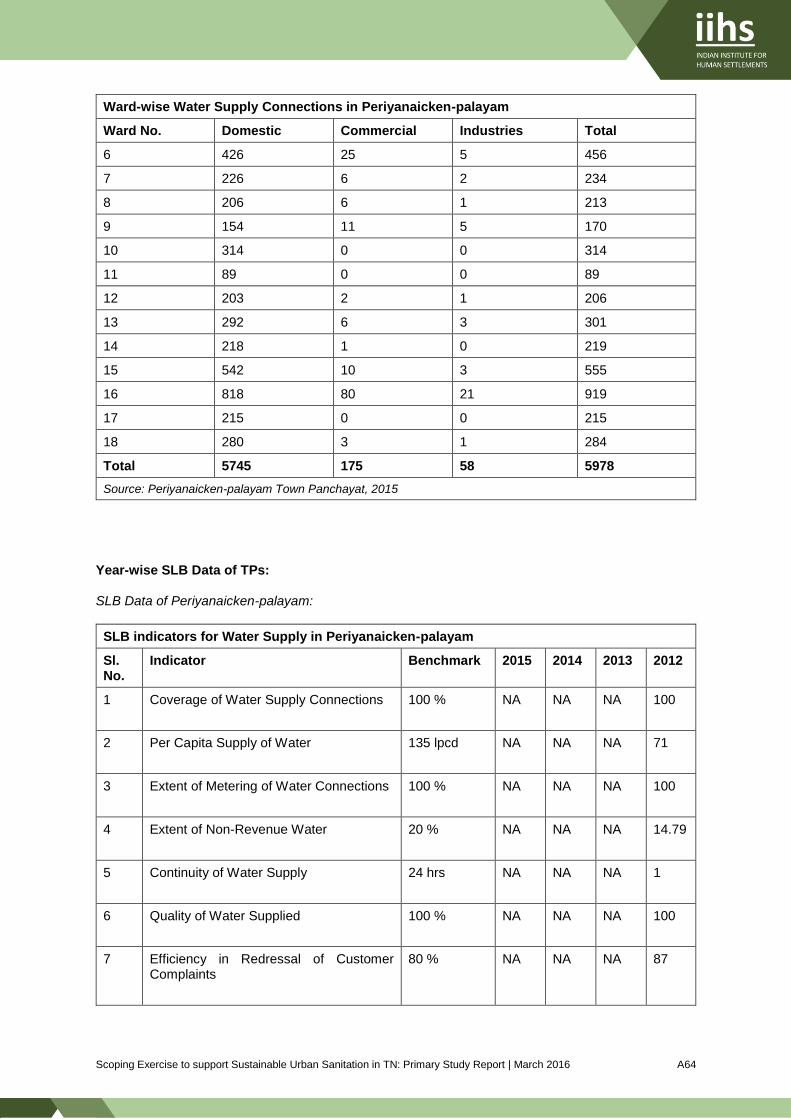
Scoping Exercise to support Sustainable Urban Sanitation in TN: Primary Study Report | March 2016 A64
Ward-wise Water Supply Connections in Periyanaicken-palayam
Ward No. Domestic Commercial Industries Total
6 426 25 5 456
7 226 6 2 234
8 206 6 1 213
9 154 11 5 170
10 314 0 0 314
11 89 0 0 89
12 203 2 1 206
13 292 6 3 301
14 218 1 0 219
15 542 10 3 555
16 818 80 21 919
17 215 0 0 215
18 280 3 1 284
Total 5745 175 58 5978
Source: Periyanaicken-palayam Town Panchayat, 2015
Year-wise SLB Data of TPs:
SLB Data of Periyanaicken-palayam:
SLB indicators for Water Supply in Periyanaicken-palayam
Sl. No.
Indicator Benchmark 2015 2014 2013 2012
1 Coverage of Water Supply Connections
100 % NA NA NA 100
2 Per Capita Supply of Water
135 lpcd NA NA NA 71
3 Extent of Metering of Water Connections
100 % NA NA NA 100
4 Extent of Non-Revenue Water
20 % NA NA NA 14.79
5 Continuity of Water Supply
24 hrs NA NA NA 1
6 Quality of Water Supplied
100 % NA NA NA 100
7 Efficiency in Redressal of Customer Complaints
80 % NA NA NA 87

Scoping Exercise to support Sustainable Urban Sanitation in TN: Primary Study Report | March 2016 A65
SLB indicators for Water Supply in Periyanaicken-palayam
Sl. No.
Indicator Benchmark 2015 2014 2013 2012
8 Cost Recovery in Water Supply Services
100 % NA NA NA -
9 Efficiency in Collection of Water Supply-related Charges
90 % NA NA NA 100
Source: Periyanaicken-palayam Town Panchayat
SLB indicators for SWM in Periyanaicken-palayam
Sl. No.
Indicator Benchmark 2015 2014 2013 2012
1 Household Level Coverage of SWM Services
100 % NA NA NA 100
2 Efficiency of Collection of Municipal Solid Waste
100 % NA NA NA 100
3 Extent of Segregation of Municipal Solid Waste
100 % NA NA NA 50
4 Extent of Municipal Solid Waste Recovered
80 % NA NA NA -
5 Extent of Scientific Disposal of Municipal Solid Waste
100 % NA NA NA 75
6 Efficiency in Redressal of Customer Complaints
80 % NA NA NA 80
7 Extent of Cost Recovery in SWM services 100 % NA NA NA -
8 Efficiency in Collection of SWM Charges
90 % NA NA NA -
Source: Periyanaicken-palayam Town Panchayat
SLB indicators for Storm Water Drainage in Periyanaicken-palayam
Sl. No.
Indicator Benchmark 2015 2014 2013 2012
1 Coverage of Storm water drainage network
100 % NA NA NA 65.80
2 Incidence of water logging / flooding 0 % NA NA NA 0
Source: Periyanaicken-palayam Town Panchayat

Scoping Exercise to support Sustainable Urban Sanitation in TN: Primary Study Report | March 2016 A66
List of Public Toilets in TPs
Public Toilets in Periyanaicken-palayam
Sl. No.
Ward no.
Location of the Public Toilet Water Supply
Toilet Seats Urinal O&M responsibility
User Fee
(Y/N) If Y?
Functional Status / Remarks
Male Female Child Male Female Child
1 3 Irvin Road
Yes 3 3 - - - - TP
2 7 Anna Nagar
Yes 4 6 - - - - TP
3 7 Ooty Road
Yes 3 3 - - - -- TP
4 10 Union Bank Road
Yes - 6 - - -- - TP
5 11 Kanduvar Street
Yes 6 5 - - -- - TP
6 12 K K Nagar
Yes 6 - - - - - TP
7 13 Vivekanandapuram
Yes 6 6 - - - - TP
8 18 Jyothipuram Bus Stand
Yes 8 9 - - - - TP
9 8 Indra Nagar Shopping Complex
Yes 4 4 - 4 - - TP
Source: Town Panchayat Office of Periyanaicken-palayam, 2015

Scoping Exercise to support Sustainable Urban Sanitation in TN: Primary Study Report | March 2016 A67
Community Toilets in Periyanaicken-palayam
Sl. No
Ward No.
Location of the Community Toilet
Water Supply
Water Closets Urinal Bath O&M respon.
User Fee
(Y/N)If Y?
Functional Status/
Remarks Male Female Child Male Female Child Male Female
1 4 Kasturipalayam
Yes 3 3 - - - - - 3 TP
2 4 Sathya Nagar
Yes 6 6 - - - - - 4 TP
3 5 Kappichipalayam
Yes - 13 - - - - - 4 TP
4 15 Sakthi Nagar
Yes 8 9 - - - - - 3 TP
Source: Town Panchayat Office of Periyanaicken-palayam, 2015
Public Toilets in Narsimhanaicken-palayam
Sl. No.
Ward no.
Location of the Public Toilet Water Supply
Toilet Seats Urinal O&M responsibility
User Fee
(Y/N) If Y, ?
Functional Status / Remarks
Male
Female
Child Male
Female
Child
1 2 Pudhupalayam Yes 6
- - - Town Panchayat
No In Use
2 2 Pudhupalayam Yes 8
- - - In Use
3 3 Balaji Nagar Yes 8 8
- - - In Use
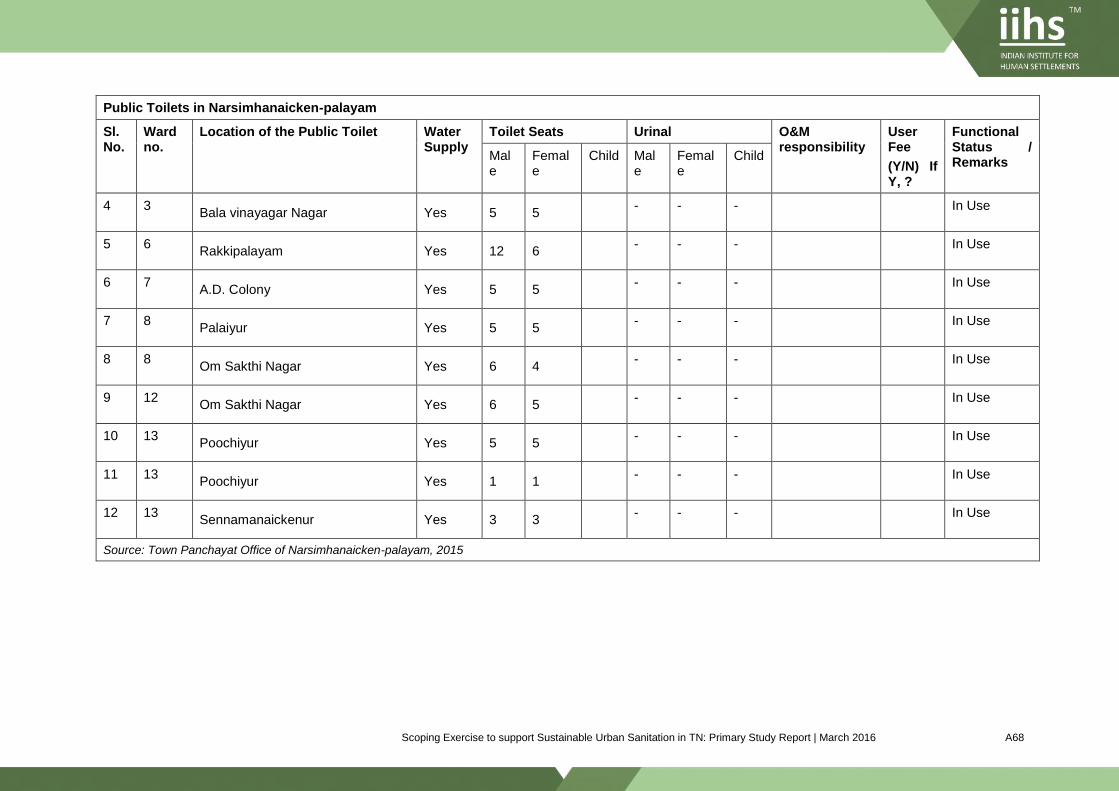
Scoping Exercise to support Sustainable Urban Sanitation in TN: Primary Study Report | March 2016 A68
Public Toilets in Narsimhanaicken-palayam
Sl. No.
Ward no.
Location of the Public Toilet Water Supply
Toilet Seats Urinal O&M responsibility
User Fee
(Y/N) If Y, ?
Functional Status / Remarks
Male
Female
Child Male
Female
Child
4 3 Bala vinayagar Nagar Yes 5 5
- - - In Use
5 6 Rakkipalayam Yes 12 6
- - - In Use
6 7 A.D. Colony Yes 5 5
- - - In Use
7 8 Palaiyur Yes 5 5
- - - In Use
8 8 Om Sakthi Nagar Yes 6 4
- - - In Use
9 12 Om Sakthi Nagar Yes 6 5
- - - In Use
10 13 Poochiyur Yes 5 5
- - - In Use
11 13 Poochiyur Yes 1 1
- - - In Use
12 13 Sennamanaickenur Yes 3 3
- - - In Use
Source: Town Panchayat Office of Narsimhanaicken-palayam, 2015

Scoping Exercise to support Sustainable Urban Sanitation in TN: Primary Study Report | March 2016 A69
Public and Community Toilets in Idigarai
Sl. No
Ward No.
Location of the Community Toilet
Water Supply
Water Closets Urinal Bath O&M respon.
User Fee
(Y/N)If Y?
Functional Status/
Remarks Male
Female
Child
Male
Female
Child
Male
Female
1 2
Main Road, Govindhanaickenpalayam
- 4 - - - - - - Town Panchayat
No In Use
2 2 Main Road, Govindhanaickenpalayam
6 - - - - - - - Town Panchayat
In Use
3 2 AD Colony, Govindhanaickenpalayam
4 4 - - - - - - Town Panchayat
In Use
4 2 Main Road (Disable Toilet) 2 2 - - - - - - Town Panchayat
In Use
5 3 Periyar Nagar
4 4 - - - - 2 2 Town Panchayat
In Use
6 4 Krishnapuram
3 3 - - - - - - Town Panchayat
In Use
7 4 Chennamanaickenpalayam
- 8 - - - - - 2 Town Panchayat
In Use
8
5
Sengalipalayam
4 4 - - - - - - Town Panchayat
In Use
9 6 Sengalipalayam
- 8 - - - - - 2 Town Panchayat
In Use
10 6 Sengalipalayam
6 - - - - - - - Town Panchayat
In Use
11 7 Maniyakaranpalayam
0 6 - - - - - - Town Panchayat
In Use
12 8 AD Colony 4 4 - - - - - - Town Panchayat
In Use
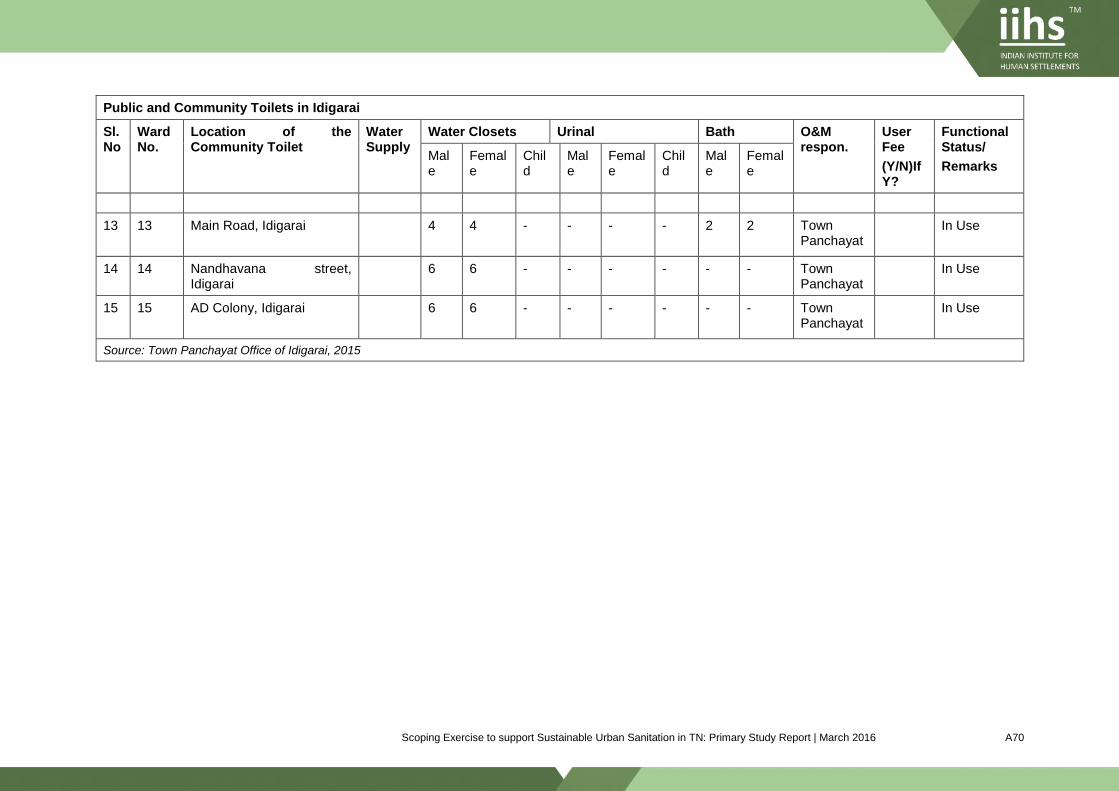
Scoping Exercise to support Sustainable Urban Sanitation in TN: Primary Study Report | March 2016 A70
Public and Community Toilets in Idigarai
Sl. No
Ward No.
Location of the Community Toilet
Water Supply
Water Closets Urinal Bath O&M respon.
User Fee
(Y/N)If Y?
Functional Status/
Remarks Male
Female
Child
Male
Female
Child
Male
Female
13 13 Main Road, Idigarai
4 4 - - - - 2 2 Town Panchayat
In Use
14 14 Nandhavana street, Idigarai
6 6 - - - - - - Town Panchayat
In Use
15 15 AD Colony, Idigarai
6 6 - - - - - - Town Panchayat
In Use
Source: Town Panchayat Office of Idigarai, 2015
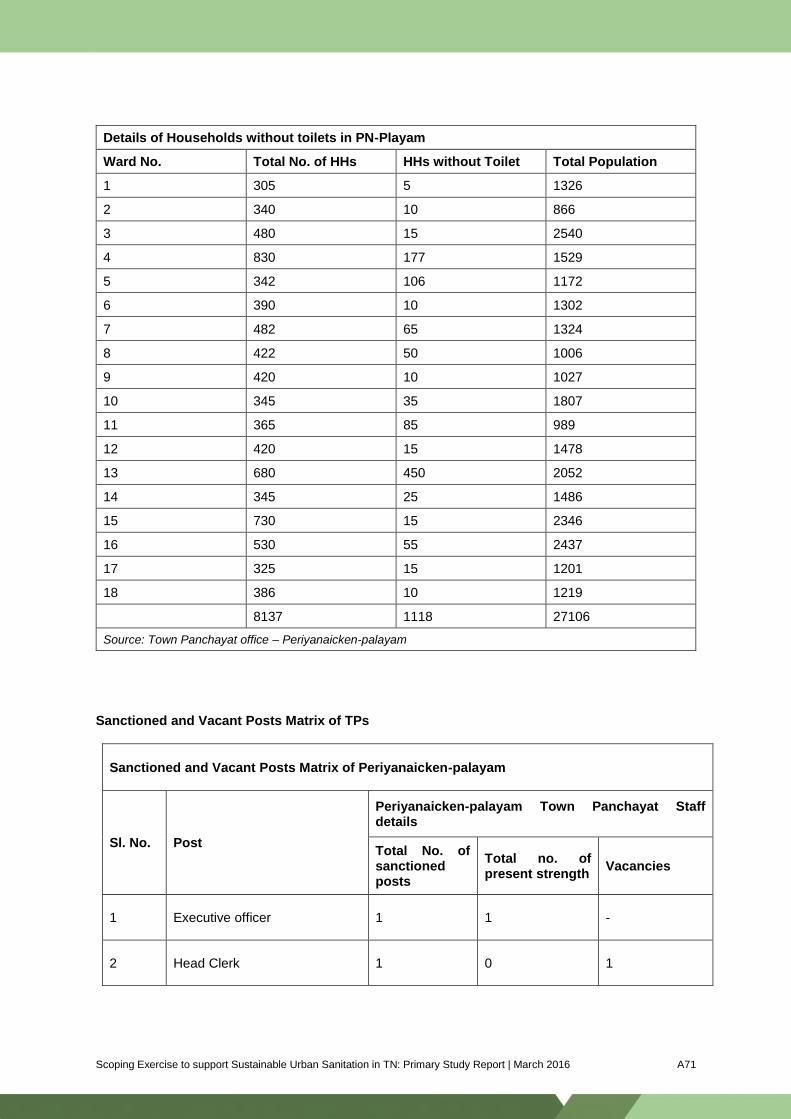
Scoping Exercise to support Sustainable Urban Sanitation in TN: Primary Study Report | March 2016 A71
Details of Households without toilets in PN-Playam
Ward No. Total No. of HHs HHs without Toilet Total Population
1 305 5 1326
2 340 10 866
3 480 15 2540
4 830 177 1529
5 342 106 1172
6 390 10 1302
7 482 65 1324
8 422 50 1006
9 420 10 1027
10 345 35 1807
11 365 85 989
12 420 15 1478
13 680 450 2052
14 345 25 1486
15 730 15 2346
16 530 55 2437
17 325 15 1201
18 386 10 1219
8137 1118 27106
Source: Town Panchayat office – Periyanaicken-palayam
Sanctioned and Vacant Posts Matrix of TPs
Sanctioned and Vacant Posts Matrix of Periyanaicken-palayam
Sl. No. Post
Periyanaicken-palayam Town Panchayat Staff details
Total No. of sanctioned posts
Total no. of present strength
Vacancies
1 Executive officer 1 1 -
2 Head Clerk 1 0 1
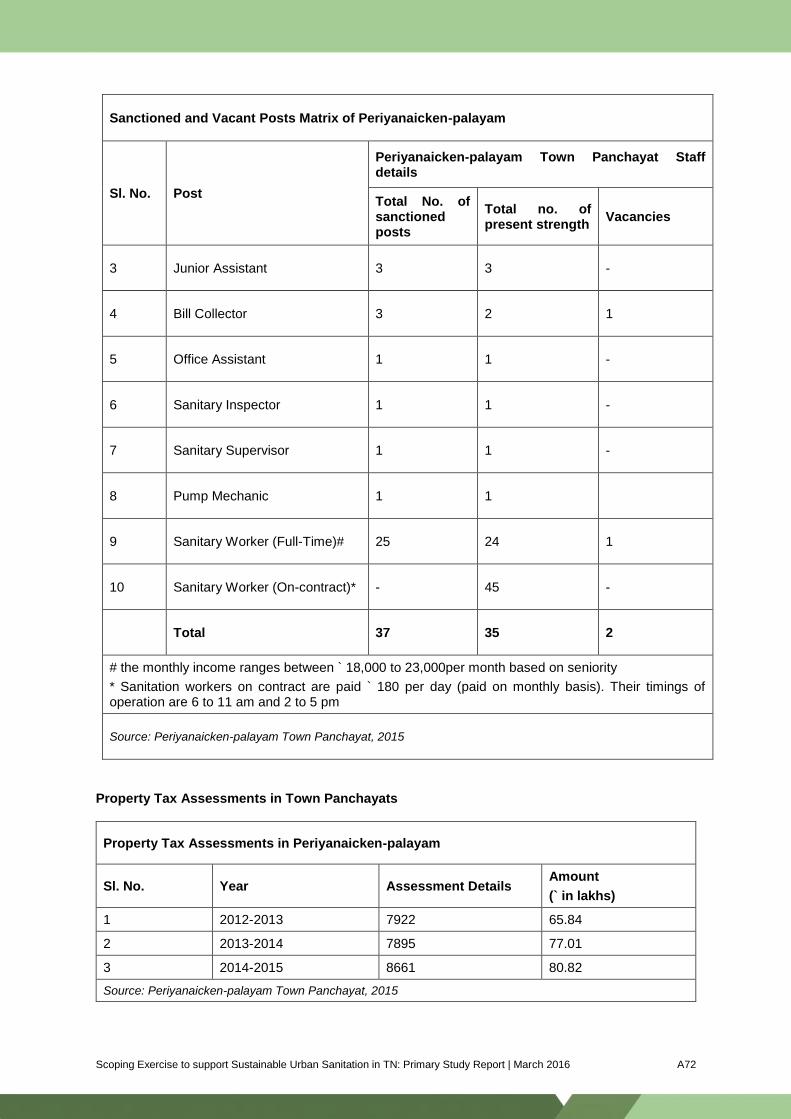
Scoping Exercise to support Sustainable Urban Sanitation in TN: Primary Study Report | March 2016 A72
Sanctioned and Vacant Posts Matrix of Periyanaicken-palayam
Sl. No. Post
Periyanaicken-palayam Town Panchayat Staff details
Total No. of sanctioned posts
Total no. of present strength
Vacancies
3 Junior Assistant 3 3 -
4 Bill Collector 3 2 1
5 Office Assistant 1 1 -
6 Sanitary Inspector 1 1 -
7 Sanitary Supervisor 1 1 -
8 Pump Mechanic 1 1
9 Sanitary Worker (Full-Time)# 25 24 1
10 Sanitary Worker (On-contract)* - 45 -
Total 37 35 2
# the monthly income ranges between ` 18,000 to 23,000per month based on seniority
* Sanitation workers on contract are paid ` 180 per day (paid on monthly basis). Their timings of operation are 6 to 11 am and 2 to 5 pm
Source: Periyanaicken-palayam Town Panchayat, 2015
Property Tax Assessments in Town Panchayats
Property Tax Assessments in Periyanaicken-palayam
Sl. No. Year Assessment Details Amount
(` in lakhs)
1 2012-2013 7922 65.84
2 2013-2014 7895 77.01
3 2014-2015 8661 80.82
Source: Periyanaicken-palayam Town Panchayat, 2015

Scoping Exercise to support Sustainable Urban Sanitation in TN: Primary Study Report | March 2016 A73
Property Tax Details for the Year 2014-15 of Periyanaicken-palayam
Ward No. No. of Assessments Total Income from P-Tax (`)
1 653 2,85,216
2 267 75,105
3 1036 3,48,551
4 463 1,10,188
5 377 79,040
6 511 1,05,783
7 503 2,22,553
8 322 83,190
9 331 1,04,514
10 257 48,719
11 224 44,705
12 312 72,212
13 600 1,53,460
14 404 90,126
15 898 3,33,812
16 1036 10,71,067
17 276 62,904
18 391 1,07,727
8,861 33,98,872
Source: Periyanaicken-palayam Town Panchayat, 2015


Scoping Exercise to support Sustainable Urban Sanitation in TN: Primary Study Report | March 2016 A75
Indian Institute for Human Settlements Bangalore City Campus No. 197/36, 2nd Main Road Sadashiva Nagar Bangalore 560 080. India T +91 80 6760 6666 www.iihs.co.in