scor model
TRANSCRIPT

SCOR MODEL
AGENDA
• Process Reference Model
• SCOR Model
• What?
• Span it operates
• Limitations & Assumptions
• AT&T Wireless Services
• Learnings
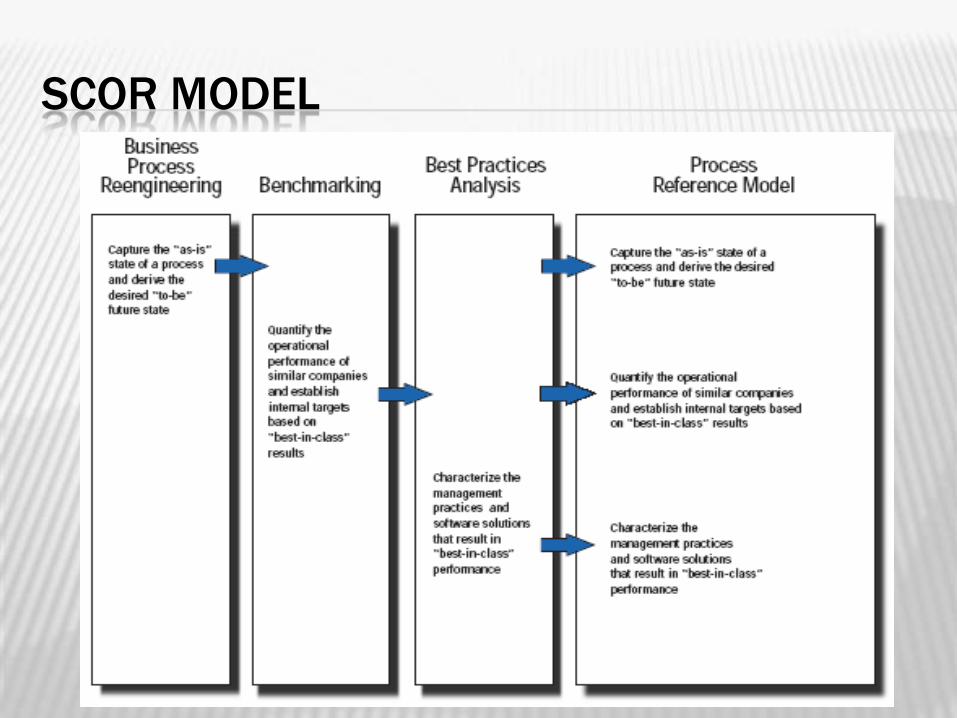
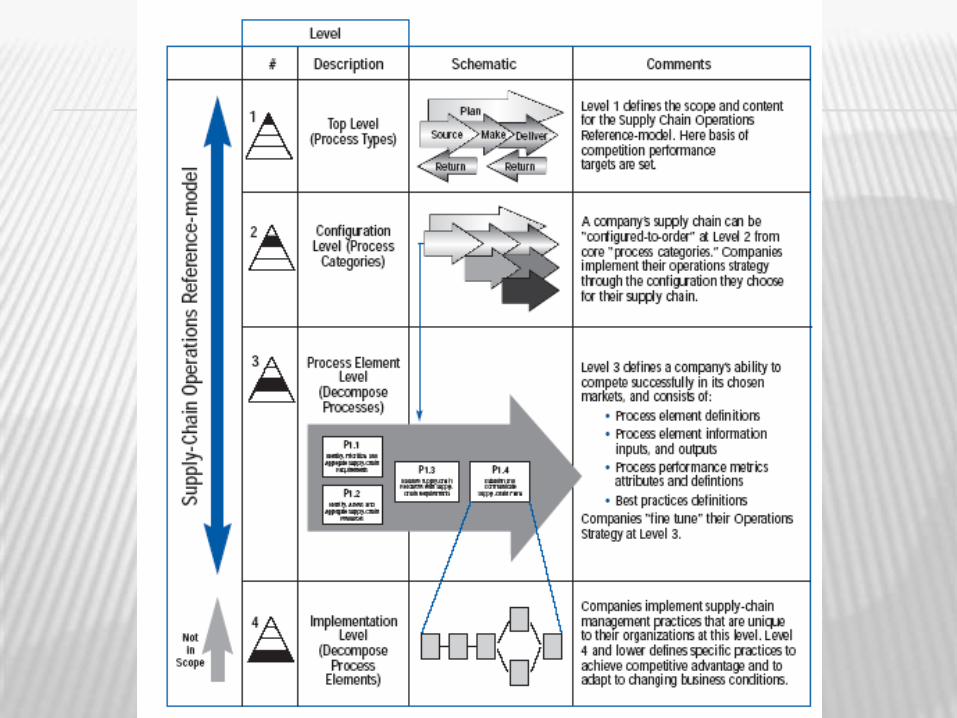
SCOR MODEL
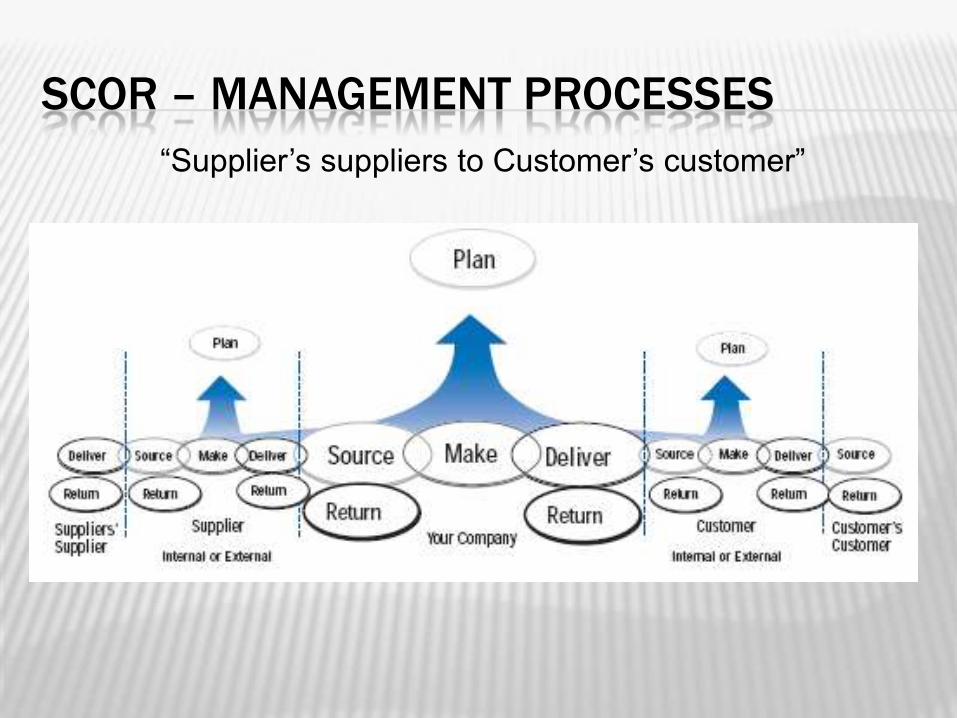
SCOR – MANAGEMENT PROCESSES
“Supplier’s suppliers to Customer’s customer”
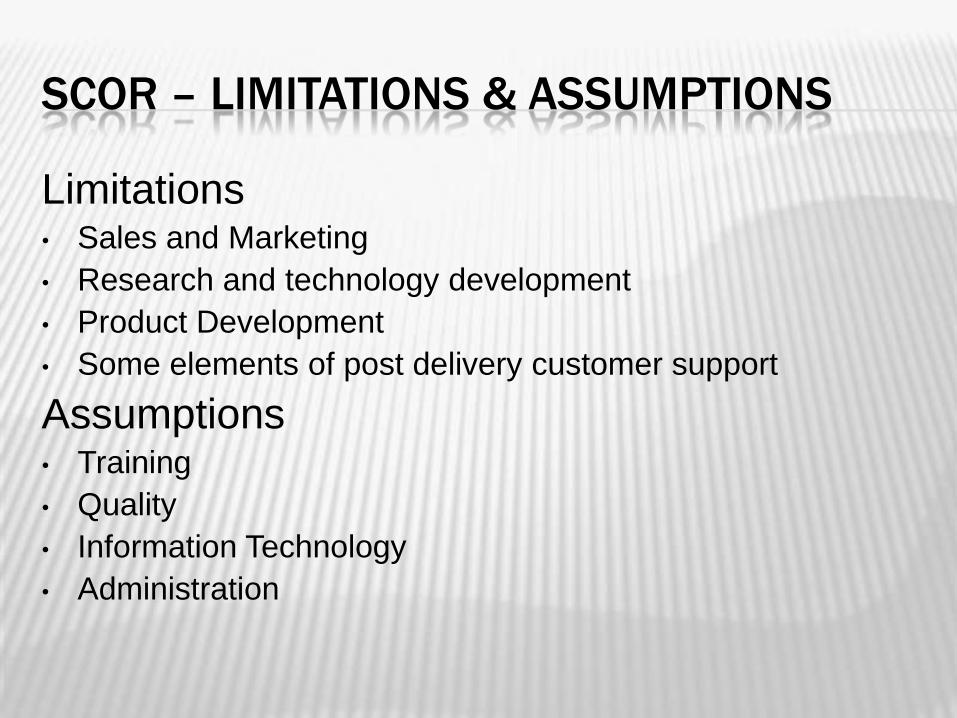
SCOR – LIMITATIONS & ASSUMPTIONS
Limitations• Sales and Marketing
• Research and technology development
• Product Development
• Some elements of post delivery customer support
Assumptions• Training
• Quality
• Information Technology
• Administration

AT&T WIRELESS SERVICES
McCaw Cellular Communications: AT&T WirelessServices in 1994
• 70% manufacturing was outsourced.
• Global presence was wide but not deep as only 10% ofthis revenue came from the global sales.
• Transition from B2B business model to a consumer-product model.
• Problem getting the right product at the right place at the righttime
• Huge amount of inventory in pipeline. About 3 to 4 months.Plus the product life cycle was reducing in this segment.
• Wireless Services division: Financial losses to 20% ofthe revenue
• Cash-to-cash cycle was 10 weeks.
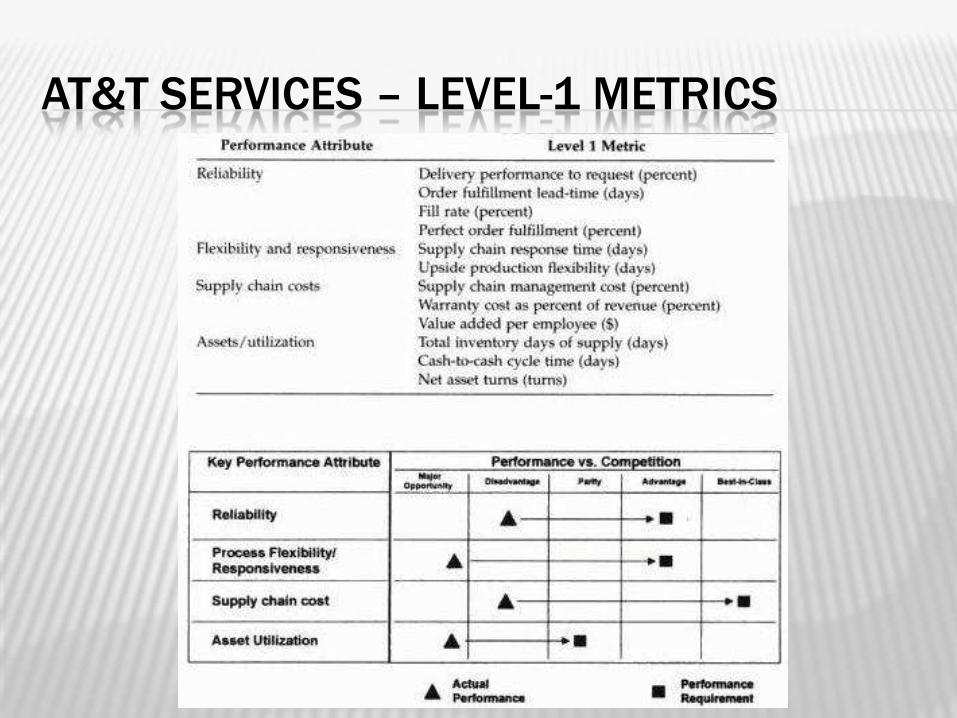
AT&T SERVICES – LEVEL-1 METRICS
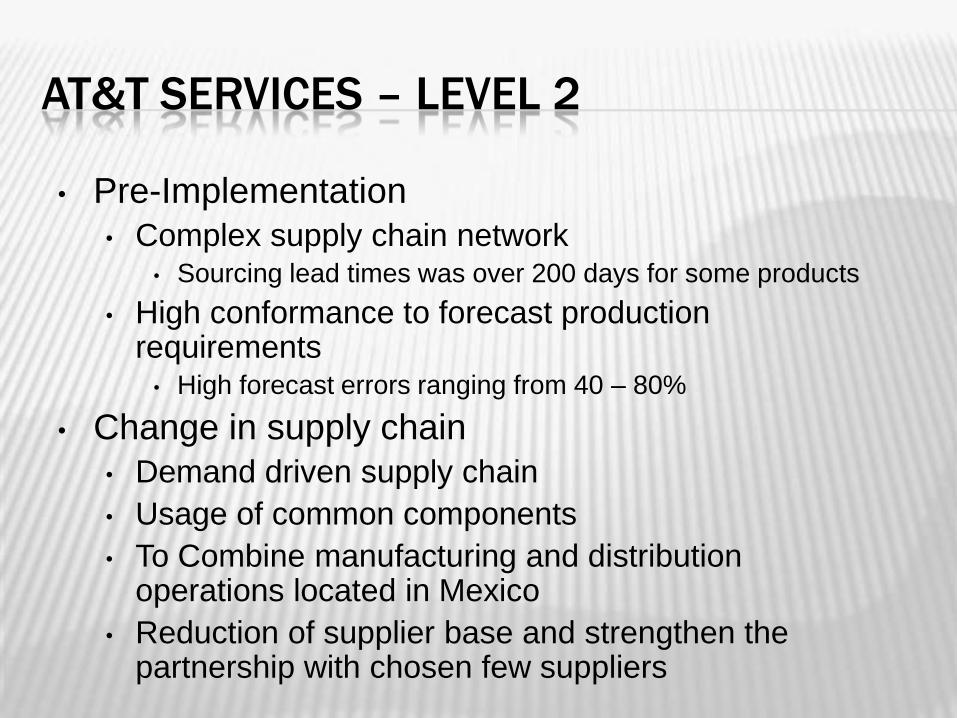
AT&T SERVICES – LEVEL 2
• Pre-Implementation
• Complex supply chain network• Sourcing lead times was over 200 days for some products
• High conformance to forecast production requirements
• High forecast errors ranging from 40 – 80%
• Change in supply chain
• Demand driven supply chain
• Usage of common components
• To Combine manufacturing and distribution operations located in Mexico
• Reduction of supplier base and strengthen the partnership with chosen few suppliers
AT&T SERVICES – LEVEL 3
Specific elements improvement.
• Real time information on available to promise
quantity: integration with scheduling and
inventory management system
• Electronic order handling
• Ship complete orders
• Handle 90% order on FIFO basis
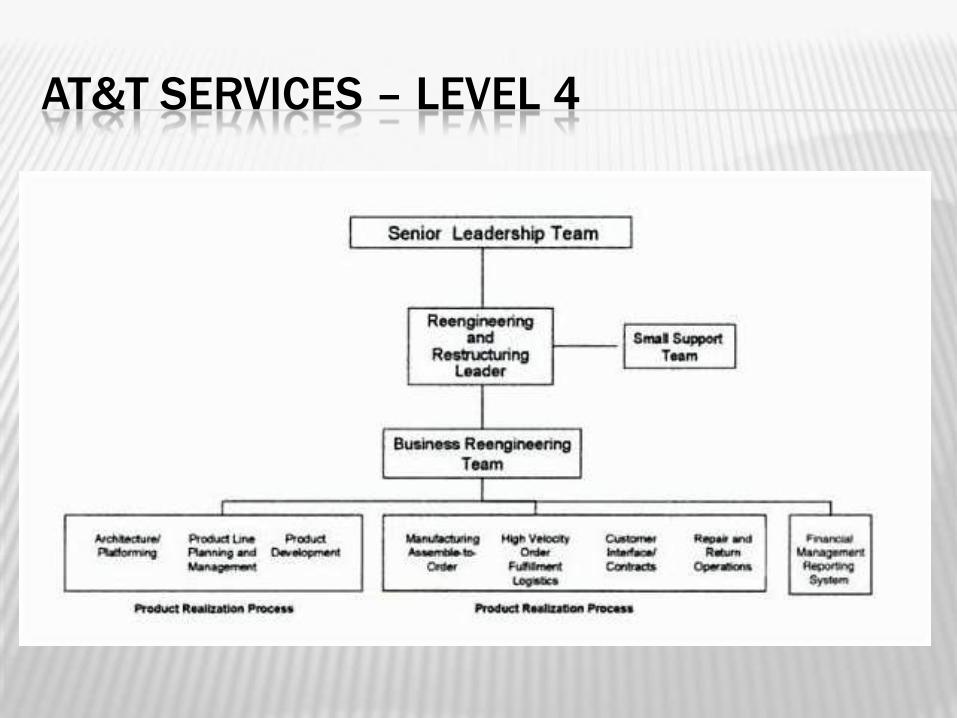
AT&T SERVICES – LEVEL 4
BENEFITS - POST IMPLEMENTATION
• Immediate financial improvements just by closing down and consolidating the SC into a make-to-order environment
• By the second year of implementation
• Gross margin was improved by 10% of revenues –resulted in $200 million worth of savings
• Significant reduction in inventory – 55% reduction in inventory
• Improvement in cash flow – cash-to-cash cycles were reduced by about 70%
• Improvement in delivery performance – cycle times were reduced by 80% (12 weeks to 2 weeks)
LEARNING
• Need for fact-based analysis
• Identification of strategic performance
advantages
• Top management involvement
• Need for continuous updation of
• Value proposition
• Benchmarks
• Refining supply chain
REFERENCES
• SCOR Overview 9.0- Supply Chain Council.
• www.supply-chain.org
• Handbook on Supply Chain Management
• Evolving Enterprise: Volume 1-Lionheart
Publishing.
• www.ism.ws

Thank You