scoring poverty philippines 2002
TRANSCRIPT
8/8/2019 Scoring Poverty Philippines 2002
http://slidepdf.com/reader/full/scoring-poverty-philippines-2002 1/68
A Simple Poverty Scorecard for the Philippines
Mark Schreiner
April 16, 2008
Senior Scholar, Center for Social Development
Washington University in Saint Louis
Campus Box 1196, One Brookings Drive
Saint Louis, MO 63130–4899, U.S.A.
andDirector, Microfinance Risk Management, L.L.C.
2441 Tracy Avenue, Kansas City, MO 64108–2935, U.S.A.
Telephone: +1 (816) 359–3545, http://www.microfinance.com
Abstract How poor are participants of development projects in the Philippines? This paper uses
the 2002 Annual Poverty Indicators Survey to construct an easy-to-use, objectivepoverty scorecard that estimates the likelihood that a participant has income below the
national poverty line. The scorecard uses 10 simple indicators that field workers can
quickly collect and verify. Scores can be computed by hand on paper in real time. With
99-percent confidence, estimates of groups’ overall poverty rates are accurate to within
+/–1 percentage points. The poverty scorecard can help programs target services, track
changes in poverty over time, and report on poverty rates.
Version noteThis version replaces that of April 27, 2007, which, due to an incorrect Purchase Power
Parity conversion factor, used an incorrect $2/day line. The correct $2/day line turns
out to be almost the same as the “very poor” line defining the poorest half below thenational poverty line. The $3/day line, in turn, is almost exactly the national poverty
line. Therefore, this version reports on the $4/day line. These changes affect Section 8
and Figures 26–29; everything else is unchanged. Organizations that have applied the
poverty scorecard here should simply discard their $2/day figures and associate their
existing scores with the correct poverty likelihoods for $4/day, using Figure 26.
Acknowledgements
8/8/2019 Scoring Poverty Philippines 2002
http://slidepdf.com/reader/full/scoring-poverty-philippines-2002 2/68
A Simple Poverty Scorecard for the Philippines
1. Introduction
This paper presents an easy-to-use, objective poverty scorecard to help
development programs in the Philippines to target services, track changes in poverty
over time, and report clients’ poverty rates.
Indicators in the scorecard were derived from the 38,014 households surveyed in
the 2002 Annual Poverty Indicators Survey (APIS). Selection criteria included:
• Inexpensive to collect, easy to answer quickly, and simple to verify
• Liable to change over time as poverty status changes
• Strongly correlated with poverty
All scorecard weights are positive integers, and scores range from 0 (most-likely
“poor”) to 100 (least-likely “poor”). The scorecard is easy to understand, and field
workers can compute scores by hand, on paper, in real time.
A participant’s score corresponds to a “poverty likelihood”, that is, the
probability of being poor. For a group, the overall poverty rate (the so-called “head-
count index”) is the average poverty likelihood of the individuals in the group. For a
group over time, progress (or regress) is the change in its average poverty likelihood.

8/8/2019 Scoring Poverty Philippines 2002
http://slidepdf.com/reader/full/scoring-poverty-philippines-2002 3/68
estimated poverty likelihood is accurate within +/–6 percentage points, and a group’s
estimated overall poverty rate is accurate with 99-percent confidence to within +/–1
percentage points.
2. Data and poverty lines
The analysis uses the 38,014 households in the 2002 APIS from the Philippines’
National Statistics Office. This is the best, most recent household survey available with
income or expenditure data.
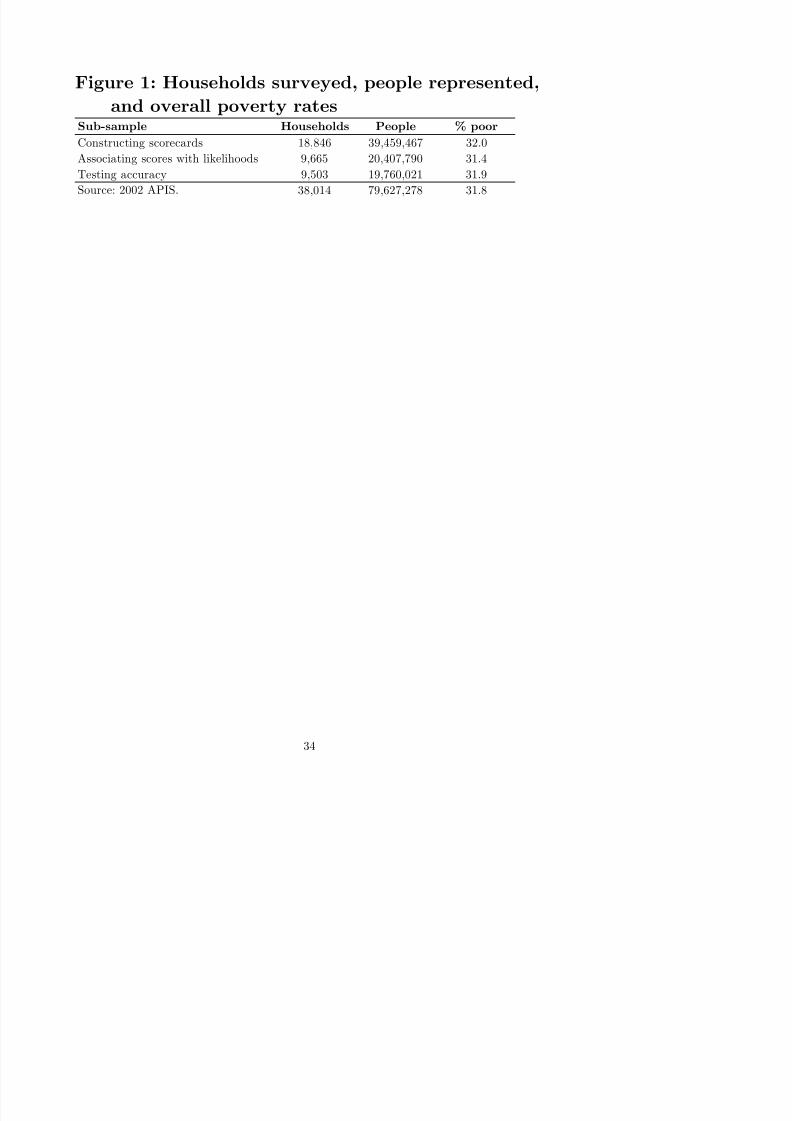
This paper divides the APIS households into three random samples (Figure 1),
with one-half the households used for constructing the scorecard, one-fourth used for
associating scores with estimated poverty likelihoods, and one-fourth used for measuring
the accuracy of estimates derived from the scorecard.
APIS is fielded annually and measures income but not expenditure. The official
poverty lines are in terms of income, and the Philippine government applies them only
to a larger, more detailed survey, the triennial Family Income and Expenditure Survey
(FIES). The 2003 FIES is not available, but Ericta (2005) reports that it gives a
poverty rate of 30.4 percent.
This paper applies the official poverty lines to the income meaure in the 2002
8/8/2019 Scoring Poverty Philippines 2002
http://slidepdf.com/reader/full/scoring-poverty-philippines-2002 4/68
The rural poverty rate in APIS was 46.4 percent, while urban was 17.3 percent.
This paper presents a single scorecard for use anywhere in the Philippines, as evidence
from India and Mexico (Schreiner, 2006 and 2005a) suggests that there are only small
returns to segmenting scorecards by rural and urban.
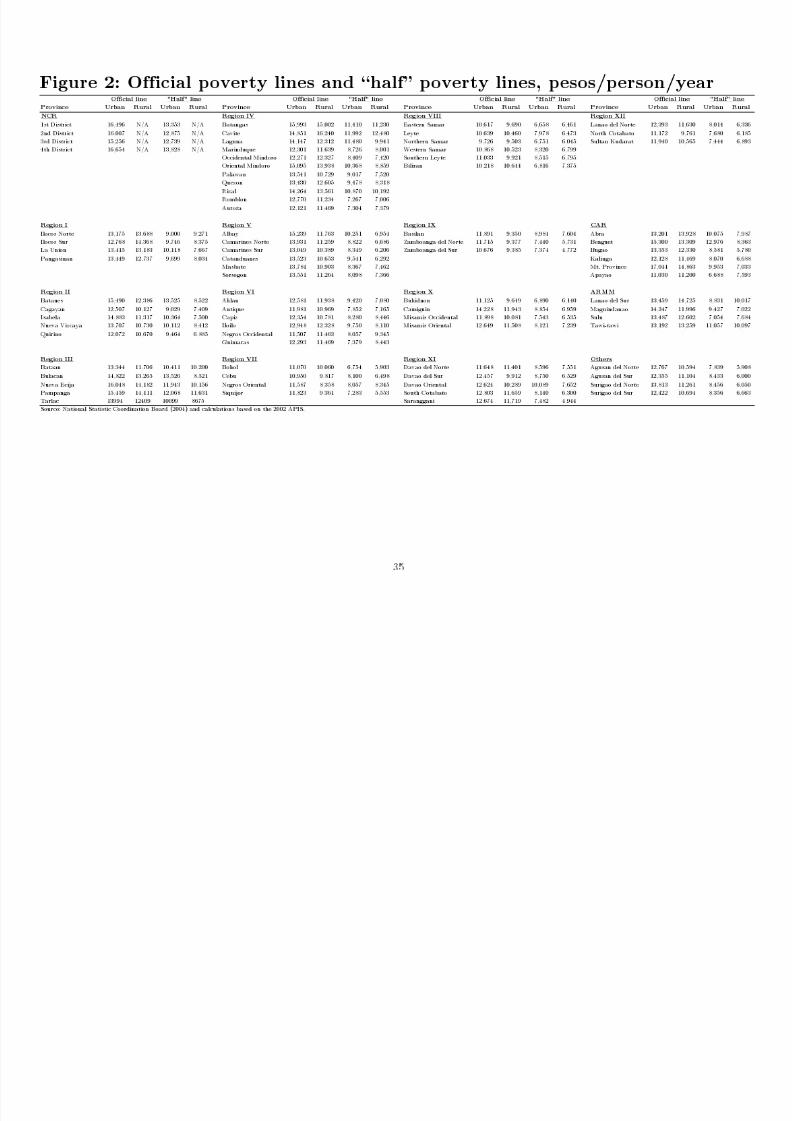
Figure 2 shows the official poverty lines by urban/rural for each province. It also
shows the “half lines” that demarcate the very poor, that is, the poorest half of the poor.
The second-to-last section of the paper looks at poverty by the $4/day-or-less standard.
3. Scorecard construction
About 500 potential poverty indicators were prepared, including:
• Household and housing characteristics (such as cooking fuel and type of floor)
• Individual characteristics (such as age and highest grade completed)
• Household consumption (such as spending on non-alcoholic drinks)
• Household durable goods (such as electric fans and telephones)
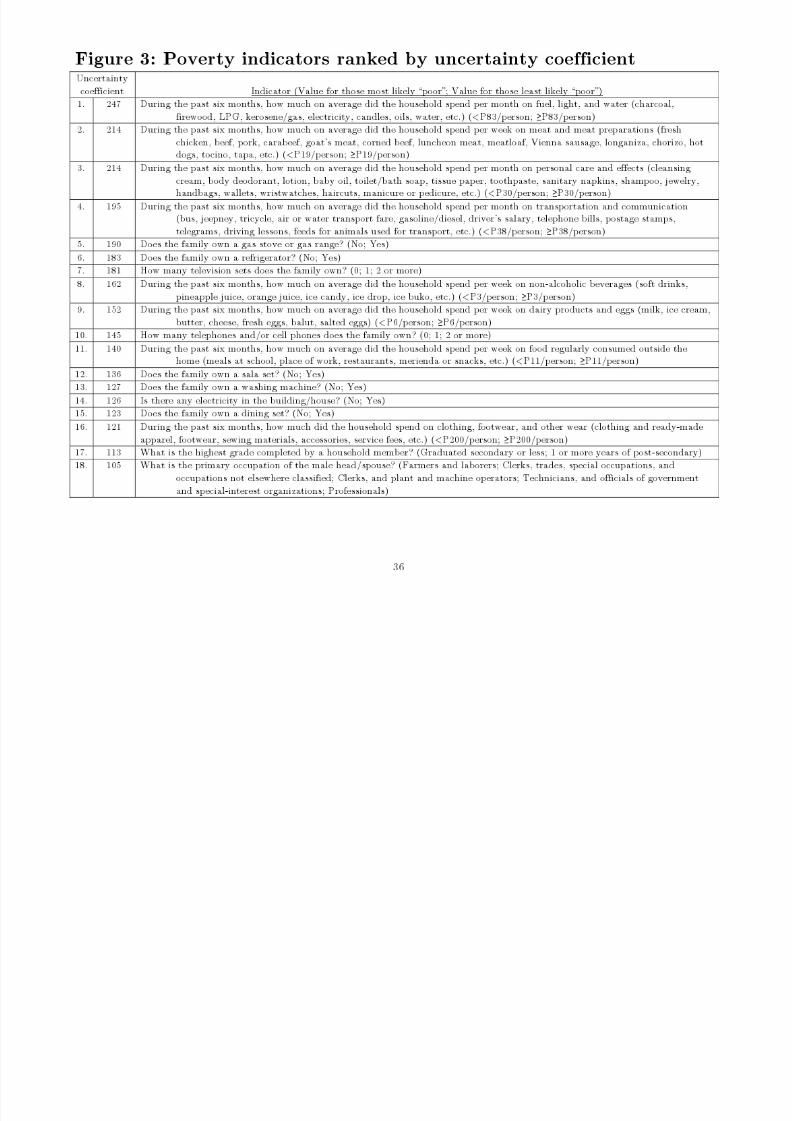
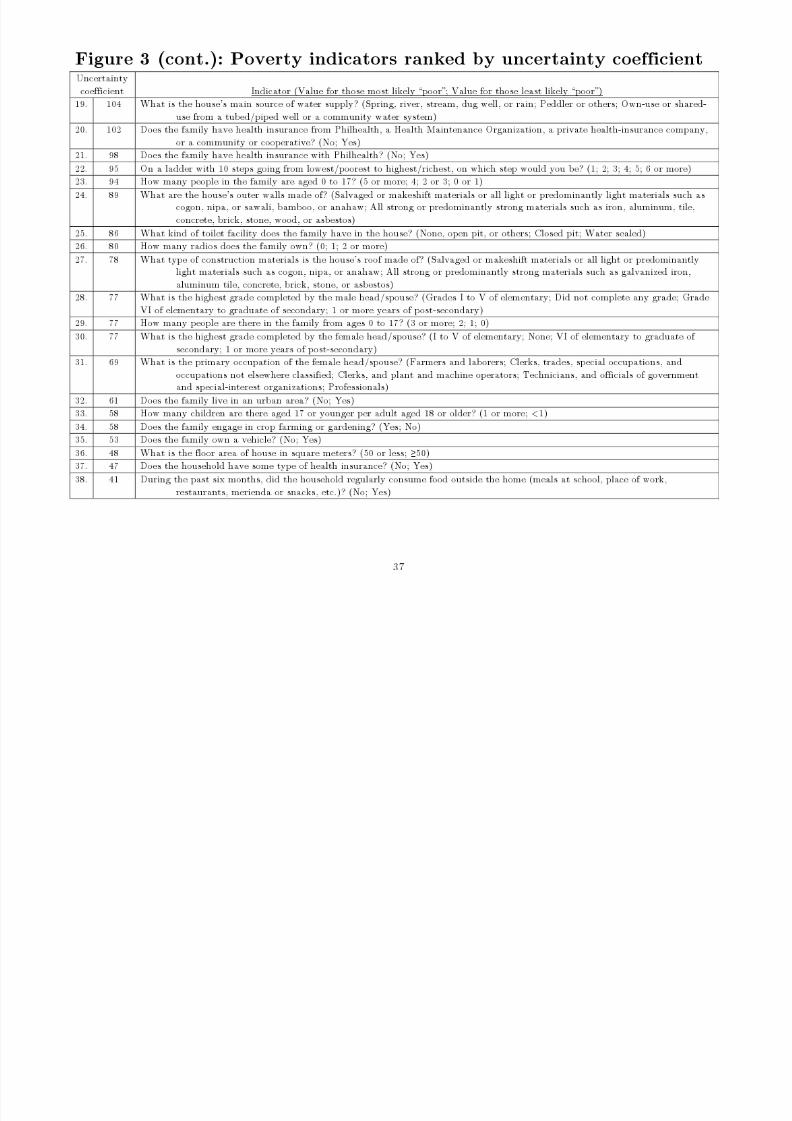
Each indicator’s ability to predict poverty was tested first with the entropy-
based “uncertainty coefficient” (Goodman and Kruskal, 1979). This resembles a
correlation coefficient, but it is applied to categorical indicators (such as “type of floor”)
rather than continuous ones (such as “square meters of floor space”) About 120

8/8/2019 Scoring Poverty Philippines 2002
http://slidepdf.com/reader/full/scoring-poverty-philippines-2002 5/68
Many indicators in Figure 3 are similar in terms of their link with poverty. For
example, most households who have a television also have electricity. If a scorecard
already includes “has a television”, then “has electricity” is superfluous. Thus, many
indicators strongly linked with poverty are not in the scorecard because similar
indicators are already included.
The scorecard also aims to measure changes in poverty through time. Thus, some
powerful indicators (such as education of the female head/spouse) that are unlikely to
change as poverty changes were omitted in favor of slightly less-powerful indicators
(such as the number of radios) that are more likely to change. All the indicators of
consumption (such as “In the past six months, how much on average per week did the
household spend on dairy products and eggs”) were not selected because they cannot be
directly observed nor verified.
The scorecard itself was constructed using Logit regression. Indicator selection
combined statistics with the judgment of an analyst with expertise in scoring and
development. Starting with a scorecard with no indicators, each candidate indicator was
added, one-by-one, to a one-indicator scorecard, using Logit to derive weights. The
improvement in accuracy for each indicator was recorded using the “c” statistic.1
8/8/2019 Scoring Poverty Philippines 2002
http://slidepdf.com/reader/full/scoring-poverty-philippines-2002 6/68
After all indicators had been tested, one was selected based on several factors
(Schreiner et al ., 2004; Zeller, 2004). These included the improvement in accuracy, the
likelihood of acceptance by users (determined by simplicity, cost of collection, and “face
validity” in terms of experience, theory, and common sense), the ability of the indicator
to change values as poverty status changes over time, variety vis-à-vis other indicators
already in the scorecard, and ease of observation/verification.
The selected indicator was then added to the scorecard, and the previous steps
were repeated until 10 indicators were selected. Finally, the Logit coefficients were
transformed into non-negative integers such that the lowest possible score is 0 (most
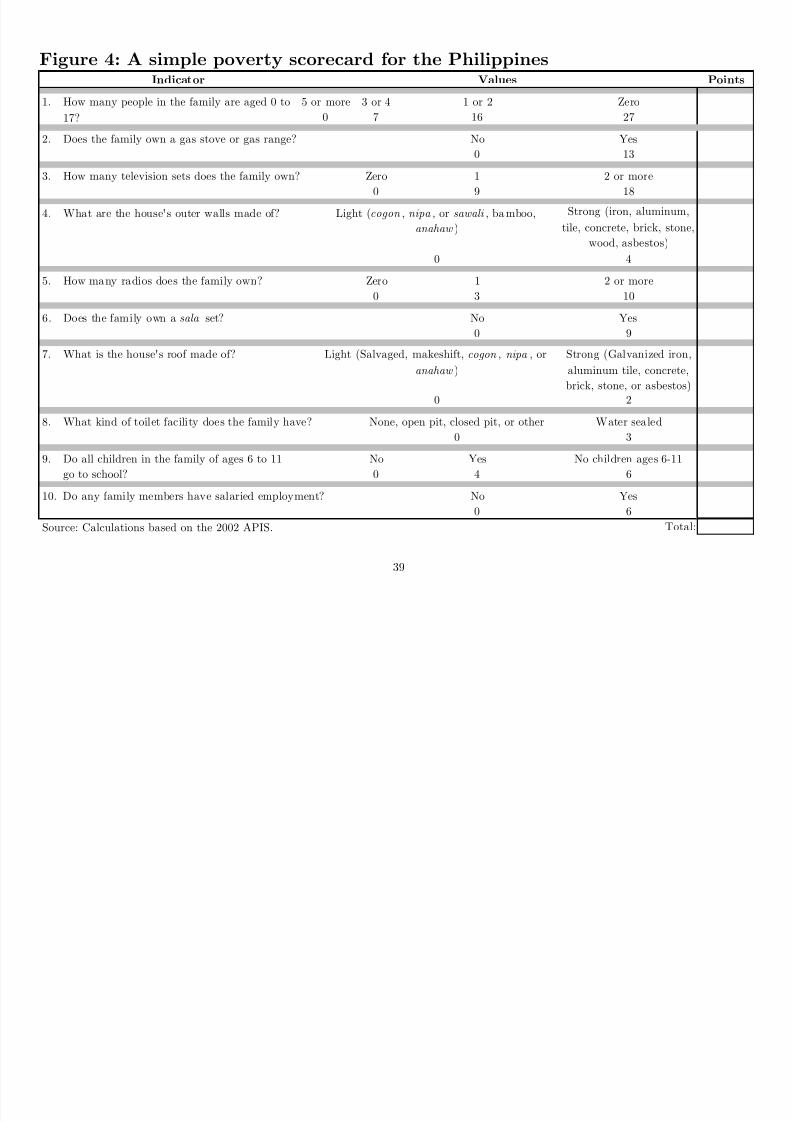
likely poor) and the highest is 100. The final poverty scorecard appears in Figure 4.
This statistical algorithm is the Logit analogue to the stepwise “MAXR” in, for
example, Zeller, Alcaraz and Johannsen (2005) and IRIS (2005a and 2005b). The
procedure here diverges from naïve stepwise in that expert judgment and non-statistical
criteria were used to select from among the most-predictive indicators. This improves
robustness and, more importantly, helps ensure that the indicators are simple and
sensible, increasing the likelihood of acceptance by users.
8/8/2019 Scoring Poverty Philippines 2002
http://slidepdf.com/reader/full/scoring-poverty-philippines-2002 7/68
4. Scorecard use
As explained in Schreiner (2005b), the central challenge is not to maximize
accuracy but rather to maximize the likelihood of programs’ using scoring
appropriately. When scoring projects fail, the culprit is usually not inaccuracy but
rather the failure of users to accept scoring and to use it properly (Schreiner, 2002). The
challenge is not technical but human and organizational, not statistics but change
management. “Accuracy” is easier—and less important—than “practicality”.
The scorecard here was designed to help users to understand and trust it (and
thus use it properly). While accuracy matters, it must be balanced against simplicity,
ease-of-use, and “face validity”. In particular, programs are more likely to collect data,
compute scores, and pay attention to the results if, in their view, scoring avoids creating
“extra” work and if the whole process generally seems to make sense.
This practical focus naturally leads to a one-page scorecard (Figure 4) that
allows field workers to score households by hand in real time because it features:
• Only 10 indicators
• Only observable, categorical indicators (“flooring material”, not “value of house”)
• User-friendly weights (non-negative integers, no arithmetic beyond simple addition)
Among other things this simplicity enables “rapid targeting” such as

8/8/2019 Scoring Poverty Philippines 2002
http://slidepdf.com/reader/full/scoring-poverty-philippines-2002 8/68
The scorecard in Figure 4 can be photocopied for immediate use. It can also
serve as a template for data-entry screens with database software that records
indicators, indicator values, scores, and poverty likelihoods.
A field agent collecting data and computing scores on paper would:
• Read each question off the scorecard
• Circle the response and the corresponding points
• Write the points in the far-right column
• Add up the points to get the total score
• Implement program policy based on the score
4.1 Scores and poverty likelihoods
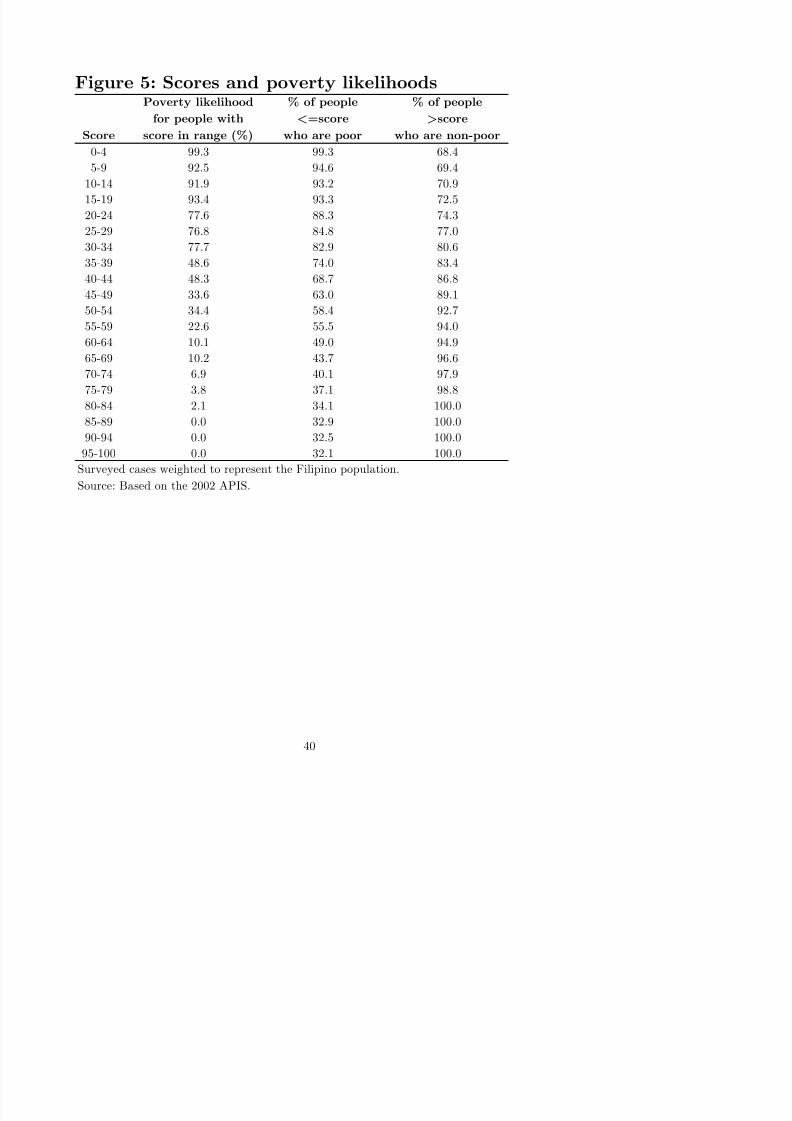
A score is not a poverty likelihood (that is, the probability of being poor), but
each score is associated with an estimated poverty likelihood via a simple table (Figure
5). For example, scores of 25–29 correspond to a poverty likelihood of 76.8 percent.
8/8/2019 Scoring Poverty Philippines 2002
http://slidepdf.com/reader/full/scoring-poverty-philippines-2002 9/68
Scores (sums of weights) are associated with estimated poverty likelihoods
(probabilities of being poor) via the “bootstrap” (Efron and Tibshirani, 1993):
• From the first one-fourth hold-out sample, draw a new sample of the same size with
replacement
• For people in a given score range, compute the share who are poor
• Repeat the previous two steps 10,000 times
• For a given score range, define the poverty likelihood as the average of the shares of
people who are poor in that score range across the 10,000 samples
These resulting poverty likelihoods are objective, that is, based on data. This
process would produce objective poverty likelihoods even if the scorecards themselves
were constructed without data . In fact, scorecards of objective, proven accuracy are
often constructed only with qualitative judgment (Fuller, 2006; Caire, 2004; Schreiner et
al ., 2004). Of course, the scorecard here uses data. While its construction—like any
statistical analysis—was partially informed by the analyst’s judgment, the explicit
acknowledgment of this fact is irrelevant for the objectivity of the poverty likelihoods.
After all, objectively depends on using data to associate scores with poverty likelihoods,
not on pretending to avoid the use of judgment during scorecard construction.
Figure 6 depicts the precision of estimated poverty likelihoods as point estimates
8/8/2019 Scoring Poverty Philippines 2002
http://slidepdf.com/reader/full/scoring-poverty-philippines-2002 10/68
score, the lower (upper) bound on the x -percent confidence interval is the value less
(greater) than (100–x )/2 percent ((100+x )/2 percent) of the bootstrapped likelihoods.
For example, the average poverty rate across bootstrap samples for people with
scores of 25–29 is 76.8 percent (this is the poverty likelihood in Figure 5). In 90 percent
of samples, the poverty rate is between 73.1–80.4 percent (Figure 6). In 95 percent of
samples, the share is 72.4–81.0; in 99 percent of samples, the share is 70.8–82.3.
For estimated and true poverty likelihoods, Figure 7 depicts mean absolute
differences and confidence intervals from bootstrapping the second one-fourth hold-out
sample from the 2002 APIS. The mean absolute difference is 3.6 percentage points.
This discussion so far looks at whether estimated poverty likelihoods are close to
true poverty likelihoods (and indeed they are). There is another aspect of accuracy, one
associated with targeting: how well the poor are concentrated in low scores. A perfect
scorecard would assign all the lowest scores to poor people (and all the highest scores to
non-poor people). In reality, no scorecard is perfect, so some poor people have high
scores, and vice versa.
ROC curves are standard tools for showing how well the poor are concentrated
in lower scores (Baulch, 2003; Wodon, 1997). They plot the share of poor and non-poor
households against the share of all households ranked by score.
8/8/2019 Scoring Poverty Philippines 2002
http://slidepdf.com/reader/full/scoring-poverty-philippines-2002 11/68
ability to rank-order—with less leakage and less undercoverage—is shown by curves
that are closer to the northwest and southeast corners of the graph.
In Figure 8, the northwest (southeast) curve depicts accuracy among the poor
(non-poor). As a benchmark, the external trapezoid shows the accuracy of a
hypothetical perfect scorecard that assigns all of the lowest scores to poor people. The
diagonal line represents random targeting.
The curves for the scorecard show, for example, that targeting the 20 percent of
households with the lowest scores would target 51 percent of all the poor and 6 percent
of all the non-poor. In contrast, randomly targeting 20 percent of cases would target 20
percent of the poor and 20 percent of the non-poor.
Figure 8 also reports two other common measures of rank-ordering. The first is
the Kolmogorov-Smirnov (KS) statistic, defined as the maximum distance between the
poor and non-poor curves (here 59.2). Higher KS implies better rank-ordering.
The second measure is the ratio of the area inside the ROC curves to the area
inside the trapezoid of a hypothetical perfect scorecard (here 75.5). Again, greater area
within the curves implies better rank-ordering.
Is this scorecard accurate enough for targeting? Errors due to scorecard
inaccuracy are probably small relative to errors due to other sources (such as mistakes
8/8/2019 Scoring Poverty Philippines 2002
http://slidepdf.com/reader/full/scoring-poverty-philippines-2002 12/68
4.2 Estimates of overall poverty rates
The estimated overall poverty rate is the average of the estimated poverty
likelihoods of individuals.
For example, suppose a program has 3,000 participants on Jan. 1, 2006 and that
1,000 have scores of 20, 1,000 have scores of 30, and 1,000 have scores of 40. The
poverty likelihoods that correspond to these scores are 77.6, 77.7 and 48.3 percent
(Figure 5). The overall poverty rate is the participants’ average poverty likelihood, that
is, 1,000 x (77.6 + 77.7 + 48.3) ÷ 3,000 = 67.9 percent.
To test accuracy and precision, the scorecard was applied to 10,000 bootstrap
replicates from the second one-fourth hold-out sample, comparing the estimated overall
poverty rates with the true values. The mean difference was 0.1 percentage points, with
a standard deviation of 0.37. The 90-percent confidence interval around the mean was
+/–0.6 percentage points, the 95-percent interval was +/–0.7 percentage points, and
the 99-percent interval was +/–1.0 percentage points. The estimated overall poverty
rate is thus unbiased and highly precise.
4.3 Progress out of poverty over time
For a given group, progress out of poverty over time is estimated as the change
8/8/2019 Scoring Poverty Philippines 2002
http://slidepdf.com/reader/full/scoring-poverty-philippines-2002 13/68
scores of 20, 25, 30, 35, 40, and 45 (by Figure 5, poverty likelihoods of 77.6, 76.8, 77.7,
48.6, 48.3, and 33.6 percent). Their average poverty likelihood is now 60.4 percent, an
improvement of 67.9 – 60.4 = 7.5 percentage points. In other words, 7.5 of every 100 in
this group left poverty. Among those who were poor to start with, one in nine (7.5 ÷
67.9 = 11.1 percent) left poverty.
Of course, the scorecard does not indicate what caused progress; it just measures
the change, regardless of cause.
5. Setting targeting cut-offs
How would the poverty scorecard be used for targeting? Potential participants
with scores at or below a targeting cut-off are labeled targeted and treated—for
program purposes—as if they were poor. Those with higher scores are non-targeted and
treated—again, for program purposes—as if they were non-poor.
Poverty status (expenditure below a poverty line) is distinct from targeting status
(score below a cut-off). Poverty status is a fact whose determination requires an
expensive survey. In contrast, targeting status is a policy choice whose determination
requires a cut-off and an inexpensive estimate of poverty likelihood. Indeed, the purpose
of scoring is to infer poverty status without incurring the cost of direct measurement.
8/8/2019 Scoring Poverty Philippines 2002
http://slidepdf.com/reader/full/scoring-poverty-philippines-2002 14/68
cut-offs and how it balances accuracy for the poor versus non-poor. The standard
approach uses a classification matrix and a net-benefit matrix (SPSS, 2003; Adams and
Hand, 2000; Salford Systems, 2000; Hoadley and Oliver, 1998; Greene, 1993).
5.1 Classification matrix
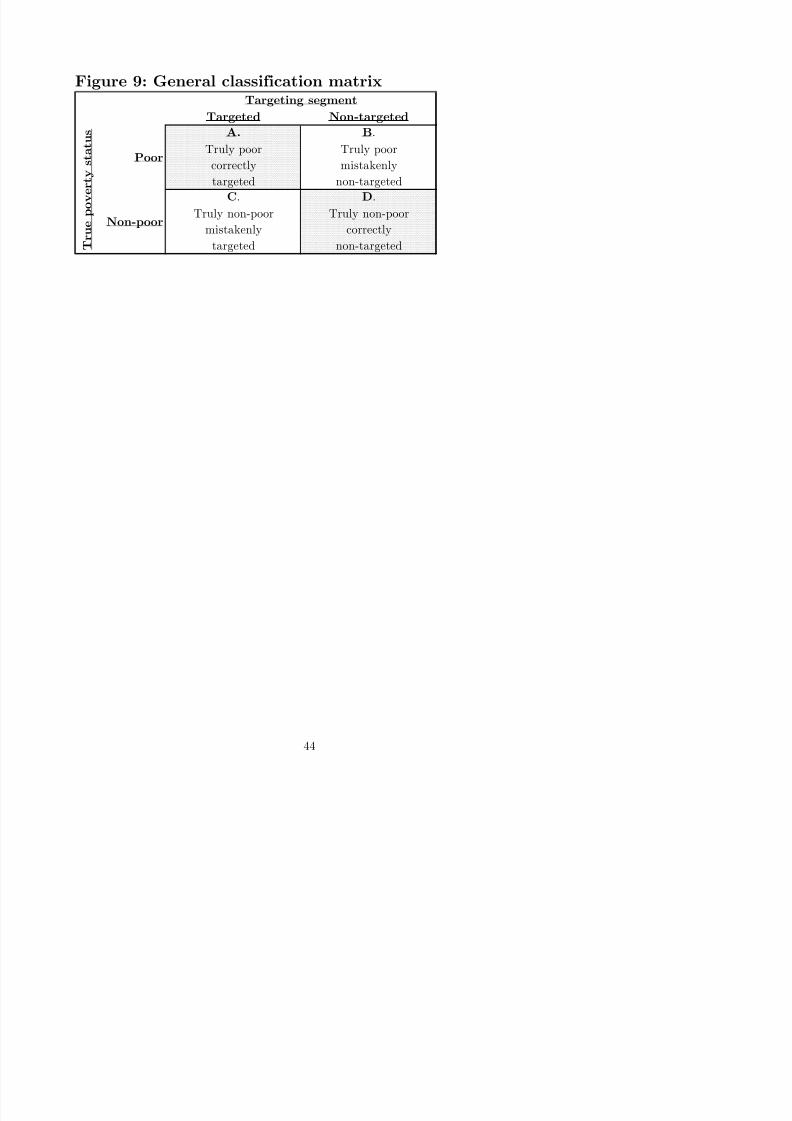
Given a targeting cut-off, there are four possible classification results:
A. Truly poor correctly targeted (score at or below the cut-off)
B. Truly poor mistakenly non-targeted (score above cut-off)
C. Truly non-poor mistakenly targeted (score at or below cut-off)
D. Truly non-poor correctly non-targeted (score above cut-off)
These four possibilities can be shown as a general classification matrix (Figure
9). Accuracy improves as there are more cases in A and D and fewer in B and C.
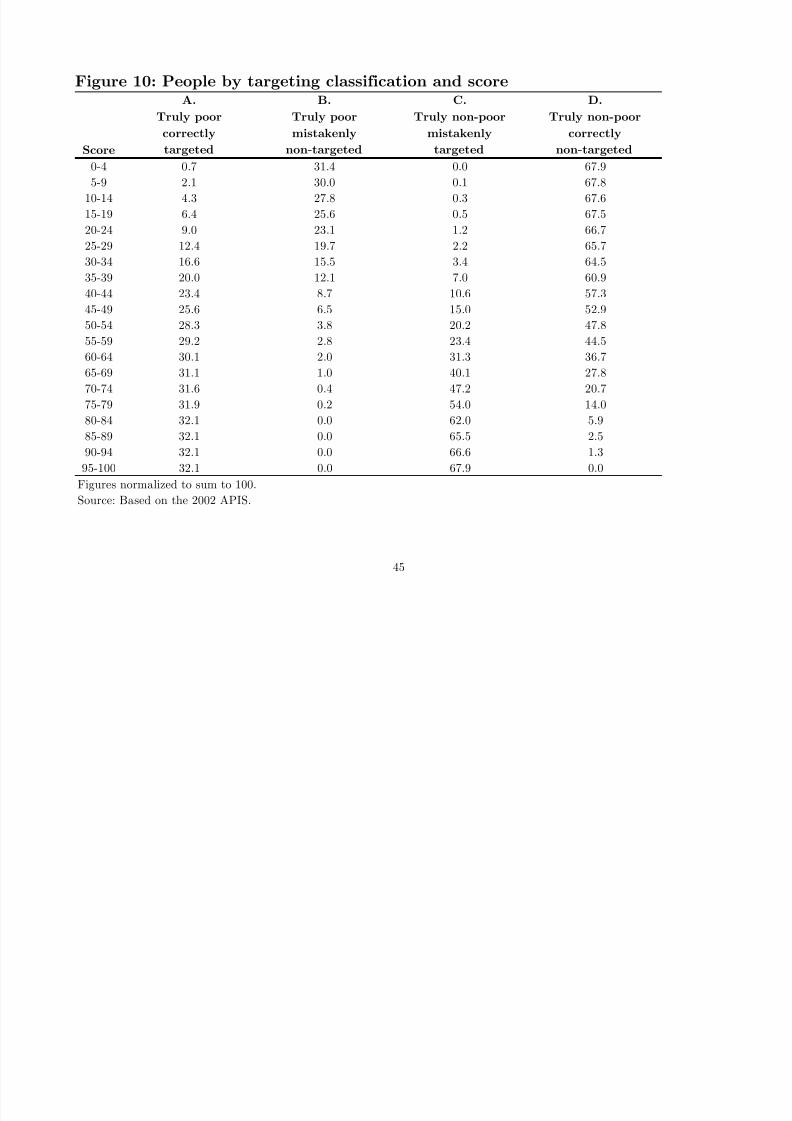
Figure 10 shows the number of people in each classification by score in the
second one-fourth hold-out sample. For example, with a cut-off of 25–29, there are:
A. 12.4 truly poor correctly targeted
B. 19.7 truly poor mistakenly non-targeted
C. 2.2 truly non-poor mistakenly targeted
D. 65.7 truly non-poor correctly non-targeted
8/8/2019 Scoring Poverty Philippines 2002
http://slidepdf.com/reader/full/scoring-poverty-philippines-2002 15/68
Targeting accuracy (and errors of undercoverage and leakage) depends on the
cut-off. For example, if the cut-off were increased to 39–34, more poor (but less non-
poor) are correctly targeted:
A. 16.6 truly poor correctly targeted
B. 15.5 truly poor mistakenly non-targeted
C. 3.4 truly non-poor mistakenly targeted
D. 64.5 truly non-poor correctly non-targeted
Whether a cut-off of 40–44 is preferred to 45–49 depends on net benefit.
5.2 Net-benefit matrix
Each of the four classification results is associated with a net benefit (Figure 11):
α. Benefit per truly poor person correctly targeted
β. Cost (negative net benefit) per truly poor person mistakenly non-targeted
γ. Cost (negative net benefit) per truly non-poor person mistakenly targeted
δ. Benefit per truly non-poor person correctly non-targeted
Each net benefit α, β, γ, and δ corresponds to one of the quadrants in the general
classification matrix in Figure 9. For example, α is the net benefit associated with each
truly poor person who is correctly targeted (quadrant A), and β is the cost (negative net
8/8/2019 Scoring Poverty Philippines 2002
http://slidepdf.com/reader/full/scoring-poverty-philippines-2002 16/68
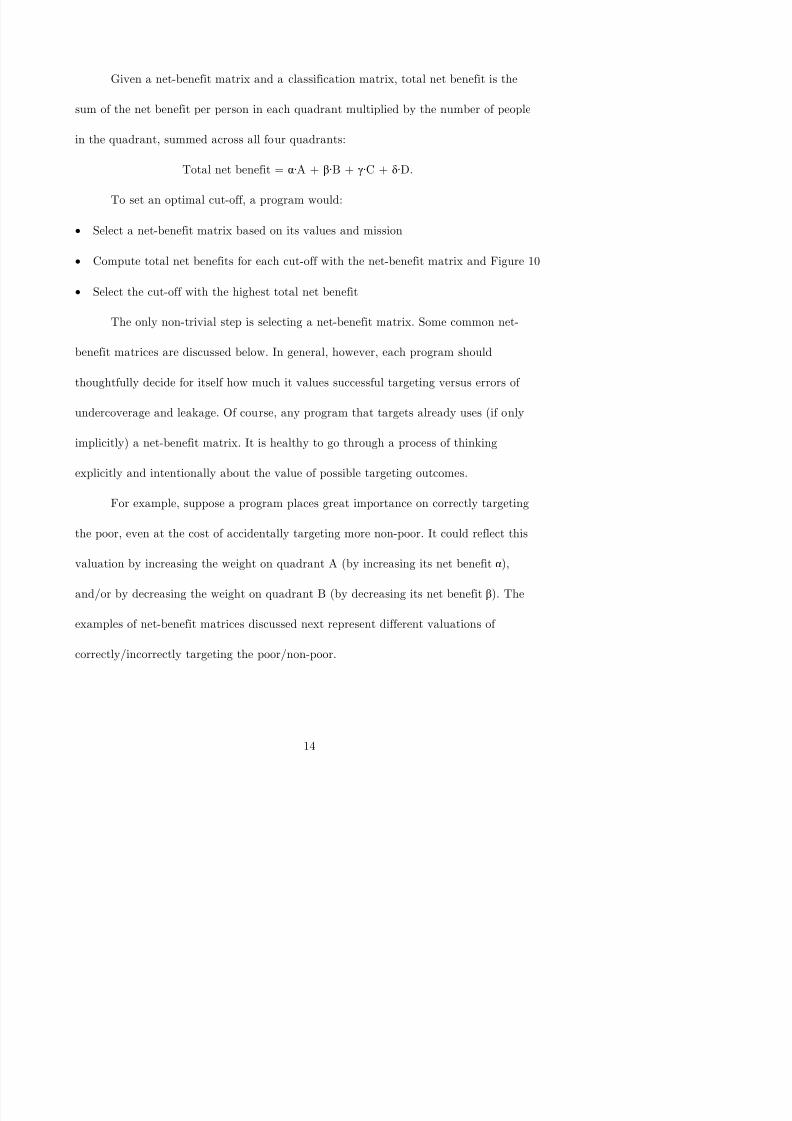
Given a net-benefit matrix and a classification matrix, total net benefit is the
sum of the net benefit per person in each quadrant multiplied by the number of people
in the quadrant, summed across all four quadrants:
Total net benefit = α·A + β·B + γ·C + δ·D.
To set an optimal cut-off, a program would:
• Select a net-benefit matrix based on its values and mission
• Compute total net benefits for each cut-off with the net-benefit matrix and Figure 10
• Select the cut-off with the highest total net benefit
The only non-trivial step is selecting a net-benefit matrix. Some common net-
benefit matrices are discussed below. In general, however, each program should
thoughtfully decide for itself how much it values successful targeting versus errors of
undercoverage and leakage. Of course, any program that targets already uses (if only
implicitly) a net-benefit matrix. It is healthy to go through a process of thinking
explicitly and intentionally about the value of possible targeting outcomes.
For example, suppose a program places great importance on correctly targeting
the poor, even at the cost of accidentally targeting more non-poor. It could reflect this
valuation by increasing the weight on quadrant A (by increasing its net benefit α),
and/or by decreasing the weight on quadrant B (by decreasing its net benefit β). The
8/8/2019 Scoring Poverty Philippines 2002
http://slidepdf.com/reader/full/scoring-poverty-philippines-2002 17/68
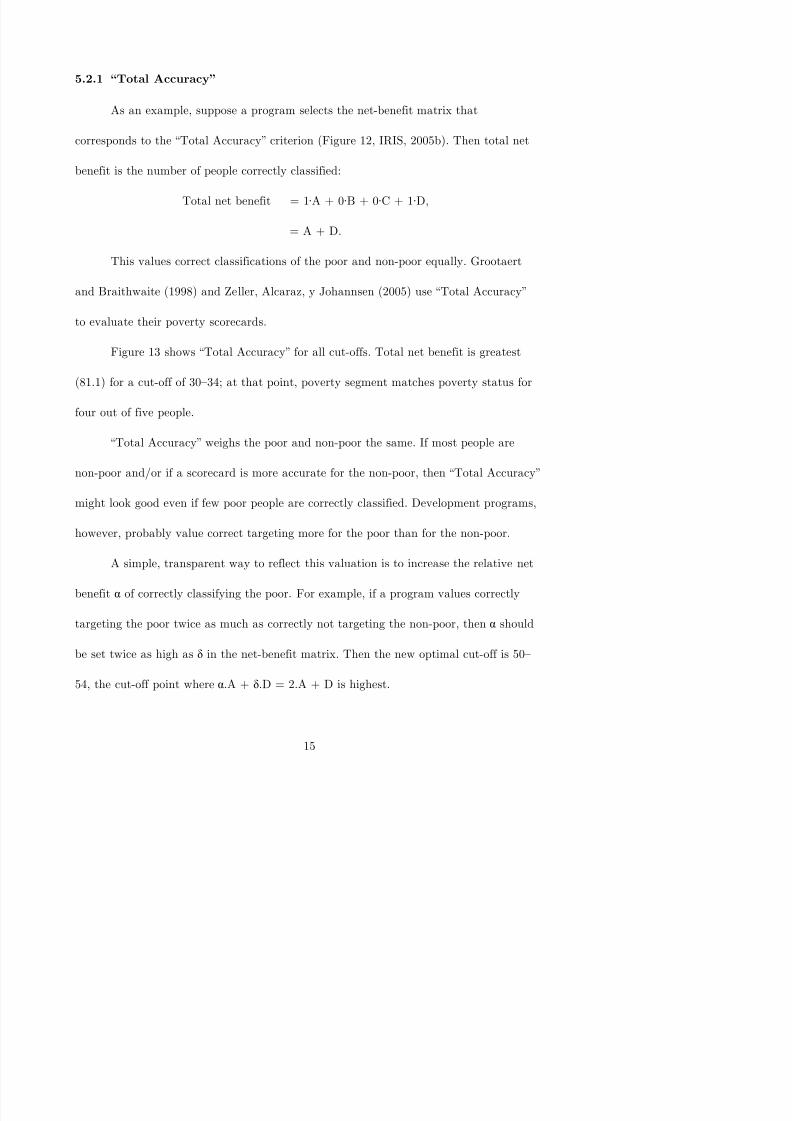
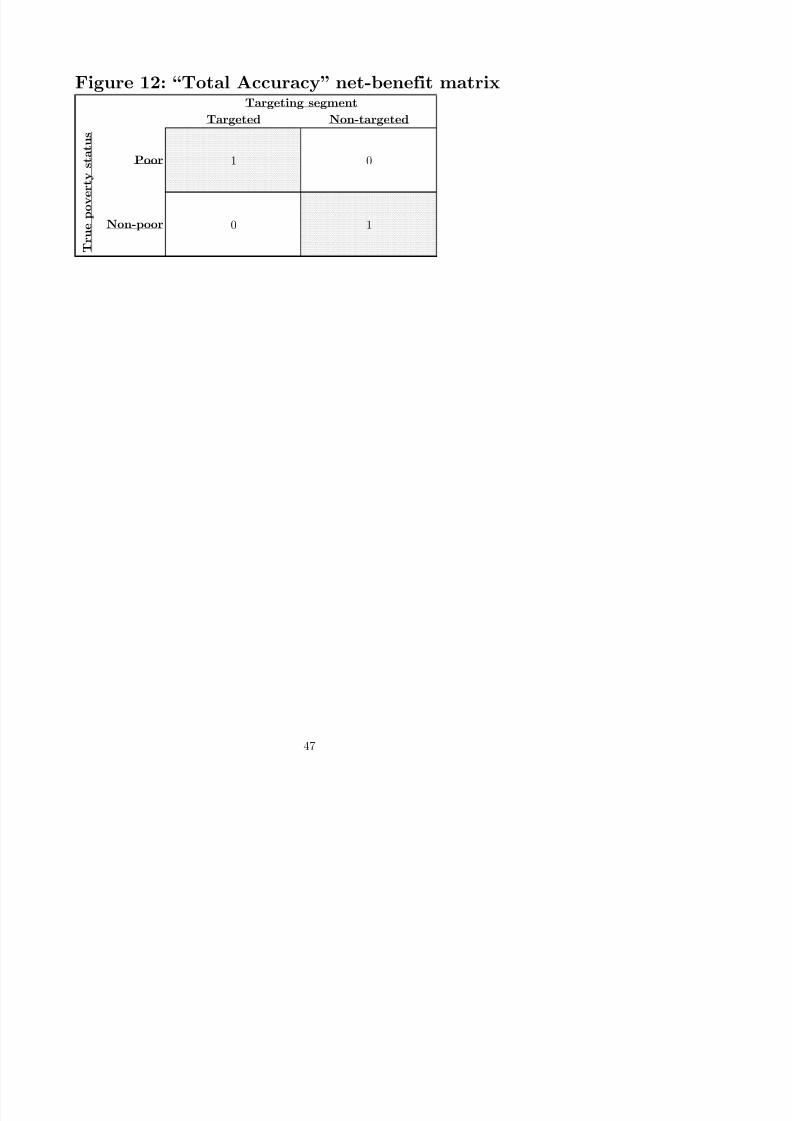
5.2.1 “Total Accuracy”
As an example, suppose a program selects the net-benefit matrix that
corresponds to the “Total Accuracy” criterion (Figure 12, IRIS, 2005b). Then total net
benefit is the number of people correctly classified:
Total net benefit = 1·A + 0·B + 0·C + 1·D,
= A + D.
This values correct classifications of the poor and non-poor equally. Grootaert
and Braithwaite (1998) and Zeller, Alcaraz, y Johannsen (2005) use “Total Accuracy”
to evaluate their poverty scorecards.
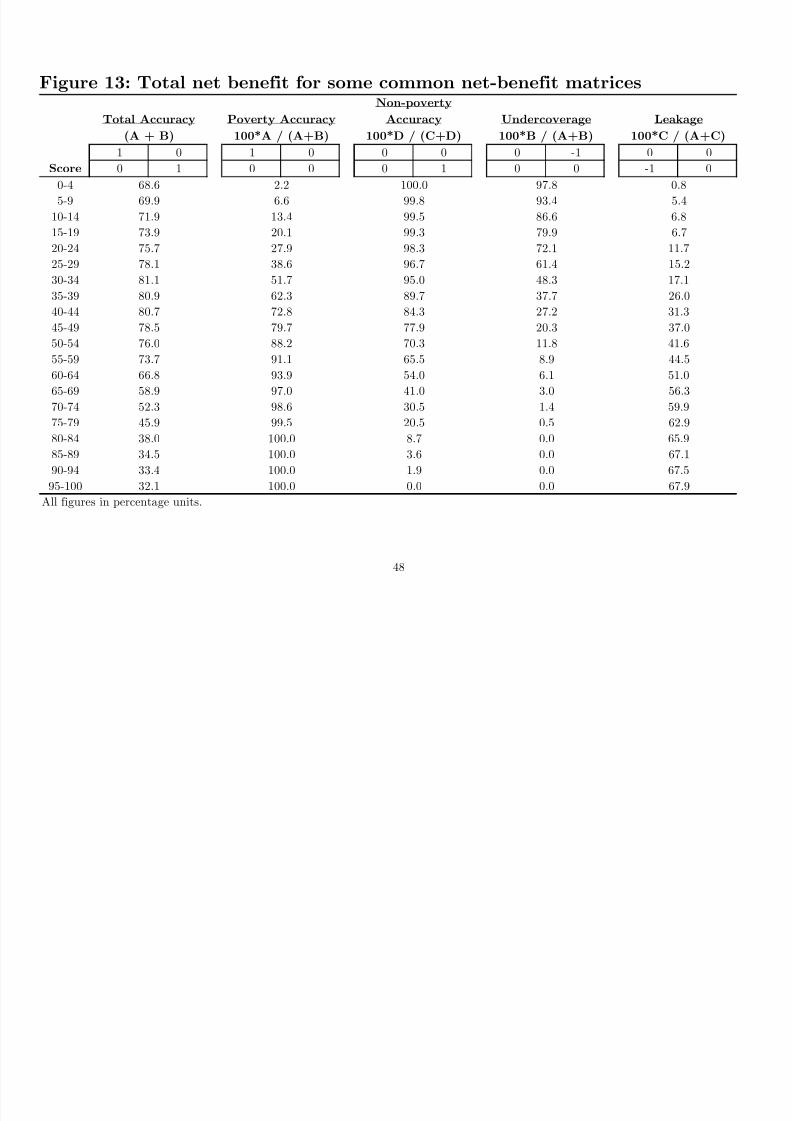
Figure 13 shows “Total Accuracy” for all cut-offs. Total net benefit is greatest
(81.1) for a cut-off of 30–34; at that point, poverty segment matches poverty status for
four out of five people.
“Total Accuracy” weighs the poor and non-poor the same. If most people are
non-poor and/or if a scorecard is more accurate for the non-poor, then “Total Accuracy”
might look good even if few poor people are correctly classified. Development programs,
however, probably value correct targeting more for the poor than for the non-poor.
A simple, transparent way to reflect this valuation is to increase the relative net
benefit α of correctly classifying the poor. For example, if a program values correctly

8/8/2019 Scoring Poverty Philippines 2002
http://slidepdf.com/reader/full/scoring-poverty-philippines-2002 18/68
5.2.2 “Poverty Accuracy”
A criterion that values only correctly classifying the poor is “Poverty Accuracy”
(Figure 14, IRIS, 2005b):
Total net benefit = 1·A + 0·B + 0·C + 0·D,
= A.
Of course, correctly targeting the poor is rarely the sole criteria. In fact, Figure
13 shows that “Poverty Accuracy” is greatest with a cut-off of 95–100. While targeting
everyone does ensure that all poor people are targeted and so minimizes undercoverage
of the poor (second-to-last column of Figure 13), it also targets all the non-poor and so
maximizes leakage (the last column of Figure 13).
5.2.3 “Non-poverty Accuracy”
“Non-poverty Accuracy” counts only correct classifications of the non-poor (total
net benefit is D). This is maximized by setting a cut-off of 0–4 and thus not targeting
anyone (minimum leakage but maximum undercoverage).
5.2.4 “BPAC”
IRIS (2005b) proposes a new measure of accuracy called the “Balanced Poverty
Accuracy Criterion”. BPAC balances two goals:
• Accuracy of the estimated overall poverty rate

8/8/2019 Scoring Poverty Philippines 2002
http://slidepdf.com/reader/full/scoring-poverty-philippines-2002 19/68
then BPAC’s net-benefit matrix is Figure 15. In essence, BPAC maximizes A while
making B and C as close to each other as possible:
Total net benefit = 1·A + 1·B + (– 1)·C + 0·D,
= A + (B – C).
If C > B, then total net benefit under BPAC is A + (C – B).
BPAC was invented because IRIS does not estimate poverty likelihoods. Instead,
IRIS estimates expenditure and then labels as poor those households with estimated
expenditure less than the poverty line. In this set-up, the overall poverty rate is
estimated as the share of people targeted, and this estimate is most accurate (that is,
closest to the true value) when undercoverage B equals leakage C.
For a scorecard (like the one here) that estimates poverty likelihoods, however,
BPAC is not meaningful. This is because the estimated overall poverty rate is the
average of participants’ estimated poverty likelihoods. These estimates are independent
of whatever targeting cut-off a program might set. In contrast, the targeting errors of
undercoverage B and leakage C depend directly on the cut-off. Thus, for scorecards that
estimate poverty likelihoods, getting B close to C is not related to optimizing the
accuracy of the estimated overall poverty rate and so is not related to BPAC’s goals.
8/8/2019 Scoring Poverty Philippines 2002
http://slidepdf.com/reader/full/scoring-poverty-philippines-2002 20/68
6. Training, quality-control, and MIS
The technical aspects of scorecard construction and accuracy just discussed are
important, but gaining the trust and acceptance of managers and field workers is even
more important (Schreiner, 2002).
In particular, the field workers who collect indicators must be trained. If they put
garbage in, the scorecard will put garbage out. To prevent abuse, on-going quality
control of data is required.
Programs should record in their MIS at least the poverty likelihood along with
an identifier for each client. Ideally, they would also record the score, the indicators,
and the values of the indicators. This will allow quick computation of average poverty
likelihoods (as well as other analyses), both for a point in time and for changes through
time (Matul and Kline, 2003).
7. Calibrating the scorecard for the very poor
The simple poverty scorecard in Figure 4 can be used to track outreach not only
to the poor but also to the very poor , that is, the poorest half of the poor below the
national poverty line. This is the relevant group for USAID certification.
8/8/2019 Scoring Poverty Philippines 2002
http://slidepdf.com/reader/full/scoring-poverty-philippines-2002 21/68
7.1 Poverty likelihoods
As before, scores are associated with the probability of being very poor by
bootstrapping 10,000 samples from first one-fourth hold-out sample from the 2002
APIS. The poverty likelihood for a given score is then taken as the average of the
shares of people with that score who are very poor across the 10,000 samples.
Columns 2–4 in Figure 16 are the poverty likelihoods for the three classes for all
scores. For example, if a potential participant has a score of 25–29, the probability of
being very poor is 42.2 percent, the probability of being poor is 34.4 percent, and the
probability of being non-poor is 23.2 percent.
Columns 5–7 in Figure 16 are the share of targeted participants by poverty
status and by cut-off. For example, for a cut-off of 25–92, 58.3 percent of those targeted
would be very poor, 26.4 percent would be poor, and 15.2 percent would be non-poor.
Each person is associated with three poverty likelihoods. For example, a person
with a score of 25 may be targeted as very poor, but the likelihood of truly being very
poor is not 100 percent but rather 42.4 percent (from Figure 16). The same person has a
34.4-percent likelihood of being truly poor, and a 23.2-percent likelihood of being truly
non-poor. Each person has one targeting status (for program purposes), one true
poverty status (in reality), and three estimated poverty likelihoods (one for each
8/8/2019 Scoring Poverty Philippines 2002
http://slidepdf.com/reader/full/scoring-poverty-philippines-2002 22/68
likelihood of being very poor. It works because the likelihood of being very poor is
highly correlated with having a low score (high likelihood of being poor). A scorecard
could be built specifically for the very poor, but it would add cost and complexity.
Figure 17 shows the precision of estimated poverty likelihoods for being very
poor as point estimates with 90-, 95-, and 99-percent confidence intervals. For example,
the average poverty rate (the poverty likelihood) across bootstrap samples for people
with scores of 25–29 was 42.4 percent. In 90 percent of 10,000 bootstraps from the
second one-fourth hold-out sample, the share was between 38.2–46.7 percent. In 95
percent of samples, the share was between 37.3–47.7, and in 99 percent of samples, the
share was between 35.9–49.3.
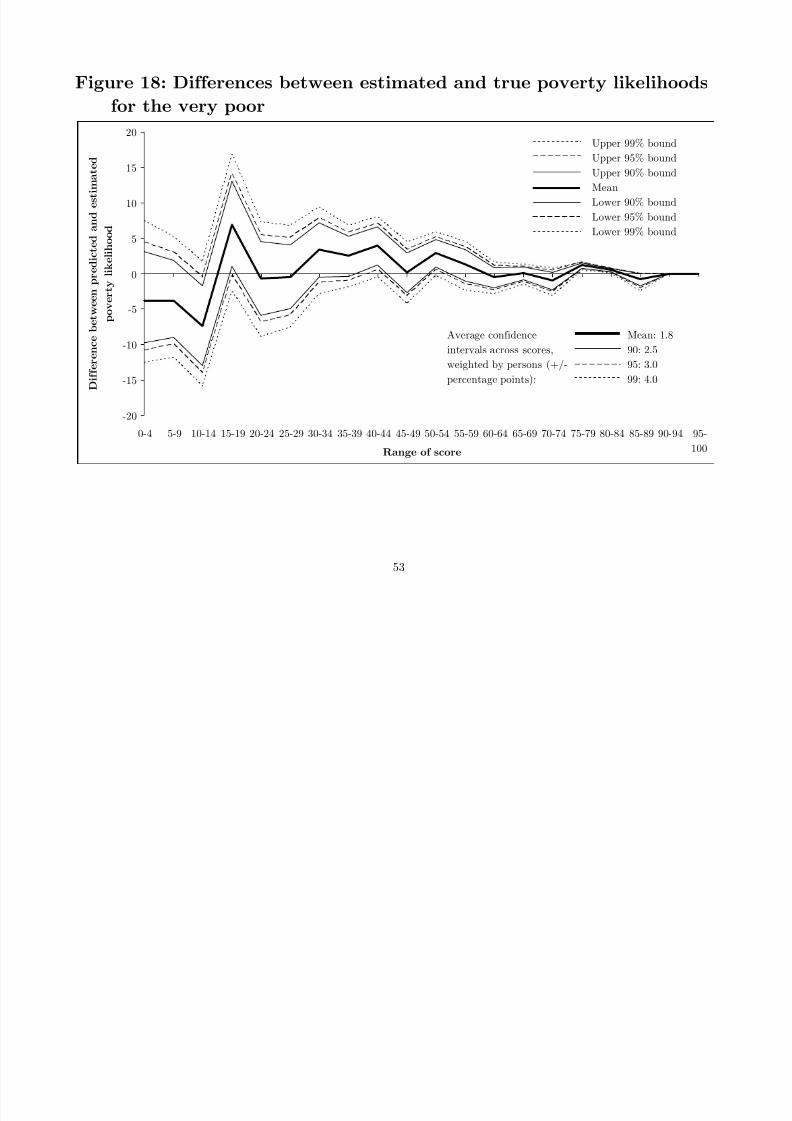
For estimated and true poverty likelihoods, Figure 18 depicts mean absolute
differences and confidence intervals from 10,000 bootstraps on the second one-fourth
hold-out sample. Weighting by the people in a score range, the mean absolute difference
is 1.8 percentage points, with a 90-percent interval of +/–2.5 percentage points.
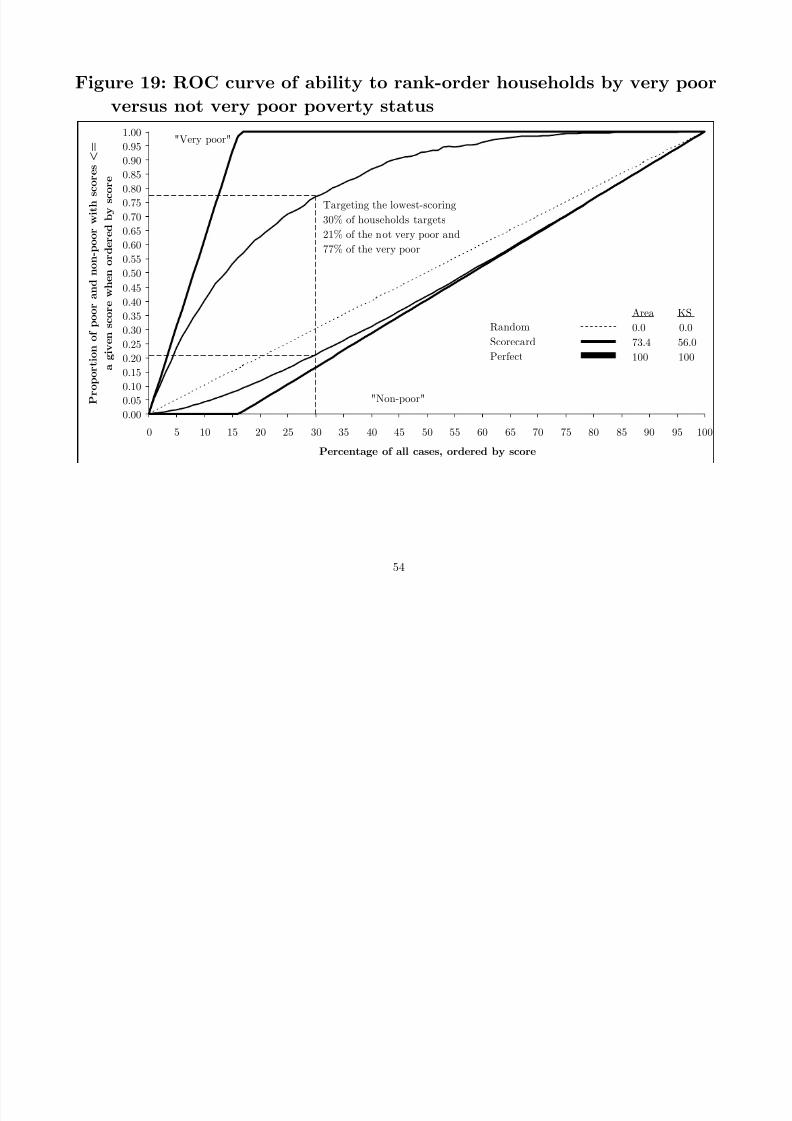
The other aspect of accuracy is how well the very poor are concentrated in low
scores. Once again, an ROC curve is a useful way to look at this.
Figure 19 plots the share of the very poor against the share of the not very poor,
ranked by score. For example, targeting the 30 percent of cases with the lowest scores

8/8/2019 Scoring Poverty Philippines 2002
http://slidepdf.com/reader/full/scoring-poverty-philippines-2002 23/68
In terms of the Kolmogorov-Smirnov statistic, the maximum distance between
the curves is 56.0. In terms of the ratio of the area inside the scorecard curves to the
area inside the trapezoid of a hypothetical perfect scorecard, the value is 73.4.
All in all, Figures 17–19 suggest that the likelihoods of being very poor are
estimated both accurately and precisely.
7.2 Overall poverty rates for the very poor
The average of estimated poverty likelihoods for a group is their estimated
overall (very poor) poverty rate. To measure the accuracy and precision of this
estimate, the scorecard was applied to 10,000 bootstrap replicates from the second one-
fourth hold-out samples from the 2002 APIS, and then the estimated overall poverty
rates were compared with the true values. The mean difference was 0.8 percentage
points, with a standard deviation of 0.32. The 90-percent confidence interval around the
mean was +/–0.5 percentage points, the 95-percent interval was +/–0.6 percentage
points, and the 99-percent interval was +/–0.8 percentage points.
Thus, subtracting 0.8 percentage points to a group’s average poverty likelihood
would produce an unbiased estimate that, in 99 of 100 cases, would be within +/–0.8
percentage points of the true overall (very poor) poverty rate. This estimate is both

8/8/2019 Scoring Poverty Philippines 2002
http://slidepdf.com/reader/full/scoring-poverty-philippines-2002 24/68
7.3 Targeting the very poor
As before, targeting involves using a classification matrix and a net-benefit
matrix to select a cut-off. The wrinkle is that there are now three poverty statuses:
• Very poor: Poorest half of those with expenditure at or below the poverty line
• Poor: Least-poor half of those with expenditure at or below poverty
• Non-poor: Expenditure above poverty
There are also three targeting segments:
• Very poor: Score at or below the very poor/poor cut-off
• Poor: Score above the very poor/poor cut-off and
at or below the poor/non-poor cut-off
• Non-poor: Score above the poor/non-poor cut-off

8/8/2019 Scoring Poverty Philippines 2002
http://slidepdf.com/reader/full/scoring-poverty-philippines-2002 25/68
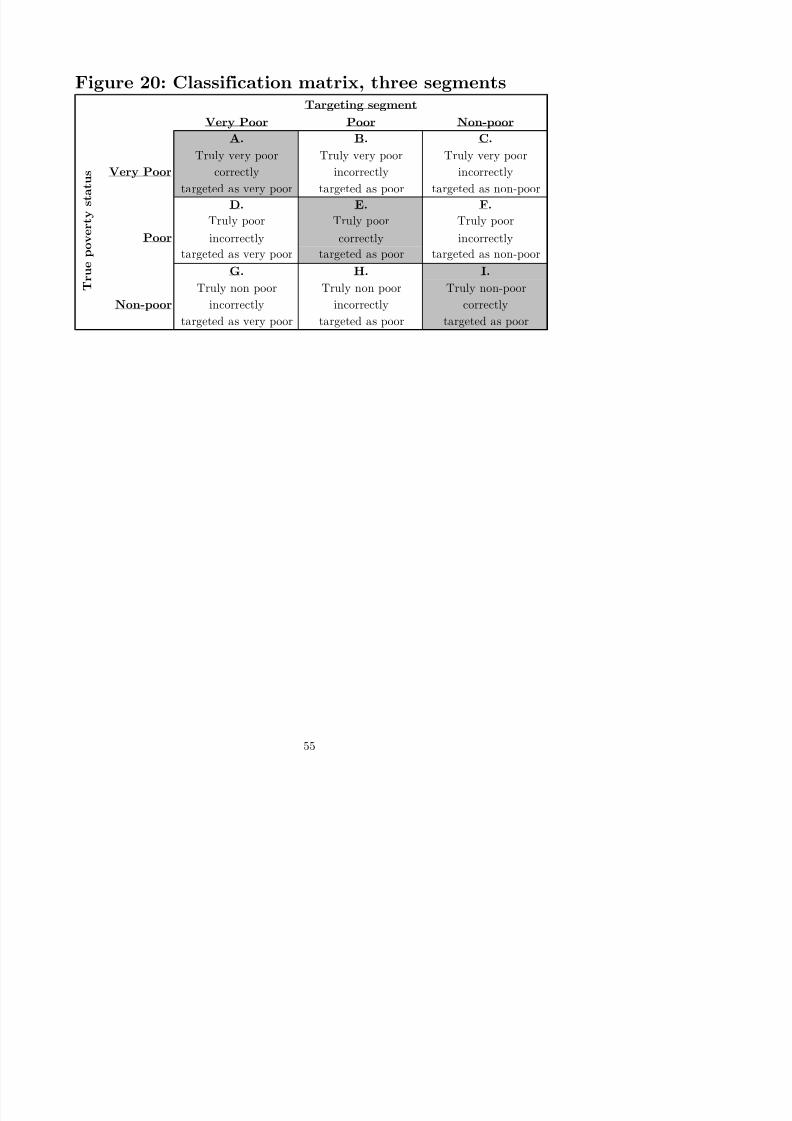
There are two cut-offs (very poor/poor and poor/non-poor) and 9 classification
results (Figure 20):
A. Truly very poor correctly targeted as very poor
B. Truly very poor incorrectly targeted as poor
C. Truly very poor incorrectly targeted as non-poor
D. Truly poor incorrectly targeted as very poor
E. Truly poor correctly targeted as poor
F. Truly poor incorrectly targeted as non-poor
G. Truly non-poor incorrectly targeted as very poor
H. Truly non-poor incorrectly targeted as poor
I. Truly non-poor correctly targeted as non-poor
The general classification matrix (Figure 20) and the net-benefit matrix (Figure
21) are combined as before to define total net benefit:
Total net benefit = α·A + β·B + γ·C + δ·D + ε·E + ζ·F + η·G + θ·H + ι ·I.
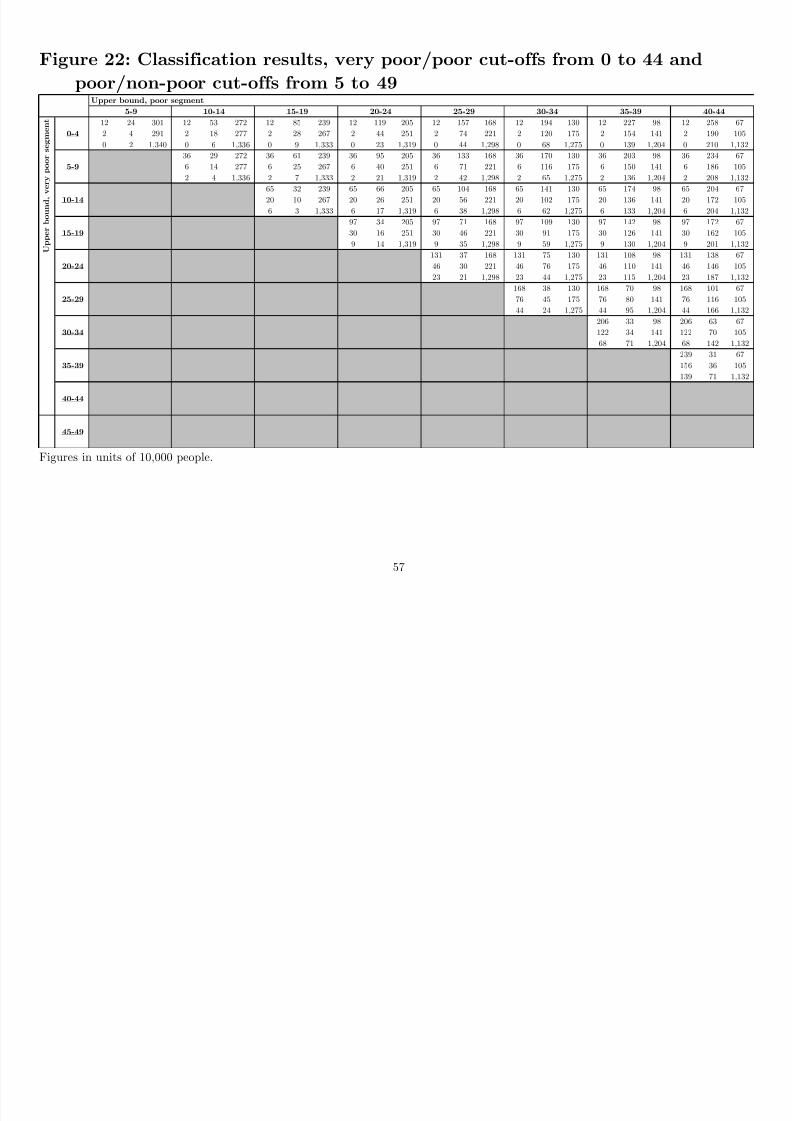
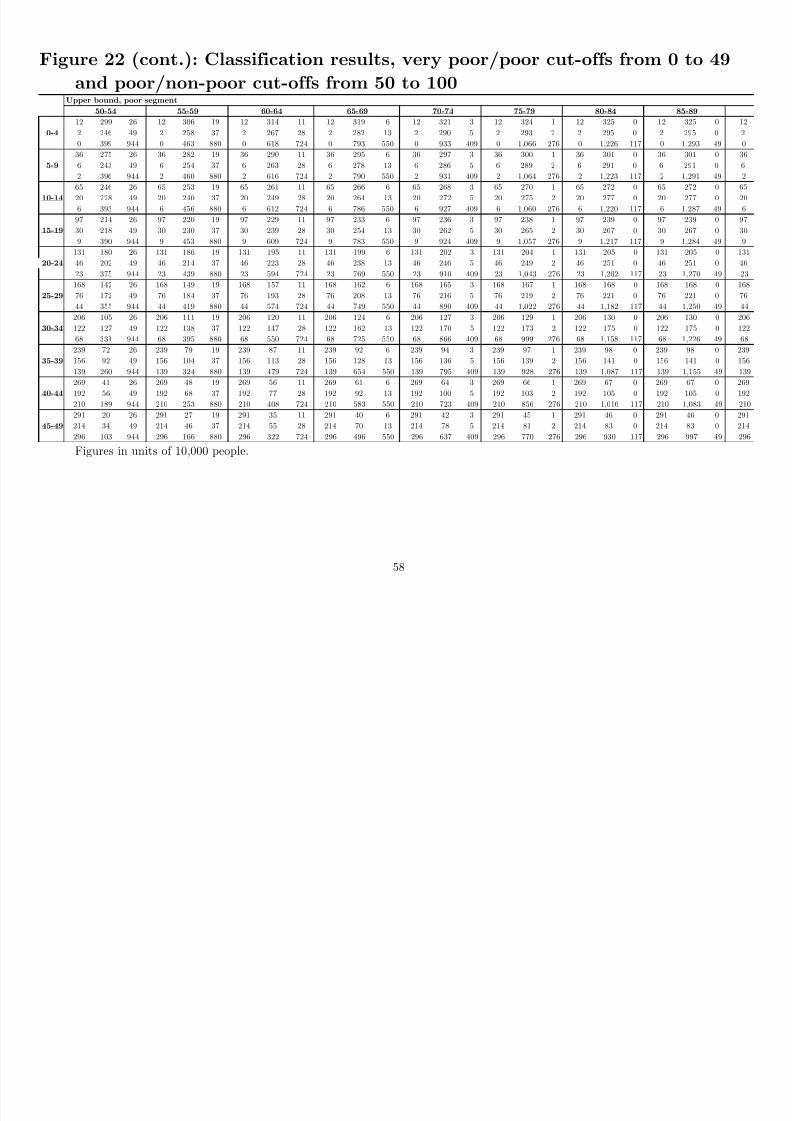
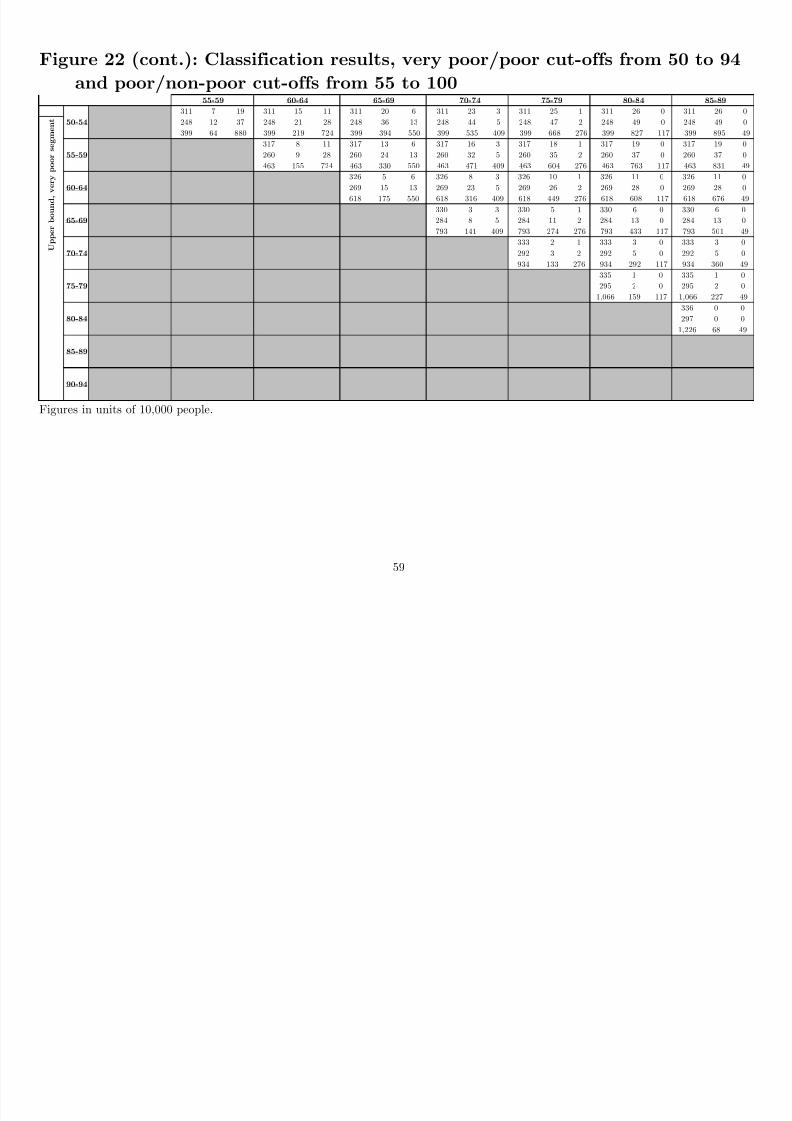
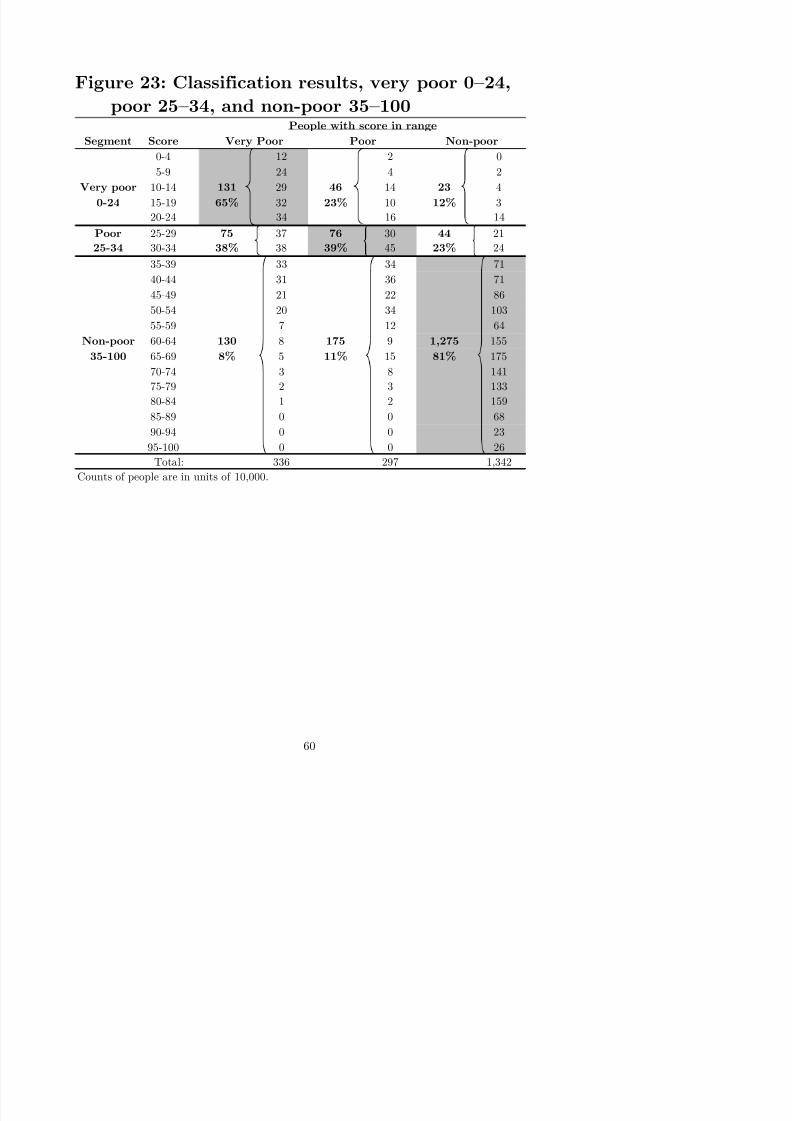
Figure 22 shows classification results for all possible pairs of cut-off scores in the
second one-fourth hold-out sample. For example, suppose a program defined:
• Very poor/poor cut-off of 20–24 (so scores of 0–24 are targeted as very poor)
• Poor/non-poor cut-off of 30–34 (so scores of 25–34 are targeted as poor, and scores

8/8/2019 Scoring Poverty Philippines 2002
http://slidepdf.com/reader/full/scoring-poverty-philippines-2002 26/68
As with any scorecard and cut-offs, there is both successful targeting and errors.
For the example cut-offs of 20–24 and 30–34, targeting would be correct for 65 percent
of the very poor, 39 percent of the poor, and 81 percent of the non-poor (Figure 23).
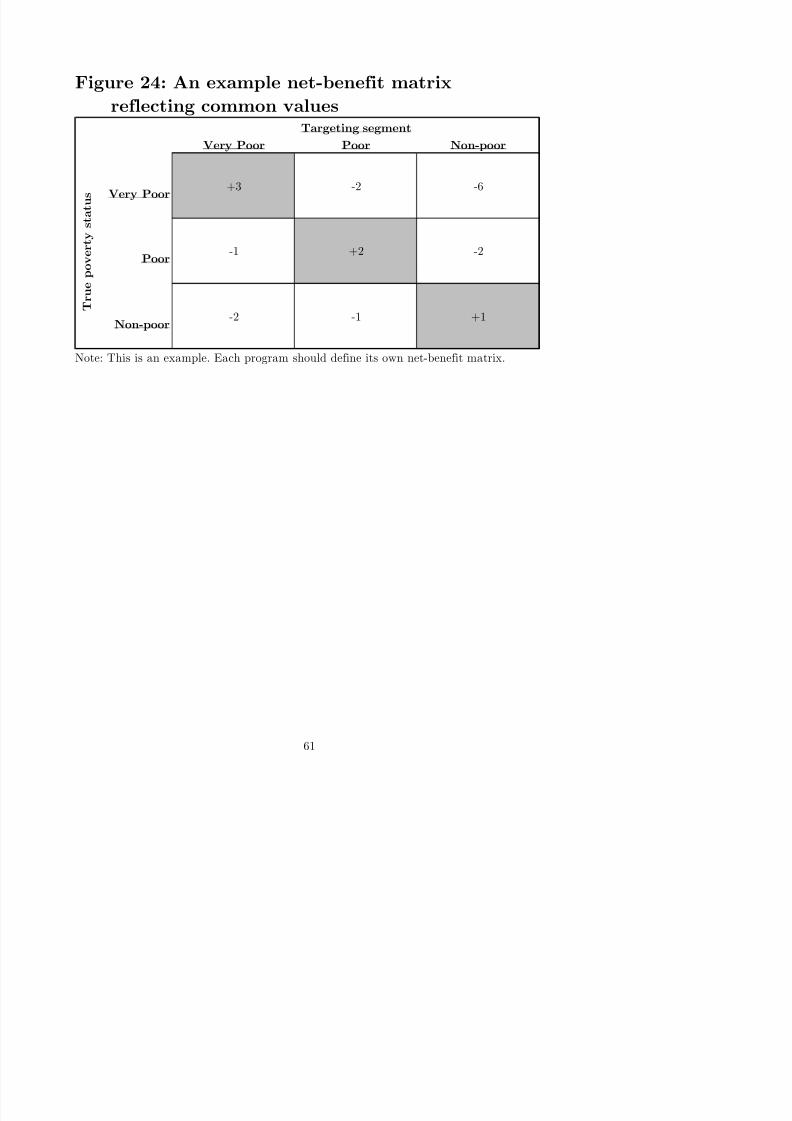
The program chooses a set of cut-offs to optimize the benefits of correct
classifications, net of the costs (negative benefits) of incorrect classifications. For
example, suppose the net-benefit matrix is Figure 24, representing one way to reflect:
• Greater importance of correctly targeting the very poor and poor
• Greater cost of gross errors such as targeting the truly very poor as non-poor
Given the classification results in Figure 23 and net benefits in Figure 24, total
net benefit for the cut-off pair of 20–24 and 30–34 is +404 (Figure 25).
Is this the best pair of cut-offs? The answer requires applying the net-benefit
matrix to the classification results for all 190 possible pairs (Figure 22). It turns out
that total net benefit is highest for cut-offs 30–34 and 50–54, giving a net benefit of 764.
8. Calibrating for $4/day-or-less poverty
The simple poverty scorecard in Figure 4 can be used to track outreach not only
to the poor (the upper half of those under the national poverty line) and the very poor
(the lower half of those under the national poverty line) but also the $4PPP/day poor
8/8/2019 Scoring Poverty Philippines 2002
http://slidepdf.com/reader/full/scoring-poverty-philippines-2002 27/68
describes the derivation of a $4PPP poverty line that accounts for differences in cost-of-
living across Filipino provinces and across rural and urban areas.
8.1 Poverty likelihoods
Scores are associated with the probability of being very poor by bootstrapping
1,000 samples from the first one-fourth hold-out sample from the 2002 APIS. The
poverty likelihood for a given score is then taken as the average of the shares of people
with that score who are $4/day-or-less poor across the 1,000 bootstrapped samples.
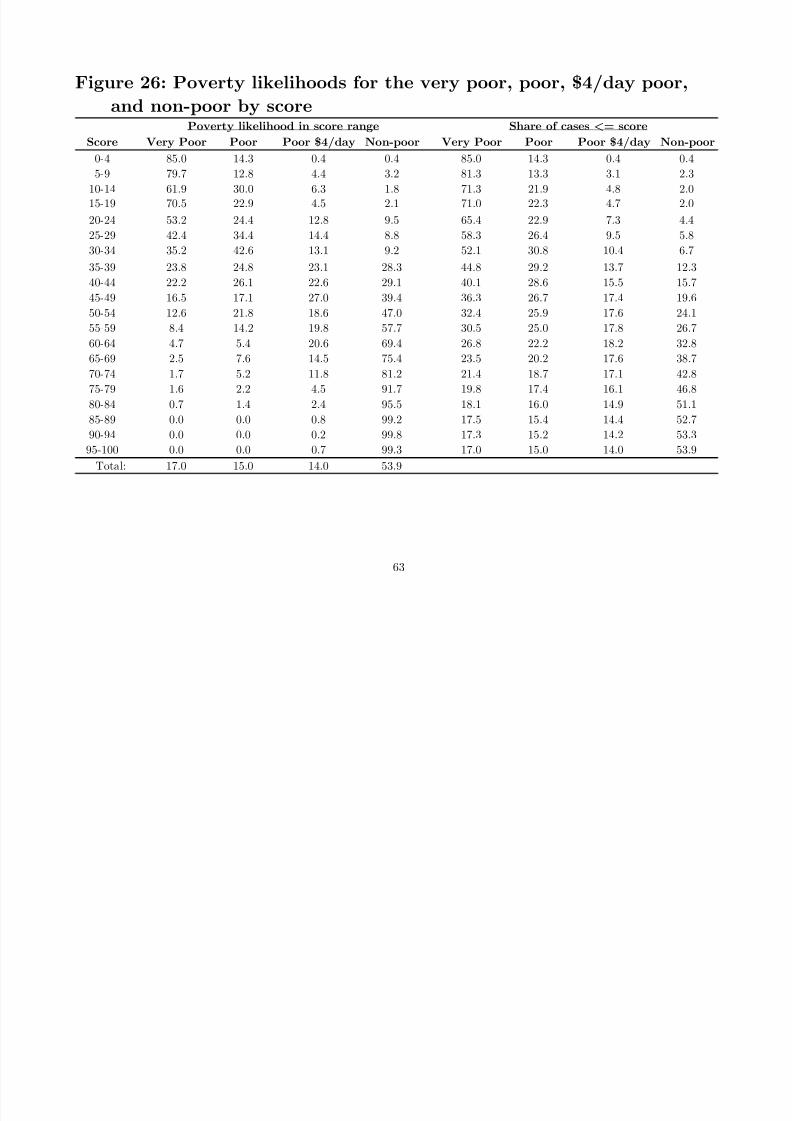
Columns 2–5 in Figure 26 are the poverty likelihoods for the four classes for all
scores. For example, if a potential participant has a score of 25–29, the probability of
being very poor is 42.2 percent, the probability of being poor is 34.4 percent, the
probability of being $4/day poor is 14.4 percent, and the probability of being non-poor
is 8.8 percent. The sum of the four poverty likelihoods is, of course, 100 percent.
Columns 6–9 in Figure 26 are the share of targeted participants by poverty
status and by cut-off. For example, for a cut-off of 25–29, 58.3 percent of those targeted
would be very poor, 26.4 percent would be poor, 9.5 percent would be $4/day poor, and
5.8 percent would be non-poor.
Each person’s score is associated with four poverty likelihoods. For example, a
person with a score of 25 may be targeted as very poor, but the likelihood of truly being

8/8/2019 Scoring Poverty Philippines 2002
http://slidepdf.com/reader/full/scoring-poverty-philippines-2002 28/68
person has one targeting status (for program purposes), one true poverty status (in
reality), and four estimated poverty likelihoods (one for each possible poverty status).
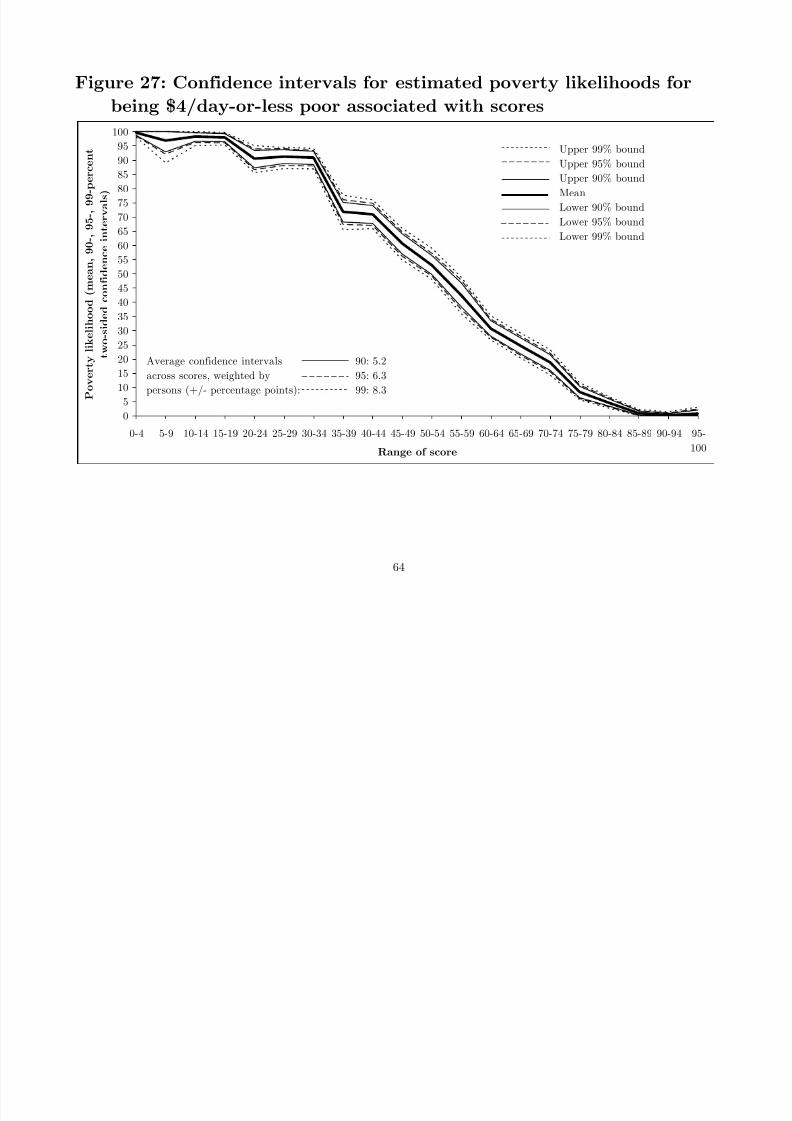
Figure 27 shows the precision of estimated poverty likelihoods for being $4/day-
or-less poor as point estimates with 90-, 95-, and 99-percent confidence intervals. For
example, the average $4/day-or-less poverty rate (the poverty likelihood) across
bootstrap samples for people with scores of 25–29 was 91.2 percent. In 90 percent of
1,000 bootstraps from the second one-fourth hold-out sample, the share was between
88.7–93.6 percent. In 95 percent of samples, the share was between 88.1–94.0, and in 99
percent of samples, the share was between 86.9–94.4.
For estimated and true poverty likelihoods, Figure 28 depicts mean absolute
differences and confidence intervals from 1,000 bootstraps on the second one-fourth
hold-out sample. Weighting by the people in a score range, the mean absolute difference
is 4.7 percentage points, with a 90-percent interval of +/–5.2 percentage points.
The other aspect of accuracy is how well the $4/day-or-less poor are
concentrated in low scores. Once again, an ROC curve is a useful way to look at this.
Figure 29 plots the share of the $4/day-or-less poor against the share of the non-
poor, ranked by score. For example, targeting the 20 percent of cases with the lowest
scores would target 44 percent of all the $4/day-or-less poor and 4 percent of all the

8/8/2019 Scoring Poverty Philippines 2002
http://slidepdf.com/reader/full/scoring-poverty-philippines-2002 29/68
In terms of the Kolmogorov-Smirnov statistic, the maximum distance between
the curves is 58.0. In terms of the ratio of the area inside the scorecard curves to the
area inside the trapezoid of a hypothetical perfect scorecard, the value is 74.3.
8.2 Overall poverty rates for the $4/day-or-less poor
The average of estimated poverty likelihoods for a group is their estimated
overall ($4/day-or-less) poverty rate. To measure the accuracy and precision of this
estimate, the scorecard was applied to 1,000 bootstrap replicates from the second one-
fourth hold-out samples from the 2002 APIS, and then the estimated overall poverty
rates were compared with the true values. The mean difference was 0.6 percentage
points, with a standard deviation of 0.39. The 90-percent confidence interval around the
mean was +/–0.6 percentage points, the 95-percent interval was +/–0.7 percentage
points, and the 99-percent interval was +/–1.0 percentage points.
Thus, subtracting 0.6 percentage points to a group’s average poverty likelihood
would produce an unbiased estimate that, in 99 of 100 cases, would be within +/–1.0
percentage points of the true overall ($4/day-or-less) poverty rate. This estimate is both
quite accurate and quite precise.
8/8/2019 Scoring Poverty Philippines 2002
http://slidepdf.com/reader/full/scoring-poverty-philippines-2002 30/68
9. Conclusion
One in three Filipinos is poor. An easy-to-use, inexpensive tool for identifying the
poor could improve targeting and speed progress out of poverty. This paper presents a
simple scorecard that estimates the likelihood that a person is poor.
The scorecard is built and tested using data on 38,014 households from the 2002
APIS. The scorecard is calibrated to estimate the likelihood of being poor (income
below the official line), very poor (poorest half of the poor), $4/day poor (income above
the official line but below the $4/day international benchmark), or non-poor.
Out-of-sample bootstrap tests show that the estimates are both accurate and
precise. For individual poverty likelihoods (whether poor or very poor), estimates are
within 6 percentage points of the true value with 90-percent confidence. For a group’s
overall poverty rate (again, whether poor or very poor), estimates are within 1
percentage points of the true value with 99-percent confidence.
For targeting, programs can use the classification results reported here to select
the best cut-off for their particular values and mission.
Accuracy is important, but ease-of-use is even more important; a perfectly
accurate scorecard is worthless if programs feel daunted by its complexity and so never
even try to use it. For this reason, the scorecard here is kept simple, using 10 indicators

8/8/2019 Scoring Poverty Philippines 2002
http://slidepdf.com/reader/full/scoring-poverty-philippines-2002 31/68
simple look-up table, and targeting cut-offs are also simple to apply. Thus, users can
not only understand the scorecard, but they can also use it to compute scores in the
field, by hand, in real time.
Overall, the poverty scorecard can help development programs to target services
to the poor, track participants’ progress out of poverty through time, and report on
participants’ overall poverty rate.

8/8/2019 Scoring Poverty Philippines 2002
http://slidepdf.com/reader/full/scoring-poverty-philippines-2002 32/68
Appendix:Adjusting the $4PPP Poverty Line for Cost-of-Living Differences
$4PPP poverty lines were constructed using the following criteria:
• Account for differences in cost-of-living by province and by rural/urban within each
province
• Match the average of rural and urban $4PPP lines to the all-Philippines $4PPP line
• Match the ratio of rural to urban $4PPP lines to that same ratio for the official
national lines
Basic inputs to the calculation include:
• $4PPP/person/day for all-Philippines in 2002 is 46.85 pesos/person/day
• In 2002, 50.16 percent of the population was rural
• The population-weighted official poverty line in 2002 was 38.49 pesos/person/day
for urban areas and 31.59 pesos/person/day for rural areas
The population-weighted average of rural and urban $4PPP lines should match the all-
Philippines $4PPP line:
46.85 = (0.5016 x Rural $4PPP line) + (0.4984 x Urban $4PPP line).
Furthermore, the ratio of the two lines should match the ratio of the official lines:
(Rural $4PPP line ÷ Urban $4PPP line) = 31.59 ÷ 38.49.
Solving the algebra gives:
• Rural $4PPP line of 42.25 pesos/person/day
• Urban $4PPP line of 51.48 pesos/person/day
To account for cost-of-living across provinces, the official lines for 2002 are then
adjusted by their ratio with the rural or urban $4PPP line. For both rural and urban
areas, the adjustment factor is 1.337. That is, the $4PPP poverty line is 33.7 percent
8/8/2019 Scoring Poverty Philippines 2002
http://slidepdf.com/reader/full/scoring-poverty-philippines-2002 33/68
References
Adams, N.M.; and D.J. Hand. (2000) “Improving the Practice of Classifier Performance
Assessment”, Neural Computation , Vol. 12, pp. 305–311.
Baulch, Bob. (2003) “Poverty Monitoring and Targeting Using ROC Curves: Examples
from Vietnam”, IDS Working Paper No. 161,
http://www.ids.ac.uk/ids/bookshop/wp/wp161.pdf .
Caire, Dean. (2004) “Building Credit Scorecards for Small Business Lending in
Developing Markets”, Bannock Consulting,http://www.microfinance.com/English/Papers/Scoring_SMEs_Hybrid.pdf .
Efron, Bradley; and Robert J. Tibshirani. (1993) An Introduction to the Bootstrap, New
York: Chapman and Hall, ISBN 0–412–04231–2.
Ericta, Carmelita N. (2005) “2004 Annual Poverty Indicators Survey (APIS):
Preliminary Results”,http://www.census.gov.ph/data/pressrelease/2005/ap2004ptx.html .
Fuller, Rob. (2006) “Measuring Poverty of Microfinance Clients in Haiti”,http://www.microfinance.com/English/Papers/Scoring_Poverty_Haiti_Ful
ler.pdf.
Goodman, L.A. and Kruskal, W.H. (1979) Measures of Association for CrossClassification , New York, NY: Springer-Verlag, ISBN 0–38–790443–3.
Greene, William H. (1993) Econometric Analysis: Second Edition , New York, NY:
MacMillan, ISBN 0–02–346391–0.
Grootaert, Christiaan; and Jeanine Braithwaite. (1998) “Poverty Correlates and
Indicator-Based Targeting in Eastern Europe and the Former Soviet Union”,World Bank Policy Research Working Paper No. 1942, Washington, D.C.,http://www.worldbank.org/html/dec/Publications/Workpapers/WPS1900ser
ies/wps1942/wps1942.pdf .
H dl B d R b t M Oli (1998) “B i f d b fit”

8/8/2019 Scoring Poverty Philippines 2002
http://slidepdf.com/reader/full/scoring-poverty-philippines-2002 34/68
IRIS Center. (2005b) “Notes on Assessment and Improvement of Tool Accuracy”,http://www.povertytools.org/documents/Assessing%20and%20Improving%20
Accuracy.pdf.
Matul, Michal; and Sean Kline. (2003) “Scoring Change: Prizma’s Approach to
Assessing Poverty”, MFC Spotlight Note No. 4, Warsaw, Poland: Microfinance
Centre for Central and Eastern Europe and the New Independent States,
http://www.mfc.org.pl/doc/Research/ImpAct/SN/MFC_SN04_eng.pdf .
National Statistic Coordination Board. (2004) “Poverty Threshold: P11,906 in 2002”,
http://www.nscb.gov.ph/headlines/2004/30Jan04_povtresh.asp , accessed
Sept. 3, 2005.
Salford Systems. (2000) CART for Windows User’s Guide, San Diego, CA.
Schreiner, Mark. (2006) “Is One Simple Poverty Scorecard Enough for India?”, memofor Grameen Foundation U.S.A., http://www.microfinance.com/English/Papers/Scoring_Poverty_India_Seg
ments.pdf.
Schreiner, Mark (2005a) “Un Indice de Pobreza para México”, memo for Grameen
Foundation U.S.A.,http://www.microfinance.com/Castellano/Documentos/Scoring_Pobreza_Me
xico.pdf.
Schreiner, Mark. (2005b) “IRIS questions on poverty scorecards”, memo for GrameenFoundation U.S.A., http://www.microfinance.com/English/Papers/Scoring_Poverty_Response_
to_IRIS.pdf.
Schreiner, Mark. (2002) Scoring: The Next Breakthrough in Microfinance? Occasional
Paper No. 7, Consultative Group to Assist the Poorest, Washington, D.C.,
http://www.cgap.org/docs/OccasionalPaper_07.pdf ,
Schreiner, Mark; Matul, Michal; Pawlak, Ewa; and Sean Kline. (2004) “PovertyScorecards: Lessons from a Microlender in Bosnia-Herzegovina”, Microfinance
Risk Management,

8/8/2019 Scoring Poverty Philippines 2002
http://slidepdf.com/reader/full/scoring-poverty-philippines-2002 35/68
Zeller, Manfred. (2004) “Review of Poverty Assessment Tools”, Accelerated
Microenterprise Advancement Project,http://www.povertytools.org/documents/Review%20of%20Poverty%20Assess
ment%20Tools.pdf.
Zeller, Manfred; Alcaraz V., Gabriela; and Julia Johannsen. (2005) “Developing and
Testing Poverty-Assessment Tools: Results from Accuracy Tests in Peru”,
Accelerated Microenterprise Advancement Project,
http://www.povertytools.org/documents/Peru%20Accuracy%20Report.pdf .
8/8/2019 Scoring Poverty Philippines 2002
http://slidepdf.com/reader/full/scoring-poverty-philippines-2002 36/68
Figure 1: Households surveyed, people represented,
and overall poverty ratesSub-sample Households People % poor
Constructing scorecards 18,846 39,459,467 32.0
Associating scores with likelihoods 9,665 20,407,790 31.4
Testing accuracy 9,503 19,760,021 31.9
Source: 2002 APIS. 38,014 79,627,278 31.8
8/8/2019 Scoring Poverty Philippines 2002
http://slidepdf.com/reader/full/scoring-poverty-philippines-2002 37/68
8/8/2019 Scoring Poverty Philippines 2002
http://slidepdf.com/reader/full/scoring-poverty-philippines-2002 38/68
8/8/2019 Scoring Poverty Philippines 2002
http://slidepdf.com/reader/full/scoring-poverty-philippines-2002 39/68
Figure 3 (cont ): Poverty indicators ranked by uncertainty coefficient

8/8/2019 Scoring Poverty Philippines 2002
http://slidepdf.com/reader/full/scoring-poverty-philippines-2002 40/68
38
Figure 3 (cont.): Poverty indicators ranked by uncertainty coefficientUncertainty
coefficient Indicator (Value for those most likely “poor”; Value for those least likely “poor”)
39. 40 During the past six months, did the household buy non-alcoholic beverages (soft drinks, pineapple juice, orange juice, ice
candy, ice drop, ice buko, etc.)? (No; Yes)40. 39 How many children are there aged 11 or younger per adult aged 18 or older? (0.5 or more; <0.5)
41. 38 During the past six months, did the household make any deposits in banks? (No; Yes)
42. 35 During the past six months, did anyone in the family receive cash, gifts, support, or relief from abroad (including pensions
retirement, workmen’s compensation, dividends from investments, etc.)? (No; Yes)
43. 31 Is the male head/spouse self-employed? (No; Yes)
44. 22 During the past six months, did the household buy dairy products and eggs (milk, ice cream, butter, cheese, fresh eggs, balut,
salted eggs)? (No; Yes)
45. 22 Do all children in the family of ages 6 to 11 go to school? (No; Yes)46. 22 Do any family members assist in the family business? (No; Yes)
47. 21 During the past six months, did anyone in the family make a deposit in a bank, receive interest on savings, or make a
withdrawal from a savings account? (No; Yes)
48. 21 Do any family members have salaried employment? (No; Yes)
49. 18 In the next 12 months, do you expect your household’s economic conditions to worsen, stay the same, or improve? (Worsen;
Stay the Same; Improve)
50. 17 Does the family have any income from entrepreneurial activities? (Yes; No)
51. 16 Is your household’s situation at present compared with the last 12 months worse, about the same, or better? (Worse, About the
same, Better)
52. 16 Are any household members involved with self-employment? (No; Yes)
Source: Based on 2002 APIS.
Figure 4: A simple poverty scorecard for the Philippines
8/8/2019 Scoring Poverty Philippines 2002
http://slidepdf.com/reader/full/scoring-poverty-philippines-2002 41/68
39
Figure 4: A simple poverty scorecard for the Philippines Indicator Points
1. 3 or 4 1 or 2 Zero
7 16 27
2. No Yes
0 13
3. Zero 1 2 or more
0 9 18
4. What are the house's outer walls made of? Strong (iron, aluminum,
tile, concrete, brick, stone,wood, asbestos)
4
5. How many radios does the family own? Zero 1 2 or more
0 3 10
6. Does the family own a sala set? No Yes
0 9
7. What is the house's roof made of? Strong (Galvanized iron,
aluminum tile, concrete,
brick, stone, or asbestos)2
8. What kind of toilet facility does the family have? Water sealed
3
9. No Yes No children ages 6-11
0 4 6
10. Do any family members have salaried employment? No Yes
0 6
Total:
Does the family own a gas stove or gas range?
How many people in the family are aged 0 to
17?
5 or more
0
Source: Calculations based on the 2002 APIS.
Values
Light (cogon , nipa , or sawali , bamboo,
anahaw )
Light (Salvaged, makeshift, cogon , nipa , or
anahaw )
None, open pit, closed pit, or other
0
0
0
Do all children in the family of ages 6 to 11
go to school?
How many television sets does the family own?
8/8/2019 Scoring Poverty Philippines 2002
http://slidepdf.com/reader/full/scoring-poverty-philippines-2002 42/68
Figure 5: Scores and poverty likelihoods
Score
0-4 99.3 99.3 68.4
5-9 92.5 94.6 69.4
10-14 91.9 93.2 70.9
15-19 93.4 93.3 72.5
20-24 77.6 88.3 74.3
25-29 76.8 84.8 77.0
30-34 77.7 82.9 80.6
35-39 48.6 74.0 83.4
40-44 48.3 68.7 86.8
45-49 33.6 63.0 89.1
50-54 34.4 58.4 92.7
55-59 22.6 55.5 94.060-64 10.1 49.0 94.9
65-69 10.2 43.7 96.6
70-74 6.9 40.1 97.9
75-79 3.8 37.1 98.8
80-84 2.1 34.1 100.0
85-89 0.0 32.9 100.0
90-94 0.0 32.5 100.095-100 0.0 32.1 100.0
Surveyed cases weighted to represent the Filipino population.
Source: Based on the 2002 APIS.
Poverty likelihood
for people withscore in range (%)
% of people
<=scorewho are poor
% of people
>scorewho are non-poor

8/8/2019 Scoring Poverty Philippines 2002
http://slidepdf.com/reader/full/scoring-poverty-philippines-2002 43/68
41
Figure 6: Confidence intervals for estimated poverty likelihoods associated
0
5
10
15
20
2530
35
40
45
50
55
6065
70
75
80
85
90
95
100
0-4 5-9 10-14 15-19 20-24 25-29 30-34 35-39 40-44 45-49 50-54 55-59 60-64 65-69 70-74 75-79 80-84 85-89 90-94 95-
100Range of score
P o v e r t y l i k e l i h o
o d ( m e a n , 9 0 - , 9 5 - , 9 9
- p e r c e n t t w o - s i d e d
c o n f i d e n c e i n t e r v a l s
)
Upper 99% bound
Upper 95% bound
Upper 90% bound
Mean
Lower 90% bound
Lower 95% bound
Lower 99% bound
Average confidence intervals
across scores, weighted by
persons (+/- percentage points):
90: 2.5
95: 3.0
99: 3.9

8/8/2019 Scoring Poverty Philippines 2002
http://slidepdf.com/reader/full/scoring-poverty-philippines-2002 44/68
42
Figure 7: Differences between estimated and true poverty likelihoods
-16
-14
-12
-10
-8
-6
-4
-2
0
2
4
6
8
10
12
14
16
18
20
0-4 5-9 10-14 15-19 20-24 25-29 30-34 35-39 40-44 45-49 50-54 55-59 60-64 65-69 70-74 75-79 80-84 85-89 90-94 95-
100Range of score
D i f f e r e n c e b
e t w e e n p r e d i c t e d
a n d e s t i m a t e d
p o v e r t y l i k e l i h o o
d
Upper 99% bound
Upper 95% bound
Upper 90% bound
Mean
Lower 90% bound
Lower 95% bound
Lower 99% bound
Average confidence
intervals across scores,
weighted by persons (+/-
percentage points):
Mean: 3.6
90: 2.5
95: 3.0
99: 3.9

8/8/2019 Scoring Poverty Philippines 2002
http://slidepdf.com/reader/full/scoring-poverty-philippines-2002 45/68
43
Figure 8: ROC curve of ability to rank-order households by poverty status
0.00
0.05
0.10
0.15
0.20
0.250.30
0.35
0.40
0.45
0.50
0.55
0.600.65
0.70
0.75
0.80
0.85
0.90
0.95
1.00
0 5 10 15 20 25 30 35 40 45 50 55 60 65 70 75 80 85 90 95 100
Percentage of all cases, ordered by score
P r o p o r t i o n o f
p o o r a n d n o n - p o o r w i t h s c o r e s < =
a g i v e n
s c o r e w h e n o r d e r e
d b y s c o r e
"Poor"
"Non-poor"
Random
ScorecardPerfect
Area KS
0.0 0.0
75.5 59.2100 100
Targeting the
lowest-scoring 20%
of households
targets 6% of the
non-poor and 51%of the poor
8/8/2019 Scoring Poverty Philippines 2002
http://slidepdf.com/reader/full/scoring-poverty-philippines-2002 46/68
Figure 9: General classification matrix
Targeted Non-targeted
Poor
A.
Truly poor
correctly
targeted
B.
Truly poor
mistakenly
non-targeted
Non-poor
C.
Truly non-poor
mistakenly
targeted
D.
Truly non-poor
correctly
non-targeted
Targeting segment
T r u e
p o v e r t y
s t a t u s
8/8/2019 Scoring Poverty Philippines 2002
http://slidepdf.com/reader/full/scoring-poverty-philippines-2002 47/68
45
Figure 10: People by targeting classification and score
A. B. C. D.
Truly poor Truly poor Truly non-poor Truly non-poorcorrectly mistakenly mistakenly correctly
Score targeted non-targeted targeted non-targeted
0-4 0.7 31.4 0.0 67.9
5-9 2.1 30.0 0.1 67.8
10-14 4.3 27.8 0.3 67.6
15-19 6.4 25.6 0.5 67.5
20-24 9.0 23.1 1.2 66.7
25-29 12.4 19.7 2.2 65.7
30-34 16.6 15.5 3.4 64.5
35-39 20.0 12.1 7.0 60.9
40-44 23.4 8.7 10.6 57.3
45-49 25.6 6.5 15.0 52.9
50-54 28.3 3.8 20.2 47.8
55-59 29.2 2.8 23.4 44.5
60-64 30.1 2.0 31.3 36.7
65-69 31.1 1.0 40.1 27.8
70-74 31.6 0.4 47.2 20.7
75-79 31.9 0.2 54.0 14.0
80-84 32.1 0.0 62.0 5.9
85-89 32.1 0.0 65.5 2.590-94 32.1 0.0 66.6 1.3
95-100 32.1 0.0 67.9 0.0
Figures normalized to sum to 100.
Source: Based on the 2002 APIS.

8/8/2019 Scoring Poverty Philippines 2002
http://slidepdf.com/reader/full/scoring-poverty-philippines-2002 48/68
Figure 11: General net-benefit matrix
Targeted Non-targeted
Poor α β
Non-poor γ δ
Targeting segment
T r u e
p o v e r t y
s t a t u s
8/8/2019 Scoring Poverty Philippines 2002
http://slidepdf.com/reader/full/scoring-poverty-philippines-2002 49/68
Figure 12: “Total Accuracy” net-benefit matrix
Targeted Non-targeted
Poor 1 0
Non-poor 0 1
Targeting segment
T r u e
p o v e r t y
s t a t u s
8/8/2019 Scoring Poverty Philippines 2002
http://slidepdf.com/reader/full/scoring-poverty-philippines-2002 50/68
48
Figure 13: Total net benefit for some common net-benefit matrices
1 0 1 0 0 0 0 -1 0 0
Score 0 1 0 0 0 1 0 0 -1 0
0-4
5-9
10-14
15-19
20-24
25-29
30-34
35-39
40-44
45-4950-54
55-59
60-64
65-69
70-74
75-79
80-8485-89
90-94
95-100
All figures in percentage units.
(A + B)Total Accuracy
0.8
69.9 6.6 99.8 93.4 5.4
68.6 2.2 100.0 97.8
Non-poverty
Poverty Accuracy Accuracy Undercoverage Leakage100*A / (A+B) 100*D / (C+D) 100*B / (A+B) 100*C / (A+C)
6.8
73.9 20.1 99.3 79.9 6.7
71.9 13.4 99.5 86.6
11.7
78.1 38.6 96.7 61.4 15.2
75.7 27.9 98.3 72.1
17.1
80.9 62.3 89.7 37.7 26.0
81.1 51.7 95.0 48.3
31.3
78.5 79.7 77.9 20.3 37.0
80.7 72.8 84.3 27.2
41.6
73.7 91.1 65.5 8.9 44.5
76.0 88.2 70.3 11.8
51.0
58.9 97.0 41.0 3.0 56.3
66.8 93.9 54.0 6.1
59.9
45.9 99.5 20.5 0.5 62.9
52.3 98.6 30.5 1.4
65.934.5 100.0 3.6 0.0 67.138.0 100.0 8.7 0.0
67.5
32.1 100.0 0.0 0.0 67.9
33.4 100.0 1.9 0.0

8/8/2019 Scoring Poverty Philippines 2002
http://slidepdf.com/reader/full/scoring-poverty-philippines-2002 51/68
Figure 14: “Poverty Accuracy” net-benefit matrix
Targeted Non-targeted
Poor 1 0
Non-poor 0 0
Targeting segment
T r u e
p o v e r t y
s t a t u s
Fi 15 N b fi i f BPAC

8/8/2019 Scoring Poverty Philippines 2002
http://slidepdf.com/reader/full/scoring-poverty-philippines-2002 52/68
Figure 15: Net-benefit matrix for BPAC
Targeted Non-targeted
Poor 1 1
Non-poor -1 0
Targeting segment
T r u e
p o v e r t y
s t a t u s
Fi 16 P t lik lih d f th d

8/8/2019 Scoring Poverty Philippines 2002
http://slidepdf.com/reader/full/scoring-poverty-philippines-2002 53/68
51
Figure 16: Poverty likelihoods for the very poor, poor, and non-poor
by score
Score Very Poor Poor Non-poor Very Poor Poor Non-poor
0-4 85.0 14.3 0.7 85.0 14.3 0.7
5-9 79.7 12.8 7.6 81.3 13.3 5.4
10-14 61.9 30.0 8.1 71.3 21.9 6.815-19 70.5 22.9 6.6 71.0 22.3 6.7
20-24 53.2 24.4 22.4 65.4 22.9 11.725-29 42.4 34.4 23.2 58.3 26.4 15.2
30-34 35.2 42.6 22.3 52.1 30.8 17.1
35-39 23.8 24.8 51.4 44.8 29.2 26.0
40-44 22.2 26.1 51.7 40.1 28.6 31.3
45-49 16.5 17.1 66.4 36.3 26.7 37.0
50-54 12.6 21.8 65.6 32.4 25.9 41.6
55-59 8.4 14.2 77.4 30.5 25.0 44.560-64 4.7 5.4 90.0 26.8 22.2 51.0
65-69 2.5 7.6 89.9 23.5 20.2 56.3
70-74 1.7 5.2 93.1 21.4 18.7 59.9
75-79 1.6 2.2 96.3 19.8 17.4 62.9
80-84 0.7 1.4 97.9 18.1 16.0 65.9
85-89 0.0 0.0 100.0 17.5 15.4 67.1
90-94 0.0 0.0 100.0 17.3 15.2 67.5
95-100 0.0 0.0 100.0 17.0 15.0 67.9
Total: 17.0 15.0 67.9
Share of cases <= scorePoverty likelihood in score range
Fi 17 C fid i t l f ti t d t lik lih d f

8/8/2019 Scoring Poverty Philippines 2002
http://slidepdf.com/reader/full/scoring-poverty-philippines-2002 54/68
52
Figure 17: Confidence intervals for estimated poverty likelihoods for
being very poor associated with scores
0
10
20
30
40
50
60
70
80
90
100
0-4 5-9 10-14 15-19 20-24 25-29 30-34 35-39 40-44 45-49 50-54 55-59 60-64 65-69 70-74 75-79 80-84 85-89 90-94 95-
100Range of score
D i f f e r e n c e b e t w e e n p r e d i c t e d a n d e s t i m a t e d
p o v e r t y l i k e l i h o o d ( % p t s . )
Upper 99% bound
Upper 95% bound
Upper 90% bound
Mean
Lower 90% bound
Lower 95% boundLower 99% bound
Average confidence intervals
across scores, weighted by
persons (+/- percentage points):
90: 2.2
95: 2.8
99: 3.6
Figure 18: Differences between estimated and true poverty likelihoods
8/8/2019 Scoring Poverty Philippines 2002
http://slidepdf.com/reader/full/scoring-poverty-philippines-2002 55/68
53
Figure 18: Differences between estimated and true poverty likelihoods
for the very poor
-20
-15
-10
-5
0
5
10
15
20
0-4 5-9 10-14 15-19 20-24 25-29 30-34 35-39 40-44 45-49 50-54 55-59 60-64 65-69 70-74 75-79 80-84 85-89 90-94 95-
100Range of score
D i f f e r e n c e b e t w e e n p r e d i c t e d a n d e s t i m a t e d
p o v e r t y l i k e l i h o o d
Upper 99% bound
Upper 95% bound
Upper 90% bound
Mean
Lower 90% bound
Lower 95% bound
Lower 99% bound
Average confidenceintervals across scores,
weighted by persons (+/-
percentage points):
Mean: 1.890: 2.5
95: 3.0
99: 4.0
Figure 19: ROC curve of ability to rank order households by very poor
8/8/2019 Scoring Poverty Philippines 2002
http://slidepdf.com/reader/full/scoring-poverty-philippines-2002 56/68
54
Figure 19: ROC curve of ability to rank-order households by very poor
versus not very poor poverty status
0.00
0.05
0.10
0.15
0.20
0.250.30
0.35
0.40
0.45
0.50
0.55
0.600.65
0.70
0.75
0.80
0.85
0.90
0.95
1.00
0 5 10 15 20 25 30 35 40 45 50 55 60 65 70 75 80 85 90 95 100
Percentage of all cases, ordered by score
P r o p o r t i o n o f
p o o r a n d n o n - p o o r
w i t h s c o r e s < =
a g i v e n
s c o r e w h e n o r d e r e d
b y s c o r e
"Very poor"
"Non-poor"
Random
Scorecard
Perfect
Area KS
0.0 0.0
73.4 56.0
100 100
Targeting the lowest-scoring
30% of households targets
21% of the not very poor and
77% of the very poor
Figure 20: Classification matrix three segments
8/8/2019 Scoring Poverty Philippines 2002
http://slidepdf.com/reader/full/scoring-poverty-philippines-2002 57/68
Figure 20: Classification matrix, three segments
Very Poor Poor Non-poorA. B. C.
Truly very poor Truly very poor Truly very poor
correctly incorrectly incorrectly
targeted as very poor targeted as poor targeted as non-poor
D. E. F.
Truly poor Truly poor Truly poor
incorrectly correctly incorrectly
targeted as very poor targeted as poor targeted as non-poor
G. H. I.
Truly non-poor Truly non-poor Truly non-poor
incorrectly incorrectly correctly
targeted as very poor targeted as poor targeted as poor
Targeting segment
T r u e p o v e r
t y
s t a t u s Very Poor
Poor
Non-poor
Figure 21: Net-benefit matrix, three segments

8/8/2019 Scoring Poverty Philippines 2002
http://slidepdf.com/reader/full/scoring-poverty-philippines-2002 58/68
Figure 21: Net benefit matrix, three segments
Very Poor Poor Non-poor
Targeting segment
T r u e p o v e r
t y
s t a t u s
α βVery Poor
δ εPoor
γ
ζ
Non-poorη θ ι
Figure 22: Classification results, very poor/poor cut-offs from 0 to 44 and
poor/non-poor cut-offs from 5 to 49
8/8/2019 Scoring Poverty Philippines 2002
http://slidepdf.com/reader/full/scoring-poverty-philippines-2002 59/68
57
poor/non poor cut offs from 5 to 49 Upper bound, poor segment
5-9 10-14 15-19 20-24 25-29 30-34 35-39 40-44
12 24 301 12 53 272 12 85 239 12 119 205 12 157 168 12 194 130 12 227 98 12 258 670-4 2 4 291 2 18 277 2 28 267 2 44 251 2 74 221 2 120 175 2 154 141 2 190 105
0 2 1,340 0 6 1,336 0 9 1,333 0 23 1,319 0 44 1,298 0 68 1,275 0 139 1,204 0 210 1,132
36 29 272 36 61 239 36 95 205 36 133 168 36 170 130 36 203 98 36 234 67
5-9 6 14 277 6 25 267 6 40 251 6 71 221 6 116 175 6 150 141 6 186 105
2 4 1,336 2 7 1,333 2 21 1,319 2 42 1,298 2 65 1,275 2 136 1,204 2 208 1,132
65 32 239 65 66 205 65 104 168 65 141 130 65 174 98 65 204 67
10-14 20 10 267 20 26 251 20 56 221 20 102 175 20 136 141 20 172 105
6 3 1,333 6 17 1,319 6 38 1,298 6 62 1,275 6 133 1,204 6 204 1,132
97 34 205 97 71 168 97 109 130 97 142 98 97 172 67
15-19 30 16 251 30 46 221 30 91 175 30 126 141 30 162 105
9 14 1,319 9 35 1,298 9 59 1,275 9 130 1,204 9 201 1,132
131 37 168 131 75 130 131 108 98 131 138 67
20-24 46 30 221 46 76 175 46 110 141 46 146 105
23 21 1,298 23 44 1,275 23 115 1,204 23 187 1,132
168 38 130 168 70 98 168 101 67
25-29 76 45 175 76 80 141 76 116 105
44 24 1,275 44 95 1,204 44 166 1,132
206 33 98 206 63 67
30-34 122 34 141 122 70 10568 71 1,204 68 142 1,132
239 31 67
35-39 156 36 105
139 71 1,132
40-44
45-49
U p p e r
b o u n d , v e r y p o o r s e g m e n t
Figures in units of 10,000 people.
Figure 22 (cont.): Classification results, very poor/poor cut-offs from 0 to 49
and poor/non-poor cut-offs from 50 to 100
8/8/2019 Scoring Poverty Philippines 2002
http://slidepdf.com/reader/full/scoring-poverty-philippines-2002 60/68
58
p / pUpper bound, poor segment
50-54 55-59 60-64 65-69 70-74 75-79 80-84 85-89
12 299 26 12 306 19 12 314 11 12 319 6 12 321 3 12 324 1 12 325 0 12 325 0 120-4 2 246 49 2 258 37 2 267 28 2 282 13 2 290 5 2 293 2 2 295 0 2 295 0 2
0 399 944 0 463 880 0 618 724 0 793 550 0 933 409 0 1,066 276 0 1,226 117 0 1,293 49 0
36 275 26 36 282 19 36 290 11 36 295 6 36 297 3 36 300 1 36 301 0 36 301 0 36
5-9 6 243 49 6 254 37 6 263 28 6 278 13 6 286 5 6 289 2 6 291 0 6 291 0 6
2 396 944 2 460 880 2 616 724 2 790 550 2 931 409 2 1,064 276 2 1,223 117 2 1,291 49 2
65 246 26 65 253 19 65 261 11 65 266 6 65 268 3 65 270 1 65 272 0 65 272 0 65
10-14 20 228 49 20 240 37 20 249 28 20 264 13 20 272 5 20 275 2 20 277 0 20 277 0 20
6 393 944 6 456 880 6 612 724 6 786 550 6 927 409 6 1,060 276 6 1,220 117 6 1,287 49 6
97 214 26 97 220 19 97 229 11 97 233 6 97 236 3 97 238 1 97 239 0 97 239 0 97
15-19 30 218 49 30 230 37 30 239 28 30 254 13 30 262 5 30 265 2 30 267 0 30 267 0 309 390 944 9 453 880 9 609 724 9 783 550 9 924 409 9 1,057 276 9 1,217 117 9 1,284 49 9
131 180 26 131 186 19 131 195 11 131 199 6 131 202 3 131 204 1 131 205 0 131 205 0 131
20-24 46 202 49 46 214 37 46 223 28 46 238 13 46 246 5 46 249 2 46 251 0 46 251 0 46
23 375 944 23 439 880 23 594 724 23 769 550 23 910 409 23 1,043 276 23 1,202 117 23 1,270 49 23
168 142 26 168 149 19 168 157 11 168 162 6 168 165 3 168 167 1 168 168 0 168 168 0 168
25-29 76 172 49 76 184 37 76 193 28 76 208 13 76 216 5 76 219 2 76 221 0 76 221 0 76
44 355 944 44 419 880 44 574 724 44 749 550 44 890 409 44 1,022 276 44 1,182 117 44 1,250 49 44
206 105 26 206 111 19 206 120 11 206 124 6 206 127 3 206 129 1 206 130 0 206 130 0 206
30-34 122 127 49 122 138 37 122 147 28 122 162 13 122 170 5 122 173 2 122 175 0 122 175 0 122
68 331 944 68 395 880 68 550 724 68 725 550 68 866 409 68 999 276 68 1,158 117 68 1,226 49 68
239 72 26 239 79 19 239 87 11 239 92 6 239 94 3 239 97 1 239 98 0 239 98 0 239
35-39 156 92 49 156 104 37 156 113 28 156 128 13 156 136 5 156 139 2 156 141 0 156 141 0 156
139 260 944 139 324 880 139 479 724 139 654 550 139 795 409 139 928 276 139 1,087 117 139 1,155 49 139
269 41 26 269 48 19 269 56 11 269 61 6 269 64 3 269 66 1 269 67 0 269 67 0 269
40-44 192 56 49 192 68 37 192 77 28 192 92 13 192 100 5 192 103 2 192 105 0 192 105 0 192
210 189 944 210 253 880 210 408 724 210 583 550 210 723 409 210 856 276 210 1,016 117 210 1,083 49 210
291 20 26 291 27 19 291 35 11 291 40 6 291 42 3 291 45 1 291 46 0 291 46 0 291
45-49 214 34 49 214 46 37 214 55 28 214 70 13 214 78 5 214 81 2 214 83 0 214 83 0 214
296 103 944 296 166 880 296 322 724 296 496 550 296 637 409 296 770 276 296 930 117 296 997 49 296
Figures in units of 10,000 people.
Figure 22 (cont.): Classification results, very poor/poor cut-offs from 50 to 94
and poor/non-poor cut-offs from 55 to 100
8/8/2019 Scoring Poverty Philippines 2002
http://slidepdf.com/reader/full/scoring-poverty-philippines-2002 61/68
59
p / p55-59 60-64 65-69 70-74 75-79 80-84 85-89
311 7 19 311 15 11 311 20 6 311 23 3 311 25 1 311 26 0 311 26 0
50-54 248 12 37 248 21 28 248 36 13 248 44 5 248 47 2 248 49 0 248 49 0399 64 880 399 219 724 399 394 550 399 535 409 399 668 276 399 827 117 399 895 49
317 8 11 317 13 6 317 16 3 317 18 1 317 19 0 317 19 0
55-59 260 9 28 260 24 13 260 32 5 260 35 2 260 37 0 260 37 0
463 155 724 463 330 550 463 471 409 463 604 276 463 763 117 463 831 49
326 5 6 326 8 3 326 10 1 326 11 0 326 11 0
60-64 269 15 13 269 23 5 269 26 2 269 28 0 269 28 0
618 175 550 618 316 409 618 449 276 618 608 117 618 676 49
330 3 3 330 5 1 330 6 0 330 6 0
65-69 284 8 5 284 11 2 284 13 0 284 13 0
793 141 409 793 274 276 793 433 117 793 501 49333 2 1 333 3 0 333 3 0
70-74 292 3 2 292 5 0 292 5 0
934 133 276 934 292 117 934 360 49
335 1 0 335 1 0
75-79 295 2 0 295 2 0
1,066 159 117 1,066 227 49
336 0 0
80-84 297 0 0
1,226 68 49
85-89
90-94
U p p e r
b o u n d , v e r y p o o r s e g m e n t
Figures in units of 10,000 people.
Figure 23: Classification results, very poor 0–24,
8/8/2019 Scoring Poverty Philippines 2002
http://slidepdf.com/reader/full/scoring-poverty-philippines-2002 62/68
poor 25–34, and non-poor 35–100
Segment Score
0-4 12 2 0
5-9 24 4 2
Very poor 10-14 131 29 46 14 23 4
0-24 15-19 65% 32 23% 10 12% 3
20-24 34 16 14
Poor 25-29 75 37 76 30 44 2125-34 30-34 38% 38 39% 45 23% 24
35-39 33 34 71
40-44 31 36 71
45-49 21 22 86
50-54 20 34 103
55-59 7 12 64
Non-poor 60-64 130 8 175 9 1,275 155
35-100 65-69 8% 5 11% 15 81% 175
70-74 3 8 141
75-79 2 3 133
80-84 1 2 159
85-89 0 0 68
90-94 0 0 23
95-100 0 0 26
Total: 336 297 1,342
Counts of people are in units of 10,000.
People with score in rangeVery Poor Poor Non-poor
Figure 24: An example net-benefit matrix
8/8/2019 Scoring Poverty Philippines 2002
http://slidepdf.com/reader/full/scoring-poverty-philippines-2002 63/68
reflecting common values
Very Poor Poor Non-poor
Targeting segment
-2Poor
T r u e p o v e r t y
s t a t u s
+3 -2 -6Very Poor
-1 +1-2
-1 +2
Non-poor
Note: This is an example. Each program should define its own net-benefit matrix.
Figure 25: Computation of total net benefit for a

8/8/2019 Scoring Poverty Philippines 2002
http://slidepdf.com/reader/full/scoring-poverty-philippines-2002 64/68
cut-off pair of 20–24 and 30–34Cell Persons Net benefit/person Net benefit
A. Truly very poor as very poor 131 +3 +393
B. Truly very poor as poor 75 –2 –150
C. Truly very poor as non-poor 130 –6 –780
D. Truly poor as very poor 46 –1 –46
E. Truly poor as poor 76 +2 +152
F. Truly poor as non-poor 175 –2 –350
G. Truly non-poor as very poor 23 –2 –46H. Truly non-poor as poor 44 –1 –44
I. Truly non-poor as non-poor 1,275 +1 +1,275
Total net benefit: +404
Note: Persons are counted in units of 10,000.
Figure 26: Poverty likelihoods for the very poor, poor, $4/day poor,
8/8/2019 Scoring Poverty Philippines 2002
http://slidepdf.com/reader/full/scoring-poverty-philippines-2002 65/68
63
and non-poor by score
Score Very Poor Poor Poor $4/day Non-poor Very Poor Poor Poor $4/day Non-poor
0-4 85.0 14.3 0.4 0.4 85.0 14.3 0.4 0.4
5-9 79.7 12.8 4.4 3.2 81.3 13.3 3.1 2.3
10-14 61.9 30.0 6.3 1.8 71.3 21.9 4.8 2.015-19 70.5 22.9 4.5 2.1 71.0 22.3 4.7 2.0
20-24 53.2 24.4 12.8 9.5 65.4 22.9 7.3 4.4
25-29 42.4 34.4 14.4 8.8 58.3 26.4 9.5 5.8
30-34 35.2 42.6 13.1 9.2 52.1 30.8 10.4 6.7
35-39 23.8 24.8 23.1 28.3 44.8 29.2 13.7 12.3
40-44 22.2 26.1 22.6 29.1 40.1 28.6 15.5 15.7
45-49 16.5 17.1 27.0 39.4 36.3 26.7 17.4 19.6
50-54 12.6 21.8 18.6 47.0 32.4 25.9 17.6 24.1
55-59 8.4 14.2 19.8 57.7 30.5 25.0 17.8 26.7
60-64 4.7 5.4 20.6 69.4 26.8 22.2 18.2 32.8
65-69 2.5 7.6 14.5 75.4 23.5 20.2 17.6 38.7
70-74 1.7 5.2 11.8 81.2 21.4 18.7 17.1 42.8
75-79 1.6 2.2 4.5 91.7 19.8 17.4 16.1 46.8
80-84 0.7 1.4 2.4 95.5 18.1 16.0 14.9 51.1
85-89 0.0 0.0 0.8 99.2 17.5 15.4 14.4 52.7
90-94 0.0 0.0 0.2 99.8 17.3 15.2 14.2 53.3
95-100 0.0 0.0 0.7 99.3 17.0 15.0 14.0 53.9
Total: 17.0 15.0 14.0 53.9
Poverty likelihood in score range Share of cases <= score
Figure 27: Confidence intervals for estimated poverty likelihoods for
$ /
8/8/2019 Scoring Poverty Philippines 2002
http://slidepdf.com/reader/full/scoring-poverty-philippines-2002 66/68
64
being $4/day-or-less poor associated with scores
0
5
10
15
20
25
30
35
40
45
50
55
6065
70
75
80
85
90
95
100
0-4 5-9 10-14 15-19 20-24 25-29 30-34 35-39 40-44 45-49 50-54 55-59 60-64 65-69 70-74 75-79 80-84 85-89 90-94 95-
100Range of score
P o v e r t y l i k e
l i h o o d ( m e a n , 9 0 - , 9 5 - , 9 9 - p e r c e n t
t w o -
s i d e d c o n f i d e n c e i n t
e r v a l s )
Upper 99% bound
Upper 95% bound
Upper 90% bound
Mean
Lower 90% bound
Lower 95% bound
Lower 99% bound
Average confidence intervals
across scores, weighted by
persons (+/- percentage points):
90: 5.2
95: 6.3
99: 8.3
Figure 28: Differences between estimated and true poverty likelihoods
f h $4/d l
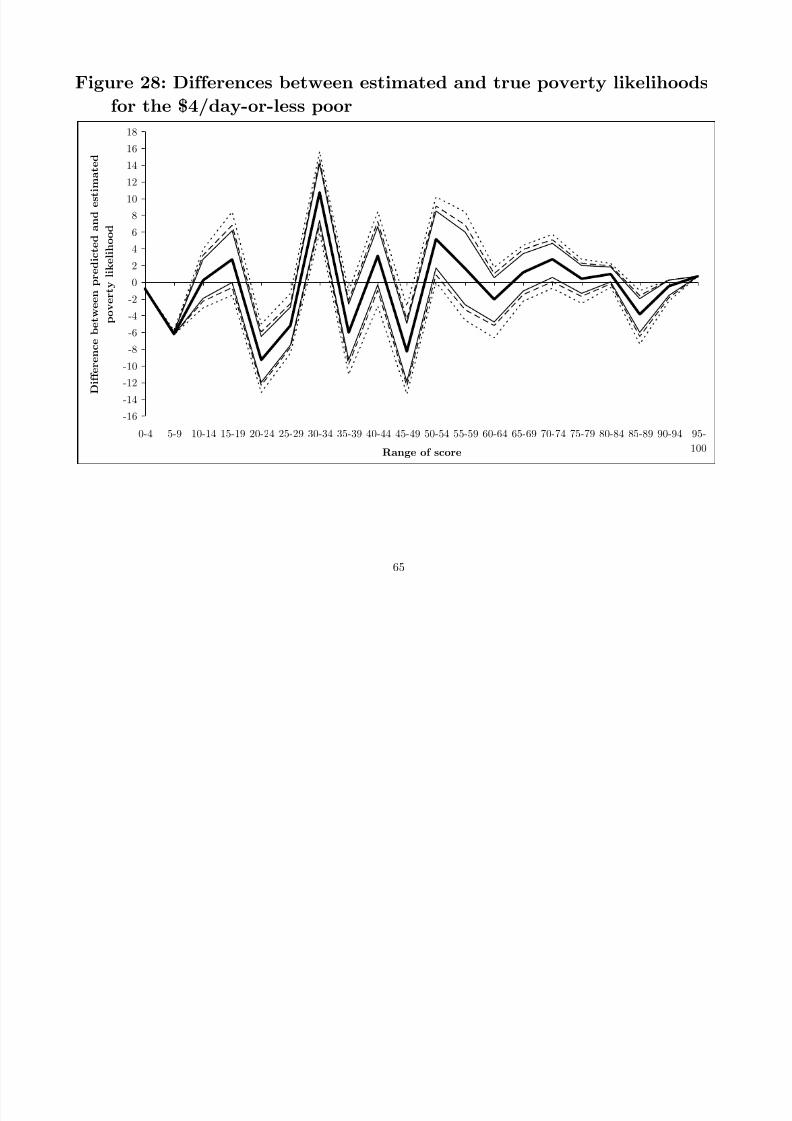
8/8/2019 Scoring Poverty Philippines 2002
http://slidepdf.com/reader/full/scoring-poverty-philippines-2002 67/68
65
for the $4/day-or-less poor
-16
-14
-12
-10
-8-6
-4
-2
0
2
4
6
8
10
12
14
16
18
0-4 5-9 10-14 15-19 20-24 25-29 30-34 35-39 40-44 45-49 50-54 55-59 60-64 65-69 70-74 75-79 80-84 85-89 90-94 95-
100Range of score
D i f f e r e n c e
b e t w e e n p r e d i c t e d a
n d e s t i m a t e d
p o v e r t y l i k e l i h o o d
Figure 29: ROC curve of ability to rank-order households by
$4/d l t t t
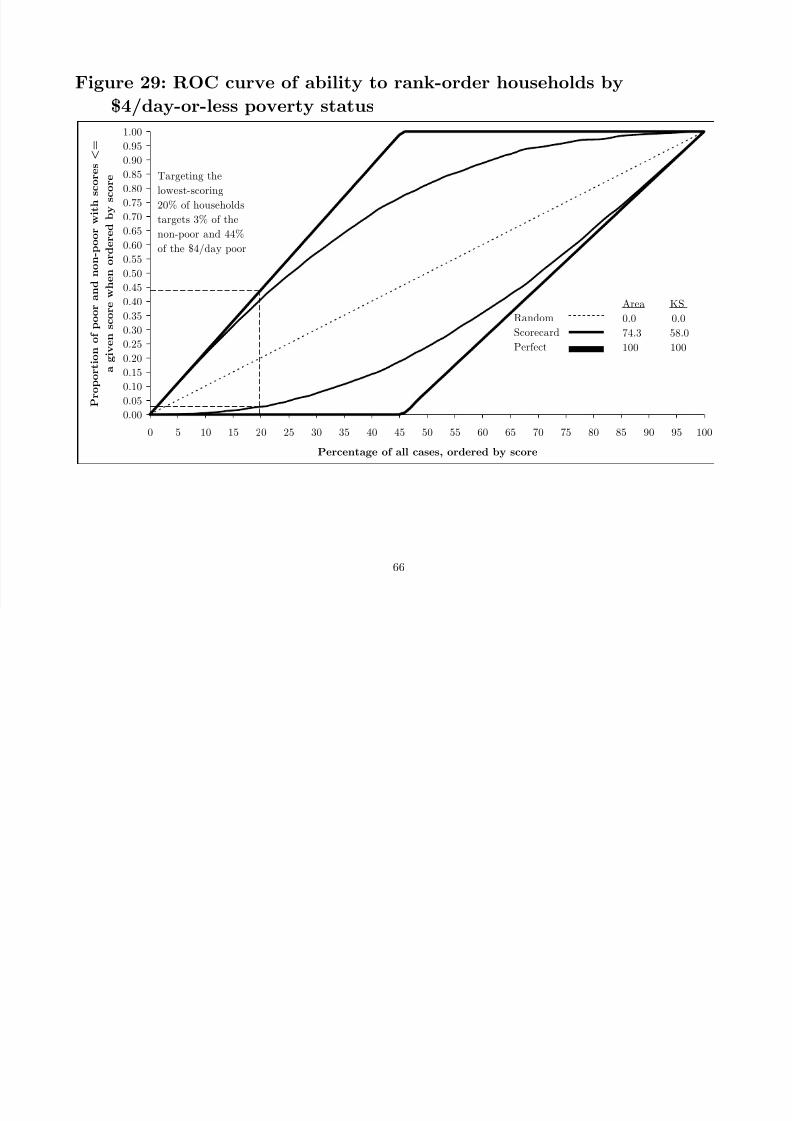
8/8/2019 Scoring Poverty Philippines 2002
http://slidepdf.com/reader/full/scoring-poverty-philippines-2002 68/68
66
$4/day-or-less poverty status
0.00
0.05
0.10
0.15
0.20
0.25
0.30
0.35
0.40
0.45
0.50
0.55
0.600.65
0.70
0.75
0.80
0.85
0.90
0.95
1.00
0 5 10 15 20 25 30 35 40 45 50 55 60 65 70 75 80 85 90 95 100
Percentage of all cases, ordered by score
P r o p o r t i o n o f p o o r a n d n o n - p o o r
w i t h s c o r e s < =
a g i v e n
s c o r e w h e n o r d e r e d b y s c o r e
Random
ScorecardPerfect
Area KS
0.0 0.0
74.3 58.0100 100
Targeting the
lowest-scoring
20% of households
targets 3% of the
non-poor and 44%of the $4/day poor