screening analysis for the environmental risk evaluation ......the environmental risk evaluation...
TRANSCRIPT

PNNL-20962
Prepared for the U.S. Department of Energy under Contract DE-AC05-76RL01830
Screening Analysis for the Environmental Risk Evaluation System Fiscal Year 2011 Report Environmental Effects of Offshore Wind Energy AE Copping LA Hanna November 2011

Choose a Disclaimer or go to https://hdi-sa.pnl.gov/standard/85/8504e010.htm (shortcut information below will disappear when disclaimer is selected) Main Body Shortcuts Ctrl+Shift+Alt+N = new section Alt+F = Figure Caption Alt+T = Table Caption Ctrl+Shift+Alt+L = new landscaped page (check page numbering and fix odd section break if needed) Appendix Shortcuts Ctrl+Shift+Alt+A = new appendix Ctrl+Shift+Alt+T = Appendix Table Caption Ctrl+Shift+Alt+F = Appendix Figure Caption Ctrl+Shift+Alt+L = new landscaped page (check page numbering and fix odd section break if needed) Style Shortcuts Alt+B = Body Text Alt+1 = Heading 1 Alt+2 = Heading 2 Alt+3 = Heading 3 Alt+4 = Heading 4 Alt+5 = Heading 5 Alt+6 = Heading 6 Alt+7 = Heading 7 Alt+8 = Heading 8 Alt+9 = Heading 9 Alt+l = List Bullet Alt+; = List Bullet 2 Alt+’ = List Bullet 3 Enjoy!

PNNL-20962
Screening Analysis for the Environmental Risk Evaluation System
Fiscal Year 2011 Report Environmental Effects of Offshore Wind Energy AE Copping LA Hanna November 2011 Prepared for the U.S. Department of Energy under Contract DE-AC05-76RL01830 Pacific Northwest National Laboratory Richland, Washington 99352


iii
Summary
Potential environmental effects of offshore wind (OSW) energy development are not well understood, and yet regulatory agencies are required to make decisions in spite of substantial uncertainty about environmental impacts and their long-term consequences. An understanding of risks associated with interactions between OSW installations and avian and aquatic receptors, including animals, habitats, and ecosystems, can help define key uncertainties and focus regulatory actions and scientific studies on interactions of most concern. During FY 2011, Pacific Northwest National Laboratory (PNNL) scientists adapted and applied the Environmental Risk Evaluation System (ERES), first developed to examine the effects of marine and hydrokinetic energy devices on aquatic environments, to offshore wind development. PNNL scientists conducted a risk screening analysis on two initial OSW cases: a wind project in Lake Erie and a wind project off the Atlantic coast of the United States near Atlantic City, New Jersey.
The screening analysis revealed that top-tier stressors in the two OSW cases were the dynamic effects of the device (e.g., strike), accidents/disasters, and effects of the static physical presence of the device, such as alterations in bottom habitats. Receptor interactions with these stressors at the highest tiers of risk were dominated by threatened and endangered animals. Risk to the physical environment from changes in flow regime also ranked high. Peer review of this process and results will be conducted during FY 2012.
The ERES screening analysis provides an assessment of the vulnerability of environmental receptors to stressors associated with OSW installations; a probability analysis is needed to determine specific risk levels to receptors. As more data become available that document effects of offshore wind farms on specific receptors in U.S. coastal and Great Lakes waters, probability analyses will be performed.


v
Acronyms and Abbreviations
DOE U.S. Department of Energy
EMF electromagnetic field
ERES Environmental Risk Evaluation System
ESA Endangered Species Act of 1973
Fish Fishermen’s Energy
LEEDCo Lake Erie Energy Development Corporation
MBTA Migratory Bird Treaty Act of 1918
MMPA Marine Mammal Protection Act of 1972 as amended
MW megawatt(s)
NEPA National Environmental Policy Act of 1969
OSW offshore wind
PNNL Pacific Northwest National Laboratory
S–R stressor–receptor
T&E threatened and endangered


vii
Contents
Summary ............................................................................................................................................... iii
Acronyms and Abbreviations ............................................................................................................... v
1.0 Introduction .................................................................................................................................. 1.1
1.1 Environmental Risk Evaluation System ............................................................................... 1.1
1.2 Practical Application of ERES ............................................................................................. 1.3
1.2.1 ERES Template for Risk ........................................................................................... 1.4
1.2.2 Point of Departure for Developers and Regulators ................................................... 1.4
1.2.3 Early Feedback on Siting and Engineering ............................................................... 1.5
1.2.4 Input to Mitigation Strategies .................................................................................... 1.5
1.3 ERES Progress Report Organization .................................................................................... 1.5
2.0 Methods ........................................................................................................................................ 2.1
2.1 Identification of Initial Cases ............................................................................................... 2.1
2.1.1 Fishermen’s Energy ................................................................................................... 2.2
2.1.2 Lake Erie Energy Development Corporation ............................................................ 2.2
2.2 Identification of Risk-Relevant Stressors and Receptors and Description of Impact Scenarios .......................................................................................... 2.2
2.3 Ranking Highest-Priority Risks for Each Case .................................................................... 2.4
3.0 Results .......................................................................................................................................... 3.1
4.0 Discussion ..................................................................................................................................... 4.1
5.0 Next Steps in Risk Assessment .................................................................................................... 5.1
6.0 References .................................................................................................................................... 6.1
Appendix – Details of the Ranking Process and Intermediate Results Tables ..................................... A.1

viii
Figures
1.1 Elements of Risk Management ..................................................................................................... 1.1
1.2 Description of Risk ....................................................................................................................... 1.2
1.3 Risk-Informed Analytical Process ................................................................................................ 1.4
Tables
2.1 Criteria for Choosing Offshore Wind Projects as Cases for Initial Screening Analysis During FY 2011 .................................................................................. 2.1
2.2 Stressors Associated with Offshore Wind Technology ................................................................ 2.3
2.3 Environmental Receptors Vulnerable to Offshore Wind Technology .......................................... 2.4
2.4 Biophysical Risk Factors .............................................................................................................. 2.5
2.5 Regulatory Risk Factors ................................................................................................................ 2.6
2.6 Vulnerable Receptor Groups and the Species or Habitats Used as Representative Examples for Risk Analysis for Each Case .......................................................... 2.7
3.1 Relative Biophysical Rank of Stressor–Receptor Interactions for Fishermen’s Energy Case Study ................................................................................................... 3.1
3.2 Relative Biophysical Rank of Stressor–Receptor Interactions for LEEDCo Case Study .................................................................................................................... 3.3
3.3 Top Tiers of Environmental Consequence for Stressor–Receptor Pairs for the Two Cases ......................................................................................................................... 3.4

1.1
1.0 Introduction
Deployment of offshore wind (OSW) energy in U.S. waters requires all appropriate regulatory requirements be met and that stakeholder concerns be taken into account. However, there is still considerable uncertainty surrounding the complex regulatory pathway to deployment, and how best to approach the myriad stakeholder concerns over potential environmental harm. Pacific Northwest National Laboratory (PNNL) has been tasked by the U.S. Department of Energy (DOE) to assist in setting priorities for focused environmental regulatory scrutiny and to recommend the most pertinent and useful research that supports that scrutiny.
A key step in setting environmental regulatory and research priorities is the assignment of risk to interactions between offshore wind installations and avian and aquatic receptors, including animals, habitats, and ecosystems in the marine and lake waters where offshore wind development is feasible. For the purpose of this analysis, risk is defined as the likelihood of a prescribed adverse outcome from an action or set of actions. Risk assessment is the process of evaluating scientific information to estimate the probability of occurrence of the action and the severity of the effect (EPA 2011).
1.1 Environmental Risk Evaluation System
The Environmental Risk Evaluation System (ERES) under development by PNNL is a risk-informed approach that can be used to assist regulators, decision-makers, and stakeholders to assess their tolerance toward risk, set priorities for research activities, and compare the costs and benefits of different offshore wind installation options. Figure 1.1 shows the steps used for management of risks in engineered and natural systems management.
Figure 1.1. Elements of Risk Management
Analysis
Evaluation
Control
Communication
Research
Monitoring
Determining risks and uncertainties
Identifying risk and uncertainty drivers. Assessing risk and uncertainty-reduction options
Reducing uncertainties Reducing and controlling risks
Communicating risks and their management to stakeholders
Ongoing confirmation of assumptions about risk

1.2
The risk assessment process begins with the identification and description of scenarios that result from sequences of events that lead to adverse impacts (Figure 1.2). It is useful to distinguish between scenarios that are episodic and, at the other end of the spectrum, those that are chronic. Episodic scenarios involve events that may or may not take place and are thus characterized by their likelihood or rate of occurrence. They are also characterized by the degree of impact or severity of their consequences. An example of an episodic scenario would be collision of a vessel with an offshore wind piling, resulting in an oil spill. The likelihood of occurrence is related to factors such as vessel traffic volume, the proximity of shipping lanes to the offshore wind devices, and weather conditions. Consequences could include environmental damage due to spills and financial loss due to damaged property or loss of generation of power. In contrast, chronic risk scenarios involve events or circumstances that are continuous, so that risk characterization involves assessing only the severity of the consequences. An example of a chronic risk scenario would be the toxicity to aquatic organisms from the low-level chemical release from anti-biofouling paints and coatings used on wind turbine foundations. Between these two extremes there are intermittent events, such as encounters between birds and rotating turbine blades, which occur when the blades are turning and birds are present. A key feature of understanding risk is describing the uncertainty associated with the occurrence of an episodic, intermittent, or chronic event, as well as the uncertainty of the resulting consequences.
Figure 1.2. Description of Risk
In discussing risk in the context of offshore wind projects, it is important to separate the key types of risk:
• environmental risk – risk to all living organisms including humans, and to the physical and chemical processes that support living systems

1.3
• regulatory risk – risk to offshore wind permitting and approvals due to regulations and their implementation
• investment risk – risk to capital investment due to regulatory, legal, or market forces.
ERES addresses environmental risk; however, it is important to note that regulatory and investment risk can be driven by environmental risk. The National Environmental Policy Act of 1969 (NEPA) will apply to the development of all offshore wind projects in U.S. waters. Although NEPA is procedural, unlike many other standard-or threshold driven applicable environmental laws and regulations, it has the potential to stop or significantly slow a permitting process.
The initial steps in creating ERES involved a screening analysis to determine the highest-priority interactions between stressors (offshore wind turbines and associated structures that may adversely affect avian and aquatic receptors) and receptors (avian and aquatic animals, habitats, and ecosystems). The results of the screening analysis will direct more detailed risk modeling studies. The screening analysis methodology developed by PNNL is tailored to the unique needs of a multivariate set of interactions among many different types of stressors and a diverse group of receptors. Standardized risk assessment methodologies are not well suited to assessing and setting priorities for interactions as diverse as electromagnetic field (EMF) stress on sea turtles, the potential for blade strike on birds and bats, and the potential effect of energy removal on nearshore features.
Figure 1.3 shows the risk assessment process developed by PNNL. The initial steps in the process carried out during FY11 consisted of a case selection process (blue box) and screening analysis (green box). This report details the process through screening analysis on the initial two cases chosen for FY11. Screening analysis consists of consequence analysis (first light green box) and scoping for probability modeling (second light green box). Refined characterization of priority risks identified through screening analysis will be further evaluated (purple box) through probability modeling (first light purple box) in cases for which environmental data are available and expertise-based probability modeling (second light purple box) in cases for which data are not yet available. Probability modeling will be first conducted on top-ranked stressor–receptor interactions that appear to be most highly affected by the probability of occurrence (i.e., most probability-dependent interactions). With input and review from stakeholders, the outcome of the screening analysis and refined risk characterization will establish a rigorous process of evaluating risk based on real offshore wind development cases and incorporating new stressor–receptor information as it becomes available.
1.2 Practical Application of ERES
ERES is under development by PNNL in order to assist with setting priorities for siting and permitting of OSW farms; this priority-setting is one important step in facilitating and streamlining the process of getting turbines in the water. The lack of adequate datasets with which to model probabilities of occurrence of the most severe consequences of stressor–receptor (S–R) interactions hampers our ability to calculate risk at this time. However, by addressing real OSW development cases early, several advantages and processes can be set in motion, as listed below and described in the following paragraphs:
• developing a template for risk calculation
• providing a point of departure for developers and regulators

1.4
• providing early feedback to developers to improve siting, design or operational methods
• providing input for mitigation strategies.
Figure 1.3. Risk-Informed Analytical Process
1.2.1 ERES Template for Risk
Results of ERES cases for consequence analysis are being entered into Tethys, the knowledge management system developed to house and make accessible information on environmental effects of offshore wind development. The output of ERES cases for consequence analysis consists of estimates of interactions informed by expert opinion, scientific literature pertinent to other fields, and studies from other regions. As monitoring data become available, these estimates will be replaced with data that detail the actual risks (consequence plus probability) for key stressor–receptor interactions. At this point, the cumulative risk for elements of OSW farm development on important avian and aquatic receptors can be determined. Tethys will provide a portal for information on all aspects of environmental effects of OSW farms, making results readily available. In addition to results of analyses like ERES, Tethys will also support datasets of S–R interactions from laboratory studies, modeling runs, and project monitoring activities, as well as supporting literature, reports, and government findings.
1.2.2 Point of Departure for Developers and Regulators
ERES is not intended to be a decision system, nor as a means to replace the judgment or decisions of regulators, developers or stakeholders. Instead, ERES provides a transparent look at the most important S–R interactions from the biophysical and the regulatory perspective, allowing discussions to focus on risks that require scrutiny and perhaps mitigation, and minimizing focus on perceived risks. Stakeholders commonly raise concerns about potential risks of OSW development due to fears and uncertainties that may not be evidentiary-based. Parsing the concerns about S–R interactions into those where uncertainty requires further investigation, versus those for which ample understanding of the avian and aquatic environment exists can streamline of the discussion and support the permitting process. Similarly,

1.5
elucidating environmental risks from those that arise due to fears about access to fisheries, conflicts with recreational opportunities, and other stakeholder concerns, can help developers and regulators understand the optimum path forward. ERES seeks to understand and elucidate environmental risks. Currently the spectrum of risk cannot be fully described for the initial cases; however, the ranking of S–R consequences is providing developers and regulators the opportunity to begin a rational discussion.
1.2.3 Early Feedback on Siting and Engineering
Through the identification and ranking of priority S–R pairs for OSW farm cases, developers gain insight into spatial interactions between their wind turbines, mooring structures, and power systems that are problematic with respect to key avian and aquatic animals and habitats. Similarly, ERES pinpoints those portions of the OSW farms hardware and operations that are most likely to cause risk to key receptors. With this information in hand, developers have the opportunity to adjust siting locations, engineering designs, and operational procedures before turbines go in the water, decreasing points of friction with regulators and stakeholders. By proactively making adjustments to lower risk to avian and aquatic receptors, developers avoid the first steps in a chain of contention, potentially leading to costly studies, mitigation, and litigation.
1.2.4 Input to Mitigation Strategies
The ultimate outcome of ERES is to provide a ranked list of the highest priority risks from OSW farms to avian and aquatic receptors. Many of the highest ranked S–R interactions calculated for OSW cases will decrease in importance as additional data and probability calculations determine a lowered risk profile. Those high-risk interactions that remain after further elucidation will form the basis for mitigation required by regulators. Understanding the specific scenarios that lead to these high-priority risks, and mapping those risks to specific portions of OSW infrastructure and equipment, will allow for targeted development of mitigation strategies that ameliorate those stresses in the most cost-effective and efficacious manner possible. Examples of these mitigation strategies include understanding whether diving birds and shorebirds are more likely to be harmed by OSW devices than are migratory seabirds; mitigation strategies might include incremental siting of OSW farms further from resting and foraging areas for diving birds and shorebirds but without the need to distance farms from seabird flyways. Alternatively, if one portion of the EMF spectrum from power cables (i.e., magnetic or induced electrical fields; AC or DC fields) is shown to be harmful to marine life, that portion of the EMF spectrum can be shielded or reduced without the need to shield and change all portions of the electrical and magnetic output.
1.3 ERES Progress Report Organization
In this report, the methods used to conduct the screening analysis are detailed in Section 2. Results of the analysis are presented in Section 3 and discussed in Section 4. Section 5 presents a summary of next steps in the risk assessment process. References cited are listed in Section 6. An appendix provides additional details on the ranking process used in the analysis.


2.1
2.0 Methods
The methodology used to identify the two case studies and conduct the screening analyses is described in terms of four key tasks:
1. Identification and description of the two case studies chosen for FY11.
2. Identification of risk-relevant stressors and receptors and description of impact scenarios.
3. Develop ranking of highest priority risks for each case, focusing only on consequence.
4. Identification of high-priority risks for probability modeling.
It is important to note that in developing the S–R rankings through the ERES process, all S–R interactions were treated as being independent of one another, and the most severe yet reasonable consequences are assigned to each interaction.
2.1 Identification of Initial Cases
A case study approach was used to identify the relevant risks associated with the operation and maintenance offshore wind energy. The ERES cases drawn from proposed OSW projects, focusing on those that are progressing through the permitting and development process, using criteria originally developed for marine and hydrokinetic energy projects and discussed with members of the DOE Wind and Water Power Program, other national laboratories, OSW project developers, regulators, environmental organizations, and other stakeholders (Table 2.1). Applying the criteria from Table 2.1, two case studies—one in New Jersey, the other in Ohio—were chosen for FY11.
Table 2.1. Criteria for Choosing Offshore Wind Projects as Cases for Initial Screening Analysis During FY 2011. The criteria are listed in sequential order. Cases that received Yes or Sufficient for a criterion were passed on to the next criterion for consideration. Cases that received No or Insufficient for certain criteria were removed from consideration for FY 2011 but will be reconsidered at a later date.
Criterion Explanation of Criterion
1. Real/Readiness Project is expected to be in the water within 2 years; both the technology and the project are ready.
2. Developer Willingness Developer is willing to share technology and project data.
3. Diverse Representation The case helps span the analytical space: a. technology type (tidal, wave, river) b. technology configuration (e.g., axial flow, horizontal flow) c. climatic zone (temperate, tropical, sub-arctic)
4. National Interest For example, the project is likely to be among the first in the water in the United States
5. Available Data Environmental effects data are available.

2.2
2.1.1 Fishermen’s Energy
Fishermen’s Energy, a community-based offshore wind developer and consortium formed by principals of East Coast fishing companies, is developing a two-phase project consisting of two offshore wind farms off the coast of New Jersey. The first phase of the project, the smaller of the two, consists of roughly 693 acres located almost 3 miles off the coast of Atlantic City, New Jersey. The project will consist of eight 2.5-MW turbines oriented in a linear array with a total rated capacity of 20 MW of energy. The larger project is located in federal waters approximately 7 miles off the New Jersey coast, covering a proposed area of 20,000 acres and consisting of 66 turbines rated at approximately 330 MW. The smaller project in state waters forms the FY11 ERES case. Some of the key environmental concerns for this project are endangered and migratory birds such as the roseate tern and osprey, as well as the endangered Atlantic sturgeon and fin whale.
2.1.2 Lake Erie Energy Development Corporation
Lake Erie Energy Development Corporation (LEEDCo), a nonprofit economic development corporation, is developing an offshore wind pilot project in Lake Erie 7 miles northwest of Cleveland, Ohio. This project will consist of five to seven 4.1-MW turbines, with a total rated capacity of 20–30 MW of energy. Key receptors for this project consist of endangered birds (piping plover and common tern), the endangered Indiana bat, and the endangered lake sturgeon.
2.2 Identification of Risk-Relevant Stressors and Receptors and Description of Impact Scenarios
The ERES screening analysis is designed to evaluate the consequences of the interaction between the stressors and receptors at each of the chosen case study sites. Because most of the current offshore wind turbines share many similar design traits, seven stressors were recognized and applied to both cases (Table 2.2). Seven receptor groups (types of organisms or habitats interacting with offshore wind devices and the surrounding environment) were also applied to both case studies (Table 2.3). However, because each case is located in a different water body and reflects the ecology and environment of different regions, the specific animals or habitat receptors differed from case to case (Table 2.3).
In an attempt to fully understand the S–R interactions and environmental effects of offshore wind energy, a wide variety of recent studies and reports were consulted (Hiscock et al. 2002; Zucco et al. 2006; Norman et al. 2007). Several case-specific baseline environmental studies were also used to assist in this process (Driedger-Marschall et al. 2009; Geo-Marine, Inc. 2010). These studies provided additional information and data specific to each case and were useful in identifying specific receptors and the potential consequence each offshore wind farm could have on the receptors.
At the time this report was written, no offshore wind projects were deployed in the United States. However, as the demand for clean renewable energy has grown in Europe, offshore wind energy has been under development extensively there since 1991. Today, Europe is the world leader in offshore wind energy and has a capacity of roughly 2,300 MW installed (EWEA 2010). Monitoring data gathered from offshore wind farms in Europe were examined and are referenced in this report. Although some of these data do not directly pertain to the U.S. experience due to the different geographic locations, weather
2.3
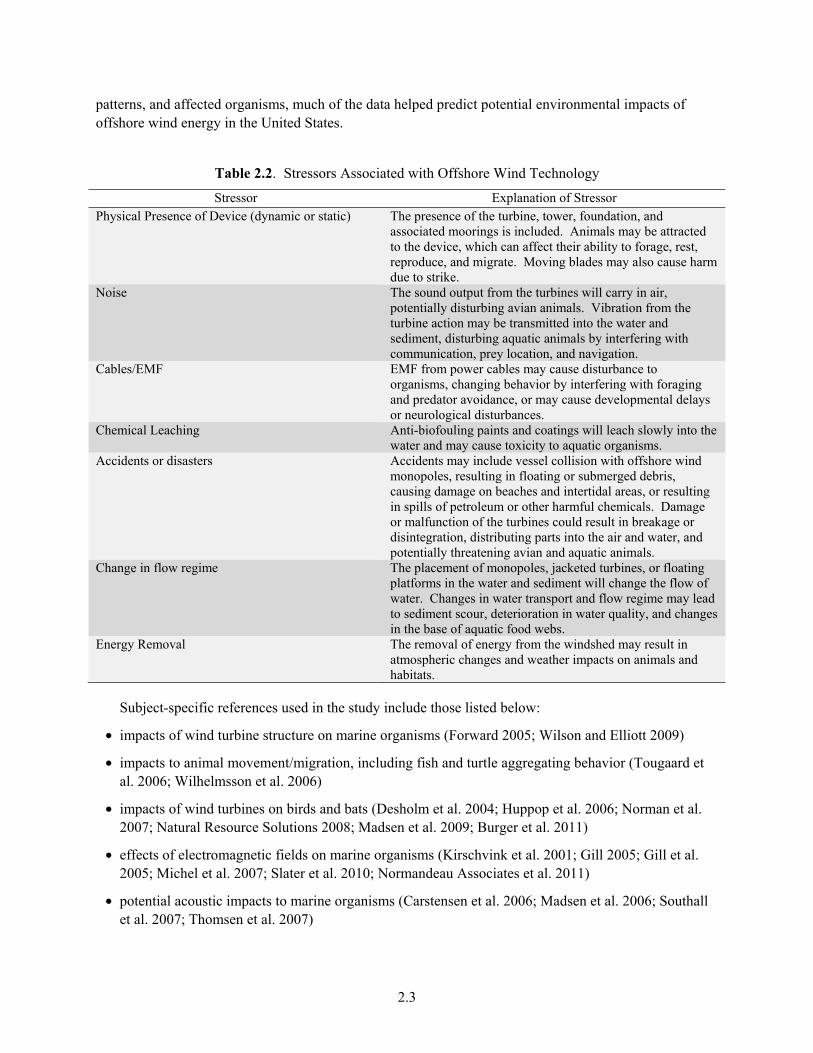
patterns, and affected organisms, much of the data helped predict potential environmental impacts of offshore wind energy in the United States.
Table 2.2. Stressors Associated with Offshore Wind Technology
Stressor Explanation of Stressor Physical Presence of Device (dynamic or static) The presence of the turbine, tower, foundation, and
associated moorings is included. Animals may be attracted to the device, which can affect their ability to forage, rest, reproduce, and migrate. Moving blades may also cause harm due to strike.
Noise The sound output from the turbines will carry in air, potentially disturbing avian animals. Vibration from the turbine action may be transmitted into the water and sediment, disturbing aquatic animals by interfering with communication, prey location, and navigation.
Cables/EMF EMF from power cables may cause disturbance to organisms, changing behavior by interfering with foraging and predator avoidance, or may cause developmental delays or neurological disturbances.
Chemical Leaching Anti-biofouling paints and coatings will leach slowly into the water and may cause toxicity to aquatic organisms.
Accidents or disasters Accidents may include vessel collision with offshore wind monopoles, resulting in floating or submerged debris, causing damage on beaches and intertidal areas, or resulting in spills of petroleum or other harmful chemicals. Damage or malfunction of the turbines could result in breakage or disintegration, distributing parts into the air and water, and potentially threatening avian and aquatic animals.
Change in flow regime The placement of monopoles, jacketed turbines, or floating platforms in the water and sediment will change the flow of water. Changes in water transport and flow regime may lead to sediment scour, deterioration in water quality, and changes in the base of aquatic food webs.
Energy Removal The removal of energy from the windshed may result in atmospheric changes and weather impacts on animals and habitats.
Subject-specific references used in the study include those listed below:
• impacts of wind turbine structure on marine organisms (Forward 2005; Wilson and Elliott 2009)
• impacts to animal movement/migration, including fish and turtle aggregating behavior (Tougaard et al. 2006; Wilhelmsson et al. 2006)
• impacts of wind turbines on birds and bats (Desholm et al. 2004; Huppop et al. 2006; Norman et al. 2007; Natural Resource Solutions 2008; Madsen et al. 2009; Burger et al. 2011)
• effects of electromagnetic fields on marine organisms (Kirschvink et al. 2001; Gill 2005; Gill et al. 2005; Michel et al. 2007; Slater et al. 2010; Normandeau Associates et al. 2011)
• potential acoustic impacts to marine organisms (Carstensen et al. 2006; Madsen et al. 2006; Southall et al. 2007; Thomsen et al. 2007)
2.4
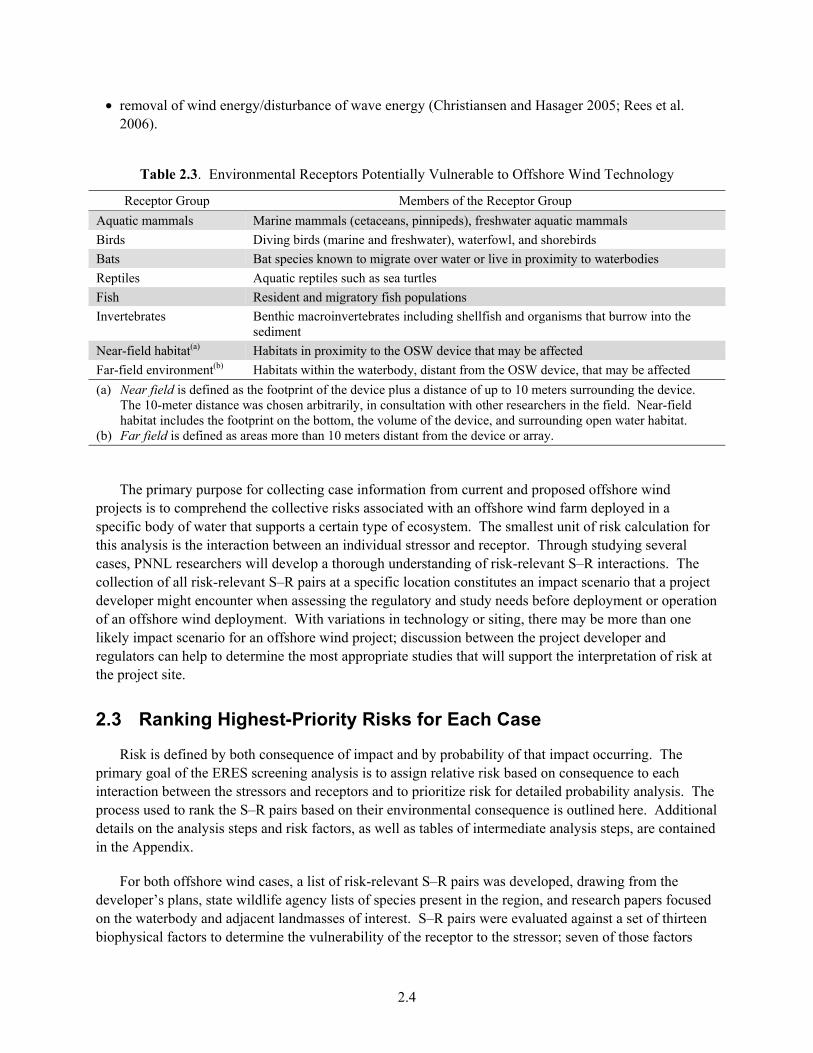
• removal of wind energy/disturbance of wave energy (Christiansen and Hasager 2005; Rees et al. 2006).
Table 2.3. Environmental Receptors Potentially Vulnerable to Offshore Wind Technology
Receptor Group Members of the Receptor Group
Aquatic mammals Marine mammals (cetaceans, pinnipeds), freshwater aquatic mammals
Birds Diving birds (marine and freshwater), waterfowl, and shorebirds
Bats Bat species known to migrate over water or live in proximity to waterbodies
Reptiles Aquatic reptiles such as sea turtles
Fish Resident and migratory fish populations
Invertebrates Benthic macroinvertebrates including shellfish and organisms that burrow into the sediment
Near-field habitat(a) Habitats in proximity to the OSW device that may be affected
Far-field environment(b) Habitats within the waterbody, distant from the OSW device, that may be affected
(a) Near field is defined as the footprint of the device plus a distance of up to 10 meters surrounding the device. The 10-meter distance was chosen arbitrarily, in consultation with other researchers in the field. Near-field habitat includes the footprint on the bottom, the volume of the device, and surrounding open water habitat.
(b) Far field is defined as areas more than 10 meters distant from the device or array.
The primary purpose for collecting case information from current and proposed offshore wind projects is to comprehend the collective risks associated with an offshore wind farm deployed in a specific body of water that supports a certain type of ecosystem. The smallest unit of risk calculation for this analysis is the interaction between an individual stressor and receptor. Through studying several cases, PNNL researchers will develop a thorough understanding of risk-relevant S–R interactions. The collection of all risk-relevant S–R pairs at a specific location constitutes an impact scenario that a project developer might encounter when assessing the regulatory and study needs before deployment or operation of an offshore wind deployment. With variations in technology or siting, there may be more than one likely impact scenario for an offshore wind project; discussion between the project developer and regulators can help to determine the most appropriate studies that will support the interpretation of risk at the project site.
2.3 Ranking Highest-Priority Risks for Each Case
Risk is defined by both consequence of impact and by probability of that impact occurring. The primary goal of the ERES screening analysis is to assign relative risk based on consequence to each interaction between the stressors and receptors and to prioritize risk for detailed probability analysis. The process used to rank the S–R pairs based on their environmental consequence is outlined here. Additional details on the analysis steps and risk factors, as well as tables of intermediate analysis steps, are contained in the Appendix.
For both offshore wind cases, a list of risk-relevant S–R pairs was developed, drawing from the developer’s plans, state wildlife agency lists of species present in the region, and research papers focused on the waterbody and adjacent landmasses of interest. S–R pairs were evaluated against a set of thirteen biophysical factors to determine the vulnerability of the receptor to the stressor; seven of those factors
2.5
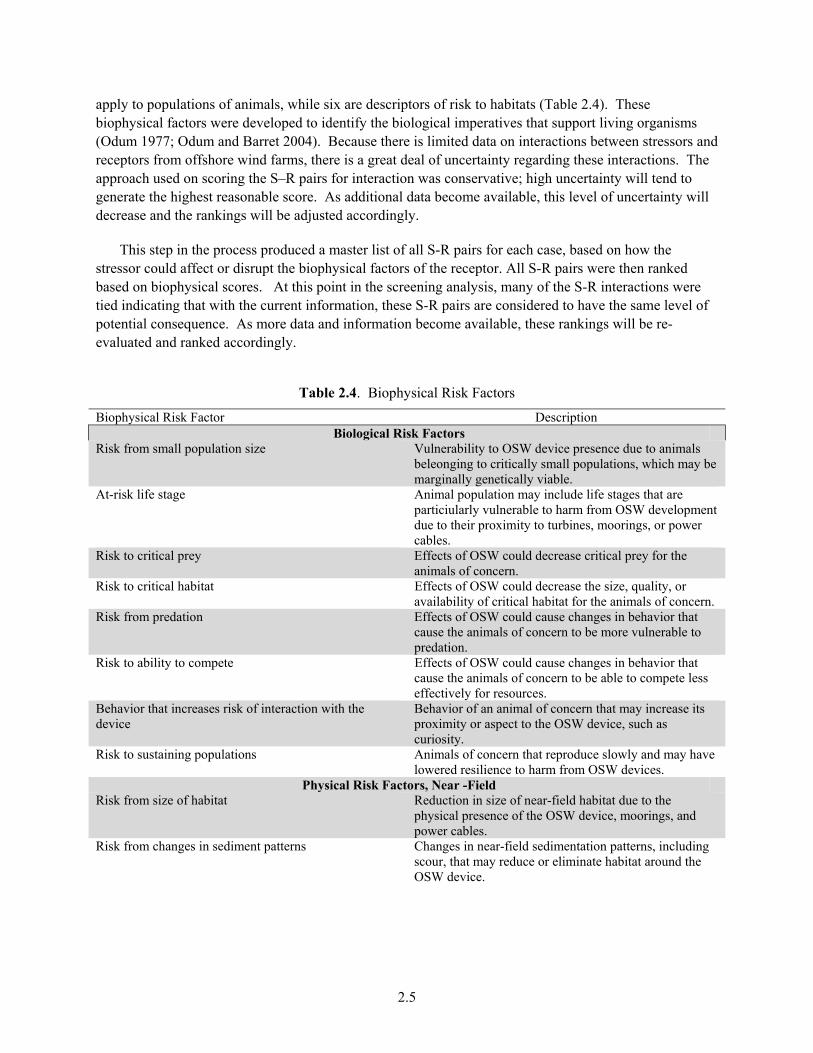
apply to populations of animals, while six are descriptors of risk to habitats (Table 2.4). These biophysical factors were developed to identify the biological imperatives that support living organisms (Odum 1977; Odum and Barret 2004). Because there is limited data on interactions between stressors and receptors from offshore wind farms, there is a great deal of uncertainty regarding these interactions. The approach used on scoring the S–R pairs for interaction was conservative; high uncertainty will tend to generate the highest reasonable score. As additional data become available, this level of uncertainty will decrease and the rankings will be adjusted accordingly.
This step in the process produced a master list of all S-R pairs for each case, based on how the stressor could affect or disrupt the biophysical factors of the receptor. All S-R pairs were then ranked based on biophysical scores. At this point in the screening analysis, many of the S-R interactions were tied indicating that with the current information, these S-R pairs are considered to have the same level of potential consequence. As more data and information become available, these rankings will be re-evaluated and ranked accordingly.
Table 2.4. Biophysical Risk Factors
Biophysical Risk Factor Description Biological Risk Factors
Risk from small population size Vulnerability to OSW device presence due to animals beleonging to critically small populations, which may be marginally genetically viable.
At-risk life stage Animal population may include life stages that are particiularly vulnerable to harm from OSW development due to their proximity to turbines, moorings, or power cables.
Risk to critical prey Effects of OSW could decrease critical prey for the animals of concern.
Risk to critical habitat Effects of OSW could decrease the size, quality, or availability of critical habitat for the animals of concern.
Risk from predation Effects of OSW could cause changes in behavior that cause the animals of concern to be more vulnerable to predation.
Risk to ability to compete Effects of OSW could cause changes in behavior that cause the animals of concern to be able to compete less effectively for resources.
Behavior that increases risk of interaction with the device
Behavior of an animal of concern that may increase its proximity or aspect to the OSW device, such as curiosity.
Risk to sustaining populations Animals of concern that reproduce slowly and may have lowered resilience to harm from OSW devices.
Physical Risk Factors, Near -Field Risk from size of habitat Reduction in size of near-field habitat due to the
physical presence of the OSW device, moorings, and power cables.
Risk from changes in sediment patterns Changes in near-field sedimentation patterns, including scour, that may reduce or eliminate habitat around the OSW device.

2.6
Biophysical Risk Factor Description Physical Risk Factors, Far Field
Circulation that affects water quality Changes in water flow that affects water quality in the waterbody, such as dissolved oxygen, nutrient, and contaminant concentrations, due to the presence of OSW devices.
Circulation that affects sediment patterns Changes in water flow that affects sedimentation patterns over large areas, due to the presence of OSW devices.
Circulation that affects food web Changes in water flow that affects primary productivity and species at the base of the food web, due to the presence of OSW devices.
Risk to nearshore habitat Farfield changes in water movement or wind–wave interactions that may affect nearshore habitat, due to OSW device.
The purpose of the ERES risk assessment is to assist project developers and regulators with deployment of offshore wind technology. Meeting all appropriate regulatory mandates that protect the living systems must be taken into consideration. To address this need we also applied regulatory risk factors to the S–R pairs. Regulatory risk factors are statutes, regulations, or rules that pose a risk to deployment and operation of an offshore wind project; these risk factors do not pose a risk to the receptors. The regulatory risk factors were applied to all the S–R pairs, after the pairs were sorted by the biophysical risk factors, generating a new set of rankings. The regulatory risk factors were developed to address the regulatory authorities that apply to offshore wind project development and are organized into four tiers based on the differences in application and intent of each authority (Table 2.5). These tiers represent the perceived vulnerability of each animal group or habitat type and the level of regulatory protection applied to each.
Table 2.5. Regulatory Risk Factors. The factors are organized by tiers to represent the level of stringency of the regulatory authority. The tier in which a regulatory risk factor resides is directly proportional to the potential for that factor to halt development of an OSW project.
Tier Legislation or Regulation Implementation of authority First
ESA(a) ESA and MBTA(b) ESA and MMPA(c)
Strict take prohibitions Strict take prohibitions Strict take prohibitions
Second ESA Moderate take prohibitions; critical habitat protection Third
Federal/state CWA(d) MMPA MBTA
Pollution discharge permits Marine mammal take prohibitions Migratory bird take prohibitions
Fourth State/tribal protected resources State listed species MSA(e)
State/tribal fishery regulations/lands protection Take limitations; area closures Fishery management plans; essential fish habitat
(a) Endangered Species Act of 1973. (b) Migratory Bird Treaty Act of 1918. (c) Marine Mammal Protection Act of 1972 As Amended. (d) Clean Water Act of 1977. (e) Magnuson-Stevens Fishery Conservation and Management Act.
In developing the S–R pairs analysis, we did not attempt to evaluate every possible receptor present at each project site. One or more examples of a species were chosen for each receptor group (e.g., fish,

2.7
birds) or subgroup (e.g., cetaceans, pinnipeds) to analyze interactions in the most realistic manner possible (Table 2.6). Multiple species were selected to represent one receptor group when major variations in life histories existed. For example, the fin whale was chosen to represent the T&E cetacean for the Fishermen’s Energy case, while both the osprey and the roseate tern were chosen to represent the T&E birds for the Fishermen’s Energy case.
Table 2.6. Vulnerable Receptor Groups and the Species or Habitats Used as Representative Examples for Risk Analysis for Each Case
Receptor Group Protection Receptor Subgroup FISH (NJ) LEEDCo (OH) Mammals T&E Cetacean Fin Whale N/A(a)
Non T&E Pinniped Harbor Seal N/A Cetacean Bottlenose Dolphin N/A
Reptile T&E Sea Turtle Loggerhead N/A Sea Turtle Leatherback N/A
Birds T&E Marine Osprey(b) Common Tern(b) Roseate Tern Piping Plover Non T&E Migratory Bird Northern Gannet Red-breasted
Merganser Herring Gull Herring Gull
Invertebrates Non T&E Atlantic Surf Clam N/A Fish T&E Migratory Atlantic Surgeon Lake Sturgeon(b)
Resident Sand Tiger Shark(c) N/A
Non T&E Migratory Blue Fin Tuna Walleye Resident Winter Flounder Yellow Perch
Bats T&E N/A Indiana Bat Non T&E Eastern Red Bat Big Brown Bat
(a) No aquatic mammals occur in the LEEDCo project area. (b) Indicates species is listed by the state but not federally listed. (c) Species of concern.
Additional steps are needed to determine the probability of occurrence for each of the ranked risks. For example, the rankings could change if an S–R pair demonstrating a high level of vulnerability exhibited a very low probability of occurrence.


3.1
3.0 Results
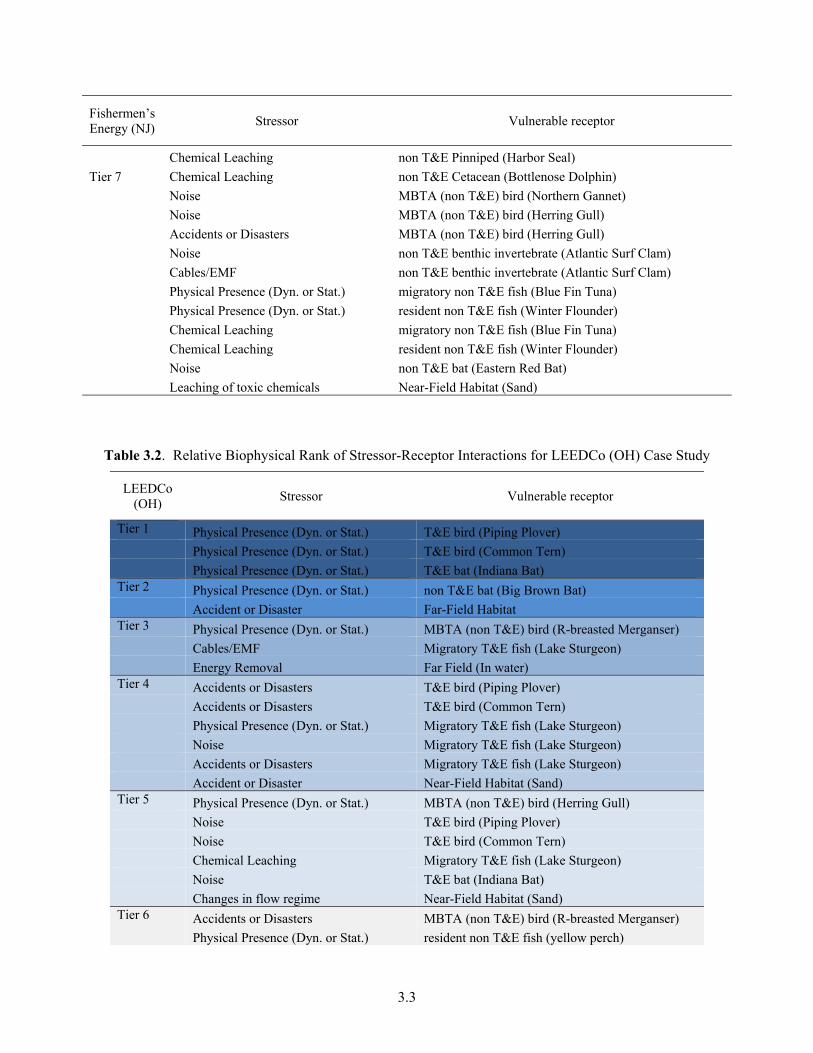
The results of the initial biophysical consequence ranking process provides the relative rank of the S–R pairs for biophysical risk factors only for the Fishermen’s Energy case and the LEEDCo case (Tables 3.1 and 3.2, respectively). The relative ranks calculated after application of the biophysical and regulatory risks factors are presented in Table 3.3. The separate color bands represent the ranks for environmental consequence. S–R pairs within the same color band are essentially tied with respect to their associated consequence. To further separate the tied S–R pairs within the same tier, an examination of the probability of occurrence is needed.
After the biophysical risk factors were applied, the highest-ranked receptors for both cases are the threatened or endangered (T&E) species. Removal of energy and changes in flow regime also tend to rank highly as affected receptors, from the application of biophysical risk factors. Among the stressors, Physical Presence (dynamic or static) and Accidents/Disasters ranked highest across all the T&E species.
The relative rankings calculated between S–R pairs from application of biophysical risk factors were then treated with regulatory risk factors; the results are shown for both cases in Table 3.3. After the application of the regulatory risk factors, the highest ranked stressors for both cases were the effects of the turbine’s Physical Presence (dynamic or static), Accidents or Disasters, and Cables/EMF. Receptors in the first three tiers were dominated by potential effects on T&E marine mammals, birds, bats, and reptiles. The S–R pairs that showed the greatest potential consequences within the fifth and sixth tiers consisted of both T&E and non T&E receptors comprised of fish, birds, invertebrates, and bats.
Table 3.1. Relative Biophysical Rank of Stressor–Receptor Interactions for Fishermen’s Energy (NJ) Case Study
Fishermen’s Energy (NJ)
Stressor Vulnerable receptor
Tier 1 Physical Presence (Dyn. or Stat.) T&E bird (Roseate Tern)
Physical Presence (Dyn. or Stat.) T&E bird (Osprey)
Tier 2 Accident or Disaster Far-Field Habitat
Tier 3 Accidents or Disasters T&E Cetacean (Fin Whale)
Cables/EMF Migratory T&E fish (Atlantic Sturgeon)
Physical Presence (Dyn. or Stat.) non T&E bat (Eastern Red Bat)
Energy Removal Far Field (in water)
Tier 4 Noise T&E Cetacean (Fin Whale)
Physical Presence (Dyn. or Stat.) MBTA (non T&E) bird (Northern Gannet)
Accidents or Disasters T&E bird (Roseate Tern)
Accidents or Disasters T&E bird (Osprey)
Cables/EMF T&E reptile (loggerhead)
Cables/EMF T&E reptile (leatherback)
Accidents or Disasters T&E reptile (loggerhead)
Accidents or Disasters T&E reptile (leatherback)
Noise Migratory T&E fish (Atlantic Sturgeon)

3.2
Fishermen’s Energy (NJ)
Stressor Vulnerable receptor
Noise resident T&E fish (Sand Tiger Shark)
Tier 4 Cables/EMF resident T&E fish (Sand Tiger Shark)
Accidents or Disasters Migratory T&E fish (Atlantic Sturgeon)
Accident or Disaster Near-Field Habitat (Sand)
Tier 5 Physical Presence (Dyn. or Stat.) T&E Cetacean (Fin Whale)
Cables/EMF T&E Cetacean (Fin Whale)
Chemical Leaching T&E Cetacean (Fin Whale)
Accidents or Disasters non T&E Pinniped (Harbor Seal)
Accidents or Disasters non T&E Cetacean (Bottlenose Dolphin)
Physical Presence (Dyn. or Stat.) MBTA (non T&E) bird (Herring Gull)
Noise T&E bird (Roseate Tern)
Noise T&E bird (Osprey)
Physical Presence (Dyn. or Stat.) T&E reptile (loggerhead)
Physical Presence (Dyn. or Stat.) T&E reptile (leatherback)
Noise T&E reptile (loggerhead)
Noise T&E reptile (leatherback)
Chemical Leaching T&E reptile (loggerhead)
Chemical Leaching T&E reptile (leatherback)
Physical Presence (Dyn. or Stat.) Migratory T&E fish (Atlantic Sturgeon)
Noise resident non T&E fish (Winter Flounder)
Cables/EMF resident non T&E fish (Winter Flounder)
Chemical Leaching Migratory T&E fish (Atlantic Sturgeon)
Accidents or Disasters resident T&E fish (Sand Tiger Shark)
Accidents or Disasters resident non T&E fish (Winter Flounder)
Changes in flow regime Near-Field Habitat (Sand)
Tier 6 Noise non T&E Pinniped (Harbor Seal)
Noise non T&E Cetacean (Bottlenose Dolphin)
Accidents or Disasters MBTA (non T&E) bird (Northern Gannet)
Physical Presence (Dyn. or Stat.) non T&E benthic invertebrate (Atlantic Surf Clam)
Chemical Leaching non T&E benthic invertebrate (Atlantic Surf Clam)
Accidents or Disasters non T&E benthic invertebrate (Atlantic Surf Clam)
Physical Presence (Dyn. or Stat.) resident T&E fish (Sand Tiger Shark)
Noise migratory non T&E fish (Blue Fin Tuna)
Cables/EMF migratory non T&E fish (Blue Fin Tuna)
Chemical Leaching resident T&E fish (Sand Tiger Shark)
Accidents or Disasters migratory non T&E fish (Blue Fin Tuna)
Physical presence Near-Field Habitat (Sand)
Energy Removal Far Field (Atmospheric Alteration)
Tier 7 Physical Presence (Dyn. or Stat.) non T&E Pinniped (Harbor Seal)
Physical Presence (Dyn. or Stat.) non T&E Cetacean (Bottlenose Dolphin)
Cables/EMF non T&E Pinniped (Harbor Seal)
Cables/EMF non T&E Cetacean (Bottlenose Dolphin)
3.3
Fishermen’s Energy (NJ)
Stressor Vulnerable receptor
Chemical Leaching non T&E Pinniped (Harbor Seal)
Tier 7 Chemical Leaching non T&E Cetacean (Bottlenose Dolphin)
Noise MBTA (non T&E) bird (Northern Gannet)
Noise MBTA (non T&E) bird (Herring Gull)
Accidents or Disasters MBTA (non T&E) bird (Herring Gull)
Noise non T&E benthic invertebrate (Atlantic Surf Clam)
Cables/EMF non T&E benthic invertebrate (Atlantic Surf Clam)
Physical Presence (Dyn. or Stat.) migratory non T&E fish (Blue Fin Tuna)
Physical Presence (Dyn. or Stat.) resident non T&E fish (Winter Flounder)
Chemical Leaching migratory non T&E fish (Blue Fin Tuna)
Chemical Leaching resident non T&E fish (Winter Flounder)
Noise non T&E bat (Eastern Red Bat)
Leaching of toxic chemicals Near-Field Habitat (Sand)
Table 3.2. Relative Biophysical Rank of Stressor-Receptor Interactions for LEEDCo (OH) Case Study
LEEDCo (OH)
Stressor Vulnerable receptor
Tier 1 Physical Presence (Dyn. or Stat.) T&E bird (Piping Plover) Physical Presence (Dyn. or Stat.) T&E bird (Common Tern) Physical Presence (Dyn. or Stat.) T&E bat (Indiana Bat) Tier 2 Physical Presence (Dyn. or Stat.) non T&E bat (Big Brown Bat) Accident or Disaster Far-Field Habitat Tier 3 Physical Presence (Dyn. or Stat.) MBTA (non T&E) bird (R-breasted Merganser) Cables/EMF Migratory T&E fish (Lake Sturgeon) Energy Removal Far Field (In water) Tier 4 Accidents or Disasters T&E bird (Piping Plover) Accidents or Disasters T&E bird (Common Tern) Physical Presence (Dyn. or Stat.) Migratory T&E fish (Lake Sturgeon) Noise Migratory T&E fish (Lake Sturgeon) Accidents or Disasters Migratory T&E fish (Lake Sturgeon) Accident or Disaster Near-Field Habitat (Sand) Tier 5 Physical Presence (Dyn. or Stat.) MBTA (non T&E) bird (Herring Gull) Noise T&E bird (Piping Plover) Noise T&E bird (Common Tern) Chemical Leaching Migratory T&E fish (Lake Sturgeon) Noise T&E bat (Indiana Bat) Changes in flow regime Near-Field Habitat (Sand) Tier 6 Accidents or Disasters MBTA (non T&E) bird (R-breasted Merganser) Physical Presence (Dyn. or Stat.) resident non T&E fish (yellow perch)

3.4
LEEDCo (OH)
Stressor Vulnerable receptor
Noise migratory non T&E fish (walleye) Tier 6 Noise resident non T&E fish (yellow perch) Accidents or Disasters migratory non T&E fish (walleye) Accidents or Disasters resident non T&E fish (yellow perch) Noise non T&E bat (Big Brown Bat) Physical presence Near-Field Habitat (Sand) Energy Removal Far Field (Atmospheric Alteration) Tier 7 Noise MBTA (non T&E) bird (R-breasted Merganser) Noise MBTA (non T&E) bird (Herring Gull) Accidents or Disasters MBTA (non T&E) bird (Herring Gull) Physical Presence (Dyn. or Stat.) migratory non T&E fish (walleye) Cables/EMF migratory non T&E fish (walleye) Cables/EMF resident non T&E fish (yellow perch) Chemical Leaching migratory non T&E fish (walleye) Chemical Leaching resident non T&E fish (yellow perch) Leaching of toxic chemicals Near-Field Habitat (Sand)
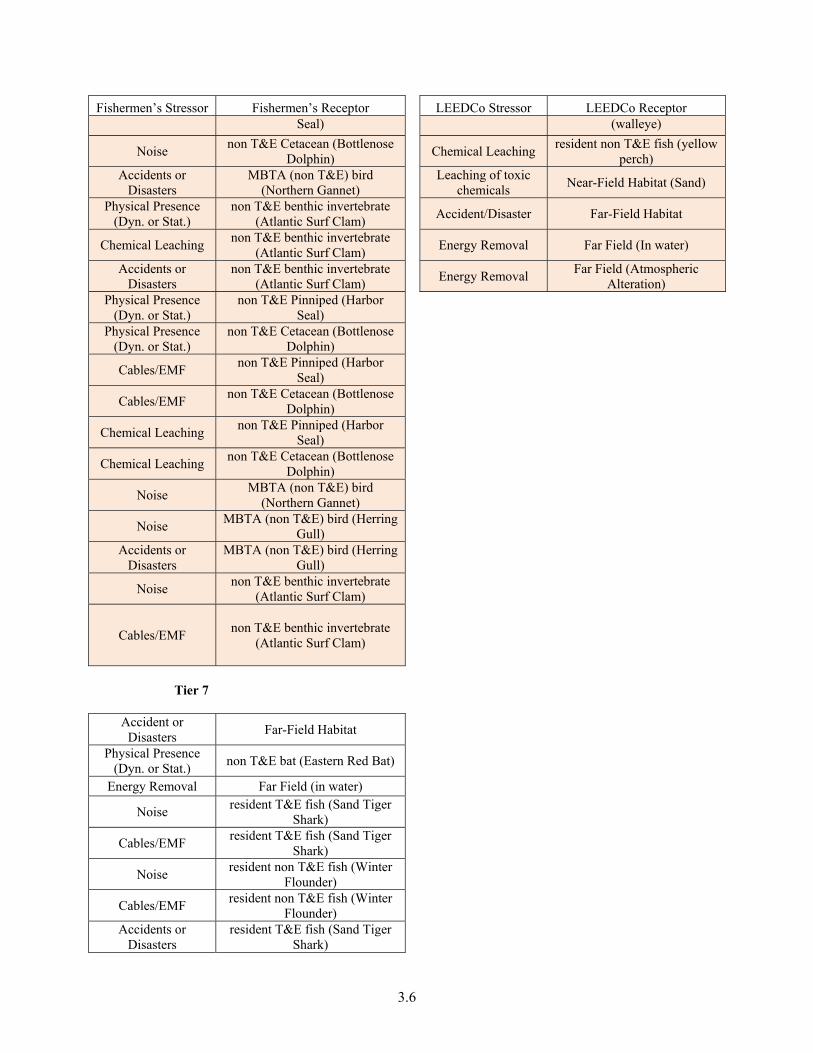
Table 3.3. Top Tiers of Environmental Consequence for Stressor–Receptor Pairs for the Two Cases, after Inclusion of Regulatory Risk Factors. Color gradation signifies consequence rank of S–R pairs (darker = more consequence).
Fishermen’s Stressor Fishermen’s Receptor LEEDCo Stressor LEEDCo Receptor
Tier 1 Tier 1
Physical Presence (Dyn. or Stat.)
T&E bird (Roseate Tern) Physical Presence
(Dyn. or Stat.) T&E bird (Piping Plover)
Tier 2 Physical Presence
(Dyn. or Stat.) T&E bat (Indiana Bat)
Accidents or Disasters
T&E Cetacean (Fin Whale) Tier 2
Cables/EMF migratory T&E fish (Atlantic
Sturgeon) Accidents or
Disasters T&E bird (Piping Plover)
Tier 3 Tier 3
Noise T&E Cetacean (Fin Whale) Noise T&E bird (Piping Plover)
Accidents or Disasters
T&E bird (Roseate Tern) Noise T&E bat (Indiana Bat)
Cables/EMF T&E reptile (loggerhead)
Tier 4
Cables/EMF T&E reptile (leatherback) Physical Presence
(Dyn. or Stat.) Migratory T&E fish (Lake
Sturgeon) Accidents or
Disasters T&E reptile (loggerhead) Tier 5
Accidents or T&E reptile (leatherback) Physical Presence T&E bird (Common Tern)

3.5
Fishermen’s Stressor Fishermen’s Receptor LEEDCo Stressor LEEDCo Receptor Disasters (Dyn. or Stat.)
Noise migratory T&E fish (Atlantic
Sturgeon) Physical Presence
(Dyn. or Stat.) MBTA (non T&E) bird (R-
breasted Merganser) Accidents or
Disasters migratory T&E fish (Atlantic
Sturgeon) Accidents or
Disasters T&E bird (Common Tern)
Tier 4 Accident/Disaster Near-Field Habitat (Sand)
Physical Presence (Dyn. or Stat.)
T&E Cetacean (Fin Whale) Physical Presence
(Dyn. or Stat.) MBTA (non T&E) bird
(Herring Gull) Cables/EMF T&E Cetacean (Fin Whale) Noise T&E bird (Common Tern)
Chemical Leaching T&E Cetacean (Fin Whale) Accidents or
Disasters MBTA (non T&E) bird (R-
breasted Merganser)
Noise T&E bird (Roseate Tern) Noise MBTA (non T&E) bird (R-
breasted Merganser) Physical Presence
(Dyn. or Stat.) T&E reptile (loggerhead) Noise
MBTA (non T&E) bird (Herring Gull)
Physical Presence (Dyn. or Stat.)
T&E reptile (leatherback) Accidents or
Disasters MBTA (non T&E) bird
(Herring Gull)
Noise T&E reptile (loggerhead) Tier 6
Noise T&E reptile (leatherback) Physical Presence
(Dyn. or Stat.) non T&E bat (Big Brown Bat)
Chemical Leaching T&E reptile (loggerhead) Cables/EMF Migratory T&E fish (Lake
Sturgeon)
Chemical Leaching T&E reptile (leatherback) Noise Migratory T&E fish (Lake
Sturgeon) Physical Presence
(Dyn. or Stat.) migratory T&E fish (Atlantic
Sturgeon) Accidents or
Disasters Migratory T&E fish (Lake
Sturgeon)
Chemical Leaching migratory T&E fish (Atlantic
Sturgeon) Chemical Leaching
Migratory T&E fish (Lake Sturgeon)
Tier 5 Changes in flow
regime Near-Field Habitat (Sand)
Energy Removal Far-
field (Atmospheric Alteration) Physical Presence
(Dyn. or Stat.) resident non T&E fish (yellow
perch)
Tier 6 Noise migratory non T&E fish
(walleye) Physical Presence
(Dyn. or Stat.) T&E bird (Osprey) Noise
resident non T&E fish (yellow perch)
Physical Presence (Dyn. or Stat.)
MBTA (non T&E) bird (Northern Gannet)
Accidents or Disasters
migratory non T&E fish (walleye)
Accidents or Disasters
T&E bird (Osprey) Accidents or
Disasters resident non T&E fish (yellow
perch) Accident or Disaster Near-Field Habitat (Sand) Noise non T&E bat (Big Brown Bat)
Accidents or Disasters
non T&E Pinniped (Harbor Seal)
Physical presence Near-Field Habitat (Sand)
Accidents or Disasters
non T&E Cetacean (Bottlenose Dolphin)
Physical Presence (Dyn. or Stat.)
migratory non T&E fish (walleye)
Physical Presence (Dyn. or Stat.)
MBTA (non T&E) bird (Herring Gull)
Cables/EMF migratory non T&E fish
(walleye)
Noise T&E bird (Osprey) Cables/EMF resident non T&E fish (yellow
perch) Noise non T&E Pinniped (Harbor Chemical Leaching migratory non T&E fish
3.6
Fishermen’s Stressor Fishermen’s Receptor LEEDCo Stressor LEEDCo Receptor Seal) (walleye)
Noise non T&E Cetacean (Bottlenose
Dolphin) Chemical Leaching
resident non T&E fish (yellow perch)
Accidents or Disasters
MBTA (non T&E) bird (Northern Gannet)
Leaching of toxic chemicals
Near-Field Habitat (Sand)
Physical Presence (Dyn. or Stat.)
non T&E benthic invertebrate (Atlantic Surf Clam)
Accident/Disaster Far-Field Habitat
Chemical Leaching non T&E benthic invertebrate
(Atlantic Surf Clam) Energy Removal Far Field (In water)
Accidents or Disasters
non T&E benthic invertebrate (Atlantic Surf Clam)
Energy Removal Far Field (Atmospheric
Alteration) Physical Presence
(Dyn. or Stat.) non T&E Pinniped (Harbor
Seal) Physical Presence
(Dyn. or Stat.) non T&E Cetacean (Bottlenose
Dolphin)
Cables/EMF non T&E Pinniped (Harbor
Seal)
Cables/EMF non T&E Cetacean (Bottlenose
Dolphin)
Chemical Leaching non T&E Pinniped (Harbor
Seal)
Chemical Leaching non T&E Cetacean (Bottlenose
Dolphin)
Noise MBTA (non T&E) bird
(Northern Gannet)
Noise MBTA (non T&E) bird (Herring
Gull) Accidents or
Disasters MBTA (non T&E) bird (Herring
Gull)
Noise non T&E benthic invertebrate
(Atlantic Surf Clam)
Cables/EMF non T&E benthic invertebrate
(Atlantic Surf Clam)
Tier 7
Accident or
Disasters Far-Field Habitat
Physical Presence (Dyn. or Stat.)
non T&E bat (Eastern Red Bat)
Energy Removal Far Field (in water)
Noise resident T&E fish (Sand Tiger
Shark)
Cables/EMF resident T&E fish (Sand Tiger
Shark)
Noise resident non T&E fish (Winter
Flounder)
Cables/EMF resident non T&E fish (Winter
Flounder) Accidents or
Disasters resident T&E fish (Sand Tiger
Shark)

3.7
Fishermen’s Stressor Fishermen’s Receptor LEEDCo Stressor LEEDCo Receptor Accidents or
Disasters resident non T&E fish (Winter
Flounder) Changes in flow
regime Near-Field Habitat (Sand)
Physical Presence (Dyn. or Stat.)
resident T&E fish (Sand Tiger Shark)
Noise migratory non T&E fish (Blue
Fin Tuna)
Cables/EMF migratory non T&E fish (Blue
Fin Tuna)
Chemical Leaching resident T&E fish (Sand Tiger
Shark) Accidents or
Disasters migratory non T&E fish (Blue
Fin Tuna) Physical presence Near-Field Habitat (Sand) Physical Presence
(Dyn. or Stat.) migratory non T&E fish (Blue
Fin Tuna) Physical Presence
(Dyn. or Stat.) resident non T&E fish (Winter
Flounder)
Chemical Leaching migratory non T&E fish (Blue
Fin Tuna)
Chemical Leaching resident non T&E fish (Winter
Flounder) Noise non T&E bat (Eastern Red Bat)
Leaching of toxic chemicals
Near-Field Habitat (Sand)


4.1
4.0 Discussion
Deployment of offshore wind turbines requires compliance with all applicable laws and regulations. However, laws and regulations designed to protect the environment should not prevent the responsible deployment of these carbon-free renewable energy sources. Through identifying the highest priority risks from interactions between stressors from offshore wind turbines and associated infrastructure with vulnerable receptors in the marine environment, project proponents, regulators and stakeholders can engage in the most efficient and effective siting and permitting pathways.
There are two possible reasons for the S–R interactions from an offshore wind project to be ranked in the top tiers of this analysis. Either the interaction is a true impact to the given receptor, or so little is known about the interaction that the resulting uncertainty raises the apparent risk level, assuming a precautionary approach is used. As seen in Table 3.3, the most important S–R interactions are ranked based on the most severe consequences. These rankings will gradually change (i.e. highly ranked interactions may shift to lower tiers) as additional data on specific S–R interactions become available through research studies and monitoring of functioning OSW projects. Similarly, as new technologies and improved operational designs are developed, consequences to marine organisms and the physical environment may be reduced, resulting in a drop in ranking for the associated S–R interactions. As these top-tier lists of S–R interactions become more concise, the remaining interactions will form the basis for post-installation monitoring and mitigation.
When ranking S–R interactions solely on biophysical risk factors (Tables 3.1 and 3.2), receptors with T&E status almost always rank high. As the impact of stressors on receptors was analyzed for each S–R pair, the S-R interaction was assumed to have taken place. Due to this assumption and the fact that this screening analysis looked at only consequence and not probability of occurrences, receptor interactions with stressors such as accidents/disasters and physical presence (dynamic or static) ranked high based on their biophysical risk factors. An example of this was seen when the consequence of the S–R interaction between accidents/disasters and cetaceans was evaluated. We assessed the potential impact to a fin whale for the eight biophysical risk factors assuming an oil spill occurred off the coast of Atlantic City, NJ as a result of a vessel collision with an offshore wind turbine. Although the probability of this scenario is presumably very small, the consequences of this incident could be significant.
The regulatory power of the “no take” provision in the Endangered Species Act of 1973 (ESA), especially if combined with either the Marine Mammal Protection Act of 1972 (MMPA) or the Migratory Bird Treaty Act of 1918 (MBTA), dictates that all threatened and endangered marine mammals, turtles, and migratory birds will rank extremely high. Because of this prioritization, these receptors receive the highest ranks regardless of whether they are likely to be the most vulnerable biological receptors from a scientific point of view. Receptors that are not listed under the ESA or those ESA-listed species for which limited take is allowed are unlikely to rank as high for consequence analysis because the ESA/MMPA or ESA/MBTA regulatory mandates dictate such a high level of scrutiny and offer considerable challenges to permitting.
The two FY11 cases were small-scale offshore wind pilot projects. Although these early-stage projects may present risks to receptors, as larger projects are developed, the consequences and risks must be reevaluated because they may escalate in nonlinear ways. For example, the risk posed by seven turbines to a migrating bird species may be minimal because the area covered by wind turbines is small in comparison to the flyway. However, a commercial project consisting of hundreds of turbines could

4.2
present a substantial aerial intersection with the flyway, hence posing a greater risk. Similarly, habitat receptors in the near field and far field are not likely to be greatly affected by small numbers of turbines, while large OSW farms may have a measurable effect on water flow, wind–wave interactions, and local weather patterns. Cumulative impacts of devices operating over long time frames may create effects not measurable at the pilot level. Additional research and monitoring data collection around operating OSW farms is needed to fully comprehend changes in far-field habitats, wind–wave interactions, and aquatic food webs.
5.1
5.0 Next Steps in Risk Assessment
After analyses were completed, PNNL contacted the developers responsible for the projects depicted in the cases to ensure that the facts of the cases are correct and to share the outcome of the consequence analysis. In the case of LEEDCo, at the request of the developer, a webinar is also planned to present the case to the regulators responsible for the Lake Erie wind development (State of Ohio and federal agencies).
To calculate the risk associated with each of the high-ranked S–R pair interactions, calculations of probability analysis are needed. Until additional data become available following deployment of OSW farms in the United States, these calculations are very difficult. Significant progress can be made in estimating the probability (and therefore the overall risk) for some of the S–R interactions by applying probability models to datasets derived from European wind farms that closely resemble the geography, oceanographic conditions, and animal populations of U.S. coastal areas. There is no functional equivalent to the Great Lakes for offshore wind deployment elsewhere in the world; certain stretches of the coastline of the United Kingdom and northern European countries resemble the Atlantic areas where U.S. offshore wind development is under consideration. PNNL scientists are seeking European datasets that will lend themselves to probability analyses in order to further our understanding of the likelihood of occurrence of the most severe consequences (i.e., the highest ranked S–R pairs). To date, no datasets have been acquired that meet these needs.
Certain potential S–R interactions that have been identified as highly ranked in the two FY11 case studies can be pursued for probability analysis, notably the potential for collision and damage of vessels with offshore wind turbines in the Great Lakes and the New Jersey coast. Data from the Automatic Identification System carried on board commercial vessels provides accurate tracking of shipping; by estimating the location and aerial coverage of OSW farms in the two case locations, the probability of accidents and spills could be estimated. Analogous modeling in Puget Sound has determined that the likelihood of a collision and spill from a vessel (most likely a tug and barge combination) due to the presence of a subsurface tidal turbine is extremely small. The scenario of OSW turbines and vessel traffic interactions will differ due to the surface-piercing nature of the wind turbines; however, the potential interactions could be mitigated by the visual and radar presence of the turbines, allowing helmsmen to recognize and avoid the hazards. A probability modeling analysis would determine the level of risk.


6.1
6.0 References
Burger J, C Gordon, J Lawrence, J Newman, G Forcey, and L Vlietstra. 2011. Risk evaluation for federally listed (roseate tern, piping plover) or candidate (red knot) bird species in offshore waters: A first step for managing the potential impacts of wind facility development on the Atlantic Outer Continental Shelf. Renewable Energy 36:338–351.
Carstensen J, OD Henrikson, and J Teimann. 2006. Impacts of offshore wind farm construction on harbor porpoises: acoustic monitoring of echolocation activity using propose detectors (T-PODs). Marine Ecology Progress Series 321:295–308.
Christiansen MB and CB Hasager. 2005. Wake effects of offshore wind farms identified from satellite SAR. Remote Sensing of Environment 98:251–268.
Desholm M, AD Fox, and PD Beasley. 2004. Best Practice Guidance for the Use of Remote Techniques for Observing Bird Behaviour in Relation to Offshore Wind Farms. COWRIE REMOTE-05-2004, Collaborative Offshore Wind Research into the Environment (COWRIE). Available from http://www.offshorewind.co.uk/Assets/REMOTETECHNIQUES-FINALREPORT.pdf (November 2011).
Driedger-Marschall B, PK Endres, RM Krueger, and C van den Bruck. 2009. Great Lakes Wind Energy Center Feasibility Study -- Final Feasibility Report. juwi GmbH and JW Great Lakes Wind LLC, Cleveland, Ohio. Available from http://development.cuyahogacounty.us/pdf_development/en-US/GLWEC_Final%20Feasibility%20Report_4-28-09.pdf (November 2011).
EPA. 2011. Integrated Risk Information System (IRIS). U.S. Environmental Protection Agency, Washington, D.C. Available from http://www.epa.gov/iris/index.html (November 2011).
EWEA. 2010. Powering the Debate – The European Wind Energy Association Annual Report 2010. Available from http://www.ewea.org/fileadmin/ewea_documents/documents/publications/reports/ EWEA_Annual_report_2010.pdf (November 2010).
Forward G. 2005. The Potential Effects of Offshore Wind-Power Facilities on Fish and Fish Habitat. Algonquin Fisheries Assessment Unit, Ontario Ministry of Fisheries Resources, Ottawa, Ontario, Canada. Available from http://www.ontla.on.ca/library/repository/mon/16000/271182.pdf (November 2011).
Geo-Marine, Inc. 2010. Ocean/Wind Power Ecological Baseline Studies – Volume 1: Overview, Summary, and Application. New Jersey Department of Environmental Protection, Trenton. Available from http://www.nj.gov/dep/dsr/ocean-wind/vol1-cover-intro.pdf (November 2011).
Gill AB. 2005. Offshore renewable energy: Ecological implications of generating electricity in the coastal zone. Journal of Applied Ecology 42(4):605–615.
Gill AB, I Gloyne-Phillips, KJ Neal, and JA Kimber. 2005. The Potential Effects of Electromagnetic Fields Generated by Sub-Sea Power Cables Associated with Offshore Wind Farm Developments on Electrically and Magnetically Sensitive Marine Organisms – A Review. Collaborative Offshore Wind Research into the Environment (COWRIE). Available from http://www.offshorewind.co.uk/Assets/ 1351_emf_phase_one_half_report.pdf (November 2011).

6.2
Hiscock K. H Tyler-Walters, and H Jones. 2002. High Level Environmental Screening Study for Offshore Wind Farm Developments – Marine Habitats and Species Project. Report from the Marine Biological Association to the Department of Trade and Industry, New & Renewable Energy Programme, London, United Kingdom. Available from http://www.marlin.ac.uk/pdf/wind_farm_report_combined.pdf (November 2011).
Huppop O, J Dierschke, KM Exo, E Fredrich, and R Hill. 2006. Bird migration studies and potential collision risk with offshore wind turbines. The International Journal of Avian Science 148:90–109.
Kirschvink JL, MM Walker, and CE Diebel. 2001. Magnetite-based magnetoreception. Current Opinion in Neurobiology 11:462–467.
Madsen PT, M Wahlberg, J Tougaard, K Lucke, and P Tyack. 2006. Wind turbine underwater noise and marine mammals: implications of current knowledge and data needs. Marine Ecology Progress Series 309:279–295.
Madsen EA, DT Haydon, AD Fox, RW Furness, R Bullman, and M Descholm. 2009. Barrier to movement: Impacts of wind farms on migrating birds. ICES Journal of Marine Science 66:746–753.
Michel J, H Dunagan, C Boring, E Healy, W Evans, JM Dean, A McGillis, and J Hain. 2007. Worldwide Synthesis and Analysis of Existing Information Regarding Environmental Effects of Alternative Energy Uses on the Outer Continental Shelf. MMS OCS Report 2007-038, Minerals Management Service, U.S. Department of the Interior, Herndon, Virginia.
Natural Resource Solutions. 2008. Appendix C: Bat Study Report. Project # 696-D, Invenergy Wind LLC, Toronto, Ontario. Available from http://raleigh.invenergyllc.com/pdf/Appendix%20C%20-%20Bats.pdf (November 2011).
Norman TB, RSK Buisson, and NP Askew. 2007. COWRIE Workshop on the Cumulative Impact of Offshore Windfarms on Birds. COWRIE CI-BIRD-01-2007, Collaborative Offshore Wind Research into the Environment (COWRIE). Available from http://www.offshorewind.co.uk/Assets/Report_on_COWRIE_CIA_workshop_v4.pdf (November 2011).
Normandeau Associates Inc., Exponent Inc., T Tricas, and A Gill. 2011. Effects of EMFs from Undersea Power Cables on Elasmobranches and Other Marine Species. OCS Study BOEMRE 2011-09, U.S. Department of the Interior, Bureau of Ocean Energy Management, Regulation, and Enforcement, Pacific OCS Region, Camarillo, California.
Odum EP. 1977. The emergence of ecology as a new integrative discipline. Science 195:1289–1293.
Odum EP and GW Barrett. 2004. Fundamentals of Ecology. 5th edition. Brooks/Cole Publishing, Cengage Learning, Stamford, Connecticut.
Rees J, P Larcombe, C Vivian, and A Judd. 2006. Scroby Sands Offshore Wind Farm – Coastal Processes Monitoring. Project No. AE0262, Cefas Lowestoft Laboratory, Suffolk, United Kingdom. Available from http://www.3bays.org/pdfs/reports/AE0262-Final-Report-Scroby-OWF.pdf (November 2011).

6.3
Slater M, A Schultz, R Jones, and C Fischer. 2010. Electromagnetic Field Study. Oregon Wave Energy Trust. Available from http://www.oregonwave.org/wp-content/uploads/OWET-EMF-on-Marine-Species_FINAL_Full_web1.pdf (November 2011).
Southall B, AE Bowles, WT Ellison, JK Finneran, RL Gentry, CR Greene, D Kastak Jr, DR Ketten, JH Miller, PE Nachtigall, JW Richardson, JA Thomas, and PL Tyack. 2007. Marine mammal noise exposure criteria: Initial scientific recommendations. Aquatic Mammals 33(4):1–521.
Thomsen F, K Lüdemann, R Kafemann, and W Piper. 2006. Effects of Offshore Wind Farm Noise on Marine Mammals and Fish. Biola (biologisch-landschaftsökologische arbeitsgemeinschaft), Hamburg, Germany. Available from http://www.offshorewind.co.uk/Assets/BIOLAReport06072006FINAL.pdf (November 2011).
Tougaard J, S Tougaard, RC Jensen, T Jensen, J Teilman, D Adelung, N Liebsch, and G Muller. 2006. Harbour Seals on Horns Reef Before, During and After Construction of Horns Rev Offshore Wind Farm. Final report to Vattenfall A/S. Biological Papers from the Fisheries and Maritime Museum No. 5, Esbjerg, Denmark. Available from http://www.vattenfall.dk/da/file/harbour-seals-at-horns-reef-b_7843262.pdf (November 2011).
Wilhelmsson D, T Malm, and MC Ohman. 2006. The influence of offshore windpower on demersal fish. ICES Journal of Marine Science 63:775–784.
Wilson JC and M Elliott. 2009. The habitat-creation potential of offshore wind farms. Wind Energy 12:203–212.
Zucco C, W Wende, T Merck, I Kochling, and J Koppel. . 2006. Ecological Research on Offshore Wind Farms: International Exchange of Experiences. Part B: Literature Review of Ecological Impacts of Offshore Wind Farms. Project No. 804 46 001, Federal Agency for Nature Conservation, Bonn, Germany. Available from http://bfn.de/habitatmare/de/downloads/berichte/ Ecological_Research_Offshor-Wind_Part_B_Skripten_186.pdf (November 2011).


Appendix
Details of the Ranking Process and Intermediate Results Tables


A.1
Appendix
Details of the Ranking Process and Intermediate Results Tables
The process for developing tables that lead into the ERES consequence ranking outcomes (Table 3.1 through 3.3) requires two separate steps and generates a series of tables. The steps are delineated here, followed by the scoring and ranking tables.
A.1 Preparation for Screening Analysis
Screening analysis consists of developing a list of S–R pairs. This was done following these three steps:
1. Identify the major groups of receptors of concern (Table 2.3). Subdivide receptor groups to reflect life history (e.g., cetaceans versus pinnipeds within aquatic mammals; migratory versus resident fish). Within each of those subdivisions, identify one or more species example for risk analysis that is broadly representative. The species or habitats used as examples for each receptor group are listed in Table 2.3.
2. Identify the major stressors of concern. These are listed in Table 2.2.
3. Produce the complete list of risk-relevant S–R pairs for each of the three cases. These S–R pairs are the basis for screening analysis for each case.
A.2 Procedure for Ranking Impact Scenarios for Each Case
Preliminary assessment of the relative risk associated with S–R pairs for each case was conducted by PNNL staff for subsequent review by subject matter experts. The purpose of this assessment is to develop a ranked list of relative consequence across receptor groups for each case. This assessment is subdivided into three steps for transparency. The transparency serves two purposes: 1) to clearly show how risk was assigned and 2) to allow for replacing each outcome as new data or information become available.
An Excel macro was written to carry out the calculations associated with the biophysical and regulatory rankings of the S–R interactions. The five steps allow an iterative process to assign relative risk using a series of risk factors.
1. Compile list of ALL receptors for each case. Receptors are compiled into one master list for each case. Although certain receptors can be fairly different with respect to their behavioral responses to offshore wind devices (i.e. marine mammals and resident fish), all S–R interactions were evaluated and compared within each case based on their biophysical risk factor scores. This allowed for us to identify the most risk prone S–R interactions through the screening analysis.
2. Apply biophysical risk factors to rank S–R pairs for each case. Biophysical risk factors are used to order the S–R pairs within each case by relative consequence risk. Biophysical risk factors are

A.2
described in Table 2.4. A score of “1” was used to represent potential consequence (“a noticeable impact/destabilized system”) for each S–R pair across the eight applicable biophysical factors, a score of “0.5” was used to indicate an intermediate consequence (“noticeable effect, but not destabilizing”), and “0” was used to indicate no probable consequence (“no noticeable effect”). Once these risk factor scores were assigned, potential risk count was summed for each S–R pair. S–R pairs containing the highest sums were considered the highest risk. These were placed in Tier 1 for biophysical risk factors, followed by the other S–R pair groups in Tiers 2, 3, and so on,based on their biophysical risk factor sums.
This step resulted in a master list for each case comprised of all the S–R interactions broken down into 7 different tiers based on their biophysical risk factor sums (Tables 3.1 and 3.2). List A shows the biophysical risk factor score for each ranked S–R pair.
3. For each case, apply regulatory risk factors to S–R pairs, starting with Tier 1 S–R pairs. A second set of risk factors, regulatory risk factors, is used to rank S–R pairs within tiers based on their regulatory consequences. These regulatory risk factors are described in Table 2.5 and are separated into four levels to represent the level of protection provided by the law or combinations of laws. S–R pairs that are assigned a score of 1, or level 1 law combinations, represent the highest risk. Level 2 represent the second highest risk, followed by level 3, and so on.
Because there were originally only four regulatory risk tiers, additional resolution was provided by subdividing all the S–R interactions within the first regulatory risk tier into additional tiers. This was done by applying both the regulatory risk factors for all S–R interactions in the first regulatory risk tier (all these scores were 1 due to the fact that they all were in the first regulatory risk tier) and by applying biophysical risk factor relative rank (i.e., with what tier were they associated based on their biophysical risk factor sum). With this second level of ranking, an additional three tiers were added to the four tiers, creating a total of seven regulatory risk tiers.

A.3
List A. Outcome of the Application of Biophysical Risk Factors to Each Stressor–Receptor Pair for Each Receptor Group
Mammal Receptor Group
Tec
hn
olog
y
Str
esso
r
Vu
lner
able
Rec
epto
r
Ris
k f
rom
Sm
all P
opu
lati
on
At
Ris
k L
ife
Sta
ge
Ris
k t
o C
riti
cal P
rey
Ris
k t
o C
riti
cal H
abit
ats
Ris
k f
rom
Pre
dat
ion
Ris
k f
rom
Com
pet
itio
n
Beh
avio
r th
at I
ncr
ease
s R
isk
Ris
k t
o S
ust
ain
ing
Pop
ulat
ion
s
Su
m
Fish (NJ)
Physical Presence (dynamic or static)
T&E Cetacean (Fin Whale)
1 0 0 0 0 0 0 0 1
Fish (NJ)
Physical Presence (dynamic or static)
non T&E Pinniped (Harbor Seal)
0 0 0 0 0 0 0 0 0
Fish (NJ)
Physical Presence (dynamic or static)
non T&E Cetacean (Bottlenose Dolphin)
0 0 0 0 0 0 0 0 0
Fish (NJ)
Noise T&E Cetacean (Fin
Whale) 1 0 0 0 0 0 0.5 0 1.5
Fish (NJ)
Noise non T&E Pinniped
(Harbor Seal) 0 0 0 0 0 0 0.5 0 0.5
Fish (NJ)
Noise non T&E Cetacean
(Bottlenose Dolphin) 0 0 0 0 0 0 0.5 0 0.5
Fish (NJ)
Cables/EMF T&E Cetacean (Fin
Whale) 1 0 0 0 0 0 0 0 1
Fish (NJ)
Cables/EMF non T&E Pinniped
(Harbor Seal) 0 0 0 0 0 0 0 0 0
Fish (NJ)
Cables/EMF non T&E Cetacean
(Bottlenose Dolphin) 0 0 0 0 0 0 0 0 0
Fish (NJ)
Chemical Leaching T&E Cetacean (Fin
Whale) 1 0 0 0 0 0 0 0 1
Fish (NJ)
Chemical Leaching non T&E Pinniped
(Harbor Seal) 0 0 0 0 0 0 0 0 0
Fish (NJ)
Chemical Leaching non T&E Cetacean
(Bottlenose Dolphin) 0 0 0 0 0 0 0 0 0
Fish (NJ)
Accidents or disasters T&E Cetacean (Fin
Whale) 1 0.5 0 0 0 0 0 0.5 2
Fish (NJ)
Accidents or disasters non T&E Pinniped
(Harbor Seal) 0 0.5 0 0 0 0 0 0.5 1
Fish (NJ)
Accidents or disasters non T&E Cetacean
(Bottlenose Dolphin) 0 0.5 0 0 0 0 0 0.5 1

A.4
Bird Receptor Group T
ech
nol
ogy
Str
esso
r
Vu
lner
able
Rec
epto
r
Ris
k f
rom
Sm
all P
opu
lati
on
At
Ris
k L
ife
Sta
ge
Ris
k t
o C
riti
cal P
rey
Ris
k t
o C
riti
cal H
abit
ats
Ris
k f
rom
Pre
dat
ion
Ris
k f
rom
Com
pet
itio
n
Beh
avio
r th
at I
ncr
ease
s R
isk
Ris
k t
o S
ust
ain
ing
Pop
ulat
ion
s
Su
m
Fish (NJ) Physical Presence
(Dynamic or Static) T&E bird (Roseate Tern)
1 0 0 0 0 0 1 1 3
Fish (NJ) Physical Presence
(Dynamic or Static) T&E bird (Osprey)
1 0 0 0 0 0 1 1 3
Fish (NJ) Physical Presence
(Dynamic or Static) MBTA (non T&E) bird
(Northern Gannet) 0 0 0 0 0 0 0.5 1 1.5
Fish (NJ) Physical Presence
(Dynamic or Static) MBTA (non T&E) bird
(Herring Gull) 0 0 0 0 0 0 1 0 1
Fish (NJ) Noise T&E bird (Roseate Tern) 1 0 0 0 0 0 0 0 1 Fish (NJ) Noise T&E bird (Osprey) 1 0 0 0 0 0 0 0 1
Fish (NJ) Noise MBTA (non T&E) bird
(Northern Gannet) 0 0 0 0 0 0 0 0 0
Fish (NJ) Noise MBTA (non T&E) bird
(Herring Gull) 0 0 0 0 0 0 0 0 0
Fish (NJ) Accidents or
Disasters T&E bird (Roseate Tern)
1 0 0 0 0 0 0 0.5 1.5
Fish (NJ) Accidents or
Disasters T&E bird (Osprey)
1 0 0 0 0 0 0 0.5 1.5
Fish (NJ) Accidents or
Disasters MBTA (non T&E) bird
(Northern Gannet) 0 0 0 0 0 0 0 0.5 0.5
Fish (NJ) Accidents or
Disasters MBTA (non T&E) bird
(Herring Gull) 0 0 0 0 0 0 0 0 0
LEEDCo (OH)
Physical Presence (Dynamic or Static)
T&E bird (Piping Plover) 1 0 0 0 0 0 1 1 3
LEEDCo (OH)
Physical Presence (Dynamic or Static)
T&E bird (Common Tern- OH-E)
1 0 0 0 0 0 1 1 3
LEEDCo (OH)
Physical Presence (Dynamic or Static)
MBTA (non T&E) bird (Red-breasted Merganser)
0 0 0 0 0 0 1 1 2
LEEDCo (OH)
Physical Presence (Dynamic or Static)
MBTA (non T&E) bird (Herring Gull)
0 0 0 0 0 0 1 0 1
LEEDCo (OH)
Noise T&E bird (Piping Plover)
1 0 0 0 0 0 0 0 1
LEEDCo (OH)
Noise T&E bird (Common Tern-
OH-E) 1 0 0 0 0 0 0 0 1
LEEDCo (OH)
Noise MBTA (non T&E) bird
(Red-breasted Merganser) 0 0 0 0 0 0 0 0 0
LEEDCo Noise MBTA (non T&E) bird 0 0 0 0 0 0 0 0 0

A.5
Tec
hn
olog
y
Str
esso
r
Vu
lner
able
Rec
epto
r
Ris
k f
rom
Sm
all P
opu
lati
on
At
Ris
k L
ife
Sta
ge
Ris
k t
o C
riti
cal P
rey
Ris
k t
o C
riti
cal H
abit
ats
Ris
k f
rom
Pre
dat
ion
Ris
k f
rom
Com
pet
itio
n
Beh
avio
r th
at I
ncr
ease
s R
isk
Ris
k t
o S
ust
ain
ing
Pop
ulat
ion
s
Su
m
(OH) (Herring Gull) LEEDCo
(OH) Accidents or
Disasters T&E bird (Piping Plover)
1 0 0 0 0 0 0 0.5 1.5
LEEDCo (OH)
Accidents or Disasters
T&E bird (Common Tern- OH-E)
1 0 0 0 0 0 0 0.5 1.5
LEEDCo (OH)
Accidents or Disasters
MBTA (non T&E) bird (Red-breasted Merganser)
0 0 0 0 0 0 0 0.5 0.5
LEEDCo (OH)
Accidents or Disasters
MBTA (non T&E) bird (Herring Gull)
0 0 0 0 0 0 0 0 0

A.6
Invertebrate Receptor Group
Tec
hn
olog
y
Str
esso
r
Vu
lner
able
Rec
epto
r
Ris
k f
rom
Sm
all P
opu
lati
on
At
Ris
k L
ife
Sta
ge
Ris
k t
o C
riti
cal P
rey
Ris
k t
o C
riti
cal H
abit
ats
Ris
k f
rom
Pre
dat
ion
Ris
k f
rom
Com
pet
itio
n
Beh
avio
r th
at I
ncr
ease
s R
isk
Ris
k t
o S
ust
ain
ing
Pop
ulat
ion
s
Su
m
Fish (NJ)
Physical Presence (Dynamic or Static)
non T&E benthic invertebrate (Atlantic Surf Clam)
0 0.5 0 0 0 0 0 0 0.5
Fish (NJ)
Noise non T&E benthic invertebrate
(Atlantic Surf Clam) 0 0 0 0 0 0 0 0 0
Fish (NJ)
Cables/EMF non T&E benthic invertebrate
(Atlantic Surf Clam) 0 0 0 0 0 0 0 0 0
Fish (NJ)
Chemical Leaching non T&E benthic invertebrate
(Atlantic Surf Clam) 0 0.5 0 0 0 0 0 0 0.5
Fish (NJ)
Accidents or Disasters
non T&E benthic invertebrate (Atlantic Surf Clam)
0 0.5 0 0 0 0 0 0 0.5

A.7
Reptile Receptor Group T
ech
nol
ogy
Str
esso
r
Vu
lner
able
Rec
epto
r
Ris
k f
rom
Sm
all P
opu
lati
on
At
Ris
k L
ife
Sta
ge
Ris
k t
o C
riti
cal P
rey
Ris
k t
o C
riti
cal H
abit
ats
Ris
k f
rom
Pre
dat
ion
Ris
k f
rom
Com
pet
itio
n
Beh
avio
r th
at I
ncr
ease
s R
isk
Ris
k t
o S
ust
ain
ing
Pop
ulat
ion
s
Su
m
Fish (NJ)
Physical Presence (Dynamic or Static)
T&E reptile (loggerhead)
1 0 0 0 0 0 0 0 1
Fish (NJ)
Physical Presence (Dynamic or Static)
T&E reptile (leatherback)
1 0 0 0 0 0 0 0 1
Fish (NJ)
Noise T&E reptile (loggerhead)
1 0 0 0 0 0 0 0 1
Fish (NJ)
Noise T&E reptile (leatherback)
1 0 0 0 0 0 0 0 1
Fish (NJ)
Cables/EMF T&E reptile (loggerhead)
1 0 0 0 0 0 0.5 0 1.5
Fish (NJ)
Cables/EMF T&E reptile (leatherback)
1 0 0 0 0 0 0.5 0 1.5
Fish (NJ)
Chemical Leaching T&E reptile (loggerhead)
1 0 0 0 0 0 0 0 1
Fish (NJ)
Chemical Leaching T&E reptile (leatherback)
1 0 0 0 0 0 0 0 1
Fish (NJ)
Accidents or Disasters T&E reptile (loggerhead)
1 0.5 0 0 0 0 0 0 1.5
Fish (NJ)
Accidents or Disasters T&E reptile (leatherback)
1 0.5 0 0 0 0 0 0 1.5
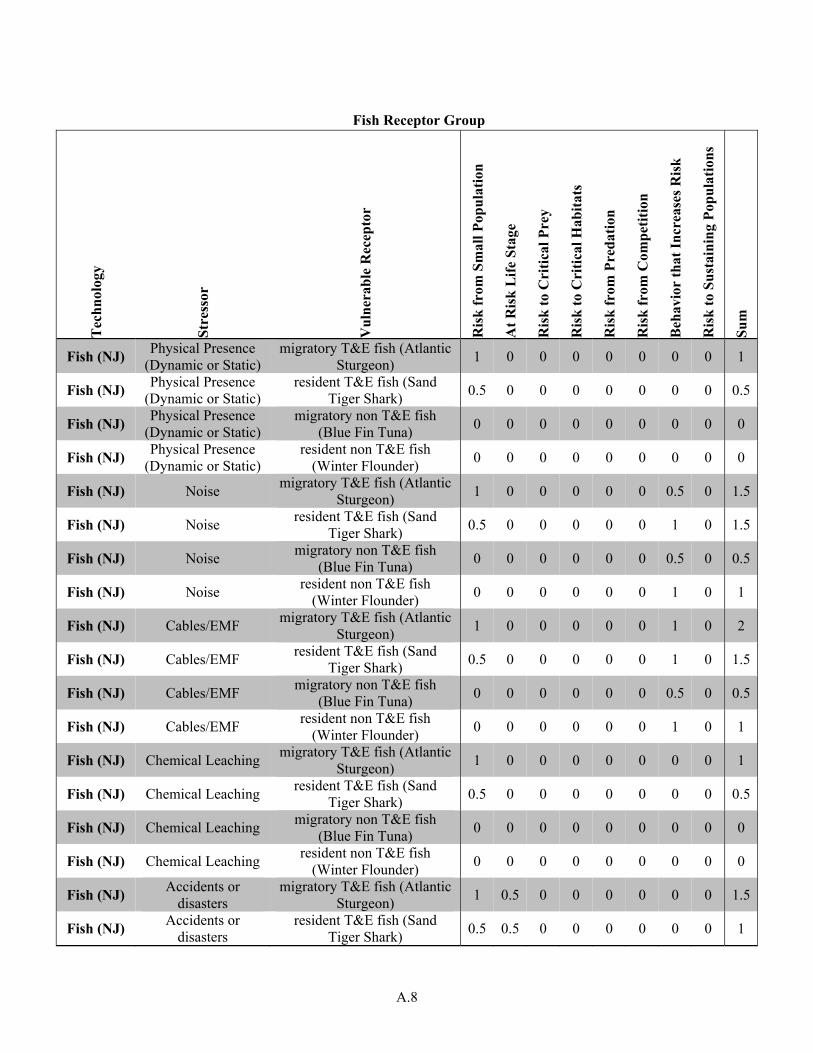
A.8
Fish Receptor Group
Tec
hn
olog
y
Str
esso
r
Vu
lner
able
Rec
epto
r
Ris
k f
rom
Sm
all P
opu
lati
on
At
Ris
k L
ife
Sta
ge
Ris
k t
o C
riti
cal P
rey
Ris
k t
o C
riti
cal H
abit
ats
Ris
k f
rom
Pre
dat
ion
Ris
k f
rom
Com
pet
itio
n
Beh
avio
r th
at I
ncr
ease
s R
isk
Ris
k t
o S
ust
ain
ing
Pop
ulat
ion
s
Su
m
Fish (NJ) Physical Presence
(Dynamic or Static) migratory T&E fish (Atlantic
Sturgeon) 1 0 0 0 0 0 0 0 1
Fish (NJ) Physical Presence
(Dynamic or Static) resident T&E fish (Sand
Tiger Shark) 0.5 0 0 0 0 0 0 0 0.5
Fish (NJ) Physical Presence
(Dynamic or Static) migratory non T&E fish
(Blue Fin Tuna) 0 0 0 0 0 0 0 0 0
Fish (NJ) Physical Presence
(Dynamic or Static) resident non T&E fish
(Winter Flounder) 0 0 0 0 0 0 0 0 0
Fish (NJ) Noise migratory T&E fish (Atlantic
Sturgeon) 1 0 0 0 0 0 0.5 0 1.5
Fish (NJ) Noise resident T&E fish (Sand
Tiger Shark) 0.5 0 0 0 0 0 1 0 1.5
Fish (NJ) Noise migratory non T&E fish
(Blue Fin Tuna) 0 0 0 0 0 0 0.5 0 0.5
Fish (NJ) Noise resident non T&E fish
(Winter Flounder) 0 0 0 0 0 0 1 0 1
Fish (NJ) Cables/EMF migratory T&E fish (Atlantic
Sturgeon) 1 0 0 0 0 0 1 0 2
Fish (NJ) Cables/EMF resident T&E fish (Sand
Tiger Shark) 0.5 0 0 0 0 0 1 0 1.5
Fish (NJ) Cables/EMF migratory non T&E fish
(Blue Fin Tuna) 0 0 0 0 0 0 0.5 0 0.5
Fish (NJ) Cables/EMF resident non T&E fish
(Winter Flounder) 0 0 0 0 0 0 1 0 1
Fish (NJ) Chemical Leaching migratory T&E fish (Atlantic
Sturgeon) 1 0 0 0 0 0 0 0 1
Fish (NJ) Chemical Leaching resident T&E fish (Sand
Tiger Shark) 0.5 0 0 0 0 0 0 0 0.5
Fish (NJ) Chemical Leaching migratory non T&E fish
(Blue Fin Tuna) 0 0 0 0 0 0 0 0 0
Fish (NJ) Chemical Leaching resident non T&E fish
(Winter Flounder) 0 0 0 0 0 0 0 0 0
Fish (NJ) Accidents or
disasters migratory T&E fish (Atlantic
Sturgeon) 1 0.5 0 0 0 0 0 0 1.5
Fish (NJ) Accidents or
disasters resident T&E fish (Sand
Tiger Shark) 0.5 0.5 0 0 0 0 0 0 1

A.9
Tec
hn
olog
y
Str
esso
r
Vu
lner
able
Rec
epto
r
Ris
k f
rom
Sm
all P
opu
lati
on
At
Ris
k L
ife
Sta
ge
Ris
k t
o C
riti
cal P
rey
Ris
k t
o C
riti
cal H
abit
ats
Ris
k f
rom
Pre
dat
ion
Ris
k f
rom
Com
pet
itio
n
Beh
avio
r th
at I
ncr
ease
s R
isk
Ris
k t
o S
ust
ain
ing
Pop
ulat
ion
s
Su
m
Fish (NJ) Accidents or
disasters migratory non T&E fish
(Blue Fin Tuna) 0.5 0 0 0 0 0 0 0 0.5
Fish (NJ) Accidents or
disasters resident non T&E fish
(Winter Flounder) 0.5 0.5 0 0 0 0 0 0 1
LEEDCo (OH)
Physical Presence (Dynamic or Static)
Migratory T&E fish (Lake Sturgeon)
1 0 0 0 0 0 0.5 0 1.5
LEEDCo (OH)
Physical Presence (Dynamic or Static)
migratory non T&E fish (walleye)
0 0 0 0 0 0 0 0 0
LEEDCo (OH)
Physical Presence (Dynamic or Static)
resident non T&E fish (yellow perch)
0 0 0 0 0 0 0.5 0 0.5
LEEDCo (OH)
Noise Migratory T&E fish (Lake
Sturgeon) 1 0 0 0 0 0 0.5 0 1.5
LEEDCo (OH)
Noise migratory non T&E fish
(walleye) 0 0 0 0 0 0 0.5 0 0.5
LEEDCo (OH)
Noise resident non T&E fish
(yellow perch) 0 0 0 0 0 0 0.5 0 0.5
LEEDCo (OH)
Cables/EMF Migratory T&E fish (Lake
Sturgeon) 1 0 0 0 0 0 1 0 2
LEEDCo (OH)
Cables/EMF migratory non T&E fish
(walleye) 0 0 0 0 0 0 0 0 0
LEEDCo (OH)
Cables/EMF resident non T&E fish
(yellow perch) 0 0 0 0 0 0 0 0 0
LEEDCo (OH)
Chemical Leaching Migratory T&E fish (Lake
Sturgeon) 1 0 0 0 0 0 0 0 1
LEEDCo (OH)
Chemical Leaching migratory non T&E fish
(walleye) 0 0 0 0 0 0 0 0 0
LEEDCo (OH)
Chemical Leaching resident non T&E fish
(yellow perch) 0 0 0 0 0 0 0 0 0
LEEDCo (OH)
Accidents or disasters
Migratory T&E fish (Lake Sturgeon)
1 0.5 0 0 0 0 0 0 1.5
LEEDCo (OH)
Accidents or disasters
migratory non T&E fish (walleye)
0.5 0 0 0 0 0 0 0 0.5
LEEDCo (OH)
Accidents or disasters
resident non T&E fish (yellow perch)
0.5 0 0 0 0 0 0 0 0.5

A.10
Bat Receptor Group C
ase
Stu
dy
Sit
e
Str
esso
r
Vu
lner
able
Rec
epto
r
Ris
k f
rom
Sm
all P
opu
lati
on
At
Ris
k L
ife
Sta
ge
Ris
k t
o C
riti
cal P
rey
Ris
k t
o C
riti
cal H
abit
ats
Ris
k f
rom
Pre
dat
ion
Ris
k f
rom
Com
pet
itio
n
Beh
avio
r th
at I
ncr
ease
s R
isk
Ris
k t
o S
ust
ain
ing
Po p
ula
tion
s
Su
m
Fish (NJ)
Physical Presence (Dynamic or Static)
non T&E bat (Eastern Red Bat)
0 0 0 0 0 0 1 1 2
Fish (NJ)
Noise non T&E bat (Eastern
Red Bat) 0 0 0 0 0 0 0 0 0
LEEDCo (OH)
Physical Presence (Dynamic or Static)
T&E bat (Indiana Bat) 1 0 0 0 0 0 1 1 3
LEEDCo (OH)
Physical Presence (Dynamic or Static)
non T&E bat (Big Brown Bat)
0.5 0 0 0 0 0 1 1 2.5
LEEDCo (OH)
Noise T&E bat (Indiana Bat) 1 0 0 0 0 0 0 0 1
LEEDCo (OH)
Noise non T&E bat (Big Brown
Bat) 0.5 0 0 0 0 0 0 0 0.5

A.11
Near-Field Habitat Receptor Group T
ech
nol
ogy
Str
esso
r
Vu
lner
able
Rec
epto
r
Ris
k f
rom
Siz
e of
Hab
itat
Ris
k f
rom
Red
uct
ion
s in
Sed
imen
t/S
cou
r
Su
m
Fish (NJ) Changes in flow regime Near Field Habitat (Sand) 0 1 1
Fish (NJ) Physical presence Near Field Habitat (Sand) 0.5 0 0.5
Fish (NJ) Leaching of toxic chemicals Near Field Habitat (Sand) 0 0 0
Fish (NJ) Accident/Disaster Near Field Habitat (Sand) 0.5 1 1.5
LEEDCo (OH) Changes in flow regime Near Field Habitat (Sand) 0 1 1
LEEDCo (OH) Physical presence Near Field Habitat (Sand) 0.5 0 0.5
LEEDCo (OH) Leaching of toxic chemicals Near Field Habitat (Sand) 0 0 0
LEEDCo (OH) Accident/Disaster Near Field Habitat (Sand) 0.5 1 1.5
Far-Field Habitat Receptor Group
Tec
hn
olog
y
Str
esso
r
Vu
lner
able
Rec
epto
r
Cir
cula
tion
tha
t A
ffec
ts W
ater
Qu
alit
y
Cir
cula
tion
tha
t A
ffec
ts S
edim
ent
Pat
tern
s
Cir
cula
tion
tha
t A
ffec
ts F
ood
Web
Ris
k t
o N
ears
hor
e H
abit
at
Su
m
Fish (NJ) Accident/Disaster Farfield Habitat 1 0 1 0.5 2.5
Fish (NJ) Energy Removal Farfield (in water) 0.5 1 0.5 0 2
Fish (NJ) Energy Removal Farfield (Atmospheric Alteration) 0 0.5 0 0 0.5
LEEDCo (OH) Accident/Disaster Farfield Habitat 1 0 1 0.5 2.5
LEEDCo (OH) Energy Removal Farfield (In water) 0.5 1 0.5 0 2
LEEDCo (OH) Energy Removal Farfield (Atmospheric Alteration) 0 0.5 0 0 0.5

A.12
List B. Biophysical Rank as Modified by Regulatory Rank
Fishermen’s Energy (NJ) T
ech
nol
ogy
Str
esso
r
Vu
lner
able
rec
epto
r
Reg
ula
tory
Ris
k R
ank
Bio
ph
ysic
al R
elat
ive
Ran
k
Tier 1 Fish (NJ) Physical Presence (Dyn. or Stat.) T&E bird (Roseate Tern) 1 1
Tier 2
Fish (NJ) Accidents or Disasters T&E Cetacean (Fin Whale) 1 3 Fish (NJ) Cables/EMF migratory T&E fish (Atlantic Sturgeon) 1 3
Tier 3
Fish (NJ) Noise T&E Cetacean (Fin Whale) 1 4 Fish (NJ) Accidents or Disasters T&E bird (Roseate Tern) 1 4 Fish (NJ) Cables/EMF T&E reptile (loggerhead) 1 4 Fish (NJ) Cables/EMF T&E reptile (leatherback) 1 4 Fish (NJ) Accidents or Disasters T&E reptile (loggerhead) 1 4 Fish (NJ) Accidents or Disasters T&E reptile (leatherback) 1 4 Fish (NJ) Noise migratory T&E fish (Atlantic Sturgeon) 1 4 Fish (NJ) Accidents or Disasters migratory T&E fish (Atlantic Sturgeon) 1 4
Tier 4
Fish (NJ) Physical Presence (Dyn. or Stat.) T&E Cetacean (Fin Whale) 1 5 Fish (NJ) Cables/EMF T&E Cetacean (Fin Whale) 1 5 Fish (NJ) Chemical Leaching T&E Cetacean (Fin Whale) 1 5 Fish (NJ) Noise T&E bird (Roseate Tern) 1 5 Fish (NJ) Physical Presence (Dyn. or Stat.) T&E reptile (loggerhead) 1 5 Fish (NJ) Physical Presence (Dyn. or Stat.) T&E reptile (leatherback) 1 5 Fish (NJ) Noise T&E reptile (loggerhead) 1 5 Fish (NJ) Noise T&E reptile (leatherback) 1 5 Fish (NJ) Chemical Leaching T&E reptile (loggerhead) 1 5 Fish (NJ) Chemical Leaching T&E reptile (leatherback) 1 5 Fish (NJ) Physical Presence (Dyn. or Stat.) migratory T&E fish (Atlantic Sturgeon) 1 5 Fish (NJ) Chemical Leaching migratory T&E fish (Atlantic Sturgeon) 1 5
Tier 5
Fish (NJ) Energy Removal Farfield (Atmospheric Alteration) 2 6 Tier 6
Fish (NJ) Physical Presence (Dyn. or Stat.) T&E bird (Osprey) 3 1 Fish (NJ) Physical Presence (Dyn. or Stat.) MBTA (non T&E) bird (Northern Gannet) 3 4

A.13
Tec
hn
olog
y
Str
esso
r
Vu
lner
able
rec
epto
r
Reg
ula
tory
Ris
k R
ank
Bio
ph
ysic
al R
elat
ive
Ran
k
Fish (NJ) Accidents or Disasters T&E bird (Osprey) 3 4 Fish (NJ) Accident or Disaster Near Field Habitat (Sand) 3 4 Fish (NJ) Accidents or Disasters non T&E Pinniped (Harbor Seal) 3 5 Fish (NJ) Accidents or Disasters non T&E Cetacean (Bottlenose Dolphin) 3 5 Fish (NJ) Physical Presence (Dyn. or Stat.) MBTA (non T&E) bird (Herring Gull) 3 5 Fish (NJ) Noise T&E bird (Osprey) 3 5 Fish (NJ) Noise non T&E Pinniped (Harbor Seal) 3 6 Fish (NJ) Noise non T&E Cetacean (Bottlenose Dolphin) 3 6 Fish (NJ) Accidents or Disasters MBTA (non T&E) bird (Northern Gannet) 3 6 Fish (NJ) Physical Presence (Dyn. or Stat.) non T&E benthic invertebrate (Atlantic Surf Clam) 3 6 Fish (NJ) Chemical Leaching non T&E benthic invertebrate (Atlantic Surf Clam) 3 6 Fish (NJ) Accidents or Disasters non T&E benthic invertebrate (Atlantic Surf Clam) 3 6 Fish (NJ) Physical Presence (Dyn. or Stat.) non T&E Pinniped (Harbor Seal) 3 7 Fish (NJ) Physical Presence (Dyn. or Stat.) non T&E Cetacean (Bottlenose Dolphin) 3 7 Fish (NJ) Cables/EMF non T&E Pinniped (Harbor Seal) 3 7 Fish (NJ) Cables/EMF non T&E Cetacean (Bottlenose Dolphin) 3 7 Fish (NJ) Chemical Leaching non T&E Pinniped (Harbor Seal) 3 7 Fish (NJ) Chemical Leaching non T&E Cetacean (Bottlenose Dolphin) 3 7 Fish (NJ) Noise MBTA (non T&E) bird (Northern Gannet) 3 7 Fish (NJ) Noise MBTA (non T&E) bird (Herring Gull) 3 7 Fish (NJ) Accidents or Disasters MBTA (non T&E) bird (Herring Gull) 3 7 Fish (NJ) Noise non T&E benthic invertebrate (Atlantic Surf Clam) 3 7 Fish (NJ) Cables/EMF non T&E benthic invertebrate (Atlantic Surf Clam) 3 7
Tier 7
Fish (NJ) Accident or Disasters Farfield Habitat 4 2 Fish (NJ) Physical Presence (Dyn. or Stat.) non T&E bat (Eastern Red Bat) 4 3 Fish (NJ) Energy Removal Farfield (in water) 4 3 Fish (NJ) Noise resident T&E fish (Sand Tiger Shark) 4 4 Fish (NJ) Cables/EMF resident T&E fish (Sand Tiger Shark) 4 4 Fish (NJ) Noise resident non T&E fish (Winter Flounder) 4 5 Fish (NJ) Cables/EMF resident non T&E fish (Winter Flounder) 4 5 Fish (NJ) Accidents or Disasters resident T&E fish (Sand Tiger Shark) 4 5 Fish (NJ) Accidents or Disasters resident non T&E fish (Winter Flounder) 4 5 Fish (NJ) Changes in flow regime Near Field Habitat (Sand) 4 5 Fish (NJ) Physical Presence (Dyn. or Stat.) resident T&E fish (Sand Tiger Shark) 4 6

A.14
Tec
hn
olog
y
Str
esso
r
Vu
lner
able
rec
epto
r
Reg
ula
tory
Ris
k R
ank
Bio
ph
ysic
al R
elat
ive
Ran
k
Fish (NJ) Noise migratory non T&E fish (Blue Fin Tuna) 4 6 Fish (NJ) Cables/EMF migratory non T&E fish (Blue Fin Tuna) 4 6 Fish (NJ) Chemical Leaching resident T&E fish (Sand Tiger Shark) 4 6 Fish (NJ) Accidents or Disasters migratory non T&E fish (Blue Fin Tuna) 4 6 Fish (NJ) Physical presence Near Field Habitat (Sand) 4 6 Fish (NJ) Physical Presence (Dyn. or Stat.) migratory non T&E fish (Blue Fin Tuna) 4 7 Fish (NJ) Physical Presence (Dyn. or Stat.) resident non T&E fish (Winter Flounder) 4 7 Fish (NJ) Chemical Leaching migratory non T&E fish (Blue Fin Tuna) 4 7 Fish (NJ) Chemical Leaching resident non T&E fish (Winter Flounder) 4 7 Fish (NJ) Noise non T&E bat (Eastern Red Bat) 4 7 Fish (NJ) Leaching of toxic chemicals Near Field Habitat (Sand) 4 7

A.15
LEEDCo (OH) T
ech
nol
ogy
Str
esso
r
Vu
lner
able
rec
epto
r
Reg
ula
tory
Ris
k R
ank
Bio
ph
ysic
al R
elat
ive
Ran
k
Tier 1
LEEDCo (OH) Physical Presence (Dyn. or Stat.) T&E bird (Piping Plover) 1 1 LEEDCo (OH) Physical Presence (Dyn. or Stat.) T&E bat (Indiana Bat) 1 1 Tier 2 LEEDCo (OH) Accidents or Disasters T&E bird (Piping Plover) 1 4 Tier 3 LEEDCo (OH) Noise T&E bird (Piping Plover) 1 5 LEEDCo (OH) Noise T&E bat (Indiana Bat) 1 5 Tier 4 LEEDCo (OH) Physical Presence (Dyn. or Stat.) Migratory T&E fish (Lake Sturgeon) 2 4 Tier 5 LEEDCo (OH) Physical Presence (Dyn. or Stat.) T&E bird (Common Tern) 3 1 LEEDCo (OH) Physical Presence (Dyn. or Stat.)
MBTA (non T&E) bird (R-breasted Merganser) 3 3
LEEDCo (OH) Accidents or Disasters T&E bird (Common Tern) 3 4 LEEDCo (OH) Accident/Disaster Near Field Habitat (Sand) 3 4 LEEDCo (OH) Physical Presence (Dyn. or Stat.) MBTA (non T&E) bird (Herring Gull) 3 5 LEEDCo (OH) Noise T&E bird (Common Tern) 3 5 LEEDCo (OH) Accidents or Disasters
MBTA (non T&E) bird (R-breasted Merganser) 3 6
LEEDCo (OH) Noise
MBTA (non T&E) bird (R-breasted Merganser) 3 7
LEEDCo (OH) Noise MBTA (non T&E) bird (Herring Gull) 3 7 LEEDCo (OH) Accidents or Disasters MBTA (non T&E) bird (Herring Gull) 3 7

A.16
Tec
hn
olog
y
Str
esso
r
Vu
lner
able
rec
epto
r
Reg
ula
tory
Ris
k R
ank
Bio
ph
ysic
al R
elat
ive
Ran
k
Tier 6 LEEDCo (OH) Physical Presence (Dyn. or Stat.) non T&E bat (Big Brown Bat) 4 2 LEEDCo (OH) Cables/EMF Migratory T&E fish (Lake Sturgeon) 4 3 LEEDCo (OH) Noise Migratory T&E fish (Lake Sturgeon) 4 4 LEEDCo (OH) Accidents or Disasters Migratory T&E fish (Lake Sturgeon) 4 4 LEEDCo (OH) Chemical Leaching Migratory T&E fish (Lake Sturgeon) 4 5 LEEDCo (OH) Changes in flow regime Near Field Habitat (Sand) 4 5 LEEDCo (OH) Physical Presence (Dyn. or Stat.) resident non T&E fish (yellow perch) 4 6 LEEDCo (OH) Noise migratory non T&E fish (walleye) 4 6 LEEDCo (OH) Noise resident non T&E fish (yellow perch) 4 6 LEEDCo (OH) Accidents or Disasters migratory non T&E fish (walleye) 4 6 LEEDCo (OH) Accidents or Disasters resident non T&E fish (yellow perch) 4 6 LEEDCo (OH) Noise non T&E bat (Big Brown Bat) 4 6 LEEDCo (OH) Physical presence Near Field Habitat (Sand) 4 6 LEEDCo (OH) Physical Presence (Dyn. or Stat.) migratory non T&E fish (walleye) 4 7 LEEDCo (OH) Cables/EMF migratory non T&E fish (walleye) 4 7 LEEDCo (OH) Cables/EMF resident non T&E fish (yellow perch) 4 7 LEEDCo (OH) Chemical Leaching migratory non T&E fish (walleye) 4 7 LEEDCo (OH) Chemical Leaching resident non T&E fish (yellow perch) 4 7 LEEDCo (OH) Leaching of toxic chemicals Near Field Habitat (Sand) 4 7 LEEDCo (OH) Accident/Disaster Farfield Habitat 4 7

A.17
Tec
hn
olog
y
Str
esso
r
Vu
lner
able
rec
epto
r
Reg
ula
tory
Ris
k R
ank
Bio
ph
ysic
al R
elat
ive
Ran
k
LEEDCo (OH) Energy Removal Farfield (In water) 4 7 LEEDCo (OH) Energy Removal Farfield (Atmospheric Alteration) 4 7


