screening for postmenopausal osteoporosis: a summary of
TRANSCRIPT
EpidemiologyHalf of all postmenopausal women will have an
osteoporosis-related fracture during their lives,including one-quarter who will develop a vertebraldeformity1 and 15% who will suffer a hip fracture.2
Hip fractures are associated with high mortality ratesand loss of independence.3,4 Although manyvertebral fractures are detected only incidentally onradiography, some cause severe pain, leading to150,000 hospital admissions per year in personsolder than 65, 161,000 physician office visits, andmore than 5 million days of restricted activity inthose 45 years of age or older.5
Low bone density has been used to predict riskfor fractures as well as to diagnose osteoporosis.Osteoporosis has been defined as “a systemic skeletaldisease characterized by low bone mass andmicroarchitectural deterioration of bone tissue,leading to enhanced bone fragility and a consequentincrease in fracture risk.”6,7 This definitionemphasizes that, in addition to bone mass, the
structure of bone is also an important factor in thepathogenesis of fractures.
A World Health Organization working group8
proposed that osteoporosis should be diagnosed inepidemiologic studies when bone mineral density is2.5 standard deviations (SDs) or more below themean for healthy young adult women at the spine,hip, or wrist (corresponding to a T-score of ≤-2.5) orwhen patients have a history of an atraumaticfracture.9 By the World Health Organizationdefinition, up to 70% of women older than 80 haveosteoporosis.10 Age is also an important factor in therelationship between bone density and the absoluterisk for fracture. Older women have a much higherfracture rate than younger women with the samebone density because of increasing risk from otherfactors, such as bone quality and tendency to fall.11
Despite the high prevalence of osteoporosis andthe effect of fractures on mortality, independence,and quality of life, it is not clear whether it isappropriate to screen asymptomatic postmenopausal
219
Screening for Postmenopausal Osteoporosis: A Summary of the EvidenceHeidi D. Nelson, MD, MPH; Mark Helfand, MD, MPH; Steven H. Woolf, MD, MPH; Janet D.Allan, PhD, RN
From the Evidence-based Practice Center and Division of Medical Informatics and Outcomes Research, Oregon Health & ScienceUniversity (Nelson, Helfand), Portland, Oregon; Medical Service, Veterans Affairs Medical Center (Nelson, Helfand), Portland,Oregon; Department of Family Practice, Virginia Commonwealth University (Woolf ), Fairfax, Virginia; School of Nursing, TheUniversity of Maryland, Baltimore (Allan), Baltimore, Maryland.
The authors of this article are responsible for its contents, including any clinical or treatment recommendations. No statement inthis article should be construed as an official position of the U.S. Agency for Healthcare Research and Quality or the U.S.Department of Health and Human Services.
Address correspondence to: Heidi D. Nelson MD, MPH, Oregon Health & Science University, Mail code BICC 504, 3181 SWSam Jackson Park Road, Portland, Oregon 97201. E-mail: [email protected].
Reprints are available from the AHRQ Web site (www.preventiveservices.ahrq.gov), through the National Guideline Clearinghouse(www.guideline.gov), or in print through the AHRQ Publications Clearinghouse ( call 1-800-358-9295 or [email protected]).
The USPSTF recommendations based on this evidence review can be found in Screening for Osteoporosis in PostmenopausalWomen: Recommendations and Rationale (which precedes this chapter), available on the AHRQ Web site and through the AHRQPublications Clearinghouse.
This chapter first appeared as an article in Ann Intern Med. 2002;137(6):529-541.
women. Recent systematic reviews and guidelinesdisagree about which women should be screened andwhen.12-20 This disagreement reflects, in part, gaps inthe evidence. For example, most guidelinesrecommend using risk factors to select patients forbone density testing, but because of inadequate datathere is no consensus on which risk factors to use.
As part of the U.S. Preventive Services Task Force(USPSTF) update of its 1996 recommendation,21 weexamined evidence on the benefits and harms ofscreening postmenopausal women for osteoporosis.Specifically, we addressed the role of risk factors inidentifying high-risk women, techniques of bonedensity testing to identify fracture risks, effectivenessof treatment in reducing fracture risk, and harms ofscreening and treatment.
MethodsAdditional methods used for this review,
including determination of the quality of studies,22
are detailed in Appendix Tables 1, 2, and 3 and in aseparate report.23 The analytic framework and keyquestions are detailed in Appendix Figure 1.Relevant studies were identified from multiplesearches of MEDLINE (1966 to May 2001),HealthSTAR (1975 to May 2001), and Cochranedatabases; reference lists of systematic reviews; andexperts. We also sent letters to manufacturers ofbone density devices requesting additionalinformation about the performance of theirinstruments, but we received no new data.
Two reviewers read each abstract to determine itseligibility. We included English-language abstractsthat included original data about postmenopausalwomen and osteoporosis and addressed screening, orthe effectiveness of risk factor assessment, bonedensity testing, or treatment. We consideredscreening to be the process of assessingpostmenopausal women without known osteoporosisfor risk of osteoporotic fractures by identification ofrisk factors, including low bone density.Postmenopausal women were those who hadexperienced surgical or natural menopause,regardless of age. Women with pre-existingatraumatic fractures were not considered in thescreening population because they had confirmed
osteoporosis according to the World HealthOrganization definition.
For studies of prediction, we selected articles thatreported the relationship between risk factorassessment methods or bone density tests and bonedensity, bone loss, or fractures. We reviewed studiesof medications used for treatment, and presentresults for bisphosphonates. We focused onrandomized controlled trials of therapies reportingradiographically verified, nontraumatic fractureoutcomes, because fractures are a stronger measureof effectiveness than bone density. We excludedstudies of primary prevention of osteoporosis, suchas the role of nutrition, calcium consumption, andphysical activity. We also excluded secondary causesof osteoporosis, such as corticosteroid use andcertain chronic diseases, and studies that did notprovide sufficient information to determine themethod for selecting patients and for analyzing data.Investigators read the full-text versions of theretrieved papers and re-applied the initial eligibilitycriteria. To assess the internal validity of individualstudies, we applied a set of criteria developed by theUSPSTF (Appendix Table 1).22
In this paper, we highlight studies that areapplicable to current practice standards, have highquality internal validity ratings, and are mostgeneralizable to the U.S. population ofpostmenopausal women under consideration forscreening. We created an outcomes table tosummarize the number of hip and vertebral fracturesprevented based on age-specific prevalence rates andtreatment effects obtained from results of thereviewed studies. We conducted a sensitivity analysisto determine the influence of risk factors on thenumber needed to screen.
This research was funded by the Agency forHealthcare Research and Quality (AHRQ) under acontract to support the work of the USPSTF.Agency staff and Task Force members participated inthe initial design of the study and reviewed interimanalyses and the final manuscript. Additionalreports were distributed for review to content expertsand revised accordingly before preparation of thismanuscript.23,24
Screening for Postmenopausal Osteoporosis
220

Results
Studies of ScreeningWe identified no studies about the effectiveness of
screening in reducing osteoporotic fractures.Without direct evidence from screening studies,recommendations about screening need to rely onevidence that risk factor assessment or bone densitytesting can adequately identify women who couldultimately benefit from treatment.
Risk Factor Assessment Hundreds of studies report associations between
risk factors and low bone density and fractures inpostmenopausal women.24 The most comprehensivestudy of risk factors in a U.S. population is theStudy of Osteoporotic Fractures (SOF), a good-quality prospective study of 9,516 women 65 yearsof age and older.25 In this study, 14 clinical riskfactors were identified as significant predictors of hipfracture in multivariable models (age; maternal hipfracture; no weight gain; height; poor self-ratedhealth; hyperthyroidism; current use ofbenzodiazepines, anticonvulsants, or caffeine; notwalking for exercise; lack of ambulation; inability torise from a chair; poor scores on 2 measures ofvision; high resting pulse; and any fracture since 50years of age). The relative risk for hip fracture perdecrease of 1 SD in calcaneal bone density was 1.6(95% confidence interval [CI], 1.3-1.9). This wascomparable to the magnitude of the relative risks ofmost of the other significant predictors in themodel, which ranged from 1.2 to 2.0. Womenwith at least 5 of the 14 risk factors had increasedrates of hip fractures compared with those who had0 to 2 risk factors at all levels of calcaneal bonedensity.
To determine which risk factors could beimportant in women younger than 65, we reviewed8 observational studies of risk factors and fracturesof various types conducted in populations in whichat least 50% of participants were younger than 65.Table 1 lists risk factors that were statisticallysignificant predictors for fractures in multivariablemodels.26-33 These results could not be quantitativelycombined because risk factors were defineddifferently in each study.
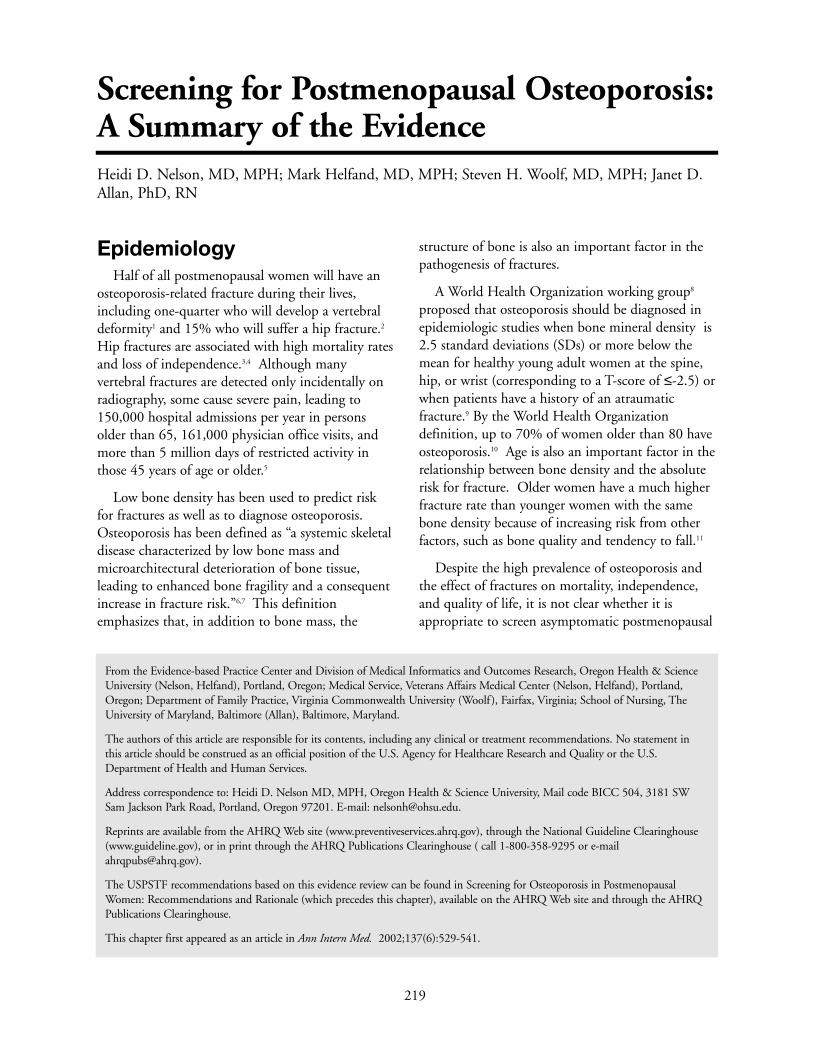
Results of risk factor studies have been used toassess risk in individuals. We identified 10 cross-sectional studies that described methods ofdetermining risk for low bone density for individualwomen based on selected clinical risk factors (Table2 ).34-43 The most common methodologic limitationsof these studies are lack of validation and lack ofgeneralizability because of small numbers of patientsor nonrepresentative patients. We also identified 8studies of clinical risk factors to determine fracturerisk (Table 2).44-51 None of these studies received agood rating for internal validity. Four studiesevaluated hip fracture outcomes, 2 evaluatedvertebral fractures, and 2 evaluated all types offractures. These studies described the association ofrisk factors with fractures known to have occurredalready (4 case-control studies), or how well theywould predict fractures in the future (4 prospectivecohort studies).
A recent study compared the performance of 5clinical decision rules for bone density testing among2,365 postmenopausal women 45 years of age orolder who were enrolled in a community-basedstudy of osteoporosis in Canada.52 These rulesincluded guidelines from the National OsteoporosisFoundation53; the Simple Calculated OsteoporosisRisk Estimation (SCORE) rule (age, weight,ethnicity, estrogen use, presence of rheumatoidarthritis, history of fractures)41; the OsteoporosisRisk Assessment Instrument (ORAI) (age, weight,current use of hormone replacement therapy)43; theAge, Body Size, No Estrogen rule,54 and body weightcriterion (weight <70 kg).38 None of the decisionrules had good discriminant performance. In thisstudy, SCORE and ORAI had the highest areaunder the receiver-operating characteristic curves(0.80 and 0.79, respectively [sensitivity, 99.6 percentand 97.5 percent, and specificity, 17.9 percent and27.8 percent respectively]). Details of how to useSCORE and ORAI are given in Table 2).
Bone Density Tests Several technologies are available to measure bone
density,55-58 although correlations among differentbone density devices are low (0.35 to 0.60).59-79
Dual-energy x-ray absorptiometry (DXA) isconsidered the gold standard because it is the mostextensively validated test against fracture outcomes.
Screening for Postmenopausal Osteoporosis
221

Screening for Postmenopausal Osteoporosis
222
Risk Factor Relative Risk (95% confidence interval) ReferencesAge: per 2 years 1.11 (1.01-1.21) 26
per 5 years 1.94 (1.55-2.42) 27
Body Mass Index per increase of 10 kg/m2 0.58 (0.36-0.92) 27≥25.6 0.7 (0.5-0.9) wrist; 1.6 (1.0-2.4) ankle 26≥28.6 0.5 (0.4-0.7) wrist; 2.0 (1.3-3.1) ankle 26
low 1.1 (1.0-1.2) 29Height: per 0.1 m 1.58 (1.18-2.12) 27Mother with fracture 1.27 (1.16-1.40) 30Grandmother with hip fracture 3.70 (1.55-8.85) 31
Hormone replacement therapyCurrent use 0.82 (0.74-0.91) 30per 5 years use 0.5 (0.2-0.9) 28>2 years use 0.44 (0.22-0.89) 32Long history of use 0.70 (0.50-0.96) 33
African American 0.54 (0.41-0.72) 30Diabetes mellitus 9.17 (3.38-24.92) 27Chronic conditions 1.3 (1.1-1.5) 26Disability pension 3.79 (2.15-6.68) 27Long-term work disability 1.3 (1.1-1.6) 26Self-rated health (fair/poor) 1.79 (1.52-2.11) 30Moderate daily physical activity 0.61 (0.37-0.99) 32Alcohol: ≥100 g/wk 1.70 (1.08-2.67) 33
Regular use 1.4 (1.3-4.4) 291 to 6 drinks/wk 0.85 (0.75-0.96) 30
Smoking Current 1.5 (1.3-1.5); 1.14 (1.00-1.30) 26, 30Former 1.09 (1.00-1.19) 30≥11 cigarettes/day 3.0 (1.9-4.6) 26
Unmarried 2.16 (1.28-3.64) 27College education or higher 1.26 (1.16-1.38) 30Age at menopause 0.94 (0.88-0.99) 32Years since menopause 30
10 to 19 1.18 (1.01-1.38)20 to 29 1.31 (1.12-1.54)30 1.51 (1.26-1.81)
Oophorectomy <45 years 3.64 (1.01-13.04) 335 or more children 2.5 (1.1-6.7) 29
Table 1. Risk factors for fractures in women 50-65 years of age

When used in the same patients, DXA machinesfrom different manufacturers differ in theproportion of patients diagnosed to haveosteoporosis by 6% to 15%.80-85 Published studiesconsistently show that the probability of receiving adiagnosis of osteoporosis depends on the choice oftest and site.86-90 One analytical study, for example,found that 6% of women older than 60 wouldreceive a diagnosis of osteoporosis if DXA of thetotal hip were used as the only test, compared with14% for DXA of the lumbar spine, 3% withquantitative ultrasonography, and 50% withquantitative computed tomography.87
The likelihood of receiving a diagnosis ofosteoporosis also depends on the number of sitestested. Testing in the forearm, hip, spine, or heelgenerally identifies different groups of patients. Forexample, a physician cannot definitively say that apatient does not have osteoporosis on the basis of aforearm test alone. Conversely, although test resultsat any site are associated to some degree withfractures at other sites, a physician may not be ableto assess whether a patient with a low T-score on ahand or forearm test has substantial bone loss atother sites.
A meta-analysis assessed 23 publications from 11separate prospective cohort studies published before1996.91 Nearly all of the data were from women intheir late 60s or older. No studies ofultrasonography were included. The meta-analysisindicated that DXA at the femoral neck predictedhip fracture better than measurements at other sites,and was comparable to forearm measurements forpredicting fractures at other sites.92-94 For bonedensity measurements at the femoral neck, thepooled relative risk per decrease of one SD in bonedensity was 2.6 (CI, 2.0-3.5). In direct comparisons,heel ultrasonography was slightly worse than butcomparable to DXA of the hip in women older than65 (Table 3).92,94-100 For both tests, a result in theosteoporotic range is associated with an increasedshort-term probability of hip fracture. No datacompare DXA and ultrasonography for prediction offracture in women younger than 65.
The National Osteoporosis Risk Assessmentstudy30 recently evaluated the performance ofperipheral densitometry in predicting fractures. This
prospective study of ambulatory postmenopausalwomen 50 years of age or older with no previousosteoporosis diagnoses recruited 200,160participants from 4,236 primary care practices in 34U.S. states. Women received baseline T-scores bymeasuring bone density at the heel (single-energy x-ray absorptiometry or quantitative ultrasonography),forearm (peripheral DXA), or finger (peripheralDXA). After 12 months of follow-up, women withT-scores less than or equal to -2.5 had an adjustedrisk for all types of fractures that was 2.74 (CI, 2.40-3.13) times higher than women with normalbaseline bone density. Results varied by type of testand site; those identified as osteoporotic by DXAhad higher fracture rates. Tests were not comparedwith DXA of the femoral neck, and the study didnot describe how tests performed by age group orrisk category.
TreatmentThe U.S. Food and Drug Administration has
approved hormone replacement therapy,bisphosphonates, raloxifene, and calcitonin forosteoporosis prevention and/or treatment. Ourreview of estrogen and selective estrogen receptormodulators is presented elsewhere.101
A recent meta-analysis102 of 11 randomizedtrials103-113 enrolling 12,855 women found that atleast 5 mg of alendronate per day reduced vertebralfractures in 8 trials (relative risk, 0.52; CI, 0.43-0.65). Alendronate also reduced forearm fractures in6 trials involving 3,723 participants (dosage ≥10mg/d; weighted relative risk, 0.48; CI, 0.29-0.78),hip fractures in 11 trials involving 11,808participants (dosage ≥5 mg/d; weighted relative risk,0.63; CI, 0.43-0.92), and other nonvertebralfractures in 6 trials involving 3,723 participants(dosage 10 to 40 mg/d; weighted relative risk, 0.51;CI, 0.38-0.69). These trials included follow-up dataranging from 1 to 4 years; effect sizes for longerperiods of use are not known. We evaluated datafrom these trials to determine whether women whohave a similar overall risk for fracture but differentbone densities derive a similar benefit fromtreatment. This question is clinically importantbecause accepted criteria for initiating treatment arelacking.
Screening for Postmenopausal Osteoporosis
223

Screening for Postmenopausal O
steoporosis
224
Quality Author Design N Validated Risk Factors Included Outcome Performance Rating*
Bone Density Outcomes
Slemenda, Cross- 124 No Age, height, weight, calcium Correct classification of Midshaft radius: 68% Poor199034 sectional intake, caffeine intake, alcohol high or low BMD (lowest low, 77% high. Lumbar
and tobacco use, urinary third of subjects) spine: 61% low, 45% markers of bone turnover. high. Femoral neck: 66%
low, 53% high.
Falch, 199235 Cross- 73 Yes Low body weight, reduced Bone loss Sensitivity 36%, specificity Poor sectional renal phosphate reabsorption, 89%, PPV 74%.
smoking.
Ribot, 199236 Cross- 1565 No Weight, menopause, duration Vertebral BMD < -2 SD Sensitivity 73%, Fairsectional of menopause. specificity 66%.
Elliot, 199337 Cross- 320 Yes Spine BMD: age, weight, Low lumbar spine and Lumbar spine: sensitivity Fairsectional smoking status, age at femoral neck BMD 86%, specificity 32%.
menarche. Femoral neck BMD: (lowest third of age Femoral neck: sensitivity age, weight, family history, matched normal range) 89%, specificity 25%.activity, smoking status.
Michaelsson, Cross- 175 No Weight > 70kg. Femoral neck BMD Sensitivity 94%, Fair199638 sectional < -2.5 SD specificity 36%, PPV
21%, NPV 97%.
Verhaar, 199839 Cross- 61 No 1.Arm span-height difference BMD ≤ -2.5 SD and Arm span only: sensitivity Poorsectional of at least 3 cm. vertebral fracture 58%, specificity 56%.
2.Arm span-height difference, Arm span, age, arm span age above or below 70, and length: sensitivity 81%, whether arm span was below specificity 64%.or above 160 cm.
Ballard, 199840 Cross- 1158 No Age, age at menopause, height, Osteoporosis of femoral ROC area 0.73. Fairsectional weight, gravidity, parity, current neck and/or spine
use of steroids, current HRT.
Lydick, 1998 Cross- 1279 Yes SCORE = age (3 times first Femoral neck BMD Sensitivity 89%, specificity Good199841 sectional digit of age in years), weight ≤ -2 SD 50%; ROC area 0.81
(- 1 times weight in pounds using a score of 6, or divided by 10 and truncated to greater. integer), race (5 if not black), estrogen use (1 if never used), rheumatoid arthritis (4 if present), history of fractures (4 for each fracture after age 45 of wrist, hip, or rib, to a maximum of 12).
Table 2. Studies of risk factors assessment
Continued on page 225

Continued on page 226
Screening for Postmenopausal O
steoporosis
225
Quality Author Design N Validated Risk Factors Included Outcome Performance Rating*
Goemaere, Cross- 300 No 18-item questionnaire of risk Lumbar spine, femoral Lumbar spine: ROC area Fair199942 sectional factors for osteoporosis (race, neck, and hip BMD 0.66; Femoral neck: ROC
height loss, age, weight, area 0.69; Hip: ROC area smoking, coffee, alcohol, dairy 0.76.product use, activity, family history, existence of comorbidities, history of wrist fracture, menopause before 45 years, corticosteroid use)
Cadarette, Cross- 926 Yes ORAI = age (15 points if ≥75, Hip or lumbar spine Sensitivity 95%, specificity Good200043 sectional 9 if 65-74, 5 if 55-64), weight BMD ≤ -2.5 41% using a score of ≥9.
(9 if <60kg, 3 if 60-69.9 kg), current use of HRT (2 if not currently using).
Fracture Outcomes
Kleerekoper, Case- 663 No Model 1; total months of Vertebral fractures Model 1: ROC area (SE) Fair198944 control lactation, family history of 0.55 (0.07); sensitivity 56%;
osteoporosis, years post specificity 54%. Model 2: menopause, weight. Model 2: ROC 0.51 (0.042); breast fed, surgical menopause, sensitivity 63% specificity age at menarche, age, smoking 39%.status.
van Hemert, Cohort 1014 No Age, metacarpal cortical area, Osteoporotic fractures Sensitivity 48%, Fair199045 relative cortical area, BMI, height, specificity 82%.
diameter of forearm, diameter of knee, age at menarche, age at menopause, smoking, number of children, period of lactation.
Cooper, Case- 1012 No Age, height, vertebral fracture Vertebral fractures Sensitivity 51%, Fair199146 control after age 45, age of last specificity 69%.
menstrual period, number of children, ever use oral corticosteroid.
Wolinsky and Cohort 368 No White race, female gender, Hip fractures ROC 0.71; sensitivity FairFitzgerald 199447 living in southern U.S., age, 64.7%, specificity 65.7%.
having been hospitalized in the previous year, previous fall, body mass.
Table 2. Studies of risk factors assessment (continued)
Screening for Postmenopausal O
steoporosis
226
Quality Author Design N Validated Risk Factors Included Outcome Performance Rating*
Johnell, Case- 5618 No Late menarche, poor mental Hip fractures Sensitivity 55%, Fair199548 control score, low BMI, low physical specificity 65%.
activity, low exposure to sunlight, and low consumption of calcium and tea.
Ranstam, Case- 7474 No Mental-functional risk score: Hip fractures A less than perfect score Fair199649 control knowledge of the day of week, had a sensitivity 46%,
knowledge of age, ability specificity 79%. to wash, ability to dress.
Tromp, 199850 Cohort 1469 No Female gender, living alone, Probability of fractures No predictors = 0%; Fairpast fractures, inactivity, height, 4 predictors = 12.9%use of analgesics.
Burger, 199951 Cohort 5208 No Model with BMD: age, gender, Hip fractures Model with BMD: ROC Fairheight, use of a walking aid, area 0.88; sensitivity 70%,current smoking, BMD of specificity 84%. Model femoral neck. Model without without BMD: ROC area BMD: age, gender, height, 0.83; sensitivity 70%, use of a walking aid, current specificity 83%.smoking, weight.
Table 2. Studies of risk factors assessment (continued)
*Based on criteria developed by the U.S. Preventive Services Task Force (22).
Note: BMD indicates bone mineral density; BMI, body mass index; CI, confidence interval; HRT, hormone replacement therapy; NPV, negative predictive value; PPV, positivepredictive value; ROC, receiver operating characteristic (values ≥0.80 are usually required to consider a text to be effective); RR, relative risk; SE, standard error.

The Fracture Intervention Trial (FIT) ofalendronate was conducted with 2 groups ofparticipants and provides some information aboutlevels of risk. One group (FIT-I) included a higher-risk sample of 2,027 women who had T-scores of -1.6 or lower and pre-existing vertebral fractures.104
The 3-year risk for hip fracture was 2.2% in theplacebo group and 1.1% in the alendronate group(relative hazard, 0.49; CI, 0.23-0.99), and the 3-yearrisk for any clinical fracture was 18.2% in theplacebo group and 13.6% in the alendronate group(relative hazard, 0.72; CI, 0.58-0.90). A secondstudy from FIT (FIT-II) included a lower-risksample of 4,432 women who also had T-scores of -1.6 or lower, but did not have pre-existing vertebralfractures.114 The 4-year incidences of hip fracture(1.1%) and any clinical fractures (14.1%) in theplacebo group were lower than those observed in theFIT-I placebo group. In FIT-II, only the subgroupof treated patients who had T-scores lower than -2.5(n = 1,627) had a significant risk reduction for allclinical fractures, from 19.6% to 13.1% (relativerisk, 0.64; CI, 0.50-0.82). No reduction in risk forfractures was seen in patients who had T-scoresbetween -1.6 and -2.5.
The results from FIT suggest that women withmore risk factors for fracture relating to bonestructure and integrity, such as age, very low bonedensity, or pre-existing vertebral fractures, derive thegreatest absolute benefit from treatment. However,FIT did not examine other nonskeletal risk factors,such as psychomotor impairment, poor gait, andother factors that increase the risk for falling. Theeffect of some of these risk factors on the benefit oftreatment was examined in a randomized trial ofanother bisphosphonate, risedronate.115 Risedronatehad no effect on hip fracture rates among women 80years of age or older who had one or more riskfactors for falls but who did not necessarily have lowbone density. In the same report, in women 70 to 79years of age with severe osteoporosis (T score < -3),risedronate reduced hip fractures by 40% (relativerisk, 0.6; CI, 0.4-0.9; number needed to treat forbenefit, 77).
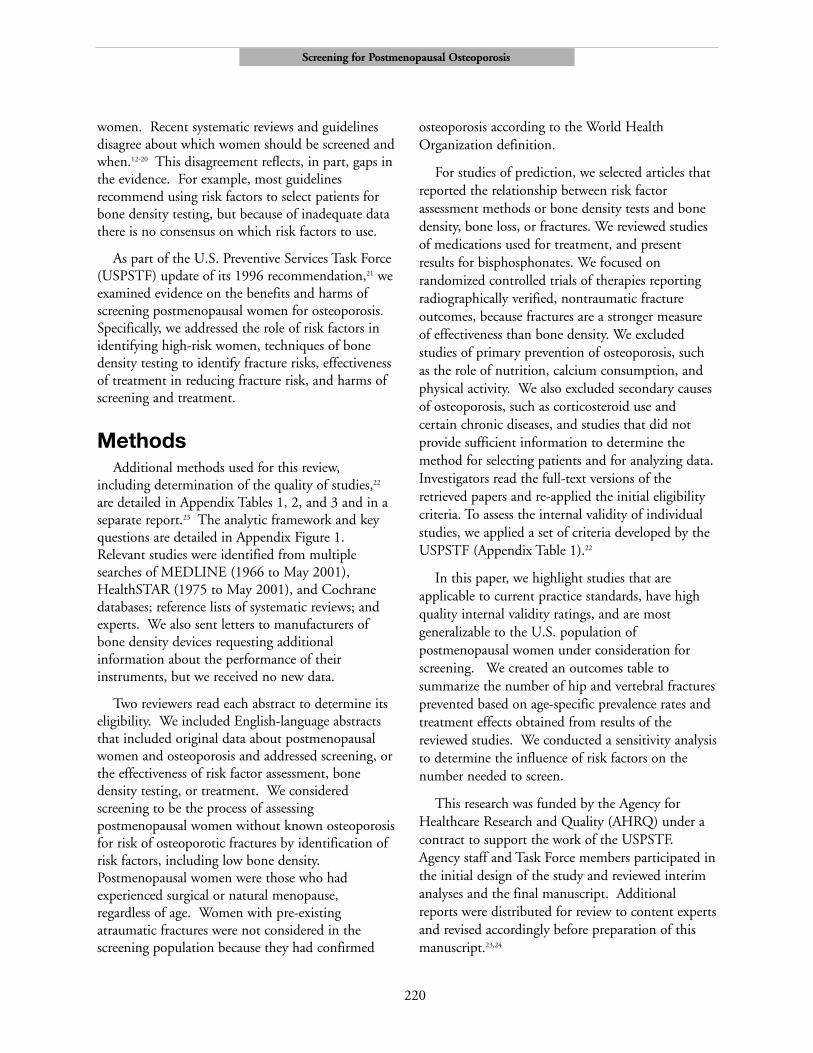
Trial results are not applicable to a screeningprogram unless the trials included patients who
would be identified by screening the generalpopulation. We examined recruitment andeligibility characteristics of 10 of the 11 publishedrandomized trials of alendronate to assess whetherselection biases or other biases might have affectedtheir generalizability (Table 4).103-112 Overall, the trialsincluded relatively healthy women with low bonedensity who were not using estrogen. Except forparticipants in 2 trials involving women who hadrecently gone through menopause and were notosteoporotic, most participants were older than 65.
The FIT-II is the largest study and provided themost detailed description of recruitment andresults.107 In FIT-II, researchers recruited the sampleof 4,432 women by mailing a query to more than 1million women selected from the general populationin 11 cities. Women who had medical problems (forexample, dyspepsia) or who used estrogen wereexcluded. Fifty-four thousand women(approximately 5.4%) responded by telephone; ofthese, 26,137 (52%) had a screening visit. A higherthan expected proportion of these (65%) hadsufficiently low bone density to enroll in the study.Of this 65%, 57% were classified as “ineligible, didnot wish to continue, or screened after recruitmentto this arm.” It is not clear from this descriptionhow many patients did not meet the eligibilitycriteria. In addition, an unspecified number ofpatients (up to 28,000) were found to be ineligibleat the initial stage of recruitment. The demographiccharacteristics of eligible and screened but excludedparticipants were not reported. None of the otherrandomized trials disclosed any details of how theirsamples were recruited or how many respondentswere found to be ineligible before randomization.
In other clinical areas, the results of industry-sponsored trials were significantly more favorable tonewer therapies than trials funded by nonprofitorganizations.116,117 Because all 11 trials ofalendronate were funded wholly or in part by themanufacturer, we were unable to assess the influenceof sponsorship on effect size. If effectiveness oftreatments is less than estimated in these trials, theefficiency of screening to identify candidates fortreatment will be reduced and the number needed toscreen for benefit will increase.
Screening for Postmenopausal Osteoporosis
227

Harms Several potential harms are associated with
screening and treatment. A test result indicatingosteoporosis could produce anxiety and perceivedvulnerability118 that may be unwarranted. On aquality-of-life questionnaire, women withosteoporosis voiced significantly more fears thanwomen who had normal bone density.119 Somewomen may be falsely reassured if abnormal resultsfrom last year’s DXA appear “improved” on thisyear’s normal calcaneal ultrasonogram. Thepotential time, effort, expense, and radiationexposure of repeated scans over a lifetime have notyet been determined.
Potential harms may also arise from inaccuraciesand misinterpretations of bone density tests. Thevariation among techniques, along with the lack ofmethods to integrate bone density results withclinical predictors, makes it difficult for clinicians toprovide accurate information to patients about testresults. In 1 study, physicians found densitometry
reports confusing, and were not confident that theirinterpretations of T-scores were accurate.120 False-positive results could lead to inappropriatetreatment, and false-negative results could lead tomissed treatment opportunities.
Harms of treatment depend on the medicationused. Overall, gastrointestinal side effects occur inapproximately 25% of patients taking alendronate,but in controlled trials these rates were usually notsignificantly higher than those for placebo. Highrates of serious gastrointestinal side effects have beenobserved among Medicare enrollees takingalendronate.121 The long-term adverse effects ofalendronate are unknown.
Costs of screening vary with technique, andaverage 2000 Medicare reimbursement rates were$133 for DXA and $34 for ultrasonography.122
Abnormal results on ultrasonography may require aconfirmatory DXA before treatment because clinicaltrials are based on entry criteria using DXA. Mostwomen would require repeated tests over several
Screening for Postmenopausal Osteoporosis
228
Probability of hip fracture*
DXA of the hip QUS of the heelProbability
Age Followup of hip “low “high “low “highCohort Population range (years) N fracture risk” risk” risk” risk”
Study of Community- ≥65 1.8-2.9 5236 0.009 0.005 0.023 0.006 0.018Osteoporotic dwellingfractures white women 65-79 2.9 0.006 0.23(SOF)92,94-96 from 4 areas in
the U.S. recruited ≥80 2.9from lists
65-69 1.8 2371 0.003 0.0028 0.005
70-74 1.8 3013 0.0076 0.0005 0.016
75-79 1.8 1728 0.0007 0.0003 0.019
80-84 1.8 731 0.018 0.0007 0.049
≥85 1.8 291 0.024 0.014 0.028
Epidemiologie Women from 5 ≥75 2 5656 0.02 0.033 0.008 0.012 0.029de cities in FranceL’Osterporose recruited from <80 2 3982 0.013 0.002 0.025(EPIDOS)97-100 voting lists and
health insurance ≥80 2 3616 0.028 0.006 0.04companies.
Table 3. Prospective studies of DXA and ultrasound reporting hip fractures
*Probability of hip fracture if bone density was classified as high or low risk.
Note: DXA indicates Dual energy x-ray absorptiometry; QUS, quantitative ultrasound.
Screening for Postmenopausal Osteoporosis
229
Duration Age Exclusion Lost toAuthor (years) (years) Population Criteria* Followup Rating†
Adami, 2 48-76 9 Italian Centers, Narrow 32/211(15.2%) Fair to 1995103 T-score < -2 Good
(0.67g/cm2); 5% vertebral fractures.
Black, 3 55-81 11 U.S. cities, BMD Broad (medical 81/2,027 (4%) Good1996104 <0.68 g/cm2; no illness, dyspepsia,
previous vertebral etc)fractures.
Bone, 2 >60 15 U.S. sites, BMD Broad (medical 19/359 (5.3%) Fair to 1997105 <0.84 g/cm2; average illness, NSAIDs, Good
20 yrs since GI drugs) menopause; 30.7% vertebral fractures.
Chesnut, 2 42-75 7 centers, spine BMD Broad 26/157 (16.6%) Fair1995106 (avg. 63) <0.88, average hip
BMD 0.7; ≥ 5 yearssince menopause.
Cummings, 4 55-81 11 U.S. cities, BMD Broad (medical 179/4,432 (4%) Good1998107 <0.68 g/cm2 illness, dyspepsia)
(ave. 0.59); no previous vertebral fractures.
Greenspan, 2.5 >65 1 Boston center, no Narrow 33/120 (27.5%) Fair1998108 BMD entry criteria. (“good health”)
Hosking, 4 45-59 4 centers, BMD > Narrow 287/1,499 (19.1%) Fair 1998109 0.8 g/cm2; <10% (“good health”)
prevalent vertebral fractures.
Liberman, 3 45-80 2 multicenter trials, Narrow 170/994 (17.1%) Good1995110 T-score < -2.5; 21% (“good health”)
prevalent vertebral
McClung, 3 40-59 15 centers, T-score Narrow 31% at 3 years Fair 1998111 < -2; 6-36 months (“good health”,
since menopause; estrogen use)no previous vertebral fractures.
Pols, 1 40-82 153 centers, Narrow 211/1,908 (11.1%) Fair 1999112 T-score <-2.8. (“good health”)
Table 4. Randomized controlled trials of alendronate with fracture outcomes
*In general, “narrow” criteria excluded estrogen users and patients with illnesses affecting bone metabolism.
†Based on criteria developed by the U.S. Preventive Services Task Force.22
years before receiving a diagnosis of osteoporosis andleaving the screening pool. Treatment costs alsovary; alendronate currently costs approximately $3per daily dose.
Screening StrategiesTo estimate the effect of screening 10,000
postmenopausal women for osteoporosis onreducing hip and vertebral fractures, we created anoutcomes table based on assumptions from the
reviewed studies (Table 5). These estimates includeage-specific prevalence rates expressed in 5-year ageintervals123 and treatment effects based on trial results(risk reduction, 37% for hip fracture and 50% forvertebral fracture).102,104,115,124 We estimated anadherence rate of 70% based on reports of adherenceand side effects from treatment trials, assuming lessoptimal compliance in the general population.
When the assumptions in Table 5 are used, if10,000 women 65 to 69 years of age underwent
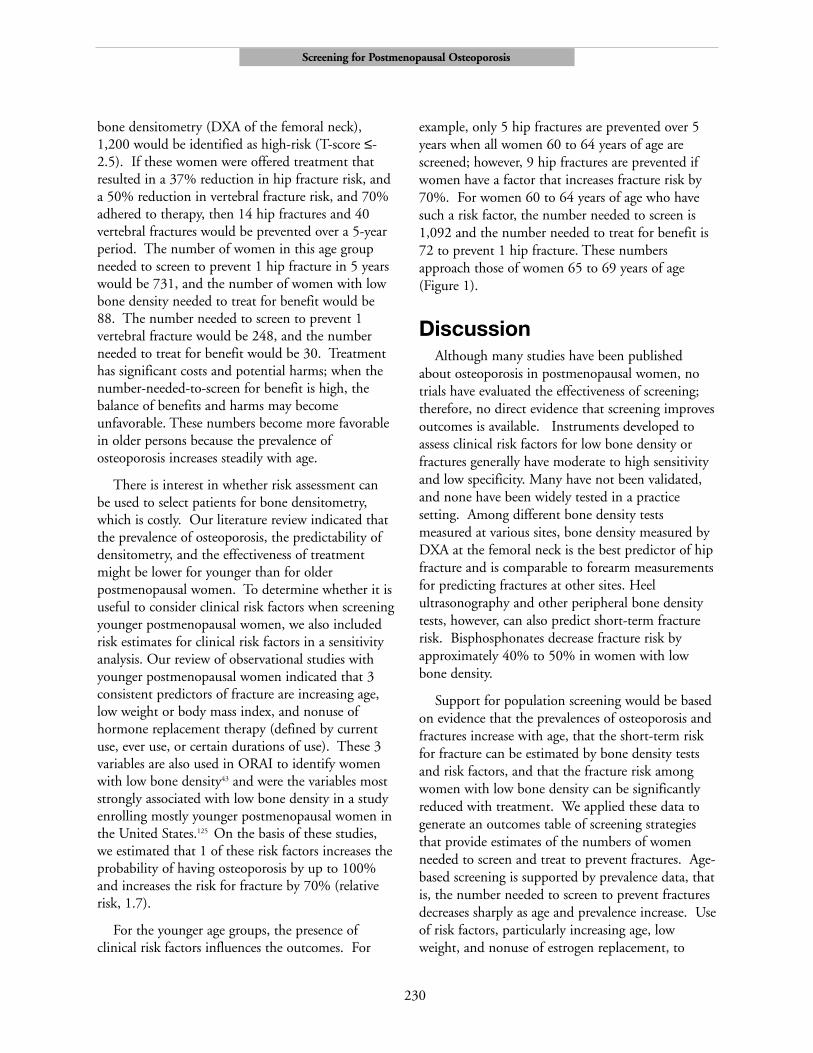
bone densitometry (DXA of the femoral neck),1,200 would be identified as high-risk (T-score ≤-2.5). If these women were offered treatment thatresulted in a 37% reduction in hip fracture risk, anda 50% reduction in vertebral fracture risk, and 70%adhered to therapy, then 14 hip fractures and 40vertebral fractures would be prevented over a 5-yearperiod. The number of women in this age groupneeded to screen to prevent 1 hip fracture in 5 yearswould be 731, and the number of women with lowbone density needed to treat for benefit would be88. The number needed to screen to prevent 1vertebral fracture would be 248, and the numberneeded to treat for benefit would be 30. Treatmenthas significant costs and potential harms; when thenumber-needed-to-screen for benefit is high, thebalance of benefits and harms may becomeunfavorable. These numbers become more favorablein older persons because the prevalence ofosteoporosis increases steadily with age.
There is interest in whether risk assessment canbe used to select patients for bone densitometry,which is costly. Our literature review indicated thatthe prevalence of osteoporosis, the predictability ofdensitometry, and the effectiveness of treatmentmight be lower for younger than for olderpostmenopausal women. To determine whether it isuseful to consider clinical risk factors when screeningyounger postmenopausal women, we also includedrisk estimates for clinical risk factors in a sensitivityanalysis. Our review of observational studies withyounger postmenopausal women indicated that 3consistent predictors of fracture are increasing age,low weight or body mass index, and nonuse ofhormone replacement therapy (defined by currentuse, ever use, or certain durations of use). These 3variables are also used in ORAI to identify womenwith low bone density43 and were the variables moststrongly associated with low bone density in a studyenrolling mostly younger postmenopausal women inthe United States.125 On the basis of these studies,we estimated that 1 of these risk factors increases theprobability of having osteoporosis by up to 100%and increases the risk for fracture by 70% (relativerisk, 1.7).
For the younger age groups, the presence ofclinical risk factors influences the outcomes. For
example, only 5 hip fractures are prevented over 5years when all women 60 to 64 years of age arescreened; however, 9 hip fractures are prevented ifwomen have a factor that increases fracture risk by70%. For women 60 to 64 years of age who havesuch a risk factor, the number needed to screen is1,092 and the number needed to treat for benefit is72 to prevent 1 hip fracture. These numbersapproach those of women 65 to 69 years of age(Figure 1).
DiscussionAlthough many studies have been published
about osteoporosis in postmenopausal women, notrials have evaluated the effectiveness of screening;therefore, no direct evidence that screening improvesoutcomes is available. Instruments developed toassess clinical risk factors for low bone density orfractures generally have moderate to high sensitivityand low specificity. Many have not been validated,and none have been widely tested in a practicesetting. Among different bone density testsmeasured at various sites, bone density measured byDXA at the femoral neck is the best predictor of hipfracture and is comparable to forearm measurementsfor predicting fractures at other sites. Heelultrasonography and other peripheral bone densitytests, however, can also predict short-term fracturerisk. Bisphosphonates decrease fracture risk byapproximately 40% to 50% in women with lowbone density.
Support for population screening would be basedon evidence that the prevalences of osteoporosis andfractures increase with age, that the short-term riskfor fracture can be estimated by bone density testsand risk factors, and that the fracture risk amongwomen with low bone density can be significantlyreduced with treatment. We applied these data togenerate an outcomes table of screening strategiesthat provide estimates of the numbers of womenneeded to screen and treat to prevent fractures. Age-based screening is supported by prevalence data, thatis, the number needed to screen to prevent fracturesdecreases sharply as age and prevalence increase. Useof risk factors, particularly increasing age, lowweight, and nonuse of estrogen replacement, to
Screening for Postmenopausal Osteoporosis
230

screen younger women may identify additional high-risk women and provide absolute benefit similar thatyielded by screening older women without riskfactors. These findings relate to screeningasymptomatic women only and do not apply towomen considered for testing because of pre-existingor new fractures or the presence of secondary causesof osteoporosis.
Our approach has several limitations, however,and results from a well-designed trial of screeningstrategies should supersede our estimations which arebased on indirect evidence. The estimates in theoutcomes table are limited by assumptions that arearguable or highly variable by patient and setting.Our assumptions of treatment effect and adherenceare especially optimistic and reflect results of clinicaltrials, not clinical practice. We chose a 5-year timehorizon based on the short-term predictability ofbone density tests as well as on results of short-term
treatment trials. Long-term outcomes may provide amore accurate estimate of benefits. Also, we cannotexclude the possibility that harms outweigh benefits,particularly since the long-term effects ofbisphosphonates are not yet known.
The evidence on which we based our conclusionsis also limited. Overall, evidence is stronger forwomen older than 65 than for younger womenbecause more research has been done in older agegroups. Bone loss in the perimenopausal and earlypostmenopausal years is important to long-termbone health, but few published studies addressscreening and treatment for younger postmenopausalwomen. Fracture risk is determined not only bybone density, but also by bone characteristics thatare difficult to measure in a clinical setting, such asbone structure and morphologic characteristics. Nobone density studies or treatment trials include largenumbers of non-white women, and it may be
Screening for Postmenopausal Osteoporosis
231
Variable Age Group
50-54 y 55-59 y 60-64 y 65-69 y 70-74 y 75-79 y
Base Case Assumptions*Prevalence of osteoporosis 0.0305 0.0445 0.065 0.120 0.2025 0.285Relative risk for hip fracture 0.63 0.63 0.63 0.63 0.63 0.63with treatmentRelative risk for vertebral 0.52 0.52 0.52 0.52 0.52 0.52fracture with treatmentAdherence to treatment 0.7 0.7 0.7 0.7 0.7 0.7
ResultsIdentified as high-risk 305 445 650 1,200 2,025 2,850(osteoporotic)Hip fractures prevented 1 2 5 14 39 70NNS to prevent 1 hip fracture 7,446 4,338 1,856 731 254 143NNT to prevent 1 hip fracture 227 193 121 88 51 41Vertebral fractures prevented 5 7 22 40 95 134NNS to prevent 1 vertebral 1,952 1,338 458 248 105 75fracture NNT to prevent 1 vertebral 60 60 30 30 21 21fracture
Table 5. Screening for osteoporosis in 10,000 postmenopausal women: hip and vertebral fracture outcomes by 5-year age intervals
*Estimates for assumptions include age-specific prevalence rates for osteoporosis and probabilities of fractures; relative risk of 0.63for hip fractures and 0.52 for vertebral fractures with treatment; treatment adherence of 0.7 (see text).
Note: Formulas for calculations are described in Appendix Table 2.
NNS indicates number needed to screen for benefit; NNT, number needed to treat.
difficult to provide ethnicity-specific screeningrecommendations in the absence of more evidence.
The role of clinical risk factors is still unclear.Although many risk factors are associated withosteoporosis and fractures, how to use them to selectwomen to test or treat is uncertain. The risk factorsidentified by our literature review and used in theoutcomes table are only best estimates. Other riskfactors may prove to be equally predictive when usedfor screening purposes. Further validation ofexisting risk assessment instruments or developmentof new ones would be useful. Few studies haveevaluated the effect of altering modifiable riskfactors, such as smoking cessation, strength andbalance training, and visual correction. Theseinterventions may prove to be as effective as drugtherapy in preventing fractures, and may also beimportant effect modifiers that would alter theeffectiveness of treatments.
Peripheral bone density tests have not beenextensively studied for screening. Results fromNational Osteoporosis Risk Assessment Study30
indicate that peripheral tests can predict short-term
fracture rates in a primary care population thatwould be targeted for screening. Most treatmenttrials use DXA of the hip as an entry criterion, andresults may not apply to women whose diagnosis isdetermined by other tests. A sequential approach, inwhich women with low values on a peripheral testare subsequently tested by DXA of the hip todetermine treatment needs, may be useful, althoughthis approach has not been evaluated. Furtherresearch is needed to define the appropriate use ofthese technologies.
How frequently to screen has also not beenspecifically studied, but data are needed todetermine optimal screening intervals. Estimationscan be made based on the age-specific prevalence ofosteoporosis and the precision of bone density tests.Less frequent testing for younger postmenopausalwomen when prevalence is lower (for example, 5-year intervals) and more frequent testing for olderwomen (for example, 2-year intervals) might bereasonable, but further research is needed. Screeningintervals of less than 2 years seem unwarrantedbecause the precision error of densitometry wouldlikely exceed the estimated bone loss in such a brief
Screening for Postmenopausal Osteoporosis
232
Figure 1. Number needed to screen to prevent 1 hip fracture in 5 years
The number needed to screen decreases with advancing age and for women younger than 65 with at least 1 risk factor.

period.126 After a woman is screened and determinedto have osteoporosis, future screening with bonedensity testing would be unnecessary.
Osteoporotic fractures present an enormoushealth burden on an expanding elderly population.Further research to more accurately determine thebenefits and harms of screening is of paramountimportance.
Acknowledgements
The authors thank Peggy Nygren, MA; NancyCarney, PhD; Kathryn Pyle Krages, AMLS, MA;Benjamin Chan, MS; and the reviewers of the fullevidence report for their contributions to thisproject.
References1. Melton LJ III, Kan SH, Frye MA, Wahner HW,
O’Fallon WM, Riggs BL. Epidemiology of vertebralfractures in women. Am J Epidemiol.1989;129(5):1000-1011.
2. Barrett JA, Baron JA, Karagas MR, Beach ML.Fracture risk in the U.S. Medicare population. J ClinEpidemiol. 1999;52(3):243-249.
3. White BL, Fisher WD, Laurin CA. Rate of mortalityfor elderly patients after fracture of hip in the 1980s.J Bone Joint Surg. 1987;69A:1335-1340.
4. Cauley J, Thompson D, Ensrud K, Scott J, Black D.Risk of mortality following clinical fractures.Osteoporos Intern. 2000;11(7):556-561.
5. Melton LJ III. Epidemiology of spinal osteoporosis.Spine. 1997;22(suppl 24):2S-11S.
6. Consensus Development Conference. Prophylaxisand treatment of osteoporosis. Am J Med.1991;90:107-110.
7. Consensus Development Conference. Diagnosis,prophylaxis and treatment of osteoporosis. Am JMed. 1993;94:646-650.
8. World Health Organization. Assessment of FractureRisk and Its Application to Screening forPostmenopausal Osteoporosis. WHO Technical ReportSeries 843. Geneva: World Health Organization;1994.
9. Kanis JA. Assessment of fracture risk and itsapplication to screening for postmenopausal
osteoporosis: synopsis of a WHO report. WHOStudy Group. Osteoporos Int. 1994;4(6):368-381.
10. Melton LJ III. How many women have osteoporosisnow? J Bone Miner Res. 1995;10(2):175-177.
11. Heaney RP. Bone mass, bone loss, and osteoporosisprophylaxis. [Editorial] Ann Intern Med.1998;128(4):313-314.
12. Bone density measurement-a systematic review.Swedish Council on Technology Assessment inHealth Care. J Intern Med Suppl. 1997;739:1-60.
13. Hailey D, Sampietro-Colom L, Marshall D.INAHTA Project on the Effectiveness of Bone DensityMeasurement and Associated Treatments for Preventionof Fractures: Statement of Findings. Edmonton,Alberta, Canada: Alberta Heritage Foundation forMedical Research; 1996.
14. Green CJ, Bassett K, Foerster V. Bone MineralDensity Testing: Does the Evidence Support its SelectiveUse in Well Women? British Columbia, Canada:British Columbia Office of Health TechnologyAssessment; 1997. Report no. 97:2T.
15. National Osteoporosis Foundation. Osteoporosis:review of the evidence for prevention, diagnosis, andtreatment and cost-effectiveness analysis. OsteoporosInt. 1998; 8(suppl 4):S7-S88.
16. Homik J, Hailey D. Quantitative Ultrasound for BoneDensity Measurement. Edmonton, Alberta, Canada:Alberta Heritage Foundation for Medical Research;1998. Report No.: Health Technology Assessment11.
17. Homik J, Hailey D. Selective Testing with BoneDensity Measurement. Edmonton, Alberta, Canada:Alberta Heritage Foundation for Medical Research;1999. Report No.: Health Technology Brief 4.
18. Royal College of Physicians. Osteoporosis: ClinicalGuidelines for Prevention and Treatment. London:Royal College of Physicians of London; 1999.
19. Blue Cross Blue Shield Association. Ultrasonographyof the Heel for Diagnostic Osteoporosis and SelectingPatients for Pharmacologic Treatment. Chicago: BlueCross and Blue Shield Assoc; 1999.
20. Siebzehner MI. Consensus statement on preventionand treatment of osteoporosis. Isr Med Assoc J.2000;2(5):397-401.
21. U.S. Preventive Services Task Force. Guide to ClinicalPreventive Services. 2nd ed. Washington, DC: Officeof Disease Prevention and Health Promotion; 1996.
Screening for Postmenopausal Osteoporosis
233

22. Harris RP, Helfand M, Woolf SH, et al. Currentmethods of the U.S. Preventive Services Task Force: areview of the process. Am J Prev Med. 2001;20(suppl3): 21-35.
23. Nelson H, Helfand M, Woolf S, Allan J. Screening forPostmenopausal Osteoporosis. Systematic EvidenceReview No. 17 (Prepared by the Oregon Health &Science University Evidence-based Practice Centerunder Contract No. 290-97-0018). Rockville, MD:Agency for Healthcare Research and Quality.September 2002. (Available on the AHRQ Web siteat: www.ahrq.gov/clinic/serfiles.htm).
24. Nelson H, Morris CD, Kraemer D, et al. Osteoporosisin Postmenopausal Women: Diagnosis and Monitoring.Rockville, MD: Agency for Healthcare Research andQuality; 2002.
25. Cummings SR, Nevitt MC, Browner WS, et al. Riskfactors for hip fracture in white women. Study ofOsteoporotic Fractures Research Group. N Engl JMed. 1995;332(12):767-773.
26. Honkanen R, Tuppurainen M, Kroger H, Alhava E,Saarikoski S. Relationships between risk factors andfractures differ by type of fracture: a population-based study of 12,192 perimenopausal women.Osteoporos Int. 1998;8(1):25-31.
27. Meyer HE, Tverdal A, Falch JA. Risk factors for hipfracture in middle-aged Norwegian women and men.Am J Epidemiol. 1993;137(11):1203-1211.
28. Kreiger N, Kelsey JL, Holford TR, O’Connor T. Anepidemiologic study of hip fracture inpostmenopausal women. Am J Epidemiol.1982;116(1):141-148.
29. Fujiwara S, Kasagi F, Yamada M, Kodama K. Riskfactors for hip fracture in a Japanese cohort. J BoneMiner Res. 1997;12(7):998-1004.
30. Siris ES, Miller PD, Barrett-Conner E, et al.Identification and fracture outcomes of undiagnosedlow bone mineral density in postmenopausal women:results from the National Osteoporosis RiskAssessment. JAMA. 2001;286(22):2815-2822.
31. Torgerson DJ, Campbell MK, Thomas RE, ReidDM. Prediction of perimenopausal fractures by bonemineral density and other risk factors. J Bone MinerRes. 1996;11(2):293-297.
32. Mallmin H, Ljunghall S, Persson I, Bergstrom R.Risk factors for fractures of the distal forearm: apopulation-based case-control study. Osteoporos Int.1994;4(6):298-304.
33. Tuppurainen M, Kroger H, Honkanen R, et al. Risksof perimenopausal fractures: a prospectivepopulation-based study. Acta Obstet Gynecol Scand.1995;74(8):624-628.
34. Slemenda CW, Hui SL, Longcope C, Wellman H,Johnston CC Jr. Predictors of bone mass inperimenopausal women: a prospective study ofclinical data using photon absorptiometry. AnnIntern Med. 1990;112(2):96-101.
35. Falch JA, Sandvik L, Van Beresteijn EC.Development and evaluation of an index to predictearly postmenopausal bone loss. Bone.1992;13(4):337-341.
36. Ribot C, Pouilles JM, Bonneu M, Tremollieres F.Assessment of the risk of post-menopausalosteoporosis using clinical factors. Clin Endocrinol(Oxf). 1992;36(3):225-228.
37. Elliot JR, Gilchrist NL, Wells JE, Ayling E, Turner J,Sainsbury R. Historical assessment of risk factors inscreening for osteopenia in a normal Caucasianpopulation. Aust N Z J Med. 1993;23(5):458-462.
38. Michaelsson K, Bergstrom R, Mallmin H, HolmbergL, Wolk A, Ljunghall S. Screening for osteopenia andosteoporosis: selection by body composition.Osteoporos Int. 1996;6(2):120-126.
39. Verhaar HJ, Koele JJ, Neijzen T, Dessens JA,Duursma SA. Are arm span measurements useful inthe prediction of osteoporosis in postmenopausalwomen? Osteoporos Int. 1998;8(2):174-176.
40. Ballard PA, Purdie DW, Langton CM, Steel SA,Mussurakis S. Prevalence of osteoporosis and relatedrisk factors in UK women in the seventh decade:osteoporosis case finding by clinical referral criteria orpredictive model? Osteoporos Int. 1998;8(6):535-539.
41. Lydick E, Cook K, Turpin J, Melton M, Stine R,Byrnes C. Development and validation of a simplequestionnaire to facilitate identification of womenlikely to have low bone density. Am J Manag Care.1998;4(1):37-48.
42. Goemaere S, Zegels B, Toye K, et al. Limited clinicalutility of a self-evaluating risk assessment scale forpostmenopausal osteoporosis: lack of predictive valueof lifestyle-related factors. Calcif Tissue Int.1999;65:354-358.
43. Cadarette SM, Jaglal SB, Kreiger N, McIsaac WJ,Darlington GA, Tu JV. Development and validationof the Osteoporosis Risk Assessment Instrument tofacilitate selection of women for bone densitometry.CMAJ. 2000;162:1289-1294.
Screening for Postmenopausal Osteoporosis
234

44. Kleerekoper M, Peterson E, Nelson D, et al.Identification of women at risk for developingpostmenopausal osteoporosis with vertebral fractures:role of history and single photon absorptiometry.Bone Miner. 1989;7(2):171-186.
45. van Hemert AM, Vandenbroucke JP, Birkenhager JC,Valkenburg HA. Prediction of osteoporotic fracturesin the general population by a fracture risk score: a 9-year follow-up among middle-aged women. Am JEpidemiol. 1990;132(1):123-135.
46. Cooper C, Shah S, Hand DJ, et al. Screening forvertebral osteoporosis using individual risk factors.Osteoporos Int. 1991;2:48-53.
47. Wolinsky FD, Fitzgerald JF. The risk of hip fractureamong noninstitutionalized older adults. J Gerontol.1994;49(4):S165-175.
48. Johnell O, Gullberg B, Kanis JA, et al. Risk factorsfor hip fracture in European women: the MEDOSStudy. Mediterranean Osteoporosis Study. J BoneMiner Res. 1995;10(11):1802-1815.
49. Ranstam J, Elffors L, Kanis JA. A mental-functionalrisk score for prediction of hip fracture. Age Ageing.1996;25(6):439-442.
50. Tromp AM, Smit JH, Deeg DJ, Bouter LM, Lips P.Predictors for falls and fractures in the LongitudinalAging Study Amsterdam. J Bone Miner Res.1998;13(12):1932-1939.
51. Burger H, de Laet CE, Weel AE, Hofman A, PolsHA. Added value of bone mineral density in hipfracture risk scores. Bone. 1999;25(3):369-374.
52. Cadarette S, Jaglal S, Murray T, Mclsac W, Joesph L,Brown J. Evaluation of decision rules for referringwomen for bone densitometry by dual-energy x-rayabsorptiometry. JAMA. 2001;286(1):57-63.
53. National Osteoporosis Foundation. Physician’s Guideto Prevention and Treatment of Osteoporosis.Washington, DC: Excerpta Medica, Inc.; 1999.
54. Weinstein L, Ullery B. Identification of at-riskwomen for osteoporosis screening. Am J ObstetGynecol. 2000;183:547-549.
55. Blake GM, Gluer CC, Fogelman I. Bonedensitometry: current status and future prospects. BrJ Radiol. 1997;70(Spec No):S177-186.
56. Blake GM, Fogelman I. Applications of bonedensitometry for osteoporosis. Endocrinol Metab ClinNorth Am. 1998;27(2):267-288.
57. Genant HK, Engelke K, Fuerst T, et al. Noninvasiveassessment of bone mineral and structure: state of theart. J Bone Miner Res. 1996;11(6):707-730.
58. Jergas M, Genant HK. Spinal and femoral DXA forthe assessment of spinal osteoporosis. Calcif TissueInt. 1997;61(5):351-357.
59. Agren M, Karellas A, Leahey D, Marks S, Baran D.Ultrasound attenuation of the calcaneus: a sensitiveand specific discriminator of osteopenia inpostmenopausal women. Calcif Tissue Int.1991;48(4):240-244.
60. Alenfeld FE, Wuster C, Funck C, et al. Ultrasoundmeasurements at the proximal phalanges in healthywomen and patients with hip fractures. OsteoporosInt. 1998;8(5):393-398.
61. Cunningham JL, Fordham JN, Hewitt TA, SpeedCA. Ultrasound velocity and attenuation at differentskeletal sites compared with bone mineral densitymeasured using dual energy X-ray absorptiometry. BrJ Radiol. 1996;69(817):25-32.
62. Faulkner KG, McClung MR, Coleman LJ, Kingston-Sandahl E. Quantitative ultrasound of the heel:correlation with densitometric measurements atdifferent skeletal sites. Osteoporos Int. 1994;4:42-47.
63. Formica CA, Nieves JW, Cosman F, Garrett P,Lindsay R. Comparative assessment of bone mineralmeasurements using dual X-ray absorptiometry andperipheral quantitative computed tomography.Osteoporos Int. 1998;8(5):460-467.
64. Graafmans WC, Van Lingen A, Ooms ME, BezemerPD, Lips P. Ultrasound measurements in thecalcaneus: precision and its relation with bonemineral density of the heel, hip, and lumbar spine.Bone. 1996;19(2):97-100.
65. Grampp S, Jergas M, Lang P, et al. Quantitative CTassessment of the lumbar spine and radius in patientswith osteoporosis. Am J Roentgenol.1996;167(1):133-140.
66. Greenspan SL, Bouxsein ML, Melton ME, et al.Precision and discriminatory ability of calcaneal boneassessment technologies. J Bone Miner Res.1997;12(8):1303-1313.
67. Langton CM, Ballard PA, Bennett DK, Purdie DW.A comparison of the sensitivity and specificity ofcalcaneal ultrasound measurements with clinicalcriteria for bone densitometry (DEXA) referral. ClinRheumatol. 1997;16(1):117-118.
Screening for Postmenopausal Osteoporosis
235

68. Laval-Jeantet AM, Bergot C, Williams M, DavidsonK, Laval-Jeantet M. Dual-energy X-rayabsorptiometry of the calcaneus: comparison withvertebral dual-energy X-ray absorptiometry andquantitative computed tomography. Calcif Tissue Int.1995;56(1):14-18.
69. Martin JC, Reid DM. Appendicular measurements inscreening women for low axial bone mineral density.Br J Radiol. 1996;69(819):234-240.
70. Massie A, Reid DM, Porter RW. Screening forosteoporosis: comparison between dual energy X-rayabsorptiometry and broadband ultrasoundattenuation in 1000 perimenopausal women.Osteoporos Int. 1993;3(2):107-110.
71. Naganathan V, March L, Hunter D, Pocock NA,Markovey J, Sambrook PN. Quantitative heelultrasound as a predictor for osteoporosis. Med JAust. 1999;171(6):297-300.
72. Pocock NA, Noakes KA, Howard GM, et al.Screening for osteoporosis: what is the role of heelultrasound? Med J Aust. 1996;164:367-370.
73. Rosenthall L, Tenenhouse A, Caminis J. A correlativestudy of ultrasound calcaneal and dual-energy X-rayabsorptiometry bone measurements of the lumbarspine and femur in 1000 women. Eur J Nucl Med.1995;22(5):402-406.
74. Roux C, Lemonnier E, Lolta S, et al. [Ultrasoundattenuation in calcaneus and bone density.] RevRhum Engl Ed Fr.1993;60:897-906.
75. Salamone L, Krall E, Dawson-Hughes B.Comparison of broadband ultrasound attenuation tosingle X-ray absorptiometry measurements at thecalcaneus in postmenopausal women. Calcif TissueInt. 1994;54:87-90.
76. Schott AM, Weill-Engerer S, Hans D, Duboeuf F,Delmas PD, Meunier PJ. Ultrasound discriminatespatients with hip fracture equally well as dual energyX-ray absorptiometry and independently of bonemineral density. J Bone Miner Res. 1995;10(2):243-249.
77. Tromp AM, Smit JH, Deeg DJ, Lips P. Quantitativeultrasound measurements of the tibia and calcaneusin comparison with DXA measurements at variousskeletal sites. Osteoporos Int. 1999;9(3):230-235.
78. Turner CH, Peacock M, Timmerman L, Neal JM,Johnston CC Jr. Calcaneal ultrasonic measurementsdiscriminate hip fracture independently of bonemass. Osteoporos Int. 1995;5:130-135.
79. Young H, Howey S, Purdie DW. Broadbandultrasound attenuation compared with dual-energyX-ray absorptiometry in screening forpostmenopausal low bone density. Osteoporos Int.1993;3(3):160-164.
80. Ahmed AI, Blake GM, Rymer JM, Fogelman I.Screening for osteopenia and osteoporosis: do theaccepted normal ranges lead to overdiagnosis?Osteoporos Int. 1997;7:432-438.
81. Petley GW, Cotton AM, Murrills AJ, et al. Referenceranges of bone mineral density for women insouthern England: the impact of local data on thediagnosis of osteoporosis. Br J Radiol.1996;69(823):655-660.
82. Chen Z, Maricic M, Lund P, Tesser J, Gluck O. Howthe new Hologic hip normal reference values affectthe densitometric diagnosis of osteoporosis.Osteoporos Int. 1998;8:423-227.
83. Simmons A, Barrington S, O’Doherty MJ, CoakleyAJ. Dual energy X-ray absorptiometry normalreference range use within the UK and the effect ofdifferent normal ranges on the assessment of bonedensity. Br J Radiol. 1995;68(812):903-909.
84. Lunt M, Felsenberg D, Reeve J, et al. Bone densityvariation and its effects on risk of vertebral deformityin men and women studied in thirteen Europeancenters: the EVOS Study. J Bone Miner Res.1997;12(11):1883-1894.
85. Laskey M, Crisp A, Cole T, Compston J.Comparison of the effect of different reference dataon Lunar DPX and Hologic QDR-1000 dual-energyX-ray absorptiometers. Br J Radiol.1992;65(780):1124-1129.
86. Arlot ME, Sornay-Rendu E, Garnero P, Vey-Marty B,Delmas PD. Apparent pre- and postmenopausalbone loss evaluated by DXA at different skeletal sitesin women: the OFELY cohort. J Bone Miner Res.1997;12(4):683-690.
87. Faulkner KG, von Stetten E, Miller P. Discordance inpatient classification using T-scores. J ClinDensitomet. 1999;2(3):343-350.
88. Grampp S, Henk CB, Fuerst TP, et al. Diagnosticagreement of quantitative sonography of thecalcaneus with dual X-ray absorptiometry of thespine and femur. Am J Roentgenol. 1999;173(2):329-334.
89. Kroger H, Lunt M, Reeve J, et al. Bone densityreduction in various measurement sites in men andwomen with osteoporotic fractures of spine and hip:
Screening for Postmenopausal Osteoporosis
236

the European quantitation of osteoporosis study.Calcif Tissue Int. 1999;64(3):191-199.
90. Varney LF, Parker RA, Vincelette A, Greenspan SL.Classification of osteoporosis and osteopenia inpostmenopausal women is dependent on site-specificanalysis. J Clin Densitomet. 1999;2(3):275-283.
91. Marshall D, Johnell O, Wedel H. Meta-analysis ofhow well measures of bone mineral density predictoccurrence of osteoporotic fractures. BMJ.1996;312:1254-1259.
92. Cummings SR, Black DM, Nevitt MC, et al. Bonedensity at various sites for prediction of hip fractures.Lancet. 1993;341:72-75.
93. Melton LJ, Atkinson E, O’Fallon W, Wahner H,Riggs B. Long-term fracture prediction by bonemineral assessed at different skeletal sites. J BoneMiner Res. 1993;8(10):1227-1233.
94. Black DM, Cummings SR, Genant HK, Nevitt MC,Palermo L, Browner W. Axial and appendicular bonedensity predict fractures in older women. J BoneMiner Res. 1992;7(6):633-638.
95. Bauer DC, Gluer CC, Cauley JA, et al. Broadbandultrasound attenuation predicts fractures strongly andindependently of densitometry in older women: aprospective study. Study of Osteoporotic FracturesResearch Group. Arch Intern Med. 1997;157(6):629-634.
96. Nevitt MC, Johnell O, Black DM, Ensrud K,Genant HK, Cummings SR. Bone mineral densitypredicts non-spine fractures in very elderly women.Study of Osteoporotic Fractures Research Group.Osteoporos Int. 1994;4(6):325-331.
97. Duboeuf F, Hans D, Schott AM, et al. Differentmorphometric and densitometric parameters predictcervical and trochanteric hip fracture: the EPIDOSStudy. J Bone Miner Res. 1997;12(11):1895-1902.
98. Garnero P, Dargent-Molina P, Hans D, et al. Domarkers of bone resorption add to bone mineraldensity and ultrasonographic heel measurement forthe prediction of hip fracture in elderly women? TheEPIDOS prospective study. Osteoporos Int.1998;8(6):563-569.
99. Hans D, Dargent-Molina P, Schott AM, et al.Ultrasonographic heel measurements to predict hipfracture in elderly women: the EPIDOS prospectivestudy. Lancet. 1996;348(9026):511-514.
100. Schott AM, Cormier C, Hans D, et al. How hipand whole-body bone mineral density predict hip
fracture in elderly women: the EPIDOS ProspectiveStudy. Osteoporos Int. 1998;8(3):247-254.
101. Nelson H. Hormone Replacement Therapy andOsteoporosis. Systematic Evidence Review No. 12(Prepared by the Oregon Health & ScienceUniversity Evidence-based Practice Center underContract No. 290-97-0018). Rockville, MD:Agency for Healthcare Research and Quality.August 2002. (Available on the AHRQ Web site at:www.ahrq.gov/clinic/serfiles.htm).
102. Cranney A, Wells G, Willan A, et al. Meta-analysisof alendronate for the treatment of postmenopausalwomen. Endocr Rev. 2002; 23:517-523.
103. Adami S, Passeri M, Ortolani S, et al. Effects of oralalendronate and intranasal salmon calcitonin onbone mass and biochemical markers of boneturnover in postmenopausal women withosteoporosis. Bone. 1995:383-390.
104. Black DM, Cummings SR, Karpf DB, et al.Randomised trial of effect of alendronate on risk offracture in women with existing vertebral fractures.Fracture Intervention Trial Research Group. Lancet.1996:1535-1541.
105. Bone HG, Downs RW Jr, Tucci JR, et al. Dose-response relationships for alendronate treatment inosteoporotic elderly women. Alendronate ElderlyOsteoporosis Study Centers. J of Clin Endocrin &Met. 1997:265-274.
106. Chesnut CH III, McClung MR, Ensrud KE, et al.Alendronate treatment of the postmenopausalosteoporotic woman: effect of multiple dosages onbone mass and bone remodeling. Am J of M.1995:144-152.
107. Cummings SR, Black DM, Thompson DE, et al.Effect of alendronate on risk of fracture in womenwith low bone density but without vertebralfractures: results from the Fracture InterventionTrial. JAMA. 1998:2077-2082.
108. Greenspan SL, Parker RA, Ferguson L, Rosen HN,Maitland-Ramsey L, Karpf DB. Early changes inbiochemical markers of bone turnover predict thelong-term response to alendronate therapy inrepresentative elderly women: A randomized clinicaltrial. J Bone & Min Res. 1998;13:1431-1438.
109. Hosking D, Chilvers CE, Christiansen C, et al.Prevention of bone loss with alendronate inpostmenopausal women under 60 years of age. EarlyPostmenopausal Intervention Cohort Study Group.N Engl J Med. 1998:485-492.
Screening for Postmenopausal Osteoporosis
237

110. Liberman UA, Weiss SR, Broll J, et al. Effect of oralalendronate on bone mineral density and theincidence of fractures in postmenopausalosteoporosis. The Alendronate Phase IIIOsteoporosis Treatment Study Group. N Engl JMed. 1995:1437-1443.
111. McClung M, Clemmesen B, Daifotis A, et al.Alendronate prevents postmenopausal bone loss inwomen without osteoporosis. A double-blind,randomized, controlled trial. AlendronateOsteoporosis Prevention Study Group. Ann InternMed. 1998:253-261.
112. Pols HA, Felsenberg D, Hanley DA, et al.Multinational, placebo-controlled, randomized trialof the effects of alendronate on bone density andfracture risk in postmenopausal women with lowbone mass: results of the FOSIT study. FoxamaxInternational Trial Study Group. Osteoporo Intern.1999:461-468.
113. Bonnick S, Rosen C, Mako B, DeLucca P, ByrnesC, Melton M. Alendronate vs calcium for treatmentof osteoporosis in postmenopausal women. Bone.1998:23(suppl 5):S476.
114. Cummings SR, Black DM, Thompson DE. Effectof alendronate reduces on risk of fracture in womenwith low bone density but without vertebralfractures: results from the Fracture InterventionTrial. JAMA. 1998;280(24):2077-2082.
115. McClung M, Geusens P, Miller P, et al. Effect ofrisedronate on the risk of hip fracture in elderlywomen. N Engl J Med. 2001;344(5):333-340.
116. Johansen HK, Gotzsche PC. Problems in the designand reporting of trials of antifungal agentsencountered during meta-analysis. JAMA.1999;282(18):1752-1759.
117. Djulbegovic B, Lacevic M, Cantor A, et al. Theuncertainty principle and industry-sponsoredresearch. Lancet. 2000;356(356):635-638.
118. Rimes KA, Salkovskis PM, Shipman AJ.Psychological and behavioural effects of bonedensity screening for osteoporosis. Psychol Health.
1999;14:585-608.
119. Lyles KW, Gold DT, Shipp KM, Pieper CF,Martinez S, Mulhausen PL. Association ofosteoporotic vertebral compression fractures withimpaired functional status. Am J Med. 1993;94:595-601.
120. Stock JL, Waud CE, Coderre JA, et al. Clinicalreporting to primary care physicians leads toincreased use and understanding of bonedensitometry and affects the management ofosteoporosis: a randomized trial. Ann Intern Med.1998;128(12):996-999.
121. Ettinger B, Pressman A, Schein J. Clinic visits andhospital admissions for care of acid-related uppergastrointestinal disorders in women usingalendronate for osteoporosis. Am J Manag Care.1998;4(10):1377-1382.
122. National Physician Fee Schedule Payment AmountFile. Baltimore, MD: Healthcare FinancingAdministration; 2000.
123. Melton LJ III, Chrischilles EA, Cooper C, LaneAW, Riggs BL. Perspective. How many women haveosteoporosis? J Bone Miner Res. 1992;7(9):1005-1010.
124. Reginster J, Minne HW, Sorensen OH, et al.Randomized trial of the effects of risedronate onvertebral fractures in women with establishedpostmenopausal osteoporosis: Vertebral Efficacywith Risedronate Therapy (VERT) Study Group.Osteo Intern. 2000;11(1):83-91.
125. Weinstein L, Ullery B, Bourguignon C. A simplesystem to determine who needs osteoporosisscreening. Obstet Gyn. 1999;93:757-760.
126. Health Technology Assessment. Number 6: BoneDensitometry: Patients with AsymptomaticHyperparathyroidism. Agency for Health Care Policyand Research, U.S. Department of Health andHuman Services. Rockville, MD: Agency for HealthCare Policy and Research; 1995;AHRQ publicationnumber 96-0004.
Screening for Postmenopausal Osteoporosis
238

Screening for Postmenopausal Osteoporosis
239
Postmenopausalwomen
Reduced rateof fractures
Risk factorassesment
Reducedprematuredeath anddisabitlity
Adverseeffects
Normal bonedensity
Low bonedensity
Highrisk
Lowrisk
2
Bone densitytesting
35
4
Adverseeffects
6
Treatment
1
Appendix Figure 1. Analytic framework
Key Questions
Arrow 1: Does screening using risk factor assessment and/or bone density testing reduce fractures?
Arrow 2: Does risk factor assessment accurately identify women who may benefit from bone density testing?
Arrow 3: Do bone density measurements accurately identify women who may benefit from treatment?
Arrow 4: What are the harms of screening?
Arrow 5: Does treatment reduce the risk of fractures in women identify by screening?
Arrow 6: What are the harms of treatment?
The analytic framework is a schematic outline used to define the population, preventive service, diagnostic or therapeuticinterventions, and intermediate and health outcomes considered in the review. The arrows represent key questions that theevidence must answer, and demonstrate the chain of logic that evidence must support, to link the preventive service toimproved health outcomes.
Appendix

Screening for Postmenopausal Osteoporosis
240
Evidence Evidence
Linkage (Fig 1) Key Questions Code* External Validity
Arrow 1: Does screening using risk factor Noneassessment or bone density testing reduce fractures?
Arrow 2: Does risk factor assessment II-2 Poor-fair: no instruments used widely foraccurately identify women who may screening purposes although some were benefit from bone density testing? developed from community-based
studies.
Arrow 3: Do bone density measurements II-2 Fair: not known how well results of accurately identify women who may studies translate to practice.benefit from treatment?
Arrow 4: What are the harms of screening? II-2, III Poor: small studies, selected participants.
Arrow 5: Does treatment reduce the risk of II Poor-fair: participants of trials may be fractures in women identified by different than primary care patients.screening?
Arrow 6: What are the harms of treatment? I, II-2 Poor-fair: difficult to know how risks impact individual patients.
Appendix Table 1. Summary of evidence quality
*Evidence codes based on study design categories.22
I = randomized, controlled trials
II-1 = controlled trials without randomization
II-2 = cohort or case-control analytic studies,
II-3 = multiple time series, dramatic uncontrolled experiments
III = opinions of respected authorities, descriptive studies
†Based on criteria developed by the U.S. Preventive Services Task Force.22
Screening for Postmenopausal Osteoporosis
241
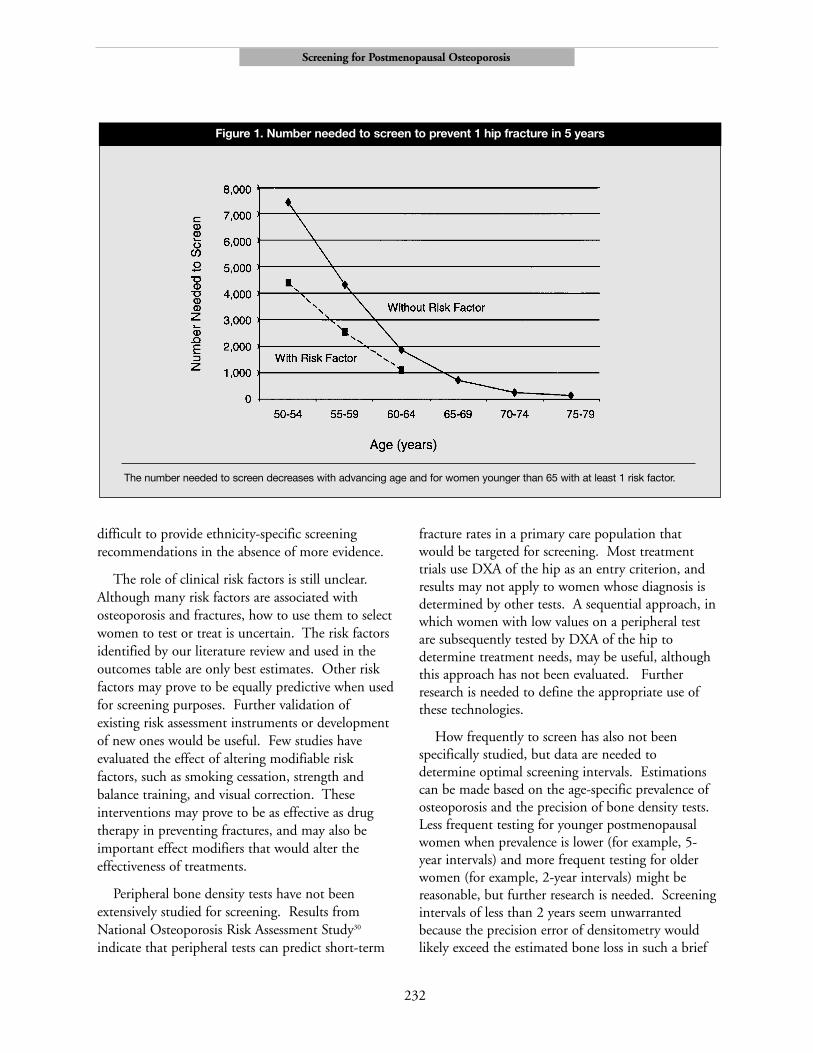
Number of hip fractures in untreated women with osteoporosis
No risk factors:
(5-year probability of hip fracture in women with osteoporosis) x (prevalence of osteoporosis) x N
At least one risk factor:
1.7 x (5-year probability of hip fracture in women with osteoporosis) x (prevalence of osteoporosis) x N
Number of hip fractures in treated women with osteoporosis
No risk factors:
(RR for hip fracture from treatment trials) x (0.7 adherence) x (number of hip fractures in untreated women with osteoporosis) + (1 – 0.7 adherence) x (number of hip fractures in untreated women with osteoporosis)
At least one risk factor:
(RR for hip fracture from treatment trials) x (0.7 adherence) x (number of hip fractures in untreated women with osteoporosis with at least one risk factor) + (1 – 0.7 adherence) x (number of hip fractures in untreated women with osteoporosis with at least one risk factor)
Number-needed-to-screen for benefit
N / (number of hip fractures without treatment – number with treatment)
Number-needed-to-treat
Number of women with osteoporosis / (number of hip fractures without treatment – number with treatment)
Appendix Table 2. Formulas for calculations in outcomes table

Screening for Postmenopausal Osteoporosis
242
The Methods Work Group for the U.S. Preventive Services Task Force developed a set of criteria to determine howwell individual studies were conducted (internal validity).22 The Task Force defined a 3-category rating of “good,”“fair,” and “poor,” based on these criteria. In general, a good study is one that meets all criteria well. A fair study isone that does not meet, or it is not clear that it meets, at least one criterion but has no known important limitationthat could invalidate its results. A poor study has important limitations. These specifications are not meant to berigid rules but rather are intended to be general guidelines, and individual exceptions, when explicitly explained andjustified, can be made.
Randomized Controlled Trials• Adequate randomization, including concealment and equal distribution of potential confounders
among groups.• Maintenance of comparable groups (includes attrition, cross-overs, adherence, contamination).• Important differential loss to follow-up or overall high loss to follow-up.• Equal, reliable, and valid measurements (includes masking of outcome assessment).• Clear definition of interventions.• Important outcomes considered.• Intention-to-treat analysis.
Case-Control Studies• Accurate ascertainment of cases.• Nonbiased selection of case patients and controls with exclusion criteria applied equally to both. • High response rate.• Diagnostic testing procedures applied equally to each group.• Measurement of exposure accurate and applied equally to each group.• Appropriate attention to potential confounding variables.
Cohort Studies• Consideration of potential confounders with either restriction or measurement for adjustment in the
analysis; consideration of inception cohorts.• Maintenance of comparable groups (includes attrition, cross-overs, adherence, contamination).• Important differential loss to follow-up or overall high loss to follow-up.• Equal, reliable, and valid measurements (includes masking of outcome assessment).• Clear definition of interventions.• Important outcomes considered.• Adjustment for potential confounders in analysis.
Diagnostic Accuracy Studies• Screening test relevant, available for primary care, adequately described.• Study uses a credible reference standard, performed regardless of test results.• Reference standard interpreted independently of screening test.• Handles indeterminate results in a reasonable manner.• Spectrum of patients included in study.• Adequate sample size• Administration of reliable screening test.
Appendix Table 3. Formulas for calculations in outcomes table
AHRQ Pub. No. 03-511BSeptember 2002