scrm--supply chain risk management: “designing & …the consortium advocates supply chain...
TRANSCRIPT

SherTrackDemand-Driven Predictive Manufacturing
SCRM--Supply Chain Risk Management:
“Designing & Planning for Resiliency”
Gregory L. Schlegel CPIM, CSP, Jonah Founder, The Supply Chain Risk Management Consortium
Executive in Residence, Adjunct Professor , Supply Chain Risk Management,
Lehigh Graduate Program
Adjunct Professor, ERM, Villanova Graduate Program
http://lehigh.bizvision.com/page/scm
973-615-2050 September 17, 2014
Emerging SCRM Planning Threads
The FOUR Spheres of Supply Chain Risk
Network Supply Chain Mapping/Risk Assessment
Probabilistic Planning
Supply Chain Maturity & Process Improvement
Network Supply Chain Alerts in the S&OP Process
ADD Book Cover
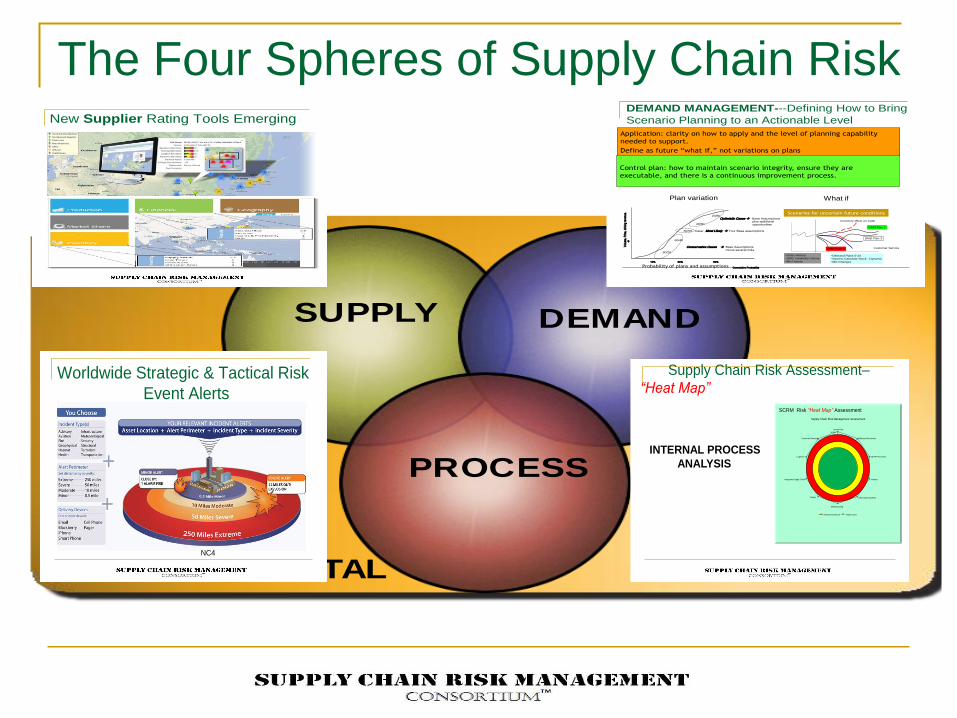
The Four Spheres of Supply Chain Risk
SUPPLY DEMAND
PROCESS
ENVIRONMENTAL LANDSCAPE
New Supplier Rating Tools EmergingDEMAND MANAGEMENT---Defining How to Bring
Scenario Planning to an Actionable Level
Application: clarity on how to apply and the level of planning capability
needed to support.
Define as future “what if,” not variations on plans
Control plan: how to maintain scenario integrity, ensure they are
executable, and there is a continuous improvement process.
50% 90%10%
Vol
ume,
Pric
e, d
rivin
g re
venu
e.
50/50 Case: Most Likely Your Base assumptions
Optimistic Cases Base Assumptions plus additional opportunities
Conservative Cases Base Assumptions minus several risks
40/60
20/80
60/40
80/20
Cumulative ProbabilityProbability of plans and assumptions
Changing Demand Picture
•Order History
•DMD Variability History
•Mix History
•Demand Plans 0-24
•Input to Calculate Stock - Dynamic
•Mix Changes
DMD Plan 1
DMD Plan 2
DMD Plan 3
Inventory effect on Cash
Customer Service
Scenarios for uncertain future conditions
Plan variation What if
1) Detailed assessment
2) Action plans
3) Trained Lean Assessors
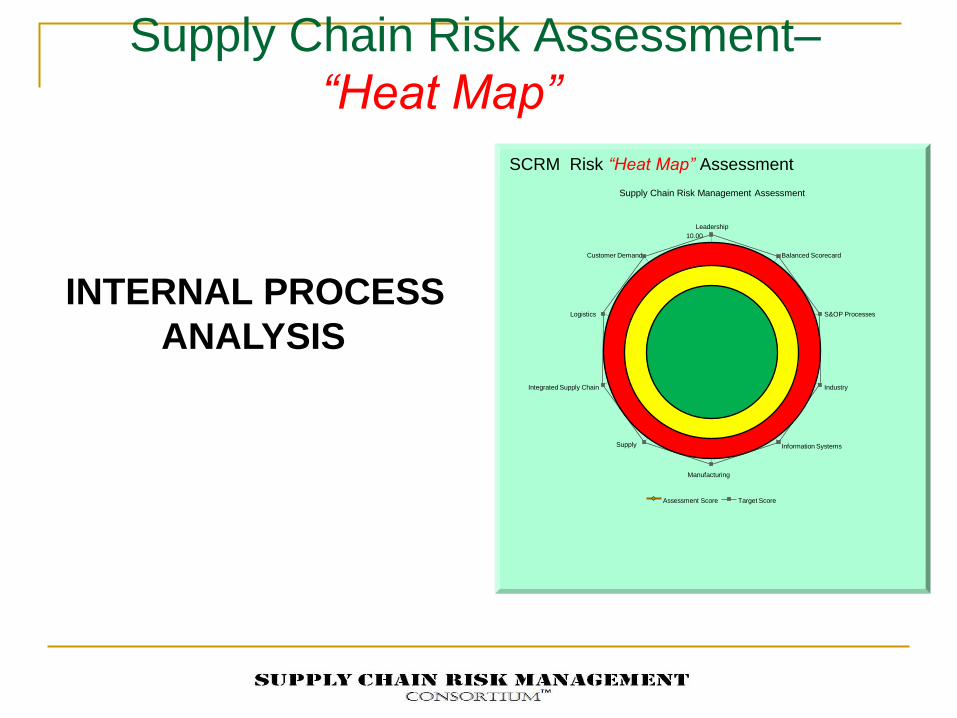
Supply Chain Risk Assessment–
“Heat Map”
SCRM Risk “Heat Map” Assessment
Supply Chain Risk Management Assessment
0.00
1.00
2.00
3.00
4.00
5.00
6.00
7.00
8.00
9.00
10.00
Leadership
Balanced Scorecard
S&OP Processes
Industry
Information Systems
Manufacturing
Integrated Supply Chain
Logistics
Customer Demand
Assessment Score Target Score
Supply
INTERNAL PROCESS
ANALYSIS
Worldwide Strategic & Tactical Risk
Event Alerts
NC4
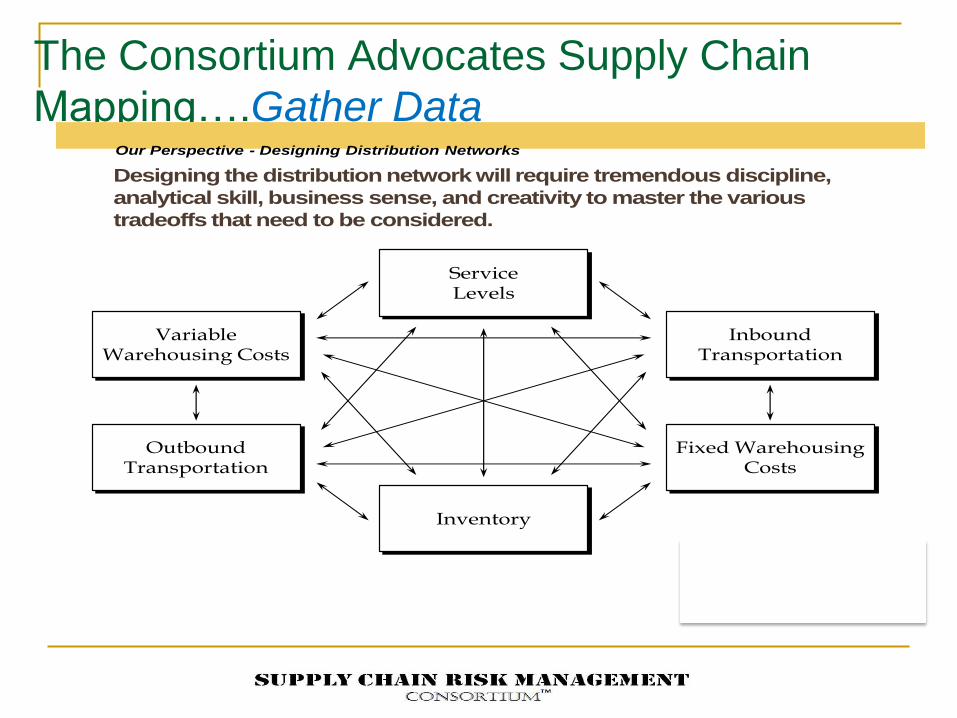
The Consortium Advocates Supply Chain
Mapping….Gather Data
Designing the distribution network will require tremendous discipline,
analytical skill, business sense, and creativity to master the various
tradeoffs that need to be considered.
Our Perspective - Designing Distribution Networks
ServiceLevels
Inventory
Variable Warehousing Costs
Outbound Transportation
Inbound Transportation
Fixed Warehousing Costs

Then, Build Out a Supply Chain Map….

And Superimpose Risk Across the Chain,
Node by Node
Node Vulnerability Landscape
RARE
OFTEN
0
5
10
15
20
25
V -SCORE RARE
FEW
SOME
OFTEN
MANY
10/21/2013Supply Chain Risk Management
Consortium10

Node Vulnerability Drivers Landscape
RARE
OFTEN
0
5
10
15
20
25
V -
SC
OR
E
RARE
FEW
SOME
OFTEN
MANY
9/15/2014 7

DEMAND MANAGEMENT---Defining How to Bring
Scenario Planning to an Actionable Level
Application: clarity on how to apply and the level of planning capability
needed to support.
Define as future “what if,” not variations on plans
Control plan: how to maintain scenario integrity, ensure they are
executable, and there is a continuous improvement process.
50% 90%10%
Volu
me, P
rice,
drivin
g r
even
ue
.
50/50 Case: Most Likely Your Base assumptions
Optimistic Cases Base Assumptions plus additional opportunities
Conservative Cases Base Assumptions minus several risks
40/60
20/80
60/40
80/20
Cumulative ProbabilityProbability of plans and assumptions
Changing Demand Picture
•Order History
•DMD Variability History
•Mix History
•Demand Plans 0-24
•Input to Calculate Stock - Dynamic
•Mix Changes
DMD Plan 1
DMD Plan 2
DMD Plan 3
Inventory effect on Cash
Customer Service
Scenarios for uncertain future conditions
Plan variation What if
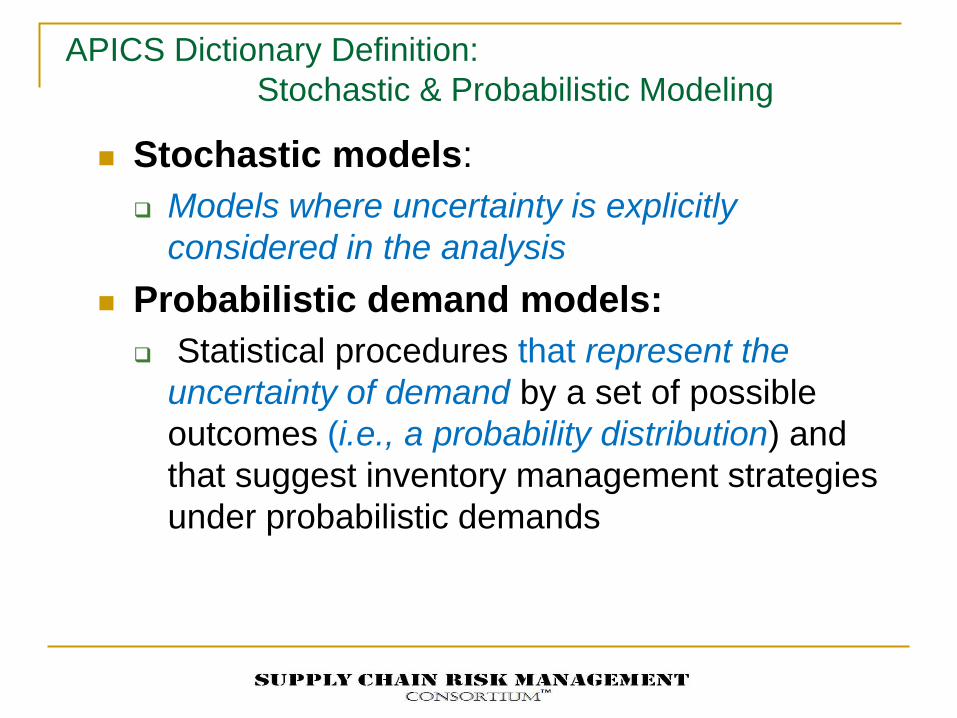
APICS Dictionary Definition:
Stochastic & Probabilistic Modeling
Stochastic models:
Models where uncertainty is explicitly
considered in the analysis
Probabilistic demand models:
Statistical procedures that represent the
uncertainty of demand by a set of possible
outcomes (i.e., a probability distribution) and
that suggest inventory management strategies
under probabilistic demands
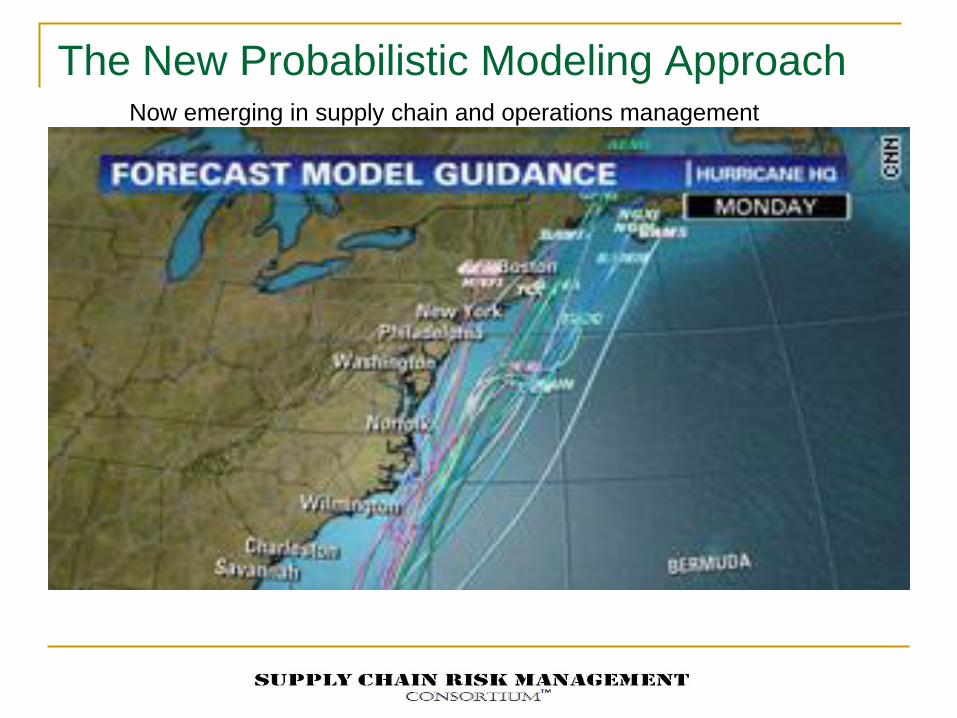
The New Probabilistic Modeling Approach
Now emerging in supply chain and operations management
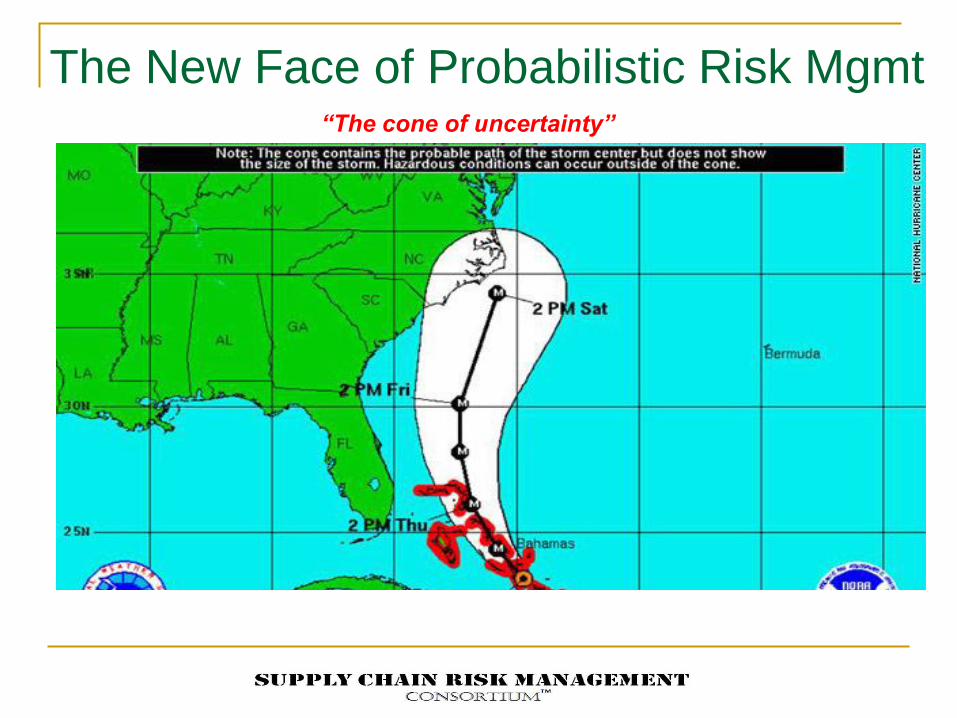
The New Face of Probabilistic Risk Mgmt “The cone of uncertainty”

NEXT GEN Scenario Planning
12
Probabilistic
Simulation
Strong
Statistics?
Risk
Response
Plan
Supply chain
Flow model
Base case
data
Decision
Logic
Probability
Distributions
of uncertain factors
Probability of
occurrence &
magnitude of
disturbing
events
Design of
Experiments
Performance
Measures
Feasible
Tactical Plans
No Yes Prioritized
Scenarios
Scenario Outcomes/Dashboards
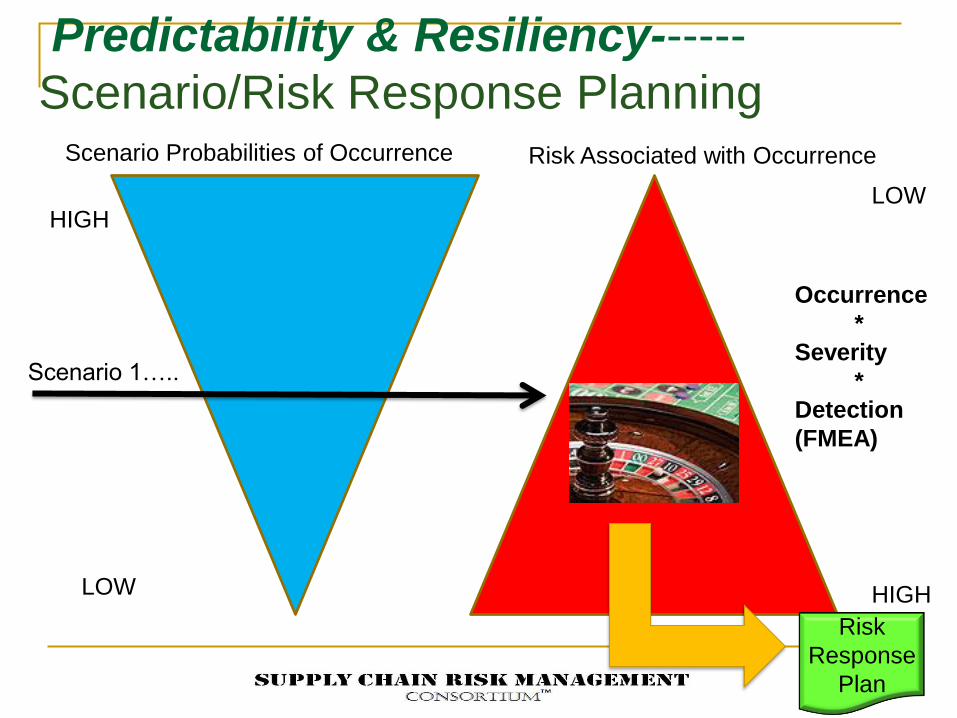
Predictability & Resiliency------
Scenario/Risk Response Planning Scenario Probabilities of Occurrence
HIGH
LOW
Risk Associated with Occurrence
LOW
HIGH
Scenario 1…..
Occurrence
*
Severity
*
Detection
(FMEA)
Risk
Response
Plan
1) Detailed assessment
2) Action plans
3) Trained Lean Assessors
Supply Chain Risk Assessment–
“Heat Map”
SCRM Risk “Heat Map” Assessment
Supply Chain Risk Management Assessment
0.00
1.00
2.00
3.00
4.00
5.00
6.00
7.00
8.00
9.00
10.00
Leadership
Balanced Scorecard
S&OP Processes
Industry
Information Systems
Manufacturing
Integrated Supply Chain
Logistics
Customer Demand
Assessment Score Target Score
Supply
INTERNAL PROCESS
ANALYSIS

Heat Map Tool Rating Example
9/15/2014 15
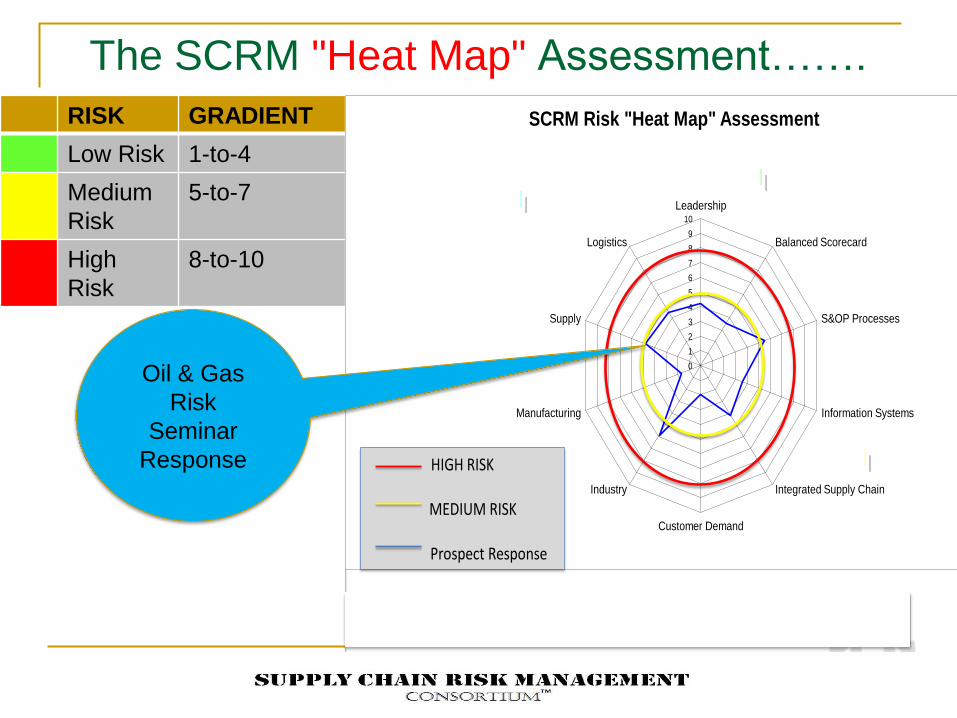
The SCRM "Heat Map" Assessment…….
RISK GRADIENT
Low Risk 1-to-4
Medium
Risk
5-to-7
High
Risk
8-to-10
0
1
2
3
4
5
6
7
8
9
10
Leadership
Balanced Scorecard
S&OP Processes
Information Systems
Integrated Supply Chain
Customer Demand
Industry
Manufacturing
Supply
Logistics
SCRM Risk "Heat Map" Assessment
SC
Client
Exemplars
HIGH RISK
MEDIUM RISK
Prospect Response
Oil & Gas
Risk
Seminar
Response

Environmental Threats…..
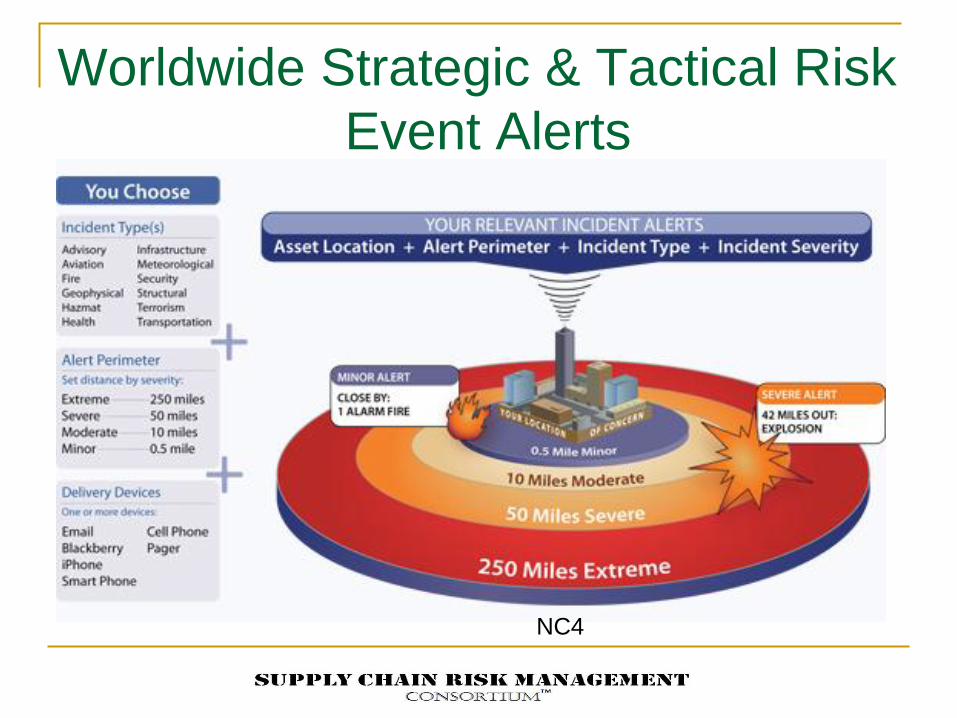
Worldwide Strategic & Tactical Risk
Event Alerts
NC4

SherTrackDemand-Driven Predictive Manufacturing
SCRM--Supply Chain Risk Management:
“Designing & Planning for Resiliency”
Gregory L. Schlegel CPIM, CSP, Jonah Founder, The Supply Chain Risk Management Consortium
Executive in Residence, Adjunct Professor , Supply Chain Risk Management,
Lehigh Graduate Program
Adjunct Professor, ERM, Villanova Graduate Program
http://lehigh.bizvision.com/page/scm
973-615-2050 September 17, 2014

Cisco’s Story about SC Mapping…. Chengdu, China earthquake event,
magnitude 7.9: May 12, 2008
Within 48 hours, Cisco was able to conduct
a full impact analysis, which included
evaluating affected supplier sites, parts, and
products
Within two days of the earthquake, SCRM
group initiated a crisis survey targeted at the
suppliers’ emergency contacts
Assessments after 24 hours of event
revealed Cisco had 20 suppliers in the
affected area
Two suppliers were at risk: supplier X, which
represented a significant revenue
risk/single-sourced, and Supplier Y, smaller
revenue risk but damage to its buildings
Supplier X was already under review and
Cisco had a second source
With Supplier Y, Cisco’s crisis management
team was deployed to assist the supplier
mitigate any production delays and the risk
was minimized

This New Methodology Leveraged at Bayer
Combining Predictive Analytics and Risk Management with Digital Modeling
leveraged the power of three methods.
Bayer utilized innovative predictive manufacturing technology to support
Scenario Planning
A cross-functional team, in collaboration with SherTrack, configured a digital
model to simulate customer demand, scheduling and production output of
a very complex compounding facility
Could reduce lead times by 45% without service issues
Could gain planned market share by lead time reduction/no capacity issues
Could improve capacity throughput without capital equip
Could reduce inventory by over 25% AND reduce production costs as well
Validate
Model
Design
DOE
Run
44
Scenarios
Evaluate
Model
Predictions
Business
Leader
Review
Modify
Supply
Chain
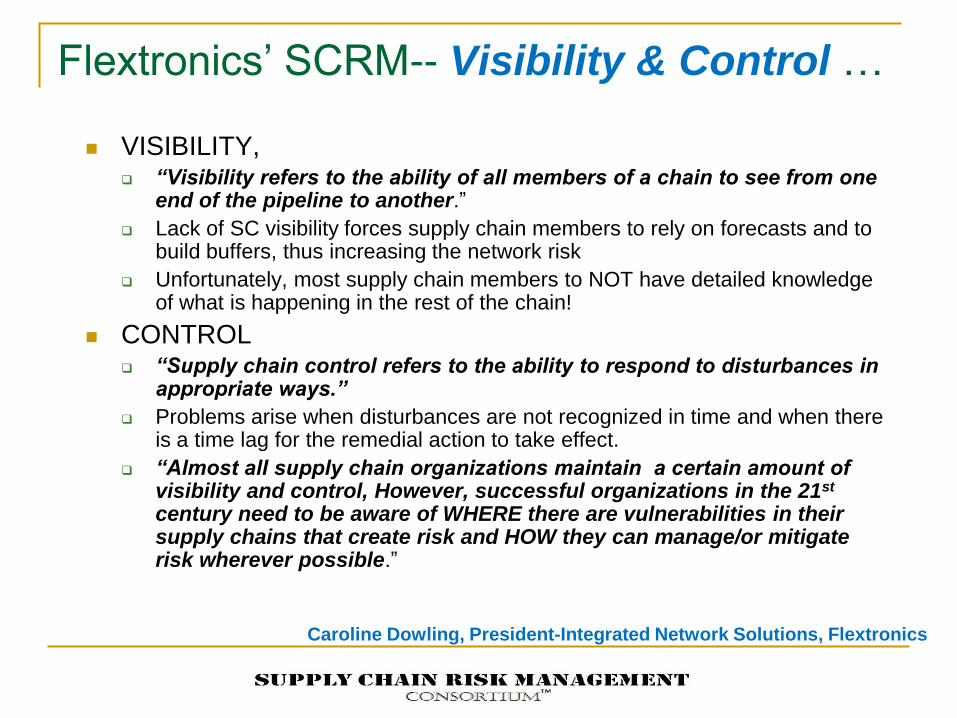
Flextronics’ SCRM-- Visibility & Control …
VISIBILITY, “Visibility refers to the ability of all members of a chain to see from one
end of the pipeline to another.”
Lack of SC visibility forces supply chain members to rely on forecasts and to build buffers, thus increasing the network risk
Unfortunately, most supply chain members to NOT have detailed knowledge of what is happening in the rest of the chain!
CONTROL “Supply chain control refers to the ability to respond to disturbances in
appropriate ways.”
Problems arise when disturbances are not recognized in time and when there is a time lag for the remedial action to take effect.
“Almost all supply chain organizations maintain a certain amount of visibility and control, However, successful organizations in the 21st century need to be aware of WHERE there are vulnerabilities in their supply chains that create risk and HOW they can manage/or mitigate risk wherever possible.”
Caroline Dowling, President-Integrated Network Solutions, Flextronics
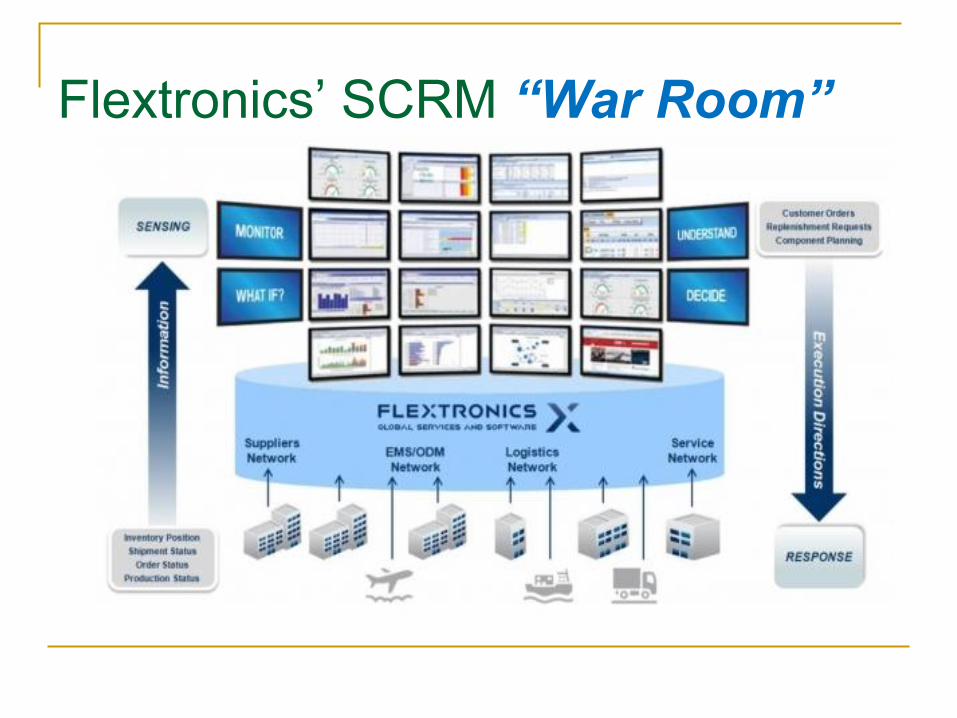
Flextronics’ SCRM “War Room”

Network Vulnerability Matrix
SKU Nod
e
DRIV
VI1-N
DRIV
VE1-N
∑
VDRIV
DAM
VI1-N
DAM
VE1-N
∑
VDAM
TRA
N
Mod
e
GEO ∑V FxN
uDe
p
cDep
Nod
e
Risk
Avg
SKU
Risk
1 A VT VG VA NA
B VB NB
C VC NC
D VD ND
R1
2 A VT VG VA NA
R2
9/15/2014 24
NODE RISK DRIVERS RISK
DAMPENERS
NODE RISK DRIVERS RISK
DAMPENERS

ADD Book Cover