sddot/sdltap gravel road experimental project update
TRANSCRIPT

SDDOT/SDLTAP Gravel Road Experimental Project Update
Ken Skorseth, SDLTAP Program Manager

Reason for Project
• More than 75% of local roads in SD are
unpaved – managing them is a challenge!
• Biggest complaints from public are: rough
condition (generally from corrugation or
“washboard” in surface) and too much loose
aggregate on the surface makes it hard to
control a vehicle.
• How critical is gravel quality to this and how
does it affect total cost of maintenance?

• Primary focus is on effect of gravel quality on life-cycle cost of gravel road maintenance
• Three types of gravel used in study:
1. Substandard but commonly used – meets no spec except top size control – one inch minus.
2. Barely meets SDDOT Gravel Surfacing Spec – percent passing #200 sieve is low and/or plasticity index (PI) at bottom of range at 4
3. Modified SDDOT Spec – higher minimums of 10% passing #200 sieve and PI at 7.
Focus of Test Project

Three test sections were built: Primary focus on Brookings
County section in 2013

Substandard Gravel
SD Standard Specification
Modified Specification
Compacted and Uncompacted
Sections
Compacted and Uncompacted
Sections
Buffer Sections

Each section was built with three to four inches of new
gravel after existing surface was prepared and shaped.
Compaction/non compaction comparison as well.

One of the biggest challenges was finding gravel that meets the modified SDDOT Specification: “Shall have minimum plasticity index (PI) of seven”. (Even higher minimum was considered in project planning)

One way to meet modified spec – blend different material from separate sources
This was done on one section in Brookings Co and one section in Custer Co

Is this the future? More blending or
“manufacturing” to get high quality gravel –
processing from a natural clay source here:

Road mixing natural clay to get a high
quality surface gravel

Please note this
area

Custer County Test Sections
Some sections showed contrast in performance quickly due to gravel quality

Brookings County Test Sections
Only one month after construction
Substandard Section
Modified Section

Substandard gravel loosens in 31 days. Loose aggregate (or float) is 1 ¼ to 1 ½ inches between the wheel paths.
Modified material has only 1/4 to 3/8 inch of loose aggregate (float) between the wheel paths in the same 31 days.

Current Status of Project
• SDLTAP has accumulated photo
documentation on all sections over the past
two years.
• Measurement and documentation has been
done on these distress types in 2012 & 2013:
1. Accumulation of loose aggregate (float)
2. Changes in top width from time of construction
3. Presence of corrugation (washboard) on
surface
4. Change in roadway crown

The float test (loose aggregate)

Simply remove loose aggregate from a 10 inch cross section, weigh it and convert that to a one-mile section

Change is top-width is measured on
traveled way – hinge point to hinge point
XX ft.

Corrugation (washboard): Hard to quantify in extent, fairly easy to measure severity

Crown: measured with a laser level

Cooler, wetter season in 2013 – 2.94 inches of rain in previous 20 days – most of that in three days prior to the last test.
Difference in 2012 & 2013 maintenance seasons:

Brookings Section – Loose Aggregate 2012
Substandard Compacted Uncompacted
Standard Spec Uncompacted Compacted
Modified Spec
405 tons
71 tons

Brooking Section – Loose aggregate 2013
020406080
100120140160180200
Tons per mile (October 2013)
Tons per mile(October 2013)
186 tons
16 tons

Loose aggregate comparison 2012 & 2013
0
50
100
150
200
250
300
350
400
450
Tons per mile(October 2013)
Tons per mile(October 2012)

Corrugation (Washboard)
• No corrugation observed on any
sections meeting at least minimum
standard specification.
• However, substandard section had
corrugation the beginning of light
corrugation only two days after blade
maintenance after nearly three inches
of rain.

Change in Roadway Width Constructed Width – 21.5 ft on all sections
Constructed Width
Current Width – Oct 2013
Constructed Width
Current Width – Oct 2013
Constructed Width
Current Width – Oct 2013
Current width ranges from 22 ft on modified section (top bar) to 25.25 ft on substandard section (bottom bar)

Substandard section – aggregate has
moved outward over 4 ft since construction

Modified section has moved outward
only six inches since construction

Problems with roadway crown
0%
1%
1%
2%
2%
3%
3%
4%
4%
5%
DesiredCrown
Actual Crown(10-18-13)

Dynamic Cone Penetrometer Testing
• Provide a measure of the in-situ strength of the base and subgrade
• A 17.6-pound weight is raised to a height of 1.8 feet and then dropped, driving the cone into the soil
• The variation in blows needed to drive the rod to a specified depth is an indicator of strength and stability of the subgrade
30

Field Use of Dynamic Cone Penetrometer
• Provide a measure of the in-situ strength of the subgrade
• A 17.6-pound weight is raised to a height of 1.8 foot and then dropped, driving the cone into the soil
• The variation in blows needed to drive the rod to a specified depth is an indicator of strength and stability of the subgrade
• Picture of DCP in use by you
31

Test location layout
• Brookings Co. Gravel Test Section (214th St.)
32
Below Spec. Meets Spec. Above Spec.

DCP Results
Modified
Standard
Substandard
Different trend in strength in modified section:
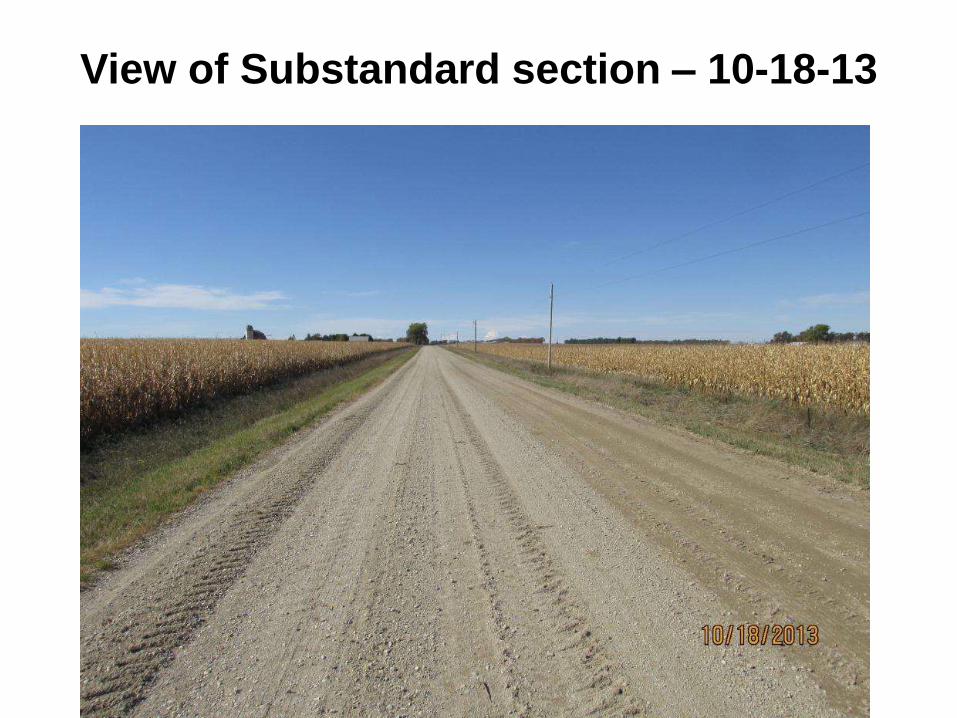
View of Substandard section – 10-18-13

View of Modified section – 10-18-13

Does the modified section rut in wet
weather? No, virtually no rutting observed.

Any traffic on this road?

Some other aggregate comparisons:
Material Type Percent fractured faces
Substandard – one inch top size control
2FF=36.15% 1FF=10.4% Total=46.6%
Standard – three-quarter inch top size control
2FF=58.7% 1FF=5.0% Total = 63.7%
Modified – three quarter inch top size control
2FF=51.5% 1FF=8.4% Total = 59.9%

Percent of fracture of stone (natural
aggregate sources)
0
10
20
30
40
50
60
70
% One fractured face % Two fractured faces % Total fracture
Substandard Mat'l
Standard Mat'l
Modified Mat'l
One fractured face
Two fractured faces
Total percent fractured faces

Concluding Points
• Meeting basic SDDOT standard surface gravel
specification reduces loose aggregate by 1/3
to 1/2.
• Widest differential was in Brookings County
near end of corn harvest in 2012 with 405 tons
of loose aggregate on substandard section to
only 71 tons on modified section.
• No corrugation ever observed on standard or
modified material.

• Most interesting fact thus far: Brookings has
done blade maintenance up to four times on
substandard section to only once on
modified!
• A negative aspect: we are getting a lot of
push-back from aggregate producers who
would prefer to produce as they always have
– no close control of % passing the #200
seive and plasticity index.
Concluding Points (Con’t)

THANK YOU!