sdg indicators 14.1.1a 14.1.1b and 14.2
TRANSCRIPT

Indicator 14.1.1a
SDG and Environment Statistics Unit - UNEP

SDG Target 14.1 and Indicator 14.1.1
Goal 14: Conserve andsustainably use the oceans, seasand marine resources forsustainable development.Target 14.1:“By 2025, prevent and significantlyreduce marine pollution of allkinds, in particular from land-based activities, including marinedebris and nutrient pollution”
Indicator 14.1.1:
“Index of coastal eutrophicationand floating plastic debris density”
Indicator 14.1.1a:
“Index of coastal eutrophication”
UNEP is the custodian agency for this indicator
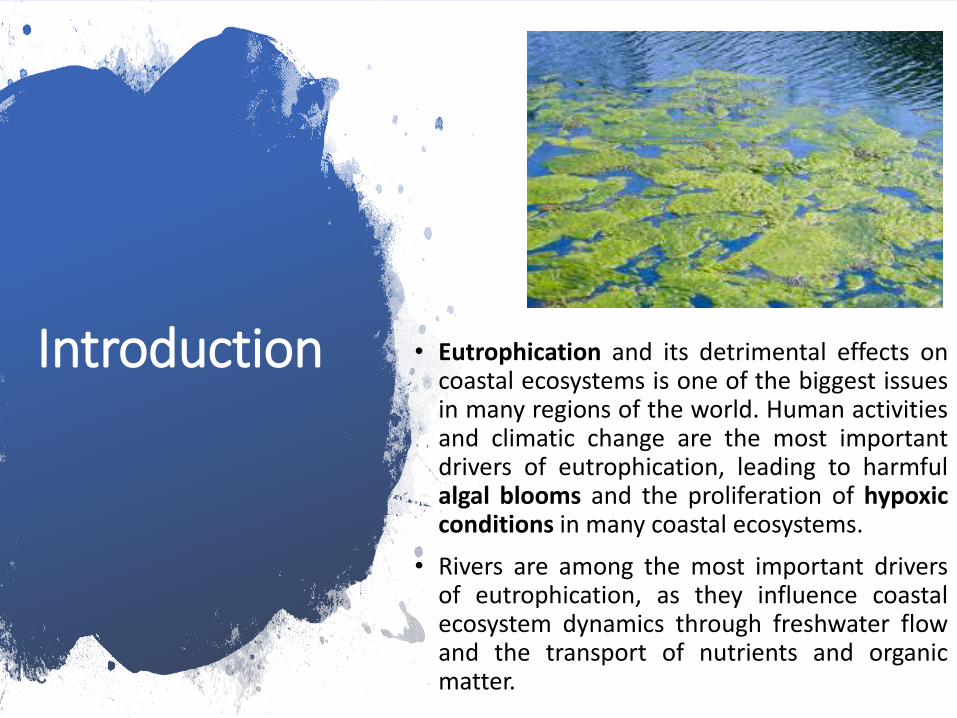
Introduction • Eutrophication and its detrimental effects oncoastal ecosystems is one of the biggest issuesin many regions of the world. Human activitiesand climatic change are the most importantdrivers of eutrophication, leading to harmfulalgal blooms and the proliferation of hypoxicconditions in many coastal ecosystems.
• Rivers are among the most important driversof eutrophication, as they influence coastalecosystem dynamics through freshwater flowand the transport of nutrients and organicmatter.
Introduction
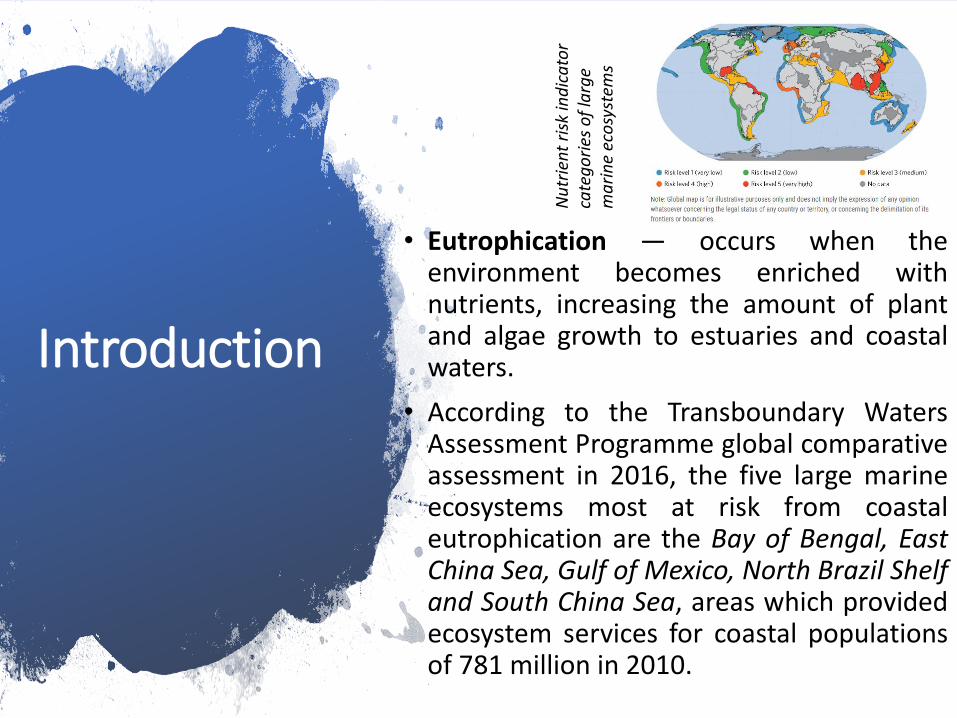
• Eutrophication — occurs when theenvironment becomes enriched withnutrients, increasing the amount of plantand algae growth to estuaries and coastalwaters.
• According to the Transboundary WatersAssessment Programme global comparativeassessment in 2016, the five large marineecosystems most at risk from coastaleutrophication are the Bay of Bengal, EastChina Sea, Gulf of Mexico, North Brazil Shelfand South China Sea, areas which providedecosystem services for coastal populationsof 781 million in 2010.
Nu
trie
nt
risk
ind
ica
tor
cate
go
ries
of
larg
e m
ari
ne
eco
syst
ems
Introduction
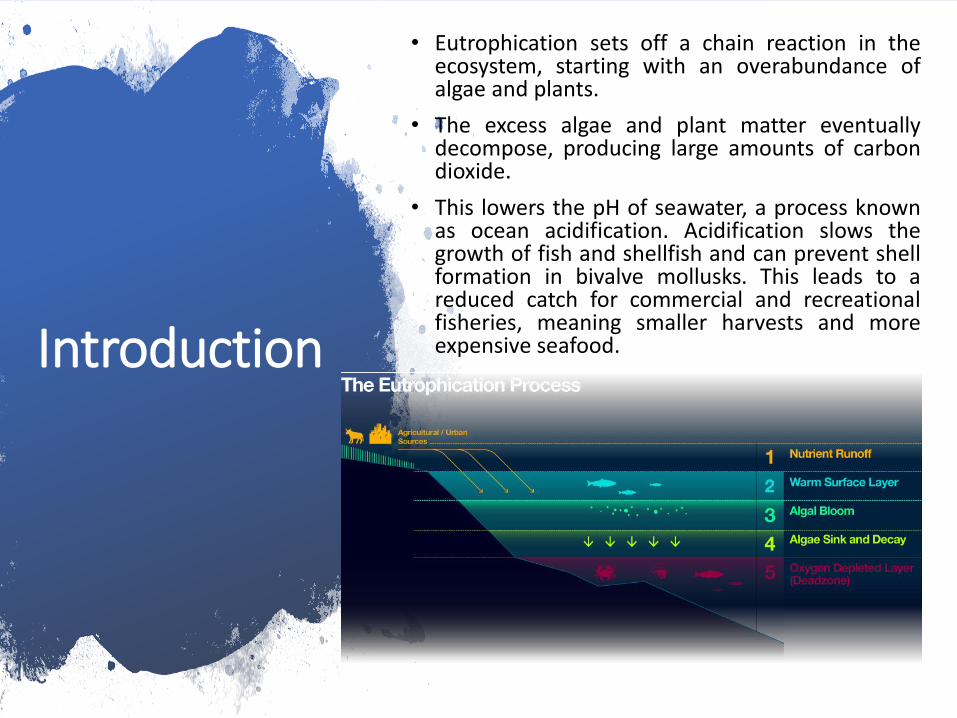
• Eutrophication sets off a chain reaction in theecosystem, starting with an overabundance ofalgae and plants.
• The excess algae and plant matter eventuallydecompose, producing large amounts of carbondioxide.
• This lowers the pH of seawater, a process knownas ocean acidification. Acidification slows thegrowth of fish and shellfish and can prevent shellformation in bivalve mollusks. This leads to areduced catch for commercial and recreationalfisheries, meaning smaller harvests and moreexpensive seafood.
Introduction
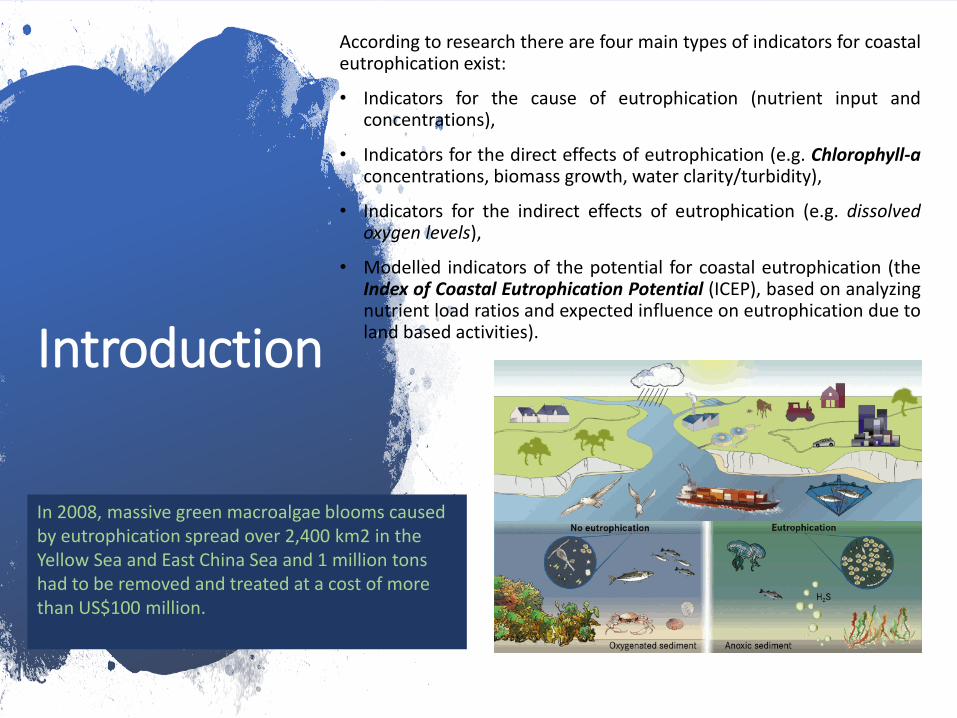
According to research there are four main types of indicators for coastaleutrophication exist:
• Indicators for the cause of eutrophication (nutrient input andconcentrations),
• Indicators for the direct effects of eutrophication (e.g. Chlorophyll-aconcentrations, biomass growth, water clarity/turbidity),
• Indicators for the indirect effects of eutrophication (e.g. dissolvedoxygen levels),
• Modelled indicators of the potential for coastal eutrophication (theIndex of Coastal Eutrophication Potential (ICEP), based on analyzingnutrient load ratios and expected influence on eutrophication due toland based activities).
In 2008, massive green macroalgae blooms caused by eutrophication spread over 2,400 km2 in the Yellow Sea and East China Sea and 1 million tons had to be removed and treated at a cost of more than US$100 million.

Why is this SDG Important?
• It is fundamentally important to understand how the freshwater-marine link works in order to establish appropriate measures to maintain (or recover) the good environmental status (GES).

Definition
• Eutrophication – excess nutrientloading into coastal environmentsfrom anthropogenic sources,resulting in excessive growth ofplants, algae and phytoplankton.
• Coastal Zone – national ExclusiveEconomic Zone (EEZ) (200 nauticalmiles from the coast) as outlined bythe United Nations Convention onthe Law of the Sea.
• Marine litter - any persistent,manufactured or processed solidmaterial which is lost or discardedand ends up in the marine andcoastal environment.

Limitations
It is assumed that countrieswould use the data to activelymake decisions, but as oceansare transboundary, it makes thisdecision-making complex.
Methodology – Approach
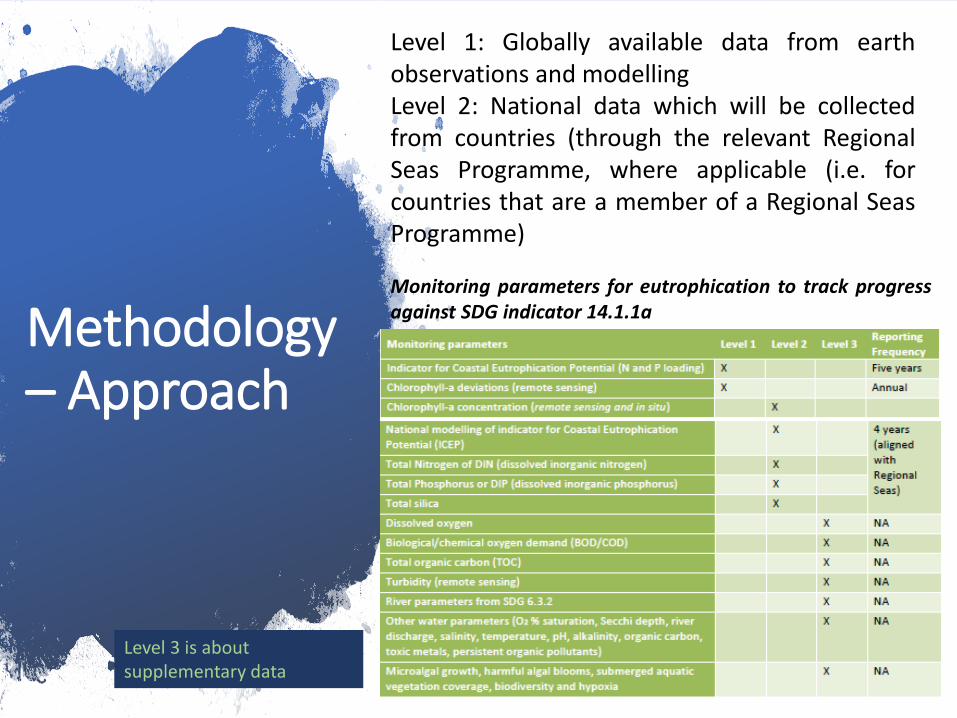
Level 1: Globally available data from earthobservations and modellingLevel 2: National data which will be collectedfrom countries (through the relevant RegionalSeas Programme, where applicable (i.e. forcountries that are a member of a Regional SeasProgramme)
Monitoring parameters for eutrophication to track progressagainst SDG indicator 14.1.1a
Level 3 is about supplementary data

Methodology –Level 1
Indicator for coastal eutrophicationpotential• This indicator assumes that excess
nitrogen or phosphorus relative to silicawill result in increased growth ofpotentially harmful algae (ICEP>0).
• This indicator is based on loads and ratiosof nitrogen, phosphorous and silicadelivered by rivers to coastal waters(Garnier et al. 2010) which contribute tothe ICEP.
• The indicator can be further developed byincorporating in situ monitoring toevaluate the dispersion of concentrationsof nitrogen, phosphorous and silica toground-truth the index.
• ICEP is expressed in kilograms of carbon(from algae biomass) per squarekilometre of river basin area per day (kg Ckm-2 day-1).

Methodology –Level 1
• The ICEP model is calculated using one oftwo equations depending on whethernitrogen or phosphorus is limiting. Theequations (Billen and Garnier 2007) are
ICEP (N limiting) = [NFlx/(14*16)-SiFlx/(28*20)]*106*12
ICEP (P limiting) = [PFlx/31 –SiFlx/(28*20)]*106*12
Where PFlx, NFlx and SiFlx are respectivelythe mean specific values of total nitrogen,total phosphorus and dissolved silicadelivered at the mouth of the river basin,expressed in kg P km-2 day-1, in kg N km-2day-1 and in kg Si km-2 day-1.

Methodology –Level 1
Chlorophyll-A deviation modelling• Satellite-based assessments of ocean colour
began in 1978 with the launch of the CoastalZone Color Scanner (CZCS) aboard the NASANimbus 7 satellite
Magnitude of Chlorophyll-a Deviation = (𝛾 -𝛽/ 𝛽)×100
Where 𝛽 = the average monthly pixel chlorophyll-a2000-2004
Where 𝛾 = the average monthly pixel chlorophyll-afor the reporting year
• Deviation will be calculated by pixel and deemeda high deviation if the magnitude is in the 90th
percentile.
• The percent of pixels with a high value will becalculated per month.
• The average monthly anomalies will becalculated as the average percent over 12months (Jan-Dec).

Methodology –Level 2
In situ monitoring of nutrients• National level measurements of Chlorophyll-a
and other parameters (including nitrogen,phosphate and silica) (in situ or from remotesensing), should be used to complement andground truth global remote sensing andmodelled data and enable a more detailedassessment of eutrophication.
National ICEP modelling• Existing ICEP modelling at the national level is
limited, but could be further developed.• A study of basin level data of Chinese rivers
utilizes Global NEWS – 2. The Global NEWS-2model is basin-scale and quantifies river export ofvarious nutrients (nitrogen, phorsphorus, carbonand silca) in multiple forms (dissolved inorganic,dissolved organic and particulate) as functions ofhuman activities on land and basin characteristics(Strokal et al 2016)
Northwest Pacific Action Plan
Eutrophication Assessment Tool
(NEAT), which is a satellite imagery
technique for detection of potential dead zones in the sea.

Data
• Data sources – Satellite data, Global models, national government.
• Data Collection – through Regional Seas Programme, NOAA, GEOBluePlanet, Global Nutrient Management System (GNMS)
• Data will be available for all member states
• The number of parties considered to have submitted post-2010 NBSAPs that take the Strategic Plan for Biodiversity (2011-2020) into account is regularly updated as well.
• Chlorophyll-a deviation and anomalies Earth Observation Data were reported in February 2021.
• In situ data will be collected directly from countries later this year through the Regional Seas programme.
• Data processing will be handled by UN Environment Programme and partners.

Example –Case Studies
Indicator for Coastal Eutrophication Potential (N and P loading)
• Modelling of basin level N, P and Silca inputs to rivermouths is a well-established practice in terms ofunderstanding coastal eutrophication.
• This have been done at the basin level, which is notparticularly useful for national level decision making.
• A sub-basin level product is expected to be finished byend of this year. For transboundary sub-basins, the Nand P loading will be on a percentage basis using thesocio-economic, land use and nutrient managementdata for each country.
• It is recommended that countries refine the ICEPmodel based on their own figures (such as land use,fertilizer use, livestock, wastewater treatment, etc.)

Example –Case Studies
Indicator for Coastal Eutrophication Potential (N and P loading)

Summary
• Coastal eutrophication can lead toserious damage to marineecosystems, vital sea habitats, andcan cause the spread of harmful algalblooms.
• Using NEAT*—as a satellite-basedtechnique to keep an eye on growingeutrophication threat to oceans.
• The Special Monitoring Centre has also developed an online portal on harmful algal blooms, countermeasures against harmful algal blooms and eutrophication monitoring guidelines for local government officials in coastal regions.
*Northwest Pacific Action Plan Eutrophication Assessment Tool

Thank you !
UN Environment
www.unenvironment.org