sds covers proteins in a net negative charge addition of 2-mercaptoethanol reduces disulphide bonds...
TRANSCRIPT

SDS covers proteins in a net negative chargeAddition of 2-mercaptoethanol reduces disulphide bonds and Boiling is used to further denature proteins.
Migrate in gel according to mass
+
+
+
+
+
+
--
-
-
-
-
Before SDS
Charged R groups
H
H
-
-
--
--- -
-- -
--
--
Hydrophobic areas
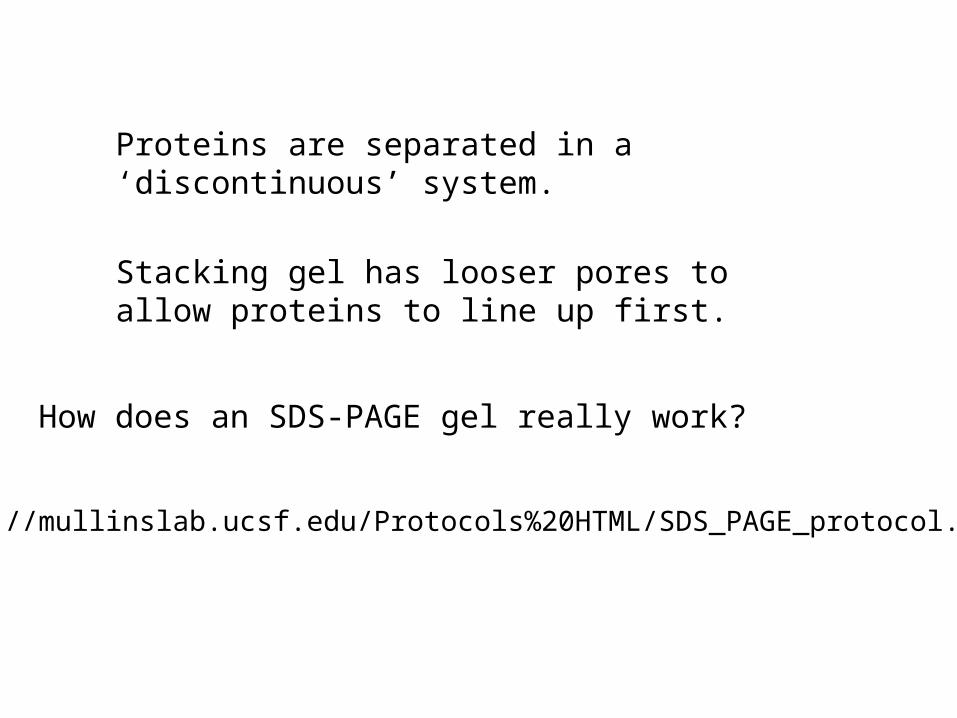
Proteins are separated in a ‘discontinuous’ system.
Stacking gel has looser pores to allow proteins to line up first.
How does an SDS-PAGE gel really work?
http://mullinslab.ucsf.edu/Protocols%20HTML/SDS_PAGE_protocol.htm

Western blots- Ab used to identify Ag immobilized on nylon
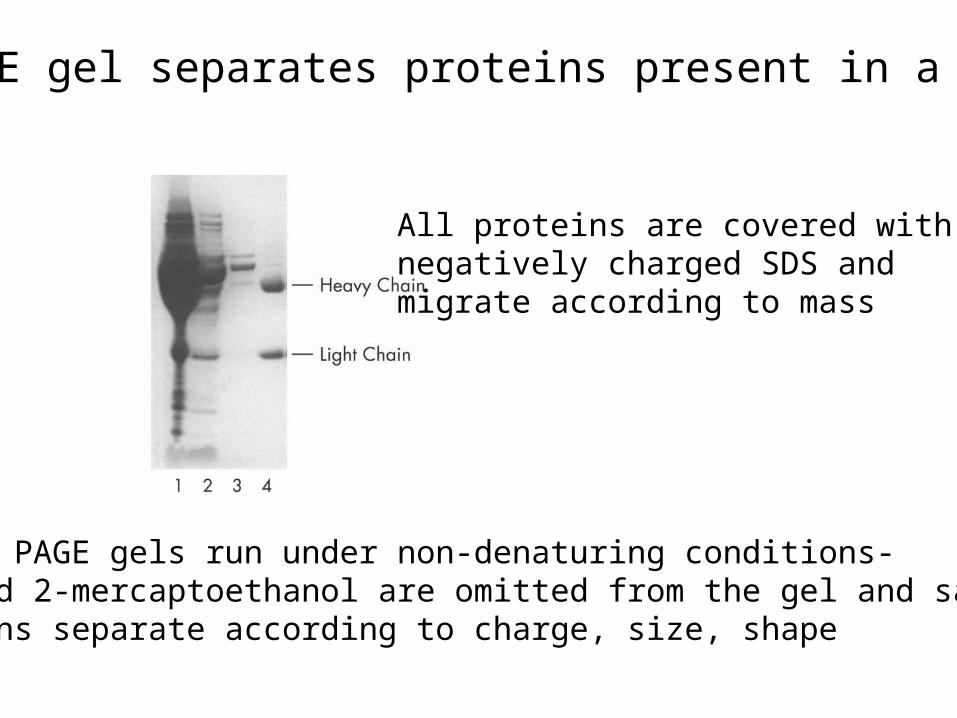
SDS PAGE gel separates proteins present in a sample
All proteins are covered withnegatively charged SDS and migrate according to mass
Native PAGE gels run under non-denaturing conditions-SDS and 2-mercaptoethanol are omitted from the gel and sampleProteins separate according to charge, size, shape
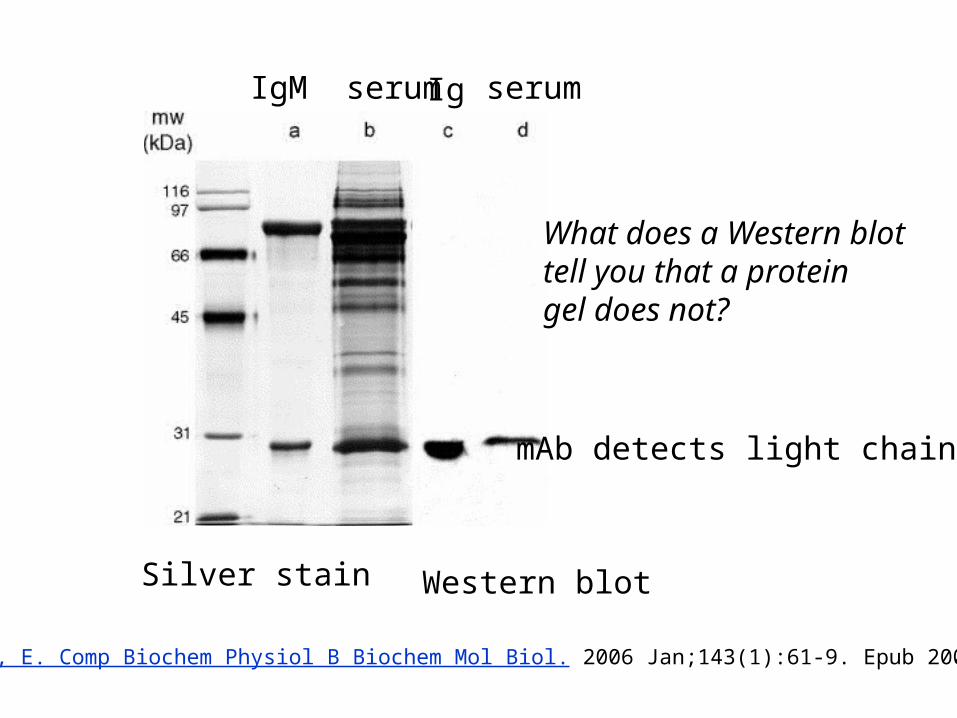
Silver stain
IgM serum
Western blot
mAb detects light chain
Ig serum
Bromage, E. Comp Biochem Physiol B Biochem Mol Biol. 2006 Jan;143(1):61-9. Epub 2005 Dec 1.
What does a Western blot tell you that a proteingel does not?

Protein blotting
Two major factors affect the efficiency
1. The elution from the gel-use the lowest percentage of acrylamide that willallow resolution-high molecular weight proteins blot poorly
2. Efficiency of binding to the membrane- nitrocellulose (not covalently bound)- Polyvinylidene fluoride (PVDF)- Activated nylon

Transfer of proteins to the membrane
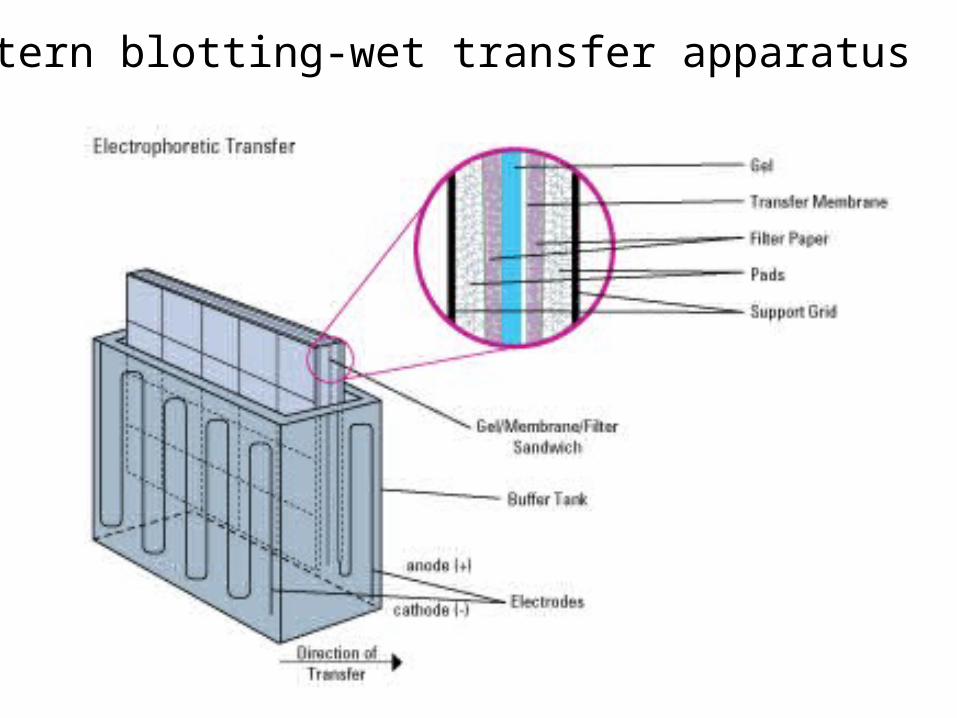
Western blotting-wet transfer apparatus

Western blot-semi-dry transfer of proteins

DetectionPrimary antibody followed by:Radioactive-labelled125I staphlococcal protein A or streptococcal protein G
Enzyme-linked secondary antibodies-horseradish peroxidase (HRP)-alkaline phosphatase-BCIP/NBTBCIP (5-Bromo-4-Chloro-3'-Indolyphosphate p-Toluidine Salt) and NBT (Nitro-Blue Tetrazolium Chloride).
Chemiluminescent detection-HRP catalyzes the oxidation of luminol in hydrogen peroxide. Luminol decays by light emission.
AP catalyzes the dephosphyorylation of adamantyl-1-2-dioxetanephosphate, resulting in emission of light.

Can see proteins that are not normally visible

Far western technique
Detection of protein-protein interactions using a labelled bait protein

Figure 7 Distribution of the 52 kDa protein in various mouse Figure 7 Distribution of the 52 kDa protein in various mouse tissues as analysed by Southwestern blot analysistissues as analysed by Southwestern blot analysis
Biochemical Journal (1998) 329, 623-629 - Biochemical Journal (1998) 329, 623-629 -
www.biochemj.orgwww.biochemj.org
Southwestern blot