sea fog detection
TRANSCRIPT

8/20/2019 Sea fog Detection
http://slidepdf.com/reader/full/sea-fog-detection 1/13
Acta Oceanologica Sinica 2009, Vol.28, No.2, p.23–35http://www.hyxb.org.cn
E-mail: [email protected]
Detection of nighttime sea fog/stratus over the Huang-hai Sea using MTSAT-1R IR data
GAO Shanhong1∗, WU Wei1,2, ZHU Leilei1, FU Gang1, HUANG Bin3
1 Physical Oceanography Laboratory, Ocean University of China, Qingdao 266003, China2 Shandong Provincial Meteorological Institute, Jinan 250031, China3 National Meteorological Center, China Meteorological Administration, Beijing 100081, China
Received 25 March 2008; accepted 16 June 2008
Abstract
A dual channel difference (DCD) method is applied to detect nighttime sea fog/stratus over theHuanghai Sea using the infrared (IR) data of shortwave (3.5–4.0 µm) and longwave (10.3–11.3µm) channels from the Multi-functional Transport Satellite (MTSAT)-1R, i.e., shortwave minuslongwave brightness temperature difference (SLTD). Twenty-four sea fog events over the HuanghaiSea during March to July of 2006 and 2007 are chosen to determine a suitable value of SLTD for
nighttime sea fog/stratus detection, and it is found that the value of –5.5––2.5◦
C can be takenas a criterion. Two case examples of sea fog events are especially demonstrated in detail utilizingthe criterion, and the results show that the derived sea fog/stratus coverage is quite reasonable.This coverage information is very helpful to analyze the formation and evolution of sea fog/stratusduring night and can provide sea fog researchers with observational evidences for model resultsverification. However, more efforts are needed to further obtain vertical extent information of seafog/stratus and attempt to discriminate between sea fog and stratus.
Key words: Huanghai Sea, nighttime sea fog, MTSAT-1R, dual channel difference method
1 Introduction
Sea fog is a serious weather hazard along coastand over ocean. It usually reduces visibility to less
than 1 km and even much lower. This bad visibility
is extremely dangerous for maritime activities, such
as navigation, oil drilling, fishery and rescue. About
80% of all calamities over ocean take place due to sea
fog (Trmant, 1987). Some ship collision accidents in
sea fog often cause oil spill events, resulting in envi-
ronmental pollution and ecological hazard. Thus, as
a major component of maritime environment moni-
toring, the sea fog information is very important for
coastal and maritime safety.Among the seas of China, the Huanghai Sea suf-
fers from dense sea fog episodes most frequently, es-
pecially during spring and summer. Monitoring and
forecasting of sea fog over the Huanghai Sea are get-
ting more attention. However, it is difficult to mon-
itor sea fog with the aid of routine surface measure-
ment network, due to the scarcity of measurements
over vast sea region. The number of surface-observing
sites along coast and at islands is insufficient to de-
termine the true extent of fog, and many of observa-
tional stations usually reduce their operations at night.Weather reports from cruise ships over the Huanghai
Sea are usually rather few and most recorded at 3 h in-
tervals and even larger. Although numerical modeling
offers a promising approach to sea fog prediction over
the Huanghai Sea, this approach is still at research
stage due to the extreme sensitivity to the model input
(Gao et al., 2007). To develop and improve a numer-
ical model to predict sea fog, observational facts such
as the spatial distribution of sea fog and its evolution
are usually necessary for model verification. Before a
sophisticated model can be used to do reliable sea fogprediction, routine sea fog monitoring over the Huang-
hai Sea is particularly urgent.
Remote sensing technique is undoubtedly becom-
ing a crucial approach to provide these observational
facts for both the monitoring and the model verifica-
tion. Nowadays, plenty of cloud information over the
Huanghai Sea is obtained everyday through the geo-
stationary orbit satellites (FY–2C, FY–2D, GOES–
Foundation item: The National Natural Science Foundation of China under contract No. 40706004, the National BasicResearch Program (“973” program) of China under contract No. 2005CB422301; China Meteorological Administration’s New
Technology Extension Project under contract No. CMATG2008M41; the National Special Fund for public Sector Research of China under contract No. GYHY200706031, Shandong Provincial Meteorological Bureau Science Fund of China under contractNo. 2004SDQXJ01.
∗Corresponding author, E-mail: [email protected]
1

8/20/2019 Sea fog Detection
http://slidepdf.com/reader/full/sea-fog-detection 2/13
24 GAO Shanhong et al. Acta Oceanologica Sinica 2009, Vol. 28, No. 2, P.23-35
9, and MTSAT–1R)1) and the polar orbit satellites
(FY–1D, NOAA series)2)
. There are two main typesof imagery from these satellites: infrared (IR) image
and visible image. During daytime, visible images
are superior to infrared images in the depiction of sea
fog/stratus that are not distinguished within infrared
images, but visible images are unavailable at night.
Since the height of polar orbit satellites is quite lower
than that of geostationary orbit satellites, the resolu-
tion and quality of images from the former is usually
much better than those from the latter. However, the
temporal frequency of the former is much lower than
the latter. For the Huanghai Sea, there are no more
than two images one day from a polar orbit satellite
while a geostationary orbit satellite often sends im-
age back to earth every hour and even every 30 min,
and moreover, sometimes an image from a polar or-
bit satellite does not cover the whole Huanghai Sea.
Therefore, infrared imagery from geostationary orbit
satellites such as “MTSAT–1R” should be a primary
tool for fog detection at night over the Huanghai Sea
due to its relatively high temporal frequency and large
spatial coverage. This high temporal frequency is very
helpful to reveal the evolution of sea fog, especially
during night time, because most of sea fog events over
the Huanghai Sea are likely to occur initially at night.
As we know, “MTSAT–1R” is the successor of the
operational geostationary meteorological Statellite–5
(GMS–5). Compared with its predecessor “GMS–5”,
besides the improvement of resolution, “MTSAT–1R”
is additionally equipped with a near-infrared channel
(shortwave window). This shortwave channel can be
useful for the identification of fog at night, discrimi-
nating between water clouds and snow or ice clouds
during the daytime, detecting fires and volcanoes, and
nighttime determination of sea surface temperature.
However, this shortwave channel is not fully compe-
tent to distinguish sea fog by itself. Usually it often
needs to be used together with other infrared chan-
nels.
In this paper, we will address the problem: how to
effectively detect nighttime sea fog over the Huanghai
Sea using “MTSAT-1R” IR data. In some cases sea
fog forms as a stratus-lowering process and can thus be
considered to be cloud in contact with the sea surface
(Pilie, 1979; Koracin et al., 2001), while in other cases
sea fog develops immediately above the sea surfaceand can expand vertically to form stratus (Gao et al.,
2007; Findlater et al., 1989). Therefore, sea fog and
stratus are often mixed and it is very difficult to dis-
criminate them from satellite imagery. Hereafter, sea
fog and stratus are jointly called sea fog/stratus. In
the following sections, the characteristics of “MTSAT-
1R” are briefly described and a dual channel difference
method to detect sea fog/stratus is introduced, and
then a case study of two examples is shown and dis-
cussed in detail. A summary and discussion is followed
in the final section.
2 Data and methodology
2.1 “MTSAT–1R” IR data
Similar to “GOES–9” (the temporary replace-
ment of “GMS–5” before “MTSAT–1R”), the
“MTSAT–1R” imager has a five-band multi-spectral
capability with 10 bit precision and high spatial reso-
lution. Table 1 shows the characteristics of “MTSAT–
1R”. It is seen that these five bands consist of four in-
frared window channels and one visible window chan-
nel. The channel 4 (IR–4) is the shortwave window
mentioned above that the “GMS–5” imager does not
own. The channel 1 (IR1) is usually used to produce
familiar infrared cloud imagery. It is also seen from
Table 1 that IR is of 4 km resolution. This resolution
is sufficient for sea fog detection over the Huanghai
Sea, because sea fog over the Huanghai Sea usually
has a spatial scale of several hundred kilometers.
Table 1. “MTSAT–1R” characteristics.
Channel Resolution/km Wavelength/µm Description
1 4 10.3–11.3 longwave2 4 11.5–12.5 longwave II
3 4 6.5–7.0 vapor
4 4 3.5–4.0 shortwave
5 1 0.55–0.9 visible
The “MTSAT–1R” IR data used in this paper are
obtained from Kochi University, Japan3) .The IR data
contain two parts: one is a file in an image format of
portable grayscale map (PGM), and the other is
a calibration file. The radiance observed by the
1) “FY–2C”, “FY–2D” are “Fengyun–2C” satellite, “Fengyun–2D” satellite of China; “GOES–9” is geostationary operationalenvironmental satellite–9 of the United States; “MTSAT–1R” is multi–functional transport satellite of Japan.
2) “FY–1D” is “Fengyun–1D” satellite of China; NOAA is short for National Oceanic Atmospheric Administration satellites,
the United States.
3) http://weather.is.kochi-u.ac.jp/
8/20/2019 Sea fog Detection
http://slidepdf.com/reader/full/sea-fog-detection 3/13
GAO Shanhong et al. Acta Oceanologica Sinica 2009, Vol. 28, No.2, P.23-35 25
“MTSAT–1R” imager is stored in a PGM image with
grayscale information. The calibration file is used tocalculate the cloud top brightness temperature (T b)
from the PGM, i.e., grayscale information is converted
to the brightness temperature information. The IR
data we will use later refer to this the brightness tem-
perature information.
2.2 Dual channel difference method
There has existed a considerable body of work on
nighttime fog detection using IR data of geostationary
and polar satellites. The techniques developed in such
work can be classified into two types: one type is single
channel (SC) method, and the other is dual channeldifference (DCD) method. The SC method is designed
for a geostationary satellite such as “GMS–5” that is
not equipped with a shortwave window channel. But
it is not only a method with the use of image enhance-
ment and animation techniques. For example, Ahn et
al. (2003) proposed an algorithm for sea fog/stratus
detection using “GMS–5” IR data (11 µm brightness
temperature, simply T b11). Their method compares
the measured radiance with a predetermined, accu-
rate clear-sky radiance composite map of the 11 µm
brightness temperature. The difference between themis used to determine sea fog/stratus. This process is
somewhat complex. However, for other satellites such
as the NOAA series and the GOES series that own
shortwave window channel, the DCD method can be
used with relative ease instead of the SC method. TheDCD method, taking the difference between short-
wave and longwave channel brightness temperature,
has been widely employed for nighttime fog/stratus
detection. This method is based on the fact that
water clouds (sea fog/status) observed in the short-
wave infrared window have significantly lower emis-
sivity than the same clouds observed in longwave win-
dows (Hunt, 1973). It was firstly developed based on a
great deal of research work of the NOAA series (Saun-
ders and Kriebel, 1988; d’Entremont and Thomason,
1987; d’Entremont, 1986; Eyre et al., 1984). The ap-
plication of this method was extended to the GOES
series by Ellrod (1995) and Lee et al. (1997). It has
already been a popular and dominant method to de-
tection fog/stratus.
2.3 Criterion for detecting nighttime sea fog
over the Huanghai Sea
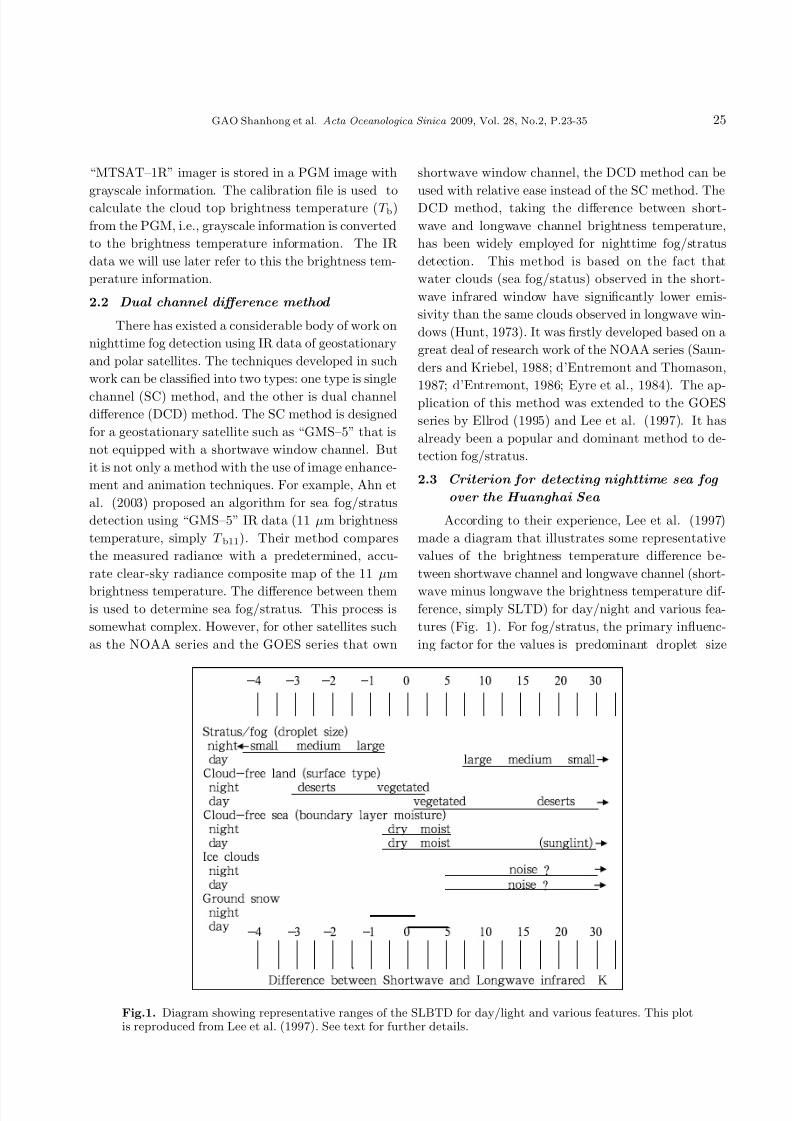
According to their experience, Lee et al. (1997)
made a diagram that illustrates some representative
values of the brightness temperature difference be-
tween shortwave channel and longwave channel (short-
wave minus longwave the brightness temperature dif-ference, simply SLTD) for day/night and various fea-
tures (Fig. 1). For fog/stratus, the primary influenc-
ing factor for the values is predominant droplet size
Fig.1. Diagram showing representative ranges of the SLBTD for day/light and various features. This plotis reproduced from Lee et al. (1997). See text for further details.

8/20/2019 Sea fog Detection
http://slidepdf.com/reader/full/sea-fog-detection 4/13
26 GAO Shanhong et al. Acta Oceanologica Sinica 2009, Vol. 28, No. 2, P.23-35
with relatively small droplet size being indicated by
the largest positive values during the daytime andby the most negative values at night. For cloud-free
ocean, the primary influencing factor for the SLTD
values is boundary layer moisture and lower values in-
dicate relative drier air mass. For ice clouds, which
reflect little solar radiation, the SLTD values are posi-
tive both day and night as a function of the differential
transmission through the clouds. Noise at low bright-
ness temperature can produce spurious values over ice
clouds. It is inferred from Fig.1 that the SLTD val-
ues from –4 ◦C to –1 ◦C can be used to determine
fog/stratus. The criterion is used by Ellrod (1995) to
detect coastal fog along the Gulf of Mexico is –4 ◦C
to –2 ◦C for SLTD, and the values used by Lee et al.
(1997) to distinguish fog over land is –3.5 ◦C to –1 ◦C.
These values agree with Fig.1. However, can they be
directly applied to nighttime sea fog/stratus detection
over the Huanghai Sea using “MTSAT–1R” IR data?
Several sea fog events over the Huanghai Sea dur-
ing the spring and summer of 2006 have been taken
as examples to test these SLTD values. It is found
that the SLTD value suitable for determining sea
fog/stratus over the Huanghai Sea is slightly differ-ent from those used by Ellrod (1995) and Lee et al.
(1997). In general, it is about 1.5 ◦C lower. The
“MTSAT–1R” IR images at 02:00 local standard time
(LST, UTC +08:00) on 07:00 March 2006 are taken as
a demonstration. It is rather difficult to distinguish sea
fog/stratus coverage from the IR1 image, as well as the
IR4 image (figures not shown). But an obviously dif-
ferent portion over the East China Sea and the south-
ern Huanghai Sea is discriminated from other portion
on the image of SLTD (IR4-IR1) (Fig. 2). Combined
with the information of surface observed visibilities
(see the symbols in Fig.2), this noticeable portion can
be considered as a large fog/stratus patch. The SLTD
of this portion is about from –6 to –3.5 ◦C. To clearly
illustrate the variation of SLTD from an area without
fog/stratus to another area with fog/stratus, two tran-
sects are elaborately arranged along two lines (west-
east line WE and south-north line SN in Fig. 2). It is
clearly shown in Fig. 2 that the line WE crosses land
and sea associated with SLTD values from higher to
Fig.2. Image of SLTD for 02:00 LST 7 March 2006. The symbols •, , ♦, ◦ and × represent the observed
visibility with values 0–1, 1–3, 3–5, 5–10 km and greater than 10 km, respectively.
8/20/2019 Sea fog Detection
http://slidepdf.com/reader/full/sea-fog-detection 5/13
GAO Shanhong et al. Acta Oceanologica Sinica 2009, Vol. 28, No.2, P.23-35 27
lower and just through an observation with sea fog re-
port (marked with “2” in Fig. 2), while the line SNis wholly across the possible sea fog/stratus area be-
tween two places with observed visibilities of less than
1 km (see the two black dots marked with “1” and “2”
in Fig. 2).
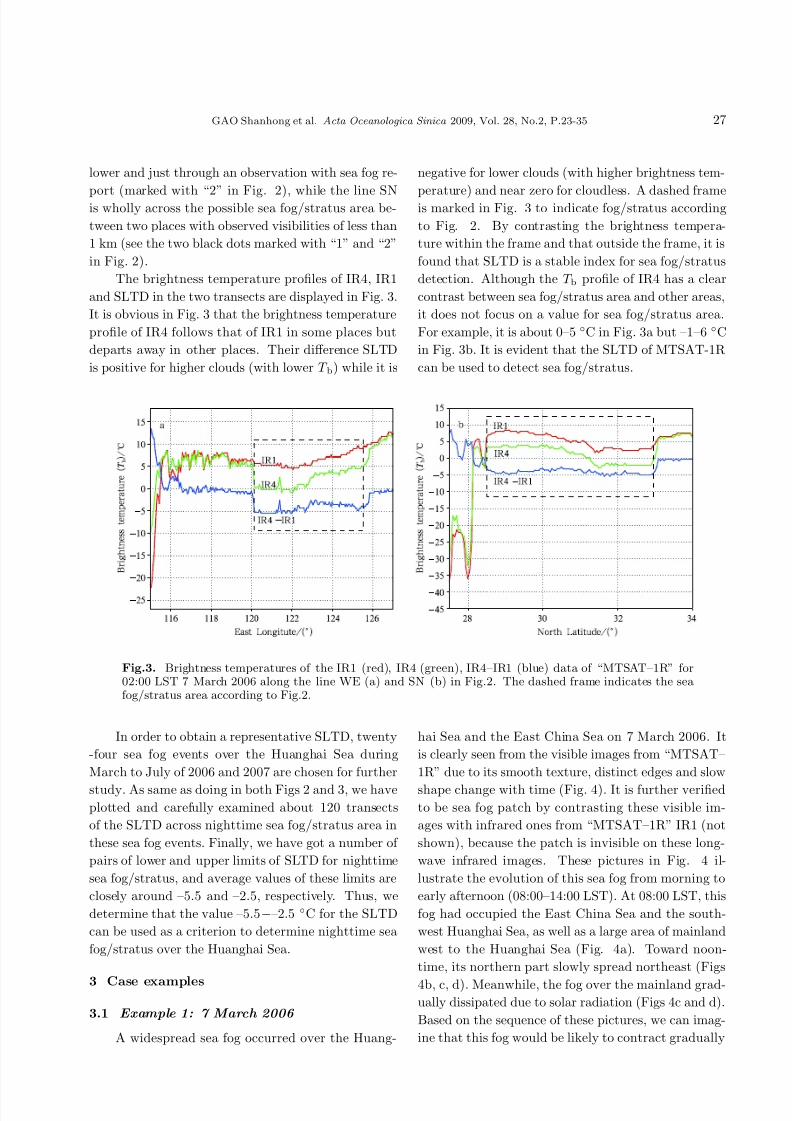
The brightness temperature profiles of IR4, IR1
and SLTD in the two transects are displayed in Fig. 3.
It is obvious in Fig. 3 that the brightness temperature
profile of IR4 follows that of IR1 in some places but
departs away in other places. Their difference SLTD
is positive for higher clouds (with lower T b) while it is
negative for lower clouds (with higher brightness tem-
perature) and near zero for cloudless. A dashed frameis marked in Fig. 3 to indicate fog/stratus according
to Fig. 2. By contrasting the brightness tempera-
ture within the frame and that outside the frame, it is
found that SLTD is a stable index for sea fog/stratus
detection. Although the T b profile of IR4 has a clear
contrast between sea fog/stratus area and other areas,
it does not focus on a value for sea fog/stratus area.
For example, it is about 0–5 ◦C in Fig. 3a but –1–6 ◦C
in Fig. 3b. It is evident that the SLTD of MTSAT-1R
can be used to detect sea fog/stratus.
Fig.3. Brightness temperatures of the IR1 (red), IR4 (green), IR4–IR1 (blue) data of “MTSAT–1R” for02:00 LST 7 March 2006 along the line WE (a) and SN (b) in Fig.2. The dashed frame indicates the seafog/stratus area according to Fig.2.
In order to obtain a representative SLTD, twenty
-four sea fog events over the Huanghai Sea during
March to July of 2006 and 2007 are chosen for further
study. As same as doing in both Figs 2 and 3, we haveplotted and carefully examined about 120 transects
of the SLTD across nighttime sea fog/stratus area in
these sea fog events. Finally, we have got a number of
pairs of lower and upper limits of SLTD for nighttime
sea fog/stratus, and average values of these limits are
closely around –5.5 and –2.5, respectively. Thus, we
determine that the value –5.5−–2.5 ◦C for the SLTD
can be used as a criterion to determine nighttime sea
fog/stratus over the Huanghai Sea.
3 Case examples
3.1 Example 1: 7 March 2006
A widespread sea fog occurred over the Huang-
hai Sea and the East China Sea on 7 March 2006. It
is clearly seen from the visible images from “MTSAT–
1R” due to its smooth texture, distinct edges and slow
shape change with time (Fig. 4). It is further verifiedto be sea fog patch by contrasting these visible im-
ages with infrared ones from “MTSAT–1R” IR1 (not
shown), because the patch is invisible on these long-
wave infrared images. These pictures in Fig. 4 il-
lustrate the evolution of this sea fog from morning to
early afternoon (08:00–14:00 LST). At 08:00 LST, this
fog had occupied the East China Sea and the south-
west Huanghai Sea, as well as a large area of mainland
west to the Huanghai Sea (Fig. 4a). Toward noon-
time, its northern part slowly spread northeast (Figs
4b, c, d). Meanwhile, the fog over the mainland grad-ually dissipated due to solar radiation (Figs 4c and d).
Based on the sequence of these pictures, we can imag-
ine that this fog would be likely to contract gradually

8/20/2019 Sea fog Detection
http://slidepdf.com/reader/full/sea-fog-detection 6/13

8/20/2019 Sea fog Detection
http://slidepdf.com/reader/full/sea-fog-detection 7/13
GAO Shanhong et al. Acta Oceanologica Sinica 2009, Vol. 28, No.2, P.23-35 29
Fig.5. Sea fog/stratus coverage detected by the DCD method using “MTSAT–1R” IR data. The picturesa. and b. are at 20:00 LST and 22:00 LST on 6 March, respectively. And the others are at the followinghour on 7 March: c. 02:00 LST, d. 03:00 LST, e. 05:00 LST and f. 06:00 LST (symbols as in Fig. 2).
and those in Fig. 4 can provide us an entire evolu-
tion of the sea fog/stratus from evening on 6 March
to early afternoon on 7 March. This is quite helpfulto analyze formation mechanism of this fog event. Ac-
cording to the literatures on sea fog formation over
the Huanghai Sea (Wang, 1985; Zhou et al., 2004;
Huang and Zhou., 2006; Fu et al., 2006; Gao et al.,
2007; Fu et al., 2008), advection cooling fog is a typi-
cal type of sea fog events over the Huanghai Sea duringspring. For most of sea fog episodes with large cover-
age over the Huanghai Sea, a usual weather situation
is that the Huanghai Sea locates between an anticy-

8/20/2019 Sea fog Detection
http://slidepdf.com/reader/full/sea-fog-detection 8/13
30 GAO Shanhong et al. Acta Oceanologica Sinica 2009, Vol. 28, No. 2, P.23-35
clone and a cyclone, and relatively persistent southerly
wind dominates the Huanghai Sea and the East ChinaSea and warm moisture air mass is transported from
the tropical zone to the Huanghai Sea (Gao et al.,
2007). However, the synoptic feature for this sea fog
event is much different. The analyses from the World
Meteorological Organization - Distributed Data Bases
(WMO-DDBs) by Japan Meteorology Agency (JMA)
are used to show this feature (Fig. 6). It is evident
that a low-level high pressure persistently controlled
the Huanghai Sea and East China Sea during 20:00
LST 6 March to 14:00 LST 7 March and its center
moved from west to southeast. By viewing the surface
winds in Fig 6a and b, it is clearly shown that heavysea fog with large coverage can also formed without
southerly winds prevailing over the Huanghai Sea and
transporting warm moisture air from the tropical zone
to the Huanghai Sea.
Regardless of northeasterly winds or southerly
winds, sea fog is usually associated with inversions.
Through a careful observational analysis of sound-
ing data of Qingdao, Sheyang, Shanghai, Hongjia and
Chejudo, China (their locations marked in Fig. 6), it
is found that in this event the inversion had been
Fig.6. Analyses of the 1 000 hPa data from JMA. The picture a is at 20:00 LST on 6 March 2006, and theothers are at the following hour of 7 March 2006: b. 02:00 LST, c. 08:00 LST and d. 14:00 LST. A full windbarb is at 5 m/s.Gray shading shows the sea fog/stratus coverage. The dots marked with QD, SY, SH, HJand CJ are located at Qingdao, Sheyang, Shanghai, Hongjia and Chejudo, respectively.
8/20/2019 Sea fog Detection
http://slidepdf.com/reader/full/sea-fog-detection 9/13
GAO Shanhong et al. Acta Oceanologica Sinica 2009, Vol. 28, No.2, P.23-35 31
set up before fog started to form, and that it resulted
from northeasterly cold air incursion into the bottompart of the marine atmospheric boundary layer over
the Huanghai Sea by the low-level high pressure cir-
culation. Further analyses, such as 12 h changes of
geopotential heights, relative humidity and tempera-
ture on 1 000 hPa, are also made. The result infers
that this sea fog is closely related to high-pressure sys-
tem over the Huanghai Sea. Subsidence induced by
high pressure is an important factor for the formation
of sea fog off the California coast, and this mechanism
were discussed in detail by Leipper (1994), Lewis et al.
(2003) and Koracin et al. (2001), Koracin, Leipper et
al. (2005), and Koracin, Businger et al. (2005). When
examining the literature on sea fog formation over the
Huanghai Sea, it can be seen that this mechanism is
seldom studied. Instead, most of studies focus on ad-
vection cooling process.
The preceding analysis has already provided us
with a way to further study this sea fog event us-
ing a numerical model, and of course the detected
sea fog/stratus coverage will undoubtedly offer useful
information to understand the formation mechanism
and verify the model results.
3.2 Example 2: 6 June 2006
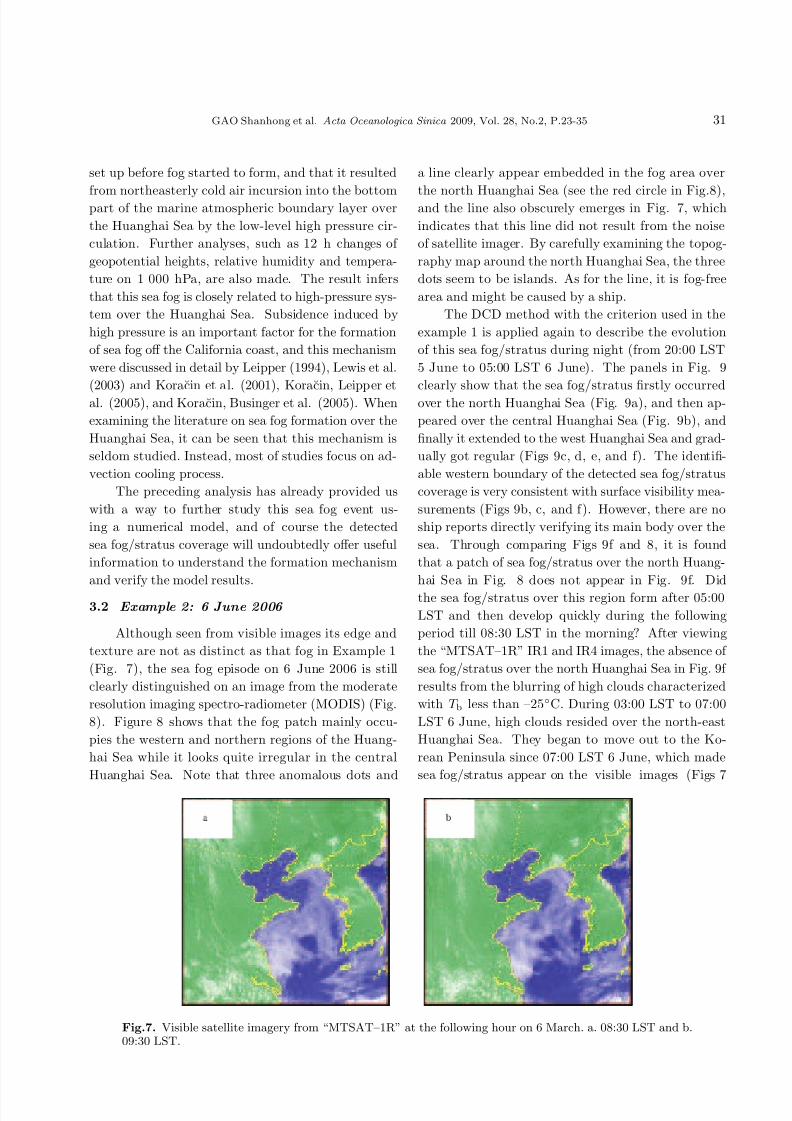
Although seen from visible images its edge and
texture are not as distinct as that fog in Example 1
(Fig. 7), the sea fog episode on 6 June 2006 is still
clearly distinguished on an image from the moderate
resolution imaging spectro-radiometer (MODIS) (Fig.
8). Figure 8 shows that the fog patch mainly occu-
pies the western and northern regions of the Huang-
hai Sea while it looks quite irregular in the central
Huanghai Sea. Note that three anomalous dots and
a line clearly appear embedded in the fog area over
the north Huanghai Sea (see the red circle in Fig.8),and the line also obscurely emerges in Fig. 7, which
indicates that this line did not result from the noise
of satellite imager. By carefully examining the topog-
raphy map around the north Huanghai Sea, the three
dots seem to be islands. As for the line, it is fog-free
area and might be caused by a ship.
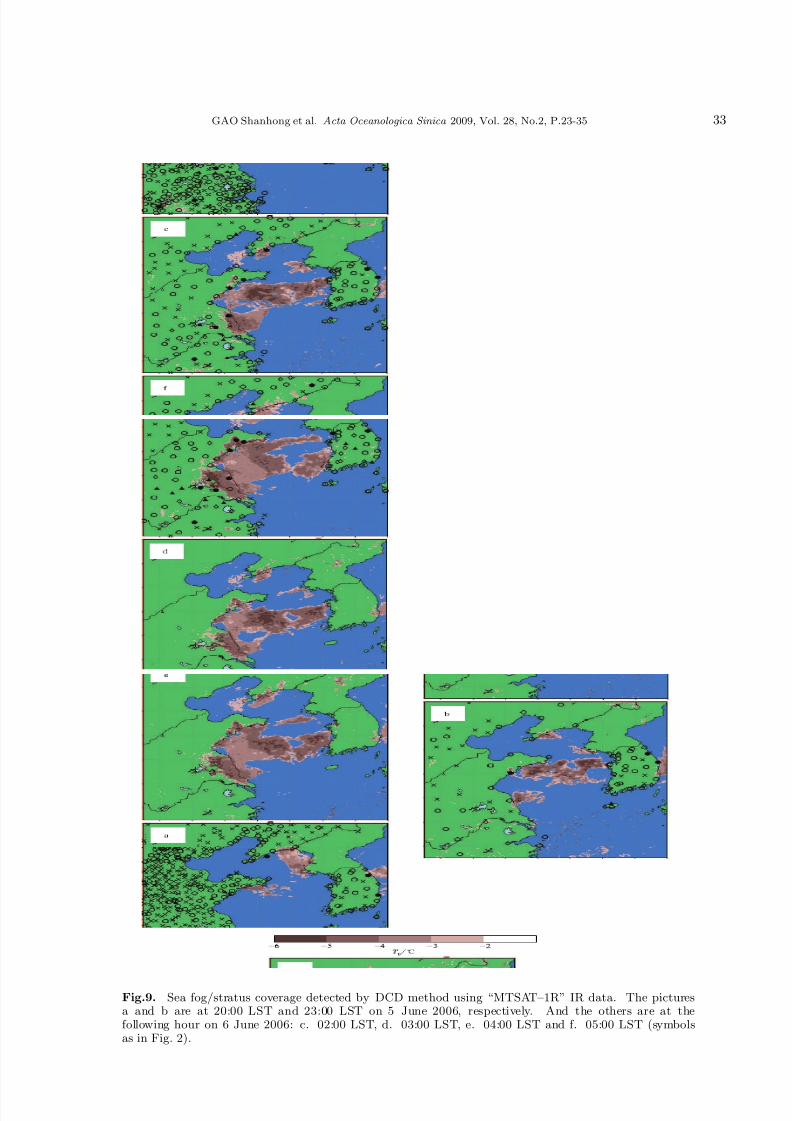
The DCD method with the criterion used in the
example 1 is applied again to describe the evolution
of this sea fog/stratus during night (from 20:00 LST
5 June to 05:00 LST 6 June). The panels in Fig. 9
clearly show that the sea fog/stratus firstly occurred
over the north Huanghai Sea (Fig. 9a), and then ap-
peared over the central Huanghai Sea (Fig. 9b), and
finally it extended to the west Huanghai Sea and grad-
ually got regular (Figs 9c, d, e, and f). The identifi-
able western boundary of the detected sea fog/stratus
coverage is very consistent with surface visibility mea-
surements (Figs 9b, c, and f). However, there are no
ship reports directly verifying its main body over the
sea. Through comparing Figs 9f and 8, it is found
that a patch of sea fog/stratus over the north Huang-
hai Sea in Fig. 8 does not appear in Fig. 9f. Did
the sea fog/stratus over this region form after 05:00
LST and then develop quickly during the following
period till 08:30 LST in the morning? After viewing
the “MTSAT–1R” IR1 and IR4 images, the absence of
sea fog/stratus over the north Huanghai Sea in Fig. 9f
results from the blurring of high clouds characterized
with T b less than –25◦C. During 03:00 LST to 07:00
LST 6 June, high clouds resided over the north-east
Huanghai Sea. They began to move out to the Ko-
rean Peninsula since 07:00 LST 6 June, which made
sea fog/stratus appear on the visible images (Figs 7
Fig.7. Visible satellite imagery from “MTSAT–1R” at the following hour on 6 March. a. 08:30 LST and b.09:30 LST.

8/20/2019 Sea fog Detection
http://slidepdf.com/reader/full/sea-fog-detection 10/13
32 GAO Shanhong et al. Acta Oceanologica Sinica 2009, Vol. 28, No. 2, P.23-35
Fig.8. Composite imagery from MODIS for 10:10 LST 6 June 2006. Three dots and a line are emphasizedby a red circle.
and 8). When we review Fig. 5b of the example 1 and
look for the reason why there exists a fog-free area
east to the Changjiang estuary, it is found that highclouds are again responsible for it.
Similar to the weather situation of the example 1,
this sea fog/stratus is also closely involved with high
pressure system. From surface to 850 hPa, nearly the
whole Huanghai Sea was dominated by high pressure
and sea fog/stratus gradually formed and developed
within this high pressure during night (Fig. 10; anal-
yses of 850 hPa is not shown). Existence of the line
in Fig.8 infers that the sea fog/stratus over the north
Huanghai Sea developed very slowly, and it occurred
nearly two hours at least (from 08:30 LST to 10:10LST; Figs 7a and 8).
4 Summary and discussion
It is relatively easy to distinguish sea fog/stratus
over the Huanghai Sea at daytime on visible images.
However, these images are unavailable at night. An
approach known as DCD method is applied to detect
nighttime sea fog/stratus over the Huanghai Sea using
the IR4 and IR1 data from “MTSAT–1R”. A value of
the dual channel difference (IR4 minus IR1, SLTD) isdetermined to –5.5−–2.5 ◦C as a criterion for this de-
tection, based on many sea fog events over the Huang-
hai Sea in the spring and summer seasons. In addition,
two case examples are demonstrated in detail to show
that the DCD method with the criterion is feasible
to detect nighttime sea fog/stratus coverage over theHuanghai Sea.
Although numerical models are undoubtedly be-
coming a hopeful tool to forecast sea fog over the
Huanghai Sea, they are still at research stage due to
the complexity of sea fog. One trouble confronting
those researchers who use numerical models is the ab-
sence of observations over sea region, especially during
night. As shown in the case examples, this problem
can be alleviated to a great extent, because progres-
sive image sequences created by the DCD method us-
ing “MTSAT–1R” IR data can provide plenty of usefulinformation about nighttime sea fog/stratus coverage.
The information is very helpful to analyze formation
mechanism of sea fog/stratus, as well as model results
verification. Besides its coverage, the vertical extent of
sea fog/stratus is another aspect worthy of consider-
ing. Yamanouchi et al. (1987) and Ellrod (1995) pro-
posed their statistical relationships between top height
of sea fog/stratus and absolute value of SLTD, respec-
tively. Their results are quite close, though they used
different data and focused on fog/stratus over different
regions. The former employed IR data from “NOAA–7” to identify low clouds in Antarctica, but the lat-
ter used IR data from “GOES–7–8” and detected sea
fog/stratus over the United States. Here, we attempt
8/20/2019 Sea fog Detection
http://slidepdf.com/reader/full/sea-fog-detection 11/13
GAO Shanhong et al. Acta Oceanologica Sinica 2009, Vol. 28, No.2, P.23-35 33
Fig.9. Sea fog/stratus coverage detected by DCD method using “MTSAT–1R” IR data. The picturesa and b are at 20:00 LST and 23:00 LST on 5 June 2006, respectively. And the others are at thefollowing hour on 6 June 2006: c. 02:00 LST, d. 03:00 LST, e. 04:00 LST and f. 05:00 LST (symbolsas in Fig. 2).
8/20/2019 Sea fog Detection
http://slidepdf.com/reader/full/sea-fog-detection 12/13
34 GAO Shanhong et al. Acta Oceanologica Sinica 2009, Vol. 28, No. 2, P.23-35
Fig.10. Analyses of the 1000 hPa data from JMA. a. 20:00 LST on 5 June and b. 08:00 LST on 6June, 2006.
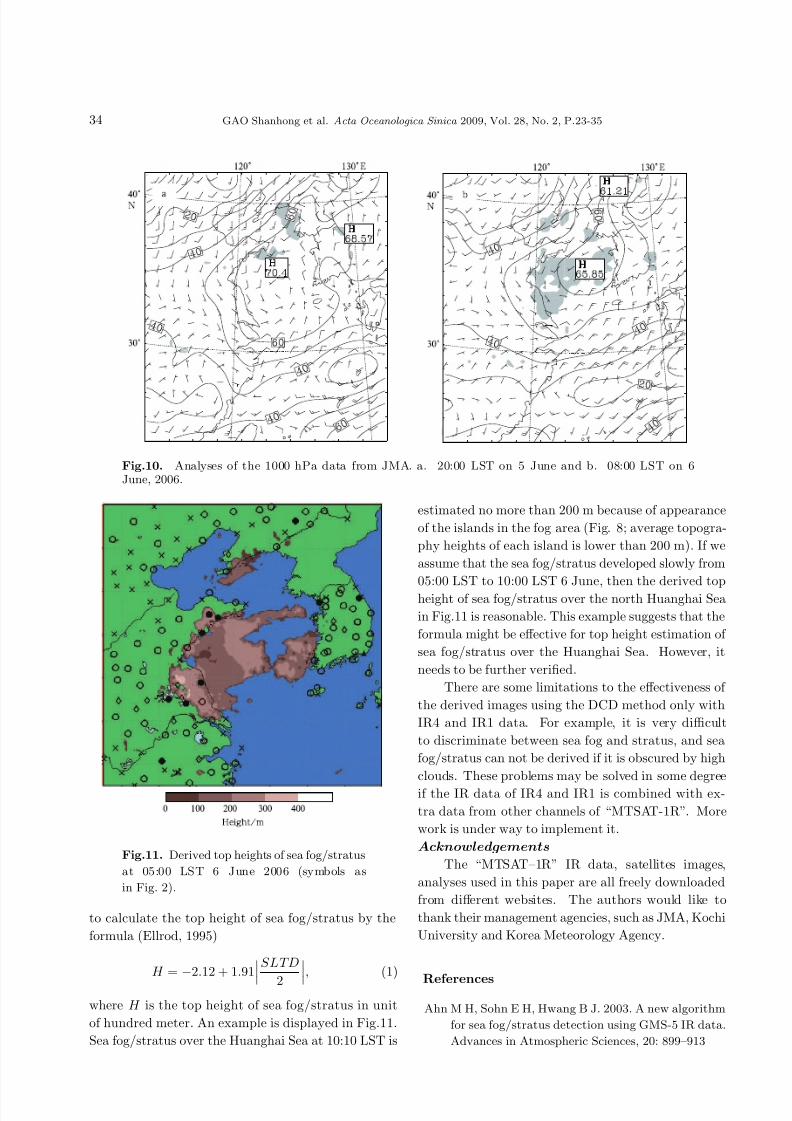
Fig.11. Derived top heights of sea fog/stratus
at 05:00 LST 6 June 2006 (symbols as
in Fig. 2).
to calculate the top height of sea fog/stratus by the
formula (Ellrod, 1995)
H = −2.12 + 1.91
SLTD
2
, (1)
where H is the top height of sea fog/stratus in unit
of hundred meter. An example is displayed in Fig.11.
Sea fog/stratus over the Huanghai Sea at 10:10 LST is
estimated no more than 200 m because of appearance
of the islands in the fog area (Fig. 8; average topogra-
phy heights of each island is lower than 200 m). If we
assume that the sea fog/stratus developed slowly from
05:00 LST to 10:00 LST 6 June, then the derived top
height of sea fog/stratus over the north Huanghai Sea
in Fig.11 is reasonable. This example suggests that the
formula might be effective for top height estimation of
sea fog/stratus over the Huanghai Sea. However, it
needs to be further verified.
There are some limitations to the effectiveness of
the derived images using the DCD method only with
IR4 and IR1 data. For example, it is very difficult
to discriminate between sea fog and stratus, and sea
fog/stratus can not be derived if it is obscured by high
clouds. These problems may be solved in some degree
if the IR data of IR4 and IR1 is combined with ex-
tra data from other channels of “MTSAT-1R”. More
work is under way to implement it.
Acknowledgements
The “MTSAT–1R” IR data, satellites images,
analyses used in this paper are all freely downloaded
from different websites. The authors would like to
thank their management agencies, such as JMA, Kochi
University and Korea Meteorology Agency.
References
Ahn M H, Sohn E H, Hwang B J. 2003. A new algorithm
for sea fog/stratus detection using GMS-5 IR data.
Advances in Atmospheric Sciences, 20: 899–913

8/20/2019 Sea fog Detection
http://slidepdf.com/reader/full/sea-fog-detection 13/13
GAO Shanhong et al. Acta Oceanologica Sinica 2009, Vol. 28, No.2, P.23-35 35
d’Entremont R P. 1986. Low- and midlevel cloud analysis
of nighttime multispectral imagery. J. Climate Appl
Meteor, 25: 1853–1869d’Entremont R P, Thomason L W. 1987. Interpreting me-
teorological satellite images using a color composite
technique. Bull Amer Meteor Soc, 68: 762–768
Ellrod G P. 1995. Advances in the detection and analysis
of fog at night using GOES multispectral infrared
imagery. Weather and Forecasting, 10: 606–619Eyre J R, Brownscombe J L, Allam R J. 1984. Detection
of fog at night using advanced very high resolution
radiometer. Meteor Mag, 113: 266–271Fu Gang, Guo Jingtian, Angeline Pendergrass, et al.
2008. An Analysis and Modeling Study of a Sea Fog
Event over the Yellow and Bohai Seas. Journal of Ocean University of China, 7: 27–34
Fu G., Guo J, Xie S P, Duan Y, et al. 2006. Analysis and
high-resolution modeling of a dense sea fog event
over the yellow Sea. Atmos Res, 81: 293–303Gao Shanhong, Lin Hang, Shen Biao, et al. 2007. A
heavy sea fog event over the Yellow Sea in March
2005: analysis and numerical modeling. Advances
in Atmospheric Sciences, 24: 65–81Huang Jian., Zhou Faxiu. 2006. The cooling and moisten-
ing effect on the formation of sea fog in the Huanghai
Sea. Acta Oceanologica Sinica, 25, 49–62
Hunt G E. 1973. Radiative properties of terrestrial cloudsat visible and infrared thermal window wavelengths.
Quart J Roy Meteor Soc, 99: 346–369Koracin D, Businger J A, Dorman C E, et al. 2005.
Formation, evolution, and dissipation of coastal sea
fog. Boundary-Layer Meteorology, 117: 447–478Koracin D, Leipper D F, Lewis J M. 2005. Modeling sea
fog on the U.S. California coast during a hot spell
event. Geofizika, 22: 59–82
Koracin D, Lewis J, Thompson W T, et al. 2001. Tran-
sition of stratus into fog along the California coast:
Observation and modeling. J Atmos Sci, 58: 1714–
1731
Lee T F, Turk F J, Richardson K. 1997. Stratus and
fog products using GOES-8-9 3.9µm Data. Weather
and Forecasting, 12: 606–619
Leipper D. 1994. Fog on the U.S. West Coast: A review.
Bull Amer Meteor Soc, 75, 229–240
Pilie R, Mack E, Rogers C , et al. 1979. The formation
of marine fog and the development of fog-stratus
systems along the California coast. J Appl Meteor,
18: 1275–1286
Lewis J M, Koracin D, Rabin R, et al. 2003. Sea fogoff the California coast. J Geophys Res, 108 (D15),
4457, doi:10.1029/2003JD002833
Lewis J M, Koracin D, Redmond K T. 2004. Sea fog
research in the United Kingdom and United States.
Bull. Amer MeteorSoc, 85: 395–408
Saunders R W, Kriebel K T. 1988. An improved method
for detecting clear sky and cloudy radiance from
AVHRR data. Int J Remote Sens, 19: 123–150
Tremant M.1987.La Prevision du brouilliard en mer, Me-
teorologie Maritime et Activies. Oceanograpiques
Connexes Rapor. v 20. WMO, 127
Wang B. 1985. Sea Fog. Beijing: China Ocean Press, 330
Yamanouchi, Suzuki T K, Kawaguchi S. 1987. Detection
of clouds in Antarctica from infrared multispectral
data of AVHRR. J Meteor Soc Japan, 65: 949–961
Zhou Faxiu, Wang Xin, Bao Xianwen. 2004. Climatic
characteristics of sea fog formation of the Huanghai
Sea in spring. Acta Oceanologia Sinica(in Chinese),
26: 28–37