sea scallop industry of canada - national oceanic and
TRANSCRIPT
-.July 1963 COMMERCIAL FISHERIES REVIEW
SEA SCALLOP INDUSTR Y O F CANADA
By Richard M. Doherty';' , George P. Draheim>:'*, Donald J. White ';" ;";' , and Charles L. Vaughn"'***
INTRODUCTIO
11
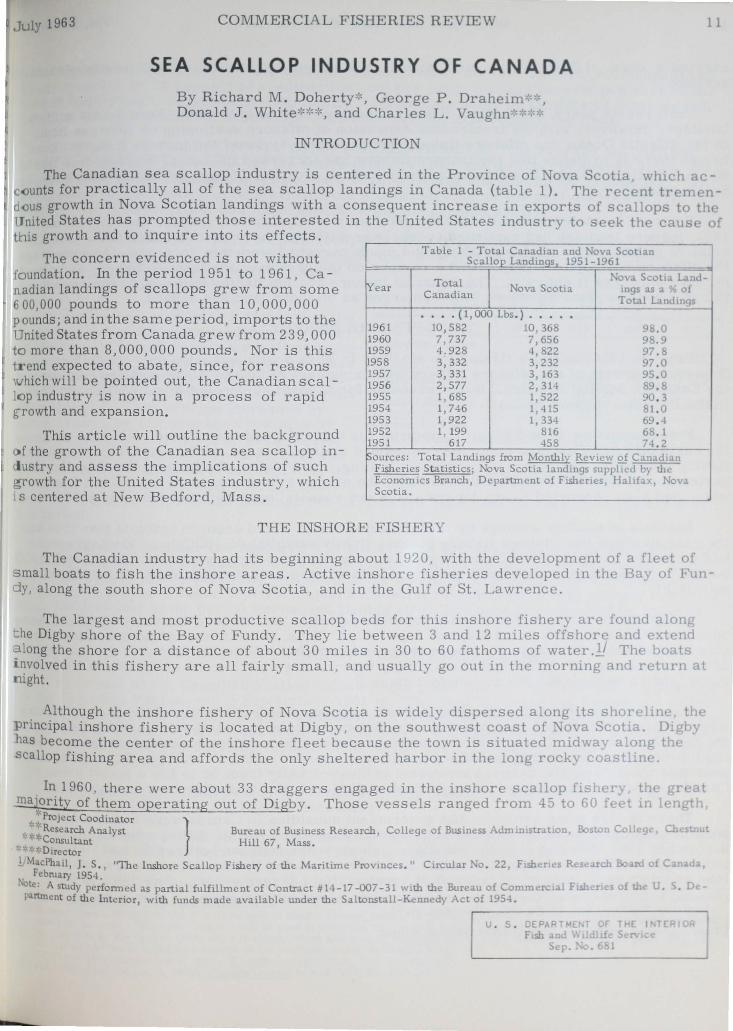
The Canadian sea scallop industry is centered in the Province of .l ova cotia, which ac<lunts for practically all of the sea scallop landings in Canada (tabl 1). T he rent tr m nous growth in Nova Scotian landings with a consequent increa s e in exports of scallops to th
United States has prompted those interested in the United States indus t ry to se k the caus of his growth and to inquire into its effects.
The concern evidenced is not without oundation. In the period 1951 to 1961, Caadian landings of scallops grew from some
600,000 pounds to more than 10, 000, 000 pounds; and in the same period, imports to the United States from Canada grew from 239,000 to more than 8,000,000 pounds. Nor is this trend expected to abate, since, for reasons \vhich will be pointed out, the Canadian scallop industry is now in a process of rapid g-rowth and expansion.
This article will outline the background ()f the growth of the Canadian sea scallop industry and assess the implications of such
rowth for the United States industry, which . s centered at New Bedford, Mass.
T able 1 - T ot al Canadian and Nova Scotian Scallop Landinqs 1951-1961
Year Total N;~a Scotia Land-
Ca na dian Nova Scotia Ings as 96 of
Total Landings ••. (1 ,000 Lbs.) ••••
1961 10, 5 82 10,368 98.0 19 60 7,7 37 7,656 98.9 1959 4 .928 01,822 97.8 195 8 3,332 3,232 97 . 0 1957 3,331 3, 163 95 . 0 1956 2 ,577 2,3101 89 . 8 1955 1, 685 1,522 90 . 3 1954 1,746 1,415 81.0 1953 1, 9 22 1,3301 69 . 4 1952 1, 199 816 68 . 1 1951 6 17 0158 74.2 :'ources: Total Landings from Monthly Review £f Canadian
Fishe ries Statist ics; Nova Scotia landings suppiled by the Economics Branch, D epartment of Fisheries, Hahfax, Nova Scot ia .
THE INSHORE FISHERY
The Canadian industry had its beginning about 1920, with the development of a fl" t of small boats to fish the inshore areas. Active i ns hore fisheries developed in the Bay of Fun
y, along the south shore of Nova Scotia, and i n the Gulf of St. Lawrence.
The largest and most productive scallop beds for this inshore fishery are found along t he Digby shore of the Bay of Fundy . They lie bet ween 3 and 12 miles offshore and ext nd a long the shore for a distance of about 30 m iles in 30 t o 60 fathoms of water.'!! Th boats involved in this fiShery are all fairly small, and u sually go out in the morning and return at night .
Although the inshore fishery of Nova Scot ia is widely dispersed along its shoreline the J)rincipal inshore fishery is located at Digby, on t he southwest coast of 1. ova Scotia. Dlg y las become the center of the inshore fl eet because the town is situated midwa along th scallop fishing area and affords the only s helte r ed harbor in the long rocky coastl~n .
In 1960, there were about 33 draggers e nga ged in the inshore scallop fishery th ma1.0rity of them operating out of Digby . Thos e vessels ranged from 45 to 60 feet in 1 n
" Research Analyst Bureau of Busmess Research , College of Business AdmlDlstratlon, Boston Col eg Ch t Project Coodinator }
* Consultant Hill 67 Mass . * "-' Director ' 1. ~lacPhail, J. S., "The Inshore Scallop Fishery of the Maritime Provinces . " Cucular o . 22, Flshenes Research Bo.ll'd of C
February 19So1. Ie : A study perform ed as partial fulf illment of Contract #101-17-007-31 With the Bureau of Commercial Fish r s of th U •• 0
rtment of the Interior, with funds made available under the Saltonstall - Kennedy Act of 1954 .
u . s.

12 COMMERCIA L FISHERIES REVIEW Vol. 25, NC). it
carried a crew of 3 to 5 men, and landed a n average da ily catch of 500 pounds of shuckl scallops .?:J
Until recent years, the inshore fishery accou nt e d fo r the bulk of the Nova Scotia scallop landings . However, with the tremendous expansion of offs hor e sca llop.ing on G~orges Bank ) in the Atlantic Ocean, the offshore fishery has now come to dwarf the lllshore flshery. Eve though there is evidence that the inshore fishery has increased its annual landings to a leve of 1.5-2 million pounds, this fishery now account s at most for 20 p e rcent of the total Nova Scotia catch.lI
It cannot be stated what will be the most likely level of future ins hor e operations , but i 1961 , inshore landings had continued to increase, although the much m ore rapid absolute aD relative growth of the offshore fishery had much overshadowed this increase. At some sta the offshore development may act as a damper on the growth of the ins ho r e fishery and als perhaps suppress it entirely . The future of inshore scallop fishing will depend, among othe things , upon the price structure which emerges as offshore landings exp a nd.
THE OFFSHORE FISHERY
Prior to 1956, offshore fishing for scallops in Nova Scotia was done on ly irregularly. Subsequent growth of the offshore fishery was extremely rapid and it has come to dominate the Canadian scallop industry. It now accounts for at least 80 percent of all scallop landings in the Province of Nova Scotia.
Notwithstanding, it is difficult to pinpoint the beginnings of the offshore industry, since the early offshore fleet was seemingly composed mainly of large , older vessels designed for fishing groundfish and converted to scallop fishing. Information supplied by the Canadian De partment of Fisheries indicates that in 1956, the offshore fleet consis t e d of 11 older boats which had been converted to scallopers and 9 new vessels, built bet ween 1 95 3 and 1956.
Analy sis of scallop landings by ports in Nova Scotia would seem t o indicate that 1956 w.a. ! t he year in which the offshore fishery became firmly established. (Offshore landings , whicA had r emained at about 250,000 pounds per year for the prior three year s, increased by 500,O ( pounds in 1956, as contrasted with an estimated increase in inshore landings of only 300, O()O pounds. )
A significant number of new boats has been added to the offshore fle et since 1957: 2 w added in 1958 , 4 in 1959, 1 in 1960, and 5 in 1961.~ Thus, in 1 961, t he offshore scallop flee consisted of some 32 draggers. These range in length from 65 to 1 30 feet, but the majorityof them a re in the 90- to 95-foot class. They carry a crew of 12 to 14 in the 65- to 80-foot class, and 18 to 21 in the 90- to 130-foot class.~
The expansion of the offshore fleet in itself suggests the profitabilit y of the fishery . The were apparent advantages in exploiting more intensively the high-unit value scallop fishery < the readily a ccessible Georges Bank scallop grounds. The scallop res ource was quite unlik Ji
the low-unit value product (groundfish) traditionally landed in the Provinc es. It would also pear that the differential between ex -vess el prices - -usually from 5¢ t o 10¢ a pound lower i Canada - -was such that costs in Canada were sufficiently low to just ify such an expansion.
There is a lso some evidence that government subsidies in Canada were and are an important conside ration in the expansion of the Canadian fleet. While direct subsidies prior t~ September 1 96 1 affected only the smaller offshore vessels (those between 60 and 70 feet), indir ect subsidies have made it possible to borrow from the Governm e nt on a low-interest loan as much as 50 percent of the cost of constructing a larger vessel. And there is the YHom a ns , R. E. S. "Sa n itary and Quality Control of the C anadian Scallop Industry." Pape r present ed at the Fourth National Shellfisb _
Sa n it a tion Wo rkshop , Nov . 28-30, 1961, Washington, D. C. lIIbid. (Footnote 1.) 1/Data supplied by the Canadian Department of Fisheries, Halifax.

July 1963 COMMERCIAL FISHERIES REVIEW 13
a<lded benefit of depreciation write-off policies allowed by the Government, which enable an o-wner to write off 15 percent of construction cost per year, and 33t percent per year of th cost of converting a vessel to scallop fishing. Statements made by Canadian operators indic ate that this governmental assistance contributed to the expanding of the fleet.
II OUTPUT AND PRODUCTIVITY OF OFFSHORE VESSELS: The average landings per l'trip5l (productivity per vessel) of the entire offshore fleet are difficult to assess sinc , until
Illrec;nt years, those vessels engaged in both scallop fishing and fishing for groundfish. How-
II
ever, some implications can be gleaned from a consideration of the performance of five vess els for which information was made available for the present study.
Of the five vessels, 2 were built in 1956 , 1 in 1955, 1 in 1954, and 1 in 1949. Three of fhe boats are between 90 and 100 feet in length, one is 80 feet in length, and the other is 120 feet in length. The average performance of the boats is shown in table 2.
A consideration of table 2 shows that the increased output (average landings per year) of the vessels is not merely a result of more trips and slightly larger crews, but there has been an increase in the efficiency of the vessels. This is evident from the fact that while t he average number of trips increased by some 17 percent and average crew size by some 13 percent over the four- year period, output per year increased by 95 percent and productivity increased by 67 percent over the same period. Thus , not only average land
T able 2 - Operational Data for an Average Nova Scotia Scalloper, 1957 -1960.!l
1960 1959 1958
Average no. of trips per ear •••••• 21 20 19
Ave
1957
18
tri~~~~~~~ __ ~1~2~.5~ __ ~12~.~31-__ ~1~3~ __ ~1~3~ Ave'
ve 615.9 475 . 6 361 0 315 5 ~ve~~~~~~~~~1~5~. 2~--~13~.~64-~~1~3~.6~--L1~3~.~4
lAve pe 29 329 23 270 19 000 17 528
yBased on operations of 5 Nova Scotia scallopers for the years 1957 through 1960.
Source: Infonnation submitted by vessel owners.
Lngs per trip , but the average landings per day and per man have increased absolutely over the period.
It is doubtful whether the resource will sustain this increasing rate of productivity, but it is not possible to say precisely what effect the intensified fishing effort will have. A logical conclusion is that productivity will drop in the face of a large expansion in fishing effort, since this is a fishery much dependent upon successful recruitment, and in similar fisheries, (e.g., haddock and ocean perch) intensified fishing effort has been accompanied by lowered !;)roducti vi ty .§!
FURTHER EXPANSION OF THE OFFSHORE FLEET
The growth of the Canadian scallop industry was given further impetus with the passage lly the Canadian Parliament in September , 1961 of 11 The Ship Construction Assistance ReguJations."2f This legislation, as later amended~/, provides for Federal subsidies of 40 percent ()f the cost of constructing wooden fishing vessels over 100 gross tons, and 50 percent of the C?st of constructing steel fishing vessels of 75 feet or more in length. The pertinent proviSlOns are as follows:
5. (1) A subsidy, in respect of the construction in Canada of any eligible ship, may be paid in an amount not exceeding
(a) forty percent of the approved cost incurred for work performed under a contract between May 12, 1961, and March 31, 1963; and
(b) thirty-five percent of the approved cost incurred for work performed __ under a contract after March 31, 1963. ~ The term. "productivity per vessel" will be used to denote average number of pounds landed per trip, based upon the operatio f the 6 Th~ssel for the year. The tenn "output" will be used to designate total pounds landed per vessel dUrIng the year. - ~s proved to be the case in 1962, wh en landings, which had been at very high levels in the first six months of th year, drop d I
- P e last half of the year due to a decline in the available stocks on Georges Bank. S p' C. 1961-1290, September 8, 1961. Canada Gazette Part II, Vol. 95, No. 397. - • C. 1962-1122 , August 8, 1962 • .fanada Gazette Part II, Vol. 96, No. 297.
14 COMMERCIAL FISHERIES REVIEW Vol. 25, No '\ -,
(2) A subsidy in respect of the construction in Canada of a fishing trawler to be operated out of a port in any of the Provinces of N~w .Brunswick, Nova Scotia, Prince Edward Island or Quebec may be paId m an amount not exceeding fifty percent of the approved cost incurred for work performed under a contract after May 12 , 1961.
Section 2 (f) defines II eligible shipll as II, .. a ship that is intended for use in commercial en-terprise and that is
(i) a self-propelled vessel of one hundred tons gross tonnage or over; or
(ii) a tug of fifty tons gross tonnage or over; or
(iii) a vessel, not self-propelled, of two hundred tons gross tonnage or over."
Section 2 (g) defines II fishing trawlerll~1 as
II. , ,a fishing vessel that has a steel hull of not less than seventy-five feet in length and that uses an otter trawl or a similar device. II
A number of features of this legislation are worth noting. First of all, it is aimed primarily at assistance in constructing ships for the maritime fleet. The provisions relating t o other types of vessels are, then, secondary to this object. Secondary or not, however, the 4G percent grant, retroactive to May 12, 1961, has spurred an unprecedented rate of construction of scallopers in Nova Scotia.
Secondly, to be eligible for the subsidy, a ship must be one hundred gross tons or over. Thus, this assistance has been of prime benefit to the offshore scallop fleet, and the vessels built and planned under the new Act are all over 90 feet in length and over 100 gross tons in tonnage.
Third, the Act provides that one condition to the granting of the subsidy is that the vess e be maintained on Canadian registry for five years, during which time the owner may not seL or transfer the ship without the consent of the Canadian Maritime Commission. It further provides that the Commission may refuse its consent unless the shipowner agrees to refund 11 an amount equal to the product obtained by multiplying the amount of the subsidy received by the fraction of the five-year period that the vessel will not be maintained on Canadian reg, . t II IS ry. , , .
One further point should be noted. The Act defines Iishipowner il as II ... aCanadiancitize:n. ~ corporation incorporated under the laws of Canada or of any Province, or Her Majesty i:rJ right of any Province. " ." (Emphasis added,) Thus, it is possible that non-Canadians can take advantage of this and other Federal and Provincial subsidies by forming a Canadian or Provincial corporation, and maintaining the ship under Canadian registry fo r five years. It is not inconceivable, then, that this Act could stimulate the flow of foreign investment funds into the scallop industry of Nova Scotia.
FLEET EXPANSION UNDER THE NEW SUBSIDY AC T
The scallop industry in Nova Scotia was quick to take advantage of the recent subsidy. In an attempt to discover the amount of construction which the Act had engendered, a staff , member from Boston College1s Bureau of Business Research made a field trip to Nova Scot ll in late January 1962.
In the course of this field trip, each of the major scallop producers was interviewed b:>: the staff member, in company with an official of the Canadian Department of Fisheries. WJ.t\ one excep~ion~ all of the producers were most cooperative, both in giving their knowledge.of the CanadIan mdustry and in supplying the project with detailed information on the operatIon! and finances of their boats. ~/It would appear that Canadian authorities have interpreted the term "trawler" to include "scallopers. "

July 1963 COMMERCIAL FISHERIES REVIEW 15
All producers stated they were then having scallopers constructed under the provisions of the new Act. It was impossible , however , at that time to document the total numb e r being built or contemplated, although the figures given by the producers indicated that a t least 18 new vessel s were then under construction or planned for early construction.
In June 1962 , however, with the cooperation of the Fisherman's Loan Board of Nova Scotia, it was possible to obtain more detailed figures not only on the magnitude of new construction, but also on the timing of the expansion. This information is shown in table 3.
Table 3 - New Vessel Construction Under P. C. 1961-1290, 1962 and 1963
Number of Scallopers Le ngth Average Cost
ntering Nova Scotia scallop fleet by June 1962 · · .. · · · · · 9 new 2 conversions 92-100 feet $ 153 000
nterinq fleet between June and D ecember 1962 · · . . · · · · · 10 new 92-100 feet 200000
ntering fleet in 1963 • . . . . . . . . . . . . · · . · · · · Ys 92-100 fe et n.a •
otal number entering fleet by end of 1963 • . . . · . · · · · · Y29 I/Minimum number estimated by the Fisherman's Loan Board. n.a. - not available ouree: Fisherman's Loan Board of Nova Scotia .
One salient fact evidenced by the figures in table 3 is this: Nova Scotia scallop boats will double in number by the end of 1963. Furthermore, the boats added to the fleet will be of such size (92 - 100 feet ) that they are capable of staying on Georges Bank longer and landing larger catches than the smaller New Bedford scallopers.
ESTIMATED PRODUCTIVITY AND LANDINGS OF THE NEW SCALLOPERS
The new subsidized Canadian boats, by virtue of their subsidy characte r alone, leaving out any labor advantage or superior built-in productivity they may have by virtue of being new, should be able to outproduce on a dollar-cost basis either other existing Canadian boats or the majority of New Bedford vessels. Put another way, the new Canadian vess e ls should be able to fish and make money (or take minimum losses) under adverse resource and mar ket conditions which work serious economic disadvantage for the other v e ssels i n Ca nada or New Bedford. Though such adverse market conditions may not occur, it s hould be obvious that mere mention of the possibility points up the advantage of the new Canadia n vessels. And it underscores the vital necessity of taking steps to see that such c onditions do not occur .
CANADIAN SCALLOP LANDINGS IN 1963
The impact of the new boats began to be felt in 1962 , when Canadian s c a llop landings were a record 14 million pounds , an increase of 3.5 million pounds over 1961 landings . It is not possible to state how much of this increase was accounted for by the n ew boats, since ?art of the increase is attributable to increased productivity of t h e boats which were already 10 the fleet- -at least during the first half of the year.
However, given the decline in landings for the fleet as a whole in t he last half of 1962, it seems evident that had there not been the addition of the new boats to t he fleet , 1962 Canadian landings would not have attained such a level, and would probably not ha ve been any greater than in 1961.
Because of uncertainty as to the location and size of the scallop res ource on Georges Bank, both United States and Canadian biologists are hesitant to predic t the availability of scal~ops in 1963. "Indications are that the 1963 class of scallops is not partic:;ularly strong and is about the same strength as the one that entered the fishe r y in 1962 ."lQ!
19 If this is the case , it seems probable that total Canadian landings will rise slightly in 63 due to the increas e in fleet size , but that catch per boat will continue the decline begun
in ,the Fall of 1962. On this basis Canadian landings of scallops in 196 3 should be in the ~orhood of 16 000 000 pounds 10 C ' " - • - ~nadlan Fishennan, February 1963, Vol. 50, No.2, p. 19.
16 COMMERCIAL F ISHERIES REVIEW Vol. 25, NO. 1
EFFECT OF CANADIAN L ANDINGS ON EXPORTS
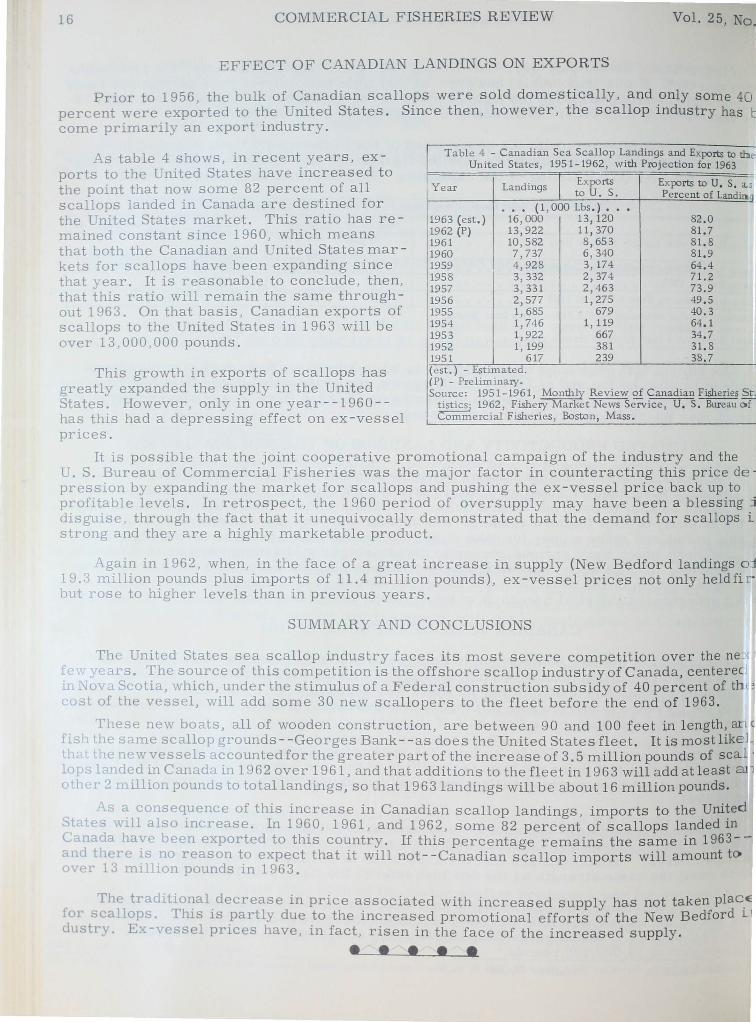
Prior to 1 956 , the bulk of Canadian scallops wer e s old domestically, and only some 40 perc ent were exported to the United States . Since then, however , the scallop industry has b com e primarily an export industry.
As table 4 s hows, in recent y ears, exp or ts to the United States have increased to the point that now some 82 percent of all scallops landed in Ca nada are destined for the United States mar ket. This ratio has remained const ant s ince 1960 , which means that both the Canadian and United States markets for scallops h ave b een expanding since that year . It is reasonable to conclude , then, that this ratio wi ll r emain the same throughout 1963 . On that basis , Canadian exports of scallops to the Unite d States in 1963 will be over 13,000, 000 pounds.
Table 4 - C anadian Sea Scallop Landings and Exports to the, United States, 1951-1962 , with Proj ection for 1963 "'
Year Landings Exports Exports to U. S. a.; to U . S. Percent of Landin.
. • • ( 1,000 Lbs .) ••• 1903 (est.) 16,000 13, 120 1962 (P) 13,922 11 , 370 1961 10,582 8 , 65 3 1960 7,737 6,340 1959 4,928 3, 174 1958 3,332 2,374 1957 3,331 2,463 1956 2,577 1,275 1955 1, 685 679 1954 1,746 1,119 1953 1,922 667 1952 1,199 381 1951 617 239 (est.) - Estimated . (P) - Preliminary.
82.0 81.7 81. 8 81.9 64 . 4 71.2 73.9 49.5 40.3 64.1 34.7 31. 8 38.7
i
I
T his growth in exports of scallops has greatly expande d the supply in the United States. However , only in one y ear--1960-has this had a depressing effect on ex-vessel
Source: 1951-1961, Monthly Review ~ Canadian Fisherie~ $ tistics' 1962, Fishery Market News Service, U. S. Bureau c>f Com~ercial Fisheries, Boston, Mass .
prices .
It is possible that the joint cooperative promotional campaign of the i ndustry and the U. S. Bureau of Commercial Fisheries was the major factor in counteracting this price de pression by expanding the mark et for scallops and pushing the ex - ves s e l price back up to profitable l evels. In retrospect, the 1960 period of oversupply may have b een a blessing j
disguise , t hrough t h e fact that it unequivocally demonstrated that the demand for scallops i. strong and they a r e a highly marketable product.
Again in 1962, when, in the face of a great increase in supply (New Bedford landings 0
19. 3 million pounds plus imports of 11.4 million pounds), ex-vessel prices not only held fi r; but r ose to higher levels than in previous years.
SUMMARY AND CONCLUSIONS !
The United States s ea scallop industry faces its most severe competition over the ne JG few ye ars. The source of this competition is the offshore scallop indus try of Canada, centered. in Nova Scotia, which, unde r the stimulus of a Federal construction subs idy of 40 percent of th~ eost of the vessel, will a dd some 30 new scallopers to the fleet before the end of 1963.
These new boats, all of wooden construction, are between 90 and 100 f e et in length, ar1
fi sh the same scallop grounds--Georges Bank--as does the United States fleet . It is most like th:l~ the new vessels accounted for the greater part of the increase of 3.5 m illion pounds of sca.l lo ps l anded in Canada in 19 62 ov er 1961 , and that additions to the fleet in 1963 will add at least a other 2 million pounds to totallanding s, so that 1963 landings will be abou t 16 million pounds.
As a consequence of this increase in Canadian scallop landings, imports to the United States will also increase . In 1 960 , 1961, and 1962, some 82 percent of scallops landed in Canada have been exported t o this country. If this percentage remains the same in 1963--and there is no reason to exp e ct that it will not--Canadian scallop imports will amount to over 13 million pounds in 1963.
The traditional decrease in price associated with increased supply has not taken plac.1I for scallops. This is par tly due to the increased promotional efforts of the New Bedford L
dustry. Ex-vessel prices have , in fact, risen in the face of the i ncr eas e d supply.
• • • • •