sea state report - channel coast state... · kingfisher house, goldhay way ... storm calendar ......
TRANSCRIPT

Title here in 8pt Arial (change text colour to black) i
Sea State Report
Essex (Year 2 Oct 2007 – Sept 2008)
RP021/E/2011
January 2011

ii
We are the Environment Agency. We protect and improve the environment and make it a better place for people and wildlife.
We operate at the place where environmental change has its greatest impact on people’s lives. We reduce the risks to people and properties from flooding; make sure there is enough water for people and wildlife; protect and improve air, land and water quality and apply the environmental standards within which industry can operate.
Acting to reduce climate change and helping people and wildlife adapt to its consequences are at the heart of all that we do.
We cannot do this alone. We work closely with a wide range of partners including government, business, local authorities, other agencies, civil society groups and the communities we serve.
Published by:
Shoreline Management Group Environment Agency Kingfisher House, Goldhay Way Orton Goldhay, Peterborough PE2 5ZR Email: [email protected] www.environment-agency.gov.uk © Environment Agency 2008 All rights reserved. This document may be reproduced with prior permission of the Environment Agency.
Further copies of this report are available from our publications catalogue: http://publications.environment-agency.gov.uk or our National Customer Contact Centre: T: 03708 506506

Anglian Coastal Monitoring
Programme Phase VII 2006/07 – 2010/11

Sea state report 2007– 2008 Essex ACMVII
i
Anglian Coastal Monitoring Programme VII ................................................................ 2
Wave & tide monitoring ............................................................................................ 2
Wave climate & sea state reports.............................................................................. 2
Acoustic Wave & Current meter ................................................................................ 3
Directional Waverider Mark 2 wave buoy ................................................................. 4
Site Information ............................................................................................................. 5
Instrument location ................................................................................................... 5
Instrument data & recording ..................................................................................... 8
Wave statistics ............................................................................................................. 11
Monthly means ........................................................................................................ 11
Significant Wave Height ........................................................................................... 12
Wave direction ......................................................................................................... 15
Peak period .............................................................................................................. 16
Period and significant wave height .......................................................................... 17
Wave energy ............................................................................................................ 18
Wave return periods ................................................................................................ 21
Temperature ................................................................................................................. 23
Sea level& tides ........................................................................................................... 23
Storminess & extremes ................................................................................................ 25
Storm wave events .................................................................................................. 25
Monthly wave maxima ............................................................................................ 25
Monthly temperature maxima ................................................................................ 26
Highest Essex storm events in 2007/2008 ............................................................... 27
Surge events ............................................................................................................. 30
Highest surge events in Essex 2007/2008 ............................................................... 30
Storm calendar ......................................................................................................... 34
Extreme sea levels ................................................................................................... 35
Summary ...................................................................................................................... 36
References .................................................................................................................... 37
Glossary ....................................................................................................................... 38
Sea state report 2007– 2008 Essex ACMVII
1
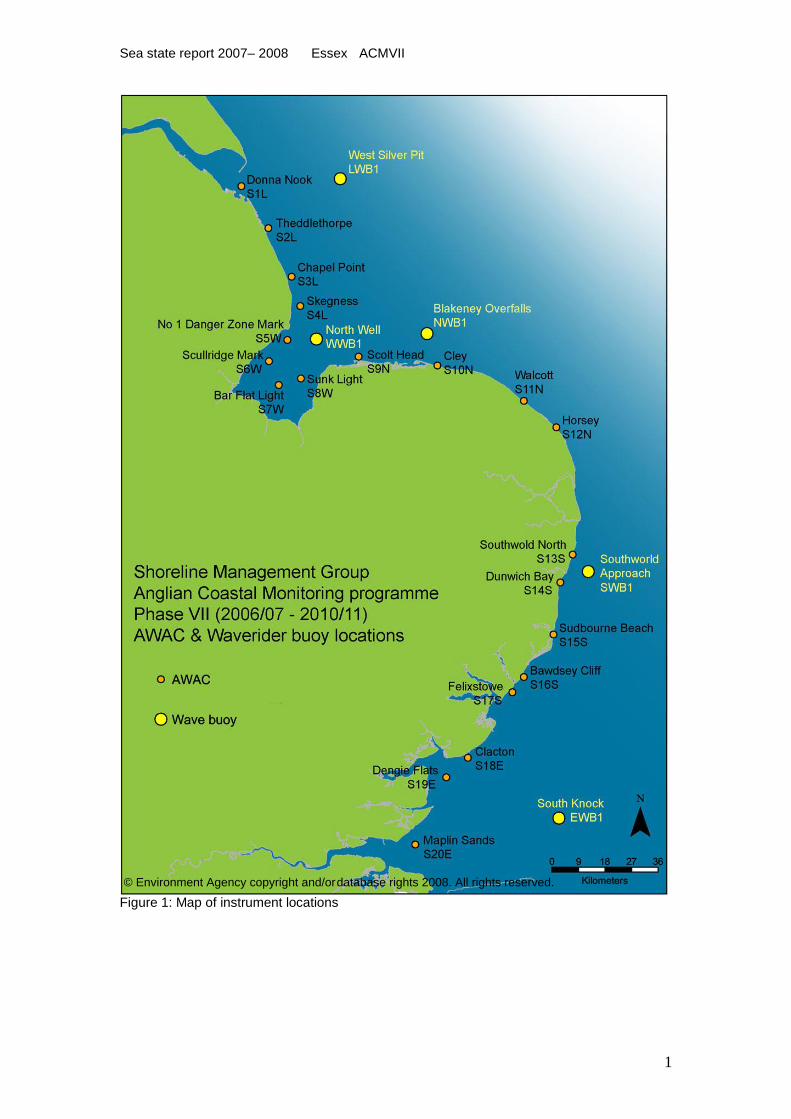
Figure 1: Map of instrument locations
© Environment Agency copyright and/or database rights 2008. All rights reserved.

Sea state report 2007– 2008 Essex ACMVII
2
Anglian Coastal Monitoring Programme VII
Wave & tide monitoring
The Shoreline Management Group (SMG) based within the Flood & Coastal Erosion Risk Management department of the Environment Agency (EA) provides strategic monitoring of the Anglian coast through the „Anglian Coastal Monitoring Programme‟. Phase VII of this programme runs from 2006/07 to 2010/11. For wave and tide monitoring, a network of five Directional Waverider (DWR) buoys and 20 Acoustic Wave And Current meters (AWACs) measured offshore and nearshore sea conditions respectively, along the regional frontage over a 3 year period (2006 – 2009). The positioning of the instruments (Figure 1) provides comprehensive coverage of the region and measurements at key areas of interest regarding wave conditions and coastal processes. In addition, this 3 year monitoring period is considered to be broadly sufficient to assemble a dataset able to support future mathematical modelling, and to better understand the dynamic mechanisms acting along our coast. It is hoped that in time, we can create statistical or transformation wave models, to better inform us of the wave climate and that a model would serve to show wave conditions inshore calculated from offshore buoy observations. This will lead to a dataset for statistical forecasting of extreme conditions to assist in flood forecasting and flood risk management. It is also hoped that in the future the wave and currents data can be combined with sediment models to identify the transportation and movement of sandbanks, annual beach sediment movement and erosion following storm events and the impact of sea level rise throughout the region.
The DWR buoys provide real-time wave spectra and GPS positions via satellite link. The real-time wave data is uploaded to the “WaveNet”
1 website maintained by the Centre for
Environment, Fisheries and Aquacultural Science (Cefas) on behalf of the Department of Environment Food & Rural Affairs (Defra), allowing public access to the programme‟s real-time monitoring data.
Wave climate & sea state reports
This report presents processed onboard instrument logged data from the four AWAC instruments and one offshore buoy located along the Essex coast. Logged data is processed and quality checked by our survey contractor, Gardline Environmental
2. The QA process for
the AWACs uses Nortek‟s control software3 and includes compass, pressure drift, acoustic
degradation checks and tide level adjustment to Ordnance Datum (Newlyn). There are further adjustments for atmospheric pressure, accounting for instrument „settling‟ periods, such as frame settlement on the bed and an initial temperature offset and differences in AWAC deployment periods. The wave buoys are fully calibrated before deployment and data translation and processing is carried out using the instrument manufacturer‟s software including Datawell‟s W@ves 21
4.
The data used within this series of sea state reports is not entirely continuous. The monitoring programme is subject to disruption, the DWR buoys are vulnerable to accidental and intentional damage from shipping traffic. The AWAC instruments are occasionally moved by trawling activities. The AWACs are also subject to burial as sediment accumulates over the 2 month deployment period; this is especially notable in The Wash. This is the second of three sea state reports that will be produced annually for the region during phase VII. To date the AWACs have now been recovered, with delivery of a final year of quality checked records to be available shortly. The buoys are now maintained by Cefas, with funding from the SMG and teak Coastal Monitoring and Forecasting service (UKCMF). This has allowed the buoys to remain in-sideband for continued wave recording.

Sea state report 2007– 2008 Essex ACMVII
3
The specific aims of this and subsequent reports are to
Analyse wave parameters and water elevations at each instrument in a regional context
Summarise the wave climate and sea state in the region
Compare annual variability with the previous year
Identify storm and significant surge events The Anglian Coastal Monitoring programme‟s wave and tide data feed into many aspects of Environment Agency work such as modelling the impact of waves on existing flood defences, flood forecasting, and incorporation in to Shoreline Management Plans to inform policy decision making processes. This report is intended as a tool to assist coastal managers in a variety of their functions including; strategic planning, capital engineering works and maintenance programmes. In addition the report will be of assistance with general education and awareness raising of coastal issues. The reports and data collected also provide an opportunity for further joint probability studies, identifying extreme offshore and nearshore water levels, wave transformation, tidal propagation and coastal response studies. The 3 year monitoring period is not sufficient to draw long term conclusions regarding sea and climate trends. Although this report will assess changes in sea state from the previous year, the main purpose of these reports is an assessment of the current sea state influencing the Anglian coast. The report presents the monitoring data to show the types of waves and the seasonal variation over the year and thus gives a picture of the wave climate. The AWAC instruments present the nearshore climate of waves and currents that are complicated by bed topography and the coastline while the wave buoys give an indication of the offshore waves approaching the region‟s shoreline. Knowledge of the Anglian wave climate is important to determine and model regional movement of sediment and the impact of forces acting on our sea defences, coastal structures and habitats.
Acoustic Wave & Current meter
The 20 AWAC instruments were placed at strategic locations distributed along the 5 coastal monitoring units of the Anglian coast. The instrument sits within a frame on the sea bed at a depth of approximately 6 m Chart Datum (CD) with sensors pointing up towards the surface and recording tidal elevations, waves, currents and surge information. The AWAC is a current profiler with a directional wave system. The instrument measures current velocity and direction at different bin depths throughout the water column. The AWAC has 3 sensor pads which emit a pulse acoustic signal in different directions radiating out from the instrument towards the surface. The scattered return signal has a Doppler shift with respect to the transmitted signal and this allows the along beam velocity to be calculated. The instrument also has a central sensor pointing vertically at the sea surface, similar to an upward looking echo-sounder, the Acoustic Surface Tracking feature of the instrument gives water depth and non-directional spectrum measurements. The number of measurements allows the instrument to calculate the velocity and direction of currents throughout the water column, wave direction, heights and identification of long swell waves, wind waves, ship wake, pressure and temperature. The AWACs sample pressure, temperature, currents and acoustic back scatter intensity (ABSI) every 5 minutes at 20, 25, 30, 35, 40, 45, 50 and 55 minutes past each hour. Waves are sampled every hour, with 2048 samples taken at 2 Hz, over 17 minutes. The instrument has a maximum error of +-50 mm for water levels, +5% for waves. However we consider a consistent achievable height accuracy to be 10 mm. AWAC instruments and the onboard logged data were recovered approximately every 6 weeks, with a new instrument redeployed at this time. There were 12 backup AWACs, used to cycle the instruments or as emergency standbys in the event of instrument failure. This allows the Shoreline Management Group a near uninterrupted and continuous record of waves and tides as they enter the shallow waters of our coast.
Sea state report 2007– 2008 Essex ACMVII
4
Photo 1: AWAC in frame being deployed (photo: Gardline Environmental)
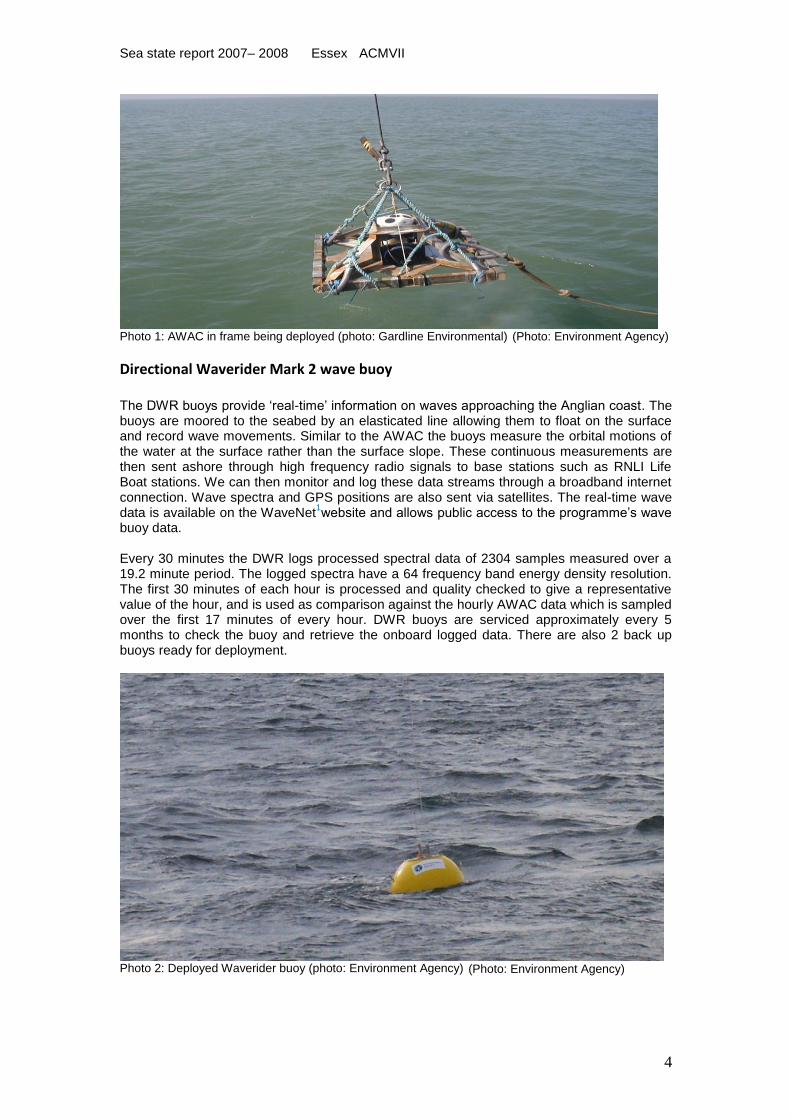
Directional Waverider Mark 2 wave buoy
The DWR buoys provide „real-time‟ information on waves approaching the Anglian coast. The buoys are moored to the seabed by an elasticated line allowing them to float on the surface and record wave movements. Similar to the AWAC the buoys measure the orbital motions of the water at the surface rather than the surface slope. These continuous measurements are then sent ashore through high frequency radio signals to base stations such as RNLI Life Boat stations. We can then monitor and log these data streams through a broadband internet connection. Wave spectra and GPS positions are also sent via satellites. The real-time wave data is available on the WaveNet
1website and allows public access to the programme‟s wave
buoy data. Every 30 minutes the DWR logs processed spectral data of 2304 samples measured over a 19.2 minute period. The logged spectra have a 64 frequency band energy density resolution. The first 30 minutes of each hour is processed and quality checked to give a representative value of the hour, and is used as comparison against the hourly AWAC data which is sampled over the first 17 minutes of every hour. DWR buoys are serviced approximately every 5 months to check the buoy and retrieve the onboard logged data. There are also 2 back up buoys ready for deployment.
Photo 2: Deployed Waverider buoy (photo: Environment Agency)
(Photo: Environment Agency)
(Photo: Environment Agency)
Sea state report 2007– 2008 Essex ACMVII
5
Site Information
Instrument location
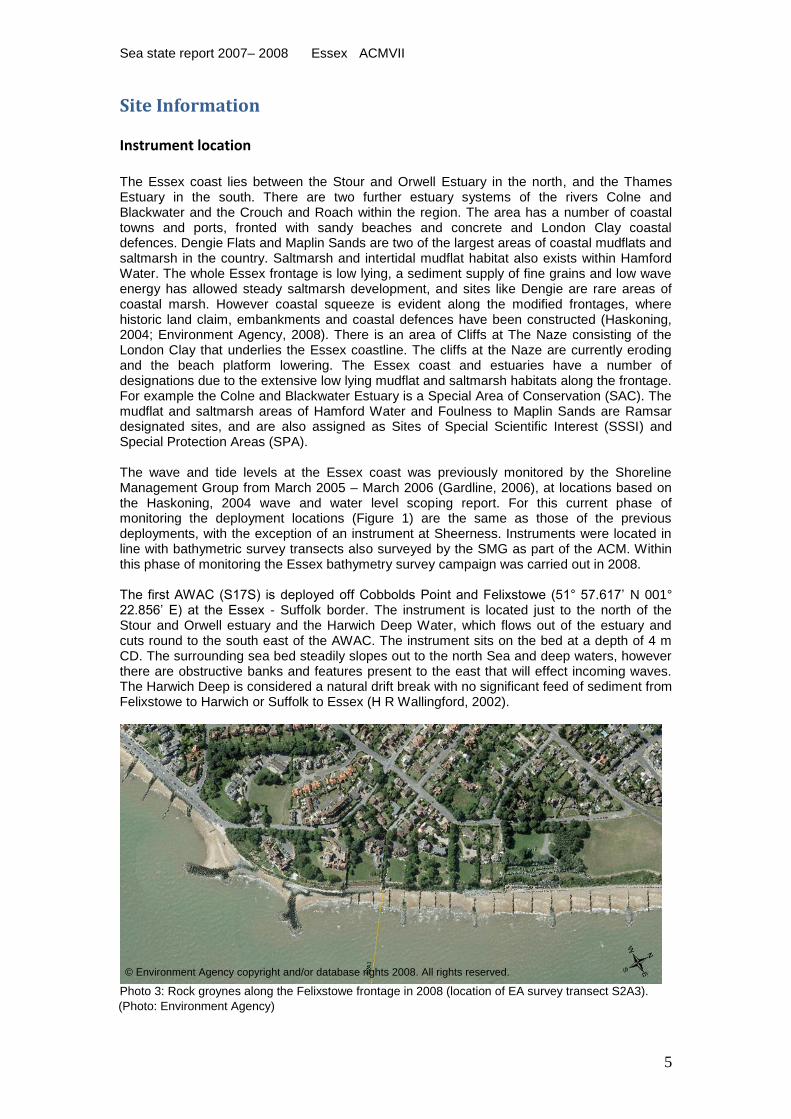
The Essex coast lies between the Stour and Orwell Estuary in the north, and the Thames Estuary in the south. There are two further estuary systems of the rivers Colne and Blackwater and the Crouch and Roach within the region. The area has a number of coastal towns and ports, fronted with sandy beaches and concrete and London Clay coastal defences. Dengie Flats and Maplin Sands are two of the largest areas of coastal mudflats and saltmarsh in the country. Saltmarsh and intertidal mudflat habitat also exists within Hamford Water. The whole Essex frontage is low lying, a sediment supply of fine grains and low wave energy has allowed steady saltmarsh development, and sites like Dengie are rare areas of coastal marsh. However coastal squeeze is evident along the modified frontages, where historic land claim, embankments and coastal defences have been constructed (Haskoning, 2004; Environment Agency, 2008). There is an area of Cliffs at The Naze consisting of the London Clay that underlies the Essex coastline. The cliffs at the Naze are currently eroding and the beach platform lowering. The Essex coast and estuaries have a number of designations due to the extensive low lying mudflat and saltmarsh habitats along the frontage. For example the Colne and Blackwater Estuary is a Special Area of Conservation (SAC). The mudflat and saltmarsh areas of Hamford Water and Foulness to Maplin Sands are Ramsar designated sites, and are also assigned as Sites of Special Scientific Interest (SSSI) and Special Protection Areas (SPA). The wave and tide levels at the Essex coast was previously monitored by the Shoreline Management Group from March 2005 – March 2006 (Gardline, 2006), at locations based on the Haskoning, 2004 wave and water level scoping report. For this current phase of monitoring the deployment locations (Figure 1) are the same as those of the previous deployments, with the exception of an instrument at Sheerness. Instruments were located in line with bathymetric survey transects also surveyed by the SMG as part of the ACM. Within this phase of monitoring the Essex bathymetry survey campaign was carried out in 2008. The first AWAC (S17S) is deployed off Cobbolds Point and Felixstowe (51° 57.617‟ N 001° 22.856‟ E) at the Essex - Suffolk border. The instrument is located just to the north of the Stour and Orwell estuary and the Harwich Deep Water, which flows out of the estuary and cuts round to the south east of the AWAC. The instrument sits on the bed at a depth of 4 m CD. The surrounding sea bed steadily slopes out to the north Sea and deep waters, however there are obstructive banks and features present to the east that will effect incoming waves. The Harwich Deep is considered a natural drift break with no significant feed of sediment from Felixstowe to Harwich or Suffolk to Essex (H R Wallingford, 2002).
Photo 3: Rock groynes along the Felixstowe frontage in 2008 (location of EA survey transect S2A3).
(Photo: Environment Agency)
© Environment Agency copyright and/or database rights 2008. All rights reserved.

Sea state report 2007– 2008 Essex ACMVII
6
The town of Felixstowe extends up to the shoreline and the sandy beach is heavily modified. The back of the beach is lined with sea walls and concrete defences. There are timber and rock groynes, including a number of fish tail groynes (Photo 3). Larger examples of these rock fish tail groynes exist at the Jaywick to Clacton frontage.
Photo 4: View of se defences along the Felixstowe frontage in 2008 (location of EA survey transect S2A3).
AWAC S18E is located offshore of a fish tail groyne on the Jaywick and Clacton-On-Sea frontage (51° 46.020‟ N 001° 08.840‟ E) (Photo 5). The rock groynes and offshore reefs along this frontage have led to the formation of crescent shaped bays and an overall widening of the sandy beaches in front of the towns. These works are in place to attempt to maintain the sand that overlays the London Clay platform, further north the beach is considerably thinner. The frontage at Frinton and Clacton is backed by recurved concrete sea walls. The Clacton cliffs and foreshore are designated as a SSSI. To the south the defences include clay sea walls with concrete revetment. The peninsula has a long term trend of shore recession, but recent topographic surveys by the SMG show the beach along much of this frontage to be relatively stable but steepening in many places (Environment Agency, 2008). Therefore the coastline and defences are increasingly vulnerable to wave attenuation. The AWAC sits at a depth of 5 m CD, landward of the Wallet channel. There are a series of deeps and sand banks running shore parallel and into the Thames Estuary that will modify waves approaching the instrument (Figure 2). These include Gunfleet Sand immediately offshore of the AWAC, and Knock Deep further out, where the wavebuoy is situated. The Tendering Peninsula is not considered to receive significant volumes of sediment from offshore and Gunfleet Sand. The primary sediment movement is to the south west, with limited sediment supplies moving from Walton to Jaywick. However the Essex SMP (Mouchel, 1997) and Haskoning, 2004 state there is a feed to the coast at Clacton, with sediment moving to the north and south from this point.
(Photo: Environment Agency)

Sea state report 2007– 2008 Essex ACMVII
7
Photo 5: Aerial photograph of the sandy beach and fish tail groyne in front of Clacton golf course in 2008 (location of
AWAC S19 E is positioned 6.3 km offshore of the Dengie Flats, 6.7 km south of Colne Point on the Tendering Peninsula and just to the north of Buxey Sand (51° 42.600‟ N 001° 02.230‟ E). The AWAC is deployed at a depth of 7 m CD. Foulness Sands are also to the south, and the same deeps and banks lying east of S18E at Clacton also extend down to the east and south east side of the S19E instrument. The Dengie and Foulness frontage has a history of land reclamation and sea wall enclosures. The low energy waves have led to the development of open coast marsh, uncommon in the UK. The extensive mudflats and marsh effectively attenuate incoming waves reaching the embankment defence. The marsh is actually at a higher elevation to the land behind the embankment. Mudflat growth has been encouraged by the installation of Thames Lighter barges along a section of the coast (Photo 6), the same barges are used at Hamford Water. Although depleting in condition the barges have assisted in sediment accumulation on the peninsula. However despite seaward growth of mudflat the frontage is showing alarming amounts of coastal squeeze to the saltmarsh that is unable to move landward due to the presence of embankments. The eroded sediment from the edge of the saltmarsh is being deposited on the remaining marsh and mudflat, building it up in height at a rate greater than sea level rise (Environment Agency, 2008). Dengie is a Ramsar site and has a SSSI and SPA status, the peninsula also forms part of the Essex Estuaries SAC. This means there are conservation objectives for birds of European importance and a responsibility to maintain the habitat in a favourable condition.
Photo 6: The intertidal area at Dengie Flats, Thames Lighter barges can be seen seaward of the enclosed marsh (location of EA survey transect E3E4). (Photo: Environment Agency)
EA survey transect E1A7).
© Environment Agency copyright and/or database rights 2007. All rights reserved.

Sea state report 2007– 2008 Essex ACMVII
8
The most southern AWAC on the Anglian coast is AWAC S20E, located to the north of the Outer Thames Estuary (51° 30.580‟ N 000° 52.380‟ E), around 5 km from Shoeburyness and just off the Maplin Sands. The instrument is positioned in a depth of 6 m CD in the Oaze Deep. Similar to the AWAC located at Dengie there is extensive saltmarsh working to attenuate waves coming on to the peninsula. The mudflats and drainage ditches at Maplin Sand form the largest continuous intertidal area in the country (Photo 7). Maplin Sands is observed to be accreting at the lower section of the marsh, with significant growth seawards (Environment, Agency, 2008). Maplin Sands has the same level of environmental protection as the Foulness and Dengie areas.
Photo 7: Marsh at Maplin Sands in 2008 (EA survey tr
The South Knock Waverider buoy (EWB1) is located at 51° 34.250‟ N 001° 34.750‟ E, in a water depth of 20 m CD (Figure 2). The buoy is situated to the south east of Knock Deep, this is outside of the Thames Estuary and the numerous sand banks and deeps in the area. Therefore the instrument will be recording unmodified waves, unlike the nearshore AWACs. The buoy is deployed in the southern section of the Essex frontage and expected to be far enough offshore to be exposed to northerly and southerly waves and surges.
Instrument data & recording
The ACM programme phase VII „ZERO HOUR‟ was designated 00:00h (GMT) on 20
th
September 2006 (Julian Day 263). Instruments were deployed from this date, and „Year 2‟ of the project is defined as the period from 1
st October 2007 to 30
th September 2008.
Table 1 details the percentage of valid data from the wave and tidal data recorded by each instrument in Year 2, and Table 2 below, shows significant wave height records as an indicator for instrument data recording and deployment periods.
Instrument Tide data return Wave data return
S17S Felixstowe 99.97 % 99.95 %
S18E Clacton 99.99 % 99.98 %
S19E Dengie Flats 99.98% 99.98 %
S20E Maplin Sands 99.95% 99.95 %
EWB1 S. Knock 100 % Table 1: Annual data return for logged records of tidal and wave parameters in Year 2.
ansect E3A2). (Photo: Environment Agency)

Sea state report 2007– 2008 Essex ACMVII
9
S17S
AWAC
FelixstoweS18E
AWAC
ClactonS19E
AWAC
DengieS20E
AWAC
MaplinEWB1
DWR S.
Knock
31/10/2007 -
14/12/2007
14/12/2007 -
13/02/2008
13/02/2008 -
04/04/2008
04/04/2008 -
04/06/2008
-
01/11/2007
01/11/2007 -
13/12/2007
13/12/2007 -
14/02/2008
14/02/2008 -
02/04/200802/04/2008 - 11/06/2008
07/06/2008 -
07/08/2008
07/08/2008 -
18/08/2008
-
01/11/2007
01/11/2007 -
13/12/2007
03/04/2008 -
03/06/2008
03/06/2008 -
06/08/2008
13/12/2007 -
12/02/2008
12/02/2008 -
03/04/2008
Jan Feb MarOct Nov Dec Apr May Jun Jul Aug Sep
06/08/2008 -
17/08/2008
06/08/2008 -
17/08/2008
01/10/2007 - 24/04/2008 24/04/2008 - - 31/09/2008
03/04/2008 -
03/06/2008
03/06/2008 -
06/08/2008
13/12/2007 -
14/02/2008
12/02/2008 -
03/04/2008-
01/11/2007
01/11/2007 -
13/12/2007
04/06/2008 -
06/08/2008
06/08/2008 -
17/08/2008- 31/10/07
Table 2: Deployment periods for Year 2 for Essex instruments used in this report, based on significant wave height records.

Sea state report 2007– 2008 Essex ACMVII
10
AWAC S17S is located at Felixstowe, north of the Harwich Deep Water Channel and on the Suffolk border. S18E at Clacton and S19E at Dengie Flats are situated either side of the River Colne and River Blackwater estuary, and landwards of a number of intertidal banks, including Gunfleet Sand, Sunk Sand and Long Sand. S20E is located in the Thames Estuary off Maplin Sands and within the Oaze Deep. The offshore buoy is located south east of Knock Deep, at a depth of 20 m CD.
© Crown copyright and database rights 2008 Ordnance Survey 100024198.Figure 2: Bathymetry plot showing water depths and locations of Essex instruments.
Sea state report 2007– 2008 Essex ACMVII
11
Wave statistics This section presents the key wave parameters in the annual time series to describe the sea conditions at each instrument. This shows the general pattern of waves represented by a spectrum of waves of different frequencies, heights and directions through statistical measurements, time series and averages over the duration of a year. This section also includes the comparison and association of measured data sets, such as the comparison of wave height and wave period, and wave spectra plots. This analysis identifies consistency in the data, trends, quality and a summary of the data recorded. A description of all of the parameters can be found in the glossary section.
Monthly means
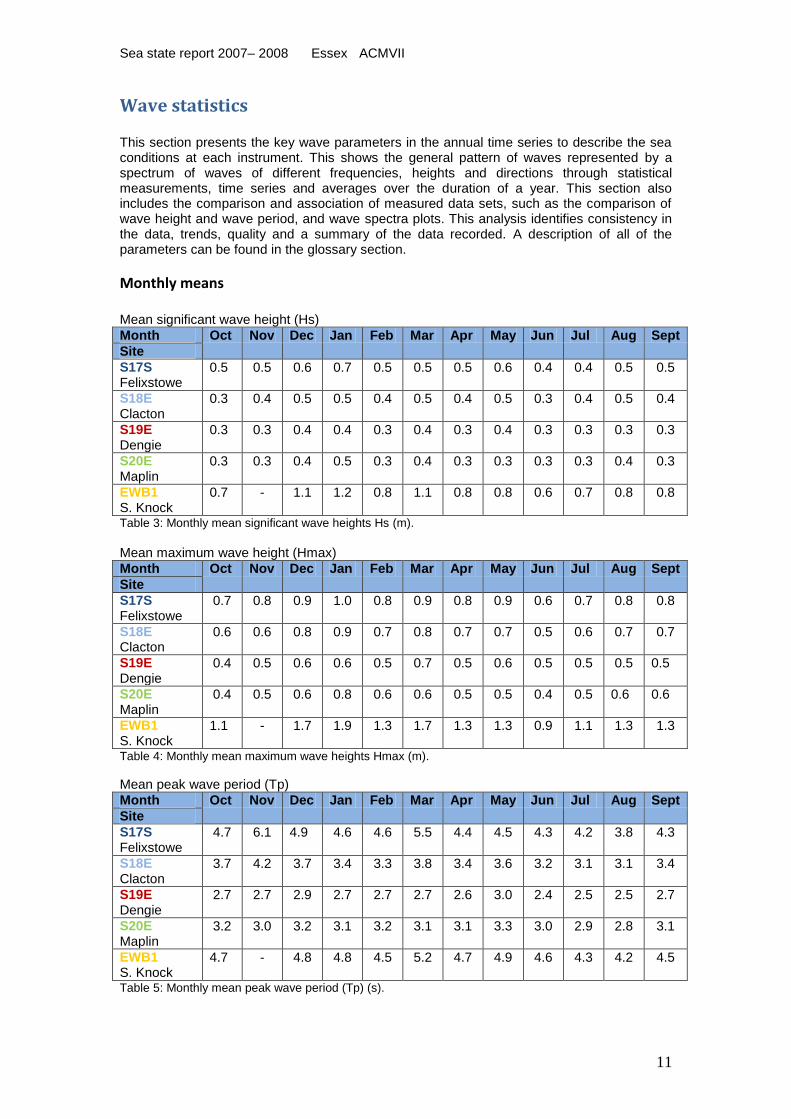
Mean significant wave height (Hs)
Month Oct Nov Dec Jan Feb Mar Apr May Jun Jul Aug Sept
Site
S17S Felixstowe
0.5 0.5 0.6 0.7 0.5 0.5 0.5 0.6 0.4 0.4 0.5 0.5
S18E Clacton
0.3 0.4 0.5 0.5 0.4 0.5 0.4 0.5 0.3 0.4 0.5 0.4
S19E Dengie
0.3 0.3 0.4 0.4 0.3 0.4 0.3 0.4 0.3 0.3 0.3 0.3
S20E Maplin
0.3 0.3 0.4 0.5 0.3 0.4 0.3 0.3 0.3 0.3 0.4 0.3
EWB1 S. Knock
0.7 - 1.1 1.2 0.8 1.1 0.8 0.8 0.6 0.7 0.8 0.8
Table 3: Monthly mean significant wave heights Hs (m).
Mean maximum wave height (Hmax)
Month Oct Nov Dec Jan Feb Mar Apr May Jun Jul Aug Sept
Site
S17S Felixstowe
0.7 0.8 0.9 1.0 0.8 0.9 0.8 0.9 0.6 0.7 0.8 0.8
S18E Clacton
0.6 0.6 0.8 0.9 0.7 0.8 0.7 0.7 0.5 0.6 0.7 0.7
S19E Dengie
0.4 0.5 0.6 0.6 0.5 0.7 0.5 0.6 0.5 0.5 0.5 0.5
S20E Maplin
0.4 0.5 0.6 0.8 0.6 0.6 0.5 0.5 0.4 0.5 0.6 0.6
EWB1 S. Knock
1.1 - 1.7 1.9 1.3 1.7 1.3 1.3 0.9 1.1 1.3 1.3
Table 4: Monthly mean maximum wave heights Hmax (m).
Mean peak wave period (Tp)
Month Oct Nov Dec Jan Feb Mar Apr May Jun Jul Aug Sept
Site
S17S Felixstowe
4.7 6.1 4.9 4.6 4.6 5.5 4.4 4.5 4.3 4.2 3.8 4.3
S18E Clacton
3.7 4.2 3.7 3.4 3.3 3.8 3.4 3.6 3.2 3.1 3.1 3.4
S19E Dengie
2.7 2.7 2.9 2.7 2.7 2.7 2.6 3.0 2.4 2.5 2.5 2.7
S20E Maplin
3.2 3.0 3.2 3.1 3.2 3.1 3.1 3.3 3.0 2.9 2.8 3.1
EWB1 S. Knock
4.7 - 4.8 4.8 4.5 5.2 4.7 4.9 4.6 4.3 4.2 4.5
Table 5: Monthly mean peak wave period (Tp) (s).

Sea state report 2007– 2008 Essex ACMVII
12
Mean of mean wave period (Tz)
Month Oct Nov Dec Jan Feb Mar Apr May Jun Jul Aug Sept
Site
S17S Felixstowe
2.9 2.9 2.9 2.9 2.8 3.0 2.7 2.8 2.5 2.5 2.6 2.7
S18E Clacton
2.3 2.5 2.5 2.5 2.4 2.5 2.3 2.5 2.2 2.2 2.3 2.4
S19E Dengie
2.0 2.0 2.1 2.1 2.0 2.1 1.9 2.1 1.9 1.9 2.0 2.0
S20E Maplin
2.1 2.1 2.3 2.3 2.2 2.2 2.1 2.1 2.0 2.0 2.1 2.1
EWB1 S. Knock
3.5 - 3.7 3.8 3.5 3.8 3.5 3.6 3.4 3.3 3.4 3.5
Table 6: Monthly mean wave period (Tz) (s).
Mean wave direction (Mdir) Month Oct Nov Dec Jan Feb Mar Apr May Jun Jul Aug Sept
Site
S17S Felixstowe
109 122 134 153 140 137 131 104 136 143 156 130
S18E Clacton
132 145 145 171 149 160 144 99 153 171 184 147
S19E Dengie
118 175 160 184 158 186 144 83 159 169 182 140
S20E Maplin
153 180 181 201 181 195 165 132 169 176 193 158
EWB1 S. Knock
119 - 157 191 158 174 137 69 139 167 188 139
Table 7: Monthly mean wave direction (Mdir) (°).
Significant Wave Height
Mean wave heights in Essex range from 0.3 m to 0.7 m, waves are recorded as being slightly higher in the winter and spring. Lower wave heights are recorded in the southern half of Essex and this is reflected in the storm thresholds set for each site. Designated threshold levels at each AWAC location serve to identify storms and monitor the frequency of storm events. Waves measured over the threshold height are determined to be storm waves. The storm threshold at Felixstowe is 1.6 m, at Clacton it is 1.5 m, at Dengie it is set at 1.2 m and at Maplin Sands the level is 1.3 m. The slightly higher level at Maplin Sands compared to Dengie Flats is based on higher storm waves rather than the overall mean wave height, which since monitoring started in 2005 is considered to be lower. There are a number of peaks in wave heights throughout the year and a consistency in the measurements at each instrument. The Felixstowe AWAC (S17S) records the highest number of storm event waves that cross a threshold level. The number of waves that meet the storm threshold may suggest the level is set too low for this site. In the 2006 – 2007 monitoring period five high wave storm events were identified at the site. All the sites identified storm events in November 2007 and March 2008. The thresholds are denoted on the below graphs with a red line, and the Peaks over Threshold method and the maximum significant wave height values are detailed in the Storminess and extremes section.

Sea state report 2007– 2008 Essex ACMVII
13
Figure 3: Plot showing significant wave height (Hs) records from October 2007 to September 2008 for AWAC S17S at Felixstowe and the South Knock buoy (EWB1), with 1.6 m threshold line.
Figure 4: Plot showing significant wave height (Hs) records from October 2007 to September 2008 for AWAC S18E at Clacton and the South Knock buoy (EWB1). The red line denotes a 1.5 m threshold.

Sea state report 2007– 2008 Essex ACMVII
14
Figure 5: Significant wave height (Hs) records from October 2007 to September 2008 for the AWAC S19E at Dengie and the South Knock buoy (EWB1). The horizontal red line denotes a 1.2 m threshold.
Figure 6: Significant wave height (Hs) records from October 2007 to September 2008 for the AWAC S20E at Maplin and the South Knock buoy (EWB1). The horizontal red line denotes a 1.3 m storm threshold.

Sea state report 2007– 2008 Essex ACMVII
15
Wave direction
Figure 7: Main wave coming direction (Mdir) and occurrences for the Essex AWACs and the offshore waverider buoy, from October 2007 to September 2008.

Sea state report 2007– 2008 Essex ACMVII
16
The wave direction in this year is very similar to the previous year in 2006-2007. The prominent wave direction (Mdir) is from the south. At Felixstowe the main wave direction is the south east to east. At the other three Essex sites, S18E – S20E there is a spread of southerly waves coming from the south west to south east. The land mass offers protection from northerly waves, making the southerly waves more significant. This is shown by the offshore wavebuoy (EWB1) that is located far away enough from the land to be exposed to north easterly waves.
Peak period Peak period is also known as the dominant wave period, and describes the frequency with the highest energy. The highest occurrence of waves is around 3 seconds and those wave periods associated with locally generated wind driven waves. It can be seen in Figure 8 that the peak of occurrences rapidly tails off with very few occurrences of wave periods over 10 seconds being recorded. The wave periods measured at S20E at Maplin Sands shows a slightly different pattern. The peak in occurrences is between 3 and 5 seconds, although there is still very few longer periods. Table 17 shows the longest wave period to be 16.5 seconds recorded in February at S17S. However in most months wave periods are less than 10 seconds. This pattern is consistent with wave periods recorded at each instrument in Year 1. Long period waves refract more and therefore can focus more energy. This has a greater impact on the sea defence, and possible risk of breaching. The below plots show the wave distribution at each instrument site on the Essex coast.
Figure 8: A distribution plot of wave periods (Tp) for each AWAC (S13S, S14S, S15S, S16S).
Sea state report 2007– 2008 Essex ACMVII
17
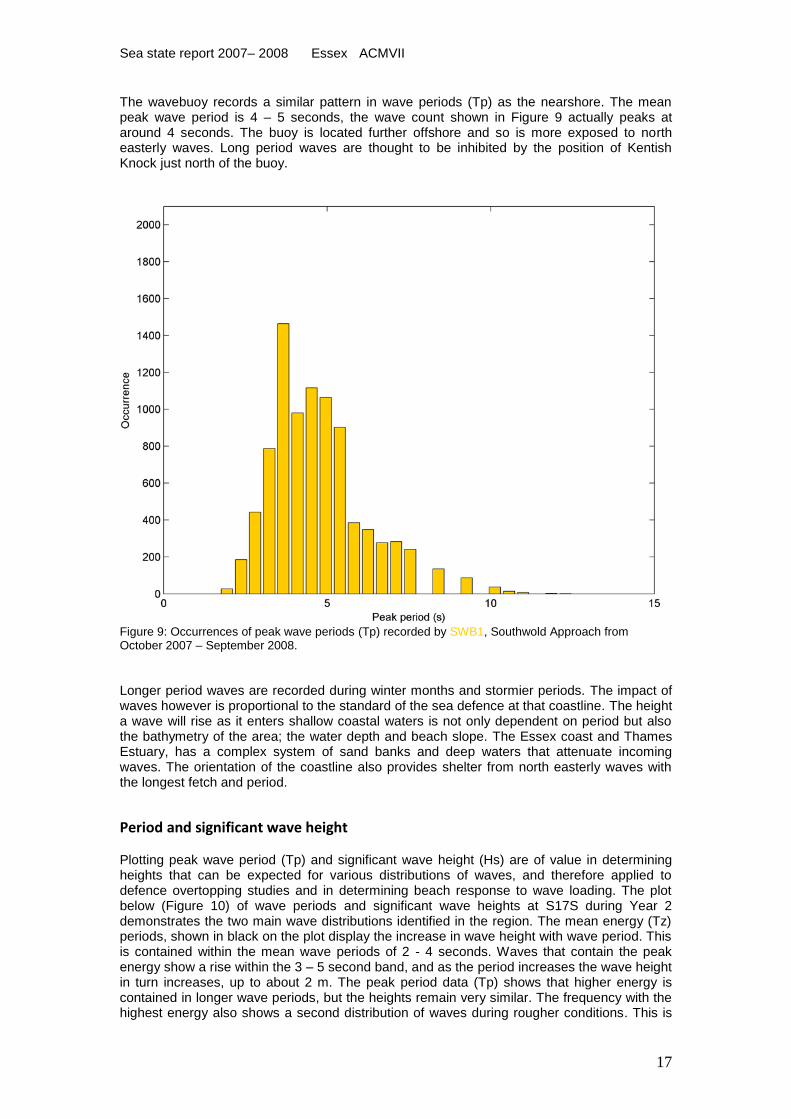
The wavebuoy records a similar pattern in wave periods (Tp) as the nearshore. The mean peak wave period is 4 – 5 seconds, the wave count shown in Figure 9 actually peaks at around 4 seconds. The buoy is located further offshore and so is more exposed to north easterly waves. Long period waves are thought to be inhibited by the position of Kentish Knock just north of the buoy.
Figure 9: Occurrences of peak wave periods (Tp) recorded by SWB1, Southwold Approach from October 2007 – September 2008.
Longer period waves are recorded during winter months and stormier periods. The impact of waves however is proportional to the standard of the sea defence at that coastline. The height a wave will rise as it enters shallow coastal waters is not only dependent on period but also the bathymetry of the area; the water depth and beach slope. The Essex coast and Thames Estuary, has a complex system of sand banks and deep waters that attenuate incoming waves. The orientation of the coastline also provides shelter from north easterly waves with the longest fetch and period.
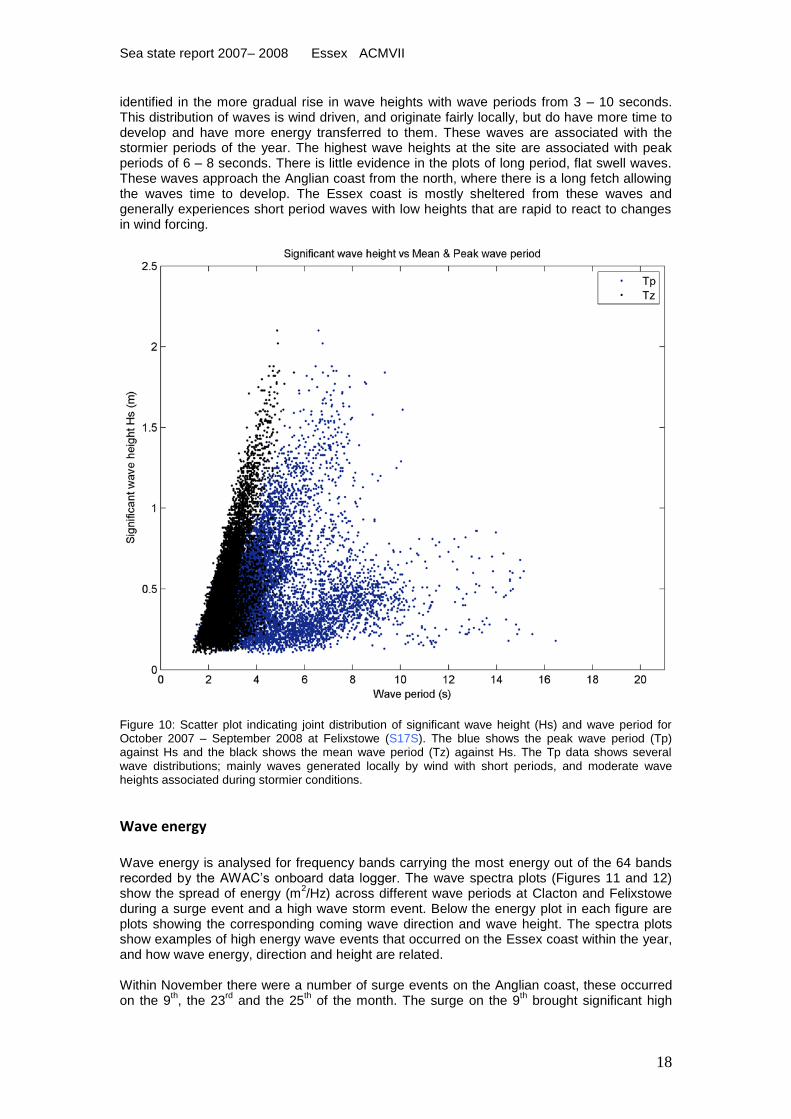
Period and significant wave height Plotting peak wave period (Tp) and significant wave height (Hs) are of value in determining heights that can be expected for various distributions of waves, and therefore applied to defence overtopping studies and in determining beach response to wave loading. The plot below (Figure 10) of wave periods and significant wave heights at S17S during Year 2 demonstrates the two main wave distributions identified in the region. The mean energy (Tz) periods, shown in black on the plot display the increase in wave height with wave period. This is contained within the mean wave periods of 2 - 4 seconds. Waves that contain the peak energy show a rise within the 3 – 5 second band, and as the period increases the wave height in turn increases, up to about 2 m. The peak period data (Tp) shows that higher energy is contained in longer wave periods, but the heights remain very similar. The frequency with the highest energy also shows a second distribution of waves during rougher conditions. This is
Sea state report 2007– 2008 Essex ACMVII
18
identified in the more gradual rise in wave heights with wave periods from 3 – 10 seconds. This distribution of waves is wind driven, and originate fairly locally, but do have more time to develop and have more energy transferred to them. These waves are associated with the stormier periods of the year. The highest wave heights at the site are associated with peak periods of 6 – 8 seconds. There is little evidence in the plots of long period, flat swell waves. These waves approach the Anglian coast from the north, where there is a long fetch allowing the waves time to develop. The Essex coast is mostly sheltered from these waves and generally experiences short period waves with low heights that are rapid to react to changes in wind forcing.
Figure 10: Scatter plot indicating joint distribution of significant wave height (Hs) and wave period for October 2007 – September 2008 at Felixstowe (S17S). The blue shows the peak wave period (Tp) against Hs and the black shows the mean wave period (Tz) against Hs. The Tp data shows several wave distributions; mainly waves generated locally by wind with short periods, and moderate wave heights associated during stormier conditions.
Wave energy
Wave energy is analysed for frequency bands carrying the most energy out of the 64 bands recorded by the AWAC‟s onboard data logger. The wave spectra plots (Figures 11 and 12) show the spread of energy (m
2/Hz) across different wave periods at Clacton and Felixstowe
during a surge event and a high wave storm event. Below the energy plot in each figure are plots showing the corresponding coming wave direction and wave height. The spectra plots show examples of high energy wave events that occurred on the Essex coast within the year, and how wave energy, direction and height are related. Within November there were a number of surge events on the Anglian coast, these occurred on the 9
th, the 23
rd and the 25
th of the month. The surge on the 9
th brought significant high

Sea state report 2007– 2008 Essex ACMVII
19
waves to areas such as Great Yarmouth and Walcott. However as shown in Figure 11 the surges brought no extraordinary high waves to the Essex coast. There are some blips indicating higher energy in moderate wave periods on these dates. The Essex coast is more sensitive to easterly and southern waves, surge events increase the water depth allowing high nearshore waves but without strong south to easterly winds the coastline appears relatively sheltered. There was a recorded storm later on in the month of November. On the 18
th a 2.10 m wave was logged at S17S at Felixstowe, this was the highest recorded wave on
the Essex coast in Year 2. In Figure 11 the wave height in the bottom plot can be seen to peak at 1.69 m. The waves came from a south easterly direction, around 120°. The centre plot of direction shows a duration of south easterly waves across all wave periods during the storm event. High energy can be seen in waves with a period of 3 – 8 seconds for the same period.
Figure 11: Wave spectra plot for S18E at Clacton during November 2007. The top plot shows high energy (up to 2 m
2/Hz) waves coloured in red and low/insignificant energy waves in blue. The centre
plot shows the corresponding wave directions, which are coloured according to their coming direction in degrees. Northerly waves coming from around 0° or 360° are either dark red or dark blue, southerly waves in turn are green. The bottom plot shows significant wave height (Hs).
Figure 12: Wave spectra plots for Felixstowe (S17S) during the month of March 2008. Peaks in energy and wave heights can be seen during several storm events.

Sea state report 2007– 2008 Essex ACMVII
20
March was the stormiest month of the monitoring period, three storms were identified from the storm threshold levels, occurring on the 10
th, 12
th and 22
nd. There was also high waves on the
16th that reached threshold levels set for Suffolk AWAC instruments. The storm on the 10
th
resulted in a 1.85 m wave being recorded at Felixstowe, while a 1.84 m wave was logged at the same site during the event on the 22
nd. These peaks in wave heights can be seen in the
lowest plot of Figure 12. During these events, where the wave heights can be seen to peak, intense patches of corresponding high energy are also visible in the top plot on the figure. The highest energy waves are concentrated in periods of 4 – 10 seconds. However on the 22
nd
the high energy can be seen in waves with a period of around 15 seconds. The 1.84 m wave on the 22
nd had a peak wave period (Tp) of 9.3 seconds. During these events the waves are
from an east to south east direction. The plots below show the annual mean and peak energy in Essex waves. The wave climate remains fairly consistent with the previous year. The plots illustrate the amount of energy within waves has slightly increased, with the exception of Clacton. Fewer storms at Clacton resulted in less high energy waves, whereas the climate has become slightly rougher at the three other sites. The pattern of energy levels continues from the previous year. Felixstowe receives the most high energy waves, with a decrease in energy to the south along the Essex coast, with Dengie Flats the most sheltered site.
Figure 13: Comparison of the average wave energy at each AWAC for monitoring years 1 and 2.

Sea state report 2007– 2008 Essex ACMVII
21
Figure 14: Comparison of the peak wave energy at each AWAC between Year 1 and Year 2.
Wave return periods
Return periods are an indicator of the frequency a wave can be expected from a certain height and direction sector. The below values detail the frequency of a particular event occurring in years. The lower the number the less frequent the event. For example a return period of 0.25 would mean the event would occur every 0.25 years or 91 days and a return period of 0.005 would occur once every 1.8 days. It is of course possible that an event with a frequency of every 2 days will occur on successive days, and does not mean an event will occur only at these intervals.
Direction band
Significant wave height (Hs) (m) band Total
0-0.5 0.5-1 1-1.5 1.5-2 2-2.5 2.5-3 3-3.5
0-30 0
30-60 6.0048 24.0192 30.024
60-90 0.0421 0.0474 0.2894 2.6688 3.0477
90-120 0.0117 0.0332 0.1483 0.6159 0.809
120-150 0.023 0.104 0.3002 1.4129 12.0096 13.8497
150-180 0.0268 0.0272 0.1668 4.0032 4.224
180-210 0.0569 0.0343 0.9238 1.015
210-240 0.3938 0.3383 0.7321
240-270 0
270-300 0
300-330 0
330-360 0
Total 6.5591 24.6036 1.8285 8.7008 12.0096 Table 8: Wave return periods at AWAC S17S Felixstowe.

Sea state report 2007– 2008 Essex ACMVII
22
Direction band
Significant wave height (Hs) (m) band Total
0-0.5 0.5-1 1-1.5 1.5-2 2-2.5 2.5-3 3-3.5
0-30 0
30-60 6.0048 24.0192 30.024
60-90 0.0421 0.0474 0.2894 2.6688 3.0477
90-120 0.0117 0.0332 0.1483 0.6159 0.809
120-150 0.023 0.104 0.3002 1.4129 12.0096 13.8497
150-180 0.0268 0.0272 0.1668 4.0032 4.224
180-210 0.0569 0.0343 0.9238 1.015
210-240 0.3938 0.3383 0.7321
240-270 0
270-300 0
300-330 0
330-360 0
Total 6.5591 24.6036 1.8285 8.7008 12.0096 Table 9: Wave return periods at AWAC S18E Clacton.
Direction band
Significant wave height (Hs) (m) band Total
0-0.5 0.5-1 1-1.5 1.5-2 2-2.5 2.5-3 3-3.5
0-30 0.1444 1.5984 1.7428
30-60 0.0475 0.393 5.9938 6.4343
60-90 0.0136 0.0747 1.1988 1.2871
90-120 0.018 0.2997 7.9918 8.3095
120-150 0.0452 0.4893 7.9918 8.5262
150-180 0.0499 0.1998 4.7951 5.0448
180-210 0.0535 0.1115 23.9753 24.1404
210-240 0.0289 0.1402 23.9753 24.1444
240-270 0.055 0.1567 11.9877 12.1994
270-300 0.1249 0.3689 11.9877 12.4814
300-330 0.0598 0.2283 0.2881
330-360 0.0987 0.8563 0.9549
Total 0.7393 4.9167 99.8973 Table 10: Wave return periods at AWAC S19E Dengie Flats.
Direction band
Significant wave height (Hs) (m) band Total
0-0.5 0.5-1 1-1.5 1.5-2 2-2.5 2.5-3 3-3.5
0-30 0.9993 3.9973 4.9966
30-60 0.7268 2.6649 3.3917
60-90 0.1256 0.8566 11.9919 12.9741
90-120 0.0159 0.0975 2.1804 2.2937
120-150 0.0141 0.2033 11.9919 12.2093
150-180 0.0279 0.3331 2.998 23.9839 27.3429
180-210 0.0238 0.1537 1.1421 1.3197
210-240 0.0204 0.0638 2.6649 2.7491
240-270 0.0352 0.0434 4.7968 4.8754
270-300 0.4283 0.7995 23.9839 25.2116
300-330 1.1421 2.1804 3.3224
330-360 5.996 11.9919 17.9879
Total 9.5554 23.3853 61.7498 23.9839 Table 11: Wave return periods at AWAC S20E Maplin Sands.

Sea state report 2007– 2008 Essex ACMVII
23
Temperature The thermometer is located within the AWAC instrument, that is mounted in a frame and sitting on the sea bed, therefore the below values are recorded at a depth of approximately 5 m CD. However the wavebuoy measurements are of sea surface temperature. The records show the same seasonal pattern as the previous year. The lowest mean temperatures are logged in January and February, the lowest being 6.2°c. The highest occur in August, peaking at 18.7°c. Details of the maximum recorded temperatures of the year are provided in Table 19 of this report.
Month Oct Nov Dec Jan Feb Mar Apr May Jun Jul Aug Sept
S17S Felixstowe
14.1 9.8 6.8 6.2 6.2 6.6 8.8 13.4 15.3 18.2 18.7 16.5
S18E Clacton
13.8 9.6 6.5 6.3 6.4 6.9 8.6 13.7 16 18.4 18.6 16.4
S19E Dengie
13.6 9.4 6.6 6.5 6.6 7.2 9.1 14.4 16.5 18.7 18.6 16.4
S20E Maplin
13.7 9.2 6.9 7 7 7.1 8.9 13.9 16.3 18.4 18.4 16.4
EWB1 S. Knock
16.2 12.9 10.6 9.4 8.3 8.3 8.9 12.4 14.8 16.7 17.9 17.4
Table 12: Monthly mean temperatures at Essex sites for the period October 2007 – September 2008.
Sea level& tides This section details sea level in Year 2, and provides tide levels at each AWAC site and the class A tide gauge station at Felixstowe. As in Year 1 the tidal range is greatest to the south, AWAC S20E shows the greatest range and high water level. The high water arrives at Felixstowe first and progresses south along the Essex coast. The high water is recorded at Maplin Sands around 50 minutes after the Felixstowe gauge and AWAC. The annual time series of tides is shown in Figure 15, the annual pattern of springs and neap tides and particularly high or low individual tides can be seen, for example in November during the surge event.
Sea level (mODN) Month Oct Nov Dec Jan Feb Mar Apr May Jun Jul Aug Sept
S17S Felixstowe
0.19 0.28 0.18 0.11 0.12 0.25 0.12 0.12 0.13 0.2 0.13 0.12
S18E Clacton
0.19 0.3 0.2 0.09 0.13 0.24 0.13 0.14 0.12 0.18 0.13 0.14
S19E Dengie
0.3 0.32 0.24 0.16 0.16 0.24 0.14 0.15 0.13 0.17 0.14 0.14
S20E Maplin
0.19 0.35 0.2 0.09 0.13 0.25 0.13 0.19 0.13 0.18 0.14 0.16
Table 13: Monthly mean sea levels relative to Ordnance Datum Newlyn for Year 2 (October 2007 – September 2008).

Sea state report 2007– 2008 Essex ACMVII
24
Essex tide levels (mODN) for Year 2
Site HAT MHWS MHWN MLWN MLWS LAT Mean HW interval
Range on Springs (m)
S17S Felixstowe
2.392 1.788 1.080 -0.752 -1.460 -1.979
11 hrs 16 min 3.248
Felixstowe 5
2.391 1.784 1.074 -0.760 -1.470 -1.989 11 hrs 18 min 3.254
S18E Clacton 3.051 2.321 1.361 -1.027 -1.987 -2.505
11 hrs 38 min 4.308
S19E Dengie 3.191 2.423 1.421 -1.059 -2.061 -2.577
11 hrs 49 min 4.484
S20E Maplin 3.473 2.733 1.587 -1.225 -2.371 -2.895 12 hrs 8 min 5.104
Table 14: Tidal parameters derived from Gardline Environmental‟s 60-constituent harmonic analysis of the second year of AWAC data (Gardline, 2008).
Figure 15: Sea level at each AWAC (S17S, S18E, S19E, S20E) for October 2007 – September 2008.

Sea state report 2007– 2008 Essex ACMVII
25
Storminess & extremes
Storm wave events
Storm analysis including storm frequency are a long term check on climate change. From analysis of extreme values we can determine how the pattern of wave characteristics in calm waters, such as direction and height, change in storm conditions. Storm generated wave directions however may vary across an area of sea, and on their approach to the coast after being recorded by an offshore buoy. Within this series of reports a storm event is defined according to the Beach Management Manual (CIRIA, 1996) Peaks over threshold method of significant wave heights (Hs) that exceed a defined threshold. This value is based on historic monitoring off the Anglian coast by the SMG, and through literature studies. This level is expected to become more accurate following the 3 year monitoring period. Suspected storms are also identifiable in the wave spectra plots (Figures 11 and 12).The duration of a storm is considered to be 16 hours around the peak wave height (Hs), however high wave events can often be seen to occur on successive high waters.
Monthly wave maxima
Threshold levels for the Essex coast are highest to the north, the designated level at Felixstowe is 1.6 m. At AWAC S18E at Clacton on the Tendering Peninsula the threshold is set at 1.5m. At Dengie Flats the threshold is set at 1.2 m, and at Maplin Sands it is 1.3 m. The highest significant wave height of the year was 2.10 m, recorded in November at AWAC S17S off Felixstowe. In the previous year the highest recorded wave was 1.94 m, logged at the Clacton site (S18E). The highest offshore wave was over 3.76 m, recorded during the storm on the 22
nd March 2008. There were 6 events of waves over 1.8 m recorded in the year
by the AWACs. Nearshore wave periods (Tp) during high wave events are observed to be within the range of 7 – 9 seconds, the maximum wave periods are around 15 seconds. The longest wave periods are recorded in the winter months from September, and during the stormy spring months of February and March. Long period swell waves are few in number and infrequent on the Essex coast, the mean wave period is between 3 – 6 seconds. The below monthly maximum values do not necessarily occur at coincidence times, for example the maximum Hs value for a month may not occur at the same time as the maximum Tp value recorded in that month. Maximum significant wave heights Hs (m) Month Oct Nov Dec Jan Feb Mar Apr May Jun Jul Aug Sept
Site
S17S Felixstowe
1.4 2.1 1.8 1.9 1.6 1.9 1.8 1.7 0.9 1.3 1.6 1.4
S18E Clacton
1.2 1.7 1.4 1.6 1.3 1.8 1.5 1.5 0.9 1.3 1.3 1.2
S19E Dengie
0.9 1.1 1.2 1.1 1.0 1.3 1.2 1.4 0.8 1.1 1.0 1.0
S20E Maplin
0.8 1.0 1.2 1.4 1.1 1.6 1.4 1.1 0.9 1.1 1.0 1.1
EWB1 S. Knock
2.1 2.9 2.6 3.0 2.5 3.8 2.5 2.8 1.7 2.0 2.4 2.1
Table 15: Monthly maximum significant wave height (Hs) (m).
Sea state report 2007– 2008 Essex ACMVII
26
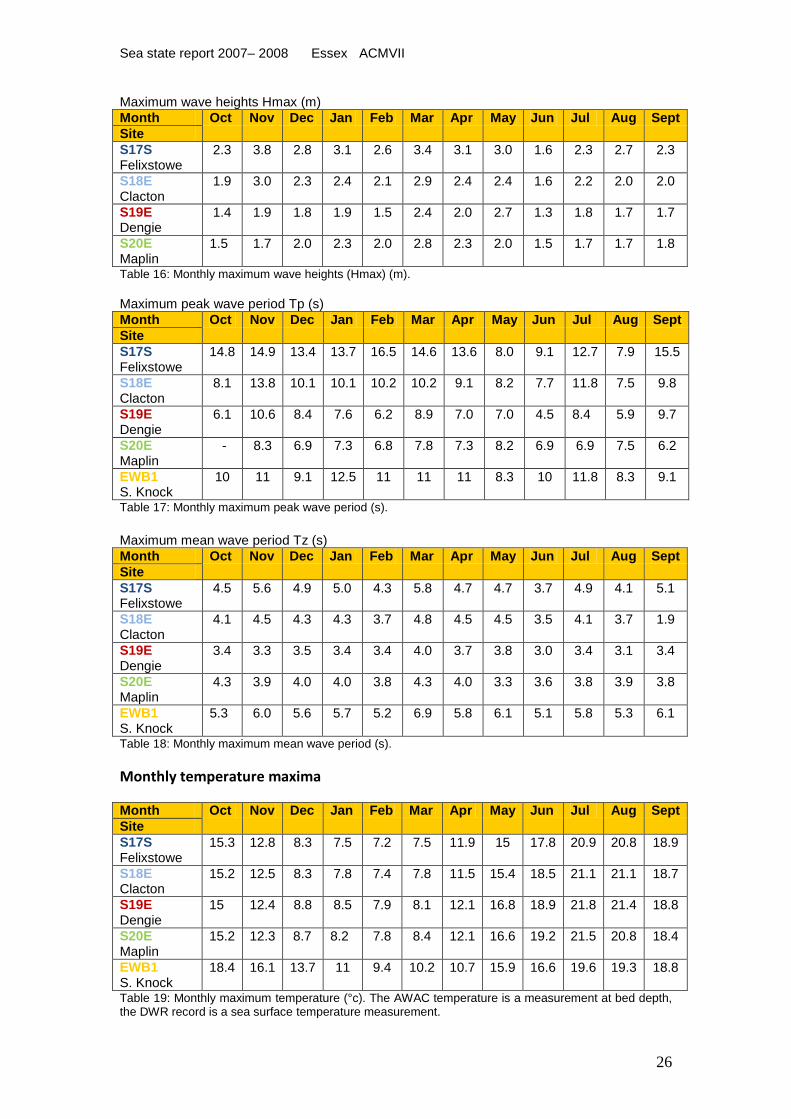
Maximum wave heights Hmax (m) Month Oct Nov Dec Jan Feb Mar Apr May Jun Jul Aug Sept
Site
S17S Felixstowe
2.3 3.8 2.8 3.1 2.6 3.4 3.1 3.0 1.6 2.3 2.7 2.3
S18E Clacton
1.9 3.0 2.3 2.4 2.1 2.9 2.4 2.4 1.6 2.2 2.0 2.0
S19E Dengie
1.4 1.9 1.8 1.9 1.5 2.4 2.0 2.7 1.3 1.8 1.7 1.7
S20E Maplin
1.5 1.7 2.0 2.3 2.0 2.8 2.3 2.0 1.5 1.7 1.7 1.8
Table 16: Monthly maximum wave heights (Hmax) (m).
Maximum peak wave period Tp (s) Month Oct Nov Dec Jan Feb Mar Apr May Jun Jul Aug Sept
Site
S17S Felixstowe
14.8 14.9 13.4 13.7 16.5 14.6 13.6 8.0 9.1 12.7 7.9 15.5
S18E Clacton
8.1 13.8 10.1 10.1 10.2 10.2 9.1 8.2 7.7 11.8 7.5 9.8
S19E Dengie
6.1 10.6 8.4 7.6 6.2 8.9 7.0 7.0 4.5 8.4 5.9 9.7
S20E Maplin
- 8.3 6.9 7.3 6.8 7.8 7.3 8.2 6.9 6.9 7.5 6.2
EWB1 S. Knock
10 11 9.1 12.5 11 11 11 8.3 10 11.8 8.3 9.1
Table 17: Monthly maximum peak wave period (s).
Maximum mean wave period Tz (s) Month Oct Nov Dec Jan Feb Mar Apr May Jun Jul Aug Sept
Site
S17S Felixstowe
4.5 5.6 4.9 5.0 4.3 5.8 4.7 4.7 3.7 4.9 4.1 5.1
S18E Clacton
4.1 4.5 4.3 4.3 3.7 4.8 4.5 4.5 3.5 4.1 3.7 1.9
S19E Dengie
3.4 3.3 3.5 3.4 3.4 4.0 3.7 3.8 3.0 3.4 3.1 3.4
S20E Maplin
4.3 3.9 4.0 4.0 3.8 4.3 4.0 3.3 3.6 3.8 3.9 3.8
EWB1 S. Knock
5.3 6.0 5.6 5.7 5.2 6.9 5.8 6.1 5.1 5.8 5.3 6.1
Table 18: Monthly maximum mean wave period (s).
Monthly temperature maxima
Month Oct Nov Dec Jan Feb Mar Apr May Jun Jul Aug Sept
Site
S17S Felixstowe
15.3 12.8 8.3 7.5 7.2 7.5 11.9 15 17.8 20.9 20.8 18.9
S18E Clacton
15.2 12.5 8.3 7.8 7.4 7.8 11.5 15.4 18.5 21.1 21.1 18.7
S19E Dengie
15 12.4 8.8 8.5 7.9 8.1 12.1 16.8 18.9 21.8 21.4 18.8
S20E Maplin
15.2 12.3 8.7 8.2 7.8 8.4 12.1 16.6 19.2 21.5 20.8 18.4
EWB1 S. Knock
18.4 16.1 13.7 11 9.4 10.2 10.7 15.9 16.6 19.6 19.3 18.8
Table 19: Monthly maximum temperature (°c). The AWAC temperature is a measurement at bed depth, the DWR record is a sea surface temperature measurement.

Sea state report 2007– 2008 Essex ACMVII
27
Highest Essex storm events in 2007/2008
18 November 2007 Waves peaked at Felixstowe reaching 2.10 m in the evening of the 18
th November 2007. The
high waves occurred during a period of spring tides and in depths of around 6 m. Wave heights at Felixstowe were well above the 1.6 m threshold, but the storm waves at Clacton were much lower, and waves at Maplin Sands and Dengie did not cross the designated thresholds for those sites. No flood alerts were issued for the Essex coast during the event. Weather over the UK on this day was recorded as being stormy, with snow and rain (UKMO, 2007).
Figure 16: Rise and decay of the storm event on the 18
th November 2007. Waves of 2.10 m were
recorded by AWAC S17S at Felixstowe during the storm.
02 January 2008 A period of southerly to easterly winds, building up to gale force by the 4
th January (UKMO,
2008a) brought easterly waves to the Essex coast. High waves were observed on successive high waters, with waves crossing the threshold level at Felixstowe and Clacton on the evening of the 2
nd. The highest waves occurred at Felixstowe and a 1.85 m wave was recorded by the
AWAC at 19:00.

Sea state report 2007– 2008 Essex ACMVII
28
Figure 17 Wave heights peaking during high waters during the January event. Waves cross the threshold levels at S17S at Felixstowe and S18E at Clacton.
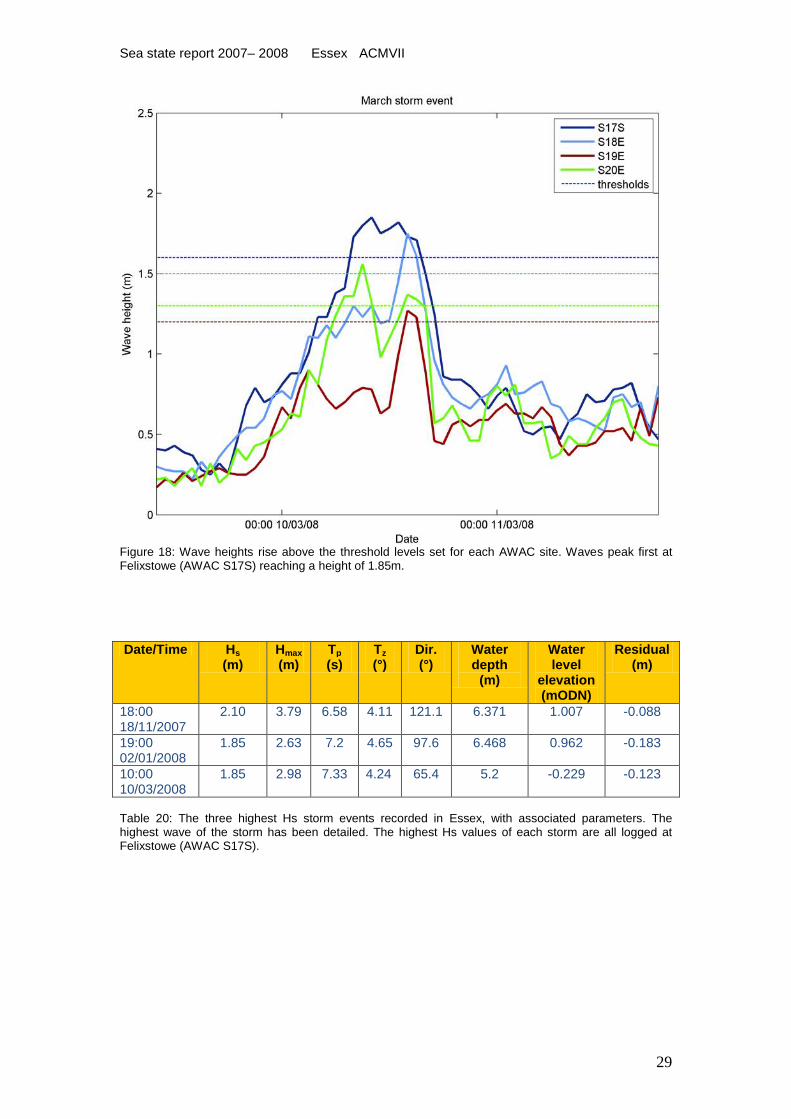
10 March 2008 A deep depression moved across the country and settled near The Wash on Monday the 10
th
March. This lead to storm force winds in the south of the country and through the English Channel (UKMO, 2008b). This event was identified as a storm in all of the AWAC instruments. First peaking at around 10:00 at Maplin Sands, and further north in Felixstowe where a 1.85 m wave was recorded. There were sustained high waves for several hours at Felixstowe. Sites S18E and S19E then recorded a peak in wave heights at 14:00, the Clacton AWAC recorded a 1.75 m wave. A Flood Alert was issued from Felixstowe in the afternoon, based on a trigger level of 2.40 mODN being reached.
Sea state report 2007– 2008 Essex ACMVII
29
Figure 18: Wave heights rise above the threshold levels set for each AWAC site. Waves peak first at Felixstowe (AWAC S17S) reaching a height of 1.85m.
Date/Time Hs
(m) Hmax
(m) Tp
(s) Tz
(°) Dir. (°)
Water depth
(m)
Water level
elevation (mODN)
Residual (m)
18:00 18/11/2007
2.10 3.79 6.58 4.11 121.1 6.371 1.007 -0.088
19:00 02/01/2008
1.85 2.63 7.2 4.65 97.6 6.468 0.962 -0.183
10:00 10/03/2008
1.85 2.98 7.33 4.24 65.4 5.2 -0.229 -0.123
Table 20: The three highest Hs storm events recorded in Essex, with associated parameters. The highest wave of the storm has been detailed. The highest Hs values of each storm are all logged at Felixstowe (AWAC S17S).

Sea state report 2007– 2008 Essex ACMVII
30
Surge events
Tides are not the only variable affecting water levels on the Anglian coast. Any contributing factors that are not part of the astronomical tide, such as non average weather conditions will have an impact. An area of low pressure and a storm can produce large scale tides know as storm surges that propagate through the North Sea. Strong winds also generate high energy waves. The addition of high waves and / or a surge combined with a high astronomical water level can severely impact on coastal defences, and risk overtopping and flooding. A surge or residual is regarded as the difference of sea level, calculated from historical sea levels and the theoretical harmonic tidal curve, and the actual sea level recorded by the AWAC. The reasons why a water level differs from the usual or predicted can be due to a number of causes, such as changes in air pressure or winds. This report highlights significant surge events, but does not seek to explain why there is a difference or isolate the principle components of a surge. Surges are identified based on the 60-constituent harmonic analysis, carried out by Gardline Environmental, which has removed the tidal influence, from the residuals (Gardline, 2008). The UK Met Office‟s classification of a surge event is when the residual (surge) exceeds 0.6 m at two or more tide gauges. This report will detail significant surge events where the residual surge is greater than 1 m. The surge has to be visible in neighbouring instruments to be considered significant and to eliminate instances of instrument error.
Highest surge events in Essex 2007/2008
09 November 2007 On the 8
th November a deep depression moved across the North Sea from Scotland into
south Norway. There were gale force winds across the Highlands on the Thursday, and early on the morning of Friday the 9
th. In addition a high pressure system had developed over the
UK on the morning of 9th. This caused gradient winds in the North Sea, these strong north
north-westerly winds caught the high spring tide and brought a surge through the North Sea, and along the Anglian coast (UKMO, 2007; UKMO, 2008b).This was the first surge event of the year and the highest recorded in both years of monitoring. A residual level of 2.4 m was recorded at Maplin Sands (S20E) at 07:25, occurring between high waters and reaching over 3.5 mODN. A below average low water was recorded prior to the surge on the 9
th, and was associated with a negative residual level. The surge then grew
with the rise of the tide, and peaked between the two high waters, holding the tide and causing the following low water to only just fall below 1.5 mODN at Southwold North. The surge actually peaks on the flood of the 11:20 high tide. In addition to the storm surge, much of the Anglian coast was affected by large waves caused by the strong winds. However the Essex coast was quite sheltered from these north easterly waves, with no storm waves being identified. During this event minor flooding was reported in Norfolk including Great Yarmouth and the Broads. A Severe Flood Warning was in place for the Suffolk coast from Hopton to Shingle Street. In Essex there was a series of Flood Alerts and barrier closures but no significant flood impact from the event.

Sea state report 2007– 2008 Essex ACMVII
31
Figure 19: The plot shows the residual levels at all four AWACs, and the Flood Forecasting modelled residual at Felixstowe (dotted grey). The dotted red line shows the 1 m surge threshold level, and the continuous grey line is the observed sea level at AWAC S20E (site of the peak recorded residual).
Figure 20: Pressure map of 9
th November 2007 showing the depression over Scandinavia and high
pressure to the south of the North Sea. (UKMO1)

Sea state report 2007– 2008 Essex ACMVII
32
01 March 2008 The second highest surge of the year was in March 2008, a surge of 2.2 m was recorded at Maplin Sands (AWAC S20E). The surge moved south along the coast and peaked in Essex at 14:45 on the 1
st March. The rising surge prevented the low water from falling and peaked
hours before the high water. The sea level logged by the S20E AWAC during the event can be seen in Figure 21. The negative surge causes a sea level of -2 mODN, the following low water does not fall below 0.5 mODN as the surge levels rise. The surge was caused by a depression moving into the area on Friday 29
th February from the west of the Faroe Islands.
By 12:00 GMT on the Saturday it reached southern Scandinavia, this caused severe gale force winds within the North Sea early on the Saturday.
Figure 21: March surge event at each of the four AWACs (S17S, S18E, S19E, S20E), the modelled residual for Felixstowe is shown by the grey dotted line, the observed sea level at the S20E AWAC is shown by the continuous grey line and the dotted red line is the 1 m surge threshold level. 02 February 2008 A depression moved across Scotland on the 1
st February resulting in severe gale force winds
over much of the North Sea. This caused the largest negative surge event of the year in the country to occur in the southern North Sea, in the days preceding the recorded positive surge. Navigation warnings were issued for the Thames estuary and the Dover Straight due to the negative surge on the 31
st January (UKMO, 2008b). The following positive surge is observed
by the AWACs to peak on the rising flood tide on the 2nd
. The surge is highest at AWAC S20E which logged 1.46 m.

Sea state report 2007– 2008 Essex ACMVII
33
Figure 22: Time series of residual levels during the February surge event, and the observed sea level at AWAC S20E.
Storm surge event
date
Residual (m)
Water level
elevation (mODN)
HW level elevation (mODN)
HW time & difference
to peak surge
Hs
(m) Tp
(s) Dir. (°)
09/11/2007 2.358 1.602 3.465 11:45 (+4:20 hrs)
0.6 3.84 284
01/03/2008 2.196 2.143 2.509 16:25 (+1:40 hrs)
0.63 3.38 266
02/02/2008 1.464 0.609 1.057 08:00 (+5:05 hrs)
0.45 3.53 266
Table 21: The highest 3 surge events (residuals greater than 1 m) in Year 2, listed in rank order. The time and height of the highest surge value of the event is listed. The related coincident water level and hourly wave data for the AWAC is shown. The high water on the closest tide, and the time difference from high water and the surge peak is also detailed. The highest surge value during all of the top 3
events was recorded at S20E.

Sea state report 2007– 2008 Essex ACMVII
34
Storm calendar
The below plots show the storm and surge events that have occurred in the first two years of monitoring. Surge events can be seen to occur from November to March in the year, with the November 2007 surge the most severe event recorded to date. There were 5 surge events recorded in each year. The number of storms in Year 2 has increased, and the most severe storm to date occurred in November of Year 2. Felixstowe shows an increase in the number of waves crossing the storm threshold in Year 2, however AWAC S20E at Maplin shows a large decrease in the number of storms at the site compared to last year.
Figure 23: Storm calendar showing the wave events in Year 1 and 2 that crossed site thresholds..
Figure 24: Surge calendar showing occurrences of surge events in Year 1 and 2.

Sea state report 2007– 2008 Essex ACMVII
35
Flood Forecasting records
Event duration
Date Time Warnings issued
Forecast site
Threshold Value (mODN)
09/11/2007 Surge event
07/11/2007 07/11/2007 08/11/2007 11/11/2007
17:38 17:48 12:15 04:37
Flood Alert Flood Alert Flood Alert Flood Alert
Felixstowe Southend Southend Felixstowe
2.40 3.60 3.60 2.40
18/11/2007 High waves event
No warnings issued
02/01/2008 High waves event
No warnings issued
02/02/2008 Surge event
No warnings issued
01/03/2008 Surge event
No warnings issued
10/03/2008 High waves event
08/03/2008 16:12 Flood Alert Felixstowe 2.40
Table 22: Environment Agency Flood Forecasting records of flood alerts
6 for the Essex coast and Flood
Warning Areas based on forecast stations between Felixstowe and Southend issued prior to and during storm and surge events identified in Year 2.
Extreme sea levels
This section details the maximum tidal level recorded in the year to inform the design of defence crest heights. The highest levels recorded this year were associated with the November 9
th storm surge. There is a consistency in the recorded sea levels across years,
with a slight increase at all sites except for Clacton, where the maximum levels are equal between years. As described in the Sea levels and tides section of this report, the highest levels occur in the south of the region, with a maximum sea level of 3.7 mODN logged at the Maplin Sands AWAC in November of Year 2.
Figure 25: Highest recorded sea level at each Essex AWAC in years 1 and 2.

Sea state report 2007– 2008 Essex ACMVII
36
Summary The wave climate during the first year of monitoring from October 2006 - September 2007 was detailed in the first Sea state report for the Essex coast (Environment Agency, 2009). Mean wave heights for the year ranged from 0.3 – 0.6 m, with an observed peak wave period range of 2.5 – 5.5 seconds. Waves were mostly logged from the east to south east. The wave climate observed in the second year of monitoring is similar to that seen in the previous year. The Essex coastline is sheltered from the long fetch and storm generated waves from the north. This is shown by the offshore buoy EWB1 that receives a greater proportion of north easterly waves than the nearshore AWACs. The nearshore bathymetry of banks and channels running parallel to the coast into the Thames Estuary and current interactions also serve to modify and reduce incoming waves. Observed wave heights and periods in Essex are relatively low compared to the coast further north, such as Norfolk. The sheltered nature of the coast has enabled the development of coastal marsh land to grow in a low wave energy environment. This saltmarsh in turn acts as a further defence to wave action by attenuating and dissipating wave energy. However the installation of defences such as embankments that prevent inland movement of the marsh land, in addition to increasing sea levels mean that coastal squeeze of the saltmarsh is an issue. A number of storm and surge events in the year met the designated threshold levels. The only event bringing significant flood risk was the November 9
th surge. This caused a number of
barrier closures, such as the Thames and Colne barriers, and Flood Alerts but no major flooding was reported in the area, unlike places such as Great Yarmouth and Walcott to the north. Although there was the same number of surge events as the previous year, two of the year‟s recorded surge levels reached over 2 metres. The November surge occurred during a period of high Spring tides. The peak of the surge arrived around 4 hours before the high water, but the event served to highlight the potential flood risk if it had occurred during a higher tidal state with larger waves present. The average wave heights on the coast range from 0.3 m (Hs), observed in the calmer months and to the south of the region, to around 0.5 m. In January at Felixstowe the mean Hs for the month was 0.7 m. The mean offshore waves recorded by the buoy EWB1 are around 0.5 m higher than the nearshore. In most months nearshore waves exceeded 1 m and the highest wave of the year was over 2 m. The highest wave was recorded by the Felixstowe AWAC during a storm on the 18
th November 2007. The main wave direction is from the east,
although waves are logged from the northeast and southwest. Winds blowing off the land have sufficient time to develop waves before reaching the AWACs. Wave energy remains at similar levels to Year 1, with Felixstowe receiving the highest energy waves. Higher waves are consistently recorded by the AWACs positioned off Felixstowe and Clacton. These heights are comparatively low compared to elsewhere in Anglia. The highest water elevation and subsequent surge risk is at the southern half of the region around the Thames Estuary, Maplin Sands and Dengie Flats. The data continues to show that the significant risk in Essex is from the long term effects of erosion. Increased sea level and additional storms impact on the eroding beaches and receding saltmarsh and make the coastline continually more vulnerable to future storms. Wave climate and extremes are an important consideration in forecasting and coastal management activities. Real time offshore buoy data can inform forecasting duty officers and EA Operations Delivery staff during or preceding an event. The collected data can be valuable for validating models and in determining forecasting errors of surges. It can also inform Mean Sea Level adjustments used in flood forecasting. The determination of wave distributions and wave types from the height / period analysis is of use in studies assessing overtopping and the design of coastal structures in Anglia. The report provides a good indication of the current sea state and trends in wave climate and sea level. Although a 3 year period is not suitable for long term trend analysis, it is hoped these reports can be used with future/historic datasets. The individual reports can be used in conjunction to directly compare adjacent or nearby instruments and determine relationships in waves and tide progression at each region.

Sea state report 2007– 2008 Essex ACMVII
37
References 1 Cefas WaveNet: www.cefas.co.uk/data/wavenet.aspx
2 Gardline Environmental: www.gardlinemarinesciences.com/page/gardline-environmental
3 Nortek control software: www.nortek-as.com
4 Datawell W@ves 21: www.datawell.nl/
5NOC, Felixstowe tide gauge: http://www.pol.ac.uk/ntslf/tides/?port=0204
6 Environment Agency Flood Warning system: http://www.environment-
agency.gov.uk/homeandleisure/floods/31620.aspx CIRIA, 1996. Beach management manual. Report 153. Construction Industry Research and Information Association, London, 1996. Environment Agency, 2008. Coastal trends analysis, Essex, Subcell 3d – Harwich to Canvey Island. Anglian Region, Peterborough, July 2008. Environment Agency, 2009, Sea state report for Essex, Year 1 Oct 2006 – Sept 2007. Anglian Coastal Monitoring Programme Phase VII 2006/07 – 2010/11. Environment Agency Anglian Region, Peterborough, 2009. Gardline, 2006 Essex Wave and Tide Monitoring Contract 2004/2005. Annual report and processes logged data 18th March 2005 – 31st March 2006. Wave tide and current measurements. Report for Environment Agency, Anglian Region, Reference 12811. Gardline Oceanography Department, Great Yarmouth, 2006. Gardline, 2008. Annual report of processed and raw logged data, September 2006 – September 2007. Wave tide and current measurements. Report for the Environment Agency, Extended Wave and Tide Data Contract 2006-2007, Reference: 12811 – Phase VII. Gardline Environmental Oceanography Department, Great Yarmouth. Haskoning 2004, Scoping study for wave and water level monitoring and analysis: Essex. Specialist Term Consultancy: Geomorphology, Project number: STCG/2003/79. Final report for the Environment Agency, Anglian Region. Royal Haskoning UK Ltd, Peterborough, June 2004. H R Wallingford, 2002. Southern North Sea Sediment Transport Study (SNSSTS), 2002. Phase 2, Sediment Transport Report. Appendix 11 Report on Southern North Sea Longshore sediment transport. Report EX4526, Report for Great Yarmouth Borough Council. HR Wallingford. Mouchel, 1997. Essex Shoreline Management Plan. Report No. MBL/SWY/45727/DOC.009, Volume 3. Report for Tending District Council. L. G. Mouchel & Partners Ltd, Surrey, April 1997. UKHO
1, UK MetOffice pressure charts from www.wetterzentrale.de
UKMO, 2008a, http://www.metoffice.gov.uk/climate/uk/2008/january.html UKMO, 2007, http://www.metoffice.gov.uk/climate/uk/2007/november.html UKMO, 2008b, Storm Tide Forecasting Service operational report to the Environment Agency, for the period 1st June 2007 to 31st May 2008. Report to the Environment Agency, Met Office, Exeter, 29 August 2008.
Sea state report 2007– 2008 Essex ACMVII
38
Glossary Bathymetry – The measured shape and depth contours of the sea bed. Fetch - The uninterrupted distance over water which the wind acts to produce waves. Intertidal – The coastal area between the Lowest Astronomical Tide (LAT) and Highest Astronomical Tide (HAT). Maximum wave height (Hmax) – Statistic of the maximum wave height recorded in a period of time. Mean direction (Mdir) – The average or main direction from which waves have come, measured over a period of time. Mean Sea Level - Generally refers to 'still water level' above a fixed datum (excluding wave influences), averaged over a period of time such that periodic changes in level (e.g. due to the tides) are smoothed out. Mean wave period (Tz) – Also referred to as the zero crossing period, a description of the average wave period over a duration of time. Neap Tide - The tide that occurs when the tide-generating forces of the sun and moon are positioned at right angles to each other. The neap tide has the lowest tidal range. Ordnance Datum (OD) – A specific datum or plane to which depths or heights are referred to. Peak period (Tp) – Also called dominant wave period and Tpeak, it is the wave period (time for two successive waves to pass a point) associated with the largest wave energy, obtained from the spectral "peak frequency" i.e. the frequency band that has the largest energy. Ramsar site – Designation under the Ramsar Convention on Wetlands of International Importance especially as Waterfowl Habitat 1971. Residual surge level – The difference from the predicted (astronomical / harmonic tide level) and the observed / instrument measured level. A surge can be negative or positive relative to the mean sea level. Return period – A statistical interpretation to describe the frequency an event will occur, for example a 2.5 m wave that may be expected once in every 5 years would have a 1:5 years return period. SAC - Special Area of Conservation designation under the EC Habitats Directive to protect flora and fauna of European importance. Sea (waves) – Waves generated at a storm system, under a height of 2 m. Significant wave height (Hs) – Statistical calculation of Hm0taken from the spectral analysis to describe the average wave height. SSSI – Site of Special Scientific Interest statutory designation recognising an area with natural features of importance such as geology or flora. SPA – Special Protection Area designation under the EC Habitats Directive to protect internationally important sites.
Sea state report 2007– 2008 Essex ACMVII
39
Spring tide - The tide that occurs when the tide-generating forces of the sun and moon are in alignment and results in a higher than average tidal range. Storm surge - A storm surge is the additional sea level accounted for by a storm. The rise in water level causes a propagating bulge of water on the open coast caused by the action of wind stress and atmospheric pressure on the sea surface. Storm waves – Wind driven waves associated with a storm system, these waves have a higher frequency than swell waves and therefore can cause multiply frequency peaks in the spectra. In a multiple peaked spectrum the mean wave period (Tz) may not be a measure of the frequency where the peak energy occurs. Swell (waves) – Waves that have travelled out of the area they were generated. Swell waves characteristically have a flatter shape and longer period. In spectral analysis swell waves have a low frequency, with a peak period (Tp) where energy decays in the frequencies either side. Wave climate – The average condition of the waves at a location over a period of time, represented by wave statistics such as height, period and direction. Wave spectra – The wave energy in a band of frequencies, describing the total energy transmitted by a wave-field.
