sea turtle monitoring and research report - … · sea turtle monitoring and research report...
TRANSCRIPT

Sea Turtle Monitoring and Research Report
Pacuare Nature Reserve
2016
Prepared by Renato Bruno
2016 Season Report Page | 1
Pacuare Nature Reserve
Endangered Wildlife Trust John Denham – Founder
Carlos Fernandez – Reserve Manager
2016 Field Coordinators
Renato Bruno – South Station
Hayi Valverde – North Station
2016 Field Assistants
Anne, Ashleigh, Christian, Hugo, Konrad, Lucy, Nathan, Nerine
Station Staff
Anna, Alexis, Hyeily, Johanna, Jonathan, Juan Carlos, Luis, Modesto, Pedro, Vicky

2016 Season Report Page | 2
Table of Contents
1. Introduction............................................................................................................................................ 4
1.1. Pacuare Nature Reserve .......................................................................................................... 4
1.2. Location of Pacuare Nature Reserve ....................................................................................... 5
1.3. Sea Turtle Species.................................................................................................................... 5
2. Methodology .......................................................................................................................................... 7
2.1. Preparation ............................................................................................................................. 7
2.2. Beach Patrols and Nesting Surveys .......................................................................................... 7
2.3. Morning Census....................................................................................................................... 9
2.4. Individual Sea Turtle Identification .......................................................................................... 9
2.4.1. Flipper Tagging ........................................................................................................ 9
2.4.2. Passive Integrated Transponder (PIT) Tagging ....................................................... 10
2.5. Biometric Data....................................................................................................................... 10
2.6. Nest Relocation ..................................................................................................................... 11
2.7. Nest Triangulation ................................................................................................................. 12
2.8. Nest Excavation ..................................................................................................................... 12
3. Results .................................................................................................................................................. 14
3.1. Leatherback Turtles ............................................................................................................... 14
3.1.1. Temporal Distribution............................................................................................ 14
3.1.2. Spatial Distribution ................................................................................................ 16
3.1.3. Timing of Activity ................................................................................................... 18
3.1.4. Stage of Nesting Process ........................................................................................ 19
3.1.5. Tagging and Biometric Data ................................................................................... 19
3.1.6. Nesting Success ..................................................................................................... 20
3.1.7. Nest Excavation ..................................................................................................... 21
3.1.8. Hatching and Emergence Success .......................................................................... 21
3.2. Hard-Shelled Turtles .............................................................................................................. 24
3.2.1. Temporal Distribution............................................................................................ 24
3.2.2. Spatial Distribution ................................................................................................ 26
3.2.3. Tagging and Biometric Data ................................................................................... 26
3.2.4. Nesting Success ..................................................................................................... 27
3.2.5. Hatching and Emergence Success .......................................................................... 27
2016 Season Report Page | 3
4. Discussion ............................................................................................................................................. 28
4.1. Leatherback Nesting Trends .................................................................................................. 28
4.2. Beach Patrols ......................................................................................................................... 28
4.3. Mark and Recapture Program ............................................................................................... 29
4.4. Egg Poaching ......................................................................................................................... 29
4.5. Nest Relocation and Triangulation ........................................................................................ 29
4.6. Eroded and Lost Nests ........................................................................................................... 30
4.7. Green Turtle Season .............................................................................................................. 30
Appendix A. Tag Catalog .......................................................................................................................... 31
2016 Season Report Page | 4
1. Introduction
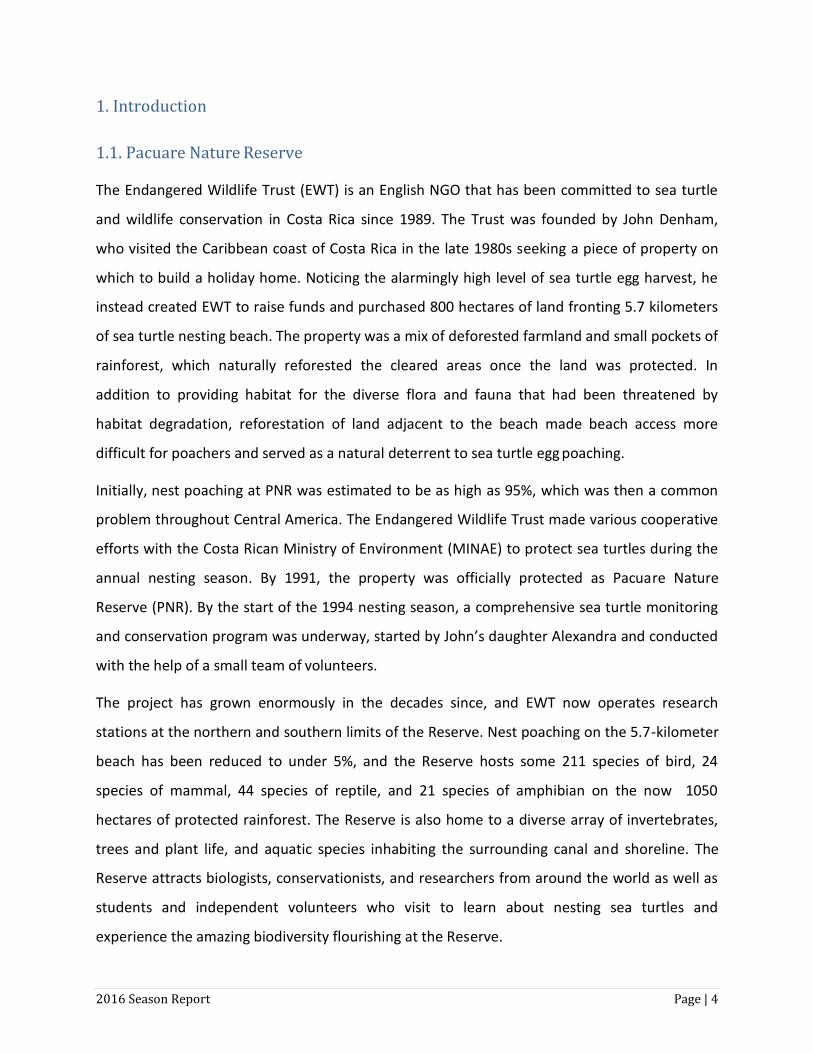
1.1. Pacuare Nature Reserve
The Endangered Wildlife Trust (EWT) is an English NGO that has been committed to sea turtle
and wildlife conservation in Costa Rica since 1989. The Trust was founded by John Denham,
who visited the Caribbean coast of Costa Rica in the late 1980s seeking a piece of property on
which to build a holiday home. Noticing the alarmingly high level of sea turtle egg harvest, he
instead created EWT to raise funds and purchased 800 hectares of land fronting 5.7 kilometers
of sea turtle nesting beach. The property was a mix of deforested farmland and small pockets of
rainforest, which naturally reforested the cleared areas once the land was protected. In
addition to providing habitat for the diverse flora and fauna that had been threatened by
habitat degradation, reforestation of land adjacent to the beach made beach access more
difficult for poachers and served as a natural deterrent to sea turtle egg poaching.
Initially, nest poaching at PNR was estimated to be as high as 95%, which was then a common
problem throughout Central America. The Endangered Wildlife Trust made various cooperative
efforts with the Costa Rican Ministry of Environment (MINAE) to protect sea turtles during the
annual nesting season. By 1991, the property was officially protected as Pacuare Nature
Reserve (PNR). By the start of the 1994 nesting season, a comprehensive sea turtle monitoring
and conservation program was underway, started by John’s daughter Alexandra and conducted
with the help of a small team of volunteers.
The project has grown enormously in the decades since, and EWT now operates research
stations at the northern and southern limits of the Reserve. Nest poaching on the 5.7-kilometer
beach has been reduced to under 5%, and the Reserve hosts some 211 species of bird, 24
species of mammal, 44 species of reptile, and 21 species of amphibian on the now 1050
hectares of protected rainforest. The Reserve is also home to a diverse array of invertebrates,
trees and plant life, and aquatic species inhabiting the surrounding canal and shoreline. The
Reserve attracts biologists, conservationists, and researchers from around the world as well as
students and independent volunteers who visit to learn about nesting sea turtles and
experience the amazing biodiversity flourishing at the Reserve.
2016 Season Report Page | 5
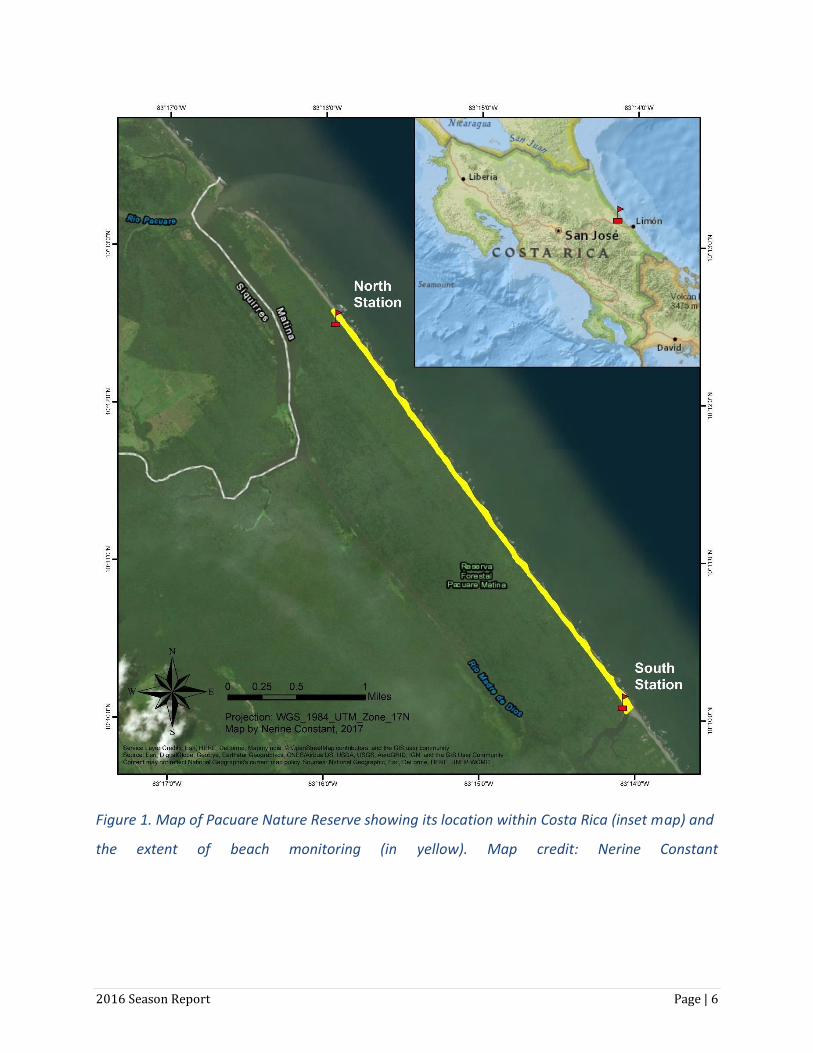
1.2. Location of Pacuare Nature Reserve
Pacuare Nature Reserve is located along the Caribbean coast of Costa Rica. The Reserve is 30
kilometers northwest of the port of Limón and 45 kilometers southeast of Tortuguero.
Tortuguero Canal separates PNR from the mainland to the west. The Reserve’s northern border
is one kilometer south of the Pacuare River mouth and the southern border is at Mondonguillo
Lagoon. The Reserve’s sea turtle monitoring project operates on the 5.7 kilometers of beach
protected by PNR (Figure 1). Two research stations, one at the northern limit and one at the
southern limit, are operational throughout the sea turtle nesting season.
1.3. Sea Turtle Species
Three of the world’s seven species of sea turtle nest in Pacuare. The high-energy and erosion-
prone beaches of the Caribbean coast of Central America, more specifically of Costa Rica and
northern Panama, hold the third most important nesting ground for the Northwest Atlantic
Ocean subpopulation of the leatherback turtle (Dermochelys coriacea). The leatherback nesting
season occurs between February and August, and Pacuare Nature Reserve receives an average
of 770 leatherback nests every year.
Two species of hard-shelled sea turtle also nest in Pacuare: the green turtle (Chelonia mydas)
and the hawksbill turtle (Eretmochelys imbricata). The green turtle nesting season is between
June and November, and the world’s largest nesting colony of green turtles is located only 45
kilometers northwest of Pacuare at Tortuguero National Park. Critically endangered hawksbill
turtles nest throughout the season, though in much smaller numbers. Other monitoring
programs have also reported loggerhead turtle (Caretta caretta) nesting in the area, but
encounters are rare.
2016 Season Report Page | 6
Figure 1. Map of Pacuare Nature Reserve showing its location within Costa Rica (inset map) and
the extent of beach monitoring (in yellow). Map credit: Nerine Constant
2016 Season Report Page | 7
2. Methodology
2.1. Preparation
To start the season fully equipped, PNR staff cleaned equipment, prepared offices, and
purchased missing equipment. Field Coordinators trained Field Assistants with an intensive field
techniques course to ensure they were suitably prepared for the onset of the nesting season.
The course included lessons on sea turtle ecology and biology, species identification, safe
working practices, use of equipment, data collection protocol, tagging methodology, nest
relocation and triangulation procedures, beach patrol ethics and leadership, and health and
safety practices.
We divided the beach into monitoring sectors by placing numbered wooden markers at 25-
meter intervals along the entire 5.7-kilometer beach. Markers at 100-meter intervals were
numbered with whole numbers from 0 in the south to 57 in the north, and markers in between
were numbered in increments of 0.1 from the previous 100-meter marker (e.g. the
southernmost 100 meters of the study area were marked 0, 0.1, 0.2, 0.3, and 1).
2.2. Beach Patrols and Nesting Surveys
We conducted nightly beach patrols from February 18th to September 30th to monitor all sea
turtle activities on the beach and to keep the poaching rate to an absolute minimum. Either a
Field Coordinator or Field Assistant led each patrol, accompanied by small groups of volunteers.
Each group patrolled for a minimum of four hours, with patrols starting from both stations at
20:00, 22:00 and 00:00. This schedule allowed us to maximize turtle encounters by having
multiple patrols on the beach simultaneously and covering the beach until almost sunrise.
During night patrols, we encountered tracks and turtles and performed tagging, measuring, and
nest relocation protocols.
For each activity, we recorded the following data in a waterproof notebook.
Patrol leader’s name

2016 Season Report Page | 8
Date: The patrol date (does not change after midnight, so all patrols in one night have
the same date recorded)
Time: Recorded in 24-hour time the minute the patrol encountered the turtle
Sea turtle species:
DC: Dermochelys coriacea (Leatherback, Baula)
CM: Chelonia mydas (Green, Verde)
EI: Eretmochelys imbricata (Hawksbill, Carey)
Activity type:
Salida Falsa (False Crawl): An activity that did not result in a nesting attempt
No Puso (Did Not Lay): The turtle dug a body pit, but did not oviposit
No Sé (Not Confirmed): An activity with all the characteristics of a nest, but the
patrol did not witness oviposition
In Situ: A confirmed nest that the patrol left in the turtle’s original nesting site
Reubicado (Relocated): A confirmed nest that the patrol relocated to a safer site
Zone: Vertical area of the beach where the activity occurred
Vegetación: In the vegetation
Alta: Upper part of the beach
Baja: Lower part of the beach
Marea: Below the high tide line
When the turtle was encountered in addition to the track, we also recorded the following
information.
Stage of nesting process: The turtle’s behavior when encountered by the patrol
Saliendo (Emerging): Emerging from the water or searching for a suitable nest
site
Bañando (Bodypitting): Making a body pit with her front flippers
Excavando (Digging): Digging the egg chamber
Poniendo (Laying): Oviposition, or laying eggs
Tapando (Covering): Covering the egg chamber with her rear flippers
Camuflando (Camouflaging): Camouflaging her nest
2016 Season Report Page | 9
Regresando (Returning): Returning to the sea
Tagging data (see 2.4. Individual Sea Turtle Identification): Left and right flipper tag
number, PIT tag number, whether tags were old or newly applied, and evidence of lost
tags (old tag holes and notches)
Size measurements (see 2.5. Biometric Data): Carapace measurements in centimeters
Body condition: Any notable observations on turtle body condition, including injuries,
deformities, and parasites
For in situ and relocated nests, we also recorded the following information.
Nest depth: Measured in centimeters from surface to bottom of egg chamber
Egg count: The number of fertile and infertile (yolkless) eggs laid in the nest
Nest location measurements (see 2.7. Nest Triangulation)
2.3. Morning Census
We conducted the morning census at dawn to monitor the status of in situ and relocated nests;
record evidence of poaching, erosion, or hatching activity; and conduct nest excavations (see
2.8. Nest Excavation). We also marked unconfirmed nests with flagging tape if we observed
evidence of hatching that confirmed oviposition. Morning census also functioned as the final
patrol, allowing us to record any turtle activities that occurred after the last night patrol.
2.4. Individual Sea Turtle Identification
2.4.1. Flipper Tagging
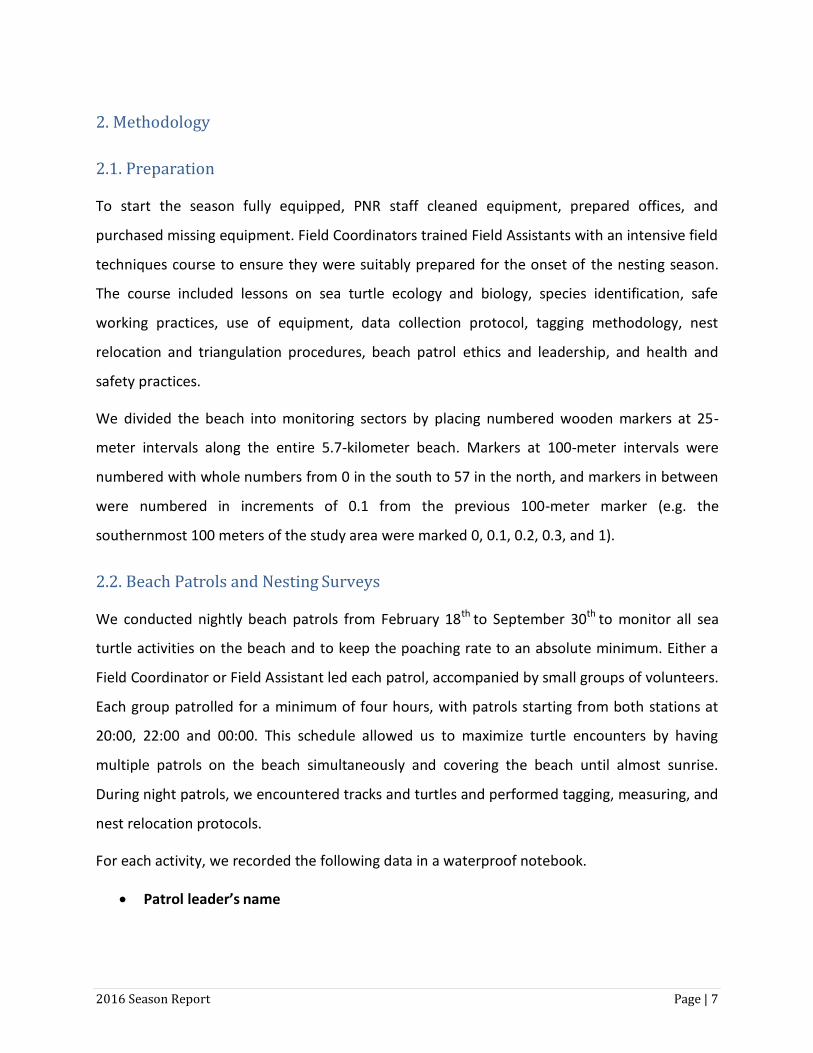
Once turtles finished laying, we marked untagged turtles with metal flipper tags using tagging
pliers. Each tag has a unique series of letters and numbers that allows for individual
identification. Leatherbacks were marked with Monel tags placed in their left and right rear
flippers and hard-shelled species were tagged with Inconel tags in the second scale of their left
and right front flippers (Figure 2).
2016 Season Report Page | 10
Figure 2. Flipper tagging locations for leatherbacks (left) and hard-shelled species (right).
Evidence of lost tags noted as old tag notch (OTN) and old tag hole (OTH). Image credit: 2009
Sea Turtle Monitoring Program Report, Pacuare Reserve.
2.4.2. Passive Integrated Transponder (PIT) Tagging
As a secondary individual identification method, we also marked turtles with Passive Integrated
Transponder (PIT) tags after scanning for existing tags. These tags use a transponder the size of
a grain of rice that provides a unique series of letters and numbers when read with a scanner.
We injected PIT tags into the front muscle of the right shoulder.
2.5. Biometric Data
We counted eggs during oviposition (for nests left in situ) and during nest relocations.
Leatherbacks also lay smaller yolkless eggs after the fertilized eggs, which we counted
separately. When handling eggs, we always wore medical gloves to protect humans, turtles,
and eggs. For leatherbacks, we measured curved carapace length (CCL) along the right side of
the central ridge from the nuchal notch following the curving shape of the carapace to the tip of
the caudal peduncle (Figure 3 A.I, B.I). We also noted if the caudal peduncle was complete or
incomplete. We measured the curved carapace width (CCW) across the widest part of the
carapace from the outer carapace ridges (Figure 3 A.II, B.I). For green turtles and hawksbills, we

2016 Season Report Page | 11
measured CCL and CCW in a similar manner, down the center of the carapace and at the widest
point respectively (Figure 3 B.II).
Figure 3. Measurement protocols for leatherbacks (A, B.I) and hard-shelled species (B.II). Image
credit: 2009 Sea Turtle Monitoring Program Report, Pacuare Reserve.
2.6. Nest Relocation
We relocated nests that were laid in areas prone to nest failure due to erosion or elevated
microbial content. If we encountered the turtle before oviposition and determined it was
necessary to relocate the nest, we waited until the turtle had finished digging the egg chamber
before placing a sterile plastic bag inside the nest to collect the eggs as they were laid. If the
turtle had already finished laying and we determined the nest was at risk, we used a metal
probe to find the egg chamber. We carefully transferred the eggs to an appropriate relocation
site as near to the original nesting location as possible. Relocation sites were selected to
minimize risk of erosion and elevated microbial content. To rebury the eggs, we dug a chamber
matching the depth (70 centimeters for leatherbacks) and shape of original nest and placed the
eggs in the same order as they were laid. We mimicked the turtle covering and camouflaging
process, and we also cleared our footprints to prevent detection by potential poachers.
2016 Season Report Page | 12
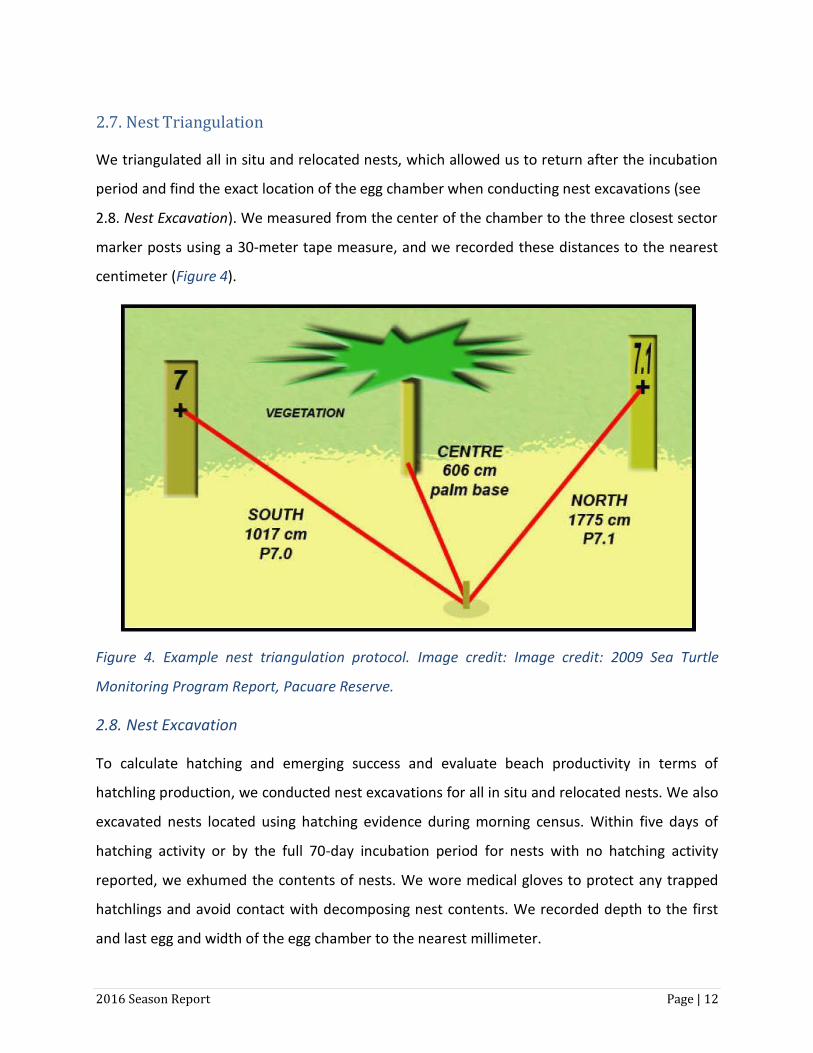
2.7. Nest Triangulation
We triangulated all in situ and relocated nests, which allowed us to return after the incubation
period and find the exact location of the egg chamber when conducting nest excavations (see
2.8. Nest Excavation). We measured from the center of the chamber to the three closest sector
marker posts using a 30-meter tape measure, and we recorded these distances to the nearest
centimeter (Figure 4).
Figure 4. Example nest triangulation protocol. Image credit: Image credit: 2009 Sea Turtle
Monitoring Program Report, Pacuare Reserve.
2.8. Nest Excavation
To calculate hatching and emerging success and evaluate beach productivity in terms of
hatchling production, we conducted nest excavations for all in situ and relocated nests. We also
excavated nests located using hatching evidence during morning census. Within five days of
hatching activity or by the full 70-day incubation period for nests with no hatching activity
reported, we exhumed the contents of nests. We wore medical gloves to protect any trapped
hatchlings and avoid contact with decomposing nest contents. We recorded depth to the first
and last egg and width of the egg chamber to the nearest millimeter.
2016 Season Report Page | 13
We separated nest contents into the following categories.
Hatched eggs: empty shells
Unhatched eggs: whole eggs
Yolkless eggs: small, misshapen eggs
Pipped alive or dead hatchlings: hatchling pierced the shell with egg tooth but did not
completely emerge from the egg
Alive or dead hatchlings: hatchling completely left its shell
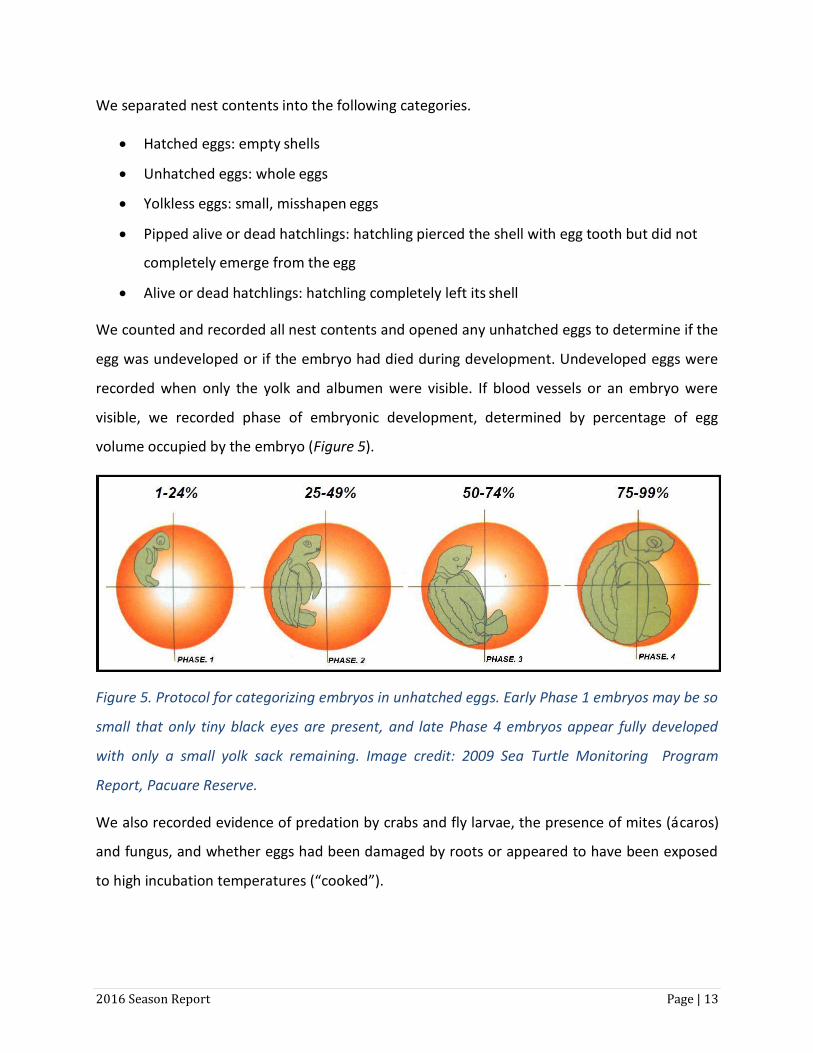
We counted and recorded all nest contents and opened any unhatched eggs to determine if the
egg was undeveloped or if the embryo had died during development. Undeveloped eggs were
recorded when only the yolk and albumen were visible. If blood vessels or an embryo were
visible, we recorded phase of embryonic development, determined by percentage of egg
volume occupied by the embryo (Figure 5).
Figure 5. Protocol for categorizing embryos in unhatched eggs. Early Phase 1 embryos may be so
small that only tiny black eyes are present, and late Phase 4 embryos appear fully developed
with only a small yolk sack remaining. Image credit: 2009 Sea Turtle Monitoring Program
Report, Pacuare Reserve.
We also recorded evidence of predation by crabs and fly larvae, the presence of mites (ácaros)
and fungus, and whether eggs had been damaged by roots or appeared to have been exposed
to high incubation temperatures (“cooked”).
2016 Season Report Page | 14
3. Results
3.1. Leatherback Turtles
3.1.1. Temporal Distribution
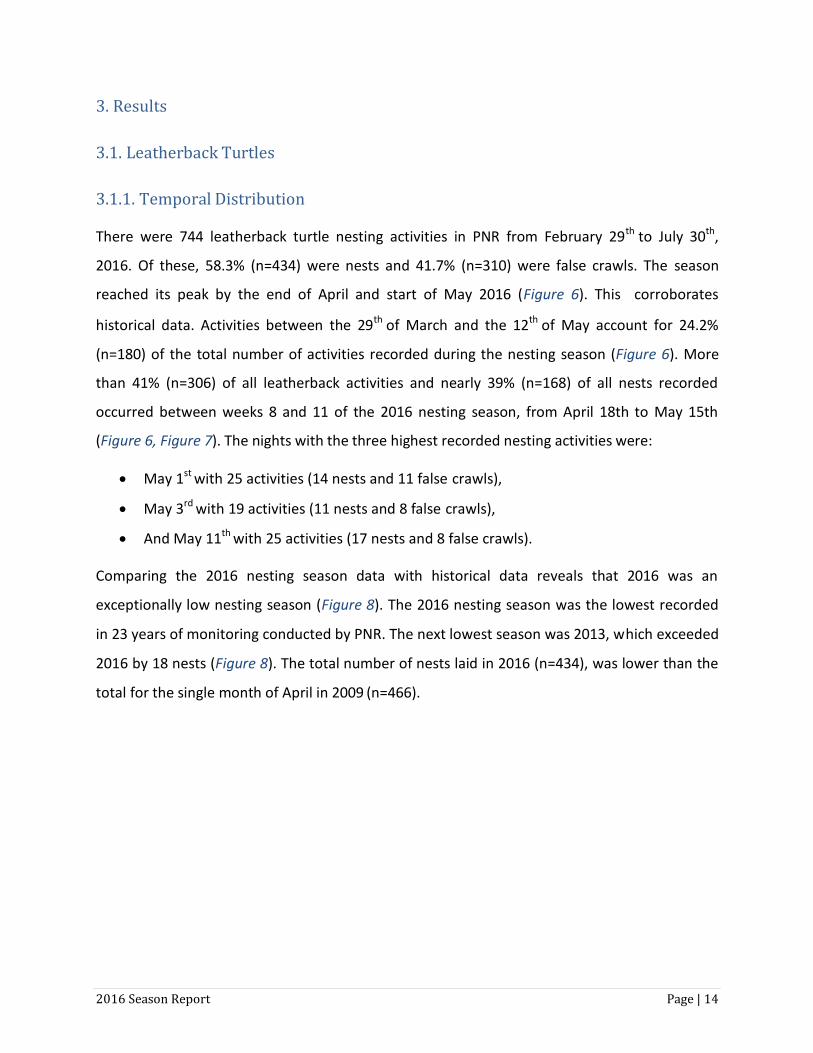
There were 744 leatherback turtle nesting activities in PNR from February 29th to July 30th,
2016. Of these, 58.3% (n=434) were nests and 41.7% (n=310) were false crawls. The season
reached its peak by the end of April and start of May 2016 (Figure 6). This corroborates
historical data. Activities between the 29th of March and the 12th of May account for 24.2%
(n=180) of the total number of activities recorded during the nesting season (Figure 6). More
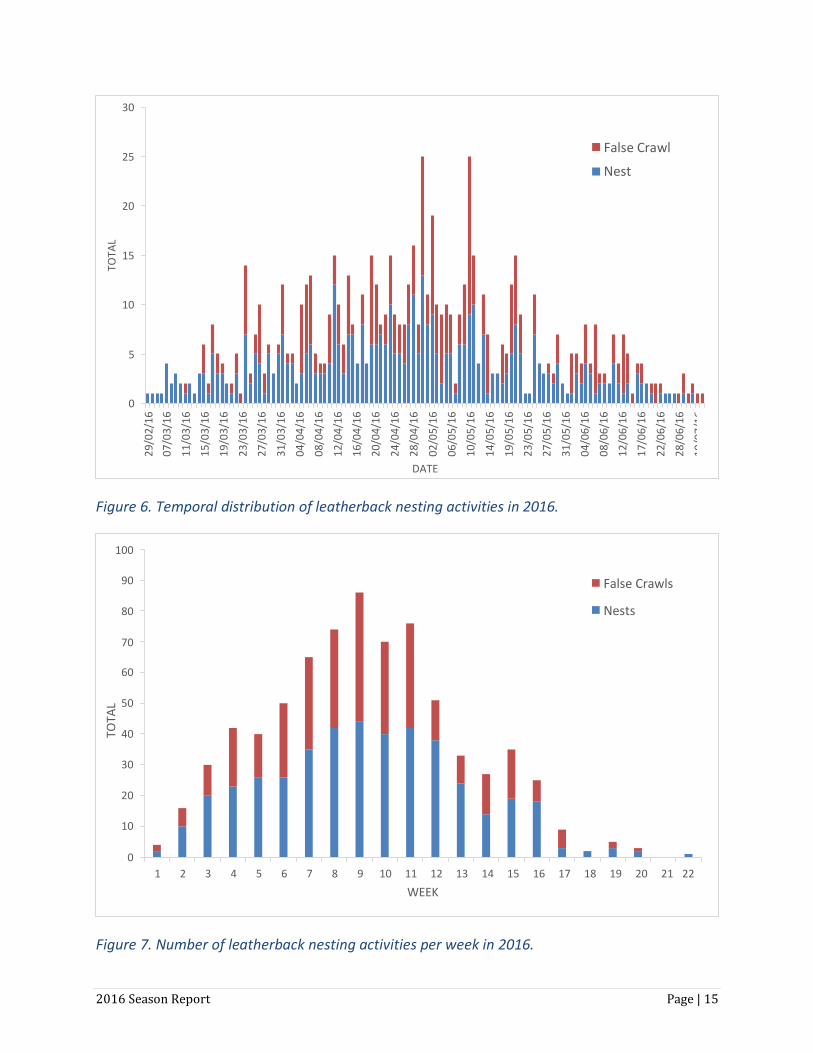
than 41% (n=306) of all leatherback activities and nearly 39% (n=168) of all nests recorded
occurred between weeks 8 and 11 of the 2016 nesting season, from April 18th to May 15th
(Figure 6, Figure 7). The nights with the three highest recorded nesting activities were:
May 1st with 25 activities (14 nests and 11 false crawls),
May 3rd with 19 activities (11 nests and 8 false crawls),
And May 11th with 25 activities (17 nests and 8 false crawls).
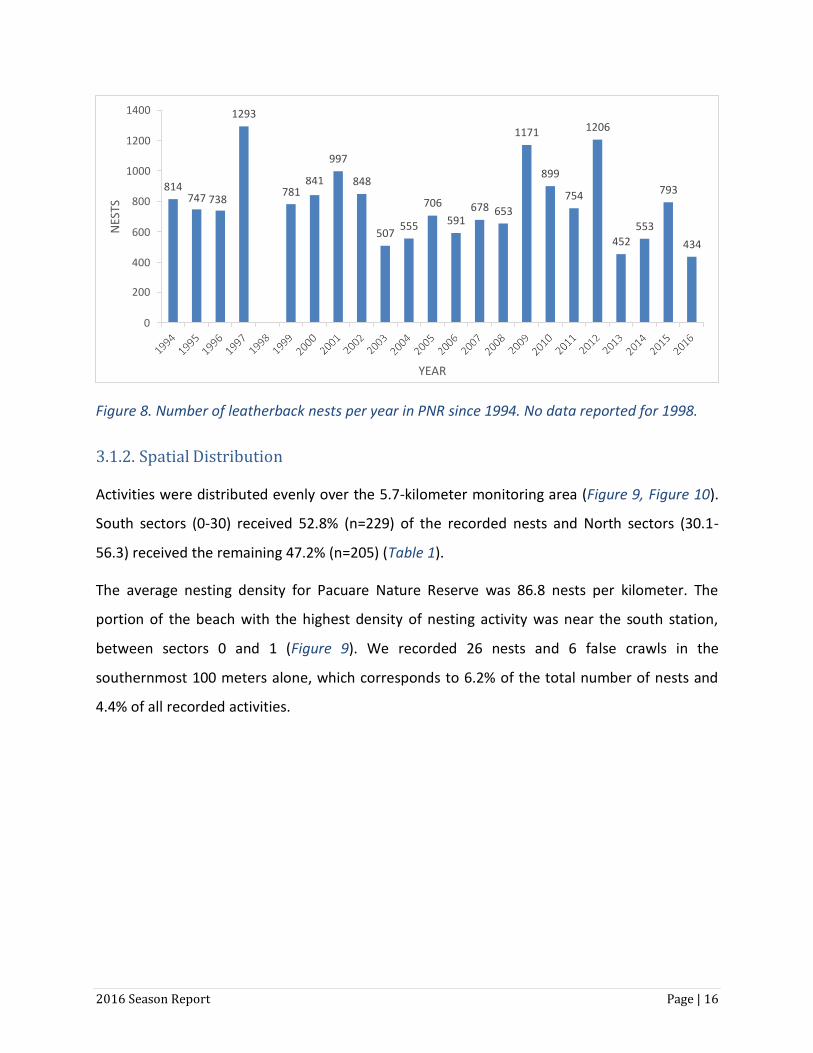
Comparing the 2016 nesting season data with historical data reveals that 2016 was an
exceptionally low nesting season (Figure 8). The 2016 nesting season was the lowest recorded
in 23 years of monitoring conducted by PNR. The next lowest season was 2013, which exceeded
2016 by 18 nests (Figure 8). The total number of nests laid in 2016 (n=434), was lower than the
total for the single month of April in 2009 (n=466).
2016 Season Report Page | 15
Figure 6. Temporal distribution of leatherback nesting activities in 2016.
Figure 7. Number of leatherback nesting activities per week in 2016.
TOTA
L 30
25 False Crawl
Nest
20
15
10
5
0
DATE
100
90 False Crawls
80 Nests
70 60
50
40
30
20
10
0
1 2 3 4 5 6 7 8 9 10 11 12 13 14 15 16 17 18 19 20 21 22
WEEK
TOTA
L
29/
02/
16
07/
03/
16
11/
03/
16
15/
03/
16
19/
03/
16
23/
03/
16
27/
03/
16
31/
03/
16
04/
04/
16
08/
04/
16
12/
04/
16
16/
04/
16
20/
04/
16
24/
04/
16
28/
04/
16
02/
05/
16
06/
05/
16
10/
05/
16
14/
05/
16
19/
05/
16
23/
05/
16
27/
05/
16
31/
05/
16
04/
06/
16
08/
06/
16
12/
06/
16
17/
06/
16
22/
06/
16
28/
06/
16
10/
07/
16
2016 Season Report Page | 16
Figure 8. Number of leatherback nests per year in PNR since 1994. No data reported for 1998.
3.1.2. Spatial Distribution
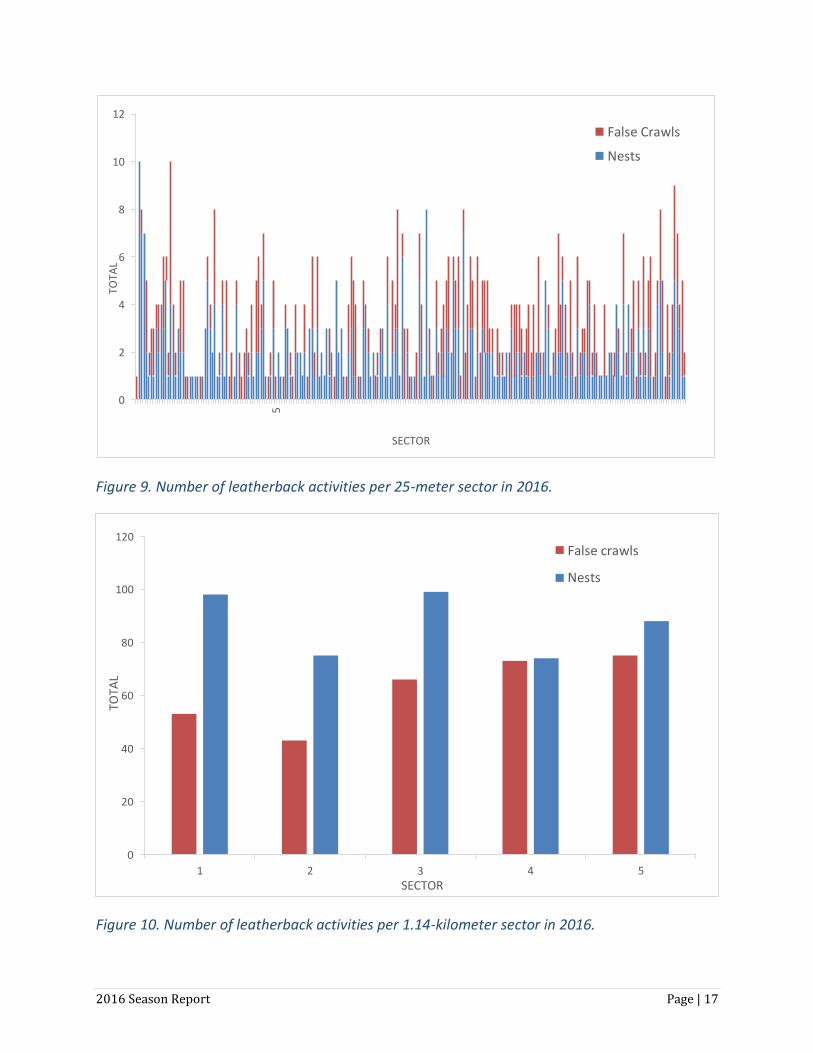
Activities were distributed evenly over the 5.7-kilometer monitoring area (Figure 9, Figure 10).
South sectors (0-30) received 52.8% (n=229) of the recorded nests and North sectors (30.1-
56.3) received the remaining 47.2% (n=205) (Table 1).
The average nesting density for Pacuare Nature Reserve was 86.8 nests per kilometer. The
portion of the beach with the highest density of nesting activity was near the south station,
between sectors 0 and 1 (Figure 9). We recorded 26 nests and 6 false crawls in the
southernmost 100 meters alone, which corresponds to 6.2% of the total number of nests and
4.4% of all recorded activities.
NES
TS
1400 1293
1200 1171 1206
997 1000 899
814 841
781 848
793 800 747 738 706
754 678 653
600 507 555 591 553
452 434
400 200
0
YEAR
2016 Season Report Page | 17
Figure 9. Number of leatherback activities per 25-meter sector in 2016.
Figure 10. Number of leatherback activities per 1.14-kilometer sector in 2016.
TOTA
L 12
False Crawls
10 Nests
8
6
4
2
0
SECTOR
120 False crawls
Nests 100
80
60
40
20
0
1 2 3 SECTOR
4 5
TOTA
L
0 . 0
1 , 2
3 , 1
5
6 , 2
7 , 3
9 , 3
1 1 , 3
1 3 , 2
1 5 , 3
1 7 , 2
1 9 , 1
2 1
2 2 , 2
2 4 , 2
2 6 , 2
2 8 , 1
3 0 , 2
3 2 , 1
3 3 , 4
3 5 , 2
3 7 , 1
3 9
4 0 , 3
4 2 , 3
4 4 , 2
4 6 , 1
4 8
4 9 , 3
5 1 , 2
5 3 , 1
5 4 , 4
5 6 , 2
2016 Season Report Page | 18
Table 1. Number and percent of leatherback activities per 1.14-kilometer sector in 2016.
Sector Nests % False
Crawls % Total %
1 98 22.6 53 17.1 151 20.3
2 75 17.3 43 13.9 118 15.9
3 99 22.8 66 21.3 165 22.2
4 74 17.1 73 23.5 147 19.8
5 88 20.3 75 24.2 163 21.9
3.1.3. Timing of Activity
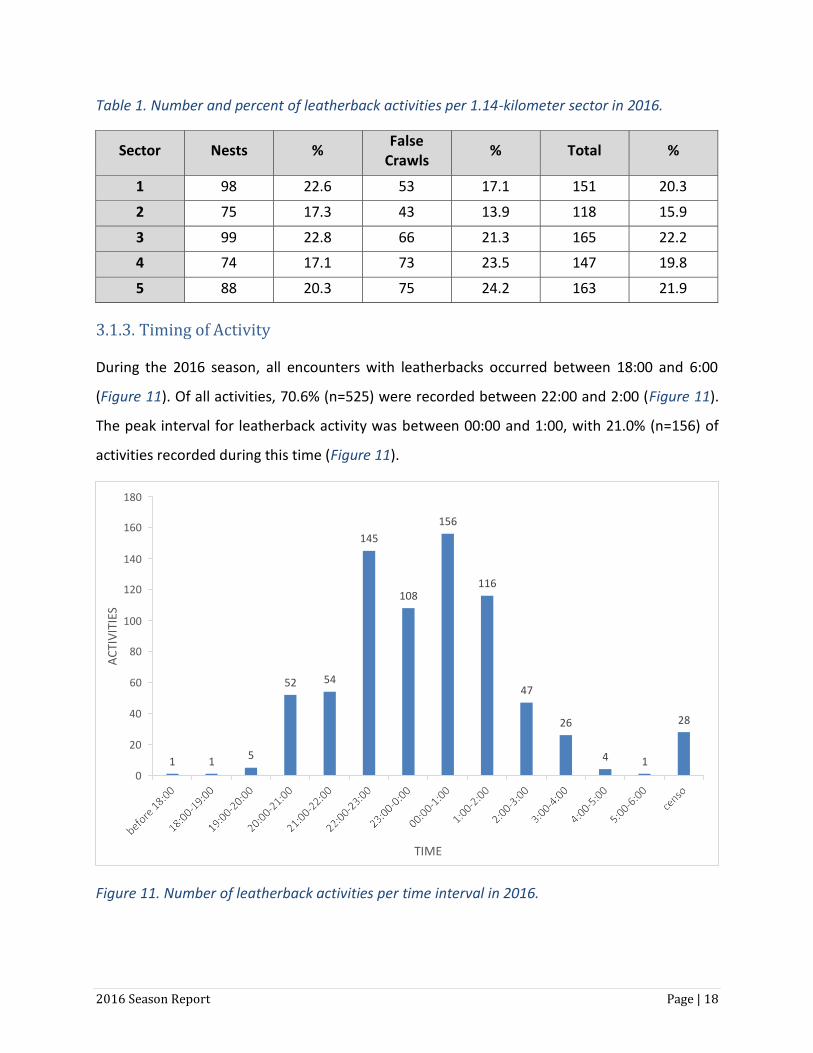
During the 2016 season, all encounters with leatherbacks occurred between 18:00 and 6:00
(Figure 11). Of all activities, 70.6% (n=525) were recorded between 22:00 and 2:00 (Figure 11).
The peak interval for leatherback activity was between 00:00 and 1:00, with 21.0% (n=156) of
activities recorded during this time (Figure 11).
Figure 11. Number of leatherback activities per time interval in 2016.
180
160
156
145
140
120
116 108
100
80
60 52 54
47
40 26 28
20
1 1 5 4 1
0
TIME
AC
TIV
ITIE
S
2016 Season Report Page | 19
3.1.4. Stage of Nesting Process
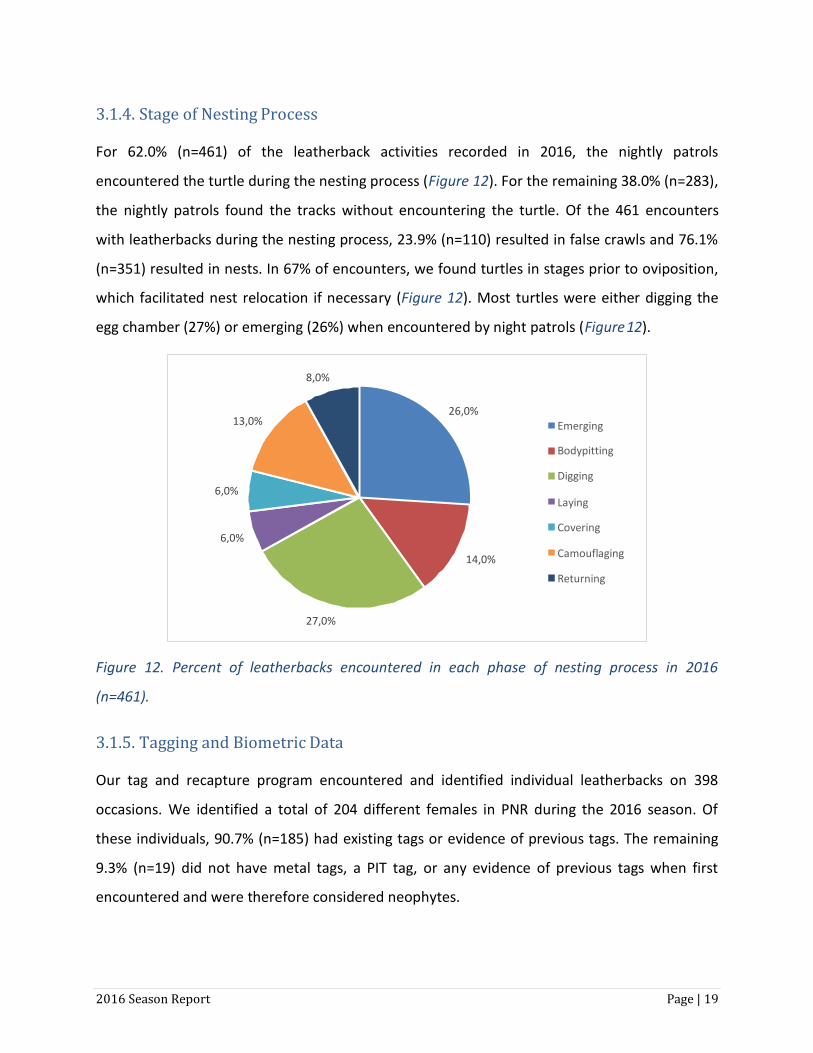
For 62.0% (n=461) of the leatherback activities recorded in 2016, the nightly patrols
encountered the turtle during the nesting process (Figure 12). For the remaining 38.0% (n=283),
the nightly patrols found the tracks without encountering the turtle. Of the 461 encounters
with leatherbacks during the nesting process, 23.9% (n=110) resulted in false crawls and 76.1%
(n=351) resulted in nests. In 67% of encounters, we found turtles in stages prior to oviposition,
which facilitated nest relocation if necessary (Figure 12). Most turtles were either digging the
egg chamber (27%) or emerging (26%) when encountered by night patrols (Figure 12).
Figure 12. Percent of leatherbacks encountered in each phase of nesting process in 2016
(n=461).
3.1.5. Tagging and Biometric Data
Our tag and recapture program encountered and identified individual leatherbacks on 398
occasions. We identified a total of 204 different females in PNR during the 2016 season. Of
these individuals, 90.7% (n=185) had existing tags or evidence of previous tags. The remaining
9.3% (n=19) did not have metal tags, a PIT tag, or any evidence of previous tags when first
encountered and were therefore considered neophytes.
8,0%
26,0% 13,0% Emerging
Bodypitting
Digging 6,0%
Laying
Covering 6,0%
14,0% Camouflaging
Returning
27,0%
2016 Season Report Page | 20
Each female laid an average of 2.0 nests. Of the individually identified turtles, 50.7% (n=110)
laid only one nest. One of the females tagged at the start of the season was encountered on 6
different occasions, 5 of which resulted in a nest.
We obtained a total of 330 CCL measurements and 329 CCW measurements for 171 different
individuals. Average CCL and CCW were 149.8 centimeters and 109.9 centimeters, respectively.
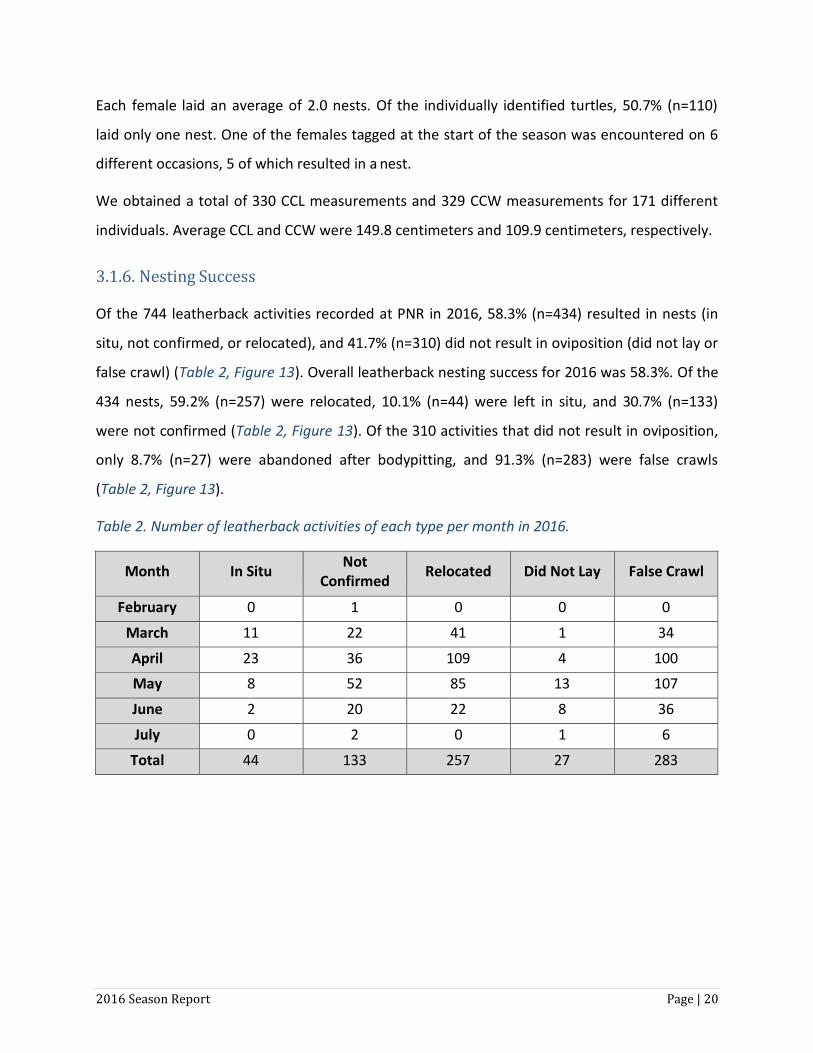
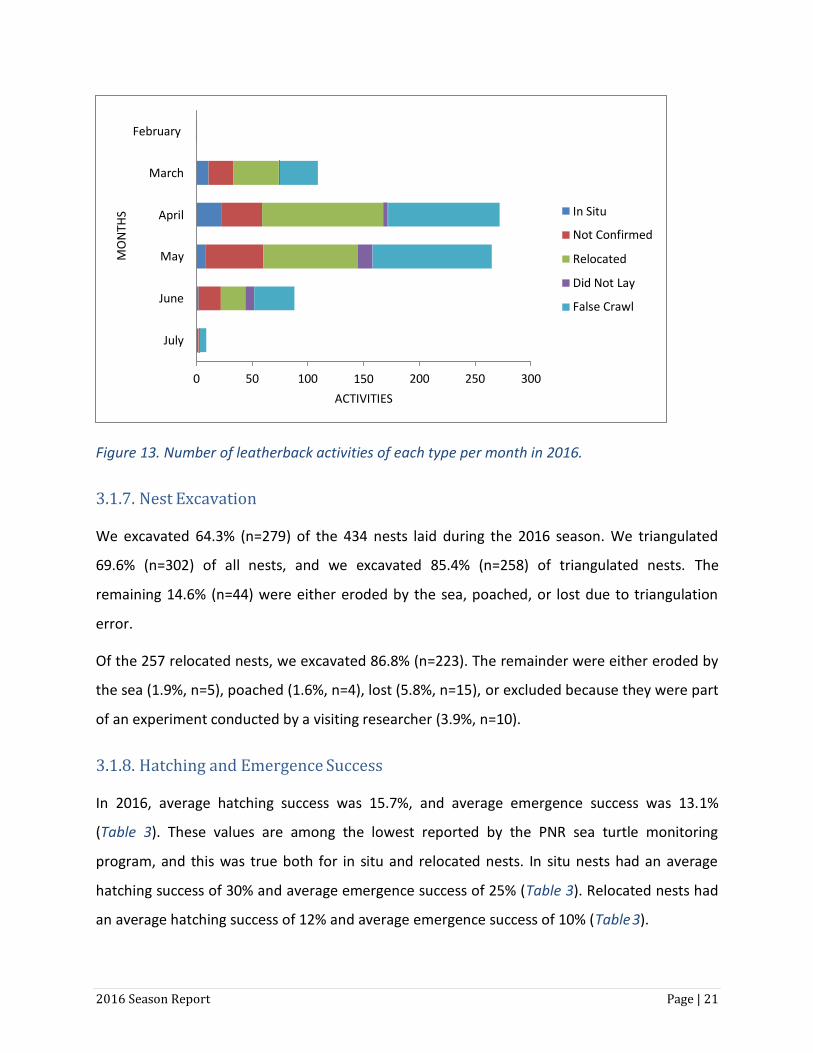
3.1.6. Nesting Success
Of the 744 leatherback activities recorded at PNR in 2016, 58.3% (n=434) resulted in nests (in
situ, not confirmed, or relocated), and 41.7% (n=310) did not result in oviposition (did not lay or
false crawl) (Table 2, Figure 13). Overall leatherback nesting success for 2016 was 58.3%. Of the
434 nests, 59.2% (n=257) were relocated, 10.1% (n=44) were left in situ, and 30.7% (n=133)
were not confirmed (Table 2, Figure 13). Of the 310 activities that did not result in oviposition,
only 8.7% (n=27) were abandoned after bodypitting, and 91.3% (n=283) were false crawls
(Table 2, Figure 13).
Table 2. Number of leatherback activities of each type per month in 2016.
Month In Situ Not
Confirmed Relocated Did Not Lay False Crawl
February 0 1 0 0 0
March 11 22 41 1 34
April 23 36 109 4 100
May 8 52 85 13 107
June 2 20 22 8 36
July 0 2 0 1 6
Total 44 133 257 27 283
2016 Season Report Page | 21
Figure 13. Number of leatherback activities of each type per month in 2016.
3.1.7. Nest Excavation
We excavated 64.3% (n=279) of the 434 nests laid during the 2016 season. We triangulated
69.6% (n=302) of all nests, and we excavated 85.4% (n=258) of triangulated nests. The
remaining 14.6% (n=44) were either eroded by the sea, poached, or lost due to triangulation
error.
Of the 257 relocated nests, we excavated 86.8% (n=223). The remainder were either eroded by
the sea (1.9%, n=5), poached (1.6%, n=4), lost (5.8%, n=15), or excluded because they were part
of an experiment conducted by a visiting researcher (3.9%, n=10).
3.1.8. Hatching and Emergence Success
In 2016, average hatching success was 15.7%, and average emergence success was 13.1%
(Table 3). These values are among the lowest reported by the PNR sea turtle monitoring
program, and this was true both for in situ and relocated nests. In situ nests had an average
hatching success of 30% and average emergence success of 25% (Table 3). Relocated nests had
an average hatching success of 12% and average emergence success of 10% (Table 3).
MO
NTH
S February
March
April
May
June
In Situ
Not Confirmed
Relocated
Did Not Lay
False Crawl
July
0 50 100 150
ACTIVITIES
200 250 300

2016 Season Report Page | 22
Table 3. Leatherback turtle nest contents and success per nest type in 2016.
Nest Type
Eggs
Hatched
Unhatched
Pipped Live
Pipped Dead
Average Hatching Success
(%)
Average Emergence
Success (%)
In-Situ 4320 1173 2969 27 151 30 25
Relocated 15863 1793 13787 28 255 12 10
Total 20183 2966 16756 55 406 15.7 13.1
We excavated a total of 20183 leatherback eggs, 14.5% (n=2915) of which hatched (Table 3).
Mean incubation period for leatherback nests was 63 days. Of the 16756 excavated eggs that
did not hatch, 55.4% (n=9279) had no visible embryo (undeveloped), and 26.6% (n=4451) had
an embryo in the first phase of development (Figure 14). The remaining phases of embryonic
development accounted for 10.9% (n=1821) of unhatched eggs, and we were unable to identify
7.2% (n=1205) of unhatched eggs (Figure 14).
Figure 14. Percent of unhatched leatherback eggs reaching each stage of embryonic
development in 2016 (n=16756).
Of the 16756 eggs that failed to hatch, 76.5% were recorded as cooked and 60.8% (n=10189)
were affected by fungus (Table 4). These were the two most important factors related to egg
4,58%
2,47%
3,81%
7,19%
55,38% 26,56%
Undeveloped
Phase 1
Phase 2
Phase 3
Phase 4
Undetermined

2016 Season Report Page | 23
failure and mortality in the 2016 nesting season. A relatively small percentage of unhatched
eggs were affected by other sources, with only 3.4% (n=573) by roots, 2.8% (n=464) by larvae,
0.96% (n=161) by ácaros, 0.29% (n=49) by crabs.
Table 4. Number and percent of leatherback eggs affected per stage of embryonic development
in 2016.
Phase Total Eggs
Larvae Cooked Fungus Crabs Roots Ácaros
Total % Total % Total % Total % Total % Total %
Undev. 9279 46 0.5 7974 85.9 6638 71.5 0 0.0 243 2.6 47 0.5
1 4451 25 0.6 3243 72.9 2038 45.8 1 0.0 88 2.0 23 0.5
2 639 12 1.9 461 72.1 302 47.3 3 0.5 46 7.2 20 3.1
3 414 23 5.6 290 70.0 239 57.7 0 0.0 28 6.8 9 2.2
4 768 38 4.9 513 66.8 423 55.1 1 0.1 58 7.6 8 1.0
Undet. 1205 320 26.6 335 27.8 549 45.6 44 3.7 110 9.1 54 4.5
Total 16756 464 2.8 12816 76.5 10189 60.8 49 0.29 573 3.4 161 0.96
2016 Season Report Page | 24
3.2. Hard-Shelled Turtles
3.2.1. Temporal Distribution
There were 152 nesting activities of hard-shelled turtle species in PNR from May 15th to
September 27th, 2016 (Table 5). Green turtles accounted for 95.4% (n=145) of hard-shelled
turtle nesting activity, and hawksbills accounted for only 4.6% (n=7) (Table 5). Green turtle
activity was recorded between June 26th and September 27th, and hawksbill activity was
recorded from May 15th to September 10th (Table 5).
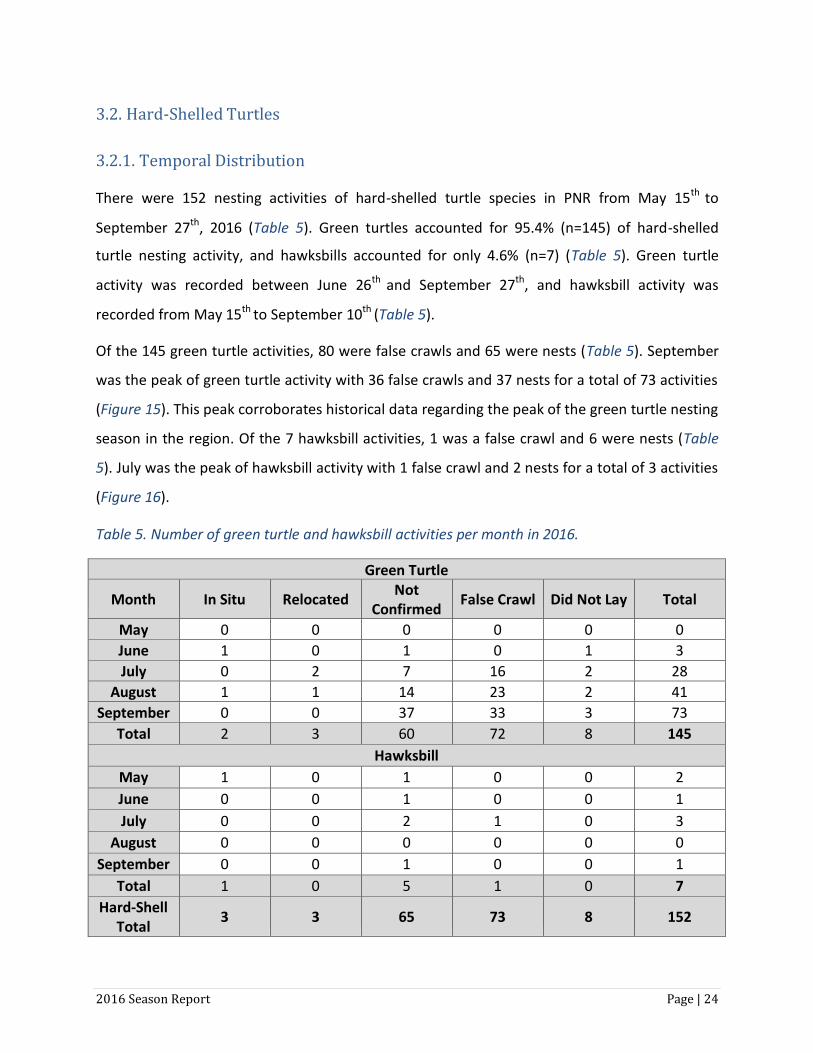
Of the 145 green turtle activities, 80 were false crawls and 65 were nests (Table 5). September
was the peak of green turtle activity with 36 false crawls and 37 nests for a total of 73 activities
(Figure 15). This peak corroborates historical data regarding the peak of the green turtle nesting
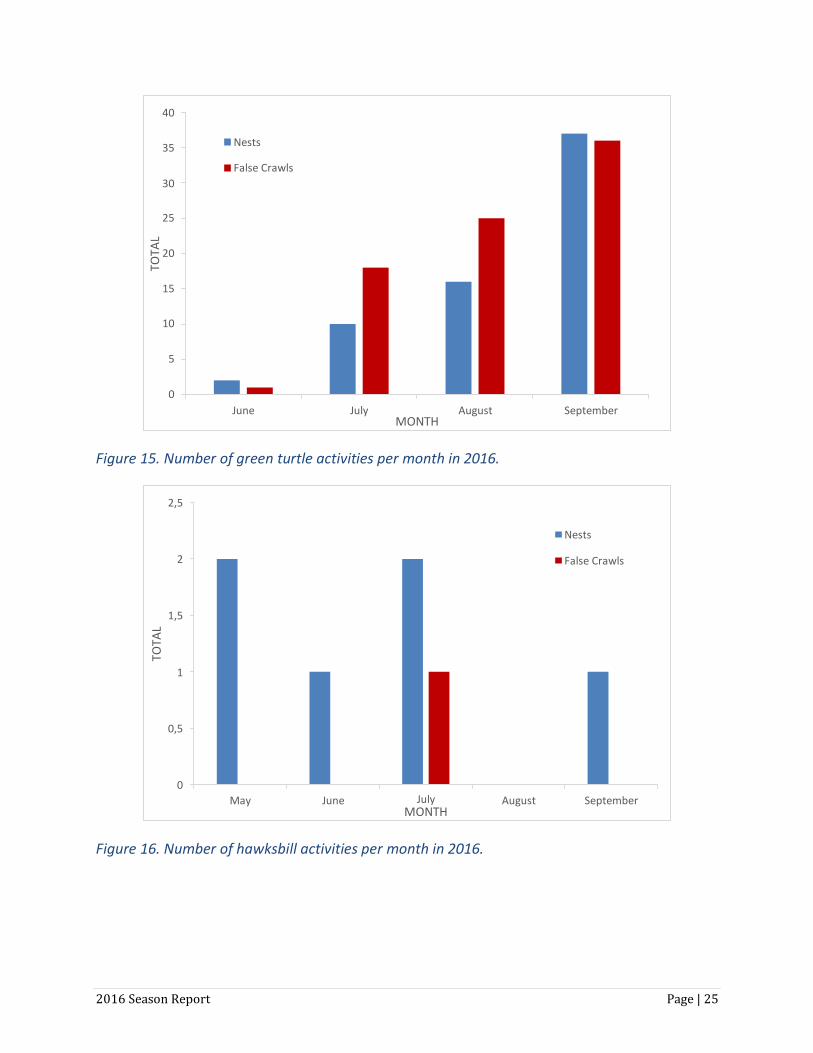
season in the region. Of the 7 hawksbill activities, 1 was a false crawl and 6 were nests (Table
5). July was the peak of hawksbill activity with 1 false crawl and 2 nests for a total of 3 activities
(Figure 16).
Table 5. Number of green turtle and hawksbill activities per month in 2016.
Green Turtle
Month In Situ Relocated Not
Confirmed False Crawl Did Not Lay Total
May 0 0 0 0 0 0
June 1 0 1 0 1 3
July 0 2 7 16 2 28
August 1 1 14 23 2 41
September 0 0 37 33 3 73
Total 2 3 60 72 8 145
Hawksbill
May 1 0 1 0 0 2
June 0 0 1 0 0 1
July 0 0 2 1 0 3
August 0 0 0 0 0 0
September 0 0 1 0 0 1
Total 1 0 5 1 0 7
Hard-Shell Total
3 3 65 73 8 152
2016 Season Report Page | 25
Figure 15. Number of green turtle activities per month in 2016.
Figure 16. Number of hawksbill activities per month in 2016.
TOTA
L
40
35 Nests
False Crawls
30
25
20
15
10
5
0
June July August September MONTH
2,5
Nests
2 False Crawls
1,5
1
0,5
0
May June July MONTH
August September
TOTA
L
2016 Season Report Page | 26
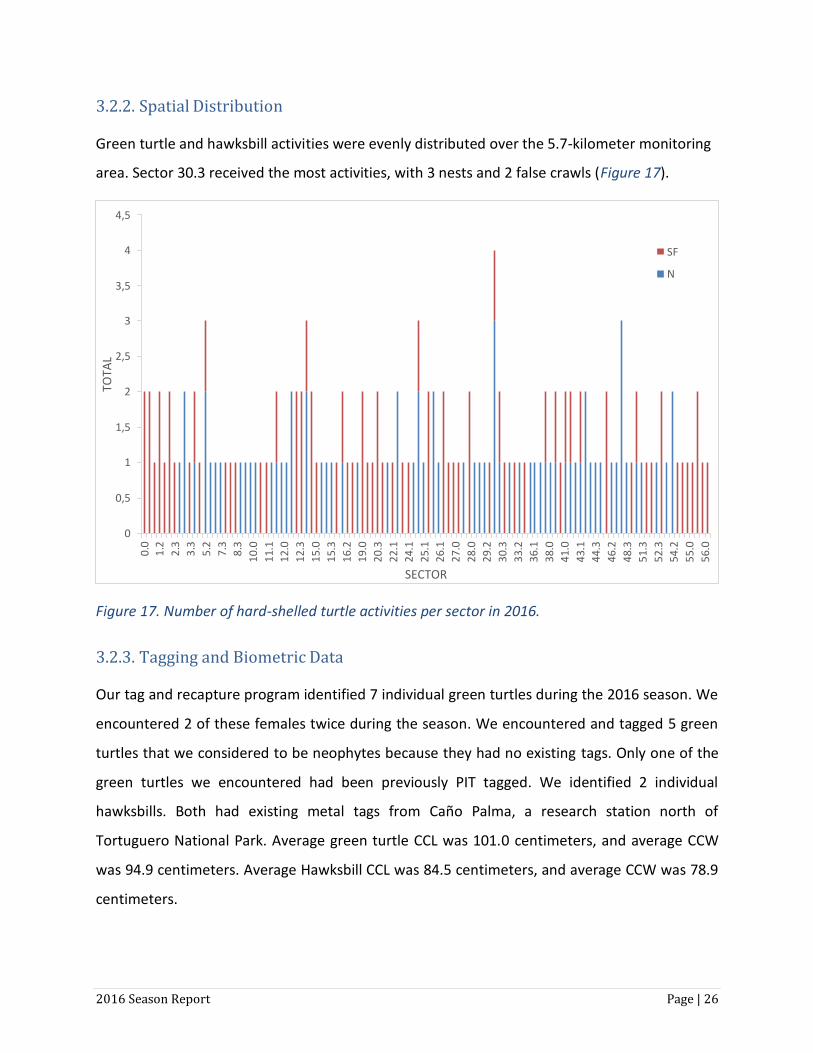
3.2.2. Spatial Distribution
Green turtle and hawksbill activities were evenly distributed over the 5.7-kilometer monitoring
area. Sector 30.3 received the most activities, with 3 nests and 2 false crawls (Figure 17).
Figure 17. Number of hard-shelled turtle activities per sector in 2016.
3.2.3. Tagging and Biometric Data
Our tag and recapture program identified 7 individual green turtles during the 2016 season. We
encountered 2 of these females twice during the season. We encountered and tagged 5 green
turtles that we considered to be neophytes because they had no existing tags. Only one of the
green turtles we encountered had been previously PIT tagged. We identified 2 individual
hawksbills. Both had existing metal tags from Caño Palma, a research station north of
Tortuguero National Park. Average green turtle CCL was 101.0 centimeters, and average CCW
was 94.9 centimeters. Average Hawksbill CCL was 84.5 centimeters, and average CCW was 78.9
centimeters.
4,5
4 SF
N 3,5
3
2,5
2
1,5
1
0,5
0
SECTOR
TOTA
L
0.0
1
.2
2.3
3.3
5.2
7.3
8.3
10.
0
11.
1
12.
0
12.
3
15.
0
15.
3
16.
2
19.
0
20.
3
22.
1
24.
1
25.
1
26.
1
27.
0
28.
0
29.
2
30.
3
33.
2
36.
1
38.
0
41.
0
43.
1
44.
3
46.
2
48.
3
51.
3
52.
3
54.
2
55.
0
56.
0
56.
3
2016 Season Report Page | 27
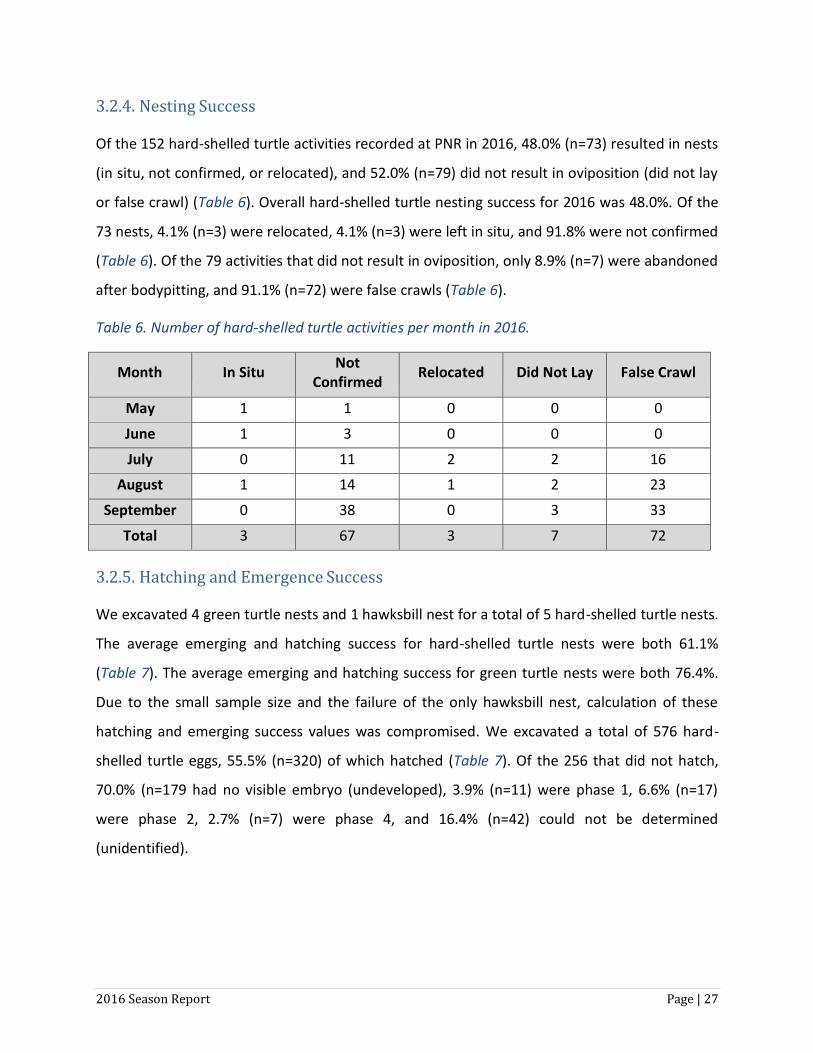
3.2.4. Nesting Success
Of the 152 hard-shelled turtle activities recorded at PNR in 2016, 48.0% (n=73) resulted in nests
(in situ, not confirmed, or relocated), and 52.0% (n=79) did not result in oviposition (did not lay
or false crawl) (Table 6). Overall hard-shelled turtle nesting success for 2016 was 48.0%. Of the
73 nests, 4.1% (n=3) were relocated, 4.1% (n=3) were left in situ, and 91.8% were not confirmed
(Table 6). Of the 79 activities that did not result in oviposition, only 8.9% (n=7) were abandoned
after bodypitting, and 91.1% (n=72) were false crawls (Table 6).
Table 6. Number of hard-shelled turtle activities per month in 2016.
Month In Situ Not
Confirmed Relocated Did Not Lay False Crawl
May 1 1 0 0 0
June 1 3 0 0 0
July 0 11 2 2 16
August 1 14 1 2 23
September 0 38 0 3 33
Total 3 67 3 7 72
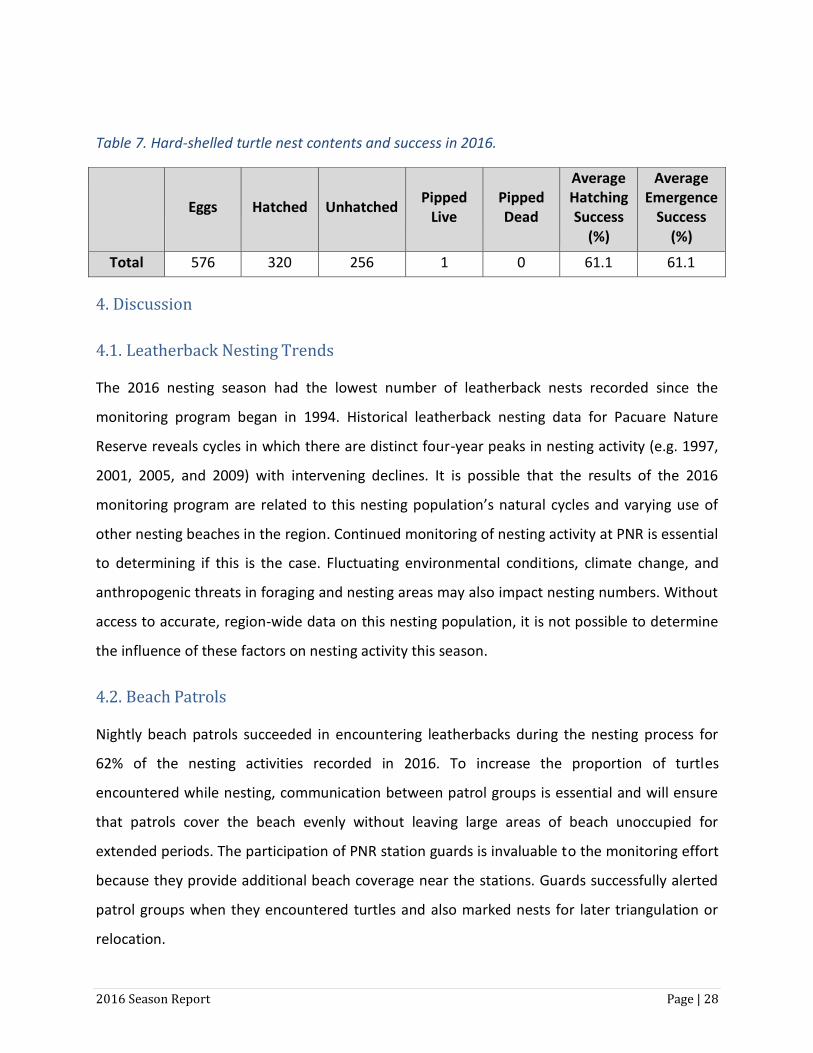
3.2.5. Hatching and Emergence Success
We excavated 4 green turtle nests and 1 hawksbill nest for a total of 5 hard-shelled turtle nests.
The average emerging and hatching success for hard-shelled turtle nests were both 61.1%
(Table 7). The average emerging and hatching success for green turtle nests were both 76.4%.
Due to the small sample size and the failure of the only hawksbill nest, calculation of these
hatching and emerging success values was compromised. We excavated a total of 576 hard-
shelled turtle eggs, 55.5% (n=320) of which hatched (Table 7). Of the 256 that did not hatch,
70.0% (n=179 had no visible embryo (undeveloped), 3.9% (n=11) were phase 1, 6.6% (n=17)
were phase 2, 2.7% (n=7) were phase 4, and 16.4% (n=42) could not be determined
(unidentified).
2016 Season Report Page | 28
Table 7. Hard-shelled turtle nest contents and success in 2016.
Eggs
Hatched
Unhatched
Pipped
Live
Pipped Dead
Average Hatching Success
(%)
Average Emergence
Success (%)
Total 576 320 256 1 0 61.1 61.1
4. Discussion
4.1. Leatherback Nesting Trends
The 2016 nesting season had the lowest number of leatherback nests recorded since the
monitoring program began in 1994. Historical leatherback nesting data for Pacuare Nature
Reserve reveals cycles in which there are distinct four-year peaks in nesting activity (e.g. 1997,
2001, 2005, and 2009) with intervening declines. It is possible that the results of the 2016
monitoring program are related to this nesting population’s natural cycles and varying use of
other nesting beaches in the region. Continued monitoring of nesting activity at PNR is essential
to determining if this is the case. Fluctuating environmental conditions, climate change, and
anthropogenic threats in foraging and nesting areas may also impact nesting numbers. Without
access to accurate, region-wide data on this nesting population, it is not possible to determine
the influence of these factors on nesting activity this season.
4.2. Beach Patrols
Nightly beach patrols succeeded in encountering leatherbacks during the nesting process for
62% of the nesting activities recorded in 2016. To increase the proportion of turtles
encountered while nesting, communication between patrol groups is essential and will ensure
that patrols cover the beach evenly without leaving large areas of beach unoccupied for
extended periods. The participation of PNR station guards is invaluable to the monitoring effort
because they provide additional beach coverage near the stations. Guards successfully alerted
patrol groups when they encountered turtles and also marked nests for later triangulation or
relocation.
2016 Season Report Page | 29
4.3. Mark and Recapture Program
In addition to having the lowest number of leatherback nests recorded in 23 years of
monitoring, there were few new recruits to the nesting population in 2016. Fewer than 10% of
individually identified leatherbacks were neophytes, despite regional trends showing increasing
numbers of new females. Continued monitoring of nesting activity at PNR is necessary to
determine if this finding is simply part of normal fluctuation in the nesting population.
4.4. Egg Poaching
Four leatherback nests were poached during the 2016 nesting season. Though this is a vast
improvement from poaching rates before the monitoring project began, these 4 nests
represent nearly 1% of the total number laid during the 2016 season. Despite the best efforts
and protection provided by PNR station guards, PNR staff were disturbed on several occasions
by people from outside the Reserve walking on the beach at night. It is imperative that the
Coast Guard continues to assist with sea turtle protection inside Pacuare Nature Reserve by
patrolling the beach and arresting poachers.
4.5. Nest Relocation and Triangulation
Based on the experience of previous seasons at PNR, we relocated nearly 60% of leatherback
nests this season due to concerns over severe erosion. However, beach erosion this season was
not as severe as anticipated. Additionally, this was an atypically hot and dry season, which
negatively affected nests that had been relocated further from the waterline to reduce risk of
loss due to erosion. Hatching success of nests left in situ was double the hatching success of
relocated nests. Hatching and emerging success might be improved in future seasons by leaving
a greater proportion of nests in situ and by relocating nests as close to the original nesting site
as possible.
We triangulated nearly 70% of the leatherback nests laid in 2016. This high value reflects both
the successful efforts of PNR staff and the unfortunately low nesting numbers this season.
2016 Season Report Page | 30
4.6. Eroded and Lost Nests
Beach erosion was responsible for the failure of less than 2% of leatherback nests during the
2016 season. Only 5 nests were eroded, which reflects the success of our relocation program in
moving nests away from high-risk erosion-prone areas.
Lost nests were the result of lack of coordination between the patrol leader that marked the
nest and the excavation team attempting to recover it and/or measurement error during
triangulation. Triangulation techniques should be further emphasized during the intensive
training course provided to field assistants at the start of the season.
4.7. Green Turtle Season
There was not a single green turtle poaching event at PNR this season. This is in part thanks to
PNR being the only research station in the area that continues to work full time during green
turtle nesting season. Poachers likely target areas to the south or north of the Reserve.
Green turtle monitoring at PNR would benefit from efforts to compile and enter green turtle
data in a digital database. The digital record of monitoring is incomplete, and efforts need to be
made to update and maintain this important record. Regional research efforts and other
specialist groups working in the Caribbean would also benefit from the availability of this
information, as would the sea turtles we are all working to protect.
2016 Season Report Page | 31
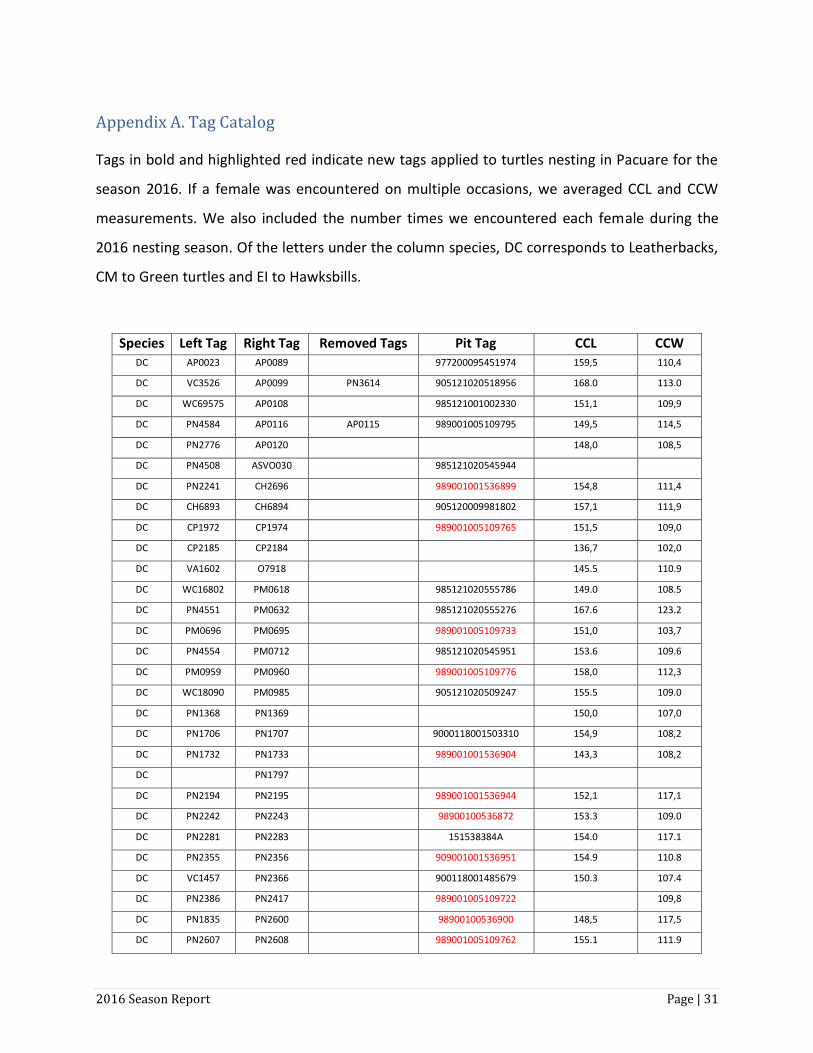
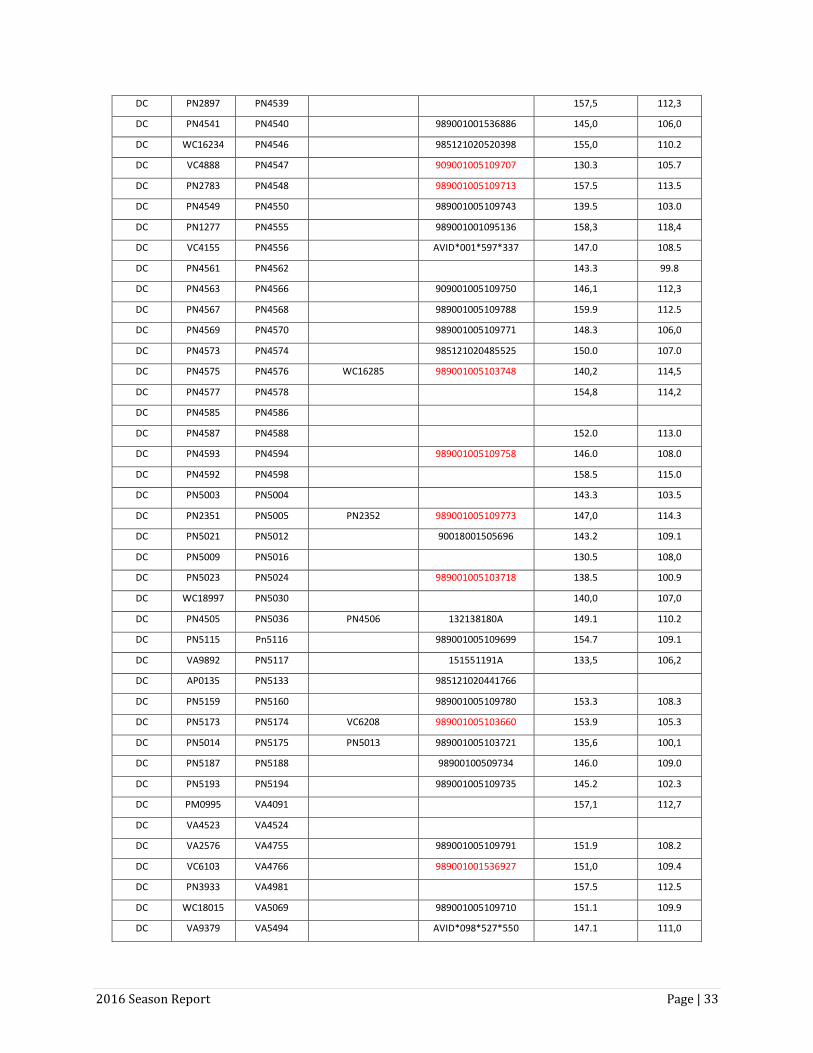
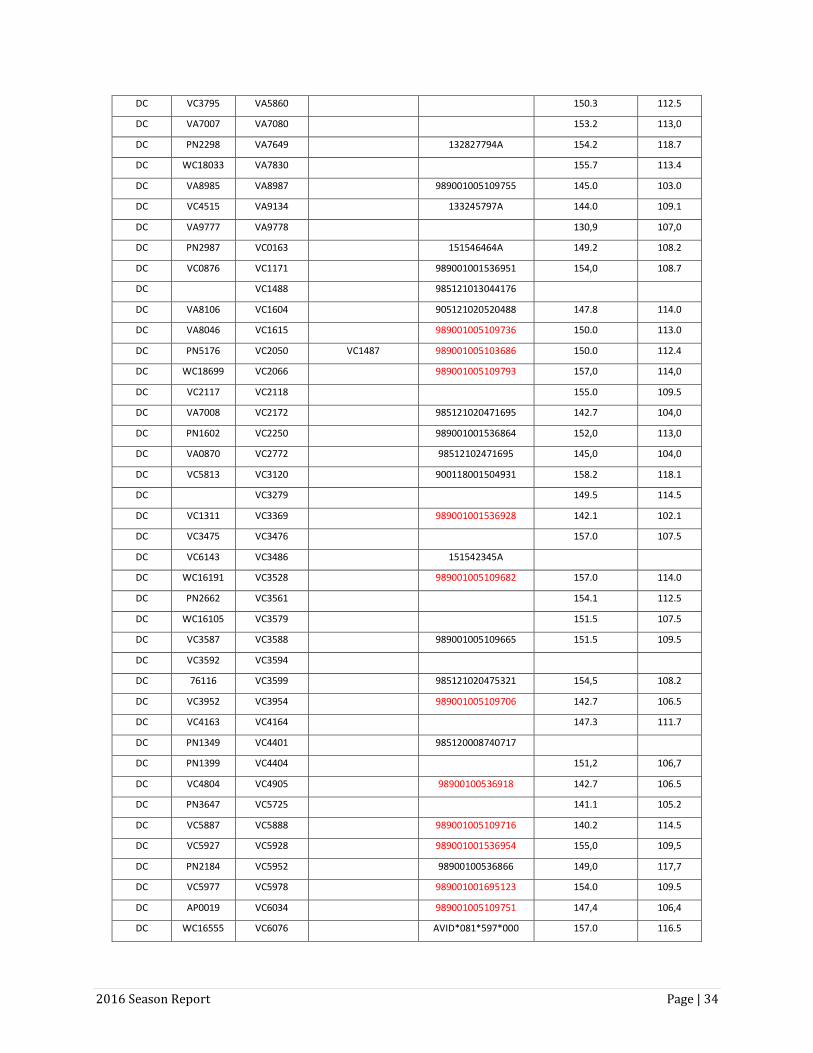
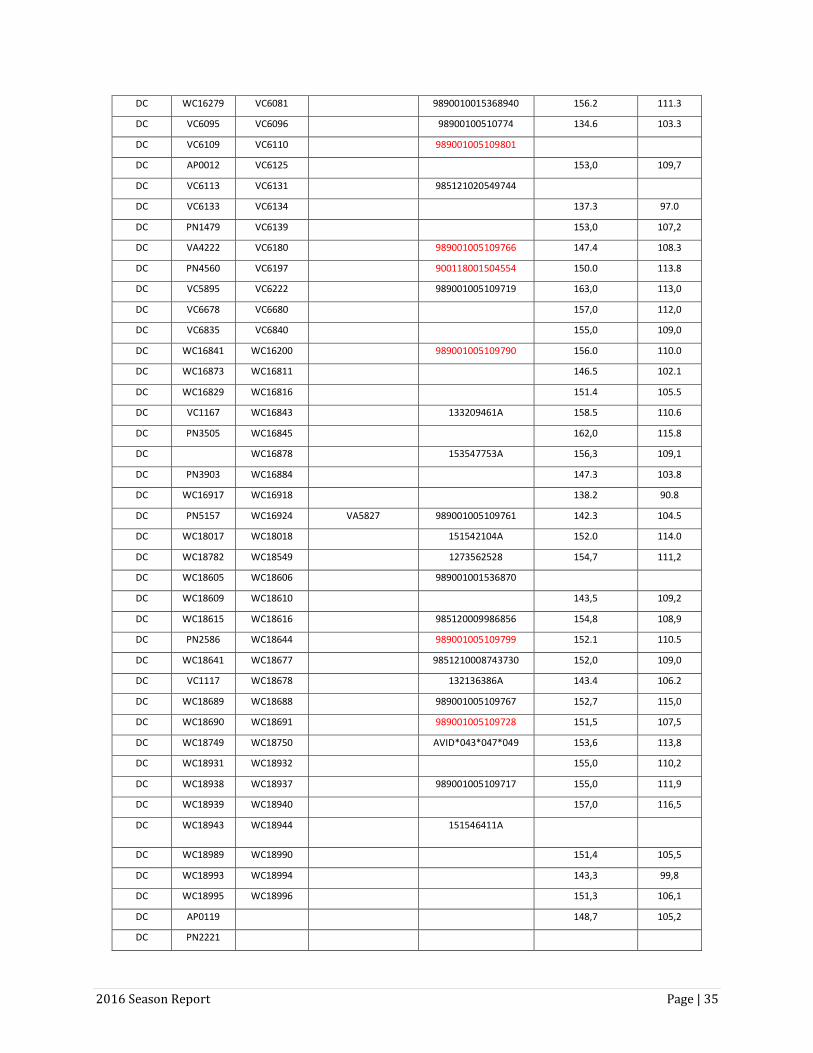
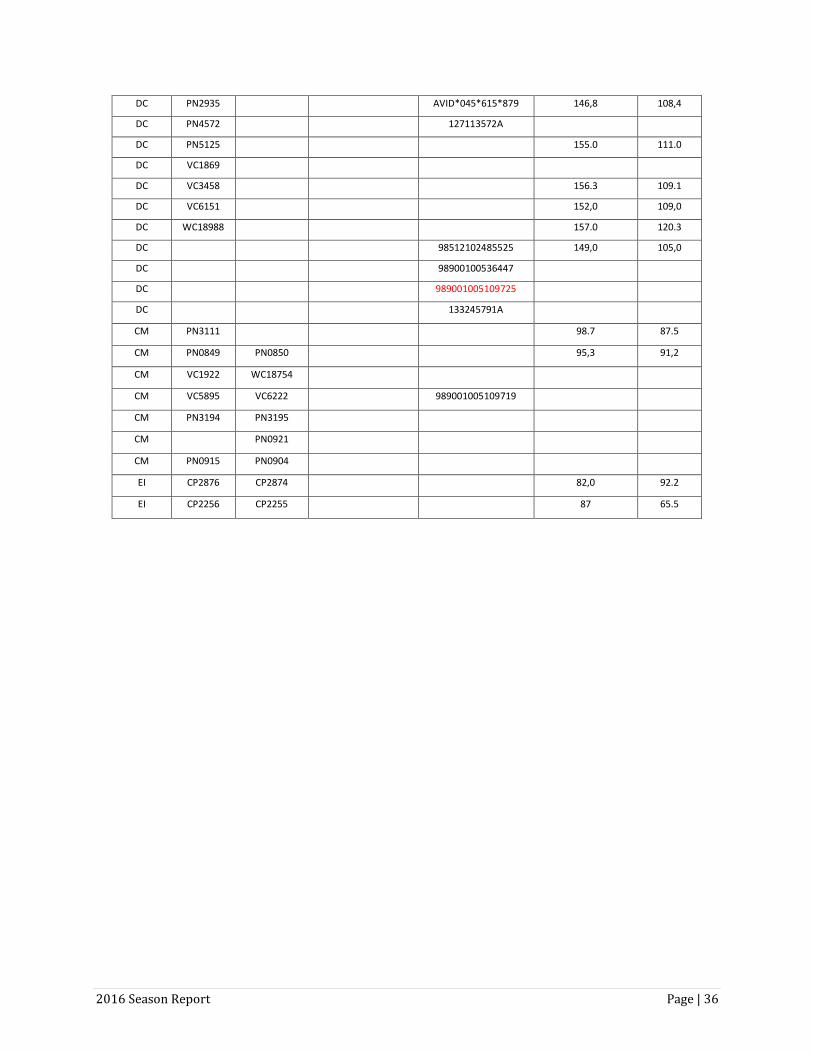
Appendix A. Tag Catalog
Tags in bold and highlighted red indicate new tags applied to turtles nesting in Pacuare for the
season 2016. If a female was encountered on multiple occasions, we averaged CCL and CCW
measurements. We also included the number times we encountered each female during the
2016 nesting season. Of the letters under the column species, DC corresponds to Leatherbacks,
CM to Green turtles and EI to Hawksbills.
Species Left Tag Right Tag Removed Tags Pit Tag CCL CCW
DC AP0023 AP0089 977200095451974 159,5 110,4
DC VC3526 AP0099 PN3614 905121020518956 168.0 113.0
DC WC69575 AP0108 985121001002330 151,1 109,9
DC PN4584 AP0116 AP0115 989001005109795 149,5 114,5
DC PN2776 AP0120 148,0 108,5
DC PN4508 ASVO030 985121020545944 DC PN2241 CH2696 989001001536899 154,8 111,4
DC CH6893 CH6894 905120009981802 157,1 111,9
DC CP1972 CP1974 989001005109765 151,5 109,0
DC CP2185 CP2184 136,7 102,0
DC VA1602 O7918 145.5 110.9
DC WC16802 PM0618 985121020555786 149.0 108.5
DC PN4551 PM0632 985121020555276 167.6 123.2
DC PM0696 PM0695 989001005109733 151,0 103,7
DC PN4554 PM0712 985121020545951 153.6 109.6
DC PM0959 PM0960 989001005109776 158,0 112,3
DC WC18090 PM0985 905121020509247 155.5 109.0
DC PN1368 PN1369 150,0 107,0
DC PN1706 PN1707 9000118001503310 154,9 108,2
DC PN1732 PN1733 989001001536904 143,3 108,2
DC PN1797 DC PN2194 PN2195 989001001536944 152,1 117,1
DC PN2242 PN2243 98900100536872 153.3 109.0
DC PN2281 PN2283 151538384A 154.0 117.1
DC PN2355 PN2356 909001001536951 154.9 110.8
DC VC1457 PN2366 900118001485679 150.3 107.4
DC PN2386 PN2417 989001005109722 109,8
DC PN1835 PN2600 98900100536900 148,5 117,5
DC PN2607 PN2608 989001005109762 155.1 111.9

2016 Season Report Page | 32
DC PN5029 PN2725 900118001505324 152.5 109.5
DC PN2771 PN2772 989001001536862 154,0 111.5
DC PN2843 PN2844 900118001506225 155,7 111,8
DC PN1794 PN2864 989001005109789 142,3 108,2
DC PN2885 PN2886 989001001536917 154,9 110,8
DC VC5806 PN2893 989001005109797 157.9 113.7
DC VC6123 PN3553 143.5 109.2
DC PN3949 PN3559 989001001536877 147.1 111,0
DC PN3611 PN3612 989001005109702 148,0 103.5
DC WC16186 PN3648 9890010015366860 128,0 103.5
DC WC18941 PN3660 132339453A 150,8 109,7
DC PN3678 152,5 113,7
DC VC6126 PN3679 126509692A 155,0 109,0
DC PN3682 PN3684 989001005109724 154.0 116.0
DC PM0471 PN3685 PM0472 98900100509800 151,9 110,7
DC VC6179 PN3706 PN3701 989001001536948 164,0 DC PN3721 PN3722 985121020475003 131.0 108.7
DC VA9869 PN3753 989001001536947 130,5 108,0
DC PN2319 PN3796 VA7495 989001001536890 149.2 102.5
DC PN3831 PN3832 909001005109783 148,0 103,3
DC PN3841 PN3842 989001005109732 145.5 97.9
DC VA4913 PN3904 989001005109390 152.8 113.0
DC PN3911 PN3912 989001005109769 141.4 102.3
DC PN5158 PN3914 PN3774 989001001536876 158,0 105.4
DC VA4053 PN3915 989001001536930 140.3 104.2
DC PN2193 PN3916 989001005109792 158.9 111.1
DC PN2401 PN3918 989001001536953 150,5 101,0
DC VA4895 PN3934 989001005109714 156.0 113.0
DC PN1546 PN3950 127239614A DC PN3951 PN3952 989001005109764 142.3 103.2
DC PN3991 PN3992 909001001536910 155,7 113,4
DC PN4501 PN4502 AVID*043*038*338* 138,0 105,0
DC PN1817 PN4507 985121020437029 145,0 110,0
DC PN4513 PN4514 135.6 100.1
DC PN4515 PN4516 985121020437480 152,0 114,0
DC PN4519 PN4520 15142747A 153,3 113,8
DC PN0659 PN4521 155,0 113,5
DC PN1724 PN4523 989001001536957 155,2 109,3
DC PN4535 PN4524 989001005109708 140.0 108.0
DC PN4529 PN4530 DC PN4537 PN4538 989001005109729 142,0 106,0
2016 Season Report Page | 33
DC PN2897 PN4539 157,5 112,3
DC PN4541 PN4540 989001001536886 145,0 106,0
DC WC16234 PN4546 985121020520398 155,0 110.2
DC VC4888 PN4547 909001005109707 130.3 105.7
DC PN2783 PN4548 989001005109713 157.5 113.5
DC PN4549 PN4550 989001005109743 139.5 103.0
DC PN1277 PN4555 989001001095136 158,3 118,4
DC VC4155 PN4556 AVID*001*597*337 147.0 108.5
DC PN4561 PN4562 143.3 99.8
DC PN4563 PN4566 909001005109750 146,1 112,3
DC PN4567 PN4568 989001005109788 159.9 112.5
DC PN4569 PN4570 989001005109771 148.3 106,0
DC PN4573 PN4574 985121020485525 150.0 107.0
DC PN4575 PN4576 WC16285 989001005103748 140,2 114,5
DC PN4577 PN4578 154,8 114,2
DC PN4585 PN4586 DC PN4587 PN4588 152.0 113.0
DC PN4593 PN4594 989001005109758 146.0 108.0
DC PN4592 PN4598 158.5 115.0
DC PN5003 PN5004 143.3 103.5
DC PN2351 PN5005 PN2352 989001005109773 147,0 114.3
DC PN5021 PN5012 90018001505696 143.2 109.1
DC PN5009 PN5016 130.5 108,0
DC PN5023 PN5024 989001005103718 138.5 100.9
DC WC18997 PN5030 140,0 107,0
DC PN4505 PN5036 PN4506 132138180A 149.1 110.2
DC PN5115 Pn5116 989001005109699 154.7 109.1
DC VA9892 PN5117 151551191A 133,5 106,2
DC AP0135 PN5133 985121020441766 DC PN5159 PN5160 989001005109780 153.3 108.3
DC PN5173 PN5174 VC6208 989001005103660 153.9 105.3
DC PN5014 PN5175 PN5013 989001005103721 135,6 100,1
DC PN5187 PN5188 98900100509734 146.0 109.0
DC PN5193 PN5194 989001005109735 145.2 102.3
DC PM0995 VA4091 157,1 112,7
DC VA4523 VA4524 DC VA2576 VA4755 989001005109791 151.9 108.2
DC VC6103 VA4766 989001001536927 151,0 109.4
DC PN3933 VA4981 157.5 112.5
DC WC18015 VA5069 989001005109710 151.1 109.9
DC VA9379 VA5494 AVID*098*527*550 147.1 111,0
2016 Season Report Page | 34
DC VC3795 VA5860 150.3 112.5
DC VA7007 VA7080 153.2 113,0
DC PN2298 VA7649 132827794A 154.2 118.7
DC WC18033 VA7830 155.7 113.4
DC VA8985 VA8987 989001005109755 145.0 103.0
DC VC4515 VA9134 133245797A 144.0 109.1
DC VA9777 VA9778 130,9 107,0
DC PN2987 VC0163 151546464A 149.2 108.2
DC VC0876 VC1171 989001001536951 154,0 108.7
DC VC1488 985121013044176 DC VA8106 VC1604 905121020520488 147.8 114.0
DC VA8046 VC1615 989001005109736 150.0 113.0
DC PN5176 VC2050 VC1487 989001005103686 150.0 112.4
DC WC18699 VC2066 989001005109793 157,0 114,0
DC VC2117 VC2118 155.0 109.5
DC VA7008 VC2172 985121020471695 142.7 104,0
DC PN1602 VC2250 989001001536864 152,0 113,0
DC VA0870 VC2772 98512102471695 145,0 104,0
DC VC5813 VC3120 900118001504931 158.2 118.1
DC VC3279 149.5 114.5
DC VC1311 VC3369 989001001536928 142.1 102.1
DC VC3475 VC3476 157.0 107.5
DC VC6143 VC3486 151542345A DC WC16191 VC3528 989001005109682 157.0 114.0
DC PN2662 VC3561 154.1 112.5
DC WC16105 VC3579 151.5 107.5
DC VC3587 VC3588 989001005109665 151.5 109.5
DC VC3592 VC3594 DC 76116 VC3599 985121020475321 154,5 108.2
DC VC3952 VC3954 989001005109706 142.7 106.5
DC VC4163 VC4164 147.3 111.7
DC PN1349 VC4401 985120008740717 DC PN1399 VC4404 151,2 106,7
DC VC4804 VC4905 98900100536918 142.7 106.5
DC PN3647 VC5725 141.1 105.2
DC VC5887 VC5888 989001005109716 140.2 114.5
DC VC5927 VC5928 989001001536954 155,0 109,5
DC PN2184 VC5952 98900100536866 149,0 117,7
DC VC5977 VC5978 989001001695123 154.0 109.5
DC AP0019 VC6034 989001005109751 147,4 106,4
DC WC16555 VC6076 AVID*081*597*000 157.0 116.5
2016 Season Report Page | 35
DC WC16279 VC6081 9890010015368940 156.2 111.3
DC VC6095 VC6096 98900100510774 134.6 103.3
DC VC6109 VC6110 989001005109801 DC AP0012 VC6125 153,0 109,7
DC VC6113 VC6131 985121020549744 DC VC6133 VC6134 137.3 97.0
DC PN1479 VC6139 153,0 107,2
DC VA4222 VC6180 989001005109766 147.4 108.3
DC PN4560 VC6197 900118001504554 150.0 113.8
DC VC5895 VC6222 989001005109719 163,0 113,0
DC VC6678 VC6680 157,0 112,0
DC VC6835 VC6840 155,0 109,0
DC WC16841 WC16200 989001005109790 156.0 110.0
DC WC16873 WC16811 146.5 102.1
DC WC16829 WC16816 151.4 105.5
DC VC1167 WC16843 133209461A 158.5 110.6
DC PN3505 WC16845 162,0 115.8
DC WC16878 153547753A 156,3 109,1
DC PN3903 WC16884 147.3 103.8
DC WC16917 WC16918 138.2 90.8
DC PN5157 WC16924 VA5827 989001005109761 142.3 104.5
DC WC18017 WC18018 151542104A 152.0 114.0
DC WC18782 WC18549 1273562528 154,7 111,2
DC WC18605 WC18606 989001001536870 DC WC18609 WC18610 143,5 109,2
DC WC18615 WC18616 985120009986856 154,8 108,9
DC PN2586 WC18644 989001005109799 152.1 110.5
DC WC18641 WC18677 9851210008743730 152,0 109,0
DC VC1117 WC18678 132136386A 143.4 106.2
DC WC18689 WC18688 989001005109767 152,7 115,0
DC WC18690 WC18691 989001005109728 151,5 107,5
DC WC18749 WC18750 AVID*043*047*049 153,6 113,8
DC WC18931 WC18932 155,0 110,2
DC WC18938 WC18937 989001005109717 155,0 111,9
DC WC18939 WC18940 157,0 116,5
DC WC18943 WC18944 151546411A
DC WC18989 WC18990 151,4 105,5
DC WC18993 WC18994 143,3 99,8
DC WC18995 WC18996 151,3 106,1
DC AP0119 148,7 105,2
DC PN2221
2016 Season Report Page | 36
DC PN2935 AVID*045*615*879 146,8 108,4
DC PN4572 127113572A DC PN5125 155.0 111.0
DC VC1869 DC VC3458 156.3 109.1
DC VC6151 152,0 109,0
DC WC18988 157.0 120.3
DC 98512102485525 149,0 105,0
DC 98900100536447 DC 989001005109725 DC 133245791A CM PN3111 98.7 87.5
CM PN0849 PN0850 95,3 91,2
CM VC1922 WC18754 CM VC5895 VC6222 989001005109719 CM PN3194 PN3195 CM PN0921 CM PN0915 PN0904 EI CP2876 CP2874 82,0 92.2
EI CP2256 CP2255 87 65.5