seal bypass at the giant gjallar vent (norwegian sea
TRANSCRIPT

�������� ����� ��
Seal bypass at the Giant Gjallar Vent (Norwegian Sea): indications for a newphase of fluid venting at a 56-Ma-old fluid migration system
Ines Dumke, Christian Berndt, Gareth J. Crutchley, Stefan Krause, VolkerLiebetrau, Aurelien Gay, Melanie Couillard
PII: S0025-3227(14)00050-4DOI: doi: 10.1016/j.margeo.2014.03.006Reference: MARGO 5067
To appear in: Marine Geology
Received date: 1 November 2013Revised date: 5 March 2014Accepted date: 6 March 2014
Please cite this article as: Dumke, Ines, Berndt, Christian, Crutchley, Gareth J., Krause,Stefan, Liebetrau, Volker, Gay, Aurelien, Couillard, Melanie, Seal bypass at the GiantGjallar Vent (Norwegian Sea): indications for a new phase of fluid venting at a 56-Ma-oldfluid migration system, Marine Geology (2014), doi: 10.1016/j.margeo.2014.03.006
This is a PDF file of an unedited manuscript that has been accepted for publication.As a service to our customers we are providing this early version of the manuscript.The manuscript will undergo copyediting, typesetting, and review of the resulting proofbefore it is published in its final form. Please note that during the production processerrors may be discovered which could affect the content, and all legal disclaimers thatapply to the journal pertain.

ACC
EPTE
D M
ANU
SCR
IPT
ACCEPTED MANUSCRIPT
1
Seal bypass at the Giant Gjallar Vent (Norwegian Sea): indications for a new phase of
fluid venting at a 56-Ma-old fluid migration system
Ines Dumkea*, Christian Berndt
a, Gareth J. Crutchley
a1, Stefan Krause
a, Volker Liebetrau
a, Aurélien
Gayb, Mélanie Couillard
b2
a GEOMAR Helmholtz Centre for Ocean Research Kiel, Wischhofstr. 1-3, 24148 Kiel, Germany
b Géosciences Montpellier, University of Montpellier 2, Place E. Bataillon, 34095 Montpellier, France
* corresponding author
contact details:
GEOMAR Helmholtz Centre for Ocean Research Kiel, Wischhofstr. 1-3, 24148 Kiel, Germany
email: [email protected]
phone: +49-431-600-2286
fax: +49-431-600-2922
1 now at GNS Science, PO Box 30-368, Lower Hutt 5040, New Zealand
2 now at GEOREX, 145 rue Michel Carré, 95100 Argenteuil, France
Abstract
The Giant Gjallar Vent (GGV), located in the Vøring Basin off mid-Norway, is one of the largest (~5
× 3 km) vent systems in the North Atlantic. The vent represents a reactivated former hydrothermal
system that formed at about 56 Ma. It is fed by two pipes of 440 m and 480 m diameter that extend
from the Lower Eocene section up to the Base Pleistocene Unconformity (BPU). Previous studies
based on 3D seismic data differ in their interpretations of the present activity of the GGV, describing
the system as buried and as reactivated in the Upper Pliocene. We present a new interpretation of the
GGV’s reactivation, using high-resolution 2D seismic and Parasound data. Despite the absence of

ACC
EPTE
D M
ANU
SCR
IPT
ACCEPTED MANUSCRIPT
2
geochemical and hydroacoustic indications for fluid escape into the water column, the GGV appears to
be active because of various seismic anomalies which we interpret to indicate the presence of free gas
in the subsurface. The anomalies are confined to the Kai Formation beneath the BPU and the overlying
Naust Formation, which are interpreted to act as a seal to upward fluid migration. The seal is breached
by focused fluid migration at one location where an up to 100 m wide chimney-like anomaly extends
from the BPU up to the seafloor. We propose that further overpressure build-up in response to
sediment loading and continued gas ascent beneath the BPU will eventually lead to large-scale seal
bypass, starting a new phase of venting at the GGV.
Keywords
Giant Gjallar Vent, fluid pipe, seal bypass, overpressure build-up, Vøring Basin, Norwegian Sea
1. Introduction
Seal bypass systems are large-scale geological features that promote fluid migration across relatively
impermeable sealing sequences (Cartwright et al., 2007). Before seal bypass occurs, upward fluid
migration is inhibited by the seal and fluids accumulate beneath it. Overpressure build-up in the sealed
sequence is favoured by rapid burial, which leads to disequilibrium compaction, e.g. in clays and mud
rocks (Osborne and Swarbrick, 1997). In addition, overpressure may be generated due to the buoyancy
of hydrocarbons (Osborne and Swarbrick, 1997). Once fluid pressure beneath the seal exceeds the
fracture gradient, the seal begins to fracture, allowing fluids to migrate into overlying sediments, until
fractures close again as overpressure bleeds off (Sibson et al., 1988; Roberts and Nunn, 1995).
Seal bypass systems are commonly found in petroliferous basins and comprise faults, intrusions, and
pipes (Cartwright et al., 2007). Faults are divided into trap-defining and supratrap faults (Cartwright et
al., 2007), and intrusions include intrusions of sand (Jolly and Lonergan, 2002; Andresen et al., 2009),
mud (Brown and Westbrook, 1988; Hjelstuen et al., 1997; Hovland et al., 1998;), salt (Poliakov et al.,
1996), and igneous material (Planke et al., 2005; Svensen et al., 2012). Pipes include hydrothermal
pipes (Izawa and Cunningham, 1989; Jamtveit et al., 2004), blowout pipes (Løseth et al., 2001; 2011),

ACC
EPTE
D M
ANU
SCR
IPT
ACCEPTED MANUSCRIPT
3
and dissolution pipes (Walsh and Morawiecka-Zacharz, 2001). All three classes of seal bypass systems
– faults, intrusions, and pipes – may be found within the same basin (Cartwright et al., 2007).
Hydrothermal pipes, for example, are closely linked to igneous intrusions. When sills intrude into
organic-rich sediments, large volumes of methane are produced by contact metamorphism around the
intrusions, promoting explosive and relatively short-lived (10-1000 years) fluid venting (Svensen et
al., 2004; Planke et al., 2005; Aarnes et al., 2010). In the Vøring and Møre basins off mid-Norway, an
80,000 km² large sill complex and subsequent explosive methane venting created 734 known
hydrothermal vent complexes, although it is estimated that there are at least 2000-3000 complexes in
the Vøring and Møre basins (Svensen et al., 2004; Planke et al., 2005). Some have been reactivated
and channelled upward-migrating fluids at later times (Svensen et al., 2003; Planke et al., 2005).
One of these hydrothermal vent complexes is the GGV, located at the northern Gjallar Ridge in the
Vøring Basin (Gay et al., 2012) (Fig. 1). With a seafloor area of ~5 km × 3 km and relief of up to 12
m, the GGV is one of the largest single vent sites in the North Atlantic. The vent system extends from
the Lower Eocene successions up to the BPU. This distinguishes the GGV from most break-up-related
hydrothermal systems of the Norwegian margin, which were active only until the Early Eocene
(Svensen et al., 2004).
The GGV thus has the potential to serve as a study site for constraining the geological processes that
were active in the deep part of the Vøring Basin, such as diagenesis, clay structure transitions,
hydrocarbon maturation, and hydrothermal activity due to break-up magmatism. Moreover, porewater
samples from Naust Formation sediments may provide information on long-term carbon venting from
the deeper Vøring Basin, which may be due to both hydrothermal maturation of organic carbon
associated with break-up magmatism (Svensen et al., 2003; 2004), and later processes.
Despite previous studies, the present fluid-flow activity of the GGV remains unclear. Hansen et al.
(2005) interpreted the GGV as a now buried, single-event mud volcano initiated in the Upper Pliocene
through reactivation of an underlying mud diapir, whereas Gay et al. (2012) proposed that fluid
migration resumed in the Upper Pliocene after a period of quiescence, suggesting that the GGV is still
at an early stage of development. Both studies were based on 3D seismic data acquired by Saga
Petroleum, which were the only available seismic data at that time across the GGV.

ACC
EPTE
D M
ANU
SCR
IPT
ACCEPTED MANUSCRIPT
4
In this paper, we present a re-interpretation of the Quarternary functioning of the GGV based on new
high-resolution 2D seismic and sediment echosounder data, as well as the first high-resolution
bathymetry data. Our aims are to test whether the GGV is presently active, and to discuss whether the
observed surface relief reflects past activity of a now inactive system, or relatively recent reactivation.
In addition, we constrain the evolution of the GGV over the last 2.6 Ma. Based on our findings, we
then re-evaluate the suggestion of Gay et al. (2012) that the GGV can be used as a study site for
constraining the geological processes that are or were active in the deep part of the Vøring Basin.
2. Regional setting and previous results
2.1 Geological background
From east to west, the Norwegian Sea may be divided into three geological provinces: the Trøndelag
Platform, the Vøring Basin, and the Vøring Marginal High which is bounded in the east by the Vøring
Escarpment (Fig. 1a; Blystadt et al., 1995). The Vøring Basin comprises several sub-basins (Fenris
Graben, Vigrid and Någrind synclines, Rås and Træna basins) separated by the NE-SW trending
basement highs Gjallar Ridge, Nyk High, and Utgard High (Blystad et al., 1995).
Evolution of the Vøring Basin started during the Upper Jurassic – Lower Cretaceous rift episode
characterized by E-W extension during the Upper Jurassic and northward-propagating NW-SE rifting
in the Lower Cretaceous (Doré et al., 1999). Rifting and subsequent subsidence created several deep
basins off Norway and in the SW Barents Sea, including the Vøring Basin and the Møre Basin further
to the south (Doré et al., 1999; Faleide et al., 2008).
The next rifting phase began in the Upper Cretaceous (Campanian-Maastrichtian) around 81 Ma (Ren
et al., 2003) and was characterized by rotation of tilted fault blocks, crustal thinning, and uplift of
structural highs (Hjelstuen et al., 1999a; Corfield et al., 2004). This phase culminated in lithospheric
break-up accompanied by extensive transient volcanism near the Paleocene-Eocene transition
(Skogseid et al., 1987; Eldholm et al., 1989) at about 56 Ma (Gradstein et al., 2012). A sill complex
extending for at least 80,000 km² intruded into thick, organic-bearing Cretaceous sequences of the
Vøring and Møre basins, producing large amounts of methane (Svensen et al., 2004; Planke et al.,

ACC
EPTE
D M
ANU
SCR
IPT
ACCEPTED MANUSCRIPT
5
2005). Subsequent explosive methane venting created at least 734 hydrothermal vent complexes
(Svensen et al., 2004; Planke et al., 2005).
Post break-up margin evolution includes compressional deformation and subsidence during the mid-
Cenozoic, and the onset of the Northern Hemisphere glaciation associated with highly increased
erosion and sedimentation rates (e.g. Doré et al., 1999; Ottesen et al., 2009). The sedimentary
sequence of the Vøring Basin since the Lower Eocene is characterized by three stratigraphic
formations: the Brygge Formation, which belongs to the Hordaland Group, and the Kai and Naust
formations, which represent the Nordland Group (Fig. 2).
The Brygge Formation (Lower Eocene to Lower Miocene) comprises mainly claystone interbedded
with sandstone, silt, and limestone (Dalland et al., 1988), although biogenic ooze dominates in the
deeper Vøring Basin (Eidvin et al., 2007). The uppermost Brygge Formation is characterized by
polygonal faults (Berndt et al., 2003).
The Kai Formation was supposedly deposited from Lower Miocene to Upper Pliocene (Dalland et al.;
1988), while Løseth and Henriksen (2005) assume it to be of late Middle to Upper Miocene age in the
central Vøring Basin. Deposition of the Kai Formation focused on the depressions between synclines,
with the largest sediment thickness occurring in the outer Vøring Basin close to the Vøring
Escarpment (Chand et al., 2011). The composition of the Kai Formation varies laterally. Near the
shelf, it consists mostly of claystone (Eidvin et al., 1998; Hjelstuen et al., 2004a), while the outer
margin is dominated by siliceous biogenic ooze (Caston, 1976; Hempel et al., 1989; Hjelstuen et al.,
1999a) that is rich in smectite (Forsberg and Locat, 2005). Caston (1976) determined a mean porosity
of 82 % and a mean bulk wet density of 1.324 g cm-³ from DSDP wells 339, 340 and 341, located at
about 70 km NE of the GGV. A high-amplitude seismic reflection observed in both the Vøring and
Møre basins marks the fossilised transition from Opal A to Opal C/T (Fig. 2) (Davies and Cartwright,
2002; Berndt et al., 2004).
The uppermost part of the Kai Formation is missing in the Vøring Basin. Jansen and Sjøholm (1991)
report a depositional hiatus from 3.1 Ma to 2.5 Ma between the Naust Formation and the preserved
part of the Kai Formation from ODP well 642B in the Vøring Basin. The hiatus may be due to a period
of transgression at the end of a Middle to Upper Miocene compressional phase, which resulted in

ACC
EPTE
D M
ANU
SCR
IPT
ACCEPTED MANUSCRIPT
6
strongly reduced deposition rates (Eidvin et al., 2000; Løseth and Henriksen, 2005). In addition, a
period of regression between 4.2 Ma and 2.8 Ma (Vail and Hardenbol, 1979) may have caused erosion
of the upper Kai Formation along most of the Norwegian margin (Eidvin et al., 2000).
The Kai Formation is further characterized by intense polygonal faulting. Polygonal faults developed
due to continuous volumetric contraction, probably during deposition of the Kai Formation and before
burial by the overlying Naust Formation (Berndt et al., 2003; Gay and Berndt, 2007). Sediment
unloading associated with the erosional event then stopped the propagation of polygonal faults (Gay
and Berndt, 2007). However, some polygonal faults extend through the Naust Formation and reach the
seafloor. These faults have been reactivated by dip-linkage during rapid deposition of the Naust
Formation (Laurent et al., 2012).
The Naust Formation was deposited during Upper Pliocene and Pleistocene according to Caston
(1976), Eidvin et al. (1998) and Hjelstuen et al. (2004a), which puts it into the Pleistocene in the
Geologic Time Scale of 2012 (Gradstein et al., 2012). Naust Formation sediments built up well-
stratified sequences termed Naust N, A, U, S, and T, with N being the oldest sequence (Rise et al.,
2006). The sequences represent massive prograding wedges resulting from glacigenic debris flows
(Henriksen and Vorren, 1996; Ottesen et al., 2009). Deposition of these units reflects the advances of
several major ice sheets across the continental shelf. Ice-rafted debris pebbles found in drill cores
indicate an intensified glaciation starting at about 2.57 Ma (Henrich, 1989; Jansen and Sjøholm, 1991).
Average sedimentation rates in the Vøring Basin sharply increased from 0.18 m ka-1
during Naust N
to 0.50 m ka-1
during Naust T (Dowdeswell et al., 2010), with a peak of 36 m ka-1
at about 16 ka
(Hjelstuen et al., 2004b). Differential loading by Naust Formation sediments led to mobilisation of the
underlying Miocene ooze, forming the Vema and Vigrid diapir fields (Hjelstuen et al., 1997; Hovland
et al., 1998).
In the study area, the Naust Formation consists of a clay-rich diamicton with small proportions of silt
and sand (Eidvin et al., 1998; Hjelstuen et al., 2004a; Ottesen et al., 2009), based on several wells in
the Vøring Basin. At DSDP wells 339, 340 and 341, ~70 km NE of the GGV, Caston (1976)
determined a mean porosity of 51 % and a mean bulk wet density of 1.846 g cm-³.

ACC
EPTE
D M
ANU
SCR
IPT
ACCEPTED MANUSCRIPT
7
A regional unconformity between the Kai and Naust formations marks the onset of glacially
dominated deposition (Faleide et al., 1996). In the study area, the unconformity appears as a strong
peak reflection in seismic records (Fig. 2). This reflector has been previously called Base Late
Pliocene Unconformity (Hjelstuen et al., 1997, 1999a), Base Pliocene reflector (Reemst et al., 1996),
Base Upper Pliocene (Eidvin et al. 1998; Corfield et al., 2004), and Top Kai (Hansen et al., 2005; Gay
et al., 2012). Throughout this paper, we use the term Base Pleistocene Unconformity (BPU), which is
in agreement with the Geologic Time Scale of 2012 (Gradstein et al., 2012).
The BPU reflects major changes in sediment composition, with relatively low-porosity, high-density
Naust Formation sediments above and higher-porosity, lower-density Kai Formation ooze below. The
lithological changes produce a velocity inversion across the BPU, which was observed at 12 wells on
the Trøndelag Platform, Nordland Ridge and the eastern Vøring Basin (Reemst et al., 1996). With a
seismic velocity of 3.09 km s-1
at the base of the Naust Formation and 2.14 km s-1
at the top of the Kai
Formation, the velocity inversion is on average 0.55 km s-1
, leading to a low-velocity zone beneath the
BPU (Reemst et al., 1996). This velocity inversion may be due to high fluid pressures beneath the less
permeable Naust Formation sediments (Reemst et al., 1996).
2.2 The Giant Gjallar Vent
The GGV is one of the largest focused fluid flow systems on the Norwegian Margin and is situated at
the northern Gjallar Ridge in water depths of 1348 m to 1360 m (Fig. 1). Located above a sill complex,
the GGV formed as the result of explosive methane venting after the intrusive event at c. 56 Ma
(Planke et al., 2005; Gay et al., 2012). The vent is characterized by two pipe-like structures extending
upwards from the Eocene sequence, each forming a V-shaped structure that terminates at the BPU
(Gay et al., 2012). Both pipes are marked by stacked high-amplitude reflections and chaotic
reflectivity above the Top Brygge horizon (Hansen et al., 2005). Hummocky reflections characterize
the BPU and overlying strata at the GGV (Gay et al., 2012). At the seabed, the GGV consists of three
NE-SW trending ridges with heights of up to 12 m above the surrounding seafloor, extending for ~5
km in a NE-SW direction and ~3 km in a NW-SE direction (Gay et al., 2012).

ACC
EPTE
D M
ANU
SCR
IPT
ACCEPTED MANUSCRIPT
8
The evolution of the GGV after the hydrothermal stage is under debate. According to Hansen et al.
(2005), the vent complex represents one of three types of mound structures (Type A, B, and C)
associated with fluid flow that exist in the Vøring Basin. Types C and A originate from mud
mobilisation at the Paleocene-Eocene transition and during Middle Oligocene, respectively. Type B
structures, which include the GGV, developed as mud diapirs during Middle to Upper Oligocene,
although some extend up to Top Brygge level. A later phase of reactivation led to mud expulsion at the
Upper Pliocene seabed. Today, type B structures are inactive and represent buried mud volcanoes
(Hansen et al., 2005).
An alternative evolution of the GGV was proposed by Gay et al. (2012). Based on the lack of
deformed horizons in the interval between the Intra-Oligocene horizon and the BPU, the authors
suggested that fluid/mud migration activity ceased in mid-Oligocene. Deformation at BPU level is
interpreted to indicate reactivation of the vent complex at the transition between Kai Formation and
Naust Formation. The GGV may therefore be at an early stage of development. Gay et al. (2012)
proposed a future collapse of the vent complex and subsequent pockmark formation.
3. Materials and methods
3.1 Seismic data
The 3D seismic data SG9604 were acquired by Saga Petroleum in 1996. The data cover a 40 × 50 km
area at the northern Gjallar Ridge between 4°8’E-5°23’E and 66°43’N-67°18’N (Fig. 1B). The data
have a dominant frequency of ~40-50 Hz and an inline and crossline spacing of 56 m. Vertical and
horizontal resolutions are approximately 10 m and 30-50 m, respectively (Hansen et al. 2005). The
data underwent standard industry processing including time migration.
During RV METEOR cruise M87-2 in 2012, we acquired high-resolution 2D seismic data along seven
profiles of 11-28 km length, using a 150-m-long 96-channel streamer. In addition, two profiles were
acquired using an 8-channel streamer of 12.5 m length. Locations of profiles discussed in this paper
are shown in Fig. 3.
All 2D seismic data were sampled at 2 kHz and recorded for 4 s. A 210 in³ GI gun was used as a
source and operated at a 5 s shot interval. The average shot spacing was 8 m for a ship speed of 3 kn.

ACC
EPTE
D M
ANU
SCR
IPT
ACCEPTED MANUSCRIPT
9
Processing was done using Seismic Unix (Stockwell, 1997) and included CMP (common midpoint)
sorting and frequency filtering. A filter with low-cut corner frequencies of 25 and 55 Hz was applied
to the 96-channel data to attenuate low-frequency noise. A slightly higher low-cut filter (36 and 60 Hz
corner frequencies) was applied for the same purpose to the lower-fold 8-channel data. Further
processing included stacking and Stolt migration with a constant velocity of 1500 m s-1
.
The Kingdom Suite software (SMT) was used to pick and correlate reflections in the different datasets.
Picked reflections include the seafloor, BPU, Opal A/CT transition, Top Brygge, Intra-Oligocene, Top
Lower Eocene, and three reflections within the Naust Formation (Naust 1, 2 and 3) that were
arbitrarily named and do not necessarily represent the intra-Naust formation tops (N, A, U, S, T; Rise
et al., 2006). We also used Kingdom Suite to calculate instantaneous frequencies of the 3D data in
order to investigate if free gas, manifested by increased attenuation of higher frequencies, is present in
the subsurface. In addition, the BPU horizon was flattened to analyse sediment thicknesses of the
overlying Naust Formation.
3.2 Hydroacoustic data
In addition to seismic data, sediment echosounder profiles were collected with the ATLAS Parasound
system operating at 4 kHz. Parasound data were acquired across the vent structure but also up to 70
km further northeast, including during the seismic surveys. The data were analysed for faults within 5
km distance intervals from the vent, with the starting point (0 km) set at the centre of the northern
pipe. In order to exclude bias from profile coverage, the number of faults found in each distance
interval was normalised to profile kilometres acquired within that distance interval. Fault locations
were compared to the locations of upper terminations of Miocene polygonal faults in 3D seismic data
to investigate if shallow faults may be connected to deeper polygonal faults.
On all seismic and Parasound profiles, multibeam echosounder data were recorded with the Kongsberg
EM122 system (12 kHz, 288 beams) (Fig. 1B). Using the open source software package MB System,
the multibeam data were manually edited and processed to obtain bathymetry grids with cell sizes of
30 m and 50 m. In addition, the EM122’s tool for water column imaging was operated during the
survey.

ACC
EPTE
D M
ANU
SCR
IPT
ACCEPTED MANUSCRIPT
10
4. Results
4.1 Seafloor and water column
Multibeam bathymetry of the GGV is of higher resolution than the seafloor pick of the 3D seismic
data and confirms that the surface expression of the vent consists of three NE-SW trending ridges (Fig.
4A). Maximum relief is about 12 m above the surrounding seafloor, with the highest point located
above the northern pipe in 1348 m water depth. Water column imaging did not reveal any anomalies
during the survey.
4.2 Subsurface
4.2.1 Seismic stratigraphy outside the vent zone
Outside the vent zone, the Naust Formation is characterized by continuous, undisturbed reflections that
are well imaged in Parasound data and appear as a conformable drape of the BPU (Fig. 5). The BPU
reflection has a negative polarity and appears hummocky at the GGV (Fig. 6). Hummocky reflections
occur over an elliptical (5.8 × 4.2 km) area oriented in a NW-SE direction, which is slightly larger than
the area of seabed elevation (5 × 3 km). The relief of the BPU hummocky area is up to 0.05 s TWT
(~38 m for a seismic velocity of 1500 m s-1
) higher than the surrounding area and is characterized by
polygonal faulting (Fig. 4B).
The thickness of the Naust Formation is reduced by up to 0.02 s TWT above the vent (Fig. 7),
equivalent to a reduction of 15 m for a seismic velocity of 1500 m s-1
. The extent of the reduced
thickness corresponds well to the extent of chaotic reflections beneath the BPU. Reflections within the
area of reduced thickness become increasingly hummocky from the flattened BPU horizon towards the
seafloor. This is particularly evident from the flank steepness, which increases towards shallower
sediment depths (Fig. 7).
In contrast to the shallower Naust Formation, the lower half of the BPU – Naust 1 interval appears
only slightly hummocky (Fig. 7). To get a rough age estimate for the upper boundary of this interval,
reflector R, we used the travel time difference (ΔTWT) between R and the BPU (0.021 s TWT), a
seismic velocity of 3.09 km s-1
(Reemst et al., 1996), and an average sedimentation rate of 0.18 m ka-1

ACC
EPTE
D M
ANU
SCR
IPT
ACCEPTED MANUSCRIPT
11
for the Naust N sequence (1.5-2.6 Ma) on the Vøring margin (Dowdeswell et al., 2010). These values
give an approximate timing of 180,000 years after the BPU for reflector R.
Between the BPU and the Opal A/CT reflection, internal reflections of the Kai Formation are of low
amplitudes. Reflections between the Opal A/CT reflection and Top Lower Eocene are characterized by
higher amplitudes (Fig. 2, 6).
4.2.2 Seismic amplitude and frequency anomalies
The subsurface of the GGV features several acoustic anomalies, including chaotic or discontinuous
reflections, high-amplitude reflections, reverse polarity, increased frequency attenuation, reflection
down-bending, and acoustic blanking.
Chaotic, discontinuous reflections occur in the uppermost Kai Formation immediately beneath the
BPU (Fig. 8). They are apparent in the 2D seismic data but not in the lower-resolution 3D seismic data
and are restricted to the area of BPU up-doming.
Discontinuous high-amplitude reflections exist within the chaotic reflections beneath the BPU in 2D
and 3D seismic data (Fig. 6, 8). High-amplitude reflections also exist in 3D data within the two pipes
down to Top Brygge level (Fig. 6), as previously noted by Hansen et al. (2005) and Gay et al. (2012).
Some of these reflections exhibit reversed polarity (Fig. 6).
Based on different amplitude characteristics, the two pipes of the GGV were divided into two units: a
high-amplitude unit between the BPU and Top Brygge (unit 1), and an opaque unit in the underlying
Brygge Formation where high-amplitude reflections are absent (unit 2).
Instantaneous frequencies from 3D seismic data show strong attenuation of higher frequencies beneath
the BPU at the vent and within the pipes (Fig. 9). Slightly increased frequency attenuation was also
observed in the lower Naust Formation above both pipe centres.
At the northern pipe, a down-bending reflection was observed in 3D seismic data at the centre of the
pipe, directly beneath the BPU (Fig. 6). At greater depths, the Top Brygge horizon bends steeply
upwards towards the centre of each pipe. Such up-bending is also observed at smaller pipe-like
features in the southern half of the 3D survey area.

ACC
EPTE
D M
ANU
SCR
IPT
ACCEPTED MANUSCRIPT
12
About 900 m NE of the northern pipe, a shallow vertical anomaly was observed, which has different
characteristics in 2D and 3D seismic data and Parasound records. On the 3D seismic line, the anomaly
appears as a subtle feature extending from the BPU into the Naust Formation. It is marked by
upbending and downbending of reflections, as well as a higher-amplitude reflection beneath the BPU
(Fig. 10A, B). At the BPU and immediately beneath it, instantaneous frequencies show increased
attenuation of higher frequencies (Fig. 10C).
On the higher-resolution 2D seismic profile, the anomaly is more distinct and characterized by reduced
seismic amplitudes, stopping at Naust 3 level (Fig. 10D). However, the Parasound data clearly show
that it reaches up to the seafloor, terminating in a shallow depression about 130 m wide and 1 m deep
(Fig. 10E). The anomaly is up to 100 m wide and marked by high amplitudes above Naust 3 level and
acoustic blanking below. Above this horizon, reflections on either side of the feature bend down
towards its centre, whereas reflection up-bending occurs beneath Naust 3. However, this is difficult to
discern as these depths are at the limit of Parasound penetration.
4.2.3 Faults related to shallow deformation
Faults were found across the entire survey area. However, data coverage at distances greater than 35
km from the GGV is limited to the area NNE of the GGV and consequently, all mapped faults beyond
this distance are located NNE of the vent. Within 35 km from the pipes, more extensive coverage
reduces directional bias.
We observed three groups of faults in the dataset: (1) shallow faults with throws of up to 3 m in the
upper 50-80 m, identified in Parasound data, (2) faults with throws of up to 10 m in the lower Naust
Formation, observed in 2D seismic data, and (3) polygonal faults imaged by the 3D data. The latter
have been described by Laurent et al. (2012), who determined maximum fault throws of 20 ms TWT.
Of the 143 shallow faults found in Parasound data, most are normal faults; only 18 showed up-dip
displacement of reflectors indicating reverse faulting. About one third (48) of the shallow faults are
located directly above polygonal faults (Table 1, Fig. 11), and one third (49) are independent, i.e. not
associated with deeper polygonal faults. The remaining 46 faults are located outside the area of the 3D
survey, and hence a comparison was not possible.
ACC
EPTE
D M
ANU
SCR
IPT
ACCEPTED MANUSCRIPT
13
Although shallow faults occur up to 70 km away from the GGV, most are within 25 km of the pipes
(Table 2, Fig. 12A). Both independent faults and faults related to polygonal faults were observed
mostly within 15 km from the central GGV, with the highest number of faults occurring within 5-10
km distance. Two faults are located directly above the northern pipe (Fig. 5).
While most shallow faults appear to terminate within the Naust Formation, 22 faults reach the
seafloor. Half of these faults are located above polygonal faults (Table 1). The seafloor-piercing faults
are found at three centres: (1) within 15 km of the pipes, (2) at distances of 25-40 km, and (3) between
55 km and 70 km (Table 2, Fig. 12B).
In 2D seismic data, normal and reverse faults were observed at the edges of the zone of chaotic, high-
amplitude reflections (Fig. 8, 10). These faults penetrate the BPU and the lower Naust Formation.
Some faults extend up to the Naust 3 horizon but none reaches the seafloor.
5. Discussion
5.1 Present-day activity of the GGV
The new data provide much higher resolution of the shallow sediment succession, i.e. the Naust
Formation and upper Kai Formation, than previously available for the area. Although we did not
observe acoustic indications for fluid release, such as acoustic flares in echosounder data, there are
several indications for present activity of the GGV both in terms of fluid migration and structural
deformation.
5.1.1 Fluid migration
The presence of free gas beneath the BPU is indicated by chaotic and high-amplitude reflections, and
by increased attenuation of higher frequencies. From the slightly increased frequency attenuation
within the pipes, as well as high-amplitude reflections and localised segments of reversed polarity
(Fig. 6), we infer that gas or gas-rich fluids are present within the pipes. Fluids migrate upwards from
greater depths, possibly from beneath the Top Brygge horizon.

ACC
EPTE
D M
ANU
SCR
IPT
ACCEPTED MANUSCRIPT
14
Free gas-related anomalies are absent above the BPU and fluids appear to be trapped underneath,
suggesting that the BPU acts as a seal to upward fluid migration. Sealing of the underlying Kai
Formation is likely due to the lower permeability and higher density of the glacigenic Naust Formation
sediments compared to the Kai Formation sediments (Caston, 1976), and the rapid covering of the Kai
Formation sediments during the Pleistocene (Hjelstuen et al., 2004a).
However, the BPU seal is not intact over the entire study area. It appears to have been breached ~900
m northeast of the northern pipe where a vertical, chimney-like anomaly extends from the BPU to the
seafloor (Fig. 10). We interpret the acoustic blanking and stacked high-amplitude reflections in 2D
seismic and Parasound data as indications for the presence of gas. 3D seismic data support this
interpretation through increased attenuation of higher frequencies at and immediately beneath the BPU
(Fig. 10C).
We interpret the shallow depression in which the vertical anomaly terminates as a pockmark. Its
dimensions are similar to pockmarks in the North Sea, e.g. in the South Fladen area where average
widths and depths of 156 m and 1.4 m, respectively, were measured (Hovland and Judd, 1988). As
pockmarks are formed by seepage, active fluid expulsion may have taken place at this location.
Although we did not observe anomalies in the water column during surveying, this does not rule out
the case for recent seepage as it is well known from other areas that seepage may be periodic on time
scales as short as minutes (Leifer et al., 2004; Krabbenhoeft et al., 2010). Thus, the time of passing this
feature could have been an intermittent period of quiescence.
Geochemical analyses of sediment samples from this site would help to clarify whether seepage occurs
at this chimney. Unfortunately, such samples do not exist. Two gravity cores taken above the northern
pipe (cores 660 and 661 in Fig. 3) show methane concentrations below 11 nmol l-1
, and no indication
for strong fluid advection in the profiles of total alkalinity, sulphate, Cl- and Br
-. However, free gas
may be present deeper in the Naust Formation, as we infer from slightly increased attenuation of
higher seismic frequencies above the BPU at the centre of the northern pipe (Fig. 9). This may be a
first indication for seal bypass at the northern pipe.
5.1.2 Structural deformation

ACC
EPTE
D M
ANU
SCR
IPT
ACCEPTED MANUSCRIPT
15
The distribution of shallow faults with respect to Miocene polygonal faults indicates that shallow
propagation of polygonal faults is taking place in the survey area. Shallow faults located above a
polygonal fault identified in 3D seismic data indicate reactivation of a buried polygonal fault which
then propagated into the Naust Formation. Fault reactivation has already been inferred from 3D data
(Laurent et al., 2012), and the new high-resolution data support this hypothesis.
Reactivation of polygonal faults of the Kai Formation is probably a regional process, rather than a
local phenomenon. Gay and Berndt (2007) observed shallow propagation of polygonal faults at the
Storegga scarp, about 280 km south of the GGV, and proposed that faulting within the lower Naust
Formation was induced by the overlying debris flow deposit, i.e. by an instantaneous process. We
suggest that a similar process inducing fault reactivation could be represented by rapid loading by
glacigenic debris flows of the Naust Formation. As the glacial deposits are unsorted and of low
permeability, they probably act similarly to submarine debris flow deposits, even though the loading
process was not as instantaneous as the emplacement of the debris flow at Storegga.
While regional reactivation of polygonal faulting is certainly responsible for many of the observed
shallow faults, other factors may also be involved. Based on the relatively high density of shallow
faults related to polygonal faults within 10 km of the GGV, we suggest that the vent influences and
possibly promotes fault reactivation and shallow propagation. The GGV also appears to induce the
formation of new faults, as inferred from the high number of faults not related to polygonal faults and
located within a 15 km radius from the northern pipe. A relation between vent activity and faulting, or
deformation, is further indicated by faults identified in 2D seismic data just at the edges of the zone of
strong BPU deformation and underlying chaotic reflections.
Recent structural deformation is implied by seafloor-piercing faults, whose distribution shows that
structural deformation is not restricted to the vent vicinity but also occurs in two areas further to the
northeast. While we attribute fault activity within 10 km from the pipes mainly to vent-induced
deformation, it seems unlikely that faults located more than 10 km away are related to the vent system.
They must therefore have been caused by other factors.
One possibility is that vent-independent faults represent centres of recent reactivation of polygonal
faults. As there are no 3D seismic data available for these areas, we can neither confirm nor exclude

ACC
EPTE
D M
ANU
SCR
IPT
ACCEPTED MANUSCRIPT
16
this possibility. However, the distinct distance intervals of the two fault areas indicates that they are
caused by local effects rather than regional reactivation of the polygonal fault system. There is no
seismic evidence that tectonic stress in the basement is causing this near-surface deformation.
5.2 GGV relief – relict from the past?
5.2.1 Is the GGV a buried mud volcano?
Unconsolidated sediments can be mobilized in the subsurface if the boundary conditions are suitable
(cf. Maltman and Bolton, 2003). Subsurface sediment mobilization may form intrusive structures, e.g.
diapirs, and extrusive structures, e.g. mud volcanoes (Huuse et al., 2010). Mud volcanoes typically
have diameters of 1-4.5 km and heights of 10-200 m, e.g. in the Barents Sea (Hjelstuen et al., 1999b),
the Black Sea (Ivanov et al., 1996), the Western Alborán Sea (Somoza et al., 2012), and on the
Mediterranean Ridge (Ivanov et al., 1996). With a diameter of ~5 km and heights of up to 38 m at the
paleo-surface (BPU), the GGV is well within this range of mud volcano dimensions. To investigate
whether the GGV is a buried mud volcano, we discuss the common characteristics of mud volcanoes,
listed by Deville et al. (2003) as (1) dome-shaped outlets, (2) focused conduits, and (3) mud chambers
or reservoirs, and evaluate whether these apply to the GGV.
5.2.1.1 Volcanic dome
From the new high-resolution data, it is evident that there is no dome-shaped outlet at the GGV.
However, in a model of a mound structure associated with the GGV, Hansen et al. (2005) showed a
mud volcano dome sitting upon a relatively undeformed BPU. If that were the case and the feature
were now buried, we would have expected a dome-shaped anomaly on the paleo-seafloor, similar, for
example, to buried sand volcanoes in the Norwegian-Danish Basin (Andresen et al., 2009). While such
a dome could be inferred from the 3D data, which were the only data available to Hansen et al. (2005),
our 2D seismic data clearly show that there is no dome on the BPU but that the BPU itself is up-
doming and deformed (Fig. 8).
In addition to a dome on the BPU, the GGV also lacks stacked domes in the deeper subsurface.
Separate domes stacked in a “Christmas tree” pattern reflect multiple eruption phases of mud
volcanoes (Stewart and Davies, 2006). These are often observed at mud volcanoes in areas with high

ACC
EPTE
D M
ANU
SCR
IPT
ACCEPTED MANUSCRIPT
17
sedimentation rates (e.g. Davies and Stewart, 2005; Deville et al., 2006; 2010). According to Hansen
et al. (2005) and Huuse et al. (2010), the GGV represents a single-event mud volcano. While this
would explain the absence of stacked domes, it seems unlikely that a mud volcano erupted only once
about 2.6 Ma ago in an area characterized by high sedimentation rates during the Pleistocene.
Also absent are characteristic onlap patterns. Mud volcanoes that developed during times of high
sedimentation rates are often characterized by conformable seismic reflections onlapping the flanks,
representing phases during which sedimentation exceeded dome growth (e.g. Stewart and Davies,
2006). Stratigraphic onlaps would therefore be expected if there were a volcanic dome on the BPU, but
they are not observed in our data.
5.2.1.2 Feeder channel
Feeder channels of mud volcanoes can be easily identified in seismic data as they are marked by
opaque vertical zones that usually lack any reflections (Dimitrov, 2002). Although vertical amplitude
anomalies are clearly identifiable at the GGV, they are not uniformly opaque but can be divided into a
lower opaque unit beneath Top Brygge level and an upper unit marked by high-amplitude reflections.
A mud diapir feeding a potential mud volcano must therefore have stopped at Top Brygge level
(Hansen et al., 2005).
Above Top Brygge level, a different mode of migration must operate. Hansen et al. (2005) proposed
that above Top Brygge level, the GGV is fed via a network of sub-vertical fractures rather than by a
diapir. Vertical discontinuities are indicated by offset reflections in 3D seismic data just above the Top
Brygge horizon (Fig. 6). We interpret these discontinuities as hydro-fractures, which can trigger mud
diapirism and volcanism (Dimitrov, 2002; Deville et al., 2010) but are also associated with the
initiation and upward propagation of gas (Hustoft et al., 2010; Netzeband et al., 2010). As the high
amplitudes and chaotic character of the pipes above Top Brygge level indicate the presence of gas, and
as gas is also present beneath the BPU, we suggest that above Top Brygge level, fluid migration in the
GGV is driven by gas rather than mud.
Another feature common to both mud volcano systems and gas chimneys is down-bending of
reflections, which occurs beneath the up-doming BPU (Fig. 6). Similar down-bending was observed at

ACC
EPTE
D M
ANU
SCR
IPT
ACCEPTED MANUSCRIPT
18
Håkon Mosby Mud Volcano in the Barents Sea (Hjelstuen et al., 1999b; Perez-Garcia et al., 2009) and
Strakhov Mud Volcano in the Black Sea (Ivanov et al., 1996).
Reflection down-bending can be interpreted in several ways: as (1) a pull-down effect caused by
decreasing seismic velocity in gas-rich fluids (Hovland and Judd, 1988; Løseth et al., 2009) or in gas-
saturated mud (Dimitrov, 2002), (2) a collapse structure, e.g. collapse of a mud volcano dome (Ivanov
et al., 1996; Perez-Garcia et al., 2009) or of a pipe structure (Moss and Cartwright, 2010), and (3) a
volcanic bicone geometry consisting of an upward-pointing cone and a downward-pointing cone
(Davies and Stewart, 2005; Stewart and Davies, 2006).
Since the high-resolution 2D seismic data do not show down-bending, we can rule out a structural
feature such as a collapse structure, and there is also no conclusive evidence for a bicone geometry.
Instead, we favour the interpretation that the down-bending is caused by lower velocities within a gas
chimney. The different effects observed in the seismic data – down-bending in 3D seismic data,
chaotic reflections in 2D seismic data –are attributed to the different frequencies of the systems used.
5.2.1.3 Mud reservoir
If the vent is driven by mud mobilization, there must be a mud reservoir of some kind. Hansen et al.
(2005) suggest that mud is sourced from within the Brygge Formation. While mud from the Brygge
Formation may have fed a mud diapir until Top Brygge times, a shallower source may have operated
afterwards. Other studies proposed mud mobilization within the Kai Formation, caused by lithological
changes across the BPU and overpressure build-up beneath it (Caston, 1976; Hjelstuen et al., 1997;
Hovland et al., 1998). Such mud mobilization within the Kai Formation probably resulted in the
formation of the Vema and Vigrid diapirs (Hjelstuen et al., 1997; Hovland et al., 1998). Due to the
relative proximity of the GGV to these diapirs, it is possible that the process of mud mobilization in
the Kai Formation also occurred at the GGV. However, the GGV differs from the diapirs in that it
shows several indications for free gas, suggesting gas migration rather than mud mobilization.
If the vent is primarily gas-driven, it can still lead to mud mobilization. Fluids migrating through
overpressured sequences may entrain unconsolidated sediment (Davies et al., 2007; Huuse et al.,
2010), for example at the edges of feeder pipes (Deville et al., 2010). Sediment entrainment in
response to fluid migration is likely to occur in areas characterized by polygonal faulting (Løseth et al.,

ACC
EPTE
D M
ANU
SCR
IPT
ACCEPTED MANUSCRIPT
19
2003). We assume that if mud mobilization by sediment entrainment occurs in the Kai Formation, it is
restricted to the upper 80 ms TWT. Reflections within this zone are up-bending, which could indicate
subsurface sediment mobilization. In contrast, flat and undisturbed reflections in the lower Kai
Formation do not seem to support subsurface sediment mobilization.
5.2.2 Recent reactivation of the GGV
After initial vigorous methane venting and a later mud-diapir phase, which probably lasted until Top
Brygge times, the GGV may have experienced a period of quiescence until deposition of the Naust
Formation onto the Kai Formation occurred. Gay et al. (2012) suggested that fluid migration was
reactivated at the Kai-Naust transition, based on the observation that deformed reflections exist only
near the BPU and above but not within the deeper Kai Formation.
Another indication for reactivation during the Naust Formation is the absence of stratigraphic onlap at
the deformed BPU. If deformation of the BPU had begun before deposition of the Naust Formation,
reflections of the lower Naust Formation should be characterized by onlap onto the BPU. As onlap is
absent in 2D and 3D seismic data, and the BPU is draped by conformable sediments, we interpret this
to indicate that the deformation of the BPU occurred after the onset of the deposition of the Naust
Formation.
Deformation and up-doming of the BPU and neighbouring reflections may be due to overpressure
build-up beneath the BPU. Overpressure build-up can be internally driven by local processes in the
sediments, or by an external fluid source (Løseth et al., 2003). Internal processes are often associated
with pore space reduction during compaction (e.g. Osborne and Swarbrick, 1997), whereas external
drivers of overpressure are derived from focused fluid migration towards a particular part of the
subsurface (e.g. Crutchley et al., 2013).
At the GGV, internal overpressure beneath the BPU is likely caused by the strong lithological contrast
between lower-permeability Naust Formation sediments and higher-permeability Kai Formation
sediments, and by high sedimentation rates during deposition of the Naust Formation. Rapid burial by
impermeable sediments favours disequilibrium compaction, leading to overpressure generation
(Osborne and Swarbrick, 1997; Deville et al., 2010). Regional or internal overpressure is further

ACC
EPTE
D M
ANU
SCR
IPT
ACCEPTED MANUSCRIPT
20
indicated by polygonal faults in the upper Brygge, Kai and lower Naust formations (Chand et al.,
2011).
However, fluid migration caused solely by regional overpressure disagrees with the localized
deformation and focused pipes of the GGV. Recent fluid migration must therefore be at least partly
related to a second, i.e. external, overpressure component. Externally driven overpressure is associated
with fluid migration pipes, which always produce small amounts of overpressure (Osborne and
Swarbrick, 1997). Gas ascending in an incompressible fluid also generates significant overpressure
(Osborne and Swarbrick, 1997).
Recent to ongoing fluid migration must therefore also be related to the underlying pre-Top-Brygge
mud diapir and former hydrothermal system of the GGV. We propose that slow fluid migration from
the last main fluid-flow activity phase of the vent, which lasted from approximately Middle Oligocene
to Lower Miocene (Top Brygge), is still ongoing, albeit at a much lower rate than during the main
phase. Fluids are seeping into the Kai Formation and migrate upwards, forming two pipe structures
terminating at the BPU.
At the pipes, local overpressure arising from buoyant, trapped fluids adds to the regional overpressure
caused by the permeability contrast and loading. Consequently, overpressure beneath the BPU must be
considerably greater at the GGV compared to the surrounding area. We suggest that greater
overpressure at the GGV is a feasible explanation for up-doming and deformation of the BPU.
Overpressure build-up beneath the BPU is also inferred from the chimney location where the seal has
been breached. Such seal failure typically occurs when a pressure threshold is reached beneath the seal
and the fracture gradient, i.e. the rock’s least principle stress, is exceeded (Huuse et al., 2010).
Subsequently, hydro-fractures can form, which serve as migration pathways into the overlying
sediments. Since fluid chimneys like the one observed at the BPU have been inferred to initiate by
faulting (e.g. Netzeband et al., 2010), we propose that seal failure at the GGV also occurred by this
process. The chimney feature must then have formed after deposition of the BPU, i.e. within the last
2.6 Ma.
5.2.3 Interpretation of the GGV

ACC
EPTE
D M
ANU
SCR
IPT
ACCEPTED MANUSCRIPT
21
We conclude that the GGV is not a buried single-event mud volcano, as the absence of a dome-shaped
outlet at the paleo-seafloor is inconsistent with the appearance of classic mud volcanoes. Moreover,
the GGV is neither inactive, nor is it driven entirely by mud mobilization. Instead, the upper part
above Top Brygge level appears to be gas-driven. We therefore interpret the GGV as an active gas
chimney above a former mud diapir. A change from a mud-dominated phase to gas-dominated activity
at the same location is possible, as suggested for Håkon Mosby Mud Volcano (Perez-Garcia et al.,
2009).
Gas-rich fluids at the GGV probably originate from different depth intervals: (1) from beneath the Top
Brygge horizon, as a continuation of past activity phases, and (2) from within the Kai Formation due
to dewatering in response to increased loading by Naust Formation sediments. Overpressure, caused
by the combined effect of external and internal drivers associated with these two types of fluid
migration, is probably sufficient to induce the observed deformation of the BPU and overlying strata.
The interpretation that the BPU deformation arises from overpressured, trapped fluids pushing
upwards beneath the seal is consistent with our observations.
It is difficult to constrain the onset of deformation of the BPU and the Naust Formation at the GGV
from the seismic data. A rough estimate is 180,000 years after the BPU, although an even earlier onset
cannot be ruled out. Up-doming and deformation have probably been continuous, as indicated by the
progressive increase in flank steepness towards the seafloor (Fig. 7). The increasing surface relief
probably influenced local bottom currents, promoting seabed erosion, which may explain the reduction
in sediment thickness in the area of the highest degree of deformation. Alternatively, sediment could
have been removed through fluid expulsion, as observed at pockmarks (Hovland and Judd, 1988).
The GGV still appears to be in an early phase of development since its possible reactivation at the Kai-
Naust transition. This is suggested by the predominantly intact BPU seal and largely absent fluid
migration features in the Naust Formation. According to Gay et al. (2012), up-doming of the BPU
reflects an early stage of pipe formation. The GGV may eventually collapse to form pockmarks
characterized by active seepage.
5.3. Evolution since the BPU
ACC
EPTE
D M
ANU
SCR
IPT
ACCEPTED MANUSCRIPT
22
Prior to the Pleistocene, a period of transgression (Løseth and Henriksen, 2005) and possibly
regression, causing erosion of the upper Kai Formation over much of the Norwegian shelf (Eidvin et
al., 2000), produced a depositional hiatus on the Norwegian margin (Jansen and Sjøholm, 1991).
Polygonal faults, which developed in the Miocene Kai Formation in response to volumetric
contraction, possibly ceased to be active after the erosional event, at least in the Storegga area about
280 km south of the GGV (Gay and Berndt, 2007). With the beginning of the Pleistocene and
deposition of the Naust Formation sediments, the depositional hiatus in the uppermost Kai Formation
led to the development of an unconformity, the BPU. Based on our assumption that low-intensity fluid
migration continued after the last main activity phase of the GGV, we devised the following model for
the vent’s evolution since the BPU, i.e. for the last 2.6 Ma.
5.3.1 Early Naust period
During the Pleistocene, the weak Kai Formation was progressively loaded by dense glacigenic Naust
Formation sediments that were deposited onto the BPU. Due to the lower porosity and higher density
of the glacigenic sediments compared to the Kai Formation ooze (Caston, 1976), the BPU acted as a
seal, trapping upward-migrating fluids (Fig. 13A).
Consequently, overpressure began to build up beneath the BPU, favoured by increased, rapid burial of
the sealed Kai Formation, which led to disequilibrium compaction and dewatering (Osborne and
Swarbrick, 1997; Chand et al., 2011). Fluids that mobilized as the result of dewatering reactions then
migrated upwards towards the BPU.
Overpressure was greatest at the GGV where local overpressure derived from buoyant, trapped fluids
added to the regional, loading-induced overpressure. This combined overpressure beneath the BPU
was probably sufficient to cause progressive up-doming and deformation of the sealing sequence.
5.3.2. Middle to Late Naust period
Overpressure continued to build up beneath the BPU while deformation of the BPU and the Naust
Formation progressively increased (Fig. 13B). Burial of the Kai Formation caused reactivation of

ACC
EPTE
D M
ANU
SCR
IPT
ACCEPTED MANUSCRIPT
23
Miocene polygonal faults, while new faults formed due to overpressure-induced deformation at the
GGV.
5.3.3 Present
At present, increasing overpressure beneath the BPU seal has caused seal bypass in at least one
location where a 100 m wide chimney feature extends into the Naust Formation and up to the seafloor
(Fig.13C). While this is the only seal bypass feature yet observed, other locations may exist but may
not have been detected due to limited coverage of 2D seismic profiles and the low resolution of the 3D
dataset (Fig. 10). It is possible that seafloor venting is already taking place, although indications for
seepage were not observed during the survey.
5.3.4 Future
If overpressure continues to increase as fluids accumulate beneath the BPU, it is likely that seal bypass
will occur at other locations (Fig 13D). Eventually, we expect the BPU seal to fail over a larger area,
i.e. several square kilometres, enabling fluids and possibly mobilized mud to freely migrate into the
Naust Formation and towards the seafloor. Once fluids reach the seafloor and are expelled into the
water column, a new phase of fluid venting begins at the GGV.
Fluid venting may lead to pockmark formation and possibly later collapse of the upper pipe structure
(Gay et al., 2012). If fluid supply to the system were to remain active long enough, typical seep facies
such as chemoautotrophic fauna (Barry et al., 1996) and carbonate chemoherms (Aharon, 1994) could
develop at the seabed and in the shallow subsurface, indicating long-lasting fluid seepage.
5.4 A window into the deep basin?
The new high-resolution data provide more insight into the GGV system than was previously possible.
We therefore re-evaluated the suggestion that the GGV can act as a window into the geological
processes active in the deep Vøring Basin.
While Gay et al. (2012) inferred from the 3D dataset that the GGV may be used as a window into the
deep basin, we cannot support this hypothesis based on our new high-resolution data. The processes
ACC
EPTE
D M
ANU
SCR
IPT
ACCEPTED MANUSCRIPT
24
characterising the GGV today – fluid accumulation, overpressure build-up, up-doming, and faulting –
are mainly shallow processes originating in the Naust Formation and upper Kai Formation. With the
exception of possible low-intensity fluid migration remaining from the last main activity phase, these
processes appear to be unrelated to the deeper vent system that was dominated by sill-associated
explosive fluid escape at the Paleocene-Eocene transition and later mud diapirism between the Intra-
Oligocene and Top Brygge horizons. We therefore conclude that the GGV does not serve as a window
into the deep Vøring Basin. Instead, the vent reflects a long-lived, polyphase history marked by
focused fluid flow, reactivation with different modes of fluid migration and fluid composition, seal
establishment, and seal failure.
To further clarify whether deep processes contribute to present-day activity at the GGV, geochemical
data such as methane signatures would be required from seepage sites. Methane of biogenic origin
would indicate that only shallow processes are active at the GGV, whereas a thermogenic signature
implies deep processes and hence a possible window into the deeper basin. At present, the most
promising location for taking methane samples to address this question is the chimney site. More
detailed seafloor investigations should be carried out in order to corroborate if fluids from the deep
parts of the Vøring Basin reach the seafloor at present.
6. Conclusions
New high-resolution 2D seismic and Parasound data complement existing 3D seismic data and provide
new insights into the evolution of the GGV. Our seismic data show that the GGV is presently active in
terms of fluid migration and structural deformation. Fluids originating from beneath the Top Brygge
horizon and from dewatering within the Kai Formation accumulate beneath the BPU which separates
the Kai and Naust formations and acts as a seal to upward fluid migration. Overpressure associated
with the trapping of fluids is highest above the two pipes and is probably sufficient to cause up-
doming and deformation of the BPU, as well as faulting up to 10 km away from the vent.
Various seismic anomalies led us to suggest that fluid migration is gas-driven above the Top Brygge
horizon. Together with the absence of a potential dome-shaped outlet on the BPU, these results
indicate that the GGV is not a buried mud volcano as suggested by Hansen et al. (2005). Rather, the

ACC
EPTE
D M
ANU
SCR
IPT
ACCEPTED MANUSCRIPT
25
GGV reflects a polyphase history characterized by phases of mud-dominated and gas-dominated
activity. The current gas-driven phase was probably initiated by the deposition of Naust Formation
sediments onto the BPU, which caused sealing of the Kai Formation.
We suggest that this seal is beginning to fail, allowing fluids to migrate into the Naust Formation and
towards the seafloor. Although this is currently observed at only one location, we propose that
progressive seal failure will occur in the future and start a new phase of active fluid venting at the
seabed. The GGV thus represents a promising location to study the evolution of a fluid migration
system at an early stage of its development since reactivation. Understanding hydrothermal systems as
the GGV is important to gain insight into the effects these systems had, and still have, on the ocean
and atmospheric composition.
Our study further highlights the importance of additional high-resolution seismic data for the
interpretation of conventional 3D seismic data, which is often not able to resolve shallow (upper 100
m) features due to its lower resolution.
Acknowledgements
We thank Captain Michael Schneider and the crew of RV Meteor for their excellent support during
work at sea. Cruise M87-2 COSY was part of the SUGAR 2 project, financed by the German Federal
Ministry for Education and Research (BMBF) under project no. 03G0819A. ID was financed by the
German Research Foundation (DFG) through the Kiel Cluster of Excellence “The Future Ocean”,
EXC80/2-2012. We thank reviewers Helge Løseth and Henrik Svensen and editor David J. W. Piper
for their constructive comments that greatly helped to improve the manuscript.
References

ACC
EPTE
D M
ANU
SCR
IPT
ACCEPTED MANUSCRIPT
26
Aarnes, I., Svensen, H., Connolly, J.A.D., Podladchikov, Y.Y., 2010. How contact metamorphism can
trigger global climate changes: Modeling gas generation around igneous sills in sedimentary
basins. Geochimica et Cosmochimica Acta 74, 7179-7195.
Aharon, P., 1994. Geology and biology of modern and ancient submarine hydrocarbon seeps and
vents: An introduction. Geo-Marine Letters 14, 69-73.
Andresen, K.J., Clausen, O.R., Huuse, M., 2009. A giant (5.3 x 10⁷ m³) middle Miocene (c. 15 Ma)
sediment mound (M1) above the Siri Canyon, Norwegian–Danish Basin: Origin and
significance. Marine and Petroleum Geology 26, 1640-1655.
Barry, J.P., Gary Greene, H., Orange, D.L., Baxter, C.H., Robison, B.H., Kochevar, R.E., Nybakken,
J.W., Reed, D.L., McHugh, C.M., 1996. Biologic and geologic characteristics of cold seeps in
Monterey Bay, California. Deep Sea Research Part I: Oceanographic Research Papers 43,
1739-1762.
Berndt, C., Planke, S., Alvestad, E., Tsikalas, F., Rasmussen, T., 2001. Seismic volcanostratigraphy of
the Norwegian Margin: constraints on tectonomagmatic break-up processes. Journal of the
Geological Society 158, 413-426.
Berndt, C., Bünz, S., Mienert, J., 2003. Polygonal fault systems on the mid-Norwegian margin: a long-
term source for fluid flow. In: Van Rensbergen, P., Hillis, R.R., Maltman, A.J., Morley, C.K.
(Eds.), Subsurface Sediment Mobilization. Geological Society. London, Special Publications,
216, pp. 283-290.
Berndt, C., Bünz, S., Clayton, T., Mienert, J., Saunders, M., 2004. Seismic character of bottom
simulating reflectors: examples from the mid-Norwegian margin. Marine and Petroleum
Geology 21, 723-733.
Blystad, P., Brekke, H., Færseth, R.B., Larsen, B.T., Skogseid, J., Tørudbakken, B., 1995. Structural
elements of the Norwegian continental shelf. Part II: The Norwegian Sea Region. Norwegian
Petroleum Directorate Bulletin 8.
Brown, K., Westbrook, G.K., 1988. Mud diapirism and subcretion in the Barbados Ridge Accretionary
Complex: The role of fluids in accretionary processes. Tectonics 7, 613-640.
Cartwright, J., Huuse, M., Aplin, A., 2007. Seal bypass systems. AAPG Bulletin 91, 1141-1166.

ACC
EPTE
D M
ANU
SCR
IPT
ACCEPTED MANUSCRIPT
27
Caston, V.N.D., 1976. Tertiary sediments of the Vøring Plateau, Norwegian Sea, recovered by Leg 38
of the Deep Sea Drilling Project. In: Talwani, M., Udintsev, G., White, S. M. (Eds.), Initial
Reports DSDP, 38, pp. 761-782.
Chand, S., Rise, L., Knies, J., Haflidason, H., Hjelstuen, B.O., Bøe, R., 2011. Stratigraphic
development of the south Vøring margin (Mid-Norway) since early Cenozoic time and its
influence on subsurface fluid flow. Marine and Petroleum Geology 28, 1350-1363.
Corfield, S.M., Wheeler, W., Karpuz, R., Wilson, M., Helland, R., 2004. Exploration 3D seismic over
the Gjallar Ridge, mid-Norway: Visualization of structures on the Norwegian Volcanic Margin
from Moho to seafloor. In: Davies, R.J., Cartwright, J., Stewart, S.A., Underhill, J.R., Lappin,
M. (Eds.), 3D Seismic Technology: Application to the Exploration of Sedimentary Basins.
Geological Society, London, Memoirs, 29, pp. 177-186.
Crutchley, G.J., Berndt, C., Geiger, S., Klaeschen, D., Papenberg, C., Klaucke, I., Hornbach, M.J.,
Bangs, N.L.B., Maier, C., 2013. Drivers of focused fluid flow and methane seepage at south
Hydrate Ridge, offshore Oregon, USA. Geology 41, 551-554.
Dalland, A., Worsley, D., Ofstad, K., 1988. A lithostratigraphic scheme for the Mesozoic and
Cenozoic succession offshore mid- and northern Norway. Norwegian Petroleum Directorate
Bulletin 4.
Davies, R.J., Cartwright, J., 2002. A fossilized Opal A to Opal C/T transformation on the northeast
Atlantic margin: support for a significantly elevated Palaeogeothermal gradient during the
Neogene? Basin Research 14, 467-486.
Davies, R.J., Stewart, S.A., 2005. Emplacement of giant mud volcanoes in the South Caspian Basin:
3D seismic reflection imaging of their root zones. Journal of the Geological Society 162, 1-4.
Davies, R.J., Swarbrick, R.E., Evans, R.J., Huuse, M., 2007. Birth of a mud volcano: East Java, 29
May 2006. GSA Today 17, 4-9.
Deville, E., Battani, A., Griboulard, R., Guerlais, S., Herbin, J.P., Houzay, J.P., Muller, C., Prinzhofer,
A., 2003. The origin and processes of mud volcanism: new insights from Trinidad. In: Van
Rensbergen, P., Hillis, R.R., Maltman, A.J., Morley, C.K. (Eds.), Subsurface Sediment
Mobilization. Geological Society, London, Special Publications, 216, pp. 475-490.
ACC
EPTE
D M
ANU
SCR
IPT
ACCEPTED MANUSCRIPT
28
Deville, E., Guerlais, S.-H., Callec, Y., Griboulard, R., Huyghe, P., Lallemant, S., Mascle, A., Noble,
M., Schmitz, J., 2006. Liquefied vs stratified sediment mobilization processes: Insight from
the South of the Barbados accretionary prism. Tectonophysics 428, 33-47.
Deville, E., Guerlais, S.-H., Lallemant, S., Schneider, F., 2010. Fluid dynamics and subsurface
sediment mobilization processes: an overview from Southeast Caribbean. Basin Research 22,
361-379.
Dimitrov, L.I., 2002. Mud volcanoes—the most important pathway for degassing deeply buried
sediments. Earth-Science Reviews 59, 49-76.
Doré, A.G., Lundin, E.R., Jensen, L.N., Birkeland, Ø., Eliassen, P.E., Fichler, C., 1999. Principal
tectonic events in the evolution of the northwest European Atlantic margin. In: Fleet, E.J.,
Boldy, S.A.R. (Eds.), Petroleum Geology of Northwest Europe: Proceedings of the 5th
Conference, Geological Society, London, 41-61.
Dowdeswell, J. A., Ottesen, D., Rise, L., 2010. Rates of sediment delivery from the Fennoscandian Ice
Sheet through an ice age. Geology 38, 3-6.
Eidvin, T., Brekke, H., Riis, F., Renshaw, D.R., 1998. Cenozoic stratigraphy of the Norwegian Sea
continental shelf, 64°N-68°N. Norsk Geologisk Tidsskrift 78, 125-151.
Eidvin, T., Jansen, E., Rundberg, Y., Brekke, H., Grogan, P., 2000. The upper Cainozoic of the
Norwegian continental shelf correlated with the deep sea record of the Norwegian Sea and the
North Atlantic. Marine and Petroleum Geology 17, 579-600.
Eidvin, T., Bugge, T., Smelror, M., 2007. The Molo Formation, deposited by coastal progradation on
the inner Mid-Norwegian continental shelf, coeval with the Kai Formation to the west and the
Utsira Formation in the North Sea. Norwegian Journal of Geology 87, 75-142.
Eldholm, O., Thiede, J., Taylor, E., 1989. Evolution of the Vøring Volcanic Margin. In: Eldholm, O.,
Thiede, J., Taylor, E. (Eds.), Proceedings of the Ocean Drilling Program, Scientific Results,
104, pp. 1033-1065.
Faleide, J.I., Solheim, A., Fiedler, A., Hjelstuen, B.O., Andersen, E.S., Vanneste, K., 1996. Late
Cenozoic evolution of the western Barents Sea-Svalbard continental margin. Global and
Planetary Change 12, 53-74.
ACC
EPTE
D M
ANU
SCR
IPT
ACCEPTED MANUSCRIPT
29
Faleide, J.I., Tsikalas, F., Breivik, A.J., Mjelde, R., Ritzmann, O., Engen, Ø., Wilson, J., Eldholm, O.,
2008. Structure and evolution of the continental margin off Norway and the Barents Sea.
Episodes 31, 82-91.
Forsberg, C.F., Locat, J., 2005. Mineralogical and microstructural development of the sediments on
the Mid-Norwegian margin. Marine and Petroleum Geology 22, 109-122.
Gay, A., Berndt, C., 2007. Cessation/reactivation of polygonal faulting and effects on fluid flow in the
Vøring Basin, Norwegian Margin. Journal of the Geological Society 164, 129-141.
Gay, A., Mourgues, R., Berndt, C., Bureau, D., Planke, S., Laurent, D., Gautier, S., Lauer, C., Loggia,
D., 2012. Anatomy of a fluid pipe in the Norway Basin: Initiation, propagation and 3D shape.
Marine Geology 332–334, 75-88.
Gradstein, F.M., Ogg, J.G., Hilgen, F.J., 2012. On the Geologic Time Scale. Newsletters on
Stratigraphy 45, 171-188.
Hansen, J.P.V., Cartwright, J.A., Huuse, M., Clausen, O.R., 2005. 3D seismic expression of fluid
migration and mud remobilization on the Gjallar Ridge, offshore mid-Norway. Basin Research
17, 123-139.
Hempel, P., Mayer, L., Taylor, E., Bohrmann, G., Pittenger, A., 1989. The influence of biogenic silica
on seismic lithostratigraphy at ODP sites 642 and 643, eastern Norwegian Sea. In: Eldholm,
O., Thiede, J., Taylor, E. (Eds.), Proceedings of the Ocean Drilling Program, Scientific
Results, 104, pp. 941-951.
Henrich, R., 1989. Glacial/interglacial cycles in the Norwegian Sea: Sedimentology,
paleoceanography, and evolution of Late Pliocene to Quarternary Northern Hemisphere
climate, in: Eldholm, O., Thiede, J., Taylor, E. (Eds.), Proceedings of the Ocean Drilling
Program, Scientific Results 104, pp. 189-232.
Henriksen, S., Vorren, T.O., 1996. Late Cenozoic sedimentation and uplift history on the mid-
Norwegian continental shelf. Global and Planetary Change 12, 171-199.
Hjelstuen, B.O., Eldholm, O., Skogseid, J., 1997. Vøring Plateau diapir fields and their structural and
depositional settings. Marine Geology 144, 33-57.

ACC
EPTE
D M
ANU
SCR
IPT
ACCEPTED MANUSCRIPT
30
Hjelstuen, B.O., Eldholm, O., Skogseid, J., 1999a. Cenozoic evolution of the northern Vøring margin.
Geological Society of America Bulletin 111, 1792-1807.
Hjelstuen, B.O., Eldholm, O., Faleide, J.I., Vogt, P.R., 1999b. Regional setting of Håkon Mosby Mud
Volcano, SW Barents Sea margin. Geo-Marine Letters 19, 22-28.
Hjelstuen, B.O., Sejrup, H.P., Haflidason, H., Nygård, A., Berstad, I.M., Knorr, G., 2004a. Late
Quaternary seismic stratigraphy and geological development of the south Vøring margin,
Norwegian Sea. Quaternary Science Reviews 23, 1847-1865.
Hjelstuen, B.O., Sejrup, H.P., Haflidason, H., Berg, K., Bryn, P., 2004b. Neogene and Quaternary
depositional environments on the Norwegian continental margin, 62°N–68°N. Marine
Geology 213, 257-276.
Hovland, M., Judd, A.G., 1988. Seabed pockmarks and seepages: Impact on geology, biology and the
marine environment. Graham and Trotman, London.
Hovland, M., Nygaard, E., Thorbjørnsen, S., 1998. Piercement shale diapirism in the deep-water Vema
Dome area, Vøring basin, offshore Norway. Marine and Petroleum Geology 15, 191-201.
Hustoft, S., Bünz, S., Mienert, J., 2010. Three-dimensional seismic analysis of the morphology and
spatial distribution of chimneys beneath the Nyegga pockmark field, offshore mid-Norway.
Basin Research 22, 465-480.
Huuse, M., Jackson, C.A.L., Van Rensbergen, P., Davies, R.J., Flemings, P.B., Dixon, R.J., 2010.
Subsurface sediment remobilization and fluid flow in sedimentary basins: an overview. Basin
Research 22, 342-360.
Ivanov, M.K., Limonov, A.F., van Weering, T.C.E., 1996. Comparative characteristics of the Black
Sea and Mediterranean Ridge mud volcanoes. Marine Geology 132, 253-271.
Izawa, E., Cunningham, C.G., 1989. Hydrothermal breccia pipes and gold mineralization in the
Iwashita Orebody, Iwato Deposit, Kyushu, Japan. Economic Geology 84, 715-724.
Jamtveit, B., Svensen, H., Podladchikov, Y.Y., Planke, S., 2004. Hydrothermal vent complexes
associated with sill intrusions in sedimentary basins. In: Breitkreuz, C.P., N. (Ed.), Physical
Geology of High-Level Magmatic Systems. Geological Society, London, Special Publications,
234, pp. 233-241.
ACC
EPTE
D M
ANU
SCR
IPT
ACCEPTED MANUSCRIPT
31
Jansen, E., Sjøholm, J., 1991. Reconstruction of glaciation over the past 6 Myr from ice-borne deposits
in the Norwegian Sea. Nature 349, 600-603.
Jolly, R.J.H., Lonergan, L., 2002. Mechanisms and controls on the formation of sand intrusions.
Journal of the Geological Society 159, 605-617.
Krabbenhoeft, A., Netzeband, G.L., Bialas, J., Papenberg, C., 2010. Episodic methane concentrations
at seep sites on the upper slope Opouawe Bank, southern Hikurangi Margin, New Zealand.
Marine Geology 272, 71-78.
Laurent, D., Gay, A., Baudon, C., Berndt, C., Soliva, R., Planke, S., Mourgues, R., Lacaze, S., Pauget,
F., Mangue, M., Lopez, M., 2012. High-resolution architecture of a polygonal fault interval
inferred from geomodel applied to 3D seismic data from the Gjallar Ridge, Vøring Basin,
Offshore Norway. Marine Geology 332–334, 134-151.
Leifer, I., Boles, J.R., Luyendyk, B.P., Clark, J.F., 2004. Transient discharges from marine
hydrocarbon seeps: spatial and temporal variability. Environmental Geology 46, 1038-1052.
Løseth, H., Wensaas, L., Arntsen, B., Hanken, N., Basire, C., Graue, K., 2001. 1000 m long gas blow
out pipes. 63rd EAGE Conference and Exhibition, Extended abstract, 524-527.
Løseth, H., Wensaas, L., Arntsen, B., Hovland, M., 2003. Gas and fluid injection triggering shallow
mud mobilization in the Hordaland Group, North Sea. In: Van Rensbergen, P., Hillis, R.R.,
Maltman, A.J., Morley, C.K. (Eds.), Subsurface Sediment Mobilization. Geological Society,
London, Special Publications, 216, 139-157.
Løseth, H., Henriksen, S., 2005. A Middle to Late Miocene compression phase along the Norwegian
passive margin. In: Doré, A.G., Vining, B.A. (Eds.), Petroleum Geology: North-West Europe
and Global Perspectives – Proceedings of the 6th Petroleum Geology Conference, Geological
Society, London, 845-859.
Løseth, H., Gading, M., Wensaas, L., 2009. Hydrocarbon leakage interpreted on seismic data. Marine
and Petroleum Geology 26, 1304-1319.
Løseth, H., Wensaas, L., Arntsen, B., Hanken, N.-M., Basire, C., Graue, K., 2011. 1000 m long gas
blow-out pipes. Marine and Petroleum Geology 28, 1047-1060.

ACC
EPTE
D M
ANU
SCR
IPT
ACCEPTED MANUSCRIPT
32
Maltman, A.J., Bolton, A., 2003. How sediments become mobilized. In: Van Rensbergen, P., Hillis,
R.R., Maltman, A.J., Morley, C.K. (Eds.), Subsurface Sediment Mobilization. Geological
Society, London, Special Publications, 216, 9-20.
Moss, J.L., Cartwright, J., 2010. The spatial and temporal distribution of pipe formation, offshore
Namibia. Marine and Petroleum Geology 27, 1216-1234.
Netzeband, G.L., Krabbenhoeft, A., Zillmer, M., Petersen, C.J., Papenberg, C., Bialas, J., 2010. The
structures beneath submarine methane seeps: Seismic evidence from Opouawe Bank,
Hikurangi Margin, New Zealand. Marine Geology 272, 59-70.
Osborne, M.J., Swarbrick, R.E., 1997. Mechanisms for generating overpressure in sedimentary basins:
a reevaluation. AAPG Bulletin 81, 1023-1041.
Ottesen, D., Rise, L., Andersen, E.S., Bugge, T., Eidvin, T., 2009. Geological evolution of the
Norwegian continental shelf between 61 N and 68 N during the last 3 million years.
Norwegian Journal of Geology 89, 251-265.
Perez-Garcia, C., Feseker, T., Mienert, J., Berndt, C., 2009. The Håkon Mosby mud volcano: 330
000 years of focused fluid flow activity at the SW Barents Sea slope. Marine Geology 262,
105-115.
Planke, S., Rasmussen, T., Rey, S.S., Myklebust, R., 2005. Seismic characteristics and distribution of
volcanic intrusions and hydrothermal vent complexes in the Vøring and Møre basins.
Geological Society, London, Petroleum Geology Conference Series 6, 833-844.
Poliakov, A.N.B., Podladchikov, Y.Y., Dawson, E.C., Talbot, C.J., 1996. Salt diapirism with
simultaneous brittle faulting and viscous flow. In: Alsop, G.I., Blundell, D.J., Davison, I.
(Eds.), Salt Tectonics. Geological Society, London, Special Publications 100, 291-302.
Reemst, P., Skogseid, J., Larsen, B.T., 1996. Base Pliocene velocity inversion on the eastern Vøring
margin— causes and implications. Global and Planetary Change 12, 201-211.
Ren, S., Faleide, J.I., Eldholm, O., Skogseid, J., Gradstein, F., 2003. Late Cretaceous–Paleocene
tectonic development of the NW Vøring Basin. Marine and Petroleum Geology 20, 177-206.

ACC
EPTE
D M
ANU
SCR
IPT
ACCEPTED MANUSCRIPT
33
Rise, L., Ottesen, D., Longva, O., Solheim, A., Andersen, E. S., Ayers, S., 2006. The Sklinnadjupet
slide and its relation to the Elsterian glaciation on the mid-Norwegian margin. Marine and
Petroleum Geology 23, 569-583.
Roberts, S.J., Nunn, J.A., 1995. Episodic fluid expulsion from geopressured sediments. Marine and
Petroleum Geology 12, 195-204.
Sibson, R.H., Robert, F., Poulsen, K.H., 1988. High-angle reverse faults, fluid-pressure cycling, and
mesothermal gold-quartz deposits. Geology 16, 551-555.
Skogseid, J., Eldholm, O., 1987. Early Cenozoic crust at the Norwegian continental margin and the
conjugate Jan Mayen Ridge. Journal of Geophysical Research 92, 11471-11491.
Somoza, L., Medialdea, T., León, R., Ercilla, G., Vázquez, J.T., Farran, M.l., Hernández-Molina, J.,
González, J., Juan, C., Fernández-Puga, M.C., 2012. Structure of mud volcano systems and
pockmarks in the region of the Ceuta Contourite Depositional System (Western Alborán Sea).
Marine Geology 332–334, 4-26.
Stewart, S.A., Davies, R.J., 2006. Structure and emplacement of mud volcano systems in the South
Caspian Basin. AAPG Bulletin 90, 771-786.
Stockwell, J., 1997. Free software in education: A case study of CWP/SU: Seismic Un*x. The Leading
Edge 16, 1045-1050.
Svensen, H., Planke, S., Jamtveit, B., Pedersen, T., 2003. Seep carbonate formation controlled by
hydrothermal vent complexes: a case study from the Vøring Basin, Norwegian Sea. Geo-
Marine Letters 23, 351-358.
Svensen, H., Planke, S., Malthe-Sorenssen, A., Jamtveit, B., Myklebust, R., Rasmussen Eidem, T.,
Rey, S.S., 2004. Release of methane from a volcanic basin as a mechanism for initial Eocene
global warming. Nature 429, 542-545.
Svensen, H., Corfu, F., Polteau, S., Hammer, Ø., Planke, S., 2012. Rapid magma emplacement in the
Karoo Large Igneous Province. Earth and Planetary Science Letters 325–326, 1-9.
Vail, P.R., Hardenbol, J., 1979. Sea-level changes during the Tertiary. Oceanus 22, 71-79.

ACC
EPTE
D M
ANU
SCR
IPT
ACCEPTED MANUSCRIPT
34
Walsh, P., Morawiecka-Zacharz, I., 2001. A dissolution pipe palaeokarst of mid-Pleistocene age
preserved in Miocene limestones near Staszów, Poland. Palaeogeography, Palaeoclimatology,
Palaeoecology 174, 327-350.
Figure captions
Figure 1
(A) Regional setting of the Giant Gjallar Vent (GGV). Tectonic structures are from Blystad et al.
(1995) and Hjelstuen et al. (1999a), volcanic seismic facies from Berndt et al. (2001). (B) Bathymetry
of the study area, showing locations of the 3D dataset and the M87-2 survey area.
Figure 2
3D seismic crossline illustrating the stratigraphic setting of the GGV, main lithological units, and
unconformities. Chronostratigraphic information and ages are from Hansen et al. (2005) and Gradstein
et al. (2012). BPU – Base Pleistocene Unconformity, Na. – Naust, Plei – Pleistocene, Pl. - Pliocene.
Location shown in Fig. 3.
Figure 3
Bathymetry map showing locations of profiles, sediment cores, pipes and seal bypass feature. Map
location shown in Fig. 2.
Figure 4
Maps of bathymetry (A) and topography of the Base Pleistocene Unconformity (BPU) horizon as
picked in the 3D seismic data (B), showing locations of pipes and seal bypass feature. mbsl – metres
below sealevel. Map location shown in Fig. 2.
Figure 5

ACC
EPTE
D M
ANU
SCR
IPT
ACCEPTED MANUSCRIPT
35
Parasound profile across the northern pipe showing conformable, undisturbed sedimentary reflections
of the Naust Formation. The normal fault is located above the centre of the pipe. Location shown in
Fig. 3.
Figure 6
3D seismic inline across the northern pipe (marked by stippled line). BPU – Base Pleistocene
Unconformity. Location shown in Fig. 3.
Figure 7
96-channel 2D seismic profile across the eastern edge of the northern pipe. The BPU horizon was
flattened to illustrate sediment thicknesses of the overlying Naust Formation. Reflector R represents
the upper boundary of the relatively undeformed lowermost part of the Naust Formation. BPU – Base
Pleistocene Unconformity. Location shown in Fig. 3.
Figure 8
96-channel 2D seismic profile across the eastern edge of the northern pipe, showing chaotic and high-
amplitude reflections and faulting. BPU – Base Pleistocene Unconformity. Location shown in Fig. 3.
Figure 9
Instantaneous frequencies of the 3D seismic data from the inline shown in Fig. 6. Stippled line marks
pipe extent as in Fig. 6. BPU – Base Pleistocene Unconformity.
Figure 10
Vertical seismic anomaly ~900 m east of northern pipe at different resolutions. (A) 3D seismic line
showing a vertical anomaly marked by upward and downward bending reflections. (B) Zoom of
vertical anomaly in the 3D seismic line (section indicated in A). Black arrows indicate reflection
downbending, red arrow indicates higher amplitudes beneath BPU. (C) Instantaneous frequencies of
same section as in B show increased attenuation of higher frequencies at the location of the seismic

ACC
EPTE
D M
ANU
SCR
IPT
ACCEPTED MANUSCRIPT
36
anomaly. (D) Higher-resolution 8-channel 2D seismic line showing a vertical amplitude anomaly or
chimney that extends into the Naust Formation, indicating bypass of the BPU seal. (E) A 4-kHz
Parasound profile shows that the anomaly extends up to the seabed, terminating in a depression.
Locations of all profiles in Fig. 3. BPU – Base Pleistocene Unconformity.
Figure 11
(A) Polygonal faults (a – e) on a profile from the 3D seismic data, extending from the Kai Formation
into the Naust Formation. (B) Shallow faults in Parasound data along the same line, interpreted as
continuations of polygonal faults a – e in (A). BPU – Base Pleistocene Unconformity. Location shown
in Fig. 3.
Figure 12
Number of faults normalised to Parasound profile km, plotted against 5 km distance intervals from
northern pipe. (A) All faults divided into categories (independent, related to polygonal faults, faults
outside the 3D survey). pf – polygonal fault. (B) Faults piercing the seafloor, indicating most recent
activity which is concentrated in three centres.
Figure 13
Model of vent evolution since deposition of the Naust Formation. (A) Early Naust period: Base
Pleistocene (BPU) acts as seal. (B) Middle to Late Naust period: fluids accumulating beneath BPU
induce overpressure and deformation. (C) Present: increased overpressure and deformation, seal
bypass in at least one location. (D) Future: extensive seal bypass enables new phase of active fluid
venting.
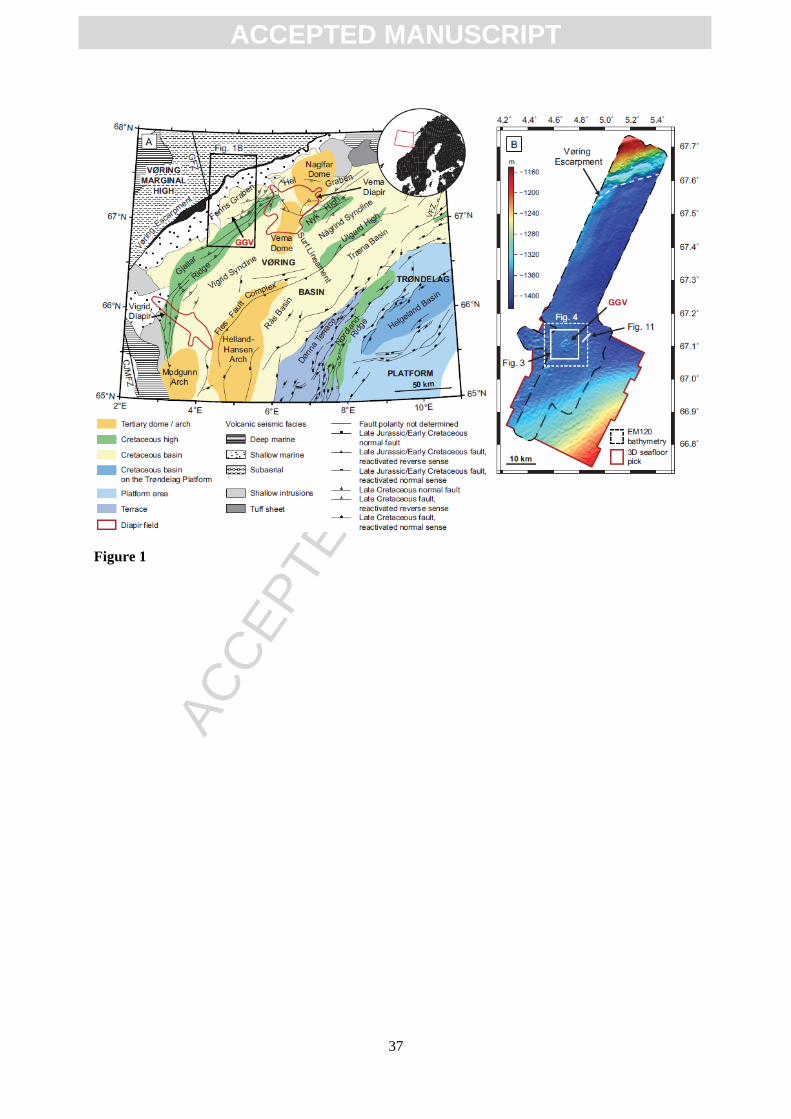
ACC
EPTE
D M
ANU
SCR
IPT
ACCEPTED MANUSCRIPT
37
Figure 1

ACC
EPTE
D M
ANU
SCR
IPT
ACCEPTED MANUSCRIPT
38
Figure 2

ACC
EPTE
D M
ANU
SCR
IPT
ACCEPTED MANUSCRIPT
39
Figure 3

ACC
EPTE
D M
ANU
SCR
IPT
ACCEPTED MANUSCRIPT
40
Figure 4

ACC
EPTE
D M
ANU
SCR
IPT
ACCEPTED MANUSCRIPT
41
Figure 5

ACC
EPTE
D M
ANU
SCR
IPT
ACCEPTED MANUSCRIPT
42
Figure 6
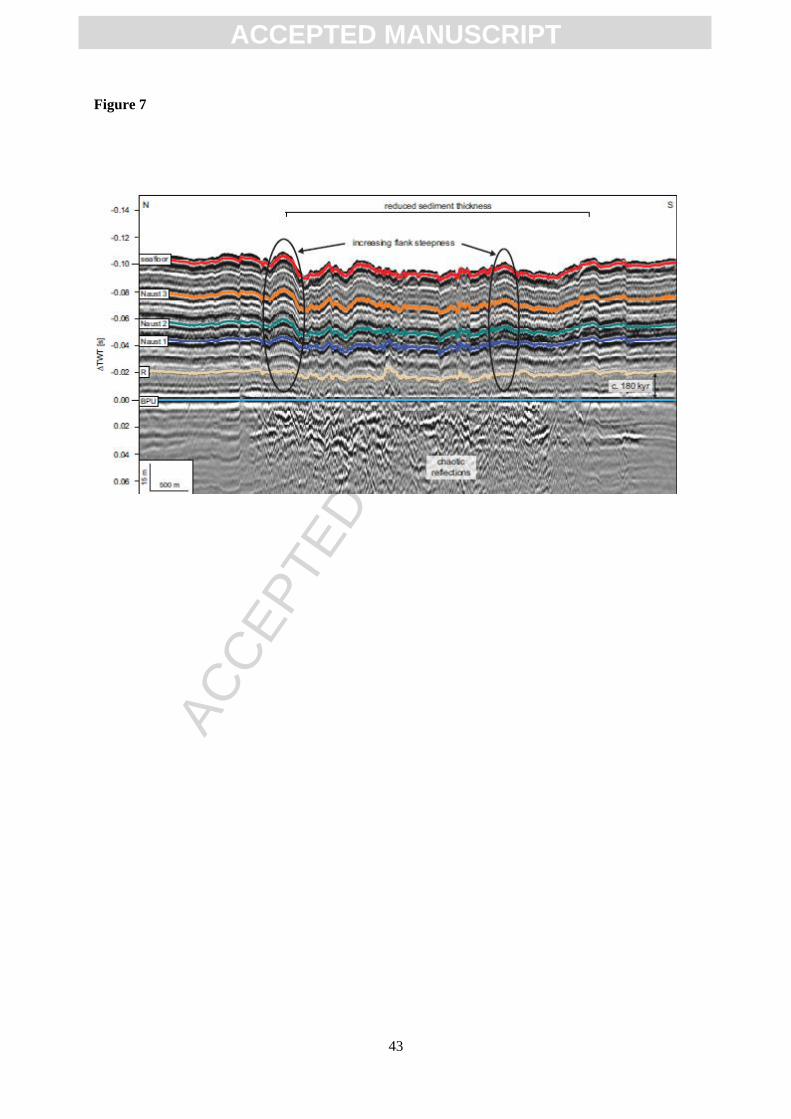
ACC
EPTE
D M
ANU
SCR
IPT
ACCEPTED MANUSCRIPT
43
Figure 7

ACC
EPTE
D M
ANU
SCR
IPT
ACCEPTED MANUSCRIPT
44
Figure 8

ACC
EPTE
D M
ANU
SCR
IPT
ACCEPTED MANUSCRIPT
45
Figure 9

ACC
EPTE
D M
ANU
SCR
IPT
ACCEPTED MANUSCRIPT
46
Figure 10

ACC
EPTE
D M
ANU
SCR
IPT
ACCEPTED MANUSCRIPT
47
Figure 11

ACC
EPTE
D M
ANU
SCR
IPT
ACCEPTED MANUSCRIPT
48
Figure 12
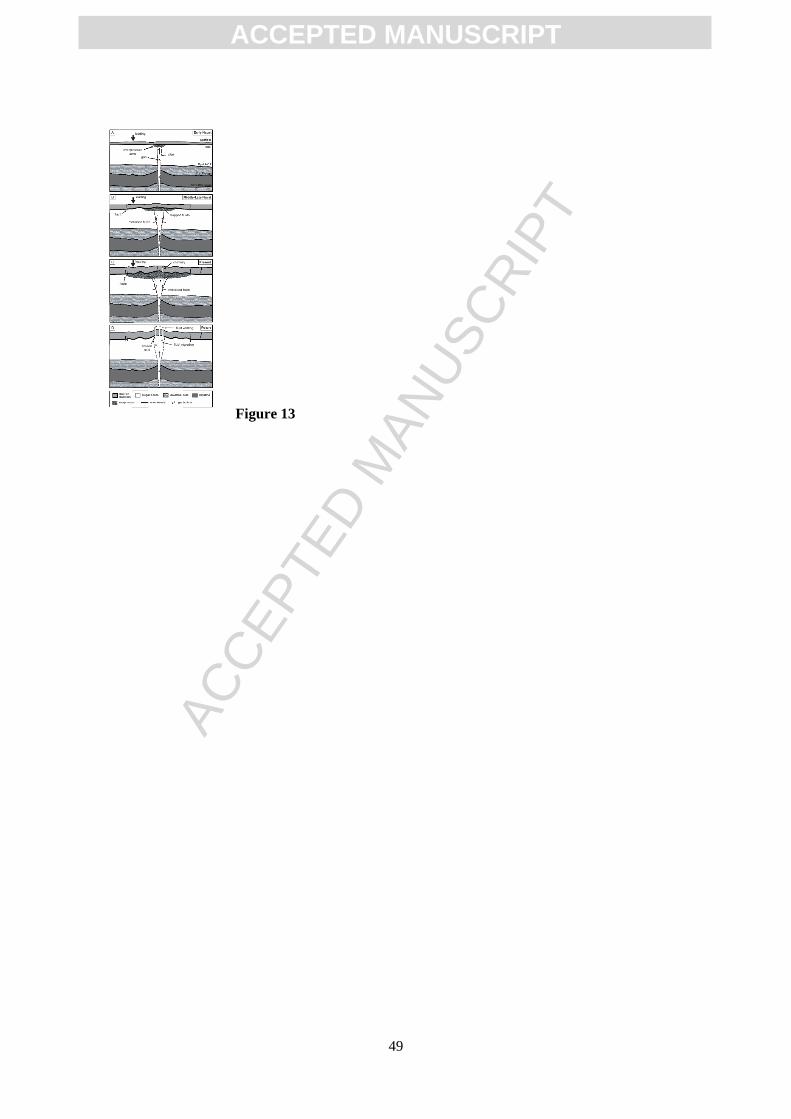
ACC
EPTE
D M
ANU
SCR
IPT
ACCEPTED MANUSCRIPT
49
Figure 13

ACC
EPTE
D M
ANU
SCR
IPT
ACCEPTED MANUSCRIPT
50
Table captions
Table 1
Occurrences of shallow faults identified in Parasound data within 5 km distance intervals from the
northern pipe. pf – polygonal fault.
all faults seafloor-piercing faults
interval
[km]
no. of
faults
(total)
no. of
pf-
related
faults
no. of
independent
faults
no. of
faults
outside
3D
survey
no. of
faults
(total)
no. of
pf-
related
faults
no. of
independent
faults
no. of
faults
outside
3D
survey
0-5 26 11 15 - 2 1 1 -
5-10 53 30 19 4 10 9 1 -
10-15 36 7 12 17 3 1 - 2
15-20 6 - 1 5 - - - -
20-25 5 - 2 3 - - - -
25-30 1 - - 1 1 - - 1
30-35 1 - - 1 1 - - 1
35-40 1 - - 1 1 - - 1
40-45 1 - - 1 - - - -
45-50 1 - - 1 - - - -
50-55 1 - - 1 - - - -
55-60 4 - - 4 2 - - 2
60-65 3 - - 3 1 - - 1
65-70 4 - - 4 2 - - 2

ACC
EPTE
D M
ANU
SCR
IPT
ACCEPTED MANUSCRIPT
51
Table 2. Occurrences of shallow faults identified in Parasound data, normalised to acquired profile
kilometres within the 5 km distance intervals. pf – polygonal fault.
all faults seafloor-piercing
faults
interval
[km]
profile
length [km]
pf-related
faults per km
independent
faults per km
faults outside 3D
survey per km
faults per km
0-5 157.85 0.070 0.095 - 0.013
5-10 184.34 0.163 0.103 0.022 0.054
10-15 145.71 0.048 0.082 0.117 0.021
15-20 55.87 - 0.018 0.089 -
20-25 37.29 - 0.054 0.080 -
25-30 29.67 - - 0.034 0.034
30-35 31.53 - - 0.032 0.032
35-40 19.84 - - 0.050 0.050
40-45 19.95 - - 0.050 -
45-50 20.60 - - 0.049 -
50-55 19.21 - - 0.052 -
55-60 20.99 - - 0.191 0.095
60-65 19.82 - - 0.151 0.050
65-70 20.02 - - 0.200 0.100

ACC
EPTE
D M
ANU
SCR
IPT
ACCEPTED MANUSCRIPT
52
Highlights
The Giant Gjallar Vent (GGV) is not a buried vent system but is still active, both in terms of
fluid migration and tectonic activity.
Fluids are trapped beneath the Base Late Pliocene Unconformity which acts as a seal to
upward fluid migration.
We present evidence that this seal has failed in at least one location, leading to a new phase of
active fluid venting at the GGV.