seamless carbon and alloy steel standard, line, and
TRANSCRIPT

U.S. International Trade CommissionPublication 5183 April 2021
Washington, DC 20436
Seamless Carbon and Alloy Steel Standard, Line, and Pressure Pipe from the
Czech Republic (Czechia) Investigation No. 731-TA-1529 (Final)

U.S. International Trade Commission
COMMISSIONERS
Jason E. Kearns, Chair Randolph J. Stayin, Vice Chair
David S. Johanson Rhonda K. Schmidtlein
Amy A. Karpel
Catherine DeFilippo
Staff assigned
Address all communications to Secretary to the Commission
United States International Trade Commission Washington, DC 20436
Director of Operations
Junie Joseph, Investigator Gregory LaRocca, Industry Analyst
Tana von Kessler, Economist Zahra Bekkal, Accountant Charles Yost, Accountant Christine Lee, Statistician
Madeline Heeren, Attorney Mary Beth Jones, Supervisory Investigator

U.S. International Trade CommissionWashington, DC 20436
www.usitc.gov
Publication 5183 April 2021
Seamless Carbon and Alloy Steel Standard, Line, and Pressure Pipe from the
Czech Republic (Czechia) Investigation No. 731-TA-1529 (Final)

CONTENTS Page
i
Determination ....................................................................................................................... 1
Views of the Commission ....................................................................................................... 3
Introduction .............................................................................................................. I-1
Background ................................................................................................................................ I-1
Statutory criteria ....................................................................................................................... I-2
Organization of report ............................................................................................................... I-3
Market summary ....................................................................................................................... I-3
Summary data and data sources ............................................................................................... I-4
Previous and related investigations .......................................................................................... I-5
Nature and extent of subsidies and sales at LTFV .................................................................... I-7
Subsidies ................................................................................................................................ I-7
Sales at LTFV .......................................................................................................................... I-7
The subject merchandise .......................................................................................................... I-9
Commerce’s scope ................................................................................................................ I-9
Tariff treatment ................................................................................................................... I-10
Section 232 Tariff Treatment .............................................................................................. I-10
Section 301 tariff treatment ................................................................................................ I-13
Description and applications ................................................................................................... I-13
Manufacturing processes ........................................................................................................ I-16
Domestic like product issues ................................................................................................... I-18
Part II: Conditions of competition in the U.S. market........................................................... II-1
U.S. market characteristics....................................................................................................... II-1
U.S. purchasers ......................................................................................................................... II-2
Channels of distribution ........................................................................................................... II-3
Geographic distribution ........................................................................................................... II-4
Supply and demand considerations ......................................................................................... II-4
U.S. supply ............................................................................................................................ II-4

CONTENTS Page
ii
U.S. demand ......................................................................................................................... II-8
Substitutability issues ............................................................................................................. II-13
Lead times .......................................................................................................................... II-13
Knowledge of country sources ........................................................................................... II-13
Factors affecting purchasing decisions............................................................................... II-14
Comparisons of domestic products, subject imports, and nonsubject imports ................ II-17
Comparison of U.S.-produced and imported SSLP pipe ..................................................... II-20
Elasticity estimates ................................................................................................................. II-23
U.S. supply elasticity ........................................................................................................... II-23
U.S. demand elasticity ........................................................................................................ II-24
Substitution elasticity ......................................................................................................... II-24
Part III: U.S. producers’ production, shipments, and employment ...................................... III-1
U.S. producers ......................................................................................................................... III-1
U.S. production, capacity, and capacity utilization ................................................................. III-6
Alternative products ............................................................................................................ III-8
U.S. producers’ U.S. shipments and exports ........................................................................... III-9
Captive production ................................................................................................................ III-11
Transfers and sales ............................................................................................................ III-12
First statutory criterion in captive production .................................................................. III-12
Second statutory criterion in captive production ............................................................. III-12
U.S. producers’ inventories ................................................................................................... III-12
U.S. producers’ imports and purchases ................................................................................ III-13
U.S. employment, wages, and productivity .......................................................................... III-14
Part IV: U.S. imports, apparent U.S. consumption, and market shares ............................... IV-1
U.S. importers.......................................................................................................................... IV-1
U.S. imports ............................................................................................................................. IV-2
Negligibility .............................................................................................................................. IV-7
Cumulation considerations ................................................................................................... IV-10

CONTENTS Page
iii
Fungibility .......................................................................................................................... IV-10
Geographical markets ....................................................................................................... IV-14
Presence in the market ..................................................................................................... IV-16
Apparent U.S. consumption .................................................................................................. IV-20
U.S. market shares ................................................................................................................ IV-22
Part V: Pricing data ............................................................................................................. V-1
Factors affecting prices ............................................................................................................ V-1
Raw material costs ............................................................................................................... V-1
Transportation costs to the U.S. market .............................................................................. V-4
U.S. inland transportation costs ........................................................................................... V-5
Pricing practices ....................................................................................................................... V-5
Pricing methods .................................................................................................................... V-5
Sales terms and discounts .................................................................................................... V-6
Price leadership .................................................................................................................... V-6
Price data .................................................................................................................................. V-7
Price trends ......................................................................................................................... V-21
Price comparisons .............................................................................................................. V-24
Lost sales and lost revenue .................................................................................................... V-25
Part VI: Financial experience of U.S. producers .................................................................. VI-1
Background .............................................................................................................................. VI-1
Operations on SSLP pipe ......................................................................................................... VI-1
Net sales ............................................................................................................................ VI-10
Cost of goods sold and gross profit or loss ........................................................................ VI-11
SG&A expenses and operating income or loss .................................................................. VI-13
All other expenses and net income or loss ....................................................................... VI-14
Variance analysis ............................................................................................................... VI-15
Capital expenditures and research and development expenses .......................................... VI-17
Assets and return on assets .................................................................................................. VI-19

CONTENTS Page
iv
Capital and investment ......................................................................................................... VI-20
Threat considerations and information on nonsubject countries .......................... VII-1
The industry in Czechia .......................................................................................................... VII-3
Changes in operations ........................................................................................................ VII-3
Operations on SSLP pipe..................................................................................................... VII-4
Alternative products ........................................................................................................... VII-5
Exports ................................................................................................................................ VII-6
The industry in Korea ............................................................................................................. VII-8
Exports ................................................................................................................................ VII-9
The industry in Russia .......................................................................................................... VII-10
Changes in operations ...................................................................................................... VII-11
Operations on SSLP pipe................................................................................................... VII-12
Alternative products ......................................................................................................... VII-13
Exports .............................................................................................................................. VII-14
The industry in Ukraine ........................................................................................................ VII-16
Changes in operations ...................................................................................................... VII-17
Operations on SSLP pipe................................................................................................... VII-18
Alternative products ......................................................................................................... VII-19
Exports .............................................................................................................................. VII-20
Subject countries combined ................................................................................................. VII-22
Operations on SSLP pipe................................................................................................... VII-22
Alternative products ......................................................................................................... VII-25
U.S. inventories of imported merchandise .......................................................................... VII-27
U.S. importers’ outstanding orders ...................................................................................... VII-29
Antidumping or countervailing duty orders in third-country markets ................................ VII-30
Information on nonsubject countries .................................................................................. VII-31

CONTENTS Page
v
Appendixes
A. Federal Register notices .................................................................................................. A-1
B. List of hearing witnesses ................................................................................................. B-1
C. Summary data ................................................................................................................. C-1
D. Negligibility and later revisions ....................................................................................... D-1
E. Nonsubject country price data ....................................................................................... E-1
Note.—Information that would reveal confidential operations of individual concerns may not be published. Such information is identified by brackets in confidential reports and is deleted and replaced with asterisks (***) in public reports.

UNITED STATES INTERNATIONAL TRADE COMMISSION
Investigation No. 731-TA-1529 (Final)
Seamless Carbon and Alloy Steel Standard, Line, and Pressure Pipe from Czechia
DETERMINATION
On the basis of the record1 developed in the subject investigation, the United States International Trade Commission (“Commission”) determines, pursuant to the Tariff Act of 1930 (“the Act”), that an industry in the United States is materially injured by reason of imports of seamless carbon and alloy steel standard, line, and pressure pipe from Czechia, provided for in subheadings 7304.19.10, 7304.19.50, 7304.31.60, 7304.39.00, 7304.51.50, 7304.59.60, and 7304.59.80 of the Harmonized Tariff Schedule of the United States, that have been found by the U.S. Department of Commerce (“Commerce”) to be sold in the United States at less than fair value (“LTFV”).2
BACKGROUND
The Commission instituted this investigation effective July 8, 2020, following receipt of petitions filed with the Commission and Commerce by Vallourec Star, LP, Houston, Texas. The Commission scheduled the final phase of the investigation following notification of a preliminary determination by Commerce that imports of seamless carbon and alloy steel standard, line, and pressure pipe from Czechia were being sold at LTFV within the meaning of section 733(b) of the Act (19 U.S.C. 1673b(b)). Notice of the scheduling of the final phase of the Commission’s investigation and of a public hearing to be held in connection therewith was given by posting copies of the notice in the Office of the Secretary, U.S. International Trade Commission, Washington, DC, and by publishing the notice in the Federal Register of December 31, 2021 (85 FR 86946). In light of the restrictions on access to the Commission building due to the COVID–19 pandemic, the Commission conducted its hearing through written testimony and video conference on March 4, 2021. All persons who requested the opportunity were permitted to participate.
1 The record is defined in § 207.2(f) of the Commission’s Rules of Practice and Procedure (19 CFR
207.2(f)). 2 86 FR 12909 (March 5, 2021).

3
Views of the Commission
Based on the record in the final phase of these investigations, we determine that an
industry in the United States is materially injured by reason of imports of seamless carbon and
alloy steel standard, line, and pressure pipe (“SSLP pipe”) from the Czech Republic (“Czechia”)
found by the U.S. Department of Commerce (“Commerce”) to be sold in the United States at
less than fair value (“LTFV”).
Background
The petitioner is Vallourec Star, LP (“Vallourec” or “Petitioner”), a domestic producer of
SSLP pipe. Petitioner filed countervailing and antidumping duty petitions on imports of SSLP
pipe from Czechia, Korea, Russia, and Ukraine on July 8, 2020. The investigation schedules
became staggered when Commerce did not postpone the final determination for its
antidumping duty investigation regarding Czechia (the “leading” investigation),1 while it
postponed those determinations for its antidumping duty investigations regarding Korea,
Russia, and Ukraine2 and aligned its countervailing duty determinations regarding Korea and
Russia with that of its corresponding antidumping duty investigations (collectively, the “trailing”
1 Seamless Carbon and Alloy Steel Standard, Line, and Pressure Pipe From the Czech Republic:
Preliminary Affirmative Determination of Sales, 85 Fed. Reg. 83,059-83,061 (Dec. 21, 2020). 2 Seamless Carbon and Alloy Steel Standard, Line, and Pressure Pipe From the Republic of Korea:
Preliminary Affirmative Determination of Sales at Less Than Fair Value, Postponement of Final Determination, and Extension of Provisional Measures, 86 Fed. Reg. 8,887 (Feb. 10, 2021); Seamless Carbon and Alloy Steel Standard, Line, and Pressure Pipe From the Russian Federation: Preliminary Affirmative Determination of Sales at Less Than Fair Value, Postponement of Final Determination, and Extension of Provisional Measures, 86 Fed. Reg. 8,891 (Feb. 10, 2021); Seamless Carbon and Alloy Steel Standard, Line, and Pressure Pipe From Ukraine: Preliminary Affirmative Determination of Sales at Less Than Fair Value, Postponement of Final Determination, and Extension of Provisional Measures, 86 Fed. Reg. 8,889 (Feb. 10, 2021).

4
investigations).3 As a result of this staggering, the Commission must make an earlier
determination in the final antidumping duty investigation on SSLP pipe from Czechia. However,
pursuant to the statutory cumulation provision on staggered investigations, the record for each
of these investigations will be the same except that, prior to the Commission’s determinations
regarding Korea, Russia, and Ukraine, the Commission shall include in the record Commerce’s
final antidumping and countervailing duty determinations, and the parties’ final comments
concerning Commerce’s trailing determinations.4
Vallourec, IPSCO Tubulars Inc. (“Tenaris”),5 and United States Steel Corporation (“U.S.
Steel”) (collectively, “Domestic Producers”), domestic producers of SSLP pipe, submitted a joint
prehearing brief. Vallourec, Tenaris, and U.S. Steel individually filed posthearing briefs.
Vallourec and U.S. Steel individually filed final comments. Representatives for Vallourec and
U.S. Steel appeared at the hearing accompanied by their respective counsel.6
A number of respondent parties participated in the final phase of these investigations.
North American Interpipe, Inc. (“Interpipe”), an importer of subject merchandise from Ukraine,
and TMK Group (“TMK”), a producer and exporter of SSLP pipe from Russia, appeared at the
3 Seamless Carbon and Alloy Steel Standard, Line, and Pressure Pipe From the Russian
Federation: Preliminary Affirmative Countervailing Duty Determination and Alignment of Final Determination With Final Antidumping Duty Determination, 85 Fed. Reg. 80,007 (Dec. 11, 2020); Seamless Carbon and Alloy Steel Standard, Line, and Pressure Pipe from the Republic of Korea: Preliminary Affirmative Countervailing Duty Determination and Alignment of Final Determination With Final Antidumping Duty Determination, 85 Fed. Reg. 80,024 (Dec. 11, 2020).
4 See 19 U.S.C. § 1677(7)(G)(iii). Commerce is currently scheduled to issue its final antidumping and countervailing duty determinations in the later investigations no later than 135 days from February 10, 2020, or by June 24, 2020. See 86 Fed. Reg. 8887, 8891, 8889 (Feb. 10, 2020).
5 Tenaris acquired TMK’s U.S. entity, IPSCO Tubulars Inc., including its seamless pipe mill in Ambridge, Pennsylvania, in January 2020. CR/PR at Tables III-3 and III-4; TMK Prehearing Br. at 4.
6 In light of the restrictions on access to the Commission building due to the COVID-19 pandemic, the Commission conducted the hearing via video teleconference, as set forth in procedures provided to the parties and announced on its website.

5
hearing with counsel and submitted individual prehearing and posthearing briefs, and final
comments. The government of Ukraine appeared at the hearing and submitted prehearing and
posthearing briefs and final comments.
U.S. industry data are based on the questionnaire responses of five firms that accounted
for the majority of U.S. production of SSLP pipe in 2020.7 U.S. imports are based on official
import statistics under Harmonized Tariff Schedule (“HTS”) statistical reporting numbers
referenced in the scope of investigations, as well as the questionnaire responses of 17
importers that accounted for *** percent of U.S. imports from Czechia, *** percent of U.S.
imports from Korea, *** percent of U.S. imports from Russia, and *** percent of U.S. imports
from Ukraine in 2020.8 The Commission received responses to its questionnaires from several
foreign producers and/or exporters of subject merchandise, including three firms accounting
for *** percent of subject imports from Czechia in 2020,9 two firms accounting for ***
percent of subject imports from Russia in 2020,10 and one firm accounting for *** percent of
subject imports from Ukraine in 2020.11 The Commission received no questionnaire responses
from producers and/or exporters of subject merchandise from Korea.12
7 Confidential Report, INV-TT-043 (Mar. 23, 2021) (“CR”) at III-1; Public Report, Seamless Carbon
and Alloy Steel Standard, Line, and Pressure Pipe from Czechia, Korea, Russia, and Ukraine, Inv. Nos. 701-TA-654-655 and 731-TA-1529-1532, USITC Pub. 5183 (April 2021) (“PR”) at III-1.
8 CR/PR at IV-1. 9 CR/PR at VII-3. 10 CR/PR at VII-10. 11 CR/PR at VII-16-17. 12 CR/PR at VII-8.
6
Domestic Like Product
A. In General
In determining whether an industry in the United States is materially injured or
threatened with material injury by reason of imports of subject merchandise, the Commission
first defines the “domestic like product” and the “industry.”13 Section 771(4)(A) of the Tariff
Act of 1930, as amended (“the Tariff Act”), defines the relevant domestic industry as the
“producers as a whole of a domestic like product, or those producers whose collective output
of a domestic like product constitutes a major proportion of the total domestic production of
the product.”14 In turn, the Tariff Act defines “domestic like product” as “a product which is
like, or in the absence of like, most similar in characteristics and uses with, the article subject to
an investigation.”15
By statute, the Commission’s “domestic like product” analysis begins with the “article
subject to an investigation,” i.e., the subject merchandise as determined by Commerce.16
Therefore, Commerce’s determination as to the scope of the imported merchandise that is
subsidized and/or sold at less than fair value is “necessarily the starting point of the
Commission’s like product analysis.”17 The Commission then defines the domestic like product
13 19 U.S.C. § 1677(4)(A). 14 19 U.S.C. § 1677(4)(A). 15 19 U.S.C. § 1677(10). 16 19 U.S.C. § 1677(10). The Commission must accept Commerce’s determination as to the
scope of the imported merchandise that is subsidized and/or sold at less than fair value. See, e.g., USEC, Inc. v. United States, 34 Fed. App’x 725, 730 (Fed. Cir. 2002) (“The ITC may not modify the class or kind of imported merchandise examined by Commerce.”); Algoma Steel Corp. v. United States, 688 F. Supp. 639, 644 (Ct. Int’l Trade 1988), aff’d, 865 F.3d 240 (Fed. Cir.), cert. denied, 492 U.S. 919 (1989).
17 Cleo Inc. v. United States, 501 F.3d 1291, 1298 (Fed. Cir. 2007); see also Hitachi Metals, Ltd. v. United States, Case No. 19-1289, slip op. at 8-9 (Fed. Circ. Feb. 7, 2020) (the statute requires the Commission to start with Commerce’s subject merchandise in reaching its own like product determination).

7
in light of the imported articles Commerce has identified.18 The decision regarding the
appropriate domestic like product in an investigation is a factual determination, and the
Commission has applied the statutory standard of “like” or “most similar in characteristics and
uses” on a case-by-case basis.19 No single factor is dispositive, and the Commission may
consider other factors it deems relevant based on the facts of a particular investigation.20 The
Commission looks for clear dividing lines among possible like products and disregards minor
variations.21
B. Product Description
In its final antidumping duty determination with respect to imports of SSLP pipe from
Czechia, Commerce defined the imported merchandise within the scope of the investigation as
follows:
18 Cleo, 501 F.3d at 1298 n.1 (“Commerce’s {scope} finding does not control the Commission’s
{like product} determination.”); Hosiden Corp. v. Advanced Display Mfrs., 85 F.3d 1561, 1568 (Fed. Cir. 1996) (the Commission may find a single like product corresponding to several different classes or kinds defined by Commerce); Torrington Co. v. United States, 747 F. Supp. 744, 748–52 (Ct. Int’l Trade 1990), aff’d, 938 F.2d 1278 (Fed. Cir. 1991) (affirming the Commission’s determination defining six like products in investigations where Commerce found five classes or kinds).
19 See, e.g., Cleo Inc. v. United States, 501 F.3d 1291, 1299 (Fed. Cir. 2007); NEC Corp. v. Department of Commerce, 36 F. Supp. 2d 380, 383 (Ct. Int’l Trade 1998); Nippon Steel Corp. v. United States, 19 CIT 450, 455 (1995); Torrington Co. v. United States, 747 F. Supp. 744, 749 n.3 (Ct. Int’l Trade 1990), aff’d, 938 F.2d 1278 (Fed. Cir. 1991) (“every like product determination ‘must be made on the particular record at issue’ and the ‘unique facts of each case’”). The Commission generally considers a number of factors, including the following: (1) physical characteristics and uses; (2) interchangeability; (3) channels of distribution; (4) customer and producer perceptions of the products; (5) common manufacturing facilities, production processes, and production employees; and, where appropriate, (6) price. See Nippon, 19 CIT at 455 n.4; Timken Co. v. United States, 913 F. Supp. 580, 584 (Ct. Int’l Trade 1996).
20 See, e.g., S. Rep. No. 96-249 at 90-91 (1979). 21 Nippon, 19 CIT at 455; Torrington, 747 F. Supp. at 748-49; see also S. Rep. No. 96-249 at 90-91
(Congress has indicated that the like product standard should not be interpreted in “such a narrow fashion as to permit minor differences in physical characteristics or uses to lead to the conclusion that the product and article are not ‘like’ each other, nor should the definition of ‘like product’ be interpreted in such a fashion as to prevent consideration of an industry adversely affected by the imports under consideration.”).

8
…seamless carbon and alloy steel (other than stainless steel) pipes and redraw hollows, less than or equal to 16 inches (406.4 mm) in nominal outside diameter, regardless of wall-thickness, manufacturing process (e.g., hot finished or cold-drawn), end finish (e.g., plain end, beveled end, upset end, threaded, or threaded and coupled), or surface finish (e.g., bare, lacquered or coated). Redraw hollows are any unfinished carbon or alloy steel (other than stainless steel) pipe or “hollow profiles” suitable for cold finishing operations, such as cold drawing, to meet the American Society for Testing and Materials (ASTM) or American Petroleum Institute (API) specifications referenced below, or comparable specifications. Specifically included within the scope are seamless carbon and alloy steel (other than stainless steel) standard, line, and pressure pipes produced to the ASTM A-53, ASTM A-106, ASTM A-333, ASTM A-334, ASTM A-589, ASTM A-795, ASTM A-1024, and the API 51 specifications, or comparable specifications, and meeting the physical parameters described above, regardless of application, with the exception of the exclusions discussed below.
Specifically excluded from the scope of the investigation are: (1) All pipes meeting aerospace, hydraulic, and bearing tubing specifications, including pipe produced to the ASTM A-822 standard; (2) all pipes meeting the chemical requirements of ASTM A-335, whether finished or unfinished; and (3) unattached couplings. Also excluded from the scope of the investigation are (1) all mechanical, boiler, condenser and heat exchange tubing, except when such products conform to the dimensional requirements, i.e., outside diameter and wall thickness, of ASTM A53, ASTM A-106 or API 51 specifications. Also excluded from the scope of the investigation are: (1) oil country tubular goods consisting of drill pipe, casing, tubing and coupling stock; (2) all pipes meeting the chemical requirements of ASTM A-335 regardless of their conformity to the dimensional requirements of ASTM A-53, ASTM A-106 or API 5L; and (3) the exclusion for ASTM A335 applies to pipes meeting the comparable specifications GOST 550-75.
Subject seamless standard, line, and pressure pipe are normally entered under
HTSUS 7304.19.1020, 7304.19.1030, 7304.19.1045, 7304.19.1060, 7304.19.5020, 7304.19.5050, 7304.31.6050, 7304.39.0016, 7304.39.0020, 7304.39.0024, 7304.39.0028, 7304.39.0032, 7304.39.0036, 7304.39.0040, 7304.39.0044, 7304.39.0048, 7304.39.0052, 7304.39.0056, 7304.39.0062, 7304.39.0068, 7304.39.0072, 7304.51.5005, 7304.51.5060, 7304.59.6000, 7304.59.8010, 7304.59.8015, 7304.59.8020, 7304.59.8025, 7304.59.8030, 7304.59.8035, 7304.59.8040, 7304.59.8045, 7304.59.8050, 7304.59.8055, 7304.59.8060, 7304.59.8065, 7304.59.8070. The HTSUS subheadings and specifications are provided

9
for convenience and customs purposes; the written description of the scope is dispositive.22
SSLP pipe is used to convey various liquids and gases in industrial piping systems,
including water, steam, petrochemicals, oil products, and natural gas. SSLP pipe encompasses
several varieties of pipe with varying specifications and uses. Seamless standard pipe is
commonly produced to ASTM A-53 specifications and intended for the low temperature
conveyance of water, steam, natural gas, air, and other liquids and gases in plumbing and
heating systems, air conditioning units, and other uses. Seamless line pipe is produced to API
5L specifications and intended for the conveyance of oil and natural gas or other fluids in
pipelines, transmission lines, or other lines. Seamless pressure pipe is commonly produced to
ASTM A-106 specifications and is intended for the conveyance of liquids and gases at elevated
pressures and temperatures. Many varieties of SSLP pipe are produced to meet multiple
standards.23
22 Seamless Carbon and Alloy Steel Standard, Line, and Pressure Pipe From the Czech Republic:
Final Affirmative Determination of Sales at Less Than Fair Value, 86 Fed. Reg. 12909 (Mar. 5, 2021). Commerce modified the scope language as it appeared in the initiation notice to clarify certain exclusions. Seamless Carbon and Alloy Steel Standard, Line, and Pressure Pipe From the Czech Republic: Final Affirmative Determination of Sales at Less Than Fair Value, 86 Fed. Reg. 12909 (Mar. 5, 2021).
23 CR/PR at I-13-14, Table I-9. Seamless pipes are commonly produced and certified to meet ASTM A-106, ASTM A-53, API 5L-B, and API 5L-X42 specifications. To avoid maintaining separate production runs and separate inventories, manufacturers typically produce pipes that can be certified to meet multiple specifications by meeting the metallurgical requirements and performing the required tests required for to the respective specifications. Since distributors sell the vast majority of this product, they can thereby maintain a single inventory to service all customers.

10
C. Arguments of the Parties
Domestic Producers argue that the Commission should define a single domestic like
product, coextensive with the scope of investigations.24 No respondent party challenges the
definition of domestic like product.25
D. Domestic Like Product Analysis
In the preliminary phase of these investigations, Petitioner advocated that the
Commission define a single domestic like product, coextensive with the scope of
investigations.26 The Commission found that most domestic pipe constitute standard products
that are made to commonly used dimensions and specifications, are made using common
manufacturing processes at the same facilities, and are sold in similar channels of distribution,
to distributors and end users.27 It further found that varieties of SSLP pipe that are made to
similar dimensions and standards are interchangeable.28 Available pricing data exhibited
similar price ranges for domestic products, with variations based on product characteristics and
availability.29
The record in the final phase of these investigations does not contain any information
calling into question the findings the Commission made in the preliminary phase.30 Moreover,
24 Domestic Producers Prehearing Br. at 8. 25 Interpipe Prehearing Br. at 11. 26 Seamless Carbon and Alloy Steel Standard, Line, and Pressure Pipe from Czechia, Korea, Russia,
and Ukraine, Inv. Nos. 701-TA-654-655 and 731-TA-1529-1532 (Preliminary), USITC Pub. 5114 (Aug. 2020) (“Preliminary Determinations”) at 7 n.24.
27 Preliminary Determinations, USITC Pub. 5114 at 7-8. 28 Preliminary Determinations, USITC Pub. 5114 at 7-8. 29 Seamless Carbon and Alloy Steel Standard, Line, and Pressure Pipe from Czechia, Korea, Russia,
and Ukraine, Inv. Nos. 701-TA-654-655 and 731-TA-1529-1532 (Preliminary), USITC Pub. 5114 at 7-8 (Aug. 2020) (“Preliminary Determinations”).
30 CR/PR at I-13-18.

11
no party has argued that the Commission should adopt a definition of the domestic like product
that is different from that in the preliminary determinations. Accordingly, we define a single
domestic like product of all SSLP pipe, coextensive with the scope.31
Domestic Industry and Related Parties
The domestic industry is defined as the domestic “producers as a whole of a domestic
like product, or those producers whose collective output of a domestic like product constitutes
a major proportion of the total domestic production of the product.”32 In defining the domestic
industry, the Commission’s general practice has been to include in the industry producers of all
domestic production of the like product, whether toll-produced, captively consumed, or sold in
the domestic merchant market.
We must determine whether any producer of the domestic like product should be
excluded from the domestic industry pursuant to section 771(4)(B) of the Tariff Act. This
31 Consistent with this definition of domestic like product, the Commission’s data for this
investigation includes SSLP pipe corresponding to Commerce’s scope description and that is domestically produced, imported from subject sources, and imported from nonsubject sources. See T.B. Woods Inc., v. United States, 355 F. Supp.3d 1265, 1277 (Ct. Int’l Tr. 2017). We note that TMK has argued that the scope of Commerce’s investigations encompasses several categories of product that other parties to this proceeding consider to be excluded from the scope of Commerce’s investigations. Respondent TMK’s Posthearing Br. at 7-9. The products at issue include ***. Respondent TMK’s Posthearing Br. at 7-14; see also *** Importer Questionnaire responses, II-3c and II-13. It is well settled that the Commission must accept Commerce’s determination as to the scope of imported merchandise that is subsidized or sold at less than fair value. See, e.g., USEC, Inc. v. United States, 34 Fed. Appx. 725, 730 (Fed. Cir. 2002) (“The ITC may not modify the class or kind of imported merchandise examined by Commerce.”); Algoma Steel Corp. v. United States, 688 F. Supp. 639, 644 (Ct. Int'l Trade 1988), aff'd, 865 F.2d 240 (Fed. Cir.), cert. denied, 492 U.S. 919 (1989); Goss Graphics System, Inc. v. United States, 33 F. Supp.2d 1082, 1093 (Ct. Int'l Trade 1998). See also NEC Corp., 36 F. Supp.2d at 383 (Ct. Int'l Trade 1998)(“the Commission must accept the determination of Commerce as to the scope of the imported merchandise sold at less than fair value...”); Makita Corp. v. United States, 974 F. Supp. 770, 783 (Ct. Int'l Trade 1997). Further, the record before us indicates that whereas certain categories of product appear to be excluded from the scope of Commerce’s investigations, the status of many other categories of products is unclear. Supplemental Memo, INV-TT-049, at Table D-8-ALT. On this record any further interpretation of the scope, however, is a matter for Commerce, not the Commission.
32 19 U.S.C. § 1677(4)(A).

12
provision allows the Commission, if appropriate circumstances exist, to exclude from the
domestic industry producers that are related to an exporter or importer of subject merchandise
or which are themselves importers.33 Exclusion of such a producer is within the Commission’s
discretion based upon the facts presented in each investigation.34
In its preliminary determinations, the Commission found that Vallourec and Tenaris
were not related parties under the statute, but noted it would seek more information in the
final phase of the investigations.35 Based on our analysis below, we find that appropriate
circumstances do not exist to exclude any of the U.S. producers from the domestic industry
under the related parties provision.
A. Arguments of the Parties
Domestic Producers. Domestic Producers argue that the Commission should define the
domestic industry to include all domestic producers of the domestic like product.36 Vallourec
33 See Torrington Co. v. United States, 790 F. Supp. 1161, 1168 (Ct. Int’l Trade 1992), aff’d
without opinion, 991 F.2d 809 (Fed. Cir. 1993); Sandvik AB v. United States, 721 F. Supp. 1322, 1331-32 (Ct. Int’l Trade 1989), aff’d mem., 904 F.2d 46 (Fed. Cir. 1990); Empire Plow Co. v. United States, 675 F. Supp. 1348, 1352 (Ct. Int’l Trade 1987).
34 The primary factors the Commission has examined in deciding whether appropriate circumstances exist to exclude a related party include the following:
(1) the percentage of domestic production attributable to the importing producer; (2) the reason the U.S. producer has decided to import the product subject to investigation
(whether the firm benefits from the LTFV sales or subsidies or whether the firm must import in order to enable it to continue production and compete in the U.S. market);
(3) whether inclusion or exclusion of the related party will skew the data for the rest of the industry;
(4) the ratio of import shipments to U.S. production for the imported product; and (5) whether the primary interest of the importing producer lies in domestic production or
importation. Changzhou Trina Solar Energy Co. v. USITC, 100 F. Supp.3d 1314, 1326-31 (Ct. Int’l. Trade 2015); see also Torrington Co. v. United States, 790 F. Supp. at 1168.
35 Preliminary Determinations, USITC Pub. 5114 at 10-11. 36 Domestic Producers Prehearing Br. at 8. Domestic Producers also argued that the Commission
should exclude *** data from the domestic industry pending its revision of its data to include only in-(Continued...)

13
argues that its joint venture with Interpipe only applies ***. Vallourec acknowledges that
Interpipe finishes subject merchandise on the same finishing line, but contends that this
product is not controlled by the joint venture and thus is not controlled by Vallourec. Vallourec
claims that it has no control over where ***.37
Respondents. Interpipe indicates that it takes no position on the definition of the
domestic industry.38 However, Interpipe also has asserted that Vallourec is a related party
because it has a *** in a joint venture with Interpipe, the joint venture finishes approximately
half of Interpipe’s SSLP pipe, and Interpipe exports these products to the United States.39 No
other respondent addresses how the Commission should define the domestic industry.
scope products. Domestic Producers Prehearing Br. at 4-7. Commission staff confirmed with *** that it produced in-scope products and *** provided the Commission a revised U.S. producer questionnaire removing production of ***. Video Conference Call, EDIS Doc. 737955 (Mar. 25, 2021); ***, EDIS Doc. 736083 (Mar. 5, 2021). Accordingly, we have included *** data in the domestic industry’s data.
37 Vallourec Posthearing Answers to Commission’s Questions at 17-18; Hearing Transcript at 28 (Frischmann).
38 Interpipe Prehearing Br. at 11 39 Interpipe Posthearing Br. at 6.

14
B. Analysis
Vallourec. Vallourec is the petitioner.40 Vallourec is also the *** largest domestic
producer, accounting for *** percent of domestic SSLP pipe production in 2020, and did not
import subject merchandise during the period of investigation.41 The parties do not dispute
that Vallourec and Interpipe jointly control a third party in Ukraine, *** (“joint venture
company”).42 Under a tolling agreement between the joint venture company and Interpipe
Ukraine,43 the joint venture company provides tolling services to Interpipe Ukraine by finishing
SSLP pipe provided by Interpipe.44 SSLP pipe finished by the joint venture company pursuant to
the tolling agreement is exported by Interpipe to the United States.45
Under the statute, a producer and exporter shall be considered related parties if the
producer and exporter directly or indirectly control a third party,46 and there is reason to
believe that the relationship causes the producer to act differently than a nonrelated
producer.47 Here, Vallourec and Interpipe indirectly control a third party, the joint venture
company. However, the record provides no indication, nor do the parties argue, that there is
40 CR/PR at Table III-1. 41 CR/PR at Tables III-1, III-9, and IV-1. 42 See, e.g., Hearing Tr. at 58 (Frischmann) (“… yes, we have full control over the sale of the
products manufactured by the JV and exclusively in Europe.”) In June 2018 Vallourec entered into a Joint Venture Agreement (“JVA”) with the Ukrainian producer Interpipe to finish certain SSLP products that are subsequently sold in the European market under the Vallourec brand. CR/PR at III-2 n.1 and Table VII-13; Petitioner’s Postconference Brief, Answers to Staff Questions at 2.
43 The tolling agreement is an ancillary agreement to the joint venture agreement. Vallourec Posthearing Br. at Exh. 8 (Annex C at p. 6 and Annex 11.2.3(b)).
44 Vallourec Posthearing Br. at Exh. 8 (Annex C at p. 6 and Annex 11.2.3(b)); see also Interpipe’s Posthearing Br., Answers to Commission’s Questions at 3 (discussing *** with the joint venture).
45 Interpipe Posthearing Br., Answers to Commission’s Questions at 1. 46 Direct or indirect control exists when “the party is legally or operationally in a position to
exercise restraint or direction over the other party.” 19 U.S.C. § 1677(4)(B). 47 19 U.S.C. § 1677(4)(B)(iv).

15
reason to believe that the relationship causes Vallourec to act differently than a nonrelated
producer. Thus, we do not consider that Vallourec is a related party under the statute.48
Tenaris. Tenaris’s activities implicate the related parties provision because Tenaris
reported acquiring TMK’s U.S. entity, IPSCO Tubulars Inc. (“IPSCO”), including its seamless pipe
mill in Ambridge, Pennsylvania,49 on January 2, 2020, and entering into an agreement with TMK
regarding imports of SSLP pipe from Russia.50 Under the agreement, TMK has discontinued
direct sales to IPSCO’s U.S. customers and can only sell subject merchandise to the United
States via Tenaris for a period of at least six years.51
In accordance with this agreement, Tenaris became the exclusive distributor of TMK
imports in the U.S. market, and these imports accounted for virtually all subject imports from
Russia. Therefore, Tenaris has control over TMK’s exports to the U.S. market and, as such, is a
related party.52
***.53
After acquiring the IPSCO plant in January 2020, by April 2020 Tenaris temporarily idled
the SSLP pipe production at the plant due to market conditions.54 Prior to its acquisition by
Tenaris, the IPSCO plant produced *** short tons of SSLP pipe in 2018 and *** short tons in
48 We also note that by the terms of the tolling agreement annexed to the joint venture
agreement ***. See Vallourec Posthearing Br. at Exh. 8 (Annex 11.2.3.(b) at paras. 2.1 – 2.8.3.). 49 CR/PR at Tables III-3 and III-4. 50 CR/PR at III-13 and III-13 n.6. 51 TMK Prehearing Br. at 4 and Exh. 1; Interpipe Prehearing Br. at Exh. 6 (Tenaris completes
acquisition of IPSCO Tubulars from TMK, 1/2/2020); U.S. Importer Questionnaire, EDIS Doc. 715849, at II-7, II-11; U.S. Producer Questionnaire, EDIS Doc. 715490, at II-12. *** Hearing Transcript at 142 (Cannistra). ***. ***.
52 See 19 U.S.C. § 1677(B)(ii)(I). 53 CR/PR at Table III-1. 54 CR/PR at Tables III-3, III-4, and III-5.

16
2019.55 TMK’s subject imports from Russia were *** short tons in 2018, *** short tons in
2019, and *** short tons in 2020.56 In September 2020, Tenaris announced plans to upgrade a
plant to produce billets in a wider range of sizes to support the company’s SSLP pipe mills.57
Operating margins for Tenaris’s IPSCO SSLP pipe operations were *** percent in 2018, ***
percent in 2018, and *** percent in 2020.58
We recognize that Tenaris controlled subject imports in 2020 and did not produce SSLP
pipe in 2020 after acquiring the IPSCO plant. However, Tenaris made a substantial investment
when it acquired IPSCO’s facilities, including its SSLP pipe production, and has announced plans
to upgrade its plants despite temporarily idling its operations due to market conditions of
record low oil prices, rig counts, and falling prices for tubulars, which were exacerbated by the
COVID-19 crisis.59 These facts, as well as the decline in Tenaris/IPSCO controlled subject
imports after the acquisition in 2020, suggests that its primary focus is on domestic production
rather than importation. Additionally, no party has argued for Tenaris’ exclusion from the
domestic industry. Given these considerations, we find that appropriate circumstances do not
exist to exclude Tenaris as a related party.
We consequently define the domestic industry to include all domestic producers of the
domestic like product in the definition of the domestic industry.
55 See CR/PR at Table III-5. 56 CR/PR at Tables IV-1 and IV-2. 57 CR/PR at Table III-3. 58 CR/PR at Table VI-3. 59 CR/PR at Tables III-3 and III-4.
17
Negligibility
Pursuant to Section 771(24) of the Tariff Act, imports from a subject country of
merchandise corresponding to a domestic like product shall be deemed negligible if they
account for less than three percent (or four percent in the case of a developing country in a
countervailing duty investigation) of all such merchandise imported into the United States
during the most recent 12 months for which data are available preceding the filing of the
petition.60
The statute further provides that subject imports from a single country that comprise
less than 3 percent of such total imports of the product may not be considered negligible if
there are several countries subject to investigation with negligible imports and the sum of such
imports from all those countries collectively accounts for more than 7 percent of the volume of
all such merchandise imported into the United States.61
A. Arguments of the Parties
Domestic Producers’ Arguments. Domestic Producers argue that the Commission should
use official import statistics to evaluate the volume of subject imports, adjusted as needed, as it
has done in prior investigations of SSLP pipe, and that ***
60 19 U.S.C. §§ 1671d(b), 1673d(b), 1677(24)(A)(i), 1677(24)(B); see also 15 C.F.R. § 2013.1
(developing countries for purposes of 19 U.S.C. § 1677(36)). 61 19 U.S.C. § 1677(24)(A)(ii).

18
***. Domestic Producers argue that when properly calculated subject imports from each
country are not negligible.62 Vallourec further argues that certain discrepancies noted in the
staff report with respect to nonsubject imports from Germany are ***.63 It further argues that
most importers were able to provide ***. It contends that the small discrepancy in the data
***.64
Respondents’ Arguments. TMK argues that subject imports from Russia are negligible
and raises a number of arguments about the appropriate methodology for the negligibility
analysis, including how to determine the products to be excluded from the official import
statistics as products not corresponding to the scope.65 According to TMK, Domestic Producers’
mechanical, boiler, or heat exchange pipe should not be considered to be taken out of official
import statistics if they meet ASTM dimensional requirements.66 Based on the descriptions
provided, TMK argues that *** did not import any mechanical, boiler, or heat exchanger pipes
with side diameters exceeding 16 inches or wall thickness outside dimensional requirements.67
Additionally, it argues that proprietary grade tubing should not be excluded from the data as
out-of-scope unless they do not meet the dimensional
62 Domestic Producers’ Joint Prehearing Brief at 2-3; Vallourec Final Comments at 2. 63 Vallourec Final Comments at 3 (citing CR/PR at D-18-D-20). 64 Vallourec Final Comments at 2-3. 65 TMK Posthearing Brief at 1-15. 66 TMK Posthearing Br. at 8-9. We note that TMK argues that Domestic Producers’ mechanical
tubing under ASTM A-519 should not be excluded from the scope, yet TMK also reported imports of mechanical tubing under ASTM A-519 as out-of-scope products. TMK stated that its out-of-scope products from Russia only pertained to coupling stock. Supplemental Memo, INV-TT-049, at Table D-8-ALT.
67 TMK Posthearing Br. at 8-9.

19
requirements in the scope, the chemical requirements of ASTM A-355, or are made from
stainless steel.68
In addition, TMK maintains that the import volumes that Domestic Producers reported
in their importer questionnaires for in-scope and out-of-scope product imported from *** are
greater than the import volumes shown in official import statistics and therefore cannot be
accurate.69 It argues that in order to calculate a baseline for the minimum denominator
calculations for negligibility, the Commission should use a denominator that includes all imports
of SSLP pipe as provided in the questionnaires, and ensure that none of the out-of-scope
merchandise exceeds the cap for any given country as reported in official import statistics.70
TMK further highlights Section 232 exclusion requests and bills of lading data to demonstrate
certain imports of SSLP pipe are in-scope.71
TMK also argues that imports of Russian origin pipe from Mexico should be excluded
from the Commission’s official import statistics. Additionally, it contends that, because TMK
Overseas’ importer questionnaire reported the only subject merchandise during the period of
investigation (“POI”), the Commission should only use the data in the importer questionnaire to
calculate the total imports of SSLP pipe from Russia.72
68 TMK Posthearing Br. at 8-9 and Exhs. 2.1, 2.2, 3.2, and 3.3. 69 TMK Posthearing Br. at 5 and Exhs. 16 and 17. 70 TMK Posthearing Br. at 6. 71 TMK Posthearing Br. at 8-9 and Exhs. 2.1, 2.2, 3.2, and 3.3. 72 TMK Posthearing Br. at 3.

20
Interpipe argues that the Commission should apply adverse inferences due to a
coordinated effort by Petitioners to adjust the negligibility calculation and assertions that
Vallourec has been misleading and uncooperative in the investigations.73
B. Analysis
As explained above, the HTS subheadings included in the scope definition include both
in-scope and out-of-scope merchandise. In the preliminary phase of the investigations,
negligibility was calculated using country-specific import data from official import statistics and
subtracting out-of-scope merchandise that was reported as being imported under the primary
HTS statistical reporting numbers.74 Only one importer reported out-of-scope imports under
the primary HTS statistical reporting numbers in the preliminary phase of these investigations.75
In the final phase of these investigations, the Commission issued importer questionnaires
seeking information and data regarding any out-of-scope products that were imported under
the primary HTS statistical reporting numbers. There were 17 firms that completed the
importer questionnaire, with six indicating in their certified importer questionnaire response
that they imported out-of-scope products under the primary HTS statistical reporting numbers
during the POI.76
73 Interpipe Final Comments at 3-4. 74 Preliminary Determinations, USITC Pub. 5114 at 12 n.60. The “primary” HTS statistical
reporting numbers are all HTS numbers reported at CR/PR at I-10. 75 CR/PR at I-10 (listing primary HTS statistical reporting numbers). *** reported importing out-
of-scope merchandise under the primary HTS statistical reporting numbers in the preliminary determination. Preliminary Determinations, USITC Pub. 5114 at 12 n.6. *** agree that out-of-scope merchandise was imported under the primary HTS statistical reporting numbers. CR/PR at D-3-5.
76 *** reported out-of-scope products in their importer questionnaires. *** importer questionnaires. *** initially reported in their U.S. importer questionnaire responses no imports of out-of-scope merchandise under the relevant HTS statistical reporting numbers during the POI, but subsequently revised their importer questionnaire responses (after issuance of the Commission’s (Continued...)

21
Consistent with our definition of the domestic like product, negligibility is calculated
using imports from subject and nonsubject sources that correspond to Commerce’s scope of
investigations. Parties disagree about the interpretation of the scope and whether importers
properly reported out-of-scope products. Party arguments have revealed that Commerce’s
scope description is particularly complex and includes, for example, descriptions of product
excluded from the scope but then provides exceptions to those exclusions.77 It is undisputed,
however, that most HTS statistical reporting numbers included in the scope definition cover
more than just SSLP pipe and therefore there are non-SSLP pipe products entering under those
statistical reporting numbers that should not be included in our SSLP pipe import data.78
As discussed above, the Commission must accept Commerce’s determination as to the
scope of imported merchandise that is subsidized or sold at less than fair value, and is not in a
position to go beyond its plain meaning or any other guidance provided by Commerce.79
Parties described the manual review process used to confirm whether products imported under
prehearing report) to report out-of-scope merchandise under the relevant HTS statistical reporting numbers. *** U.S. Importer Questionnaire Response at Question II-3c (February 24, 2021); *** U.S. Importer Questionnaire Response at Question II-3c (February 24, 2021 and March 17, 2021); *** U.S. Importer Questionnaire Response at Question II-3c (February 24, 2021).
77 See, e.g., 86 Fed. Reg. 12909 (Mar. 5, 2021) (scope language including: “Also excluded from the scope of the investigation are (1) all mechanical, boiler, condenser and heat exchange tubing, except when such products conform to the dimensional requirements, i.e., outside diameter and wall thickness, of ASTM A53, ASTM A-106 or API 51 specifications”).
78 Vallourec Posthearing Br. at 4. 79 See, e.g., USEC, Inc. v. United States, 34 Fed. Appx. 725, 730 (Fed. Cir. 2002) (“The ITC may not
modify the class or kind of imported merchandise examined by Commerce.”); Algoma Steel Corp. v. United States, 688 F. Supp. 639, 644 (Ct. Int'l Trade 1988), aff'd, 865 F.2d 240 (Fed. Cir.), cert. denied, 492 U.S. 919 (1989); Goss Graphics System, Inc. v. United States, 33 F. Supp.2d 1082, 1093 (Ct. Int'l Trade 1998). See also NEC Corp., 36 F. Supp.2d at 383 (Ct. Int'l Trade 1998) (“the Commission must accept the determination of Commerce as to the scope of the imported merchandise sold at less than fair value...”); Makita Corp. v. United States, 974 F. Supp. 770, 783 (Ct. Int'l Trade 1997);Cold-Drawn Mechanical Tubing from China and India, Inv. Nos. 701-TA-575-577 (Final), USITC Pub. 4755 at 11-13 (Jan. 2018).

22
the primary HTS statistical reporting numbers were excluded from the scope and many noted
that it was extremely labor intensive and time consuming due to the nature of the scope.80 We
also note that all importers were required to “certify that the information {t}herein supplied in
response to {the} questionnaire is complete and correct to the best of {their} knowledge.”81
Additionally, counsel for importers were required to certify that such information in the
questionnaire response was accurate and complete to the best of the submitter’s knowledge.82
Based on the language of the scope, responding U.S. importers reported volumes of in-
scope SSLP pipe, and several responding U.S. importers also have reported what they consider
to be out-of-scope merchandise that they imported under the primary HTS statistical reporting
numbers, i.e., out-of-scope merchandise that would register in the official import statistics.83
We do not have a reasonable basis on this record for determining some of the products to be
properly reported in these certified questionnaire responses as outside the scope but not
others.84
We have examined the issues raised by TMK comparing revised importer questionnaire
response data to official import statistics.85 We first observe that certain revised questionnaire
responses identify for Germany in 2018 a greater volume of out-of-scope merchandise
80 CR/PR at D-5. 81 Blank importer questionnaire, EDIS Doc. 729228 (Dec. 30, 2020). 82 19 CFR § 207.3(a). 83 We note that multiple importers reported overlapping product descriptions for the non-SSLP
pipe that was imported under the primary HTS statistical reporting numbers, including mechanical tubing and coupling stock. Supplemental Memo, INV-TT-049, at Table D-8-ALT4; see, e.g., *** Importer Questionnaire at II-3c; *** Importer Questionnaire at II-3c.
84 We recognize that there are conflicting party arguments as to the interpretation of the scope of investigation and whether the importers’ reported out-of-scope products are in fact excluded from the scope. However, as noted above, on this record any further interpretation of the scope is a matter for Commerce, not the Commission.
85 TMK’s Posthearing Br. at 1-7, Exhs. 16-17.

23
purportedly imported under the primary HTS statistical reporting numbers than is observed in
the official import statistics for that year under the primary HTS statistical reporting numbers.86
We also observe that questionnaire revisions from ***, combined, report a substantially
greater volume of in-scope product and out-of-scope product purportedly imported under the
primary HTS statistical reporting numbers during the negligibility period than is observed in the
official import statistics.87 Because of these discrepancies, we decline to rely on the reported
out-of-scope merchandise to calculate import volumes from Germany and instead, because
*** is the *** of in-scope SSLP pipe from Germany, we rely on its reported imports of SSLP
pipe from Germany as the best information available for measuring the volume of SSLP pipe
from Germany. Therefore, imports of SSLP pipe from Germany reflect *** reported imports of
SSLP pipe from Germany reported in its importer questionnaire response.88
TMK contends that, because TMK Overseas’ importer questionnaire reported the only
subject merchandise during the POI, the Commission should only use the data in the importer
questionnaire to calculate the total imports of SSLP pipe from Russia. Importer questionnaire
86 CR/PR at D-18. 87 Calculated from *** and *** Importer Questionnaires at questions II-3b and II-3c and Official
Import Statistics, EDIS Doc. 797965 (Mar. 25, 2021). TMK’s Posthearing Brief at Exhibit 17. 88 *** Importer Questionnaire at question II-3b.

24
responses from responding firms report volumes of non-SSLP pipe imported from Russia under
the primary HTS statistical reporting numbers. We find that reported imports of SSLP pipe from
Russia in importer questionnaire responses of the TMK companies constitute the best available
information for calculating the volume of imports of SSLP pipe from Russia and base our import
data for Russia accordingly.89
No importers reported importing SSLP pipe or out-of-scope merchandise under the
primary HTS numbers from Czechia or Korea. While one importer did report imports of SSLP
pipe from Ukraine, these reported imports *** in the primary HTS statistical reporting numbers
for the negligibility period, and no importers reported imports of out-of-scope merchandise
from Ukraine.90 Consequently, we find that official import statistics constitute the best
available information for measuring subject imports from these countries.91 Importers have
reported quantities of out-of-scope merchandise imported under the primary HTS statistical
reporting numbers collectively from all other sources; we accordingly subtract these reported
non-SSLP pipe quantities from the volumes
89 Calculated from *** Importer Questionnaires at question II-3b. TMK argued that official
import statistics include Russian origin products that were imported into the United States from Mexico. TMK’s Posthearing Brief at 3. However, because Tenaris reports in its brief that ***. Tenaris’s Posthearing Br. at 8; *** U.S. Importer Questionnaire at question II-3b.
90 Interpipe reported *** short tons of SSLP pipe during the negligibility period, while the total volume of imports from Ukraine in the primary HTS statistical reporting numbers for the negligibly period was *** short tons. *** Importer Questionnaire at question II-3b; Official Import Statistics, EDIS Doc. 797965 (Mar. 25, 2021).
91 Official Import Statistics, EDIS Doc. 797965 (Mar. 25, 2021).

25
recorded in the official import statistics to calculate imports of SSLP pipe from all other
sources.92 93
Based on importer questionnaire responses and official import statistics, the data for
the 12 month period preceding the filing of these petitions, July 2019 through June 2020,
indicate that subject imports from Czechia were *** percent of total imports of SSLP pipe.94
Therefore, we find that subject imports from Czechia exceed the statutory negligibility
threshold.
Cumulation
For purposes of evaluating the volume and effects for a determination of material injury
by reason of subject imports, section 771(7)(G)(i) of the Tariff Act requires the Commission to
cumulate subject imports from all countries as to which petitions were filed and/or
investigations self-initiated by Commerce on the same day, if such imports compete with each
other and with the domestic like product in the U.S. market. In assessing whether subject
imports compete with each other and with the domestic like product, the Commission generally
has considered four factors:
92 Calculated from Official Import Statistics, EDIS Doc. 797965 (Mar. 25, 2021) and ***, ***,
***, and *** Importer Questionnaires at question II-3c. 93 We acknowledge that TMK raised with respect to imports from Italy and Argentina – two
countries that fall within the “all others” category – concerns that are similar to those noted above with respect to imports from Germany, namely that the reported in-scope and out-of-scope merchandise from Italy and Argentina exceed the volumes recorded under the primary HTS statistical reporting numbers. However, TMK’s claims with respect to imports from these countries could not be verified and the Commission therefore declines to disregard the out-of-scope volumes reported for these countries.
94 Calculated from Official Import Statistics, EDIS Doc. 797965 (Mar. 25, 2021), ***, ***, and *** Importer Questionnaires at question II-3b, and ***, ***, ***, and *** Importer Questionnaires at question II-3c.
26
(1) the degree of fungibility between subject imports from different countries and between subject imports and the domestic like product, including consideration of specific customer requirements and other quality related questions;
(2) the presence of sales or offers to sell in the same geographic markets of subject imports from different countries and the domestic like product;
(3) the existence of common or similar channels of distribution for subject imports from different countries and the domestic like product; and
(4) whether the subject imports are simultaneously present in the market.95
While no single factor is necessarily determinative, and the list of factors is not
exclusive, these factors are intended to provide the Commission with a framework for
determining whether the subject imports compete with each other and with the domestic like
product.96 Only a “reasonable overlap” of competition is required.97
A. Arguments of the Parties
Domestic Producers’ Arguments. Domestic Producers note that the petitions for each
subject country were filed on the same day, and assert that there is a reasonable overlap of
competition between subject imports from each country and the domestic like product.98
Specifically, Domestic Producers claim that SSLP pipe from Czechia, Korea, Ukraine, and Russia
95 See Certain Cast-Iron Pipe Fittings from Brazil, the Republic of Korea, and Taiwan, Inv. Nos.
731-TA-278-280 (Final), USITC Pub. 1845 (May 1986), aff’d, Fundicao Tupy, S.A. v. United States, 678 F. Supp. 898 (Ct. Int’l Trade), aff’d, 859 F.2d 915 (Fed. Cir. 1988).
96 See, e.g., Wieland Werke, AG v. United States, 718 F. Supp. 50 (Ct. Int’l Trade 1989). 97 The Statement of Administrative Action (SAA) to the Uruguay Round Agreements Act (URAA),
expressly states that “the new section will not affect current Commission practice under which the statutory requirement is satisfied if there is a reasonable overlap of competition.” H.R. Rep. No. 103-316, Vol. I at 848 (1994) (citing Fundicao Tupy, S.A. v. United States, 678 F. Supp. at 902; see Goss Graphic Sys., Inc. v. United States, 33 F. Supp. 2d 1082, 1087 (Ct. Int’l Trade 1998) (“cumulation does not require two products to be highly fungible”); Wieland Werke, AG, 718 F. Supp. at 52 (“Completely overlapping markets are not required.”).
98 Domestic Producers Prehearing Br. at 8-10.

27
are fungible with each other and with the domestic like product and are sold in overlapping
regions of the United States, mainly to distributors. Additionally, they contend that the
domestic like product and subject imports were simultaneously present in the market, with
subject imports from each of the subject countries present in nearly every month of the POI.99
Respondents’ Arguments. No respondent parties provided arguments about cumulation
for an analysis of present material injury.
B. Analysis and Conclusion
As an initial matter, the statutory requirement is satisfied because the petitioner filed
the antidumping and countervailing duty petitions with respect to Czechia, Korea, Russia, and
Ukraine on the same day, July 8, 2020. As explained below, we find there is a reasonable
overlap of competition between subject imports from each of the subject countries, and
between subject imports from each source and the domestic like product based on the
following considerations.
Fungibility. The record in these investigations indicates that domestically produced SSLP
pipe and subject imports produced to the same or similar standards and specifications are
reasonably fungible. All responding U.S. producers and purchasers and a majority of
responding importers reported that the domestic like product and subject imports from each of
the four subject countries are “always” or “frequently” interchangeable, and that subject
imports from each subject country are “always” or “frequently” interchangeable with each
other.100 Pluralities or majorities of purchasers found that domestically produced SSLP pipe are
99 Domestic Producers Prehearing Br. at 9-10. 100 CR/PR at Table II-11.
28
comparable with subject imports from Czechia in 14 out of 16 factors and from Korea, Russia,
and Ukraine in 12 out of 16 factors.101 Varieties of SSLP pipe eight inches or less in diameter
comprise the majority of U.S. shipments from domestic producers and subject imports from
each country, with the exception of Russia and Ukraine,102 and products from each source are
made to similar standards and specifications.103
Channels of Distribution. Subject imports and the domestic like product shared the
same channels of distribution, with a majority of importers’ and domestic producers’ U.S.
shipments sold to distributors and lesser amounts to end users.104
Geographic Overlap. U.S. producers reported selling SSLP pipe to all regions of the
contiguous United States.105 Subject imports were sold in all regions of the United States, and
imports from each subject country were sold to the Central Southwest region.106 Official
import data indicate that the largest concentration of subject imports entered the U.S. market
through the South and lesser amounts in other regions, although imports from some subject
countries are not imported into all regions.107
101 CR/PR at Table II-10. 102 CR/PR at Table IV-5 (showing U.S. shipments for all range of sizes of SSLP pipe for both
domestic producers and U.S. importers of subject merchandise). 103 CR/PR at I-13-14; Conference Tr. at 29-30 (Arevalo). 104 CR/PR at Table II-2. U.S. producers U.S. shipments to distributors ranged from *** percent
to *** percent from 2018 to 2020, with the remainder to end-users. U.S. importers reported U.S. shipments of subject imports from Korea, Russia, and Ukraine ***, and *** U.S. shipments of subject imports from Czechia were to ***. Id.
105 CR/PR at Table II-3. 106 CR/PR at Table II-3. U.S. importers reported U.S. shipments of subject imports from Korea
only in the Central Southwest. Id. Questionnaire responses for U.S. importers of subject merchandise from Korea were limited, accounting for *** percent of imports from Korea in 2020. CR/PR at IV-1.
107 CR/PR at Table IV-6. For subject imports from each subject country, the largest concentration of imports was in the South. Subject imports from each subject country were imported into overlapping geographic regions; there were no subject imports from Czechia into the West, no subject imports from Russia into the East, North, or West, and no subject imports from Ukraine into the North. Id.

29
Simultaneous Presence in Market. Subject imports from Czechia, Korea, and Ukraine
were present in every month of the POI, while subject imports from Russia were present in 25
of 36 months.108 Domestic producers reported U.S. shipments of the domestic like product in
each full year of the POI.109
Conclusion. The record indicates that subject imports from the four subject countries
are fungible with the domestic like product and each other, and that subject imports from each
subject country and the domestic like product are sold in similar channels of distribution, in
similar geographic markets, and have been simultaneously present in the U.S. market. In light
of the foregoing, we find that there is a reasonable overlap of competition between the
domestic like product and imports from each subject country and between imports from each
subject country. Accordingly, we analyze subject imports from Czechia, Korea, Russia, and
Ukraine on a cumulated basis for our analysis of whether the domestic industry is materially
injured by reason of subject imports.
Material Injury by Reason of Subject Imports
Based on the record in the final phase of these investigations, we find that an industry in
the United States is materially injured by reason of imports of SSLP pipe from Czechia that
Commerce has found to be sold in the United States at less than fair value.
A. Legal Standards
In the final phase of antidumping and countervailing duty investigations, the
Commission determines whether an industry in the United States is materially injured or
108 CR/PR at Table IV-7. 109 CR/PR at Table III-7.
30
threatened with material injury by reason of the imports under investigation.110 In making this
determination, the Commission must consider the volume of subject imports, their effect on
prices for the domestic like product, and their impact on domestic producers of the domestic
like product, but only in the context of U.S. production operations.111 The statute defines
“material injury” as “harm which is not inconsequential, immaterial, or unimportant.”112 In
assessing whether the domestic industry is materially injured by reason of subject imports, we
consider all relevant economic factors that bear on the state of the industry in the United
States.113 No single factor is dispositive, and all relevant factors are considered “within the
context of the business cycle and conditions of competition that are distinctive to the affected
industry.”114
Although the statute requires the Commission to determine whether the domestic
industry is “materially injured or threatened with material injury by reason of” unfairly traded
imports,115 it does not define the phrase “by reason of,” indicating that this aspect of the injury
analysis is left to the Commission’s reasonable exercise of its discretion.116 In identifying a
causal link, if any, between subject imports and material injury to the domestic industry, the
Commission examines the facts of record that relate to the significance of the volume and price
110 19 U.S.C. §§ 1671d(b), 1673d(b). 111 19 U.S.C. § 1677(7)(B). The Commission “may consider such other economic factors as are
relevant to the determination” but shall “identify each {such} factor ... and explain in full its relevance to the determination.” 19 U.S.C. § 1677(7)(B).
112 19 U.S.C. § 1677(7)(A). 113 19 U.S.C. § 1677(7)(C)(iii). 114 19 U.S.C. § 1677(7)(C)(iii). 115 19 U.S.C. §§ 1671d(b), 1673d(b). 116 Angus Chemical Co. v. United States, 140 F.3d 1478, 1484-85 (Fed. Cir. 1998) (“{T}he statute
does not ‘compel the commissioners’ to employ {a particular methodology}.”), aff’d, 944 F. Supp. 943, 951 (Ct. Int’l Trade 1996).
31
effects of the subject imports and any impact of those imports on the condition of the domestic
industry. This evaluation under the “by reason of” standard must ensure that subject imports
are more than a minimal or tangential cause of injury and that there is a sufficient causal, not
merely a temporal, nexus between subject imports and material injury.117
In many investigations, there are other economic factors at work, some or all of which
may also be having adverse effects on the domestic industry. Such economic factors might
include nonsubject imports; changes in technology, demand, or consumer tastes; competition
among domestic producers; or management decisions by domestic producers. The legislative
history explains that the Commission must examine factors other than subject imports to
ensure that it is not attributing injury from other factors to the subject imports, thereby
inflating an otherwise tangential cause of injury into one that satisfies the statutory material
injury threshold.118 In performing its examination, however, the Commission need not isolate
117 The Federal Circuit, in addressing the causation standard of the statute, observed that “{a}s
long as its effects are not merely incidental, tangential, or trivial, the foreign product sold at less than fair value meets the causation requirement.” Nippon Steel Corp. v. USITC, 345 F.3d 1379, 1384 (Fed. Cir. 2003). This was further ratified in Mittal Steel Point Lisas Ltd. v. United States, 542 F.3d 867, 873 (Fed. Cir. 2008), where the Federal Circuit, quoting Gerald Metals, Inc. v. United States, 132 F.3d 716, 722 (Fed. Cir. 1997), stated that “this court requires evidence in the record ‘to show that the harm occurred “by reason of” the LTFV imports, not by reason of a minimal or tangential contribution to material harm caused by LTFV goods.’” See also Nippon Steel Corp. v. United States, 458 F.3d 1345, 1357 (Fed. Cir. 2006); Taiwan Semiconductor Industry Ass’n v. USITC, 266 F.3d 1339, 1345 (Fed. Cir. 2001).
118 SAA at 851-52 (“{T}he Commission must examine other factors to ensure that it is not attributing injury from other sources to the subject imports.”); S. Rep. 96-249 at 75 (1979) (the Commission “will consider information which indicates that harm is caused by factors other than less-than-fair-value imports.”); H.R. Rep. 96-317 at 47 (1979) (“in examining the overall injury being experienced by a domestic industry, the ITC will take into account evidence presented to it which demonstrates that the harm attributed by the petitioner to the subsidized or dumped imports is attributable to such other factors;” those factors include “the volume and prices of nonsubsidized imports or imports sold at fair value, contraction in demand or changes in patterns of consumption, trade restrictive practices of and competition between the foreign and domestic producers, developments in technology and the export performance and productivity of the domestic industry”); accord Mittal Steel, 542 F.3d at 877.

32
the injury caused by other factors from injury caused by unfairly traded imports.119 Nor does
the “by reason of” standard require that unfairly traded imports be the “principal” cause of
injury or contemplate that injury from unfairly traded imports be weighed against other factors,
such as nonsubject imports, which may be contributing to overall injury to an industry.120 It is
clear that the existence of injury caused by other factors does not compel a negative
determination.121
Assessment of whether material injury to the domestic industry is “by reason of” subject
imports “does not require the Commission to address the causation issue in any particular way”
as long as “the injury to the domestic industry can reasonably be attributed to the subject
imports.”122 The Commission ensures that it has “evidence in the record” to “show that the
119 SAA at 851-52 (“{T}he Commission need not isolate the injury caused by other factors from
injury caused by unfair imports.”); Taiwan Semiconductor Industry Ass’n, 266 F.3d at 1345 (“{T}he Commission need not isolate the injury caused by other factors from injury caused by unfair imports ... . Rather, the Commission must examine other factors to ensure that it is not attributing injury from other sources to the subject imports.” (emphasis in original)); Asociacion de Productores de Salmon y Trucha de Chile AG v. United States, 180 F. Supp. 2d 1360, 1375 (Ct. Int’l Trade 2002) (“{t}he Commission is not required to isolate the effects of subject imports from other factors contributing to injury” or make “bright-line distinctions” between the effects of subject imports and other causes.); see also Softwood Lumber from Canada, Inv. Nos. 701-TA-414 and 731-TA-928 (Remand), USITC Pub. 3658 at 100-01 (Dec. 2003) (Commission recognized that “{i}f an alleged other factor is found not to have or threaten to have injurious effects to the domestic industry, i.e., it is not an ‘other causal factor,’ then there is nothing to further examine regarding attribution to injury”), citing Gerald Metals, 132 F.3d at 722 (the statute “does not suggest that an importer of LTFV goods can escape countervailing duties by finding some tangential or minor cause unrelated to the LTFV goods that contributed to the harmful effects on domestic market prices.”).
120 S. Rep. 96-249 at 74-75; H.R. Rep. 96-317 at 47. 121 See Nippon Steel Corp., 345 F.3d at 1381 (“an affirmative material-injury determination under
the statute requires no more than a substantial-factor showing. That is, the ‘dumping’ need not be the sole or principal cause of injury.”).
122 Mittal Steel, 542 F.3d at 876 &78; see also id. at 873 (“While the Commission may not enter an affirmative determination unless it finds that a domestic industry is materially injured ‘by reason of’ subject imports, the Commission is not required to follow a single methodology for making that determination ... {and has} broad discretion with respect to its choice of methodology.”) citing United States Steel Group v. United States, 96 F.3d 1352, 1362 (Fed. Cir. 1996) and S. Rep. 96-249 at 75. In its (Continued...)

33
harm occurred ‘by reason of’ the LTFV imports,” and that it is “not attributing injury from other
sources to the subject imports.” 123 The Federal Circuit has examined and affirmed various
Commission methodologies and has disavowed “rigid adherence to a specific formula.”124
The question of whether the material injury threshold for subject imports is satisfied
notwithstanding any injury from other factors is factual, subject to review under the substantial
evidence standard.125 Congress has delegated this factual finding to the Commission because
of the agency’s institutional expertise in resolving injury issues.126
B. Conditions of Competition and the Business Cycle
The following conditions of competition inform our analysis of whether there is material
injury by reason of subject imports.
1. Captive Productive Provision
The captive production provision127 can be applied only if, as a threshold matter,
significant production of the domestic like product is internally transferred and significant
decision in Swiff-Train v. United States, 793 F.3d 1355 (Fed. Cir. 2015), the Federal Circuit affirmed the Commission’s causation analysis as comporting with the Court’s guidance in Mittal.
123 Mittal Steel, 542 F.3d at 873 (quoting from Gerald Metals, 132 F.3d at 722), 877-79. We note that one relevant “other factor” may involve the presence of significant volumes of price-competitive nonsubject imports in the U.S. market, particularly when a commodity product is at issue. In appropriate cases, the Commission collects information regarding nonsubject imports and producers in nonsubject countries in order to conduct its analysis.
124 Nucor Corp. v. United States, 414 F.3d 1331, 1336, 1341 (Fed. Cir. 2005); see also Mittal Steel, 542 F.3d at 879 (“Bratsk did not read into the antidumping statute a Procrustean formula for determining whether a domestic injury was ‘by reason’ of subject imports.”).
125 We provide in our discussion below a full analysis of other factors alleged to have caused any material injury experienced by the domestic industry.
126 Mittal Steel, 542 F.3d at 873; Nippon Steel Corp., 458 F.3d at 1350, citing U.S. Steel Group, 96 F.3d at 1357; S. Rep. 96-249 at 75 (“The determination of the ITC with respect to causation is ... complex and difficult, and is a matter for the judgment of the ITC.”).
127 The captive production provision, 19 U.S.C. § 1677(7)(C)(iv), as amended by the Trade Preferences Extension Act of 2015, provides: (Continued...)

34
production is sold in the merchant market.128 US Steel argues that if the data for *** is
used,129 the captive production provision applies, and the Commission should focus primarily
on competition in the merchant market.130 No other party has made an argument as to
whether the captive production provision applies.
The domestic industry internally consumed between *** percent and *** percent and
transferred to related firms between *** percent and *** percent of U.S. producers’ U.S.
shipments of SSLP pipe during the POI.131 The domestic industry’s commercial U.S. shipments
accounted for between *** percent and *** percent.132 Thus, we determine that the
threshold criterion is satisfied, and we next consider the first and second statutory criterion.
(iv) CAPTIVE PRODUCTION – If domestic producers internally transfer significant production of the domestic like product for the production of a downstream article and sell significant production of the domestic like product in the merchant market, and the Commission finds that-
(I) the domestic like product produced that is internally transferred for processing into that downstream article does not enter the merchant market for the domestic like product, and
(II) the domestic like product is the predominant material input in the production of that downstream article.
The SAA indicates that where a domestic like product is transferred internally for the production of another article coming within the definition of the domestic like product, such transfers do not constitute internal transfers for the production of a “downstream article” for purposes of the captive production provision. SAA at 853.
128 The definition of an “internal transfer” for purposes of the captive production provision was addressed in Bethlehem Steel Corp. v. United States, 294 F. Supp. 2d 1359, 1364-1368 (Ct. Int’l Trade 2003).
129 As discussed above, after receiving revisions to *** U.S. producer questionnaire response, the Commission has included the revised data in the domestic industry data compilation.
130 U.S. Steel Final Comments at 3. U.S. Steel does not address the sizeable portion of the internally transferred product that appears to enter the merchant market for the domestic like product. Id. at n.14.
131 CR/PR at III-9 and 10, and Table III-7. 132 CR/PR at Table III-7.

35
The first criterion requires that the domestic like product that is internally transferred
for processing into downstream articles does not enter the merchant market for the domestic
like product.133 *** reported diverting *** percent of its SSLP pipe intended for internal
consumption to the merchant market.134 Moreover, for the *** that reported transfers to
related firms, the majority of these transfers to related firms were for resale, as-is.135
Accordingly, we find that the first criterion has not been met.
When applying the second statutory criterion, we generally consider whether the
domestic like product is the predominant material input into a downstream product by
referring to its share of the raw material cost of the downstream product.136 *** indicated
that SSLP pipe accounted for *** percent of the cost of the downstream products produced
from SSLP pipe.137 We find that SSLP pipe accounts for a predominate share of the cost of the
downstream products in which it is used, and thus, this criterion is satisfied in these
investigations.
133 See, e.g., Hot-Rolled Steel Products from Argentina and South Africa, Inv. Nos. 701-TA-404,
731-TA-898, 905 (Final), USITC Pub. 3446 at 15-16 (Aug. 2001); Certain Cold-Rolled Steel Products from Argentina, Brazil, China, Indonesia, Japan, Russia, Slovakia, South Africa, Taiwan, Turkey and Venezuela, Inv. Nos. 701-TA-393 and 731-TA-829-40 (Final) (Remand), USITC Pub. 3691 at 2 & n.19 (May 2004).
134 Internal consumption by *** resulted in the sale of *** short tons of the *** short tons of SSLP pipe intended for internal consumption to the merchant market. *** sold *** short tons of the *** short tons of SSLP pipe that was transferred to related firms to the merchant market. *** Captive Consumption Questionnaire.
135 CR/PR at III-9 and 10. 136 See generally, e.g., Polyethylene Terephthalate Film, Sheet and Strip from Brazil, China,
Thailand, and the United Arab Emirates, Inv. Nos. 731-TA-1131-1134 (Final), USITC Pub. 4040 at 17 n.103 (October 2008). The Commission has construed “predominant” material input to mean the main or strongest element, and not necessarily a majority, of the inputs by value. See Polyvinyl Alcohol from Germany and Japan, Inv. Nos. 731-TA-1015-16 (Final), USITC Pub. 3604 at 15 n.69 (June 2003).
137 CR/PR at III-12.

36
Accordingly, as only one of the two required criteria are satisfied, we find that the
captive production provision does not apply and will focus our analysis on the overall SSLP pipe
market.
2. Data Coverage
U.S. industry data are based on the questionnaire responses of five firms believed to
account for the majority of U.S. production of SSLP pipe in 2020.138 U.S. import data are based
on official Commerce import statistics under HTS statistical reporting numbers referenced in
the scope of investigations and responses to the Commission’s importer questionnaires. For
the reasons discussed above, subject imports from Czechia, Korea, and Ukraine are based on
official import statistics;139 subject imports from Russia are based on questionnaire responses
of two firms accounting for *** percent of U.S. imports from Russia;140 nonsubject imports of
SSLP pipe from Mexico and Germany are each based on questionnaire responses from ***,
reportedly accounting for all imports from each country;141 and all other nonsubject sources
were based official import statistics less out-of-scope products imported under the primary HTS
statistical reporting numbers reported by four firms.142
138 CR at III-1. 139 Calculated from Official Import Statistics, EDIS Doc. 797965 (Mar. 25, 2021). 140 CR/PR at VII-10; Calculated from *** and *** Importer Questionnaires at question II-7a. 141 *** Importer Questionnaire at question II-9a (Germany) and *** Importer Questionnaire at
question II-10a (Mexico). 142 Calculated from Official Import Statistics, EDIS Doc. 797965 (Mar. 25, 2021) and ***, ***,
***, and *** Importer Questionnaires at question II-13.

37
3. Demand Considerations
SSLP pipes are used to convey gases and liquids in industrial piping systems, including in
the energy industry and nonresidential construction.143 Reported end uses include oil and gas
pipelines, well gathering lines, process pipe/LP, refinery and chemical plants, hydrocarbon
processing facilities, and automotive, industrial, and construction applications.144 SSLP pipe
accounts for a small share of the end-use products in which it is used, with the reported shares
of end-use costs ranging from two percent for well gathering lines, three percent for
hydrocarbon processing facilities, and up to 11.3 percent for pipelines.145
Demand for SSLP pipe is derived from demand for downstream applications, particularly
in the oil and gas market; higher oil/natural gas prices result in increased drilling and more
demand for SSLP pipe.146 During the POI, crude oil prices fluctuated but were 26 percent lower
in December 2020 than in January 2018.147 Oil price declines were particularly acute in 2020
due to travel restrictions resulting from COVID-19 mitigation efforts and the Russia-Saudi
Arabia disagreement over oil production that resulted in a global oversupply of oil.148 Natural
gas prices followed similar trends, fluctuating over the period, but were 30 percent lower in
December 2020 than in January 2018.149 The number of oil and gas rigs fluctuated, but
143 CR/PR at II-10. 144 CR/PR at II-10. 145 CR/PR at II-11. 146 CR/PR at II-8. 147 CR/PR at II-8 and Figure II-1. Crude oil prices generally increased from January through
October 2018 before declining irregularly in 2019, and sharply from January to April 2020, but generally increased through the remainder of the year. Id.
148 CR/PR at II-8-9. 149 CR/PR at II-8 and Figure II-1. Natural gas prices increased irregularly from January to
November 2018 before declining through June 2020 and increasing the remainder of the period. Id.

38
decreased overall by 62 percent from January 2018 to December 2020.150 Responding firms
reported that there are limited substitutes for SSLP pipe in certain applications.151
All responding U.S. producers and a majority of responding importers and purchasers
indicated that demand for SSLP pipe is subject to business cycles and/or distinct conditions of
competition, with reported cycles including oil and gas prices, industrial demand, seasonal
drilling activity, import competition, and slow fourth quarter business due to inventory taxes.152
Four U.S. producers, seven importers, and six purchasers reported that these cycles or
conditions had changed over the POI, including a historic decline in demand in 2020 resulting
from the COVID-19 pandemic and diminished oil and gas demand, Section 232 measures
changing demand for imports over the POI, a decline in demand resulting from falling oil and
gas prices, and import competition.153 The majority of responding U.S. producers, importers,
and purchasers reported that U.S. demand for SSLP pipe decreased or fluctuated over the
POI.154
150 CR/PR at II-9 and Figure II-2. The number of oil and gas rigs increased from January 2018
through December 2018 and then declined through August 2020 and increased over the remainder of the period. Id.
151 CR/PR at II-12. Two of five U.S. producers, seven of 13 U.S. importers, and 11 of 16 purchasers reported that there were no substitutes for SSLP pipe. Reported substitutes for certain applications, including welded or plastic pipe for onshore applications, ERW welded pipe in the gas industry, and coiled steel line pipe, fiberglass, polyethylene pipe, and HDPE pipe for flow lines and liquid gases. Id.
152 CR/PR at II-11. 153 CR/PR at II-11. 154 CR/PR at Table II-5. Three U.S. producers reported that demand had decreased, and two
reported it had fluctuated. Of 15 responding U.S. importers, nine reported that demand had decreased, five that it had fluctuated, and one that it had not changed. Ten purchasers reported demand had decreased, and two reported that it fluctuated. Id.

39
Apparent U.S. consumption of SSLP pipe decreased from *** short tons in 2018 to ***
short tons in 2019 to *** short tons in 2020, for an overall decline of *** percent from 2018 to
2020.155
4. Supply Considerations
The domestic industry held the second largest share of the U.S. market over the POI. Its
market share initially fell from *** percent in 2018 to *** percent in 2019, and then rose to
*** percent in 2020.156 While the domestic industry’s annual SSLP pipe production capacity
increased each year between 2018 and 2020,157 its annual production decreased.158 Its
capacity utilization rate decreased from 56.8 percent in 2018, to 32.8 percent in 2019, and 19.8
percent in 2020.159
Subject imports accounted for the smallest share of the U.S. market. Their market share
increased from *** percent in 2018 to *** percent in 2019 and ***, as apparent U.S.
consumption declined.160
Nonsubject imports accounted for the largest share of the U.S. market over the POI.
Their market share was *** percent in 2018, *** percent in 2019, and *** percent in
155 Calculated from Official Import Statistics, EDIS Doc. 797965 (Mar. 25, 2021), ***, ***, ***,
***, ***, ***, and *** Importer Questionnaires at questions II-7a, II-9a, II-10a, and II-13 and ***, ***, ***, ***, and *** U.S. Producer Questionnaire at question II-7 (“Final Market Share/Volume of Imports Worksheet”).
156 Final Market Share/Volume of Imports Worksheet. 157 CR/PR at Table III-5. The domestic industry’s annual production capacity for SSLP pipe was
722,501 short tons in 2018, 726,417 short tons in 2019, and 727,379 short tons in 2020. Id. 158 CR/PR at Table III-5. The domestic industry’s annual production of SSLP pipe was 410,736
short tons in 2018, 238,062 short tons in 2019, and 143,721 short tons in 2020. Id. 159 CR/PR at Table III-5. 160 Final Market Share/Volume of Imports Worksheet
40
2020.161 The leading sources of these imports during the POI were Mexico, Germany, and
Japan.162
5. Substitutability and Other Conditions
The record indicates that there is a high degree of substitutability between domestically
produced SSLP pipe and SSLP pipe from subject sources for the same or similar products. The
degree of substitutability between domestic and imported SSLP pipe depends on factors such
as price, quality (e.g., grade standards, defect rates), and conditions of sale (e.g.,
discounts/rebates, lead times between order and delivery date, reliability of supply, and
product services).163 A majority of responding U.S. producers, purchasers, and importers
reported that domestically produced SSLP pipe and subject imports from each source are
“always” or “frequently” interchangeable.164 A majority of purchasers rated the domestic like
product and imports from each subject country as comparable for a majority of the purchasing
factors most frequently identified by purchasers as “very important.”165 166 Both domestic
161 Final Market Share/Volume of Imports Worksheet. 162 CR/PR at IV-7. 163 CR/PR at II-12. 164 CR/PR at Table II-11. 165 Factors most frequently identified as “very important” by a majority of purchasers were
availability, quality meets industry standards, price, product consistency, reliability of supply, delivery time, delivery terms, approved manufactures’ list, and product range. CR/PR at Table II-8.
166 CR/PR at Table II-10. A majority of purchasers reported that the domestic like product was inferior to SSLP pipe from Czechia for price and superior for delivery time; the domestic like product was inferior to SSLP pipe from Korea for price and superior for approved manufactures’ list and delivery time; the domestic like product was inferior to SSLP pipe from Russia for price and was superior for delivery terms, delivery time, and product range; the domestic like product was inferior to SSLP pipe from Ukraine for price and superior for approved manufactures’ list, availability, delivery time, and product range; and the domestic like product was inferior to SSLP pipe from nonsubject sources for price. Id.

41
producers and importers from subject sources reported U.S. shipments of SSLP pipe in all size
ranges for articles subject to investigation.167
We find that price is an important factor in purchasing decisions for SSLP pipe. Price
was among the most often cited top-three factors considered in purchasing decisions by
purchasers.168 Half of responding purchasers (7 of 14) reported that they usually purchase the
lowest priced product; while the other half reported that they sometimes purchase the lowest
priced product.169 All responding domestic producers and the majority of importers and
purchasers reported that there are “sometimes” or “never” significant differences other than
price between domestic SSLP pipe and subject imports.170
Buy America programs and approved manufacture lists (“AMLs”) are features of this
market. With respect to Buy America programs, the record shows that purchases under these
programs affect only a minority of all purchases.171 With respect to AMLs, U.S. producers and
167 CR/PR at Table IV-5. Domestic producers and U.S. importers from Ukraine reported U.S.
shipments of all sizes; U.S. importers from Czechia reported U.S. shipments of SSLP pipe 12 inches and less; U.S. importers from Russia reported U.S. shipments of SSLP pipe 6 to 12 inches and 14 to 16 inches. Questionnaire responses for importers from Korea were limited, with shipments reported only for SSLP pipe 6 inches and less in diameter for Korea. Id.
168 CR/PR at Table II-7. Price was the most frequently reported first-most important factor by purchasers overall, price and availability were the most frequently reported second-most important factor, and availability was the most frequently reported third-most important factor. Id.
169 CR/PR at II-14. 170 CR/PR at Table II-13. All responding domestic producers reported that there are
“sometimes” or “never” significant differences other than price. For U.S. importers, majorities reported that there are “sometimes” or “never” significant differences other than price, including five of nine firms regarding subject imports from Czechia, four of five firms regarding subject imports from Korea, and all but one responding firm regarding subject imports from both Russia and Ukraine. Id.
171 Eleven of 14 purchasers reported that most or all of their purchases did not require purchasing domestically produced SSLP pipe. CR/PR at II-16. Vallourec states that the Buy America provision does not have a meaningful impact on the domestic SSLP pipe market given that the intended uses and applications are for industries in the U.S. private industrial sector with few, if any, government projects. Id. at II-16 n.19. Indeed, Interpipe estimated that the portion of available sales governed by (Continued...)
42
importers of subject merchandise both reported that a portion of their shipments required an
AML listing, albeit in varying amounts, indicating that imported product competes for sales in
the portion of the market requiring or preferring to purchase from AMLs.172 Moreover, in
comparing SSLP pipe made by firms on AMLs with those made by firms not on AMLs, one U.S.
producer reported that such products were “usually” interchangeable, and one U.S. producer
and eleven importers reported that such products were “sometimes” interchangeable. In other
words, while a number of importers have reported some limitations on interchangeability
between AML and non-AML product, there remains a substantial degree of interchangeability
according even to these importers. In addition, purchasers were equally or nearly split on
whether the domestic like product and subject imports are comparable or the domestic like
product is superior with respect to AMLs.173 Further, the vast majority of responding
purchasers indicated that both domestically produced SSLP pipe and subject imports always or
usually meet minimum quality specifications.174 Thus, while we acknowledge that AMLs
feature significantly in the U.S. market and purchasing decisions, their impact on the degree of
these provisions accounted for approximately 5 percent of the U.S. market. Interpipe Posthearing Brief Answers to Commission’s Questions at 15; id. at Exh. 1 (Valk Decl.).
172 Vallourec reported that *** percent of its commercial sales were made under AMLs, while Benteler reported the figure at *** percent. Most responding importers reported at least half of their commercial sales were made under AMLs: *** and *** reported 50 percent of their commercial sales were made under AMLs, ***, ***, and *** reported between 60 and 70 percent; *** reported 90 percent; and *** reported 100 percent. *** reported that only 5 percent of its commercial shipments in 2020 were made under AMLs, while *** reported only 20 percent of its sales. CR/PR at II-16-17. However, the record reflects that AMLs are not necessarily exclusive of subject imports. See, e.g., Vallourec Posthearing Br., Exh. 12 (identifying an AML that includes Interpipe). Indeed, the many AMLs provided by Interpipe in its own posthearing submission included multiple firms with facilities in Czechia, Korea, and Russia. Interpipe Posthearing Br., Exh. 4 at PDF 311, 347, 408.
173 CR/PR at II-17 and Table II-10. 174 CR/PR at Table II-14.

43
substitutability between domestically produced SSLP pipe and subject imports, especially when
considered alongside other factors, such as price, considered by purchasers in their purchasing
decisions, does not rise to a level that would warrant deviating from our finding above.
Raw materials used in the production of SSLP pipe include solid steel billets, scrap metal,
alloys, and other additives.175 Raw materials as a share of costs of goods sold (“COGS”)
decreased from *** percent in 2018 to *** percent in 2020.176 Scrap steel and pig iron prices
fluctuated but increased overall from January 2018 to January 2021, from by *** percent for
scrap steel and *** percent for pig iron.177 Most U.S. producers and importers reported that
raw material costs fluctuated over the POI.178
Subject imports from each subject country have been subject to additional measures
during the POI, pursuant to Section 232 of the Trade Expansion Act of 1962, as amended
(“Section 232”).179 Subject imports from Czechia were subject to 25 percent duties effective
June 1, 2018, and subject imports from Russia and Ukraine were subject to 25 percent duties
effective March 23, 2018.180 Effective May 1, 2018, annual quota limits were applied to subject
imports from Korea.181 A majority of producers, importers, and purchasers reported that
Section 232 measures did not impact the supply of U.S.-produced SSLP pipe.182 A plurality of
purchasers indicated that Section 232 measures did not have an impact on the supply of
175 CR/PR at V-1. 176 CR/PR at V-1. According to Vallourec, scrap metal accounted for *** percent of its raw
material costs. Id. 177 CR/PR at Figure V-1 and V-1. 178 CR/PR at V-3. Three of five U.S. producers and 11 of 14 importers reported that raw material
costs fluctuated over the POI. *** reported that the scrap market is very volatile. Id. 179 19 U.S.C. § 1862. 180 CR/PR at I-10-12. 181 CR/PR at Table I-8 (detailing annual quota limits for applicable HTS subheadings). 182 CR/PR at Table II-1.

44
imported SSLP pipe, while a plurality of importers reported that supply decreased and a
majority of producers reported that supply fluctuated.183 Nearly all U.S. producers, importers,
and purchasers reported that Section 232 measures had an impact on the price of SSLP pipe.184
A plurality of producers reported that Section 232 measures did not have an impact on overall
demand of SSLP pipe, while a majority of importers reported that it caused demand to
decrease; purchasers were evenly split between it causing no changes and decreasing
demand.185
C. Volume of Cumulated Subject Imports
Section 771(7)(C)(i) of the Tariff Act provides that the “Commission shall consider
whether the volume of imports of the merchandise, or any increase in that volume, either in
absolute terms or relative to production or consumption in the United States, is significant.”186
The volume of cumulated subject imports fluctuated over the POI. Cumulated subject
imports were *** short tons in 2018, *** short tons in 2019, and *** short tons in 2020.187
Cumulated subject imports’ market share increased from *** percent in 2018 to *** percent
in 2019 and *** percent in 2020.188 Cumulated subject imports gained market share in a
declining market from 2018 to 2020.189
183 CR/PR at Table II-1. 184 CR/PR at Table II-1. 185 CR/PR at Table II-1. 186 19 U.S.C. § 1677(7)(C)(i). 187 Final Market Share/Volume of Imports Worksheet. 188 Final Market Share/Volume of Imports Worksheet. 189 Cumulated subject imports’ market share increased by *** percentage points, while
apparent U.S. consumption declined by *** percent from 2018 to 2020. Final Market Share/Volume of Imports Worksheet.

45
We find that the volume of subject imports was significant in absolute terms and
relative to consumption and that the increase in volume relative to consumption in the United
States was also significant during the POI.
D. Price Effects of the Subject Imports
Section 771(7)(C)(ii) of the Tariff Act provides that, in evaluating the price effects of the
subject imports, the Commission shall consider whether
(I) there has been significant price underselling by the imported merchandise as compared with the price of domestic like products of the United States, and
(II) the effect of imports of such merchandise otherwise depresses prices to a significant degree or prevents price increases, which otherwise would have occurred, to a significant degree.190
As previously discussed, we find that the domestic like product and cumulated subject
imports have a high degree of substitutability for the same or similar products, and that price is
an important factor in purchasing decisions.
The Commission collected quarterly data for the total quantity and f.o.b. value for six
SSLP pipe products shipped to unrelated U.S. customers between January 2018 and December
2020.191 Four U.S. producers and eight importers provided usable pricing data for sales of the
190 19 U.S.C. § 1677(7)(C)(ii). 191 The pricing products were as follows: Product 1.-- Seamless pipe stenciled to meet one or more of the following specifications: ASTM
A-106 grade B, ASTM A-53 grade B, API 5L grade B, and API 5L grade X-42 specifications; 3” nominal size (3 1/2 inch OD x 0.3 wall thickness); plain ends.
Product 2.-- Seamless pipe stenciled to meet one or more of the following specifications: ASTM A-106 grade B, ASTM A-53 grade B, API 5L grade B, and API 5L grade X-42 specifications; 4” nominal size (4 1/2 inch OD x 0.237 wall thickness); plain ends.
Product 3.-- Seamless pipe stenciled to meet one or more of the following specifications: ASTM A-106 grade B, ASTM A-53 grade B, API 5L grade B, and API 5L grade X-42 specifications; 6” nominal size (6 5/8 inch OD x 0.280 wall thickness); plain ends. (Continued...)

46
requested products, although not all firms reported pricing for all products for all quarters.192
The data collected account for approximately *** percent of U.S. producers’ commercial
shipments, *** percent of U.S. shipments of subject imports from Czechia, *** percent of U.S.
shipments of subject imports from Korea, *** percent of U.S. shipments of subject imports
from Russia, and *** percent of U.S. shipments of subject imports from Ukraine in 2020.193
The pricing data indicate that cumulated subject imports were priced below
domestically produced product in all 136 quarterly comparisons (involving 103,459 short tons
of SSLP pipe).194 The margins of underselling ranged from 8.6 percent to 49.1 percent and
averaged 29.6 percent.195 Of the 17 responding U.S. purchasers, eight reported that they had
purchased subject imports rather than the domestic product during the POI. Seven of these
purchasers reported that imports were priced lower than the domestic industry, with six
reporting that price was a primary reason for their decision to purchase subject imports rather
Product 4.-- Seamless pipe stenciled to meet one or more of the following specifications: ASTM
A-106 grade B, ASTM A-53 grade B, API 5L grade B, and API 5L grade X-42 specifications; 8” nominal size (8 5/8 inch OD x 0.322 wall thickness); plain ends.
Product 5.-- Seamless pipe stenciled to meet one or more of the following specifications: ASTM A-106 grade B, ASTM A-53 grade B, API 5L grade B, and API 5L grade X-42 specifications; 12” nominal size (12 3/4 inch OD x 0.375 wall thickness); plain ends.
Product 6.-- Seamless pipe stenciled to meet one or more of the following specifications: ASTM A-106 grade B, ASTM A-53 grade B, API 5L grade B, and API 5L grade X-42 specifications; 16” nominal size (16 inch OD x 0.375 wall thickness); plain ends. CR/PR at V-7.
192 CR/PR at V-8. 193 CR/PR at V-8. These percentages reflect the share of U.S. shipments reported in
questionnaire responses; as noted above, importer questionnaires account for *** of U.S. imports from Korea. CR/PR at I-4.
194 CR/PR at Table V-10. 195 CR/PR at Table V-10.

47
than domestic like product.196 Purchasers reported *** short tons of total estimated lost sales
to the domestic industry.197
In light of the record evidence showing universal underselling by cumulated subject
imports in a market in which subject imports and domestic product are highly substitutable and
price is an important purchasing factor, we find that the underselling by subject imports is
significant. In addition, given the purchaser questionnaire responses confirming lost sales and
showing that the subject imports’ low prices influence purchasing decisions, we further find
that this significant underselling caused the domestic industry to lose sales and market share.
Indeed, cumulated subject imports gained *** percentage points of market share during the
POI at the expense of the domestic industry.
We have also considered price trends for the domestic like product and subject imports
during the POI. Domestic prices decreased between January 2018 to December 2020.
Domestic price decreases from the first quarter of the investigation period though the last
quarter for which pricing was available for each pricing product ranged from *** to ***
percent for all products over the POI.198 Ukrainian price decreases ranged from *** to ***
percent for products 1, 3, 4, 5, and 6, and Czech price decreases were *** and *** percent for
products 1 and 4, respectively.199 Price increases of *** percent were reported for product
196 CR/PR at V-26, Table V-12-13. 197 CR/PR at Table V-12. Five purchasers estimated the quantity of SSLP pipe from subject
countries purchased instead of domestic product ranged from *** short tons to *** short tons. Id. 198 CR/PR at Table V-9. Domestic producers did not produce pricing product 5 and 6 in the third
and fourth quarters of 2020. U.S. Steel stated that it was forced to idle the only mill that was able to produce pricing products 5 and 6 in late 2020 due to underselling by subject imports in the face of rising raw material costs. It argues that because pricing products 5 and 6 had the highest average underselling margins, price declines would have been even greater for pricing products 5 and 6 had U.S. Steel’s mill continued operating. U.S. Steel Posthearing Br. at I-2.
199 CR/PR at Table V-9.

48
2 from Ukraine, and price increases of *** and *** percent were reported for products 2 and
3, respectively, from Czechia.200 Three purchasers also reported that domestic producers had
reduced prices to compete with lower priced subject imports, with two reporting price
decreases of *** percent and *** percent.201
The evidence demonstrates that there were substantial declines in the prices of the
domestic like product and subject imports during the POI in a declining market. These declines
occurred amid a substantial decline in apparent U.S. consumption, but competition from low-
priced subject imports exacerbated these declines, as evident by large purchasers confirming
that domestic producers reduced prices to compete with subject imports. Consequently, we
find that low-priced subject imports placed downward pressure on domestic prices.
The domestic industry’s average ratio of COGS to net sales increased by *** percentage
points from *** percent in 2018 to *** percent in 2019 and by an additional *** percentage
points to *** percent in 2020, for an overall period increase of *** percentage points.202 The
overall increase in the ratio of COGS to net sales was largely driven by declines in the industry’s
total net sales, as production and shipments declined and the industry’s fixed costs were spread
over a smaller volume of sales.203 In addition, the industry
200 CR/PR at Table V-9. The percentage change was not reported for any products from Korea or
Russia because pricing data for ten or more quarters were not reported. Id. at Note. 201 CR/PR at Table V-14. The third purchaser reported that ***. Id. Those purchasers who
confirmed domestic price reductions, ***, together accounted for *** percent of purchasers reported domestic product purchases over the POI. Calculated from CR/PR at Table V-11.
202 CR/PR at Table VI-1. 203 See CR/PR at Table VI-1 and VI-12 n.10. The industry’s production declined by *** percent
from 2018 to 2020 and its U.S. shipments declined by *** percent. Id. at Table C-1. The industry’s per-unit labor costs increased by *** percent from 2018 to 2020, and per-unit other factory costs increased by *** percent, while per-unit raw material costs declined by *** percent. Id. at Table VI-2.

49
experienced decreases in its net sales average unit value (“AUV”) over the investigation period,
particularly later in the investigation period which also contributed to the increase in the
industry’s ratio of COGS to net sales. Specifically, the domestic industry’s unit COGS increased
by *** percent from *** in 2017 to *** in 2019 before decreasing by *** percent to *** in
2020, for an overall period increase of *** percent,204 and its net sales AUV decreased by ***
percent from *** in 2018 to *** in 2019 and by an additional *** percent to *** in 2020, for
an overall period decrease of *** percent.205 We note that these declines in the domestic
industry’s net sales AUV, which were most pronounced in the latter half of the POI, occurred
during a period of pronounced decline in apparent U.S. consumption, which was also greater in
the latter half of the POI.206 Thus, we cannot conclude that cumulated subject imports
prevented price increases which otherwise would have occurred to a significant degree.
We find that underselling by cumulated subject imports was significant during the POI
and placed downward pressure on prices. The significant underselling enabled cumulated
subject imports to take sales and market share from the domestic industry. We therefore find
that cumulated subject imports had significant price effects on the domestic industry.
204 CR/PR at Tables VI-1, VI-2, C-1. The domestic industry’s unit direct labor costs increased by
*** percent over the investigation period, and other factory costs increased by *** percent over the investigation period. CR/PR at Table VI-2. Unit labor costs were $ *** per short tons in 2018, $ *** per short tons in 2019, and $ *** per short tons in 2020. Id. at Table VI-1.
205 CR/PR at Tables VI-1, VI-2, C-1. Unit other factory costs were $ *** per short tons in 2018, $ *** per short tons in 2019, and $ *** per short tons in 2020. Id. at Table VI-1. We take into account that the decline in demand in 2019 and 2020 contributed to the domestic industry’s lower production and higher unit costs.
206 Apparent U.S. consumption decreased from *** short tons in 2018 to *** short tons in 2019 to *** short tons in 2020, for an overall decline of *** percent from 2018 to 2020. Final Market Share/Volume of Imports Worksheet.

50
E. Impact of the Subject Imports207
Section 771(7)(C)(iii) of the Tariff Act provides that examining the impact of subject
imports, the Commission “shall evaluate all relevant economic factors which have a bearing on
the state of the industry.”208 These factors include output, sales, inventories, capacity
utilization, market share, employment, wages, productivity, gross profits, net profits, operating
profits, cash flow, return on investment, return on capital, ability to raise capital, ability to
service debts, research and development, and factors affecting domestic prices. No single
factor is dispositive and all relevant factors are considered “within the context of the business
cycle and conditions of competition that are distinctive to the affected industry.”209
207 The statute instructs the Commission to consider the “magnitude of the dumping margin” in
an antidumping proceeding as part of its consideration of the impact of imports. 19 U.S.C. § 1677(7)(C)(iii)(V). In its final determination of sales at less value, Commerce found dumping margins of 51.07 percent for imports from Czechia. Seamless Carbon and Alloy Steel Standard, Line, and Pressure Pipe From the Czech Republic: Final Affirmative Determination of Sales at Less Than Fair Value, 86 Fed. Reg. 12909 (Mar. 5, 2021).
We have considered the above dumping margins. In addition to this consideration, our impact analysis has considered other factors affecting domestic prices. Our analysis of the significant underselling and price effects of cumulated subject imports, described in both the price effects discussion and below, is particularly probative to an assessment of the impact of the subject imports on the domestic industry.
208 19 U.S.C. § 1677(7)(C)(iii); see also SAA at 851 and 885 (“In material injury determinations, the Commission considers, in addition to imports, other factors that may be contributing to overall injury. While these factors, in some cases, may account for the injury to the domestic industry, they also may demonstrate that an industry is facing difficulties from a variety of sources and is vulnerable to dumped or subsidized imports.”).
209 19 U.S.C. § 1677(7)(C)(iii). This provision was amended by the Trade Preferences Extension Act of 2015, Pub. L. 114-27.

51
The domestic industry’s performance declined over the POI. The industry’s production
capacity increased,210 while its production211 and capacity utilization declined.212 The domestic
industry’s U.S. shipments declined 64.0 percent from 2018 to 2020, although apparent U.S.
consumption decreased by only *** percent.213 Although the domestic industry’s inventories
decreased absolutely, the ratio of inventories relative to production and shipments increased
over the POI.214
The domestic industry also lost market share to the cumulated subject imports that
significantly undersold the domestic product. The industry’s share of apparent U.S.
consumption fell from *** percent in 2018 to *** percent in 2019, and rose to *** percent in
2020.215
The domestic industry’s employment-related indicia generally declined over the POI.
From 2018 to 2020, the domestic industry’s number of production related workers (“PRWs”),216
210 The domestic industry’s capacity was 722,501 short tons in 2018, 726,417 short tons in 2019,
and 727,379 short tons in 2020. CR/PR at Table III-5. 211 The industry’s production was 410,736 short tons in 2018, 238,062 short tons in 2019, and
143,721 short tons in 2020. CR/PR at Table III-5. 212 The domestic industry’s capacity utilization was 56.8 percent in 2018, 32.8 percent in 2019,
and 19.8 percent in 2020. CR/PR at Table III-5. 213 CR/PR at Table C-1. The domestic industry’s U.S. shipments were 399,784 short tons in 2018,
233,989 short tons in 2019, and 144,054 short tons in 2020. Id. 214 CR/PR at Table III-8. U.S. producer’s end-of-year inventories were *** short tons in 2018,
*** short tons in 2019, and *** short tons in 2020. The ratio of inventories relative to production increased from *** percent in 2018 to *** percent in 2020. Inventories grew as a share of total shipments from *** percent in 2018 to *** percent in 2020. Id.
215 Final Market Share/Volume of Imports Worksheet. 216 The number of PRWs declined from 1,129 in 2018 to 1,001 in 2019 and 679 in 2020. CR/PR at
Table III-10.
52
hours worked,217 wages paid, 218 hourly wages, 219 and worker productivity declined.220 Unit
labor costs increased each year of the POI.221
The domestic industry’s financial performance deteriorated over the POI. The domestic
industry’s sales revenue,222 gross profits,223 operating income decreased each year of the
POI.224 Similarly, operating and net income margins also decreased each year of the POI.225
Capital expenditures and research and development also decreased.226 The domestic industry’s
assets and its return on assets declined from 2018 to 2020.227 Finally, four of five responding
217 Total hours worked declined from 2.3 million hours in 2018 to 2.0 million hours in 2019 and
1.3 million hours in 2020. CR/PR at Table III-10. 218 Wages paid decreased from $98.6 million in 2018 to $80.1 million in 2019 and $54.2 million
in 2020. CR/PR at Table III-10. 219 Hourly wages fell from $42.69 in 2018 to $40.21 in 2019 and rose to $41.62 in 2020. CR/PR at
Table III-10. 220 Productivity was 177,800 short tons per 1,000 hours in 2018, 119,500 short tons per 1,000
hours in 2019, and 110,300 short tons per 1,000 hours in 2020. CR/PR at Table III-10. 221 Unit labor costs were $240 in 2018, $336 in 2019, and $377 in 2020. CR/PR at Table III-10.
222 The domestic industry’s total net sales were $ *** in 2018, $ *** in 2019, and $ *** in 2020. CR/PR at Table VI-1.
223 The domestic industry’s gross profits were *** in 2018, *** in 2019, and *** in 2020. CR/PR at Table VI-1.
224 Its operating income was *** in 2018, *** in 2019, and *** in 2020. CR/PR at Table VI-1. 225 The domestic industry’s operating income as a share of net sales was 8.0 percent in 2018, a
loss of 2.2 percent in 2019, and a loss of 14.4 percent in 2020. CR/PR at Table VI-1. The domestic industry’s net income as a share of net sales was *** percent in 2018, *** percent in 2019, and *** percent in 2020. Id.
226 Capital expenditures declined from $33.2 million in 2018 to $29.4 million in 2019, and $13.5 million in 2020. Research and development expenses declined from $ *** in 2018 to $ *** in 2019, and $ *** in 2020. CR/PR at Table VI-6.
227 Total net assets were $750.9 million in 2018, $521.8 million in 2019, and $423.5 million in 2020. CR/PR at Table VI-8. The industry’s operating return on assets was *** percent in 2018, *** percent in 2019, and *** percent in 2020. Id.

53
domestic producers reported negative effects on investment and five reported negative effects
on growth and development due to subject imports.228
From 2018 to 2020, significant volumes of cumulated subject imports entered the U.S.
market that significantly undersold the domestic like product and took sales and market share
from the domestic industry. Purchasers have also reported that domestic producers reduced
prices to compete with lower-priced subject imports, thus contributing to downward pressures
on price and declining revenues. As a result, the domestic industry’s output and revenues were
lower than they would have been otherwise. Consequently, the domestic industry’s
production, shipments, and financial performance declined from 2018 to 2020, with the
domestic industry sustaining operating and net losses in 2019 and 2020. Based on the
foregoing, we find that subject imports had a significant impact on the domestic industry.229
We have also considered whether there are other factors that may have had an impact
on the domestic industry during the POI to ensure that we are not attributing injury from such
228 CR/PR at Tables VI-10 and VI-11. Negative effects on investment reported by U.S. producers
included cancellation, postponement, or rejection of expansion projects and return on specific investments. Negative effects on growth and development reported included lowering of credit rating, lowered ability to service debt, and ***. Id.
229 Interpipe cites to Certain Seamless Carbon and Alloy Steel Standard, Line, and Pressure Pipe from China, Inv. Nos. 701-TA-469 and 731-TA-1168 (Final), USTIC Pub. 4190 (November 2010) (“SSLP pipe from China”) and argues that the domestic industry in the present case has not experienced material injury by reason of cumulated subject imports. As reviewing courts have held, however, each Commission injury investigation “is sui generis, involving a unique combination and interaction of many economic variables,” that the Commission may reasonably reach different outcomes in cases with different circumstances, and that Commission proceedings involving “different statutory provisions” from injury investigations are of limited relevance. See, e.g., Hitachi Metals Ltd. v. United States, 949 F.3d 710, 718 (Fed. Cir. 2020). Regardless, Interpipe’s assertion that the facts are similar is not supported by the record. The Commission in SSLP Pipe from China relied on, inter alia, the favorable demand, increased domestic prices, and double-digit operating profits in its negative present material industry determination. SSLP Pipe from China, USITC Pub. 4190 at 24, 27. In the present case, demand has significantly declined, the industry’s performance has deteriorated, and the industry had double-digit operating losses. CR/PR at Table C-1.

54
other factors to cumulated subject imports. We acknowledge that apparent U.S. consumption
declined *** percent during the POI.230 Nevertheless, the declines in apparent U.S.
consumption do not explain the larger declines in the domestic industry’s output during this
period,231 nor do they explain the domestic industry’s loss of market share to cumulated
subject imports.232 The significant underselling by subject imports, which resulted in lost sales
and market share for the domestic industry indicate that the decline in demand alone cannot
account for the domestic industry’s poor performance.
Nonsubject imports accounted for *** percent of apparent U.S. consumption in 2018,
*** percent in 2019, and *** in 2020.233 Nonsubject imports’ market share fluctuated and
230 Final Market Share/Volume of Imports Worksheet. 231 While apparent U.S. consumption fell by *** percent from 2018 to 2020, production fell by
*** percent, commercial U.S. shipments by *** percent, and total U.S. shipments by *** percent. Derived from CR/PR Table III-7.
232 Subject imports gained *** percentage points in market share from 2018 to 2020 while the domestic industry experienced a loss of *** percentage points over the POI. Final Market Share/Volume of Imports Worksheet.
233 Final Market Share/Volume of Imports Worksheet. Interpipe also notes that certain sources of nonsubject imports, including from Mexico (the
largest source of nonsubject imports), are exempt from Section 232 measures, and demand for these imports have increased during the POI. Interpipe Br. at 36 & Exh. 2 (noting that imports from Mexico were exempted from Section 232 measures effective May 19, 2019). Interpipe also notes that domestic producers import from nonsubject sources. CR/PR at Table III-9.
However, we do not find that the imports from nonsubject countries, including imports from Mexico, explain the domestic industry’s loss of market share and revenues over the POI. The AUVs for imports from Mexico and all nonsubject sources were above subject imports’ AUVs throughout the POI and above domestic AUVs in 2018 and 2019. Although domestic producers imported from nonsubject countries, they reported that the products they imported could not be produced at their U.S. production facilities. Vallourec Posthearing Br. at 6. Additionally, Congress has stated that the Commission does not consider foreign operations or import operations of domestic producers in measuring the impact of imports on the domestic industry. S. Rep. No. 100-171, 100th Cong., 1st Sess. 117 (1988); See also H. Rep. 100-40, 100th Cong., 1st Sess. 128-29 (1988). Instead, the statute instructs the Commission to assess the impact of imports on domestic producers of domestic like products, but only in the context of domestic production operations within the United States. 19 U.S.C. § 1677(7)(B)(III).

55
decreased slightly, compared to the significant increase by cumulated subject imports.234
Additionally, nonsubject imports’ AUVs were above subject imports’ AUVs throughout the POI
and above domestic AUVs in 2018 and 2019.235 Consequently, the presence of nonsubject
imports in the U.S. market during the POI cannot explain the domestic industry’s loss of market
share and revenues from 2018 to 2020.
We consequently conclude that other causes cannot explain the injury we have
attributed to the cumulated subject imports. We accordingly determine that the domestic
industry was materially injured by reason of cumulated subject imports.236
Conclusion
For the reasons stated above, we determine that an industry in the United States is
materially injured by reason of subject imports of SSLP pipe from Czechia that are sold in the
United States at less than fair value.
234 Nonsubject imports *** by *** percentage point from 2018 to 2020, while subject imports
increased by *** percentage points. Final Market Share/Volume of Imports Worksheet. 235 CR/PR at Table C-1. The AUVs for nonsubject imports from Mexico were also higher than
subject imports’ AUVs throughout the POI and were higher than domestic AUVs in 2019. Id. 236 Interpipe argues that competition between the domestic like product and subject imports is
attenuated because subject imports are not materially competing for sales with higher-priced domestic product due to subject imports’ limited eligibility for AMLs, limited access to end-users, and limited overlap of certain sizes of SSLP pipe. Interpipe Prehearing Br. at 57-58. Although we acknowledge that there is a portion of the U.S. market meaningfully impacted by AMLs, as we discuss above, we are not persuaded that this consideration warrants a finding of a lower degree of substitutability and similarly find that this consideration does not demonstrate that competition between the domestic like product and subject imports is attenuated. We additionally observe that there was a substantial overlap in the channels of distribution, with a majority of U.S. shipments to distributors and lesser amounts to end users for the domestic like product and imports from each subject country, and that there was overlap in all outer diameter sizes of SSLP pipe, with U.S. shipments in all outer diameter size categories from less than 2 inches outer diameter up to 16 inches by U.S. producers and subject import in 2020. CR/PR at Tables II-2, IV-5. Thus, we find that these considerations also do not support a finding that competition is attenuated between subject imports and the domestic like product.


I-1
Introduction
Background
These investigations result from petitions filed with the U.S. Department of Commerce (“Commerce”) and the U.S. International Trade Commission (“USITC” or “Commission”) by Vallourec Star, LP (“Vallourec”), Houston, Texas, on July 8, 2020, alleging that an industry in the United States is materially injured and threatened with material injury by reason of subsidized imports of seamless carbon and alloy steel standard, line, and pressure pipe (“SSLP pipe”)1 by the Governments of Korea and Russia and less-than-fair-value (“LTFV”) imports of SSLP pipe from Czechia, Korea, Russia, and Ukraine. The following tabulation provides information relating to the background of these investigations.2 3
Effective date Action July 8, 2020 Petitions filed with Commerce and the Commission;
institution of Commission investigations (85 FR 42431, July 14, 2020)
July 20, 2020 Commerce’s notice of initiation AD (85 FR 47176, August 4, 2020)
July 20, 2020 Commerce’s notice of initiation CVD (85 FR 47170, August 4, 2020)
August 24, 2020 Commission’s preliminary determinations (85 FR 53398, August 28, 2020)
December 11, 2020 Commerce’s preliminary CVD determination – Korea (85 FR 80024, December 11, 2020)
December 11, 2020 Commerce’s preliminary CVD determination – Russia (85 FR 80007, December 11, 2020)
December 15, 2020 Commerce’s preliminary AD determination – Czechia (85 FR 83059, December 21, 2020)
December 15, 2020 Scheduling of final phase of Commission investigations (85 FR 86946, December 31, 2020)
1 See the section entitled “The subject merchandise” in Part I of this report for a complete
description of the merchandise subject in this proceeding. 2 Pertinent Federal Register notices are referenced in appendix A, and may be found at the
Commission’s website (www.usitc.gov). 3 Appendix B is reserved for the witnesses appearing at the Commission’s hearing.

I-2
Effective date Action February 10, 2021 Commerce’s preliminary antidumping duty
determinations, postponement of final determination, and extension of provisional measures—Korea (86 FR 8887, February 10, 2021); Russia (86 FR 8891, February 10, 2021); Ukraine (86 FR 8889, February 10, 2021)
March 4, 2021 Commission’s hearing
March 5, 2021 Commerce’s final affirmative determination of sales at less than fair value – Czechia (86 FR 12909, March 5, 2010)
April 1, 2021 Commission’s vote - Czechia
April 19, 2021 Commission’s views
Statutory criteria
Section 771(7)(B) of the Tariff Act of 1930 (the “Act”) (19 U.S.C. § 1677(7)(B)) provides that in making its determinations of injury to an industry in the United States, the Commission--
shall consider (I) the volume of imports of the subject merchandise, (II) the effect of imports of that merchandise on prices in the United States for domestic like products, and (III) the impact of imports of such merchandise on domestic producers of domestic like products, but only in the context of production operations within the United States; and. . . may consider such other economic factors as are relevant to the determination regarding whether there is material injury by reason of imports.
Section 771(7)(C) of the Act (19 U.S.C. § 1677(7)(C)) further provides that--4
In evaluating the volume of imports of merchandise, the Commission shall consider whether the volume of imports of the merchandise, or any increase in that volume, either in absolute terms or relative to production or consumption in the United States is significant.. . .In evaluating the effect of imports of such merchandise on prices, the Commission shall consider whether. . .(I) there has been significant price underselling by the imported merchandise as compared with the price of domestic like products of the United States, and (II) the effect of imports of such merchandise otherwise depresses prices to a significant degree or prevents price increases, which otherwise would have occurred, to a significant degree.. . . In examining the impact required to be considered under subparagraph (B)(i)(III), the Commission shall evaluate (within the
4 Amended by PL 114-27 (as signed, June 29, 2015), Trade Preferences Extension Act of 2015.

I-3
context of the business cycle and conditions of competition that are distinctive to the affected industry) all relevant economic factors which have a bearing on the state of the industry in the United States, including, but not limited to. . . (I) actual and potential decline in output, sales, market share, gross profits, operating profits, net profits, ability to service debt, productivity, return on investments, return on assets, and utilization of capacity, (II) factors affecting domestic prices, (III) actual and potential negative effects on cash flow, inventories, employment, wages, growth, ability to raise capital, and investment, (IV) actual and potential negative effects on the existing development and production efforts of the domestic industry, including efforts to develop a derivative or more advanced version of the domestic like product, and (V) in {an antidumping investigation}, the magnitude of the margin of dumping. In addition, Section 771(7)(J) of the Act (19 U.S.C. § 1677(7)(J)) provides that—5 (J) EFFECT OF PROFITABILITY.—The Commission may not determine that there is no material injury or threat of material injury to an industry in the United States merely because that industry is profitable or because the performance of that industry has recently improved.
Organization of report
Part I of this report presents information on the subject merchandise, subsidy/dumping margins, and domestic like product. Part II of this report presents information on conditions of competition and other relevant economic factors. Part III presents information on the condition of the U.S. industry, including data on capacity, production, shipments, inventories, and employment. Parts IV and V present the volume of subject imports and pricing of domestic and imported products, respectively. Part VI presents information on the financial experience of U.S. producers. Part VII presents the statutory requirements and information obtained for use in the Commission’s consideration of the question of threat of material injury as well as information regarding nonsubject countries.
Market summary
SSLP pipe is generally is used in the oil industry to convey petrochemicals, oil products, and natural gas, though it has applications in the automotive and chemical processing industries for the conveyance of water, steam, chemicals, and among other liquids and gasses.
5 Amended by PL 114-27 (as signed, June 29, 2015), Trade Preferences Extension Act of 2015.

I-4
The leading U.S. producers of SSLP pipe are ***, while leading producers of SSLP pipe outside the United States include *** of Russia and *** of Ukraine. The leading U.S. importer of SSLP pipe from Ukraine is ***, while the leading importers of SSLP pipe from Czechia are ***. Leading importers of SSLP pipe from Argentina, Brazil, Germany, France, Italy, and Mexico include ***. The Commission received responses to its U.S. purchasers’ questionnaire from 17 purchasers, the top five purchasers being: ***.6
Apparent U.S. consumption of SSLP pipe totaled approximately *** short tons (*** million) in 2020. Currently, five firms are known to produce SSLP pipe in the United States. U.S. producers’ U.S. shipments of SSLP pipe totaled 144,054 short tons ($210.8 million) in 2020, and accounted for *** percent of apparent U.S. consumption by quantity and *** percent by value. U.S. imports from subject sources totaled *** short tons (*** million) in 2020 and accounted for *** percent of apparent U.S. consumption by quantity and *** percent by value. U.S. imports from nonsubject sources totaled 231,467 short tons ($395.5 million) in 2020 and accounted for *** percent of apparent U.S. consumption by quantity and *** percent by value.
Summary data and data sources
A summary of data collected in these investigations is presented in appendix C, table C-1. Except as noted, U.S. industry data are based on questionnaire responses of five firms that accounted for most of U.S. production of SSLP pipe during 2020. U.S. imports are based on official U.S. import statistics under HTS statistical reporting numbers referenced in the scope.
Additional data regarding imported SSLP pipe are based on the responses of 17 U.S. importers that accounted for *** percent of U.S. imports of SSLP pipe from subject sources, accounting for *** percent of U.S. imports from Czechia, *** percent of U.S. imports from Korea, *** percent of U.S. imports from Russia and *** percent of U.S. imports from Ukraine.7
6 See Part II, “U.S. purchasers,” and Part V, “Lost sales and lost revenue.” 7 The response rates presented are calculated based on a comparison of the quantity of 2020 U.S.
imports of SSLP pipe as reported in the responses to the Commission’s U.S. importer questionnaires
(continued...)

I-5
Previous and related investigations
SSLP pipe has been the subject of two prior countervailing duty investigations and ten prior antidumping duty investigation in the United States. Table I-1 summarizes information on previous and related title VII investigations. Table I-1: SSLP pipe: Previous and related Commission proceedings
Original Investigation
Current Status Year Investigation
No(s). Countries Outcome
1994 731-TA-707 Argentina Affirmative Orders revoked after second review, May 18, 2007. 72 FR 28027
1994 731-TA-708 Brazil Affirmative Orders revoked after second review, May 18, 2007. 72 FR 28027
1994 731-TA-709 Germany Affirmative Orders continued after third review, Feb. 28, 2018. 83 FR 8651
1994 701-TA-362 and 731-TA-710
Italy Affirmative Orders revoked after first review, July 16, 2001. 66 FR 36999
1999 731-TA-846 Czechia Affirmative Orders revoked after first review, May 11, 2006. 71 FR 27463
1999 731-TA-847 Japan Affirmative Orders continued after third review, November 13, 2017. 82 FR 52275
1999 731-TA-848 Mexico Affirmative Orders revoked after first review, May 11, 2006. 71 FR 27461
1999 731-TA-849 Romania Affirmative Orders continued after third review, November 13, 2017. 82 FR 52275
1999 731-TA-850 South Africa Affirmative Orders revoked after first review, May 11, 2006. 71 FR 27463
2009 701-TA-469 and 731-TA-1168
China Affirmative Orders continued after first review, March 16, 2016. 81 FR 14089
Note: “Date” refers to the year in which the investigation or review was instituted by the Commission. Source: U.S. International Trade Commission publications and Federal Register notices.
In June 1994, the Commission instituted investigations on SSLP pipe from Argentina, Brazil, Germany, and Italy in response to petitions filed by the Gulf States Tube Division of Quanex Corp. The Commission determined that an industry in the United States was materially injured by reason of imports of SSLP pipe from Argentina, Brazil, Germany, and Italy that had
with the total quantity of imports reported in 2020 U.S. official import statistics which were adjusted to exclude out-of-scope products.

I-6
been found by Commerce to be sold in the United States at LTFV, and to be subsidized by the government of Italy. In August 1995, Commerce issued orders on SSLP pipe from Argentina, Brazil, Germany, and Italy. After the first sunset review of the orders, the Commission determined that SSLP pipe from Italy would not be likely to lead to continuation or recurrence of material injury to an industry in the United States within a reasonably foreseeable time. At the same time, Commerce issued a continuation of antidumping orders with respect to Argentina, Brazil, and Germany as the Commission determined that revocation of the antidumping orders on SSLP from Argentina, Brazil, and Germany would likely lead to continuation or recurrence of material injury within a reasonably foreseeable time. After the second sunset review, antidumping orders on Argentina and Brazil were revoked while antidumping orders on Germany continued even after its third review in 2017.
In June 1999, the Commission instituted investigations on large- and small-diameter SSLP pipe from the Czech Republic (“Czechia”), Japan, Mexico, Romania, and South Africa in response to petitions filed by Koppel Steel Corp., Sharon Tube Co., U.S. Steel Group, and Vision Metals’ Gulf States Tube Division. The Commission determined that an industry in the United States was materially injured by reason of imports of small-diameter SSLP pipe from Czechia, Japan, Romania, and South Africa and large-diameter SSLP pipe from Japan and Mexico that had been found by Commerce to be sold in the United States at LTFV. After the first sunset review of the orders, the Commission determined that revocation of the antidumping duty orders on small-diameter SSLP pipe from Czechia and South Africa, and large-diameter SSLP pipe from Mexico, would not be likely to lead to continuation or recurrence of material injury within a reasonably foreseeable time. Imports of large-diameter SSLP pipe from Japan and small-diameter SSLP pipe from Japan and Romania were determined to likely lead to continuation or recurrence of material injury within a reasonably foreseeable time, and orders have continued after the third sunset review.
In September 2009, the Commission instituted investigations on SSLP pipe from China in response to petitions filed by U.S. Steel Corporation; V&M Star, LP; and TMK IPSCO. The Commission determined that an industry in the United States was threatened with material injury by reason of imports of SSLP pipe from China that have been found by Commerce to be sold in the United States at LTFV, and to be subsidized by the government of China. These orders were continued after the first review as the Commission determined that revocation of the orders would be likely to lead to continuation or recurrence of material injury within a foreseeable time.
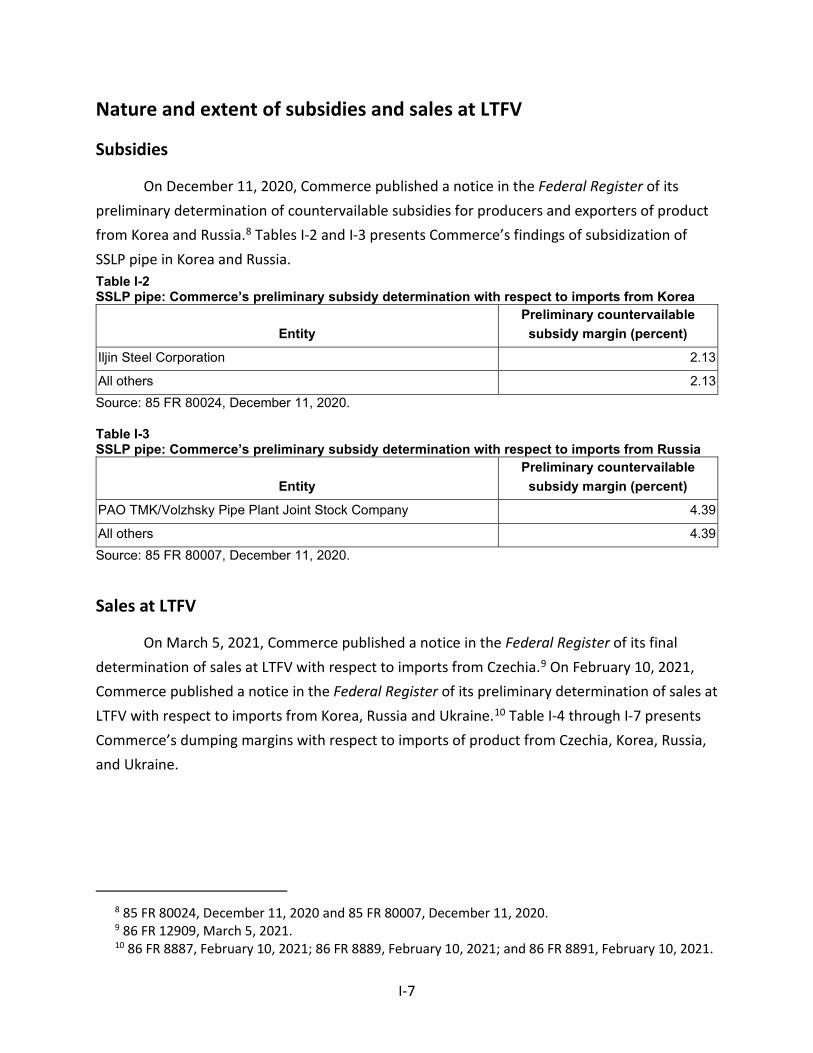
I-7
Nature and extent of subsidies and sales at LTFV
Subsidies
On December 11, 2020, Commerce published a notice in the Federal Register of its preliminary determination of countervailable subsidies for producers and exporters of product from Korea and Russia.8 Tables I-2 and I-3 presents Commerce’s findings of subsidization of SSLP pipe in Korea and Russia. Table I-2 SSLP pipe: Commerce’s preliminary subsidy determination with respect to imports from Korea
Entity Preliminary countervailable subsidy margin (percent)
Iljin Steel Corporation 2.13
All others 2.13 Source: 85 FR 80024, December 11, 2020.
Table I-3 SSLP pipe: Commerce’s preliminary subsidy determination with respect to imports from Russia
Entity Preliminary countervailable subsidy margin (percent)
PAO TMK/Volzhsky Pipe Plant Joint Stock Company 4.39
All others 4.39 Source: 85 FR 80007, December 11, 2020.
Sales at LTFV
On March 5, 2021, Commerce published a notice in the Federal Register of its final determination of sales at LTFV with respect to imports from Czechia.9 On February 10, 2021, Commerce published a notice in the Federal Register of its preliminary determination of sales at LTFV with respect to imports from Korea, Russia and Ukraine.10 Table I-4 through I-7 presents Commerce’s dumping margins with respect to imports of product from Czechia, Korea, Russia, and Ukraine.
8 85 FR 80024, December 11, 2020 and 85 FR 80007, December 11, 2020. 9 86 FR 12909, March 5, 2021. 10 86 FR 8887, February 10, 2021; 86 FR 8889, February 10, 2021; and 86 FR 8891, February 10, 2021.

I-8
Table I-4 SSLP pipe: Commerce’s final weighted-average LTFV margins with respect to imports from Czechia
Exporter/producer Final dumping margin (percent) Liberty Ostrava A.S 51.70
Moravia Steel A.S 51.70
All others 51.07 Source: 86 FR 12909, March 5, 2021.
Table I-5 SSLP pipe: Commerce’s preliminary weighted-average LTFV margins with respect to imports from Korea
Exporter/producer Final dumping margin (percent) ILJIN Steel Corporation 4.52
All others 4.52 Source: 86 FR 8887, February 10, 2021.
Table I-6 SSLP pipe: Commerce’s preliminary weighted-average LTFV margins with respect to imports from Russia
Exporter/producer Final dumping margin (percent) PAO TMK/Volzhsky Pipe Plant Joint Stock Company 209.72
All others 209.72 Source: 86 FR 8891, February 10, 2021.
Table I-7 SSLP pipe: Commerce’s preliminary weighted-average LTFV margins with respect to imports from Ukraine
Exporter/producer Final dumping margin (percent) Interpipe Ukraine LLC/PJSC Interpipe Niznedneprovksy Tube Rolling Plant/LLC Interpipe Niko Tube
41.23
All others 41.23 Source: 86 FR 8889, February 10, 2021.

I-9
The subject merchandise
Commerce’s scope
In the current proceeding, Commerce has defined the scope as follows:11
The merchandise covered by the scope of this investigation is seamless carbon and alloy steel (other than stainless steel) pipes and redraw hollows, less than or equal to 16 inches (406.4 mm) in nominal outside diameter, regardless of wall-thickness, manufacturing process (e.g., hot finished or cold-drawn), end finish (e.g., plain end, beveled end, upset end, threaded, or threaded and coupled), or surface finish (e.g., bare, lacquered or coated). Redraw hollows are any unfinished carbon or alloy steel (other than stainless steel) pipe or “hollow profiles” suitable for cold finishing operations, such as cold drawing, to meet the American Society for Testing and Materials (ASTM) or American Petroleum Institute (API) specifications referenced below, or comparable specifications. Specifically included within the scope are seamless carbon and alloy steel (other than stainless steel) standard, line, and pressure pipes produced to the ASTM A-53, ASTM A-106, ASTM A-333, ASTM A-334, ASTM A-589, ASTM A-795, ASTM A-1024, and the API 51 specifications, or comparable specifications, and meeting the physical parameters described above, regardless of application, with the exception of the exclusions discussed below. Specifically excluded from the scope of the investigation are: (1) All pipes meeting aerospace, hydraulic, and bearing tubing specifications, including pipe produced to the ASTM A-822 standard; (2) all pipes meeting the chemical requirements of ASTM A-335, whether finished or unfinished; and (3) unattached couplings. Also excluded from the scope of the investigation are (1) all mechanical, boiler, condenser and heat exchange tubing, except when such products conform to the dimensional requirements, i.e., outside diameter and wall thickness, of ASTM A53, ASTM A-106 or API 51 specifications. Also excluded from the scope of the investigation are: (1) oil country tubular goods consisting of drill pipe, casing, tubing and coupling stock; (2) all pipes meeting the chemical requirements of ASTM A-335 regardless of their conformity to the dimensional requirements of ASTM A-53, ASTM A-106 or API 5L; and (3) the exclusion for ASTM A335 applies to pipes meeting the comparable specifications GOST 550-75.
11 85 FR 83059, December 21, 2020.

I-10
The primary HTS statistical reporting numbers for these investigations include out-of-scope products.12 Regarding out-of-scope products, respondent TMK noted that the scope does not exclude products that meet the physical requirements specified within the scope, proprietary grades, nor all mechanical tubing.13 In response, petitioner Vallourec argued that out-of-scope products could enter under an array of HTS statistical reporting numbers “which could include excluded mechanical tubing as well as other excluded tubing.”14 Staff determined that the provided product specifications were not entirely exclusive from the scope of the investigation due to further workability and possible standard, line, and pressure applications.15
Tariff treatment
Based upon the scope set forth by Commerce, information available to the Commission indicates that the merchandise subject to these investigations is imported under the following provisions of the Harmonized Tariff Schedule of the United States (“HTSUS” or “HTS”): 7304.19.1020, 7304.19.1030, 7304.19.1045, 7304.19.1060, 7304.19.5020, 7304.19.5050, 7304.31.6050, 7304.39.0016, 7304.39.0020, 7304.39.0024, 7304.39.0028, 7304.39.0032, 7304.39.0036, 7304.39.0040, 7304.39.0044, 7304.39.0048, 7304.39.0052, 7304.39.0056, 7304.39.0062, 7304.39.0068, 7304.39.0072, 7304.51.5005, 7304.51.5060, 7304.59.6000, 7304.59.8010, 7304.59.8015, 7304.59.8020, 7304.59.8025, 7304.59.8030, 7304.59.8035, 7304.59.8040, 7304.59.8045, 7304.59.8050, 7304.59.8055, 7304.59.8060, 7304.59.8065, and 7304.59.8070. SSLP pipe provided for in the covered subheadings is accorded a column-1 general duty rate of “Free.”16 Decisions on the tariff classification and treatment of imported goods are within the authority of U.S. Customs and Border Protection.
Section 232 Tariff Treatment
SSLP pipe classifiable under HTS subheadings 7304.19, 7304.31, 7304.39, 7304.51, and 7304.59 were included in the enumeration of iron and steel articles that became subject to the
12 Products are considered out-of-scope if products meet specifications for aerospace, hydraulic,
bearing, boiler, and OCTG pipe and tube specifications. For more information on exclusions, see Department of Commerce, Preliminary Scope Decision Memorandum, January 13, 2021.
13 Respondent TMK’s posthearing brief, p. 7-9. 14 Petitioner Vallourec’s posthearing brief, p. 4. 15 For further analysis refer to Appendix D. 16 HTSUS (2021) Preliminary Revision 3, USITC Publication 5161, February 2021, pp. 73-3, 73-9 – 73-
10, 73-12 – 73-13, and 73-43.

I-11
additional 25 percent ad valorem Section 232 national security import duties,17 as of March 23, 2018.18 See also U.S. notes 16(a) and 16(b) of subchapter III of HTS chapter 99.19 At this time, imports of SSLP pipe originating in Czechia, Ukraine, and Russia are subject to these 25 percent duties; but imports of SSLP pipe originating in Korea are exempted from these duties, subject to annual quota limits (see table I-5).20
Tariff treatment under Section 232 with respect to the subject merchandise in these investigations are as follows:21
Czechia– Imports of SSLP pipe originating in Czechia and other European Union (“EU”) member states were initially exempted from the Section 232 duties when they became effective as of March 23, 2018.22 However, on June 1, 2018, the EU’s exemption was discontinued. Hence, imports of SSLP pipe originating in Czechia and other EU member states continue to remain subject to the 25 percent Section 232 duties.23
Korea– Imports of SSLP pipe originating in Korea were initially exempted from the Section 232 duties when they became effective as of March 23, 2018.24 As of May 1, 2018, the exemption for Korea was continued, however becoming subject to annual quota limits.25 Annual quota
17 Section 232 of the Trade Expansion Act of 1962, as amended (19 U.S.C. 1862) authorizes the
President, on advice of the Secretary of Commerce, to adjust the imports of an article and its derivatives that are being imported into the United States in such quantities or under such circumstances as to threaten to impair the national security.
18 Adjusting Imports of Steel Into the United States, Presidential Proclamation 9705, March 8, 2018, 83 FR 11625, March 15, 2018.
19 HTSUS (2021) Preliminary Revision 3, USITC Publication 5161, February 2021, pp. 99-III-5 – 99-III-7, 99-III-230, 99-III-232 – 99-III-234.
20 The composition of the quota product groups may not exactly match the product scope of this investigation. See the CBP quota bulletin at https://www.cbp.gov/trade/quota/bulletins/qb-19-008-2019-absolute-quota-steel-mill-articles-first-quarter-limits for a full list of product groups as well as their specified quotas and HTS definitions.
21 For a list of Section 232 Presidential Proclamations affecting imports of steel articles, see Appendix table D-2.
22 Adjusting Imports of Steel Into the United States, Presidential Proclamation 9711, March 22, 2018, 83 FR 13361, March 28, 2018.
23 Adjusting Imports of Steel Into the United States, Presidential Proclamation 9740, April 30, 2018, 83 FR 20683, May 7, 2018.
24 Adjusting Imports of Steel Into the United States, Presidential Proclamation 9711, March 22, 2018, 83 FR 13361, March 28, 2018.
25 Adjusting Imports of Steel Into the United States, Presidential Proclamation 9740, April 30, 2018, 83 FR 20683, May 7, 2018.

I-12
limits were continued as of June 1, 2018 and again as of August 13, 2018.26 Table I-8 summarizes these limits by each respective HTS subheading subject to these investigations.
Table I-8 SSLP pipes: Section 232 annual quantitative limitations for Korea
Quota identification (Chapter 99 subheading) Article description
Annual quantitative limitations
(kilograms) (short tons) 9903.80.20 Line pipe not exceeding 406.4 mm in outside
diameter, provided for in subheading 7304.19.10, 7304.19.50, 7306.19.10, or 7306.19.51.1
51,383,847 56,641
9903.80.21 Other line pipe, provided for in subheading 7306.19.10 or 7306.19.51.2
250,007,048 275,586
9903.80.22 Standard pipe, provided for in subheading 7304.39.00, 7304.59.80, or 7306.30.50.3
69,469,685 76,577
9903.80.24 Mechanical tubing and other products, provided for in subheadings 7304.31.30, 7304.31.60, 7304.39.00, 7304.51.10, 7304.51.50, 7304.59.10, 7304.59.60, 7304.59.80, 7304.90.50, 7304.90.70, 7306.30.10, 7306.30.50, 7306.50.10, 7306.50.50, 7306.61.50, 7306.61.70, 7306.69.50 or 7306.69.70.4
8,438,050 9,301
1 Except for the following HTS statistical reporting numbers: 7304.19.1080; 7304.19.5080, 7306.19.1050, and 7306.19.5150. 2 Except for the following HTS statistical reporting numbers: 7306.19.1010 and 7306.19.5110. 3 Except for the following HTS statistical reporting numbers: 7304.39.0002, 7304.39.0004, 7304.39.0006, 7304.39.0008, 7304.39.0028, 7304.39.0032, 7304.39.0040, 7304.39.0044, 7304.39.0052, 7304.39.0056, 7304.39.0068 and 7304.39.0072, 7304.59.8020, 7304.59.8025, 7304.59.8035, 7304.59.8040, 7304.59.8050, 7304.59.8055, 7304.59.8065 and 7304.59.8070; 7306.30.5010, 7306.30.5015, 7306.30.5020 and 7306.30.5035. 4 Except for the following HTS statistical reporting numbers: 7304.31.6010, 7304.39.0002, 7304.39.0004, 7304.39.0006, 7304.39.0008, 7304.39.0016, 7304.39.0020, 7304.39.0024, 7304.39.0036, 7304.39.0048, 7304.39.0062, 7304.39.0076 and 7304.39.0080; 7304.51.5005, 7304.51.5015 and 7304.51.5045, 7304.59.8010, 7304.59.8015, 7304.59.8030, 7304.59.8045, 7304.59.8060 and 7304.59.8080; 7306.30.5010, 7306.30.5025, 7306.30.5028, 7306.30.5032, 7306.30.5040, 7306.30.5055, 7306.30.5085 and 7306.30.5090; 7306.50.5010; 7306.61.7030; 7306.69.7030. Source: U.S. Customs and Border Protection (“CBP”), “QB 20-602 2020 2QTR Absolute Quota for Steel Mill Articles: Argentina, Brazil and South Korea,” March 11, 2020, https://www.cbp.gov/trade/quota/bulletins/qb-20-602-2020-2qtr-absolute-quota-steel-mill-articles-argentina-brazil-and-south-korea, retrieved January 26, 2021.
Russia and Ukraine– Imports of SSLP pipe from Russia and Ukraine have been subject to the Section 232 duties since they became effective as of March 23, 2018.27
26 Adjusting imports of Steel Into the United States, Presidential Proclamation 9759, May 31, 2018, 83
FR 25857, June 5, 2018; and Adjusting imports of Steel Into the United States, Presidential Proclamation 9772, August 10, 2018, 83 FR 40429, August 15, 2018.
27 Adjusting Imports of Steel Into the United States, Presidential Proclamation 9705, March 8, 2018, 83 FR 11625, March 15, 2018.

I-13

I-14
Section 301 tariff treatment28
Nonsubject U.S. imports of SSLP pipe originating in China are currently subject to additional 7.5 percent ad valorem Section 301 duties,29 as of February 14, 2020.30 See also U.S. notes 20(r) and 20(s) to subchapter III of HTS chapter 99.31
Description and applications32
Seamless pressure pipes are intended for the conveyance of water, steam, petrochemicals, chemicals, oil products, natural gas, and other liquids and gasses in industrial piping systems. They may carry these substances at elevated pressures and temperatures and may be subject to the application of external heat. Seamless carbon steel pressure pipe meeting the American Society for Testing and Materials (“ASTM”) standard ASTM A-106 may be used in temperatures of up to 1,000 degrees Fahrenheit, at various American Society of
28 A chronological summary of section 301 proceedings is provided in Appendix table D-2. 29 Section 301 of the Trade Act of 1974, as amended (19 U.S.C. § 2411) authorizes the Office of the
United States Trade Representative (“USTR”), at the direction of the President, to take appropriate action to respond to a foreign country’s unfair trade practices. On August 18, 2017, USTR initiated an investigation into certain acts, policies, and practices of the Government of China related to technology transfer, intellectual property, and innovation (82 FR 40213, August 24, 2017). On April 6, 2018, USTR published its determination that the acts, policies, and practices of China under investigation are unreasonable or discriminatory and burden or restrict U.S. commerce, and are thus actionable under section 301(b) of the Trade Act (83 FR 14906, April 6, 2018).
30 The HTS subheadings for SSLP pipe are among those included in the USTR’s first list to the fourth enumeration (“List 1 to Tranche 4”) of the products originating in China that became subject to the additional 10 percent ad valorem Section 301 duties (Annexes A and B to 84 FR 43304, August 20, 2019), as of September 1, 2019, which was subsequently increased to 15 percent while retaining the same effective date (84 FR 45821, August 30, 2019). As of February 14, 2020, the 15 percent duty was reduced to 7.5 percent for the products enumerated on List 1 to Tranche 4 (85 FR 3741, January 22, 2020).
A product exclusion was granted on July 7, 2020 for “Seamless tubes, of circular cross-section, of 304L stainless steel, cold-rolled, with an external diameter of not more than 21.1 mm, with the thickness of the tube wall not more than 2.9 mm, each tube measuring at least 2,964 mm but not more than 6,350 mm in length (described in HTS statistical reporting number 7304.41.6045);” however this product does not fall within the scope of these investigations. Notice of Product Exclusions and Amendments: China’s Acts, Policies, and Practices Related to Technology Transfer, Intellectual Property, and Innovation, 85 FR 41658, July 10, 2020. See also U.S. note 20(ddd)(23) to subchapter III of HTS chapter 99. HTSUS (2021) Preliminary Revision 3, USITC publication 5161, February 2021, pp. 99-III-179, 99-III-245.
31 HTSUS (2021) Preliminary Revision 3, USITC publication 5161, February 2021, pp. 99-III-82 – 99-III-84, 99-III-94, 99-III-242, 99-III-244 – 99-III-247.
32 Unless specified elsewhere, information in this section is derived from Certain Seamless Carbon and Alloy Steel Standard, Line, and Pressure Pipe from China, Investigation Nos. 701-TA-469 and 731-TA-1168 (Review), pp. I-4-6.

I-15
Mechanical Engineers (“ASME”) code stress levels. Alloy pipes meeting the ASTM A-335 standard must be used if temperatures and stress levels exceed those allowed for ASTM A-106. Seamless pressure pipes sold in the United States are commonly produced to the ASTM A-106 standard.
Seamless standard pipes are commonly produced to ASTM A-53 and generally are not intended for high temperature service. Rather, they are intended for the low temperature and pressure conveyance of water, steam, natural gas, air and other liquids and gasses in plumbing and heating systems, air conditioning units, automatic sprinkler systems, and other related end uses. Standard pipes (depending on type and code) may carry liquids at elevated temperatures but must not exceed the relevant ASME code requirements. If exceptionally low temperature uses or conditions are anticipated, standard pipe may be manufactured to ASTM A-333 or ASTM A-334 specifications.
Seamless line pipes are intended for the conveyance of oil, natural gas, or other fluids in pipelines. Seamless line pipes are produced to the API 5L specification. Seamless water well pipe (ASTM A-589) and seamless galvanized pipe for fire protection uses (ASTM A-795) are used for the conveyance of water. Seamless pipes are commonly produced and certified to meet ASTM A-106, ASTM A-53, API 5L-B, and API 5L-X42 specifications. To avoid maintaining separate production runs and separate inventories, manufacturers typically triple or quadruple certify pipes by meeting the metallurgical requirements and performing the required tests pursuant to the respective specifications. Since distributors sell the vast majority of this product, they can thereby maintain a single inventory to service all customers.
The primary applications of ASTM A-106 pressure pipes and triple or quadruple certified pipes are: (1) oil and gas distribution lines for commercial applications; (2) pressure piping systems by refineries, petrochemical plants, and chemical plants; (3) power generation plants (electrical-fossil fuel or nuclear); and (4) some oil field uses (on shore and offshore) such as for separator lines, gathering lines, and metering runs. These applications constitute the majority of the market for the subject seamless pipe.
Redraw hollows are any unfinished pipe or “hollow profiles” of carbon or alloy steel transformed by hot rolling or cold drawing/hydrostatic testing or other methods to enable the material to be sold under ASTM A-53, ASTM A-106, ASTM A-333, ASTM A-334, ASTM A-335, ASTM A-589, ASTM A-795, and API 5L specifications.
Table I-9 provides a summary of certain ASTM and API standard specifications covered by these investigations.
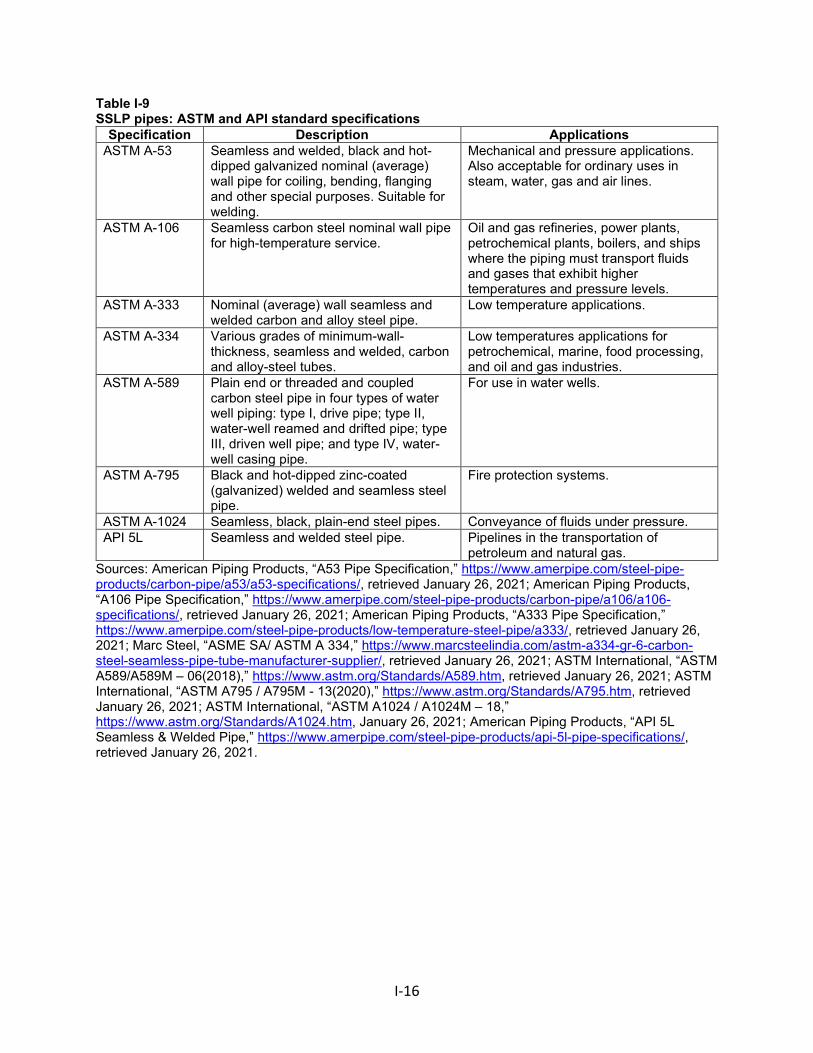
I-16
Table I-9 SSLP pipes: ASTM and API standard specifications
Specification Description Applications ASTM A-53 Seamless and welded, black and hot-
dipped galvanized nominal (average) wall pipe for coiling, bending, flanging and other special purposes. Suitable for welding.
Mechanical and pressure applications. Also acceptable for ordinary uses in steam, water, gas and air lines.
ASTM A-106 Seamless carbon steel nominal wall pipe for high-temperature service.
Oil and gas refineries, power plants, petrochemical plants, boilers, and ships where the piping must transport fluids and gases that exhibit higher temperatures and pressure levels.
ASTM A-333 Nominal (average) wall seamless and welded carbon and alloy steel pipe.
Low temperature applications.
ASTM A-334 Various grades of minimum-wall-thickness, seamless and welded, carbon and alloy-steel tubes.
Low temperatures applications for petrochemical, marine, food processing, and oil and gas industries.
ASTM A-589 Plain end or threaded and coupled carbon steel pipe in four types of water well piping: type I, drive pipe; type II, water-well reamed and drifted pipe; type III, driven well pipe; and type IV, water-well casing pipe.
For use in water wells.
ASTM A-795 Black and hot-dipped zinc-coated (galvanized) welded and seamless steel pipe.
Fire protection systems.
ASTM A-1024 Seamless, black, plain-end steel pipes. Conveyance of fluids under pressure. API 5L Seamless and welded steel pipe. Pipelines in the transportation of
petroleum and natural gas. Sources: American Piping Products, “A53 Pipe Specification,” https://www.amerpipe.com/steel-pipe-products/carbon-pipe/a53/a53-specifications/, retrieved January 26, 2021; American Piping Products, “A106 Pipe Specification,” https://www.amerpipe.com/steel-pipe-products/carbon-pipe/a106/a106-specifications/, retrieved January 26, 2021; American Piping Products, “A333 Pipe Specification,” https://www.amerpipe.com/steel-pipe-products/low-temperature-steel-pipe/a333/, retrieved January 26, 2021; Marc Steel, “ASME SA/ ASTM A 334,” https://www.marcsteelindia.com/astm-a334-gr-6-carbon-steel-seamless-pipe-tube-manufacturer-supplier/, retrieved January 26, 2021; ASTM International, “ASTM A589/A589M – 06(2018),” https://www.astm.org/Standards/A589.htm, retrieved January 26, 2021; ASTM International, “ASTM A795 / A795M - 13(2020),” https://www.astm.org/Standards/A795.htm, retrieved January 26, 2021; ASTM International, “ASTM A1024 / A1024M – 18,” https://www.astm.org/Standards/A1024.htm, January 26, 2021; American Piping Products, “API 5L Seamless & Welded Pipe,” https://www.amerpipe.com/steel-pipe-products/api-5l-pipe-specifications/, retrieved January 26, 2021.

I-17
Manufacturing processes33
Melting
In the United States, steel used to produce SSLP pipe is made by either (1) the basic-oxygen process, in which ferrous scrap is added to molten pig iron and alloying materials and converted into molten steel, or by (2) the electric-arc furnace process, in which ferrous scrap, direct-reduced iron, cold pig iron, and alloying materials are melted to convert into molten steel. The chemical composition of steel, including level of carbon, manganese, and other alloying materials is controlled in the melting process. Molten steel produced by either steelmaking process is continuously cast into either round or square billets, which are the starting materials to produce SSLP pipe. SSLP pipe producers that do not maintain steelmaking operations purchase billets or redraw hollows as their raw material. Figure I-1 summarizes the production process for seamless pipe. Figure I-1 SSLP pipe: Production of seamless pipe
Source: “Mill Tolerance in Seamless Pipe,” https://akhmadmarufnur.blogspot.com/2018/06/mill-tolerance-in-seamless-pipe.html, retrieved January 26, 2021.
33 Unless specified elsewhere, information in this section is derived from Certain Seamless Carbon
and Alloy Steel Standard, Line, and Pressure Pipe from China, Investigation Nos. 701-TA-469 and 731-TA-1168 (Review), pp. I-6-9.

I-18
Piercing
SSLP pipe is typically manufactured by the rotary piercing process that forms a central cavity in a solid steel billet at high temperature. A heated billet is gripped by angled rolls that rotate and advance it over a piercer point, forming a hole throughout the billet’s length. The resulting “hollow shell” is then rolled with either a fixed-plug or a continuous mandrel inside the shell to reduce the wall thickness and increase the length. The shell is then rolled in a sizing mill or a stretch-reduction mill where it is formed into a true (perfectly) round and sized to the specified diameter.
Testing
The pipe then undergoes a non-destructive inspection process (e.g., electronic magnetic inspection or an ultrasonic inspection) to determine whether there are surface or internal defects in the wall of the pipe. Depending on the grade of steel requested by the final customer, the product may also undergo a heat treatment process on the production line or in a different location within the same production facility. The manufacturer will confirm that the desired mechanical properties of the final product have been met.34
Finishing
The last stage of the production process is the finishing stage. If required by the final customer, the manufacturer may bevel the pipe ends during this stage. Other requirements could include specific stenciling, coating, or varnishing to protect the pipes from corrosion during transportation or storage before final end-use applications. Depending on the size of the pipe, the subject product may also undergo a packaging operation (i.e., bundling) for easier handling.35
Different manufacturing processes and technologies are used worldwide for the production of SSLP pipe, and there may be similarities and differences between the production technology used by domestic and foreign producers.36 Certain U.S. producers, including the petitioner Vallourec as well as Tenaris and Benteler, have installed Danieli Fine Quality Mills (FQM™), which are among the most efficient rolling operations in the world, at a capital cost of approximately $1 billion each.37 Danieli’s FQM™ technology is suitable for a wide range of pipe
34 Conference transcript, p. 58 (Arevalo). 35 Conference transcript, pp. 58-59 (Arevalo). 36 Conference transcript, p. 57 (Arevalo). 37 Conference transcript, p. 59 (Polk).
I-19
sizes and grades of steel, and the manufacturing process for this type of mill is flexible and appropriate for both high and low production volumes.38
Domestic like product issues
No issues with respect to domestic like product have been raised in these investigations. The petitioner proposes that the Commission define a single domestic like product that is coextensive with the scope of the investigations consisting of all SSLP pipe. Respondents do not contest the domestic like product definition for the preliminary or final phase of these investigations. In final phase investigations, no party requested data or other information necessary for analysis of the domestic like product.
38 Danieli, “Seamless Pipe Mills and Finishing Lines,” https://www.danieli.com/en/products/products-
processes-and-technologies/extrusion_26_31.htm, retrieved January 26, 2021.


II-1
Part II: Conditions of competition in the U.S. market
U.S. market characteristics
SSLP pipe is mainly used in oil and gas transmission but can be used in other construction and industrial applications as well. SSLP pipe is sold in both carbon steel and alloy steel grades, in a range of sizes up to 16 inches in outside diameter.1 Seamless pipe is commonly produced and certified to meet ASTM A-106, ASTM A-53, API 5L-B, and API 5L-X42 specifications. SSLP pipe producers typically triple- or quadruple-certify the pipes so that the pipes can serve multiple end uses so as to avoid maintaining separate production runs and separate inventories.2 Oil and gas exploration is a key driver of demand for SSLP pipe.3 SSLP pipe is generally sold to distributors, and demand mainly follows the demand trends of oil and gas markets.4 As discussed in “U.S. demand,” oil and gas prices and rig counts increased in 2018 but declined beginning in 2019, with precipitous declines between March and July 2020. No firms reported product changes since January 1, 2018.
Apparent U.S. consumption of SSLP pipe declined during 2018-20. Overall, apparent U.S. consumption in 2020 was *** percent lower than in 2018.
Firms were asked if the imposition of tariffs or other restrictions on imported steel and aluminum products associated with section 232 had an impact on the SSLP pipe market in the United States. Almost all U.S. producers and importers reported that section 232 tariffs did have an impact on the SSLP pipe market, however, responses were mixed regarding the impact of these tariffs on different market factors (table II-1). Two U.S. producers reported that the supply of domestic SSLP pipe was unchanged, and one U.S. producer reported that supply had fluctuated or decreased while most importers and purchasers reported supply of domestic SSLP pipe was unchanged. Two U.S. producers reported the supply of imported SSLP pipe fluctuated, a plurality of importers reported it decreased, and half of responding purchasers reported no change. Several importers and most purchasers reported SSLP pipe prices increased, while U.S. producers most frequently reported prices had fluctuated.5 U.S. importer *** noted
1 Carbon and Alloy Seamless Standard, Line, and Pressure Pipe from Japan and Romania, Inv. Nos. 731-TA-847 and 849 (Third Review), (“SSLPP Japan and Romania Third Review”), USITC Publication 4731, p. II-1.
2 Petition, p. 9. 3 Hearing transcript, p. 14 (Yushchuck), p. 27 (Frischmann). 4 SSLPP Japan and Romania Third Review, USITC Publication 4731, p. II-1. 5 See Part V for further discussion on the impact of the section 232 measures on prices.

II-2
that prices increased because of section 232 measures, and that these measures have been transferred to the consumer. U.S. producers and purchasers were also split on the impact the section 232 measures had on overall demand while most importers, conversely, reported that demand declined due to the section 232 measures. U.S. importer *** noted there was a frenzy of demand for SSLP pipes initially with section 232 measures, and it has since subsided. Table II-1 SSLP pipe: Firms’ responses regarding impact of section 232 measures on SSLP market
Item Increase No change Decrease Fluctuate Supply of U.S. produced SSLP pipe U.S. producers 0 2 1 1 Importers 3 6 1 1 Purchasers 2 8 1 1 Supply of imported SSLP pipe U.S. producers 1 1 0 2 Importers 1 3 4 3 Purchasers 0 6 5 1 Price of SSLP pipe U.S. producers 1 0 0 3 Importers 5 1 0 5 Purchasers 8 0 3 2 Overall demand for SSLP pipe U.S. producers 0 2 1 1 Importers 0 3 6 2 Purchasers 2 4 4 0
Source: Compiled from data submitted in response to Commission questionnaires.
U.S. purchasers
The Commission received 17 usable questionnaire responses from firms that had purchased SSLP pipe during 2018-20.6 7 8 Twelve responding purchasers are distributors, 3 are end users, and 2 reported as an “other” type of firm (wholesaler and manufacturer). In general, responding U.S. purchasers were located in Southwestern, Central, and Southern U.S regions. The responding purchasers represented firms typically servicing or in the oil and gas industries.
6 The following firms provided purchaser questionnaire responses: ***. 7 One purchaser (***) submitted lost sales lost revenue survey responses in the preliminary phase,
but responded that it did not purchase SSLP pipe in the final phase of these investigations. 8 Of the 17 responding purchasers, 15 purchased the domestic SSLP pipe, 11 purchased imports of
the subject merchandise from Czechia, and 15 purchased imports of SSLP pipe from other sources.
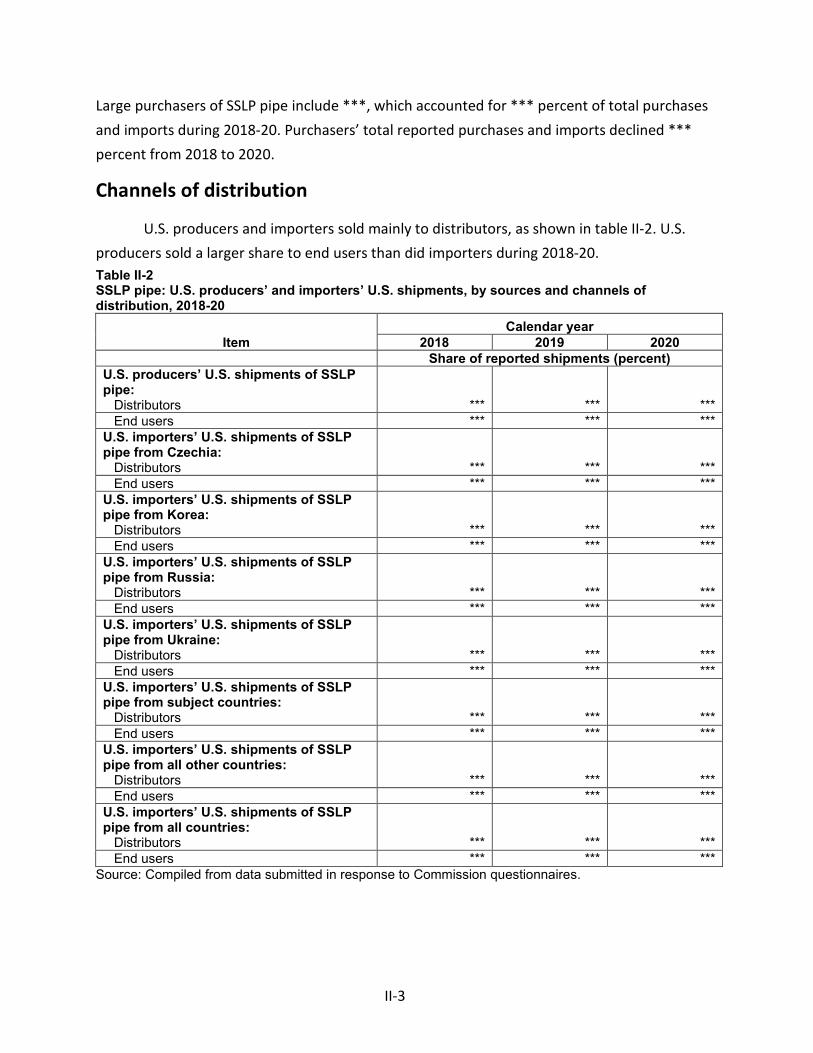
II-3
Large purchasers of SSLP pipe include ***, which accounted for *** percent of total purchases and imports during 2018-20. Purchasers’ total reported purchases and imports declined *** percent from 2018 to 2020.
Channels of distribution
U.S. producers and importers sold mainly to distributors, as shown in table II-2. U.S. producers sold a larger share to end users than did importers during 2018-20. Table II-2 SSLP pipe: U.S. producers’ and importers’ U.S. shipments, by sources and channels of distribution, 2018-20
Item Calendar year
2018 2019 2020 Share of reported shipments (percent) U.S. producers’ U.S. shipments of SSLP pipe: Distributors *** *** *** End users *** *** *** U.S. importers’ U.S. shipments of SSLP pipe from Czechia: Distributors *** *** *** End users *** *** *** U.S. importers’ U.S. shipments of SSLP pipe from Korea: Distributors *** *** *** End users *** *** *** U.S. importers’ U.S. shipments of SSLP pipe from Russia: Distributors *** *** *** End users *** *** *** U.S. importers’ U.S. shipments of SSLP pipe from Ukraine: Distributors *** *** *** End users *** *** *** U.S. importers’ U.S. shipments of SSLP pipe from subject countries: Distributors *** *** *** End users *** *** *** U.S. importers’ U.S. shipments of SSLP pipe from all other countries: Distributors *** *** *** End users *** *** *** U.S. importers’ U.S. shipments of SSLP pipe from all countries: Distributors *** *** *** End users *** *** ***
Source: Compiled from data submitted in response to Commission questionnaires.
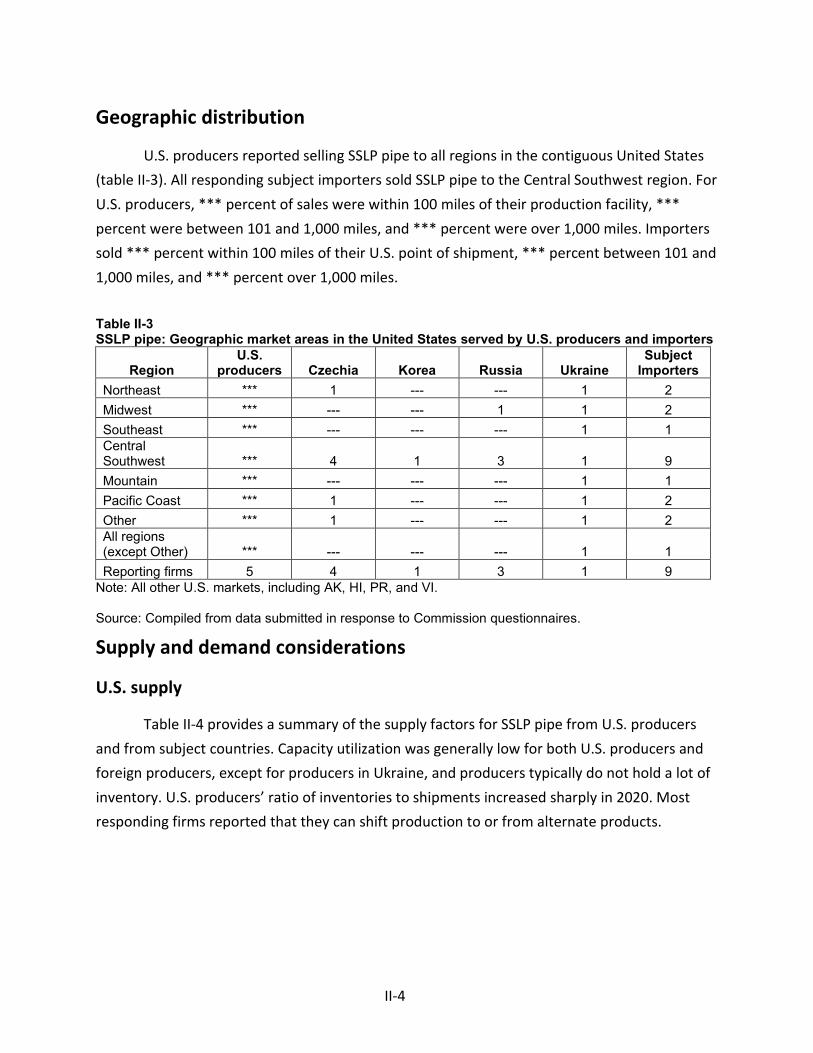
II-4
Geographic distribution
U.S. producers reported selling SSLP pipe to all regions in the contiguous United States (table II-3). All responding subject importers sold SSLP pipe to the Central Southwest region. For U.S. producers, *** percent of sales were within 100 miles of their production facility, *** percent were between 101 and 1,000 miles, and *** percent were over 1,000 miles. Importers sold *** percent within 100 miles of their U.S. point of shipment, *** percent between 101 and 1,000 miles, and *** percent over 1,000 miles.
Table II-3 SSLP pipe: Geographic market areas in the United States served by U.S. producers and importers
Region U.S.
producers Czechia Korea Russia Ukraine Subject
Importers Northeast *** 1 --- --- 1 2 Midwest *** --- --- 1 1 2 Southeast *** --- --- --- 1 1 Central Southwest *** 4 1 3 1 9 Mountain *** --- --- --- 1 1 Pacific Coast *** 1 --- --- 1 2 Other *** 1 --- --- 1 2 All regions (except Other) *** --- --- --- 1 1 Reporting firms 5 4 1 3 1 9
Note: All other U.S. markets, including AK, HI, PR, and VI. Source: Compiled from data submitted in response to Commission questionnaires.
Supply and demand considerations
U.S. supply
Table II-4 provides a summary of the supply factors for SSLP pipe from U.S. producers and from subject countries. Capacity utilization was generally low for both U.S. producers and foreign producers, except for producers in Ukraine, and producers typically do not hold a lot of inventory. U.S. producers’ ratio of inventories to shipments increased sharply in 2020. Most responding firms reported that they can shift production to or from alternate products.

II-5
Table II-4 SSLP pipe: Supply factors that affect the ability to increase shipments to the U.S. market
Country
Capacity (short tons)
Capacity utilization (percent)
Ratio of inventories to
total shipments (percent)
Shipments by market, 2020 (percent)
Able to shift to
alternate products
2018 2020 2018 2020 2018 2020
Home market
shipments
Exports to non-
U.S. markets
No. of firms
reporting “yes”
United States *** *** *** *** *** *** *** *** 3 of 5 Czechia *** *** *** *** *** *** *** *** 3 of 3 Korea *** *** *** *** *** *** *** *** 0 of 0 Russia *** *** *** *** *** *** *** *** 2 of 2 Ukraine *** *** *** *** *** *** *** *** 1 of 1 Note: Responding U.S. producers accounted for *** of U.S. production of SSLP pipe in 2020. Responding foreign producer/exporter firms accounted for two-thirds of U.S. imports of SSLP pipe from Czechia, and the vast majority for Russia and Ukraine during 2020. No foreign producer/exporter firms responded from Korea. For additional data on the number of responding firms and their share of U.S. production and of U.S. imports from each subject country, please refer to Part I, “Summary Data and Data Sources.” Source: Compiled from data submitted in response to Commission questionnaires.
Domestic production
Based on available information, U.S. producers of SSLP pipe have the ability to respond to changes in demand with large changes in the quantity of shipments of U.S.-produced SSLP pipe to the U.S. market. The main contributing factors to this degree of responsiveness of supply are the availability of unused capacity and inventories, and the ability to shift production to or from alternate products. A factor mitigating responsiveness of supply include a very limited ability to shift shipments from alternate markets.
U.S. producers’ capacity increased and production decreased, leading to decreased capacity utilization; inventories to shipments ratio increased; and exports decreased during 2018-20. Other products that producers reportedly can produce on the same equipment as SSLP pipe are OCTG, drill pipe, mechanical pipe, structural pipe, coupling stock, casing, tubing, fitting pipe, and welded products. U.S. producers reported that most of their overall production on the same equipment was out-of-scope OCTG and a small portion was out-of-scope SSLP pipe. Factors affecting U.S. producers’ ability to shift production include mill capacity, product mix, lack of full crews on all shifts, market conditions, maintenance schedules, unexpected downtime, and finishing and inspection equipment capacity.

II-6
Subject imports from Czechia
Based on available information, producers of SSLP pipe from Czechia have the ability to respond to changes in demand with large changes in the quantity of shipments of SSLP pipe to the U.S. market. The main contributing factors to this degree of responsiveness of supply are the availability of unused capacity, ability to shift shipments from alternate markets, and ability to shift production to or from alternate products. A factor mitigating responsiveness of supply is limited availability of inventories.
Czech producers’ capacity and production decreased during 2018-20, leading to an overall decrease in capacity utilization. Major export markets include ***. Other products that responding producers in Czechia reportedly can produce on the same equipment as SSLP pipe are ***. Factors affecting their ability to shift production include ***.
Subject imports from Korea
No Korean producers responded to the Commission’s foreign producer questionnaire.
Subject imports from Russia
Based on available information, producers of SSLP pipe from Russia have the ability to respond to changes in demand with large changes in the quantity of shipments of SSLP pipe to the U.S. market. The main contributing factors to this degree of responsiveness of supply are the availability of unused capacity, ability to shift some shipments from alternate markets, and ability to shift production to or from alternate products. A factor mitigating responsiveness of supply is limited availability of inventories.
Russian producers’ capacity and production decreased, resulting in decreased capacity utilization during 2018-20. Major export markets include ***. Other products that producers in Russia reported they can produce on the same equipment as SSLP pipe are ***

II-7
***. Factors affecting their ability to shift production include ***.
Subject imports from Ukraine
Based on available information, producers of SSLP pipe from Ukraine have the ability to respond to changes in demand with moderate-to-large changes in the quantity of shipments of SSLP pipe to the U.S. market. The main contributing factors to this degree of responsiveness of supply are the availability of some unused capacity, ability to shift shipments from alternate markets, and ability to shift production to or from alternate products. A factor mitigating responsiveness of supply is limited availability of inventories.
Responding Ukrainian producer Interpipe Ukraine’s capacity was *** while production *** during 2018-20, leading to a *** in capacity utilization. Interpipe Ukraine’s reported principal export markets include ***. The other product that Interpipe Ukraine reportedly can produce on the same equipment as SSLP pipe is ***. Interpipe Ukraine reported that ***.
Imports from nonsubject sources
Nonsubject imports accounted for *** percent of total U.S. imports in 2020. The largest sources of nonsubject imports during 2018-20 were Germany and Mexico. Combined, these countries accounted for *** percent of all imports in 2020.

II-8
Supply constraints
Only one of five U.S. producers (***) reported a supply constraint; it reported that due to high levels of imports, it was forced to ***. None of the 16 responding importers reported experiencing supply constraints. Purchaser *** noted that U.S. Steel’s Lorain plant is idled. Purchaser *** simply stated “tariff” as a supply constraint.
New suppliers
One of 16 purchasers indicated that new suppliers entered the U.S. market since January 1, 2018. Purchaser *** stated that Boly Pipe (Thailand) has become a “significant” importer.
U.S. demand
Based on available information, the overall demand for SSLP pipe is likely to experience small-to-moderate changes in response to changes in price. The main contributing factors are the limited range of substitute products and the small cost share of SSLP pipe in most of its end-use products.
Demand for SSLP pipe is linked to the demand trends in the oil and gas markets.9 As shown in figure II-1, crude oil prices generally increased from January to October 2018 before declining irregularly through 2019. Crude oil prices declined more sharply between January and April 2020 but generally increased through the remainder of the year. Between its peak in July 2018 at approximately $71 per barrel to its lowest point in April 2020 at approximately $17 per barrel, crude oil prices declined by 76 percent. Overall, crude oil prices declined by 26 percent from January 2018 to December 2020. Natural gas prices followed a similar trend; prices increased irregularly from January 2018 to their peak in November 2018 before declining by 56 percent through June 2020 then increasing through the end of 2020. Overall, natural gas prices declined by 30 percent from January 2018 to December 2020. According to the U.S. Energy Information Administration (EIA), U.S. consumption of petroleum products fell to its lowest level in decades because of measures that limit travel and because of the general economic
9 Hearing transcript, pp. 40-41 (Dorn) and p. 133 (Valk).

II-9
slowdown induced by mitigation efforts for COVID-19.10 In turn, oil and gas prices declined in 2020. Subsequently, the Russia-Saudi “price war,” stemming from a disagreement in oil production in the face of plummeting demand, “plunged” oil prices to below zero.11 Figure II-1 Oil and gas prices: Monthly crude oil spot and natural gas prices, January 2018 to December 2020
Source: U.S. Energy Information Administration, https://www.eia.gov/outlooks/steo/data/browser/#/?v=8&f=M&s=&start=201701&end=202112&id=&maptype=0&ctype=linechart&linechart=WTIPUUS, accessed January 15, 2021.
The oil and gas rig count in the United States is another indicator of demand for SSLP pipe. SSLP pipe is used in gathering lines and demand for SSLP pipe for this use depends upon the rig count.12 The number of oil and gas rigs increased by 17 percent from January to December 2018, declined by 27 percent through mid-March 2020, fell sharply by approximately 69 percent through mid-August 2020, then increased 44 percent through December 2020. Overall, the number of oil and gas rigs decreased by 62 percent from January 2018 to December 2020.
10 U.S. Energy Information Administration, “COVID-19 mitigation efforts result in lowest U.S. petroleum consumption in decades,” https://www.eia.gov/todayinenergy/detail.php?id=43455, April 23, 2020.
11 Hearing transcript, p. 133 (Valk). 12 Hearing transcript, p. 133 (Valk), p. 170 (Jacobson).

II-10
Figure II-2 Rig count: Baker Hughes North America rotary rig count, weekly, January 2018 to December 2020
Source: Baker Hughes North America Rotary Rig Count, https://rigcount.bakerhughes.com/na-rig-count, accessed January 15, 2021.
End uses and cost share
U.S. demand for SSLP pipe depends on the demand for U.S.-produced downstream products, particularly activity in the energy industry, in drilling, and in nonresidential construction. Reported end uses include oil and gas pipelines, well gathering lines, process pipe/LP, refinery and chemical plants, hydrocarbon processing facilities, and automotive, industrial, and construction applications. The primary applications for ASTM A-106 pressure pipes and triple- or quadruple-certified pipes are: use in oil and gas distributions lines for commercial applications; use in pressure piping systems for refineries, petrochemical plants, and chemical plants; use in power generation plants; and use in some on- and offshore oil fields.13
13 Petition, pp. 9-10.
II-11
SSLP pipe accounts for a small share of the cost of the end-use products in which it is used. Reported cost shares for some end uses were 2.0 percent for well gathering lines, 1.0 to 11.3 percent for pipelines, and 3.0 percent for hydrocarbon processing facilitates.14
Business cycles
All five U.S. producers, 9 of 16 importers, and 7 of 15 purchasers indicated that the market was subject to business cycles and/or distinct conditions of competition. Specifically, three U.S. producers, six importers, and five purchasers reported that the SSLP pipe market is subject to business cycles and five producers, seven importers, and four purchasers reported that there are distinct conditions of competition, citing oil and gas demand and prices, industrial demand, seasonality with drilling activity, import competition, and slow business in the fourth quarter as inventory holders (distributors) become concerned with inventory taxes. U.S. producer/importer *** reported that the oil and gas market activity is strongly related to the price of oil and that a sudden drop in oil price will result in “an abrupt change in activity.” It continued that the “dramatic 2020 market crash” has resulted in “unprecedented demand destruction.” Importer/purchaser *** stated that the SSLP pipe market is affected by the overall requirements of the oil and gas exploration markets and as demand for these commodities increases, so does the demand for SSLP pipe as exploration companies drill and bring product to market. It continued that this requires more SSLP pipe to build out facilities required to deliver these commodities.
Four U.S. producers, seven importers, and six purchasers reported that there had been changes to these cycles or conditions since January 1, 2018. Firms cited the historic decline in demand in 2020 as a result of the COVID-19 global pandemic, with severely diminished oil and gas demand impacting SSLP pipe demand, the implementation of section 232 measures, and import competition. *** stated that the initiation of the section 232 measures in early 2018 caused many stockists and end users to substantially increase inventory levels, anticipating there was going to be a shortage of SSLP, but ultimately there was no shortage. As a result, the United States quickly became overstocked with SSLP, and while demand improved throughout 2018 and early 2019, the market still has excess supply. *** added that as demand improved so did competition to satisfy commercial needs.
14 Some importers reported that SSLP pipe accounted for up to 100 percent of the end use they reported, including oil and gas pipe, process pipe/LP, OCTG couplings, construction, fabrication, and general use/purpose. Purchaser *** reported end uses being *** with associated cost shares of ***.

II-12
Demand trends
Most firms reported a decline or fluctuation in U.S. demand for SSLP pipe since January 1, 2018 (table II-5). Generally, firms cited a slowdown in 2019, and an abrupt decline in 2020 due to COVID-19 and declining oil and gas prices. Importer *** stated that demand for SSLP pipe, both inside and outside the United States, diminished significantly since March 2020 due to the COVID-19 pandemic, and that overall demand for oil and gas has significantly decreased, causing oil and gas exploration companies and transmission companies to cut their spending back significantly. U.S. producer/importer *** reported that the reduction in petrochemical, LNG, and refinery projects reduced demand, and that the COVID-19 pandemic affected refineries’ utilization, “HPI project execution,” as well as offshore activity all significantly decreasing expected SSLP pipe demand. A majority of responding purchasers reported that demand for their end use products had declined.
Table II-5 SSLP pipe: Firms’ responses regarding U.S. demand and demand outside the United States
Item Increase No change Decrease Fluctuate Demand in the United States U.S. producers --- --- 3 2 Importers --- 1 9 5 Purchasers --- --- 10 2 Demand outside the United States U.S. producers --- --- 2 --- Importers --- --- 5 3 Purchasers --- --- 6 2 Demand for end use product(s): Purchasers --- 1 3 1
Source: Compiled from data submitted in response to Commission questionnaires.
Substitute products
Most firms reported that there are no substitutes, however, several firms reported that there are. Two of 5 U.S. producers, 7 of 13 importers, and 11 of 16 purchasers reported that there were no substitutes. Reported substitutes include welded or plastic pipe for onshore applications; DSAW and ERW welded pipe for use in the gas industry; and coiled steel line pipe, fiberglass, polyethylene pipe, and HDPE pipe for flow lines and liquid gasses. U.S. producer/importer *** reported that the price of ERW pipe can affect the price of SSLP pipe in midstream operations because it’s easy to switch from one product to another. *** indicated that ERW pipe is more than 30 percent less expensive than SSLP pipe. Importers *** reported that there is a strong trend for replacing steel pipes

II-13
with plastic ones as the technology of plastic pipes production develops.15 They also reported that seamless and welded line pipes are direct substitutes and that welded pipes were 30 percent cheaper on average than seamless pipes during the period of investigation.
Substitutability issues
The degree of substitution between domestic and imported SSLP pipe depends upon such factors as relative prices, quality (e.g., grade standards, defect rates, etc.), and conditions of sale (e.g., price discounts/rebates, lead times between order and delivery dates, reliability of supply, product services, etc.). Based on available data, staff believes that there is a high degree of substitutability between domestically produced SSLP pipe and SSLP pipe imported from subject sources.
Lead times
SSLP pipe is primarily produced-to-order. U.S. producers reported that *** percent of their commercial shipments were produced-to-order, with lead times averaging *** days.16 Importers reported that 99.8 percent of their commercial shipments were produced-to-order, with lead times averaging 102 days.17
Knowledge of country sources
Of the 14 responding purchasers, 13 purchasers indicated they had knowledge of domestic SSLP pipe, 7 of Czech SSLP pipe, 5 of Korean SSLP pipe, 3 of Russian SSLP pipe, 8 of Ukrainian SSLP pipe, and 7 of nonsubject countries.
As shown in table II-6, most purchasers and their customers “sometimes” make purchasing decisions based on the producer or country of origin. Of the nine purchasers that reported that they always or usually make decisions based on the manufacturer, purchasers cited customers’ Approved Manufacturers lists (AMLs),18 lower price, quality, and particular specifications needed for specific jobs.
15 These importers provided the following source for this information: https://egyptoil-gas.com/features/the-wise-choice-for-infrastructure-metal-and-non-metal-pipelines/
16 The remaining *** percent of their commercial shipments came from inventories, with lead times averaging *** days.
17 The remaining 0.2 percent of their commercial shipments came from inventories, with lead times averaging 6.0 days.
18 Reported by ***.
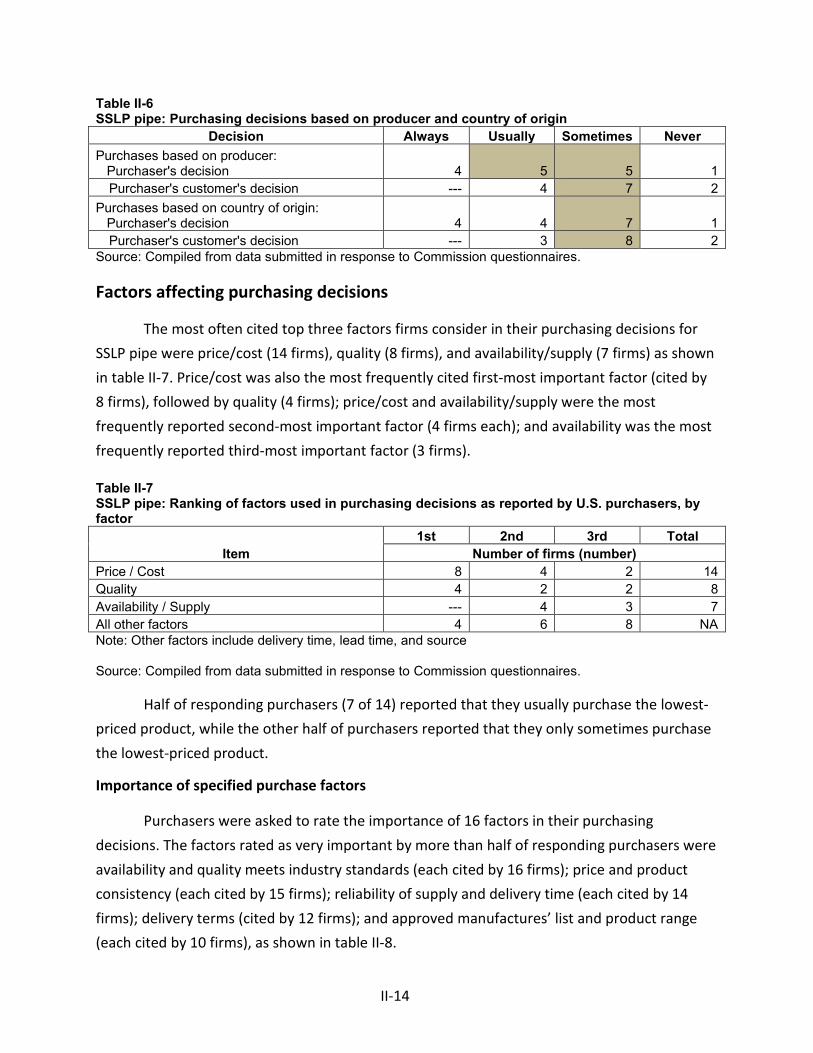
II-14
Table II-6 SSLP pipe: Purchasing decisions based on producer and country of origin
Decision Always Usually Sometimes Never Purchases based on producer: Purchaser's decision 4 5 5 1
Purchaser's customer's decision --- 4 7 2 Purchases based on country of origin: Purchaser's decision 4 4 7 1
Purchaser's customer's decision --- 3 8 2 Source: Compiled from data submitted in response to Commission questionnaires.
Factors affecting purchasing decisions
The most often cited top three factors firms consider in their purchasing decisions for SSLP pipe were price/cost (14 firms), quality (8 firms), and availability/supply (7 firms) as shown in table II-7. Price/cost was also the most frequently cited first-most important factor (cited by 8 firms), followed by quality (4 firms); price/cost and availability/supply were the most frequently reported second-most important factor (4 firms each); and availability was the most frequently reported third-most important factor (3 firms). Table II-7 SSLP pipe: Ranking of factors used in purchasing decisions as reported by U.S. purchasers, by factor
Item 1st 2nd 3rd Total
Number of firms (number) Price / Cost 8 4 2 14 Quality 4 2 2 8 Availability / Supply --- 4 3 7 All other factors 4 6 8 NA Note: Other factors include delivery time, lead time, and source Source: Compiled from data submitted in response to Commission questionnaires.
Half of responding purchasers (7 of 14) reported that they usually purchase the lowest-priced product, while the other half of purchasers reported that they only sometimes purchase the lowest-priced product.
Importance of specified purchase factors
Purchasers were asked to rate the importance of 16 factors in their purchasing decisions. The factors rated as very important by more than half of responding purchasers were availability and quality meets industry standards (each cited by 16 firms); price and product consistency (each cited by 15 firms); reliability of supply and delivery time (each cited by 14 firms); delivery terms (cited by 12 firms); and approved manufactures’ list and product range (each cited by 10 firms), as shown in table II-8.
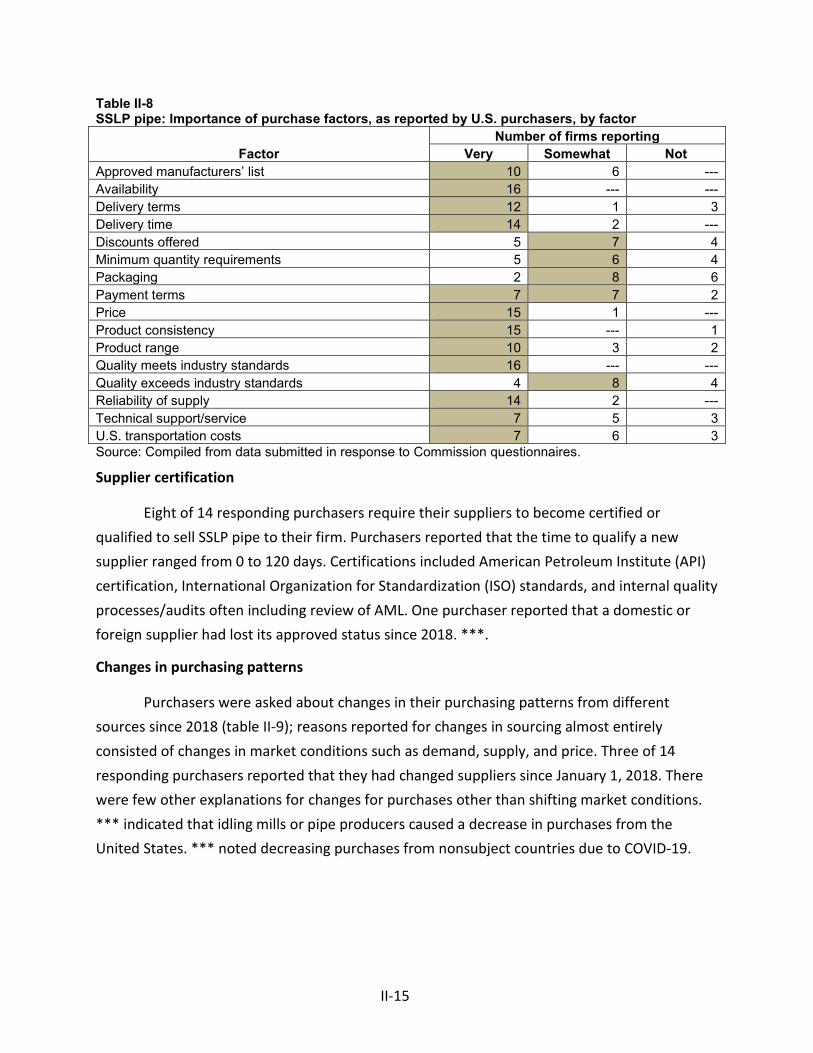
II-15
Table II-8 SSLP pipe: Importance of purchase factors, as reported by U.S. purchasers, by factor
Factor Number of firms reporting
Very Somewhat Not Approved manufacturers’ list 10 6 --- Availability 16 --- --- Delivery terms 12 1 3 Delivery time 14 2 --- Discounts offered 5 7 4 Minimum quantity requirements 5 6 4 Packaging 2 8 6 Payment terms 7 7 2 Price 15 1 --- Product consistency 15 --- 1 Product range 10 3 2 Quality meets industry standards 16 --- --- Quality exceeds industry standards 4 8 4 Reliability of supply 14 2 --- Technical support/service 7 5 3 U.S. transportation costs 7 6 3 Source: Compiled from data submitted in response to Commission questionnaires.
Supplier certification
Eight of 14 responding purchasers require their suppliers to become certified or qualified to sell SSLP pipe to their firm. Purchasers reported that the time to qualify a new supplier ranged from 0 to 120 days. Certifications included American Petroleum Institute (API) certification, International Organization for Standardization (ISO) standards, and internal quality processes/audits often including review of AML. One purchaser reported that a domestic or foreign supplier had lost its approved status since 2018. ***.
Changes in purchasing patterns
Purchasers were asked about changes in their purchasing patterns from different sources since 2018 (table II-9); reasons reported for changes in sourcing almost entirely consisted of changes in market conditions such as demand, supply, and price. Three of 14 responding purchasers reported that they had changed suppliers since January 1, 2018. There were few other explanations for changes for purchases other than shifting market conditions. *** indicated that idling mills or pipe producers caused a decrease in purchases from the United States. *** noted decreasing purchases from nonsubject countries due to COVID-19.

II-16
Table II-9 SSLP pipe: Changes in purchase patterns from U.S., subject, and nonsubject countries
Source of purchases Did not
purchase Decreased Increased Constant Fluctuated United States 1 8 2 3 2 Czechia 3 5 1 2 2 Korea 5 1 --- 3 6 Russia 7 2 --- 3 1 Ukraine 3 5 --- 3 3 Nonsubject sources --- 8 --- 3 2 Sources unknown 4 1 1 2 1 Source: Compiled from data submitted in response to Commission questionnaires.
Importance of purchasing domestic product
Eleven of 14 purchasers reported that between 70 percent and 100 percent of their purchases in 2020 did not require purchasing U.S.-produced product. Eight reported that domestic product was required by law19 (for between 1 and 15 percent of their purchases), nine reported it was required by their customers (for between 1 percent and 65 percent of their purchases, with 4 reporting 10 percent), and 4 reported other preferences for domestic product (for between 10 and 100 percent of their purchases). Reasons cited for preferring domestic product included: location of specific manufacturers, domestic production requirements, preferences, and availability of specific materials.
AMLs
U.S. producers and importers were asked to estimate the share of their commercial shipments that were to customers that required the listing of the producer on an AML. U.S. producer *** reported *** percent and U.S. producer *** reported *** percent of their commercial shipments in 2020 were to customers with AML requirements. Importers’ responses varied with respect to the share of their commercial shipments made under AMLs:
• *** - 5 percent;
19 This could include government purchases under “Buy America(n)” provisions. Petitioner stated that Buy America provisions generally cover government procurement and use of federal funds that support projects in highways, public transportation, aviation, and intercity passenger rail. It continued that given the intended end uses for SSLP pipe are all applications in the U.S. private industrial sector with few, in any, government projects, it does not believe that Buy America has a meaningful impact on the U.S. SSLP pipe market. It also stated that President Trump sought to expand Buy America requirements to the repair and construction of pipelines in January 2017, which would have implicated SSLP pipe, but no such measures were implemented. Petitioner’s posthearing brief, Responses to Commissioner questions, pp. 29-30.

II-17
• *** - 20 percent;
• *** - 50 percent;
• *** - between 60 and 70 percent;
• *** - 90 percent; and
• *** - 100 percent. U.S. producers and importers were also asked how frequently SSLP pipe produced by
firms listed on AMLs and SSLP pipe produced by firms not on AMLs are interchangeable. One U.S. producer/importer *** reported “usually,” noting that most end users will accept a product meeting API 5CT from distributors, with just a few exceptions, while one U.S. producer and 11 importers reported “sometimes”. Importers cited that it depends on the end user or it is case-by-case and that approved material can be substituted for non-approved material but non-approved cannot be substituted for approved material.
As shown in table II-8, 10 of 16 purchasers reported that AMLs are very important and 6 reported somewhat important in purchasing decisions. Purchasers were equally or nearly split on whether U.S.-product and subject imports are comparable or U.S.-product is superior with respect to AMLs (table II-10).
Respondent Interpipe asserted that U.S. distributors hold three “tiers” of SSLP pipe stock: domestic, AML imports, and non-AML imports and that these tiers effectively limit competition between domestic production and subject imports.20 Respondent also stated that it believes that more than 50 percent of business in the U.S. is AML business, which it is not able to participate in because it generally does not appear on AMLs.21 Petitioner Vallourec stated that historically this industry has been driven by different tiers of distribution and AMLs played a significant role in what the market demanded at a particular time, but lately these AML requirements are sporadic and end users are looking for more cost effective solutions.22
Comparisons of domestic products, subject imports, and nonsubject imports
Purchasers were asked a number of questions comparing SSLP pipe produced in the United States, subject countries, and nonsubject countries. First, purchasers were asked for a country-by-country comparison on the same 16 factors (table II-10) for which they were asked
20 Respondent Interpipe’s prehearing brief, pp. 27-28. 21 Hearing transcript, p. 130 (Valk), and Respondent Interpipe’s posthearing brief, Responses to
Commissioner questions, p. 14. 22 Hearing transcript, pp. 101-102 (Arevalo).
II-18
to rate the importance. Most purchasers reported that U.S.-produced SSLP pipe was comparable on most factors with subject countries’ SSLP pipe. Price was the only factor purchasers consistently considered SSLP pipe imported from subject countries was consistently considered inferior. Czech SSLP pipe was considered comparable to domestic SSLP pipe in all other factors besides being considered inferior in delivery time. U.S.-produced SSLP pipe was considered superior to SSLP pipe imported from Korea, Russia, and Ukraine in terms approved manufacturer’s list, availability, delivery time, product range, and technical support/service.
Most purchasers reported that U.S.-produced and nonsubject SSLP pipe were comparable in all factors other than delivery time, where an equal number of firms consider U.S.-produced SSLP pipe to be superior or comparable, while U.S.-produced SSLP pipe is considered inferior in price. Most firms considered price as very important (see table II-8).

II-19
Table II-10 SSLP pipe: Purchasers’ comparisons between U.S.-produced and imported product
Factor U.S. vs. Czechia U.S. vs. Korea U.S. vs. Russia
S C I S C I S C I Approved manufacturers’ list 4 5 --- 5 4 --- 3 3 --- Availability 3 5 1 4 4 1 3 3 --- Delivery terms 3 4 1 3 3 --- 3 2 --- Delivery time 5 2 1 5 1 --- 4 1 --- Discounts offered 1 5 2 1 4 1 1 3 1 Minimum quantity requirements --- 6 2 1 5 1 1 4 --- Packaging --- 8 --- 1 6 --- --- 6 --- Payment terms 2 6 --- 3 4 --- 1 4 --- Price --- 2 7 --- 1 8 --- --- 6 Product consistency 2 6 1 1 7 --- 1 5 --- Product range 2 5 2 4 4 1 3 3 --- Quality meets industry standards 2 7 --- 2 6 --- 1 5 --- Quality exceeds industry standards 2 6 --- 2 5 --- 1 4 --- Reliability of supply 3 6 --- 3 5 --- 3 3 --- Technical support/service 3 5 --- 4 3 --- 4 1 --- U.S. transportation costs 3 5 --- 2 5 --- 1 4 ---
Factor U.S. vs. Ukraine
U.S. vs. nonsubject
Czechia vs. nonsubject
S C I S C I S C I Approved manufacturers’ list 5 4 --- 5 6 --- 1 5 1 Availability 4 4 1 3 7 1 --- 7 --- Delivery terms 3 4 1 3 7 --- --- 6 --- Delivery time 5 2 1 5 5 --- 1 5 --- Discounts offered 1 5 2 1 5 2 1 5 --- Minimum quantity requirements 1 5 2 --- 6 2 --- 6 --- Packaging 1 7 --- 1 8 --- --- 6 --- Payment terms 1 7 --- 2 7 --- --- 6 --- Price --- 1 8 --- 2 9 1 5 1 Product consistency 2 7 --- 2 9 --- 1 5 1 Product range 4 3 2 1 7 3 --- 6 1 Quality meets industry standards 1 8 --- 1 10 --- 1 6 --- Quality exceeds industry standards 2 6 --- 2 7 --- 1 3 2 Reliability of supply 2 7 --- 2 8 --- 1 5 1 Technical support/service 4 4 --- 2 7 --- --- 6 --- U.S. transportation costs 3 5 --- 3 6 --- --- 6 ---
Table continued on next page.
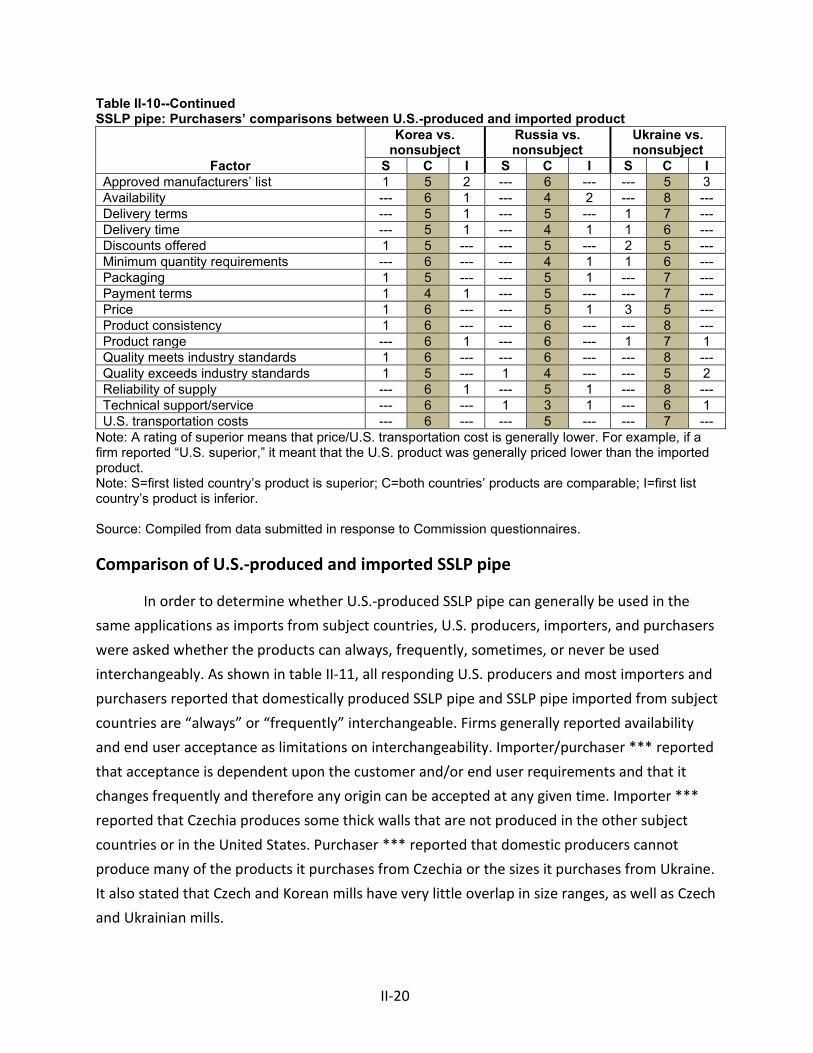
II-20
Table II-10--Continued SSLP pipe: Purchasers’ comparisons between U.S.-produced and imported product
Factor
Korea vs. nonsubject
Russia vs. nonsubject
Ukraine vs. nonsubject
S C I S C I S C I Approved manufacturers’ list 1 5 2 --- 6 --- --- 5 3 Availability --- 6 1 --- 4 2 --- 8 --- Delivery terms --- 5 1 --- 5 --- 1 7 --- Delivery time --- 5 1 --- 4 1 1 6 --- Discounts offered 1 5 --- --- 5 --- 2 5 --- Minimum quantity requirements --- 6 --- --- 4 1 1 6 --- Packaging 1 5 --- --- 5 1 --- 7 --- Payment terms 1 4 1 --- 5 --- --- 7 --- Price 1 6 --- --- 5 1 3 5 --- Product consistency 1 6 --- --- 6 --- --- 8 --- Product range --- 6 1 --- 6 --- 1 7 1 Quality meets industry standards 1 6 --- --- 6 --- --- 8 --- Quality exceeds industry standards 1 5 --- 1 4 --- --- 5 2 Reliability of supply --- 6 1 --- 5 1 --- 8 --- Technical support/service --- 6 --- 1 3 1 --- 6 1 U.S. transportation costs --- 6 --- --- 5 --- --- 7 ---
Note: A rating of superior means that price/U.S. transportation cost is generally lower. For example, if a firm reported “U.S. superior,” it meant that the U.S. product was generally priced lower than the imported product. Note: S=first listed country’s product is superior; C=both countries’ products are comparable; I=first list country’s product is inferior. Source: Compiled from data submitted in response to Commission questionnaires.
Comparison of U.S.-produced and imported SSLP pipe
In order to determine whether U.S.-produced SSLP pipe can generally be used in the same applications as imports from subject countries, U.S. producers, importers, and purchasers were asked whether the products can always, frequently, sometimes, or never be used interchangeably. As shown in table II-11, all responding U.S. producers and most importers and purchasers reported that domestically produced SSLP pipe and SSLP pipe imported from subject countries are “always” or “frequently” interchangeable. Firms generally reported availability and end user acceptance as limitations on interchangeability. Importer/purchaser *** reported that acceptance is dependent upon the customer and/or end user requirements and that it changes frequently and therefore any origin can be accepted at any given time. Importer *** reported that Czechia produces some thick walls that are not produced in the other subject countries or in the United States. Purchaser *** reported that domestic producers cannot produce many of the products it purchases from Czechia or the sizes it purchases from Ukraine. It also stated that Czech and Korean mills have very little overlap in size ranges, as well as Czech and Ukrainian mills.

II-21
Table II-11 SSLP pipe: Interchangeability between SSLP pipe produced in the United States and in other countries, by country pair
Country pair Number of U.S.
producers reporting Number of U.S.
importers reporting Number of
purchasers reporting A F S N A F S N A F S N
U.S. vs. subject countries: U.S. vs. Czechia 3 1 --- --- 5 3 2 --- 6 1 3 --- U.S. vs. Korea 3 2 --- --- 6 1 1 --- 9 --- 1 --- U.S. vs. Russia 3 2 --- --- 6 --- 3 --- 6 --- 1 --- U.S. vs. Ukraine 3 1 --- --- 6 1 1 --- 6 1 3 --- Subject countries comparisons: Czechia vs. Korea 3 1 --- --- 5 3 2 --- 6 1 2 --- Czechia vs. Russia 3 1 --- --- 4 4 4 --- 5 1 1 --- Czechia vs. Ukraine 3 1 --- --- 4 5 2 --- 5 2 3 --- Korea vs. Russia 3 1 --- --- 5 1 3 --- 5 1 1 --- Korea vs. Ukraine 3 1 --- --- 5 2 1 --- 5 3 1 --- Russia vs. Ukraine 3 1 --- --- 6 1 1 --- 6 1 1 --- Nonsubject countries comparisons: U.S. vs. nonsubject 2 3 --- --- 4 4 2 --- 9 2 2 --- Czechia vs. nonsubject 2 2 --- --- 3 4 2 --- 7 1 2 --- Korea vs. nonsubject 2 2 --- --- 3 1 2 --- 7 1 1 --- Russia vs. nonsubject 2 2 --- --- 3 1 2 --- 7 1 1 --- Ukraine vs. nonsubject 2 2 --- --- 4 1 2 --- 8 1 2 ---
Note: A=Always, F=Frequently, S=Sometimes, N=Never. Source: Compiled from data submitted in response to Commission questionnaires.
As can be seen from table II-12, eight responding purchasers reported that domestically produced product always met minimum quality specifications. Five responding purchasers reported that the SSLP pipe imported from Czechia always met minimum quality specifications, six of SSLP pipe from Korea, four of SSLP pipe from Russia, and five of SSLP pipe from Ukraine. Table II-12 SSLP pipe: Ability to meet minimum quality specifications, by source
Source Always Usually Sometimes Rarely or never United States 8 5 --- --- Czechia 5 2 1 --- Korea 6 1 --- --- Russia 4 --- 1 --- Ukraine 5 1 1 --- Nonsubject sources 5 4 --- ---
Note: Purchasers were asked how often domestically produced or imported SSLP pipe meets minimum quality specifications for their own or their customers’ uses. Source: Compiled from data submitted in response to Commission questionnaires.
II-22
In addition, U.S. producers, importers, and purchasers were asked to assess how often differences other than price were significant in sales of SSLP pipe from the United States, subject, or nonsubject countries. As seen in table II-13, all responding U.S. producers and most responding importers and purchasers reported that there are “sometimes” or “never” significant differences other than price between domestically produced SSLP pipe and SSLP pipe imported from subject countries. The importers that reported there are “always” or “frequently” differences cited quality differences, lead times, size production differences, approval from end users, reliability, technical support, transportation network, customer service, delivery timeline, product dimension, and suitability for end users' needs including qualifications. Respondent Interpipe argued that non-price factors limit competition between subject import supply and U.S. products, including Buy American requirements and “Made in America” preferences, the range of sizes are only suitable for certain end users, U.S. distributors hold “tiers” of SSLP pipe stock, U.S. producer decisions on whether to produce OCTG or SSLP pipe, and section 232 measures.23
23 Respondent Interpipe’s postconference brief, pp. 13-20.
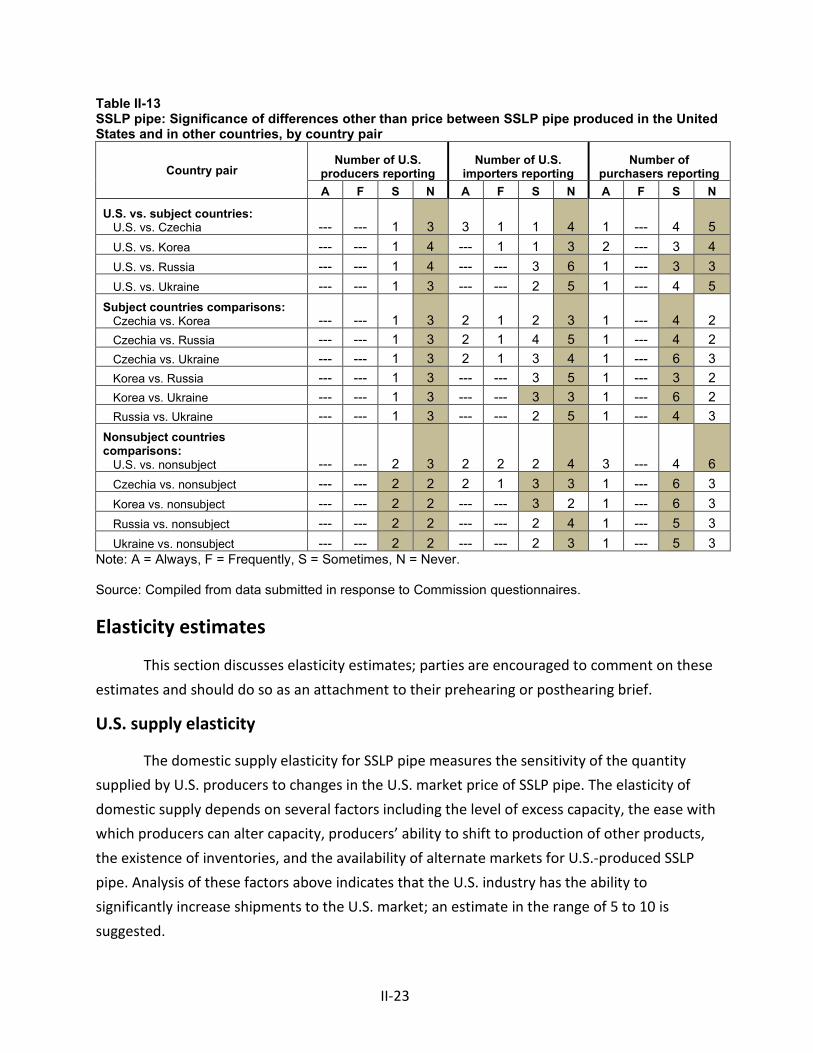
II-23
Table II-13 SSLP pipe: Significance of differences other than price between SSLP pipe produced in the United States and in other countries, by country pair
Country pair Number of U.S.
producers reporting Number of U.S.
importers reporting Number of
purchasers reporting A F S N A F S N A F S N
U.S. vs. subject countries: U.S. vs. Czechia --- --- 1 3 3 1 1 4 1 --- 4 5 U.S. vs. Korea --- --- 1 4 --- 1 1 3 2 --- 3 4 U.S. vs. Russia --- --- 1 4 --- --- 3 6 1 --- 3 3 U.S. vs. Ukraine --- --- 1 3 --- --- 2 5 1 --- 4 5 Subject countries comparisons: Czechia vs. Korea --- --- 1 3 2 1 2 3 1 --- 4 2 Czechia vs. Russia --- --- 1 3 2 1 4 5 1 --- 4 2 Czechia vs. Ukraine --- --- 1 3 2 1 3 4 1 --- 6 3 Korea vs. Russia --- --- 1 3 --- --- 3 5 1 --- 3 2 Korea vs. Ukraine --- --- 1 3 --- --- 3 3 1 --- 6 2 Russia vs. Ukraine --- --- 1 3 --- --- 2 5 1 --- 4 3 Nonsubject countries comparisons: U.S. vs. nonsubject --- --- 2 3 2 2 2 4 3 --- 4 6 Czechia vs. nonsubject --- --- 2 2 2 1 3 3 1 --- 6 3 Korea vs. nonsubject --- --- 2 2 --- --- 3 2 1 --- 6 3 Russia vs. nonsubject --- --- 2 2 --- --- 2 4 1 --- 5 3 Ukraine vs. nonsubject --- --- 2 2 --- --- 2 3 1 --- 5 3
Note: A = Always, F = Frequently, S = Sometimes, N = Never. Source: Compiled from data submitted in response to Commission questionnaires.
Elasticity estimates
This section discusses elasticity estimates; parties are encouraged to comment on these estimates and should do so as an attachment to their prehearing or posthearing brief.
U.S. supply elasticity
The domestic supply elasticity for SSLP pipe measures the sensitivity of the quantity supplied by U.S. producers to changes in the U.S. market price of SSLP pipe. The elasticity of domestic supply depends on several factors including the level of excess capacity, the ease with which producers can alter capacity, producers’ ability to shift to production of other products, the existence of inventories, and the availability of alternate markets for U.S.-produced SSLP pipe. Analysis of these factors above indicates that the U.S. industry has the ability to significantly increase shipments to the U.S. market; an estimate in the range of 5 to 10 is suggested.

II-24
U.S. demand elasticity
The U.S. demand elasticity for SSLP pipe measures the sensitivity of the overall quantity demanded to a change in the U.S. market price of SSLP pipe. This estimate depends on factors discussed above such as the existence, availability, and commercial viability of substitute products, as well as the component share of the SSLP pipe in the production of any downstream products. Based on the available information, the aggregate demand for SSLP pipe is likely to be low to moderately inelastic; a range of -0.5 to -1.0 is suggested.
Substitution elasticity
The elasticity of substitution depends upon the extent of product differentiation between the domestic and imported products.24 Product differentiation, in turn, depends upon such factors as quality (e.g., chemistry, appearance, etc.) and conditions of sale (e.g., availability, sales terms/discounts/promotions, etc.). Based on available information, the elasticity of substitution between U.S.-produced SSLP pipe and imported SSLP pipe is likely to be in the range of 4 to 7.
24 The substitution elasticity measures the responsiveness of the relative U.S. consumption levels of the subject imports and the domestic like products to changes in their relative prices. This reflects how easily purchasers switch from the U.S. product to the subject products (or vice versa) when prices change.
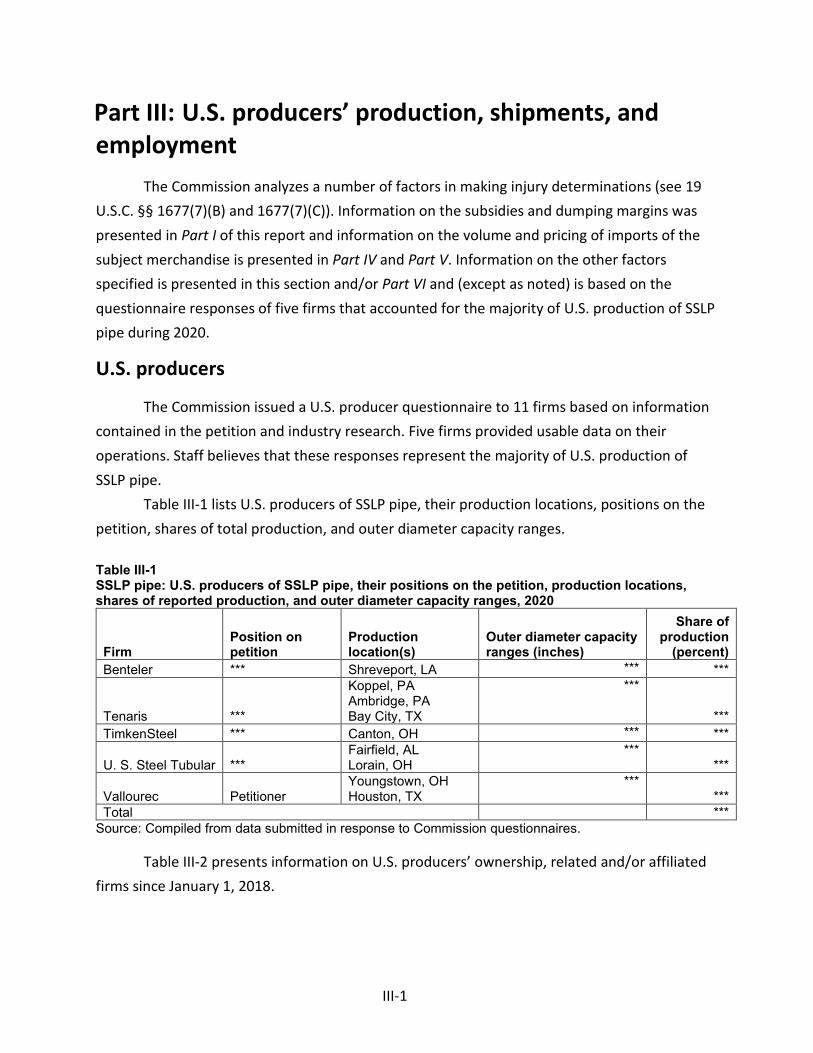
III-1
Part III: U.S. producers’ production, shipments, and employment
The Commission analyzes a number of factors in making injury determinations (see 19 U.S.C. §§ 1677(7)(B) and 1677(7)(C)). Information on the subsidies and dumping margins was presented in Part I of this report and information on the volume and pricing of imports of the subject merchandise is presented in Part IV and Part V. Information on the other factors specified is presented in this section and/or Part VI and (except as noted) is based on the questionnaire responses of five firms that accounted for the majority of U.S. production of SSLP pipe during 2020.
U.S. producers
The Commission issued a U.S. producer questionnaire to 11 firms based on information contained in the petition and industry research. Five firms provided usable data on their operations. Staff believes that these responses represent the majority of U.S. production of SSLP pipe.
Table III-1 lists U.S. producers of SSLP pipe, their production locations, positions on the petition, shares of total production, and outer diameter capacity ranges.
Table III-1 SSLP pipe: U.S. producers of SSLP pipe, their positions on the petition, production locations, shares of reported production, and outer diameter capacity ranges, 2020
Firm Position on petition
Production location(s)
Outer diameter capacity ranges (inches)
Share of production
(percent) Benteler *** Shreveport, LA *** ***
Tenaris ***
Koppel, PA Ambridge, PA Bay City, TX
***
*** TimkenSteel *** Canton, OH *** ***
U. S. Steel Tubular *** Fairfield, AL Lorain, OH
*** ***
Vallourec Petitioner Youngstown, OH Houston, TX
*** ***
Total *** Source: Compiled from data submitted in response to Commission questionnaires.
Table III-2 presents information on U.S. producers’ ownership, related and/or affiliated firms since January 1, 2018.

III-2
Table III-2 SSLP pipe: U.S. producers’ ownership, related and/or affiliated firms, since January 1, 2018
Item / Firm Firm Name Affiliated/Ownership Ownership: *** *** *** *** *** *** *** *** *** *** *** *** *** *** *** Related producers: *** *** *** *** *** *** *** *** *** *** *** *** *** *** *** *** *** *** *** *** *** *** *** *** *** *** *** *** *** ***
Source: Compiled from data submitted in response to Commission questionnaires.
As indicated in table III-2, *** are related to foreign producers of the merchandise and *** U.S. producers are related to U.S. importers of the subject merchandise.1 In addition, as discussed in greater detail below, *** directly import the subject merchandise and *** purchases the subject merchandise from U.S. importers.
Table III-3 presents an overview of events that occurred in the domestic SSLP pipe industry since January 1, 2017.
1 “As explained at the staff conference, Vallourec operates a joint venture with Interpipe in Ukraine that finishes certain seamless standard, line, and pressure pipe (“SSLP pipe”) and exports that pipe exclusively to Europe.” Petitioner’s postconference brief, p. 2, see also petitioner Vallourec’s posthearing brief, pp.6-7 and exh. 8.
Also, ***. ***.

III-3
Table III-3 SSLP pipe: Important industry events, since January 1, 2017
Year Company Description of Event
2017
Tenaris and Vallourec
Closure/idling: Tenaris SA and Vallourec temporarily idled their Houston-area operations in August and early September due to Hurricane Harvey. Tenaris SA announced that it would not resume rolling operations at its Bay City, Texas mill until October.1
2018
U.S. Steel/United Steelworkers
Labor agreement: In October, U.S. Steel and the United Steelworkers (USW) reached a new four-year labor agreement covering 16,000 workers at U.S. Steel facilities, including its Fairfield, Alabama operations.2
2019
U.S. Steel Expansion/modernization: In February, U.S. Steel announced that it would resume construction on a $215 million electric arc furnace project at its Fairfield, Alabama facility. The expansion also included the modernization of the existing rounds caster and was expected to add 150 full-time employees.3
TimkenSteel Closure: In November, Timken Steel announced that it would close a Houston-area facility that provided value-added and finishing services primarily to customers in the energy sector. The closure was expected to impact 97 employees.4
2020
Tenaris Acquisition: In January, Tenaris announced that it acquired U.S. steel pipe manufacturer IPSCO Tubulars, Inc. from PAO TMK for nearly $1.1 billion in cash. The acquisition includes a steel melt shop in Koppel, Pennsylvania, and a seamless pipe mill in Ambridge, Pennsylvania 5
Tenaris Closure/idling: In March, Tenaris announced that it would idle certain tubemaking operations at the end of the month due to a collapse in oil prices. The announcement applied to the firm’s billet mill in Koppel, Pennsylvania, and its seamless pipe mill in Ambridge, Pennsylvania.6
Table continued.

III-4
Table III-3--Continued Year Company Description of Event
2020
U.S. Steel Closure/idling: In March, U.S. Steel announced that it would idle its Lorain, Ohio tubular operations and issued a WARN notice to employees. 250 workers were expected to be laid off by May 24, 2020. The company noted that the decision was largely related to market conditions, including oil pricing, imports, and demand.7
Vallourec Idling/layoff: In April, Vallourec announced that it would lay off 112 workers at its Muskogee, Oklahoma pipe operations due to uncertainty caused by COVID-19 and OPEC actions.8
Vallourec Idling/layoff: In April, Vallourec announced that it would lay off 59 workers at its Youngstown, Ohio operations, citing “unprecedented issues caused by the COVID-19 pandemic and the OPEC-Russia oil price war.” Layoffs were expected to begin April 30 through May 13.9
Tenaris Idling/layoff: In May, Tenaris announced it would lay off 200 workers at its Bay City, Texas plant citing “a drastic drop in demand caused by the price war between Russia and Saudi Arabia.”10
Tenaris Expansion/modernization: In September, Tenaris announced that the firm will upgrade its plant in Koppel, Pennsylvania, to allow the plant to produce billets at a wider range of sizes. The upgrade supports the company’s seamless pipe mills operating in Texas, Pennsylvania, and Canada.11
Sources: 1 Association for Iron and Steel (AIST), “After Hurricane Harvey, Tenaris Pushes Back Bay City Schedule,” September 5, 2017, https://www.aist.org/news/steel-news/2017/september/4-8-september-2017/after-the-hurricane,-tenaris-pushes-back-bay-city. 2 United Steelworkers (USW), “USW Welcomes U.S. Steel Plan to Restart EAF Construction,” February 11, 2019, https://m.usw.org/news/media-center/releases/2019/usw-welcomes-u-s-steel-plan-to-restart-eaf-construction. 3 Thornton, “U.S. Steel restarting Fairfield furnace project, adding 150 jobs” Al.com, February 11, 2019, https://www.al.com/business/2019/02/us-steel-restarting-fairfield-furnace-adding-150-jobs.html. 4 Pulsinelli, “Steel Manufacturer to Close Houston Facility, Cut Nearly 100 Jobs,” Houston Business Journal, November 21, 2019, https://www.bizjournals.com/houston/news/2019/11/21/steel-manufacturer-to-close-houston-facility-cut.html. 5 Veazey, “Tenaris Embarks on U.S. Expansion,” Rigzone, January 3, 2020, https://www.rigzone.com/news/tenaris_embarks_on_us_expansion-03-jan-2020-160710-article/#:~:text=Tenaris%20S.A.%20reported%20Thursday%20that,nearly%20%241.1%20billion%20in%20cash. 6 Druzin, “Tenaris to Idle Some US Ops Amid Oil Price Collapse,” Argus Media, March 19, 2020, https://www.argusmedia.com/en/news/2088751-tenaris-to-idle-some-us-ops-amid-oil-price-collapse. 7 O’Brien, “U.S. Steel to idle Lorain tubular plant, lay off 250 workers by May 24,” The Chronicle, March 23, 2020, https://chroniclet.com/news/207586/us-steel-to-idle-lorain-tubular-plant-lay-off-250-workers-by-may-24/#:~:text=U.S.%20Steel%20has%20notified%20the,in%20a%20letter%20on%20Monday. 8 OK Energy Today, “Nearly 90 Workers at Muskogee Pipe Plant Lose Their Jobs,” April 16, 2020, http://www.okenergytoday.com/2020/04/nearly-90-workers-at-muskogee-pipe-plant-lose-their-jobs/. 9 Gauntner, “Vallourec Lays Off 59 Youngstown Workers Amid Coronavirus, Low Oil Price,” WFMJ, April 7, 2020, https://www.wfmj.com/story/41975901/vallourec-cutting-onethird-of-us-workforce 10 Yanchunas, “Tenaris Bay City to lay off 200; market ‘stark,’” Fastmarkets AMM, May 13, 2020, https://www.amm.com/Article/3932607/Tenaris-Bay-City-to-lay-off-200-market-stark.html. 11 Ramanand, “Tenaris invests $11mln to upgrade Pa Facility,” Fastmarkets AMM, September 1, 2020, https://www.amm.com/Article/3949051/Tenaris-invests-11mln-to-upgrade-Pa-facility.html. Note: Brackets indicate business proprietary information that was obtained from questionnaires for which no public source was found.

III-5
Table III-4 presents U.S. producers’ reported changes in operations since January 1, 2018.
Table III-4 SSLP pipe: U.S. producers’ reported changes in operations, since January 1, 2018
Item / Firm Reported changed in operations Plant closings: *** *** *** *** Expansions: *** *** Acquisitions: *** *** Prolonged shutdowns or curtailments: *** *** *** *** *** *** *** ***
Table continued.

III-6
Table III-4--Continued Revised labor agreements: *** *** Other: *** *** *** ***
Source: Compiled from data submitted in response to Commission questionnaires.
U.S. production, capacity, and capacity utilization
Table III-5 and figure III-1 present U.S. producers’ production, capacity, and capacity utilization during 2018-20. Between 2018 and 2020, capacity remained flat for *** U.S. producers, ***. During the same period, total production fell by 65.0 percent, with a 42.0 percent decrease to 238,062 short tons in 2019 followed by a 39.6 percent decrease to 143,721 short tons in 2020. Production fell by over 75 percent for almost all of the U.S. producers between 2018 and 2020 with ***2 ***.3 As a result, capacity utilization fell in like manner by 37.1 percentage points during 2018-20, from 56.8 percent in 2018 to 19.8 percent in 2020.4
2 ***. See table III-9 and ***. 3 ***. 4 See table III-3 and table III-4 for U.S. producers’ list of ***.

III-7
Table III-5 SSLP pipe: U.S. producers’ production, capacity, and capacity utilization, 2018-20
Source: Compiled from data submitted in response to Commission questionnaires.
Item Calendar year
2018 2019 2020 Capacity (short tons) Benteler *** *** *** Tenaris *** *** *** TimkenSteel *** *** *** U. S. Steel Tubular *** *** *** Vallourec *** *** ***
All firms 722,501 726,417 727,379 Production (short tons) Benteler *** *** *** Tenaris *** *** *** TimkenSteel *** *** *** U. S. Steel Tubular *** *** *** Vallourec *** *** ***
All firms 410,736 238,062 143,721 Capacity utilization (percent) Benteler *** *** *** Tenaris *** *** *** TimkenSteel *** *** *** U. S. Steel Tubular *** *** *** Vallourec *** *** ***
All firms 56.8 32.8 19.8 Share of production (percent) Benteler *** *** *** Tenaris *** *** *** TimkenSteel *** *** *** U. S. Steel Tubular *** *** *** Vallourec *** *** ***
All firms 100.0 100.0 100.0

III-8
Figure III-1 SSLP pipe: U.S. producers’ production, capacity, and capacity utilization, 2018-20
Source: Compiled from data submitted in response to Commission questionnaires.
Alternative products
As shown in table III-6, 14.2 percent of the products produced in 2020 by U.S. producers was SSLP pipe, down by 5.9 percentage points since 2018. Overall, oil country tubular goods (“OCTG”) comprised *** percent of products produced on the same equipment as SSLP pipe in 2018 and increased to about *** percent in 2019 and 2020. Other out-of-scope production included SSLP pipe with outside diameter larger than 16 inches (*** percent in 2020) and other products (*** percent in 2020) that included OCTG coupling stock, structural pipe, mechanical tube, and drill pipe.
0.010.020.030.040.050.060.070.080.090.0100.0
0
100
200
300
400
500
600
700
800
2018 2019 2020
Calendar year
Ratio
(percent)Qua
ntity
(1,0
00 s
hort
tons
)
Capacity (left-axis) Production (left-axis) Capacity utilization (right-axis)
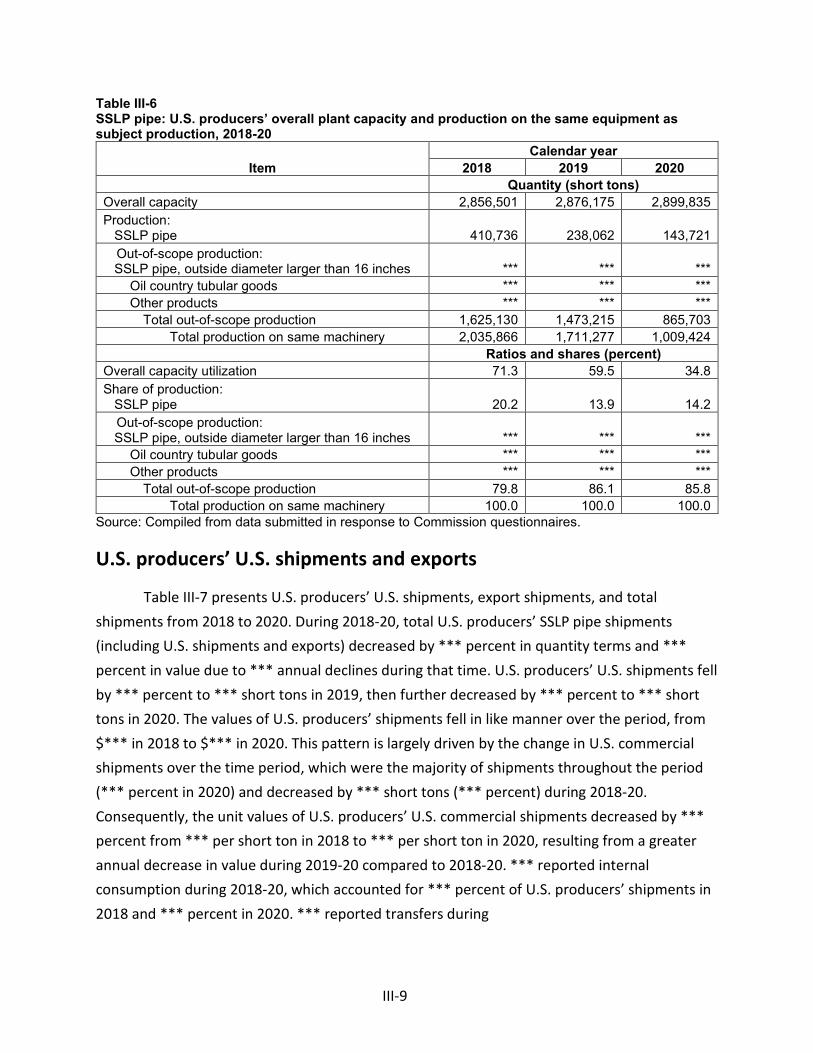
III-9
Table III-6 SSLP pipe: U.S. producers’ overall plant capacity and production on the same equipment as subject production, 2018-20
Item Calendar year
2018 2019 2020 Quantity (short tons) Overall capacity 2,856,501 2,876,175 2,899,835 Production: SSLP pipe 410,736 238,062 143,721
Out-of-scope production: SSLP pipe, outside diameter larger than 16 inches *** *** ***
Oil country tubular goods *** *** *** Other products *** *** ***
Total out-of-scope production 1,625,130 1,473,215 865,703 Total production on same machinery 2,035,866 1,711,277 1,009,424
Ratios and shares (percent) Overall capacity utilization 71.3 59.5 34.8 Share of production: SSLP pipe 20.2 13.9 14.2
Out-of-scope production: SSLP pipe, outside diameter larger than 16 inches *** *** ***
Oil country tubular goods *** *** *** Other products *** *** ***
Total out-of-scope production 79.8 86.1 85.8 Total production on same machinery 100.0 100.0 100.0
Source: Compiled from data submitted in response to Commission questionnaires.
U.S. producers’ U.S. shipments and exports
Table III-7 presents U.S. producers’ U.S. shipments, export shipments, and total shipments from 2018 to 2020. During 2018-20, total U.S. producers’ SSLP pipe shipments (including U.S. shipments and exports) decreased by *** percent in quantity terms and *** percent in value due to *** annual declines during that time. U.S. producers’ U.S. shipments fell by *** percent to *** short tons in 2019, then further decreased by *** percent to *** short tons in 2020. The values of U.S. producers’ shipments fell in like manner over the period, from $*** in 2018 to $*** in 2020. This pattern is largely driven by the change in U.S. commercial shipments over the time period, which were the majority of shipments throughout the period (*** percent in 2020) and decreased by *** short tons (*** percent) during 2018-20. Consequently, the unit values of U.S. producers’ U.S. commercial shipments decreased by *** percent from *** per short ton in 2018 to *** per short ton in 2020, resulting from a greater annual decrease in value during 2019-20 compared to 2018-20. *** reported internal consumption during 2018-20, which accounted for *** percent of U.S. producers’ shipments in 2018 and *** percent in 2020. *** reported transfers during

III-10
2018-20, which were *** percent of U.S. producers’ shipments in quantity terms. ***. In the same period, *** reported exports to ***, which were *** percent of total U.S. producers’ shipments in 2018 then *** percent in 2019 before increasing to *** percent in 2020.
Table III-7 SSLP pipe: U.S. producers’ U.S. shipments, exports shipments, and total shipments, 2018-20
Item Calendar year
2018 2019 2020 Quantity (short tons) Commercial U.S. shipments *** *** *** Internal consumption *** *** *** Transfers to related firms *** *** ***
U.S. shipments 399,784 233,989 144,054 Export shipments *** *** ***
Total shipments *** *** *** Value (1,000 dollars) Commercial U.S. shipments *** *** *** Internal consumption *** *** *** Transfers to related firms *** *** ***
U.S. shipments 670,698 387,406 210,799 Export shipments *** *** ***
Total shipments *** *** *** Unit value (dollars per short ton) Commercial U.S. shipments *** *** *** Internal consumption *** *** *** Transfers to related firms *** *** ***
U.S. shipments 1,678 1,656 1,463 Export shipments *** *** ***
Total shipments *** *** *** Table continued.

III-11
Table III-7--Continued SSLP pipe: U.S. producers’ U.S. shipments, exports shipments, and total shipments, 2018-20
Item Calendar year
2018 2019 2020 Share of U.S. shipments quantity (percent)
Commercial U.S. shipments *** *** *** Internal consumption *** *** *** Transfers to related firms *** *** ***
U.S. shipments *** *** *** Share of total shipments quantity (percent) Commercial U.S. shipments *** *** *** Internal consumption *** *** *** Transfers to related firms *** *** ***
U.S. shipments *** *** *** Export shipments *** *** ***
Total shipments *** *** *** Share of U.S. shipments value (percent)
Commercial U.S. shipments *** *** *** Internal consumption *** *** *** Transfers to related firms *** *** ***
U.S. shipments *** *** *** Share of total shipments value (percent) Commercial U.S. shipments *** *** *** Internal consumption *** *** *** Transfers to related firms *** *** ***
U.S. shipments *** *** *** Export shipments *** *** ***
Total shipments *** *** *** Source: Compiled from data submitted in response to Commission questionnaires.
Captive production
Section 771(7)(C)(iv) of the Act states that–5
If domestic producers internally transfer significant production of the domestic like product for the production of a downstream article and sell significant production of the domestic like product in the merchant market, and the Commission finds that–
(I) the domestic like product produced that is internally transferred for processing into that downstream article does not enter the merchant market for the domestic like product,
(II) the domestic like product is the predominant material input in the production of that downstream article, and
5 Amended by PL 114-27 (as signed, June 29, 2015), Trade Preferences Extension Act of 2015.
III-12
then the Commission, in determining market share and the factors affecting financial performance . . ., shall focus primarily on the merchant market for the domestic like product.
Transfers and sales
As reported in table III-7 above, U.S. producers’ internal consumption of SSLP pipe as a share of their U.S. commercial shipments grew from *** percent to *** percent in quantity terms and from *** percent to *** percent in value terms during 2018-20.
First statutory criterion in captive production
The first requirement for application of the captive production provision is that the domestic like product that is internally transferred for processing into that downstream article not enter the merchant market for the domestic like product. *** reported internal consumption of SSLP pipe for the production of ***.
Second statutory criterion in captive production
The second criterion of the captive production provision concerns whether the domestic like product is the predominant material input in the production of the downstream article that is captively produced. With respect to the downstream articles resulting from captive production, SSLP pipe reportedly comprises *** percent of the finished cost of ***.
U.S. producers’ inventories
Table III-8 presents U.S. producers’ end-of-period inventories and the ratio of these inventories to U.S. producers’ production, U.S. shipments, and total shipments between 2018 and 2020. During 2018-20, U.S. producers’ end-of-period inventories decreased by *** short tons or *** percent, yet increased relative to both U.S. production and U.S. shipments, from *** percent in 2018 to *** percent in 2020, due to relatively larger declines in U.S. production and shipments.

III-13
Table III-8 SSLP pipe: U.S. producers’ inventories, 2018-20
Item Calendar year
2018 2019 2020 Quantity (short tons) U.S. producers' end-of-period inventories *** *** *** Ratio (percent) Ratio of inventories to.-- U.S. production *** *** ***
U.S. shipments *** *** *** Total shipments *** *** ***
Source: Compiled from data submitted in response to Commission questionnaires.
U.S. producers’ imports and purchases
U.S. producers’ imports and purchases of SSLP pipe are presented in table III-9. ***. *** reported other purchases of SSLP pipe ***.6
6 ***.
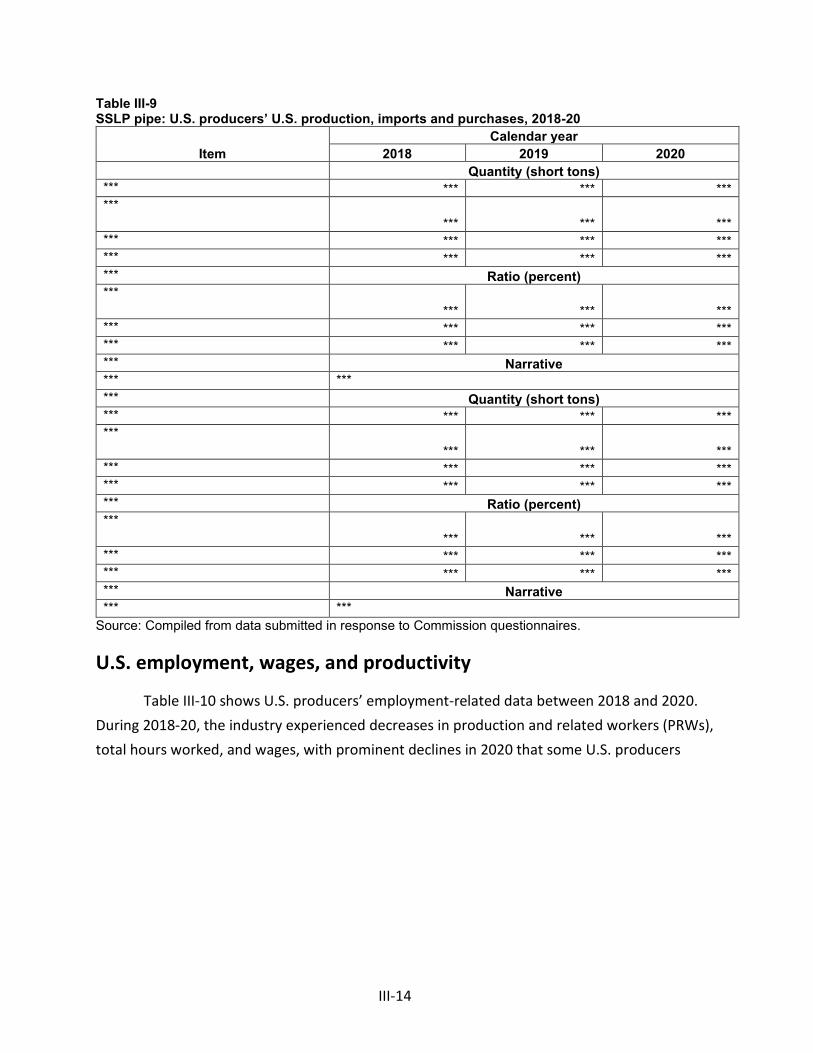
III-14
Table III-9 SSLP pipe: U.S. producers’ U.S. production, imports and purchases, 2018-20
Item Calendar year
2018 2019 2020 Quantity (short tons) *** *** *** *** ***
*** *** *** *** *** *** *** *** *** *** *** *** Ratio (percent) ***
*** *** *** *** *** *** *** *** *** *** *** *** Narrative *** *** *** Quantity (short tons) *** *** *** *** ***
*** *** *** *** *** *** *** *** *** *** *** *** Ratio (percent) ***
*** *** *** *** *** *** *** *** *** *** *** *** Narrative *** ***
Source: Compiled from data submitted in response to Commission questionnaires.
U.S. employment, wages, and productivity
Table III-10 shows U.S. producers’ employment-related data between 2018 and 2020. During 2018-20, the industry experienced decreases in production and related workers (PRWs), total hours worked, and wages, with prominent declines in 2020 that some U.S. producers

III-15
attributed to lost market share and COVID-19 pandemic-related issues.7 PRWs and total hours worked decreased by 39.9 percent and 43.6 percent, respectively, from 2018 to 2020 resulting in a 6.2 percent decrease in hours worked per PRWs over that period. Similarly, wages paid fell by 45.0 percent between 2018 and 2020 causing hourly wages to decrease slightly from $42.69 in 2018 to $41.62 in 2020, after a period low of $40.21 in 2019. At the same time, productivity fell by 38.0 percent to 110.3 short tons per 1,000 hours in 2020. Combined, this resulted in a 57.2 percent increase in unit labor costs during the period to $377 per short ton in 2020.
Table III-10 SSLP pipe: Average number of production and related workers, hours worked, wages paid to such employees, hourly wages, productivity, and unit labor costs, 2018-20
Item Calendar year
2018 2019 2020 Production and related workers (PRWs) (number) 1,129 1,001 679 Total hours worked (1,000 hours) 2,310 1,992 1,303 Hours worked per PRW (hours) 2,046 1,990 1,919 Wages paid ($1,000) 98,611 80,103 54,229 Hourly wages (dollars per hour) $42.69 $40.21 $41.62 Productivity (short tons per 1,000 hours) 177.8 119.5 110.3 Unit labor costs (dollars per short ton) $240 $336 $377
Source: Compiled from data submitted in response to Commission questionnaires.
7 See *** U.S. producers’ questionnaires, question II-10.


IV-1
Part IV: U.S. imports, apparent U.S. consumption, and market shares
U.S. importers
The Commission issued importer questionnaires to 35 firms believed to be importers of subject SSLP pipe, as well as to all U.S. producers of SSLP pipe.1 Usable questionnaire responses were received from 17 companies,2 representing *** percent of U.S. imports from Czechia, *** percent of U.S. imports from Korea, *** percent of U.S. imports from Russia, and *** percent of U.S. imports from Ukraine in 2020.3 Import quantities and values presented in this report are derived from official U.S. import statistics using HTS statistical reporting numbers 7304.19.1020, 7304.19.1030, 7304.19.1045, 7304.19.1060, 7304.19.5020, 7304.19.5050, 7304.31.6050, 7304.39.0016, 7304.39.0020, 7304.39.0024, 7304.39.0028, 7304.39.0032, 7304.39.0036, 7304.39.0040, 7304.39.0044, 7304.39.0048, 7304.39.0052, 7304.39.0056, 7304.39.0062, 7304.39.0068, 7304.39.0072, 7304.51.5005, 7304.51.5060, 7304.59.6000, 7304.59.8010, 7304.59.8015, 7304.59.8020, 7304.59.8025, 7304.59.8030, 7304.59.8035, 7304.59.8040, 7304.59.8045, 7304.59.8050, 7304.59.8055, 7304.59.8060, 7304.59.8065, and 7304.59.8070, and responses to Commission questionnaires, except as otherwise noted.4
1 The Commission issued questionnaires to those firms identified in the petition, along with firms that, based on a review of data provided by U.S. Customs and Border Protection (“Customs”), may have accounted for more than one percent of total imports under HTS statistical reporting numbers identified in the scope.
2 Eight firms reported that they did not import SSLP pipe into the United States since January 1, 2018. 3 The response rates presented are calculated based on a comparison of the quantity of 2020 U.S.
imports of SSLP pipe as reported in the responses to the Commission’s U.S. importer questionnaires with the total quantity of imports reported in 2020 official U.S. import statistics which were adjusted to exclude out-of-scope products.
4 Official U.S. import statistics were adjusted to remove out-of-scope products that enter under the referenced HTS statistical reporting numbers, but are not included in the scope of this investigation. *** reported out-of-scope products that entered under the referenced HTS statistical reporting numbers within the questionnaire mailing period. ***. See Appendix D.

IV-2
Table IV-1 lists all responding U.S. importers of SSLP pipe from subject and nonsubject sources, their locations, and their shares of U.S. imports (compiled from data submitted in response to Commission questionnaires), in 2020. Table IV-1 SSLP pipe: U.S. importers by source, 2020
Firm Headquarters
Share of imports by source (percent)
Czechia Korea Russia Ukraine Subject sources
Nonsubject sources
All import
sources American Piping Chesterfield, MO *** *** *** *** *** *** *** ArcelorMittal Chicago, IL *** *** *** *** *** *** *** ArcelorMittal
Projects Americas
Houston, TX
*** *** *** *** *** *** *** ArcelorMittal
Projects Europe
Heijningen, The Netherlands,
*** *** *** *** *** *** *** Benteler Houston, TX *** *** *** *** *** *** *** DistributionNOW Houston, TX *** *** *** *** *** *** *** Kelly Pipe Santa Fe
Springs, CA *** *** *** *** *** *** *** North American
Interpipe Houston, TX
*** *** *** *** *** *** *** OFS Houston, TX *** *** *** *** *** *** *** Optima Steel Concord, CA *** *** *** *** *** *** *** Seba Tubular Houston, TX *** *** *** *** *** *** *** Tenaris Houston, TX *** *** *** *** *** *** *** TMK-ARTROM Slatina, Olt
County, RO *** *** *** *** *** *** *** TMK Industrial Houston, TX *** *** *** *** *** *** *** TMK IPSCO Houston, TX *** *** *** *** *** *** *** TMK Overseas Houston, TX *** *** *** *** *** *** *** Vallourec Houston, TX *** *** *** *** *** *** ***
Total *** *** *** *** *** *** *** Source: Compiled from data submitted in response to Commission questionnaires.
U.S. imports
Table IV-2 and figure IV-1 present data for U.S. imports of SSLP pipe from subject sources and all other sources during 2018-20.5 Since 2018, U.S. imports of SSLP pipe decreased greatly overall by *** percent to *** short tons in 2020, mainly resulting from the *** short ton drop in U.S. imports of SSLP pipe between 2019 and 2020. In the same period, the value of U.S. imports of SSLP pipe similarly decreased by *** percent to ***
5 Official U.S. import statistics were adjusted to remove out-of-scope imports as reported in questionnaire responses.

IV-3
million in 2020. During 2018-20, U.S. imports of SSLP pipe from Czechia and Russia experienced the largest drops among subject sources, falling by 26,640 short tons ($32.6 million) and *** short tons (*** million), respectively. All U.S. imports from subject countries fell during the period except for Korean imports of SSLP pipe, which increased by 7,968 short tons (45.6 percent) during 2018-20 and was *** percent of U.S. imports in quantity terms in 2020. In total, U.S. imports from subject sources fell by *** short tons (*** million) while nonsubject imports decreased by *** short tons (*** million) between 2018 and 2020.
Table IV-2 SSLP pipe: U.S. imports by source, 2018-20
Item Calendar year
2018 2019 2020 Quantity (short tons) U.S. imports from.-- Czechia 42,867 39,243 16,227
Korea 17,460 18,863 25,428 Russia *** *** *** Ukraine 42,962 48,134 36,157
Subject sources *** *** *** Subject sources less Russia 103,289 106,239 77,812
Germany *** *** *** Mexico *** *** *** All other sources *** *** ***
Nonsubject sources 520,979 427,316 231,467 Nonsubject sources plus Russia *** *** ***
All import sources *** *** *** Value (1,000 dollars) U.S. imports from.-- Czechia 50,401 48,637 17,819
Korea 22,061 25,480 27,619 Russia *** *** *** Ukraine 45,613 50,690 31,871
Subject sources *** *** *** Subject sources less Russia 118,075 124,808 77,309
Germany *** *** *** Mexico *** *** *** All other sources *** *** ***
Nonsubject sources 846,673 736,843 395,465 Nonsubject sources plus Russia *** *** ***
All import sources *** *** *** Table continued.

IV-4
Table IV-2--Continued SSLP pipe: U.S. imports by source, 2018-20
Item Calendar year
2018 2019 2020 Unit value (dollars per short ton) U.S. imports from.-- Czechia 1,176 1,239 1,098
Korea 1,264 1,351 1,086 Russia *** *** *** Ukraine 1,062 1,053 881
Subject sources *** *** *** Subject sources less Russia 1,143 1,175 994
Germany *** *** *** Mexico *** *** *** All other sources *** *** ***
Nonsubject sources 1,625 1,724 1,709 Nonsubject sources plus Russia *** *** ***
All import sources *** *** *** Share of quantity (percent) U.S. imports from.-- Czechia *** *** ***
Korea *** *** *** Russia *** *** *** Ukraine *** *** ***
Subject sources *** *** *** Subject sources less Russia *** *** ***
Germany *** *** *** Mexico *** *** *** All other sources *** *** ***
Nonsubject sources *** *** *** Nonsubject sources plus Russia *** *** ***
All import sources *** *** *** Table continued.

IV-5
Table IV-2--Continued SSLP pipe: U.S. imports by source, 2018-20
Item Calendar year
2018 2019 2020 Share of value (percent)
U.S. imports from.-- Czechia *** *** ***
Korea *** *** *** Russia *** *** *** Ukraine *** *** ***
Subject sources *** *** *** Subject sources less Russia *** *** ***
Germany *** *** *** Mexico *** *** *** All other sources *** *** ***
Nonsubject sources *** *** *** Nonsubject sources plus Russia *** *** ***
All import sources *** *** *** Ratio to U.S. production
U.S. imports from.-- Czechia 10.4 16.5 11.3
Korea 4.3 7.9 17.7 Russia *** *** *** Ukraine 10.5 20.2 25.2
Subject sources *** *** *** Subject sources less Russia 25.1 44.6 54.1
Germany *** *** *** Mexico *** *** *** All other sources *** *** ***
Nonsubject sources 126.8 179.5 161.1 Nonsubject sources plus Russia *** *** ***
All import sources *** *** *** Source: Compiled from data submitted in response to Commission questionnaires and official U.S. import statistics for HTS statistical reporting numbers 7304.19.1020, 7304.19.1030, 7304.19.1045, 7304.19.1060, 7304.19.5020, 7304.19.5050, 7304.31.6050, 7304.39.0016, 7304.39.0020, 7304.39.0024, 7304.39.0028, 7304.39.0032, 7304.39.0036, 7304.39.0040, 7304.39.0044, 7304.39.0048, 7304.39.0052, 7304.39.0056, 7304.39.0062, 7304.39.0068, 7304.39.0072, 7304.51.5005, 7304.51.5060, 7304.59.6000, 7304.59.8010, 7304.59.8015, 7304.59.8020, 7304.59.8025, 7304.59.8030, 7304.59.8035, 7304.59.8040, 7304.59.8045, 7304.59.8050, 7304.59.8055, 7304.59.8060, 7304.59.8065, and 7304.59.8070, accessed February 8, 2021.

IV-6
Figure IV-1 SSLP pipe: U.S. import quantities and average unit values, 2018-20
* * * * * * * * * Source: Compiled from data submitted in response to Commission questionnaires and official U.S. import statistics for HTS statistical reporting numbers 7304.19.1020, 7304.19.1030, 7304.19.1045, 7304.19.1060, 7304.19.5020, 7304.19.5050, 7304.31.6050, 7304.39.0016, 7304.39.0020, 7304.39.0024, 7304.39.0028, 7304.39.0032, 7304.39.0036, 7304.39.0040, 7304.39.0044, 7304.39.0048, 7304.39.0052, 7304.39.0056, 7304.39.0062, 7304.39.0068, 7304.39.0072, 7304.51.5005, 7304.51.5060, 7304.59.6000, 7304.59.8010, 7304.59.8015, 7304.59.8020, 7304.59.8025, 7304.59.8030, 7304.59.8035, 7304.59.8040, 7304.59.8045, 7304.59.8050, 7304.59.8055, 7304.59.8060, 7304.59.8065, and 7304.59.8070, accessed February 8, 2021.
Slightly larger declines in U.S. imports of SSLP quantities compared to values in this period led to a *** per short ton (*** percent) decrease in unit values of all U.S. imports of SSLP pipe to *** per short ton in 2020. Unit values of U.S. imports of SSLP pipe from subject sources decreased from *** per short ton in 2018 to *** per short ton in 2020 as unit values of U.S. imports of SSLP pipe from nonsubject sources increased from *** per short ton in 2018 to *** per short ton in 2020. Among subject sources, imports of Russian SSLP pipe experienced the largest decrease, in both level and percentage terms, from *** per short ton in 2018 to *** per short ton in 2020, a decline of $*** per short ton and *** percent respectively. Within nonsubject sources, unit values of U.S. imports of SSLP pipe from Germany and Mexico fell by *** per short ton and *** per short ton, respectively, while unit values of U.S. imports of SSLP pipe from all other nonsubject sources increased by *** per short ton or *** percent between 2018 and 2020.

IV-7
Overall, nonsubject imports had higher unit values than subject sources throughout the entire period and in 2020 accounted for *** percent and *** percent of imports in quantity and value terms, respectively. According to official U.S. imports statistics, not adjusted to exclude out-of-scope products, the largest nonsubject source of U.S. imports of SSLP pipe was Mexico accounting for 16.4 percent of U.S. imports of SSLP pipe by quantity in 2020 followed by Germany (11.3 percent) and Japan (6.7 percent).
Among subject sources of U.S. imports SSLP pipe in 2020, Ukraine was the *** in both quantity (*** percent of all U.S. imports) and value terms (*** percent), followed by Korea, accounting for *** percent and *** percent of all U.S. imports in quantity and value terms, respectively, in 2020. Conversely, in 2020 Russia was the ***, accounting for *** percent of U.S. imports of SSLP pipe in quantity and *** percent in value terms during 2018-20. U.S. imports from Czechia decreased as share of U.S. imports in quantity terms from *** percent in 2018 to *** percent in 2020, after a period high of *** percent in 2019. During that same time, U.S. imports of SSLP pipe from Korea, which generally had the *** unit values among subject sources, increased as a share of the quantity and value of subject imports (from *** percent and *** percent in 2019 to *** percent and *** percent in 2020, respectively), though from a relatively small base.
U.S. imports of SSLP pipe as a ratio to U.S. production increased from *** percent in 2018 to *** percent in 2020. As a ratio to U.S. production, U.S. imports of SSLP pipe from subject sources increased from *** percent in 2018 to *** percent in 2020, while U.S. imports of SSLP pipe from nonsubject sources increased from *** percent in 2018 to *** percent in 2020.
Negligibility
The statute requires that an investigation be terminated without an injury determination if imports of the subject merchandise are found to be negligible.6 Negligible imports are generally defined in the Act, as amended, as imports from a country of merchandise corresponding to a domestic like SSLP pipe where such imports account for less than 3 percent of the volume of all such merchandise imported into the United States in the most recent 12-month period for which data are available that precedes the filing of the petition or the initiation of the investigation. However, if there are imports of such merchandise from a number of countries subject to investigations initiated on the same day that individually
6 Sections 703(a)(1), 705(b)(1), 733(a)(1), and 735(b)(1) of the Act (19 U.S.C. §§ 1671b(a)(1), 1671d(b)(1), 1673b(a)(1), and 1673d(b)(1)).

IV-8
account for less than 3 percent of the total volume of the subject merchandise, and if the imports from those countries collectively account for more than 7 percent of the volume of all such merchandise imported into the United States during the applicable 12-month period, then imports from such countries are deemed not to be negligible.7
Tables IV-3 and IV-4 with figure IV-2 present the individual shares of total imports of SSLP pipe by subject countries by quantity from July 2019 to June 2020, the most recent 12-month period preceding the filing of the petitions for the investigations. Individual quantities are computed by removing the country-specific volume of reported out-of-scope imports from the total U.S. imports from that country based on official import statistics for the primary HTS statistical reporting numbers. These adjusted country-specific quantities are used to calculate the individual shares of total imports of SSLP pipe. During the 12-month beginning in July 2019, U.S. imports of SSLP pipe from Czechia, Korea, and Ukraine individually accounted for more than *** of total U.S. imports of SSLP pipe by quantity. Though Russia accounted for *** percent during this period, subject sources collectively accounted for *** percent of U.S. imports of SSLP pipe by quantity.8
Table IV-3 SSLP pipe: U.S. imports in the twelve-month period preceding the filing of the petitions, July 2019 through June 2020
Item July 2019 through June 2020
Quantity (short tons) Share quantity (percent) U.S. imports from.-- Czechia *** ***
Korea *** *** Russia *** *** Ukraine *** *** Germany *** *** Mexico *** *** All other sources *** ***
All import sources *** *** Source: Compiled from data submitted in response to Commission questionnaires and official U.S. import statistics for HTS statistical reporting numbers 7304.19.1020, 7304.19.1030, 7304.19.1045, 7304.19.1060, 7304.19.5020, 7304.19.5050, 7304.31.6050, 7304.39.0016, 7304.39.0020, 7304.39.0024, 7304.39.0028, 7304.39.0032, 7304.39.0036, 7304.39.0040, 7304.39.0044, 7304.39.0048, 7304.39.0052, 7304.39.0056, 7304.39.0062, 7304.39.0068, 7304.39.0072, 7304.51.5005, 7304.51.5060, 7304.59.6000, 7304.59.8010, 7304.59.8015, 7304.59.8020, 7304.59.8025, 7304.59.8030, 7304.59.8035, 7304.59.8040, 7304.59.8045, 7304.59.8050, 7304.59.8055, 7304.59.8060, 7304.59.8065, and 7304.59.8070, accessed February 8, 2021.
7 Section 771 (24) of the Act (19 U.S.C § 1677(24)). 8 See Appendix D for more information regarding negligibility.

IV-9
Table IV-4 SSLP pipe: U.S. imports in various twelve-month periods before and after the filing of the petitions, December 2018 through December 2020
Item
Quantity (short tons) Share of quantity (percent)
Russia All other sources
All import
sources Russia
All other
sources
All import
sources U.S. imports for a twelve-month period ending.-- December 31, 2018 *** *** *** *** *** ***
January 31, 2019 *** *** *** *** *** *** February 28, 2019 *** *** *** *** *** *** March 31, 2019 *** *** *** *** *** *** April 30, 2019 *** *** *** *** *** *** May 31, 2019 *** *** *** *** *** *** June 30, 2019 *** *** *** *** *** *** July 31, 2019 *** *** *** *** *** *** August 31, 2019 *** *** *** *** *** *** September 30, 2019 *** *** *** *** *** *** October 31, 2019 *** *** *** *** *** *** November 30, 2019 *** *** *** *** *** *** December 31, 2019 *** *** *** *** *** *** January 31, 2020 *** *** *** *** *** *** February 28, 2020 *** *** *** *** *** *** March 31, 2020 *** *** *** *** *** *** April 30, 2020 *** *** *** *** *** *** May 31, 2020 *** *** *** *** *** *** June 30, 2020 (negligibility period) *** *** *** *** *** *** July 31, 2020 *** *** *** *** *** *** August 31, 2020 *** *** *** *** *** *** September 30, 2020 *** *** *** *** *** *** October 31, 2020 *** *** *** *** *** *** November 30, 2020 *** *** *** *** *** *** December 31, 2020 *** *** *** *** *** ***
Source: Compiled from data submitted in response to Commission questionnaires and official U.S. import statistics for HTS statistical reporting numbers 7304.19.1020, 7304.19.1030, 7304.19.1045, 7304.19.1060, 7304.19.5020, 7304.19.5050, 7304.31.6050, 7304.39.0016, 7304.39.0020, 7304.39.0024, 7304.39.0028, 7304.39.0032, 7304.39.0036, 7304.39.0040, 7304.39.0044, 7304.39.0048, 7304.39.0052, 7304.39.0056, 7304.39.0062, 7304.39.0068, 7304.39.0072, 7304.51.5005, 7304.51.5060, 7304.59.6000, 7304.59.8010, 7304.59.8015, 7304.59.8020, 7304.59.8025, 7304.59.8030, 7304.59.8035, 7304.59.8040, 7304.59.8045, 7304.59.8050, 7304.59.8055, 7304.59.8060, 7304.59.8065, and 7304.59.8070, accessed February 8, 2021.
IV-10
Figure IV-2 SSLP pipe: U.S. imports in various twelve-month periods before and after the filing of the petition, December 2018 through December 2020
* * * * * * * * Source: Compiled from data submitted in response to Commission questionnaires and official U.S. import statistics for HTS statistical reporting numbers 7304.19.1020, 7304.19.1030, 7304.19.1045, 7304.19.1060, 7304.19.5020, 7304.19.5050, 7304.31.6050, 7304.39.0016, 7304.39.0020, 7304.39.0024, 7304.39.0028, 7304.39.0032, 7304.39.0036, 7304.39.0040, 7304.39.0044, 7304.39.0048, 7304.39.0052, 7304.39.0056, 7304.39.0062, 7304.39.0068, 7304.39.0072, 7304.51.5005, 7304.51.5060, 7304.59.6000, 7304.59.8010, 7304.59.8015, 7304.59.8020, 7304.59.8025, 7304.59.8030, 7304.59.8035, 7304.59.8040, 7304.59.8045, 7304.59.8050, 7304.59.8055, 7304.59.8060, 7304.59.8065, and 7304.59.8070, accessed February 8, 2021.
Cumulation considerations
In assessing whether imports should be cumulated, the Commission determines whether U.S. imports from the subject countries compete with each other and with the domestic like product and has generally considered four factors: (1) fungibility, (2) presence of sales or offers to sell in the same geographical markets, (3) common or similar channels of distribution, and (4) simultaneous presence in the market. Information regarding channels of distribution, market areas, and interchangeability appear in Part II. Additional information concerning fungibility, geographical markets, and simultaneous presence in the market is presented below.
Fungibility
Table IV-5 and figure IV-3 present the summary of data the Commission requested information concerning U.S. producers’ and U.S. importers’ U.S. shipments of SSLP pipe by
IV-11
outer diameter size in 2020. For U.S. producers, *** percent of U.S. shipments were of SSLP pipe with outer diameters larger than 2 inches and less than or equal to 12 inches. These shipments were concentrated in outer diameters between 2 and 8 inches, with outer diameter sizes between 4 and 6 inches and between 6 and 8 inches each *** percent of U.S. producers’ shipments in 2020. U.S. importers’ shipments of subject SSLP pipe were more evenly distributed across outer diameter sizes, though some U.S. importer shipments of SSLP pipe from Korea and Russia were more concentrated in particular outer diameters.
U.S. importers’ shipments of SSLP from Ukraine accounted for the *** share of SSLP pipe shipments with outer diameter less than 2 inches (*** percent) and outer diameter between 12 and 14 inches (*** percent) compared to U.S. shipments from other subject sources or U.S. producers. U.S. producers’ shipments comprised the *** share of U.S. shipments of SSLP pipe with outer diameters between 2 and 12 inches compared to U.S. shipments from U.S. producers or other subject sources in 2020.
U.S. shipments of imports of SSLP pipe from subject sources with an outer diameter size of 2 inches or less were *** percent of reported U.S. shipments in 2020 while U.S. producers accounted for *** percent. For SSLP pipe with outer diameter sizes ranges between 2 and 8 inches, U.S. producers’ shipments contributed *** of U.S. shipments in 2020 compared to U.S. importers’ shipments from subject sources. Another notable comparison is for U.S. shipments of SSLP pipe with outer diameter sizes greater than 12 inches, where imports from subject sources were *** of U.S. producers’ shipments of the same pipe in 2020.
When considering total U.S. shipments of SSLP pipe including nonsubject sources, similar trends appear as discussed above. Among U.S. shipments of SSLP pipe with outer diameter less than 2 inches, *** percent were from all U.S. imports, approximately *** of which were supplied from nonsubject sources. For U.S. shipments of SSLP pipe with outer diameter greater than 12 inches, *** percent were imported SSLP pipe, *** supplied by ***.

IV-12
Table IV-5 SSLP pipe: U.S. producers' and U.S. importers' U.S. shipments by outer diameter size, 2020
Item U.S. producers
U.S. importers
Czechia Korea Russia Ukraine Subject sources
Subject sources
less Russia
Quantity (short tons) U.S. shipments.-- 2 inches or less *** *** *** *** *** *** ***
>2 inches and ≤4 inches *** *** *** *** *** *** *** >4 inches and ≤6 inches *** *** *** *** *** *** *** >6 inches and ≤8 inches *** *** *** *** *** *** *** >8 inches and ≤10 inches *** *** *** *** *** *** *** >10 inches and ≤12 inches *** *** *** *** *** *** *** >12 inches and ≤14 inches *** *** *** *** *** *** *** >14 inches and ≤16 inches *** *** *** *** *** *** ***
All sizes 144,054 *** *** *** *** *** *** Share across (percent)
U.S. shipments.-- 2 inches or less *** *** *** *** *** *** ***
>2 inches and ≤4 inches *** *** *** *** *** *** *** >4 inches and ≤6 inches *** *** *** *** *** *** *** >6 inches and ≤8 inches *** *** *** *** *** *** *** >8 inches and ≤10 inches *** *** *** *** *** *** *** >10 inches and ≤12 inches *** *** *** *** *** *** *** >12 inches and ≤14 inches *** *** *** *** *** *** *** >14 inches and ≤16 inches *** *** *** *** *** *** ***
All sizes *** *** *** *** *** *** *** Share down (percent)
U.S. shipments.-- 2 inches or less *** *** *** *** *** *** ***
>2 inches and ≤4 inches *** *** *** *** *** *** *** >4 inches and ≤6 inches *** *** *** *** *** *** *** >6 inches and ≤8 inches *** *** *** *** *** *** *** >8 inches and ≤10 inches *** *** *** *** *** *** *** >10 inches and ≤12 inches *** *** *** *** *** *** *** >12 inches and ≤14 inches *** *** *** *** *** *** *** >14 inches and ≤16 inches *** *** *** *** *** *** ***
All sizes 100.0 *** *** *** *** *** *** Table continued.

IV-13
Table IV-5--Continued SSLP pipe: U.S. producers' and U.S. importers' U.S. shipments by outer diameter size, 2020
Item
U.S. importers U.S.
producers and U.S.
importers Germany Mexico
All other
sources Nonsubject
sources
Nonsubject sources
plus Russia
All import
sources Quantity (short tons)
U.S. shipments.-- 2 inches or less *** *** *** *** *** *** ***
>2 inches and ≤4 inches *** *** *** *** *** *** *** >4 inches and ≤6 inches *** *** *** *** *** *** *** >6 inches and ≤8 inches *** *** *** *** *** *** *** >8 inches and ≤10 inches *** *** *** *** *** *** *** >10 inches and ≤12 inches *** *** *** *** *** *** *** >12 inches and ≤14 inches *** *** *** *** *** *** *** >14 inches and ≤16 inches *** *** *** *** *** *** ***
All sizes *** *** *** *** *** *** *** Share across (percent)
U.S. shipments.-- 2 inches or less *** *** *** *** *** *** ***
>2 inches and ≤4 inches *** *** *** *** *** *** *** >4 inches and ≤6 inches *** *** *** *** *** *** *** >6 inches and ≤8 inches *** *** *** *** *** *** *** >8 inches and ≤10 inches *** *** *** *** *** *** *** >10 inches and ≤12 inches *** *** *** *** *** *** *** >12 inches and ≤14 inches *** *** *** *** *** *** *** >14 inches and ≤16 inches *** *** *** *** *** *** ***
All sizes *** *** *** *** *** *** *** Share down (percent)
U.S. shipments.-- 2 inches or less *** *** *** *** *** *** ***
>2 inches and ≤4 inches *** *** *** *** *** *** *** >4 inches and ≤6 inches *** *** *** *** *** *** *** >6 inches and ≤8 inches *** *** *** *** *** *** *** >8 inches and ≤10 inches *** *** *** *** *** *** *** >10 inches and ≤12 inches *** *** *** *** *** *** *** >12 inches and ≤14 inches *** *** *** *** *** *** *** >14 inches and ≤16 inches *** *** *** *** *** *** ***
All sizes *** *** *** *** *** *** *** Note.--Shares and ratios shown as "0.0" represent values greater than zero, but less than "0.05" percent. Source: Compiled from data submitted in response to Commission questionnaires.

IV-14
Figure IV-3 SSLP pipe: U.S. producers' and U.S. importers' U.S. shipments by outer diameter size, 2020
* * * * * * * * Source: Compiled from data submitted in response to Commission questionnaires.
Geographical markets
SSLP pipe produced in the United States is shipped nationwide.9 Among imports, over 86 percent of U.S. imports of SSLP pipe from both subject and nonsubject sources entered through the Southern borders of entry of the United States, with the majority of imports from every country entering through this region (table IV-6). The Eastern borders of entry followed with 8.4 percent of U.S. imports of SSLP pipe from subject sources and 3.5 percent from nonsubject sources according to official U.S. import data in 2020. Among subject sources, imports from Korea were the majority of imports that entered the Northern U.S region in 2020, though 94.4 percent of imports to that region were from nonsubject sources. Russian imports of SSLP pipe exclusively entered through the Southern border of entry, contributing 4.3 percent of total imports through that border in 2020. During that time, subject imports from Korea that entered from the Western region accounted for 28.8 percent, the highest among subject sources, followed by Ukraine with 12.7 percent. In the Eastern region, 32.6 percent of U.S. imports of SSLP pipe was from Ukraine, followed by Korea and Czechia at roughly 8 percent
9 See Part II for additional information on geographic markets.

IV-15
each.10
Table IV-6 SSLP pipe: U.S. imports by border of entry, 2020
Item Border of entry
East North South West All borders Quantity (short tons)
U.S. imports from.-- Czechia 1,195 14 15,019 --- 16,227
Korea 1,223 412 20,556 3,236 25,428 Russia --- --- 12,645 --- 12,645 Ukraine 5,178 --- 29,550 1,429 36,157
Subject sources 7,595 426 77,770 4,665 90,457 Germany 3,773 509 32,443 457 37,183 Mexico 337 213 53,763 7 54,320 All other sources 4,176 6,518 131,745 6,092 148,530
Nonsubject sources 8,286 7,240 217,951 6,557 240,034 All import sources 15,881 7,666 295,721 11,222 330,490
Share across (percent) U.S. imports from.-- Czechia 7.4 0.1 92.6 --- 100.0
Korea 4.8 1.6 80.8 12.7 100.0 Russia --- --- 100.0 --- 100.0 Ukraine 14.3 --- 81.7 4.0 100.0
Subject sources 8.4 0.5 86.0 5.2 100.0 Germany 10.1 1.4 87.3 1.2 100.0 Mexico 0.6 0.4 99.0 0.0 100.0 All other sources 2.8 4.4 88.7 4.1 100.0
Nonsubject sources 3.5 3.0 90.8 2.7 100.0 All import sources 4.8 2.3 89.5 3.4 100.0
Table continued.
10 The “East” border of entry includes the following Customs entry districts for SSLP pipe: Baltimore, MD; Charleston, SC; Charlotte, NC; New York, NY; Norfolk, VA; Ogdensburg, NY; Philadelphia, PA; Savannah, GA; and St. Albans, VT. The “North” border of entry includes the following Customs entry districts for PC strand: Chicago, IL; Cleveland, OH; Detroit, MI; Great Falls, MT; Minneapolis, MN; and St. Louis, MO. The “South” border of entry includes the following Customs entry districts for PC strand: Dallas-Fort Worth, TX; Houston-Galveston, TX; Miami, FL; New Orleans, LA; and Tampa, FL. The “West” border of entry includes the following Customs entry districts for PC strand: Los Angeles, CA; San Francisco, CA; and Seattle, WA.
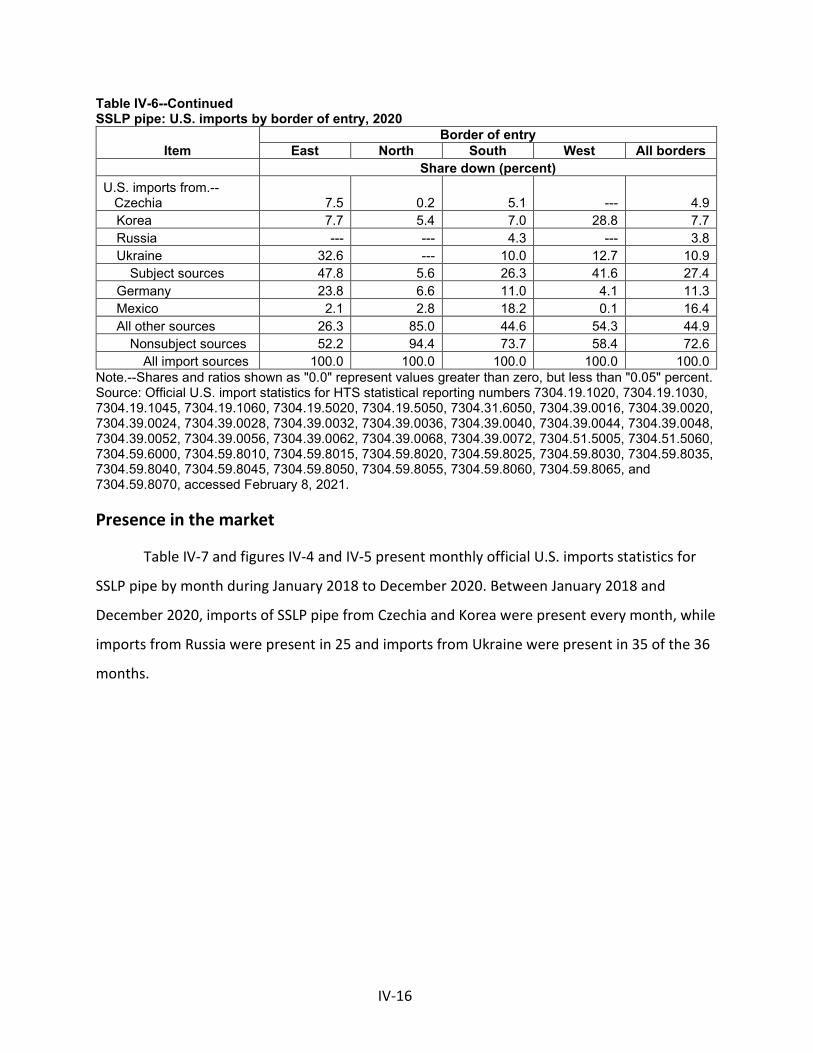
IV-16
Table IV-6--Continued SSLP pipe: U.S. imports by border of entry, 2020
Item Border of entry
East North South West All borders Share down (percent)
U.S. imports from.-- Czechia 7.5 0.2 5.1 --- 4.9
Korea 7.7 5.4 7.0 28.8 7.7 Russia --- --- 4.3 --- 3.8 Ukraine 32.6 --- 10.0 12.7 10.9
Subject sources 47.8 5.6 26.3 41.6 27.4 Germany 23.8 6.6 11.0 4.1 11.3 Mexico 2.1 2.8 18.2 0.1 16.4 All other sources 26.3 85.0 44.6 54.3 44.9
Nonsubject sources 52.2 94.4 73.7 58.4 72.6 All import sources 100.0 100.0 100.0 100.0 100.0
Note.--Shares and ratios shown as "0.0" represent values greater than zero, but less than "0.05" percent. Source: Official U.S. import statistics for HTS statistical reporting numbers 7304.19.1020, 7304.19.1030, 7304.19.1045, 7304.19.1060, 7304.19.5020, 7304.19.5050, 7304.31.6050, 7304.39.0016, 7304.39.0020, 7304.39.0024, 7304.39.0028, 7304.39.0032, 7304.39.0036, 7304.39.0040, 7304.39.0044, 7304.39.0048, 7304.39.0052, 7304.39.0056, 7304.39.0062, 7304.39.0068, 7304.39.0072, 7304.51.5005, 7304.51.5060, 7304.59.6000, 7304.59.8010, 7304.59.8015, 7304.59.8020, 7304.59.8025, 7304.59.8030, 7304.59.8035, 7304.59.8040, 7304.59.8045, 7304.59.8050, 7304.59.8055, 7304.59.8060, 7304.59.8065, and 7304.59.8070, accessed February 8, 2021.
Presence in the market
Table IV-7 and figures IV-4 and IV-5 present monthly official U.S. imports statistics for
SSLP pipe by month during January 2018 to December 2020. Between January 2018 and
December 2020, imports of SSLP pipe from Czechia and Korea were present every month, while
imports from Russia were present in 25 and imports from Ukraine were present in 35 of the 36
months.
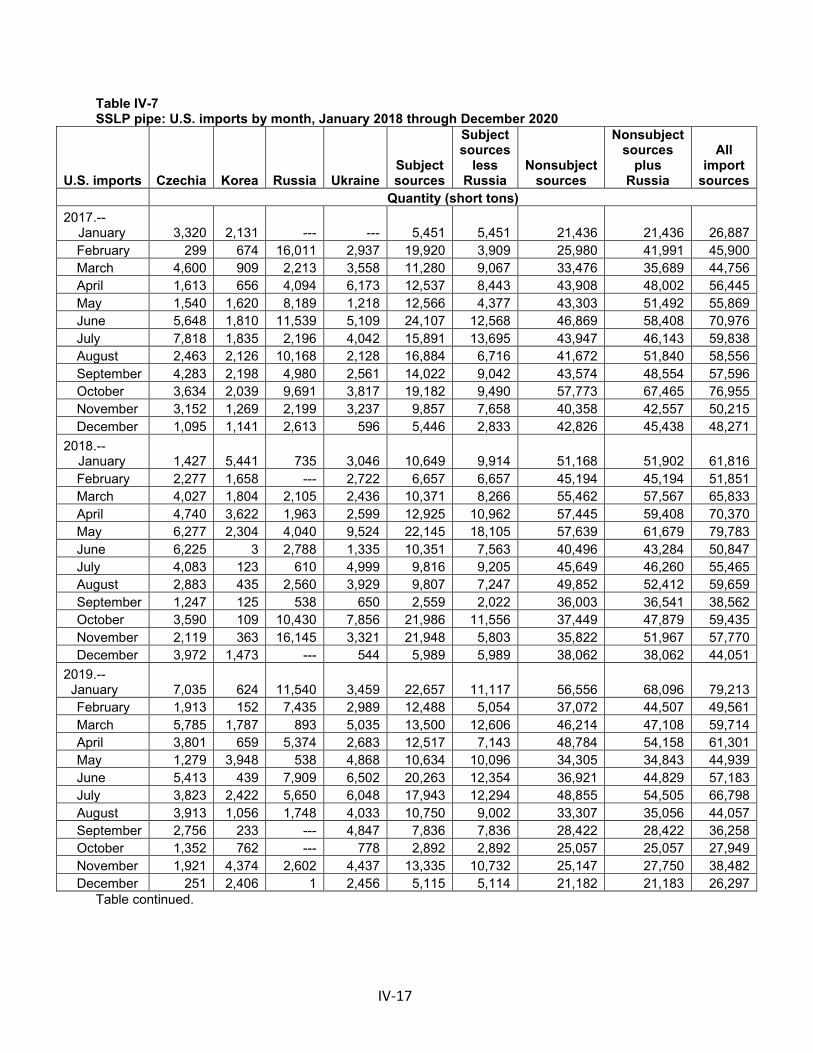
IV-17
Table IV-7 SSLP pipe: U.S. imports by month, January 2018 through December 2020
U.S. imports Czechia Korea Russia Ukraine Subject sources
Subject sources
less Russia
Nonsubject sources
Nonsubject sources
plus Russia
All import
sources Quantity (short tons)
2017.-- January 3,320 2,131 --- --- 5,451 5,451 21,436 21,436 26,887
February 299 674 16,011 2,937 19,920 3,909 25,980 41,991 45,900 March 4,600 909 2,213 3,558 11,280 9,067 33,476 35,689 44,756 April 1,613 656 4,094 6,173 12,537 8,443 43,908 48,002 56,445 May 1,540 1,620 8,189 1,218 12,566 4,377 43,303 51,492 55,869 June 5,648 1,810 11,539 5,109 24,107 12,568 46,869 58,408 70,976 July 7,818 1,835 2,196 4,042 15,891 13,695 43,947 46,143 59,838 August 2,463 2,126 10,168 2,128 16,884 6,716 41,672 51,840 58,556 September 4,283 2,198 4,980 2,561 14,022 9,042 43,574 48,554 57,596 October 3,634 2,039 9,691 3,817 19,182 9,490 57,773 67,465 76,955 November 3,152 1,269 2,199 3,237 9,857 7,658 40,358 42,557 50,215 December 1,095 1,141 2,613 596 5,446 2,833 42,826 45,438 48,271
2018.-- January 1,427 5,441 735 3,046 10,649 9,914 51,168 51,902 61,816
February 2,277 1,658 --- 2,722 6,657 6,657 45,194 45,194 51,851 March 4,027 1,804 2,105 2,436 10,371 8,266 55,462 57,567 65,833 April 4,740 3,622 1,963 2,599 12,925 10,962 57,445 59,408 70,370 May 6,277 2,304 4,040 9,524 22,145 18,105 57,639 61,679 79,783 June 6,225 3 2,788 1,335 10,351 7,563 40,496 43,284 50,847 July 4,083 123 610 4,999 9,816 9,205 45,649 46,260 55,465 August 2,883 435 2,560 3,929 9,807 7,247 49,852 52,412 59,659 September 1,247 125 538 650 2,559 2,022 36,003 36,541 38,562 October 3,590 109 10,430 7,856 21,986 11,556 37,449 47,879 59,435 November 2,119 363 16,145 3,321 21,948 5,803 35,822 51,967 57,770 December 3,972 1,473 --- 544 5,989 5,989 38,062 38,062 44,051
2019.-- January 7,035 624 11,540 3,459 22,657 11,117 56,556 68,096 79,213
February 1,913 152 7,435 2,989 12,488 5,054 37,072 44,507 49,561 March 5,785 1,787 893 5,035 13,500 12,606 46,214 47,108 59,714 April 3,801 659 5,374 2,683 12,517 7,143 48,784 54,158 61,301 May 1,279 3,948 538 4,868 10,634 10,096 34,305 34,843 44,939 June 5,413 439 7,909 6,502 20,263 12,354 36,921 44,829 57,183 July 3,823 2,422 5,650 6,048 17,943 12,294 48,855 54,505 66,798 August 3,913 1,056 1,748 4,033 10,750 9,002 33,307 35,056 44,057 September 2,756 233 --- 4,847 7,836 7,836 28,422 28,422 36,258 October 1,352 762 --- 778 2,892 2,892 25,057 25,057 27,949 November 1,921 4,374 2,602 4,437 13,335 10,732 25,147 27,750 38,482 December 251 2,406 1 2,456 5,115 5,114 21,182 21,183 26,297
Table continued.

IV-18
Table IV-7--Continued SSLP pipe: U.S. imports by month, January 2018 through December 2020
U.S. imports Czechia Korea Russia Ukraine Subject sources
Subject sources
less Russia
Nonsubject sources
Nonsubject sources
plus Russia
All import
sources Quantity (short tons)
2020.-- January 3,029 3,574 5,917 2,656 15,176 9,259 32,638 38,555 47,814
February 2,076 1,828 1 99 4,003 4,003 23,497 23,497 27,500 March 1,570 3,677 720 2,736 8,703 7,983 24,946 25,666 33,649 April 2,227 3,553 --- 573 6,352 6,352 19,344 19,344 25,696 May 1,914 1,126 3,815 4,831 11,686 7,871 30,802 34,616 42,487 June 1,197 917 2,192 6,643 10,948 8,756 18,968 21,159 29,916 July 2,554 3,728 --- 4,158 10,440 10,440 21,343 21,343 31,783 August 31 1,109 --- 3,663 4,803 4,803 11,902 11,902 16,704 September 672 13 --- 314 1,000 1,000 15,602 15,602 16,602 October 419 506 --- 2,512 3,437 3,437 19,105 19,105 22,542 November 266 834 --- 217 1,317 1,317 6,720 6,720 8,038 December 273 4,563 --- 7,755 12,592 12,592 15,168 15,168 27,759
Source: Official U.S. import statistics for HTS statistical reporting numbers 7304.19.1020, 7304.19.1030, 7304.19.1045, 7304.19.1060, 7304.19.5020, 7304.19.5050, 7304.31.6050, 7304.39.0016, 7304.39.0020, 7304.39.0024, 7304.39.0028, 7304.39.0032, 7304.39.0036, 7304.39.0040, 7304.39.0044, 7304.39.0048, 7304.39.0052, 7304.39.0056, 7304.39.0062, 7304.39.0068, 7304.39.0072, 7304.51.5005, 7304.51.5060, 7304.59.6000, 7304.59.8010, 7304.59.8015, 7304.59.8020, 7304.59.8025, 7304.59.8030, 7304.59.8035, 7304.59.8040, 7304.59.8045, 7304.59.8050, 7304.59.8055, 7304.59.8060, 7304.59.8065, and 7304.59.8070, accessed February 8, 2021.

IV-19
Figure IV-4 SSLP pipe: U.S. imports from individual subject sources, by month, January 2018 through December 2020
Source: Official U.S. import statistics for HTS statistical reporting numbers 7304.19.1020, 7304.19.1030, 7304.19.1045, 7304.19.1060, 7304.19.5020, 7304.19.5050, 7304.31.6050, 7304.39.0016, 7304.39.0020, 7304.39.0024, 7304.39.0028, 7304.39.0032, 7304.39.0036, 7304.39.0040, 7304.39.0044, 7304.39.0048, 7304.39.0052, 7304.39.0056, 7304.39.0062, 7304.39.0068, 7304.39.0072, 7304.51.5005, 7304.51.5060, 7304.59.6000, 7304.59.8010, 7304.59.8015, 7304.59.8020, 7304.59.8025, 7304.59.8030, 7304.59.8035, 7304.59.8040, 7304.59.8045, 7304.59.8050, 7304.59.8055, 7304.59.8060, 7304.59.8065, and 7304.59.8070, accessed February 8, 2021.
Figure IV-5 SSLP pipe: U.S. imports from aggregated subject and nonsubject sources, by month, January 2017 through December 2020
Source: Official U.S. import statistics for HTS statistical reporting numbers 7304.19.1020, 7304.19.1030, 7304.19.1045, 7304.19.1060, 7304.19.5020, 7304.19.5050, 7304.31.6050, 7304.39.0016, 7304.39.0020, 7304.39.0024, 7304.39.0028, 7304.39.0032, 7304.39.0036, 7304.39.0040, 7304.39.0044, 7304.39.0048, 7304.39.0052, 7304.39.0056, 7304.39.0062, 7304.39.0068, 7304.39.0072, 7304.51.5005, 7304.51.5060, 7304.59.6000, 7304.59.8010, 7304.59.8015, 7304.59.8020, 7304.59.8025, 7304.59.8030, 7304.59.8035, 7304.59.8040, 7304.59.8045, 7304.59.8050, 7304.59.8055, 7304.59.8060, 7304.59.8065, and 7304.59.8070, accessed February 8, 2021.
02468
1012141618
Jan
Feb
Mar Ap
rM
ay Jun
Jul
Aug
Sep
Oct
Nov
Dec Jan
Feb
Mar Ap
rM
ay Jun
Jul
Aug
Sep
Oct
Nov
Dec Jan
Feb
Mar Ap
rM
ay Jun
Jul
Aug
Sep
Oct
Nov
Dec Jan
Feb
Mar Ap
rM
ay Jun
Jul
Aug
Sep
Oct
Nov
Dec
2017 2018 2019 2020
Qua
ntity
(1,0
00 s
hort
tons
)
Czechia Korea Russia Ukraine
01020304050607080
Jan
Feb
Mar Ap
rM
ay Jun
Jul
Aug
Sep
Oct
Nov
Dec Jan
Feb
Mar Ap
rM
ay Jun
Jul
Aug
Sep
Oct
Nov
Dec Jan
Feb
Mar Ap
rM
ay Jun
Jul
Aug
Sep
Oct
Nov
Dec Jan
Feb
Mar Ap
rM
ay Jun
Jul
Aug
Sep
Oct
Nov
Dec
2017 2018 2019 2020
Qua
ntity
(1,0
00 s
hort
tons
)
Subject sources Subject sources less RussiaNonsubject sources Nonsubject sources plus Russia

IV-20
Apparent U.S. consumption
Table IV-8 and figure IV-6 present data on apparent U.S. consumption of SSLP pipe based on responses from U.S. producers and official import statistics reported during 2018-20. Since 2018, apparent U.S. consumption of SSLP pipe decreased by *** percent to ***short tons in 2020. The volume of U.S. producers’ U.S. shipments decreased by 64.0 percent, from 399,784 short tons in 2018 to 144,054 short tons in 2020. At the same time, U.S. imports of SSLP pipe from subject sources decreased by ***percent to *** short tons in 2020 and U.S. imports from nonsubject sources decreased by 55.6 percent to 231,467 short tons in 2020. Still, between 2018 and 2019, total subject imports increased slightly by *** percent even as apparent consumption and U.S. producers’ shipments declined. Among subject sources, only the volume of U.S. imports from Korea increased during the entire period, 2018 to 2020, and added *** short tons by 2020.
During 2018-20, the value of apparent U.S. consumption also decreased by *** percent to *** million in 2020. The value of U.S. producers’ U.S. shipments decreased by 68.6 percent to $210.8 million in 2020. Similarly, the value of U.S. imports of SSLP pipe from subject countries decreased by *** percent to *** million in 2020 and the value of U.S. imports from nonsubject sources decreased by 53.3 percent to $395.5 million in 2020.

IV-21
Table IV-8 SSLP pipe: Apparent U.S. consumption, 2018-20
Item Calendar year
2018 2019 2020 Quantity (short tons) U.S. producers' U.S. shipments 399,784 233,989 144,054 U.S. imports from.-- Czechia 42,867 39,243 16,227
Korea 17,460 18,863 25,428 Russia *** *** *** Ukraine 42,962 48,134 36,157
Subject sources *** *** *** Subject sources less Russia 103,289 106,239 77,812
Germany *** *** *** Mexico *** *** *** All other sources *** *** ***
Nonsubject sources 520,979 427,316 231,467 Nonsubject sources plus Russia *** *** ***
All import sources *** *** *** Apparent U.S. consumption *** *** *** Value (1,000 dollars) U.S. producers' U.S. shipments 670,698 387,406 210,799 U.S. imports from.-- Czechia 50,401 48,637 17,819
Korea 22,061 25,480 27,619 Russia *** *** *** Ukraine 45,613 50,690 31,871
Subject sources *** *** *** Subject sources less Russia 118,075 124,808 77,309
Germany *** *** *** Mexico *** *** *** All other sources *** *** ***
Nonsubject sources 846,673 736,843 395,465 Nonsubject sources plus Russia *** *** ***
All import sources *** *** *** Apparent U.S. consumption *** *** ***
Source: Compiled from data submitted in response to Commission questionnaires and official U.S. import statistics for HTS statistical reporting numbers 7304.19.1020, 7304.19.1030, 7304.19.1045, 7304.19.1060, 7304.19.5020, 7304.19.5050, 7304.31.6050, 7304.39.0016, 7304.39.0020, 7304.39.0024, 7304.39.0028, 7304.39.0032, 7304.39.0036, 7304.39.0040, 7304.39.0044, 7304.39.0048, 7304.39.0052, 7304.39.0056, 7304.39.0062, 7304.39.0068, 7304.39.0072, 7304.51.5005, 7304.51.5060, 7304.59.6000, 7304.59.8010, 7304.59.8015, 7304.59.8020, 7304.59.8025, 7304.59.8030, 7304.59.8035, 7304.59.8040, 7304.59.8045, 7304.59.8050, 7304.59.8055, 7304.59.8060, 7304.59.8065, and 7304.59.8070, accessed February 8, 2021.

IV-22
Figure IV-6 SSLP pipe: Apparent U.S. consumption, 2018-20
* * * * * * * * Source: Compiled from data submitted in response to Commission questionnaires and official U.S. import statistics for HTS statistical reporting numbers 7304.19.1020, 7304.19.1030, 7304.19.1045, 7304.19.1060, 7304.19.5020, 7304.19.5050, 7304.31.6050, 7304.39.0016, 7304.39.0020, 7304.39.0024, 7304.39.0028, 7304.39.0032, 7304.39.0036, 7304.39.0040, 7304.39.0044, 7304.39.0048, 7304.39.0052, 7304.39.0056, 7304.39.0062, 7304.39.0068, 7304.39.0072, 7304.51.5005, 7304.51.5060, 7304.59.6000, 7304.59.8010, 7304.59.8015, 7304.59.8020, 7304.59.8025, 7304.59.8030, 7304.59.8035, 7304.59.8040, 7304.59.8045, 7304.59.8050, 7304.59.8055, 7304.59.8060, 7304.59.8065, and 7304.59.8070, accessed February 8, 2021.
U.S. market shares
U.S. market share data for SSLP pipe are presented in table IV-9 over the period 2018-20. In quantity terms, U.S. producers’ share of apparent U.S. consumption decreased by *** percentage points to *** percent in 2020. Meanwhile, U.S. imports of SSLP from subject sources increased by *** percentage points to *** percent of apparent U.S. consumption by quantity in 2020. U.S. imports of SSLP pipe from nonsubject sources increased slightly from *** percent of apparent U.S. consumption in quantity terms in 2018 to *** percent 2020, with a period high of *** percent in 2019. Among subject sources, Korea and Ukraine each experienced a *** percentage point increase in shares of apparent U.S. consumption during 2018-20, while market shares of U.S. imports from Czechia and Russia ***. Among nonsubject sources, the market share of U.S. imports from Germany and Mexico in quantity terms increased by *** and *** percentage points, respectively, during 2018-20, while the market share of U.S. imports from all other nonsubject sources decreased by *** percentage points.

IV-23
During 2018-20, U.S. producers’ share of U.S. apparent consumption by value decreased from *** percent in 2018 to *** percent in 2020. Over the same period, the market share of U.S. imports of SSLP pipe from subject sources by value increased by *** percentage points to *** percent in 2020, driven by relative increases in imports from Korea and Ukraine. The market share of U.S. imports from nonsubject sources increased by more, gaining *** percentage points from *** percent in 2018 to *** percent in 2020, ***.

IV-24
Table IV-9 SSLP pipe: Market shares, 2018-20
Item Calendar year
2018 2019 2020 Quantity (short tons) Apparent U.S. consumption *** *** *** Share of quantity (percent) U.S. producers' U.S. shipments *** *** *** U.S. imports from.-- Czechia *** *** ***
Korea *** *** *** Russia *** *** *** Ukraine *** *** ***
Subject sources *** *** *** Subject sources less Russia *** *** ***
Germany *** *** *** Mexico *** *** *** All other sources *** *** ***
Nonsubject sources *** *** *** Nonsubject sources plus Russia *** *** ***
All import sources *** *** *** Value (1,000 dollars) Apparent U.S. consumption *** *** *** Share of value (percent) U.S. producers' U.S. shipments *** *** *** U.S. imports from.-- Czechia *** *** ***
Korea *** *** *** Russia *** *** *** Ukraine *** *** ***
Subject sources *** *** *** Subject sources less Russia *** *** ***
Germany *** *** *** Mexico *** *** *** All other sources *** *** ***
Nonsubject sources *** *** *** Nonsubject sources plus Russia *** *** ***
All import sources *** *** *** Source: Compiled from data submitted in response to Commission questionnaires and official U.S. import statistics for HTS statistical reporting numbers 7304.19.1020, 7304.19.1030, 7304.19.1045, 7304.19.1060, 7304.19.5020, 7304.19.5050, 7304.31.6050, 7304.39.0016, 7304.39.0020, 7304.39.0024, 7304.39.0028, 7304.39.0032, 7304.39.0036, 7304.39.0040, 7304.39.0044, 7304.39.0048, 7304.39.0052, 7304.39.0056, 7304.39.0062, 7304.39.0068, 7304.39.0072, 7304.51.5005, 7304.51.5060, 7304.59.6000, 7304.59.8010, 7304.59.8015, 7304.59.8020, 7304.59.8025, 7304.59.8030, 7304.59.8035, 7304.59.8040, 7304.59.8045, 7304.59.8050, 7304.59.8055, 7304.59.8060, 7304.59.8065, and 7304.59.8070, accessed February 8, 2021.

V-1
Part V: Pricing data
Factors affecting prices
Raw material costs
The primary raw material used to manufacture SSLP pipe is solid steel billets. Petitioner Vallourec stated that it uses scrap metal bought from regional shredders and alloys/additives in its production process.1 Raw materials, as a share of cost of goods sold (“COGS”), decreased during 2018-20, from *** percent in 2018 to decreasing to *** percent in 2020. Petitioner Vallourec stated that scrap accounts for *** of its raw material costs. It also stated that multiple factors can affect scrap prices, including demand in the region and local dynamics like weather and automotive activity.2 The prices of steel scrap and pig iron increased irregularly from January 2018 to April 2018, and then generally decreased through April 2020 with some fluctuations before increasing substantially through January 2021 (figure V-1). Overall, scrap steel and pig iron prices increased by *** percent and *** percent, respectively, from January 2018 to January 2021.
1 Petitioner Vallourec’s postconference brief, Answers to staff questions, p. 5. 2 Petitioner Vallourec’s postconference brief, Answers to staff questions, p. 5.

V-2
Figure V-1 Raw Materials: Prices of scrap steel and pig iron, monthly, January 2018-January 2021
* * * * * * *
Electricity and natural gas are also considerable costs in the production of SSLP pipe. Petitioner Vallourec stated that electricity costs are mostly incurred during the melting process and equal about *** percent of its COGS.3 Industrial natural gas prices generally declined from January to August 2018, increased sharply to peak in December 2018, then declined through July 2020, and increased through the remainder of the year (figure V-2). Industrial electricity prices fluctuated during 2018-20. Overall, natural gas and electricity prices declined by 9 percent and 8 percent, respectively, between January 2018 and December 2020.
3 Petitioner Vallourec’s postconference brief, Answers to staff questions, p. 5.

V-3
Figure V-2 Energy prices: Industrial sector natural gas and electricity prices, monthly, January 2018 to December 2020
Source: U.S. Energy Information Administration, https://www.eia.gov/outlooks/steo/data/browser/#/?v=8&f=M&s=&start=201701&end=202112&id=&maptype=0&ctype=linechart&linechart=WTIPUUS, accessed July 20, 2020.
Most U.S. producers (3 of 5) and importers (11 of 14) reported that raw material costs fluctuated since January 1, 2018. U.S. producer *** reported that the scrap market is very volatile. Importer *** reported that scrap and ore prices fluctuated, and importer *** reported that the cost of scrap, ferroalloys, and electrodes had significant fluctuations. Importer *** stated that scrap is affected by overall steel demand, recycling abilities, etc., and iron ore prices are affected by overall steel demand, and inclement weather that limits mining activities as well as transportation systems. Most responding purchasers (11 of 16) are not familiar with raw materials costs and 9 of 11 reported that raw material costs do not affect their contracts.
When asked whether the section 232 measures influenced raw material costs, responses were mixed, with half of responding U.S. producers (2 of 4) and most importers (7 of 13) reporting that raw material costs fluctuated.4 When asked whether the section 232 measures had an impact on prices of SSLP pipe, one U.S. producer and five importers reported
4 One U.S. producer and four importers reported that raw material costs had increased as a result of the section 232 measures. One U.S. producer and two importers reported that raw material costs had remained constant.

V-4
an increase and three U.S. producers and five importers reported prices fluctuated. U.S. producer *** stated that the scrap market is mostly domestic and not influenced much by the section 232 measures, and that initially the section 232 measures led to an increase in prices; however the market could not fully absorb the measures and that there is strong price pressure from imported pipe manufacturers. U.S. producer/importer *** reported that it saw a steep increase in the market price as a result of the section 232 measures but in 2019 prices fell though remained slightly higher than before the section 232 measures were put in place. Importer *** reported that prices went up to cover the new tariff. Importer *** reported that domestic mills, distributors, and importers increased prices upon implementation of the measures under section 232 and that the increase led to a “material economic impact” on the end users of SSLP products. U.S. producer/importer *** reported that prices initially reacted favorably to section 232 measures but since then have declined as a result of the market downturn and unfair competition. Respondent Interpipe stated that the section 232 measures were important as they “lifted the bar” on SSLP prices and that it lost some business because not everyone would “pay up because the 25 percent needed to be absorbed.”5
Twelve of 16 purchasers reported that the section 232 measures had an impact on the SSLP pipe market; four did not know. Eight purchasers indicated that prices for SSLP pipe increased overall, three reported prices decreased overall, and two reported prices fluctuated as a result of the section 232 measures. Purchaser *** reported that initially, prices went up but when oil prices fell and COVID-19 hit, prices fell. Purchaser *** reported that the section 232 measures allowed domestic suppliers to raise prices initially as much as 25 percent to follow import SSLP pipe prices, but the initial gains were lost in 2020. Purchaser *** reported that prices briefly increased but demand ultimately caused pricing to be less than before the section 232 measures were implemented. Purchaser *** estimated a 22 percent price increase.
Transportation costs to the U.S. market
Transportation costs for SSLP pipe shipped from subject countries to the United States averaged 7.8 percent for Czechia, 5.9 percent for Korea, 8.2 percent for Russia, and 0.2 percent
5 Conference transcript, p. 94 (Valk).

V-5
for Ukraine during 2020. These estimates were derived from official import data and represent the transportation and other charges on imports.6
U.S. inland transportation costs
Four of five responding U.S. producers and some importers (6 of 16) reported that they typically arrange transportation to their customers. All four responding U.S. producers reported that their U.S. inland transportation costs ranged from 2 to 10 percent while five importers reported that costs ranged from less than one percent to 2 percent.
Pricing practices
Pricing methods
U.S. producers and importers reported a variety of price setting methods. The majority of responding U.S. producers and importers reported using transaction-by-transaction negotiations (table V-1).
Table V-1 SSLP pipe: U.S. producers’ and importers’ reported price setting methods, by number of responding firms
Method U.S. producers Importers Transaction-by-transaction 4 13 Contract 1 2 Set price list 2 1 Other 1 2 Responding firms 5 15
Note: The sum of responses down may not add up to the total number of responding firms as each firm was instructed to check all applicable price setting methods employed. Source: Compiled from data submitted in response to Commission questionnaires.
U.S. producers and importers reported selling the vast majority of their SSLP pipe in the spot market (table V-2).
6 The estimated transportation costs were obtained by subtracting the customs value from the c.i.f. value of the imports for 2019 and then dividing by the customs value based on the HTS subheading 7304.19.1020, 7304.19.1030, 7304.19.1045, 7304.19.1060, 7304.19.5020, 7304.19.5050, 7304.31.6050, 7304.39.0016, 7304.39.0020, 7304.39.0024, 7304.39.0028, 7304.39.0032, 7304.39.0036, 7304.39.0040, 7304.39.0044, 7304.39.0048, 7304.39.0052, 7304.39.0056, 7304.39.0062, 7304.39.0068, 7304.39.0072, 7304.51.5005, 7304.51.5060, 7304.59.6000, 7304.59.8010, 7304.59.8015, 7304.59.8020, 7304.59.8025, 7304.59.8030, 7304.59.8035, 7304.59.8040, 7304.59.8045, 7304.59.8050, 7304.59.8055, 7304.59.8060, 7304.59.8065, and 7304.59.8070, accessed February 8, 2021.
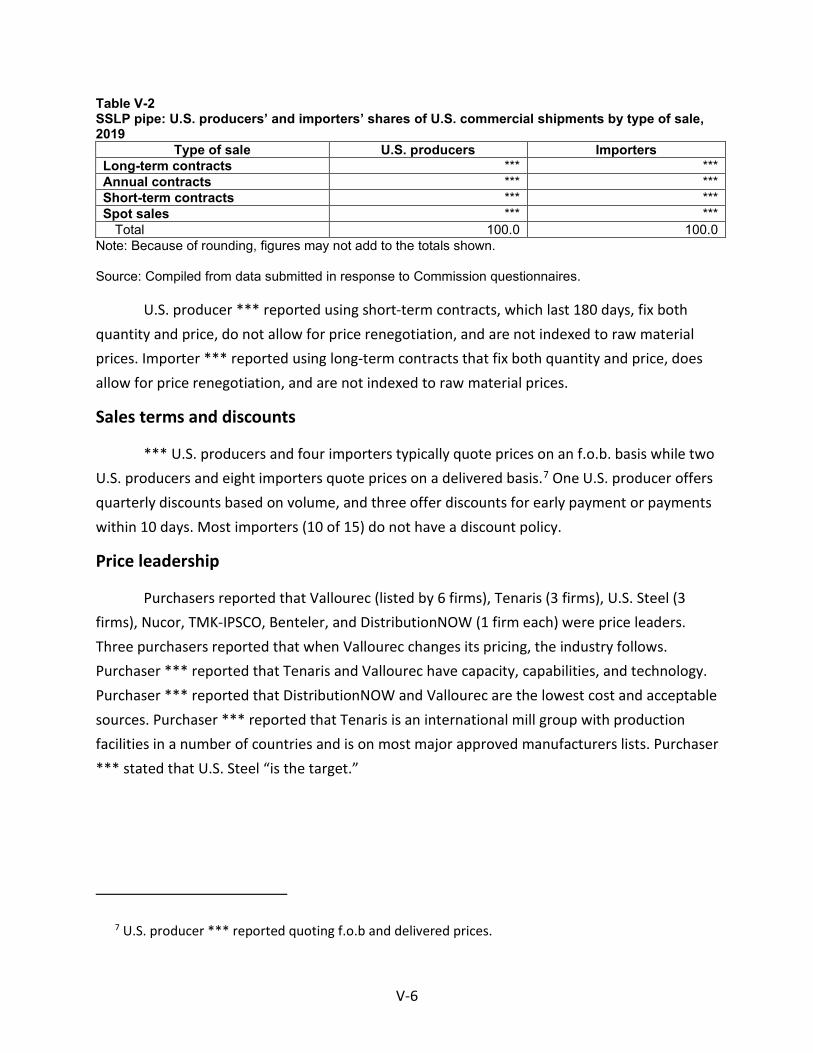
V-6
Table V-2 SSLP pipe: U.S. producers’ and importers’ shares of U.S. commercial shipments by type of sale, 2019
Type of sale U.S. producers Importers Long-term contracts *** *** Annual contracts *** *** Short-term contracts *** *** Spot sales *** ***
Total 100.0 100.0 Note: Because of rounding, figures may not add to the totals shown. Source: Compiled from data submitted in response to Commission questionnaires.
U.S. producer *** reported using short-term contracts, which last 180 days, fix both quantity and price, do not allow for price renegotiation, and are not indexed to raw material prices. Importer *** reported using long-term contracts that fix both quantity and price, does allow for price renegotiation, and are not indexed to raw material prices.
Sales terms and discounts
*** U.S. producers and four importers typically quote prices on an f.o.b. basis while two U.S. producers and eight importers quote prices on a delivered basis.7 One U.S. producer offers quarterly discounts based on volume, and three offer discounts for early payment or payments within 10 days. Most importers (10 of 15) do not have a discount policy.
Price leadership
Purchasers reported that Vallourec (listed by 6 firms), Tenaris (3 firms), U.S. Steel (3 firms), Nucor, TMK-IPSCO, Benteler, and DistributionNOW (1 firm each) were price leaders. Three purchasers reported that when Vallourec changes its pricing, the industry follows. Purchaser *** reported that Tenaris and Vallourec have capacity, capabilities, and technology. Purchaser *** reported that DistributionNOW and Vallourec are the lowest cost and acceptable sources. Purchaser *** reported that Tenaris is an international mill group with production facilities in a number of countries and is on most major approved manufacturers lists. Purchaser *** stated that U.S. Steel “is the target.”
7 U.S. producer *** reported quoting f.o.b and delivered prices.

V-7
Price data
The Commission requested U.S. producers and importers to provide quarterly data for the total quantity and f.o.b. value of the following SSLP pipe products shipped to unrelated U.S. customers during January 2018-December 2020.
Product 1.-- Seamless pipe stenciled to meet one or more of the following specifications: ASTM A-106 grade B, ASTM A-53 grade B, API 5L grade B, and API 5L grade X-42 specifications; 3” nominal size (3 1/2 inch OD x 0.3 wall thickness); plain ends.
Product 2.-- Seamless pipe stenciled to meet one or more of the following
specifications: ASTM A-106 grade B, ASTM A-53 grade B, API 5L grade B, and API 5L grade X-42 specifications; 4” nominal size (4 1/2 inch OD x 0.237 wall thickness); plain ends.
Product 3.-- Seamless pipe stenciled to meet one or more of the following
specifications: ASTM A-106 grade B, ASTM A-53 grade B, API 5L grade B, and API 5L grade X-42 specifications; 6” nominal size (6 5/8 inch OD x 0.280 wall thickness); plain ends.
Product 4.-- Seamless pipe stenciled to meet one or more of the following
specifications: ASTM A-106 grade B, ASTM A-53 grade B, API 5L grade B, and API 5L grade X-42 specifications; 8” nominal size (8 5/8 inch OD x 0.322 wall thickness); plain ends.
Product 5.-- Seamless pipe stenciled to meet one or more of the following
specifications: ASTM A-106 grade B, ASTM A-53 grade B, API 5L grade B, and API 5L grade X-42 specifications; 12” nominal size (12 3/4 inch OD x 0.375 wall thickness); plain ends.
Product 6.-- Seamless pipe stenciled to meet one or more of the following
specifications: ASTM A-106 grade B, ASTM A-53 grade B, API 5L grade B, and API 5L grade X-42 specifications; 16” nominal size (16 inch OD x 0.375 wall thickness); plain ends.

V-8
Four U.S. producers and eight importers provided usable pricing data for sales of the requested products, although not all firms reported pricing for all products for all quarters.8 Pricing data reported by these firms accounted for approximately *** percent of U.S. producers’ shipments of SSLP pipe and *** percent of U.S. shipments of subject imports from Czechia, *** percent of U.S. shipments of subject imports from Korea, *** percent of U.S. shipments of subject imports from Russia, and *** percent of U.S. shipments of subject imports from Ukraine in 2020.9 10 11
Price data for products 1-6 are presented in tables V-3 to V-8 and figures V-3 to V-8. Nonsubject country prices are presented in Appendix E.
8 Per-unit pricing data are calculated from total quantity and total value data provided by U.S. producers and importers. The precision and variation of these figures may be affected by rounding, limited quantities, and producer or importer estimates.
9 Pricing coverage is based on U.S. shipments reported in questionnaires. 10 No pricing data was reported for products 5 and 6 imported from Czechia; products 4, 5, and 6
from Korea; and products 1 and 2 from Russia. 11 ***.

V-9
Table V-3 SSLP pipe: Weighted-average f.o.b. prices and quantities of domestic and imported product 1 and margins of underselling/(overselling), by quarter, January 2018-December 2020
Period
United States Czechia Korea Price
(dollars per short
ton)
Quantity (short tons)
Price (dollars
per short ton)
Quantity (short tons)
Margin (percent)
Price (dollars
per short ton)
Quantity (short tons)
Margin (percent)
2018: Jan.-Mar. *** *** *** *** *** *** *** *** Apr.-June *** *** *** *** *** *** *** *** July-Sept. *** *** *** *** *** *** *** *** Oct.-Dec. *** *** *** *** *** *** *** *** 2019: Jan.-Mar. *** *** *** *** *** *** *** *** Apr.-June *** *** *** *** *** *** *** *** July-Sept. *** *** *** *** *** *** *** *** Oct.-Dec. *** *** *** *** *** *** *** *** 2020: Jan.-Mar. *** *** *** *** *** *** *** *** Apr.-June *** *** *** *** *** *** *** *** July-Sept. *** *** *** *** *** *** *** *** Oct.-Dec. *** *** *** *** *** *** *** ***
Period
United States Russia Ukraine Price
(dollars per short
ton)
Quantity (short tons)
Price (dollars
per short ton)
Quantity (short tons)
Margin (percent)
Price (dollars
per short ton)
Quantity (short tons)
Margin (percent)
2018: Jan.-Mar. *** *** *** *** *** *** *** *** Apr.-June *** *** *** *** *** *** *** *** July-Sept. *** *** *** *** *** *** *** *** Oct.-Dec. *** *** *** *** *** *** *** *** 2019: Jan.-Mar. *** *** *** *** *** *** *** *** Apr.-June *** *** *** *** *** *** *** *** July-Sept. *** *** *** *** *** *** *** *** Oct.-Dec. *** *** *** *** *** *** *** *** 2020: Jan.-Mar. *** *** *** *** *** *** *** *** Apr.-June *** *** *** *** *** *** *** *** July-Sept. *** *** *** *** *** *** *** *** Oct.-Dec. *** *** *** *** *** *** *** ***
Note: Product 1: Seamless pipe stenciled to meet one or more of the following specifications: ASTM A-106 grade B, ASTM A-53 grade B, API 5L grade B, and API 5L grade X-42 specifications; 3” nominal size (3 1/2 inch OD x 0.3 wall thickness); plain ends. Source: Compiled from data submitted in response to Commission questionnaires.

V-10
Table V-4 SSLP pipe: Weighted-average f.o.b. prices and quantities of domestic and imported product 2 and margins of underselling/(overselling), by quarter, January 2018-December 2020
Period
United States Czechia Korea Price
(dollars per short
ton)
Quantity (short tons)
Price (dollars
per short ton)
Quantity (short tons)
Margin (percent)
Price (dollars
per short ton)
Quantity (short tons)
Margin (percent)
2018: Jan.-Mar. *** *** *** *** *** *** *** *** Apr.-June *** *** *** *** *** *** *** *** July-Sept. *** *** *** *** *** *** *** *** Oct.-Dec. *** *** *** *** *** *** *** *** 2019: Jan.-Mar. *** *** *** *** *** *** *** *** Apr.-June *** *** *** *** *** *** *** *** July-Sept. *** *** *** *** *** *** *** *** Oct.-Dec. *** *** *** *** *** *** *** *** 2020: Jan.-Mar. *** *** *** *** *** *** *** *** Apr.-June *** *** *** *** *** *** *** *** July-Sept. *** *** *** *** *** *** *** *** Oct.-Dec. *** *** *** *** *** *** *** ***
Period
United States Russia Ukraine Price
(dollars per short
ton)
Quantity (short tons)
Price (dollars
per short ton)
Quantity (short tons)
Margin (percent)
Price (dollars
per short ton)
Quantity (short tons)
Margin (percent)
2018: Jan.-Mar. *** *** *** *** *** *** *** *** Apr.-June *** *** *** *** *** *** *** *** July-Sept. *** *** *** *** *** *** *** *** Oct.-Dec. *** *** *** *** *** *** *** *** 2019: Jan.-Mar. *** *** *** *** *** *** *** *** Apr.-June *** *** *** *** *** *** *** *** July-Sept. *** *** *** *** *** *** *** *** Oct.-Dec. *** *** *** *** *** *** *** *** 2020: Jan.-Mar. *** *** *** *** *** *** *** *** Apr.-June *** *** *** *** *** *** *** *** July-Sept. *** *** *** *** *** *** *** *** Oct.-Dec. *** *** *** *** *** *** *** ***
Note: Product 2: Seamless pipe stenciled to meet one or more of the following specifications: ASTM A-106 grade B, ASTM A-53 grade B, API 5L grade B, and API 5L grade X-42 specifications; 4” nominal size (4 1/2 inch OD x 0.237 wall thickness); plain ends. Source: Compiled from data submitted in response to Commission questionnaires.
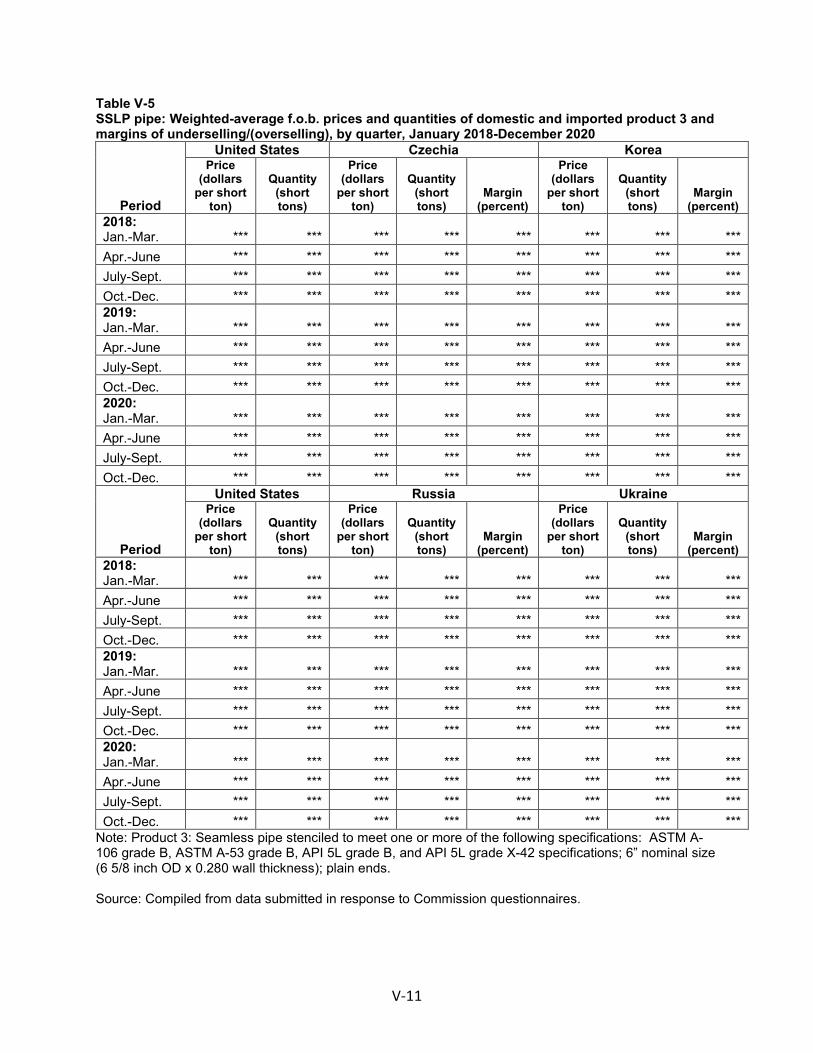
V-11
Table V-5 SSLP pipe: Weighted-average f.o.b. prices and quantities of domestic and imported product 3 and margins of underselling/(overselling), by quarter, January 2018-December 2020
Period
United States Czechia Korea Price
(dollars per short
ton)
Quantity (short tons)
Price (dollars
per short ton)
Quantity (short tons)
Margin (percent)
Price (dollars
per short ton)
Quantity (short tons)
Margin (percent)
2018: Jan.-Mar. *** *** *** *** *** *** *** *** Apr.-June *** *** *** *** *** *** *** *** July-Sept. *** *** *** *** *** *** *** *** Oct.-Dec. *** *** *** *** *** *** *** *** 2019: Jan.-Mar. *** *** *** *** *** *** *** *** Apr.-June *** *** *** *** *** *** *** *** July-Sept. *** *** *** *** *** *** *** *** Oct.-Dec. *** *** *** *** *** *** *** *** 2020: Jan.-Mar. *** *** *** *** *** *** *** *** Apr.-June *** *** *** *** *** *** *** *** July-Sept. *** *** *** *** *** *** *** *** Oct.-Dec. *** *** *** *** *** *** *** ***
Period
United States Russia Ukraine Price
(dollars per short
ton)
Quantity (short tons)
Price (dollars
per short ton)
Quantity (short tons)
Margin (percent)
Price (dollars
per short ton)
Quantity (short tons)
Margin (percent)
2018: Jan.-Mar. *** *** *** *** *** *** *** *** Apr.-June *** *** *** *** *** *** *** *** July-Sept. *** *** *** *** *** *** *** *** Oct.-Dec. *** *** *** *** *** *** *** *** 2019: Jan.-Mar. *** *** *** *** *** *** *** *** Apr.-June *** *** *** *** *** *** *** *** July-Sept. *** *** *** *** *** *** *** *** Oct.-Dec. *** *** *** *** *** *** *** *** 2020: Jan.-Mar. *** *** *** *** *** *** *** *** Apr.-June *** *** *** *** *** *** *** *** July-Sept. *** *** *** *** *** *** *** *** Oct.-Dec. *** *** *** *** *** *** *** ***
Note: Product 3: Seamless pipe stenciled to meet one or more of the following specifications: ASTM A-106 grade B, ASTM A-53 grade B, API 5L grade B, and API 5L grade X-42 specifications; 6” nominal size (6 5/8 inch OD x 0.280 wall thickness); plain ends. Source: Compiled from data submitted in response to Commission questionnaires.

V-12
Table V-6 SSLP pipe: Weighted-average f.o.b. prices and quantities of domestic and imported product 4 and margins of underselling/(overselling), by quarter, January 2018-December 2020
Period
United States Czechia Korea Price
(dollars per short
ton)
Quantity (short tons)
Price (dollars
per short ton)
Quantity (short tons)
Margin (percent)
Price (dollars
per short ton)
Quantity (short tons)
Margin (percent)
2018: Jan.-Mar. *** *** *** *** *** *** *** *** Apr.-June *** *** *** *** *** *** *** *** July-Sept. *** *** *** *** *** *** *** *** Oct.-Dec. *** *** *** *** *** *** *** *** 2019: Jan.-Mar. *** *** *** *** *** *** *** *** Apr.-June *** *** *** *** *** *** *** *** July-Sept. *** *** *** *** *** *** *** *** Oct.-Dec. *** *** *** *** *** *** *** *** 2020: Jan.-Mar. *** *** *** *** *** *** *** *** Apr.-June *** *** *** *** *** *** *** *** July-Sept. *** *** *** *** *** *** *** *** Oct.-Dec. *** *** *** *** *** *** *** ***
Period
United States Russia Ukraine Price
(dollars per short
ton)
Quantity (short tons)
Price (dollars
per short ton)
Quantity (short tons)
Margin (percent)
Price (dollars
per short ton)
Quantity (short tons)
Margin (percent)
2018: Jan.-Mar. *** *** *** *** *** *** *** *** Apr.-June *** *** *** *** *** *** *** *** July-Sept. *** *** *** *** *** *** *** *** Oct.-Dec. *** *** *** *** *** *** *** *** 2019: Jan.-Mar. *** *** *** *** *** *** *** *** Apr.-June *** *** *** *** *** *** *** *** July-Sept. *** *** *** *** *** *** *** *** Oct.-Dec. *** *** *** *** *** *** *** *** 2020: Jan.-Mar. *** *** *** *** *** *** *** *** Apr.-June *** *** *** *** *** *** *** *** July-Sept. *** *** *** *** *** *** *** *** Oct.-Dec. *** *** *** *** *** *** *** ***
Note: Product 4: Seamless pipe stenciled to meet one or more of the following specifications: ASTM A-106 grade B, ASTM A-53 grade B, API 5L grade B, and API 5L grade X-42 specifications; 8” nominal size (8 5/8 inch OD x 0.322 wall thickness); plain ends. Source: Compiled from data submitted in response to Commission questionnaires.

V-13
Table V-7 SSLP pipe: Weighted-average f.o.b. prices and quantities of domestic and imported product 5 and margins of underselling/(overselling), by quarter, January 2018-December 2020
Period
United States Czechia Korea Price
(dollars per short
ton)
Quantity (short tons)
Price (dollars
per short ton)
Quantity (short tons)
Margin (percent)
Price (dollars
per short ton)
Quantity (short tons)
Margin (percent)
2018: Jan.-Mar. *** *** *** *** *** *** *** *** Apr.-June *** *** *** *** *** *** *** *** July-Sept. *** *** *** *** *** *** *** *** Oct.-Dec. *** *** *** *** *** *** *** *** 2019: Jan.-Mar. *** *** *** *** *** *** *** *** Apr.-June *** *** *** *** *** *** *** *** July-Sept. *** *** *** *** *** *** *** *** Oct.-Dec. *** *** *** *** *** *** *** *** 2020: Jan.-Mar. *** *** *** *** *** *** *** *** Apr.-June *** *** *** *** *** *** *** *** July-Sept. *** *** *** *** *** *** *** *** Oct.-Dec. *** *** *** *** *** *** *** ***
Period
United States Russia Ukraine Price
(dollars per short
ton)
Quantity (short tons)
Price (dollars
per short ton)
Quantity (short tons)
Margin (percent)
Price (dollars
per short ton)
Quantity (short tons)
Margin (percent)
2018: Jan.-Mar. *** *** *** *** *** *** *** *** Apr.-June *** *** *** *** *** *** *** *** July-Sept. *** *** *** *** *** *** *** *** Oct.-Dec. *** *** *** *** *** *** *** *** 2019: Jan.-Mar. *** *** *** *** *** *** *** *** Apr.-June *** *** *** *** *** *** *** *** July-Sept. *** *** *** *** *** *** *** *** Oct.-Dec. *** *** *** *** *** *** *** *** 2020: Jan.-Mar. *** *** *** *** *** *** *** *** Apr.-June *** *** *** *** *** *** *** *** July-Sept. *** *** *** *** *** *** *** *** Oct.-Dec. *** *** *** *** *** *** *** ***
Note: Product 5: Seamless pipe stenciled to meet one or more of the following specifications: ASTM A-106 grade B, ASTM A-53 grade B, API 5L grade B, and API 5L grade X-42 specifications; 12” nominal size (12 3/4 inch OD x 0.375 wall thickness); plain ends. Source: Compiled from data submitted in response to Commission questionnaires.

V-14
Table V-8 SSLP pipe: Weighted-average f.o.b. prices and quantities of domestic and imported product 6 and margins of underselling/(overselling), by quarter, January 2018-December 2020
Period
United States Czechia Korea Price
(dollars per short
ton)
Quantity (short tons)
Price (dollars
per short ton)
Quantity (short tons)
Margin (percent)
Price (dollars
per short ton)
Quantity (short tons)
Margin (percent)
2018: Jan.-Mar. *** *** *** *** *** *** *** *** Apr.-June *** *** *** *** *** *** *** *** July-Sept. *** *** *** *** *** *** *** *** Oct.-Dec. *** *** *** *** *** *** *** *** 2019: Jan.-Mar. *** *** *** *** *** *** *** *** Apr.-June *** *** *** *** *** *** *** *** July-Sept. *** *** *** *** *** *** *** *** Oct.-Dec. *** *** *** *** *** *** *** *** 2020: Jan.-Mar. *** *** *** *** *** *** *** *** Apr.-June *** *** *** *** *** *** *** *** July-Sept. *** *** *** *** *** *** *** *** Oct.-Dec. *** *** *** *** *** *** *** ***
Period
United States Russia Ukraine Price
(dollars per short
ton)
Quantity (short tons)
Price (dollars
per short ton)
Quantity (short tons)
Margin (percent)
Price (dollars
per short ton)
Quantity (short tons)
Margin (percent)
2018: Jan.-Mar. *** *** *** *** *** *** *** *** Apr.-June *** *** *** *** *** *** *** *** July-Sept. *** *** *** *** *** *** *** *** Oct.-Dec. *** *** *** *** *** *** *** *** 2019: Jan.-Mar. *** *** *** *** *** *** *** *** Apr.-June *** *** *** *** *** *** *** *** July-Sept. *** *** *** *** *** *** *** *** Oct.-Dec. *** *** *** *** *** *** *** *** 2020: Jan.-Mar. *** *** *** *** *** *** *** *** Apr.-June *** *** *** *** *** *** *** *** July-Sept. *** *** *** *** *** *** *** *** Oct.-Dec. *** *** *** *** *** *** *** ***
Note: Product 6: Seamless pipe stenciled to meet one or more of the following specifications: ASTM A-106 grade B, ASTM A-53 grade B, API 5L grade B, and API 5L grade X-42 specifications; 16” nominal size (16 inch OD x 0.375 wall thickness); plain ends. Source: Compiled from data submitted in response to Commission questionnaires.

V-15
Figure V-3 SSLP pipe: Weighted-average prices and quantities of domestic and imported product 1, by quarter, January 2018-December 2020
* * * * * * *

V-16
Figure V-4 SSLP pipe: Weighted-average prices and quantities of domestic and imported product 2, by quarter, January 2018-December 2020
* * * * * * *
V-17
Figure V-5 SSLP pipe: Weighted-average prices and quantities of domestic and imported product 3, by quarter, January 2018-December 2020
* * * * * * *

V-18
Figure V-6 SSLP pipe: Weighted-average prices and quantities of domestic and imported product 4, by quarter, January 2018-December 2020
* * * * * * *

V-19
Figure V-7 SSLP pipe: Weighted-average prices and quantities of domestic and imported product 5, by quarter, January 2018-December 2020
* * * * * * *

V-20
Figure V-8 SSLP pipe: Weighted-average prices and quantities of domestic and imported product 6, by quarter, January 2018-December 2020
* * * * * * *
V-21
Price trends
In general, prices decreased during January 2018-December 2020. Table V-9 summarizes the price trends, by country and by product. As shown in the table, domestic price decreases ranged from *** to *** percent during January 2018-December 2020. Import prices ranged from *** percent decrease to *** percent increase for products 1 thru 4 imported from Czechia and ranged from *** percent decrease to *** percent increase for products 1 thru 5 imported from Ukraine. As shown in figures V-9 and V-10, U.S. producers’ prices steadily increased from the first quarter of 2018 to the third quarter of 2018 before declining through 2020. Importers’ prices, on the other hand, increased more rapidly from the first quarter of 2018 to the third quarter of 2018 before declining steadily through 2020.

V-22
Table V-9 SSLP pipe: Summary of weighted-average f.o.b. prices for products 1-6 from the United States and subject countries
Item Number of quarters
Low price (dollars per short ton)
High price (dollars per short ton)
Change in price (percent)
Product 1: United States *** *** *** *** Czechia *** *** *** *** Korea *** *** *** *** Russia *** *** *** *** Ukraine *** *** *** *** Product 2: United States *** *** *** *** Czechia *** *** *** *** Korea *** *** *** *** Russia *** *** *** *** Ukraine *** *** *** *** Product 3: United States *** *** *** *** Czechia *** *** *** *** Korea *** *** *** *** Russia *** *** *** *** Ukraine *** *** *** *** Product 4: United States *** *** *** *** Czechia *** *** *** *** Korea *** *** *** *** Russia *** *** *** *** Ukraine *** *** *** *** Product 5: United States *** *** *** *** Czechia *** *** *** *** Korea *** *** *** *** Russia *** *** *** *** Ukraine *** *** *** *** Product 6: United States *** *** *** *** Czechia *** *** *** *** Korea *** *** *** *** Russia *** *** *** *** Ukraine *** *** *** ***
Note: Percentage change from the first quarter in which data were available to the last quarter in which price data were available when ten or more quarters of data were reported. Source: Compiled from data submitted in response to Commission questionnaires.
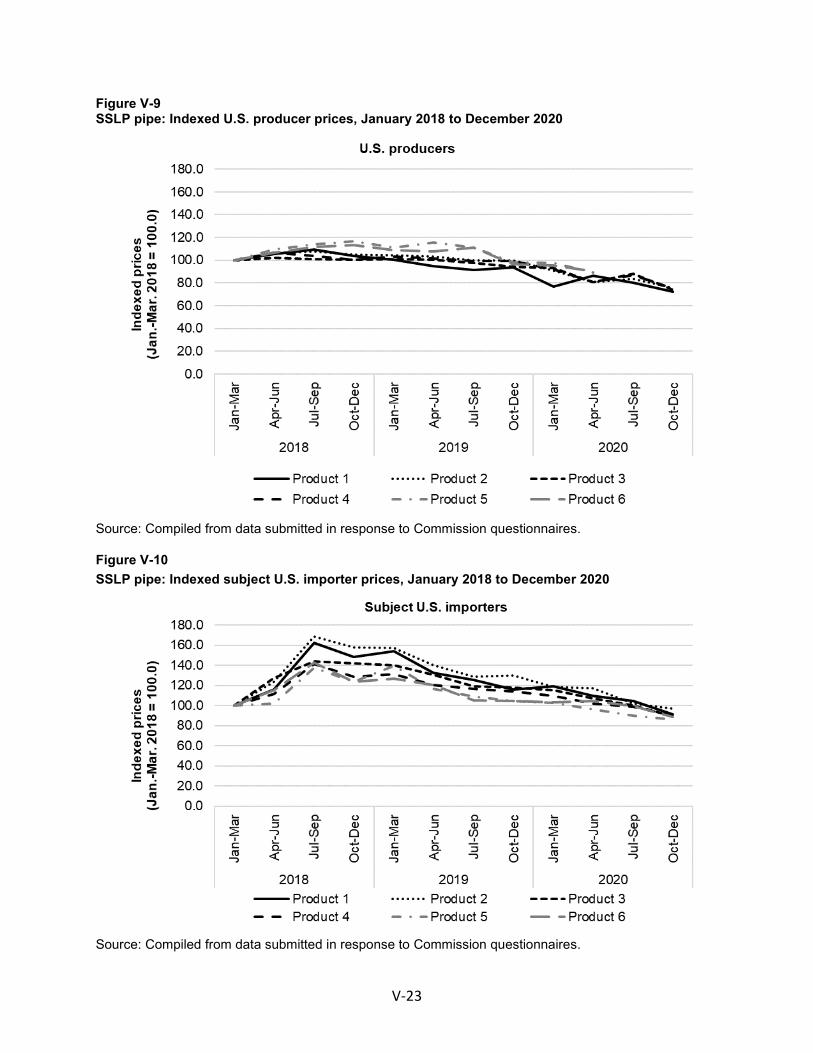
V-23
Figure V-9 SSLP pipe: Indexed U.S. producer prices, January 2018 to December 2020
Source: Compiled from data submitted in response to Commission questionnaires.
Figure V-10 SSLP pipe: Indexed subject U.S. importer prices, January 2018 to December 2020
Source: Compiled from data submitted in response to Commission questionnaires.

V-24
Price comparisons
As shown in table V-10, prices for product imported from subject countries were below those for U.S.-produced product in all 136 instances (103,459 short tons); margins of underselling ranged from 8.6 to 49.1 percent.
Table V-10 SSLP pipe: Instances of underselling/overselling and the range and average of margins, by country, January 2018-December 2020
Source Underselling
Number of quarters
Quantity (short tons)
Average margin
(percent)
Margin range (percent) Min Max
Product 1 *** *** *** *** *** Product 2 *** *** *** *** *** Product 3 *** *** *** *** *** Product 4 *** *** *** *** *** Product 5 *** *** *** *** *** Product 6 *** *** *** *** ***
Total, by product 136 103,459 29.6 8.6 49.1 Czechia *** *** *** *** *** Korea *** *** *** *** *** Russia *** *** *** *** *** Ukraine *** *** *** *** ***
Total, by country 136 103,459 29.6 8.6 49.1
Source (Overselling)
Number of quarters
Quantity (short tons)
Average margin
(percent)
Margin range (percent) Min Max
Product 1 --- --- --- --- --- Product 2 --- --- --- --- --- Product 3 --- --- --- --- --- Product 4 --- --- --- --- --- Product 5 --- --- --- --- --- Product 6 --- --- --- --- ---
Total, by product --- --- --- --- --- Czechia --- --- --- --- --- Korea --- --- --- --- --- Russia --- --- --- --- --- Ukraine --- --- --- --- ---
Total, by country --- --- --- --- --- Note: These data include only quarters in which there is a comparison between the U.S. and subject product. Source: Compiled from data submitted in response to Commission questionnaires.
V-25
Lost sales and lost revenue
In the preliminary phase of these investigations, the Commission requested that U.S. producers of SSLP pipe report purchasers with which they experienced instances of lost sales or revenue due to competition from imports of SSLP pipe from Czechia, Korea, Russia, and Ukraine during January 2017-March 2020. Of the five responding U.S. producers, five reported that they had to reduce prices, three had to roll back announced price increases, and six firms reported that they had lost sales. No U.S. producers submitted lost sales and lost revenue allegations.12
In the final phase of these investigations, of the five responding U.S. producers, five reported that they had to reduce prices, three had to roll back announced price increases, and five firms reported that they had lost sales.
Staff contacted 41 purchasers and received responses from 14 purchasers.13 Responding purchasers reported purchasing and/or importing 890,004 short tons of SSLP pipe during 2018-20 (table V-11).
12 Petition, p. 17. 13 One purchaser (***) submitted lost sales lost revenue survey responses in the preliminary phase,
but responded that it did not purchase SSLP pipe in the final phase of these investigations.

V-26
Table V-11 SSLP pipe: Purchasers’ reported purchases and imports, 2018-20
Purchaser
Purchases in 2018-20 (short tons)
Change in domestic share (pp, 2018-20)
Change in subject
country share (pp, 2018-20) Domestic Subject All other
*** *** *** *** *** *** *** *** *** *** *** *** *** *** *** *** *** *** *** *** *** *** *** *** *** *** *** *** *** *** *** *** *** *** *** *** *** *** *** *** *** *** *** *** *** *** *** *** *** *** *** *** *** *** *** *** *** *** *** *** *** *** *** *** *** *** *** *** *** *** *** *** *** *** *** *** *** *** *** *** *** *** *** *** *** *** *** *** *** *** *** *** *** *** *** *** *** *** *** *** *** *** Total *** *** *** *** ***
Note: All other includes all other sources and unknown sources. Note: Percentage points (pp) change: Change in the share of the firm’s total purchases of domestic and/or subject country imports between first and last years. Source: Compiled from data submitted in response to Commission questionnaires.
Of the 17 responding purchasers, 8 reported that, since 2018, they had purchased imported SSLP pipe from subject countries instead of U.S.-produced product.14 Seven of these purchasers reported that subject import prices were lower than U.S.-produced product.15 Six of these purchasers reported that price was a primary reason for the decision to purchase imported product rather than U.S.-produced product.16 Five purchasers estimated the quantity of SSLP pipe from subject countries purchased instead of domestic product; quantities ranged from *** short tons to *** short tons (tables V-12 and V-13). Purchasers identified availability as non-price reasons for purchasing imported rather than U.S.-produced product.
14 Six purchasers purchased SSLP pipe imported from Czechia, five from Korea, two from Russia, and four from Ukraine instead of purchasing domestically produced product.
15 Six purchasers reported prices of imports from Czechia were lower priced, four from Korea, two from Russia, and four from Ukraine.
16 Four purchasers reported price was a primary reason in purchasing SSLP pipe imported from Czechia, three from Korea, one from Russia, and three from Ukraine.

V-27
Table V-12 SSLP pipe: Purchasers’ responses to purchasing subject imports instead of domestic product
Purchaser
Purchased imports
instead of domestic
(Y/N)
Imports priced
lower (Y/N)
If purchased imports instead of domestic, was price a primary reason
Y/N
If Yes, quantity
purchased instead of domestic
(short tons) If No, non-price reason *** *** *** *** *** *** *** *** *** *** *** *** *** *** *** *** *** *** *** *** *** *** *** *** *** *** *** *** *** *** *** *** *** *** *** *** *** *** *** *** *** *** *** *** *** *** *** *** *** *** *** *** *** *** *** *** *** *** *** *** *** *** *** *** *** *** *** *** *** *** *** *** *** *** *** *** *** *** *** *** *** *** *** *** *** *** *** *** *** *** *** *** *** *** *** *** *** *** *** *** *** ***
Total Yes--8; No--7
Yes--7; No--1
Yes--6; No--2 ***
Note: In its lost sales lost revenue survey, *** reported that it did not purchase SSLP pipe imported from subject countries instead of domestic product. Source: Compiled from data submitted in response to Commission questionnaires.

V-28
Table V-13 SSLP pipe: Purchasers’ responses to purchasing subject product instead of domestic, by country
Source
Count of purchasers reporting
subject instead of domestic
Count of purchasers
reported that imports were priced lower
Count of purchasers
reporting that price was a
primary reason for shift
Quantity subject
purchased (short tons)
Czechia *** *** *** *** Korea *** *** *** *** Russia *** *** *** *** Ukraine *** *** *** ***
Any subject source 8 7 6 *** Source: Compiled from data submitted in response to Commission questionnaires.
Of the 17 responding purchasers, 5 reported that U.S. producers did not reduce prices in order to compete with lower-priced imports from subject countries and 3 reported that U.S. producers had reduced prices in order to compete with lower-priced imports from subject countries (3 firms each with respect to imports from Czechia and Ukraine and 1 firm each for Korea and Russia). Eight purchasers reported that they did not know (table V-14). Two purchasers estimated price reductions with respect to Czechia and Ukraine of *** percent (***) and *** percent (***). In describing the price reductions, *** reported that demand in the energy sector fell significantly which created increased competition among domestic mills. *** noted domestic price declines in mid-2019.

V-29
Table V-14 SSLP pipe: Purchasers’ responses to U.S. producer price reductions
Purchaser
U.S. producers reduced priced to
compete with subject imports
(Y/N)
If U.S. producers reduced prices
Estimated U.S. price reduction (percent) Additional information, if available
*** *** *** *** *** *** *** *** *** *** *** *** *** *** *** *** *** *** *** *** *** *** *** *** *** *** *** *** *** *** *** *** *** *** *** *** *** *** *** *** *** *** *** *** *** *** *** *** *** *** *** *** *** *** *** *** *** *** *** *** *** *** *** *** *** *** *** *** Total / average Yes--3; No--5 ***
Note: In its lost sales lost revenue survey, *** reported that domestic producers did not reduce prices. Source: Compiled from data submitted in response to Commission questionnaires.
In responding to the lost sales lost revenue survey in the preliminary phase of these investigations, some purchasers provided additional information on purchases and market dynamics. *** stated that it purchased domestic pipe in addition to its purchases of imports. *** stated that it only markets import products to import users and that it does not offer import products to traditional domestic purchasers.

VI-1
Part VI: Financial experience of U.S. producers
Background
The following U.S. producers provided usable financial results on their SSLP pipe operations: Benteler, Tenaris, TimkenSteel, U.S. Steel, and Vallourec. *** of the responding U.S. producers provided their financial data based on International Financial Reporting Standards (“IFRS”). *** and *** reported their results on the basis of U.S. generally accepted accounting principles (“GAAP”). *** responding producers reported their financial results on a calendar-year basis.1 2
Operations on SSLP pipe
Figure VI-1 presents each responding firm’s share of the total reported net sales, by quantity, in 2020. Table VI-1 presents aggregated data on U.S. producers’ operations in relation to SSLP pipe over the period examined. Table VI-2 presents changes in the average unit value (“AUV”) data for the data presented in table VI-1, while table VI-3 presents selected company-specific financial data.
1 ***. Emails from ***. March 1, 5 and 8, 2021. *** in the preliminary phase of these investigations, has not responded in the final phase. ***
responded in these final phase investigations ***. In response to an email from Commission staff, ***. Email from ***, February 16, 2021.
2 *** reported that it has been in a tolling agreement with *** since July 2017. The sales resulting from the tolling agreement are classified as commercial sales. Email from ***, February 4, 2021.

VI-2
Figure VI-1 SSLP pipe: Share of net sales quantity, by firm, 2020
* * * * * * * Source: Compiled from data submitted in response to Commission questionnaires.

VI-3
Table VI-1 SSLP pipe: Results of operations of U.S. producers, 2018 20
Item Calendar year
2018 2019 2020 Quantity (short tons) Commercial sales *** *** *** Internal consumption *** *** *** Transfers to related firms *** *** ***
Total net sales *** *** *** Value (1,000 dollars) Commercial sales *** *** *** Internal consumption *** *** *** Transfers to related firms *** *** ***
Total net sales *** *** *** Cost of goods sold.-- Raw materials *** *** ***
Direct labor *** *** *** Other factory costs *** *** ***
Total COGS *** *** *** Gross profit *** *** *** SG&A expense *** *** *** Operating income or (loss) *** *** *** All other expenses/(income), net *** *** *** Net income or (loss) *** *** *** Depreciation/amortization *** *** *** Cash flow *** *** *** Ratio to net sales (percent) Cost of goods sold.-- Raw materials *** *** ***
Direct labor *** *** *** Other factory costs *** *** ***
Average COGS *** *** *** Gross profit 13.2 5.2 (3.8) SG&A expense *** *** *** Operating income or (loss) 8.0 (2.2) (14.4) Net income or (loss) *** *** *** Table continued on next page.

VI-4
Table VI-1--Continued SSLP pipe: Results of operations of U.S. producers, 2018-20
Source: Compiled from data submitted in response to Commission questionnaires.
Item Calendar year
2018 2019 2020 Ratio to total COGS (percent) Cost of goods sold.-- Raw materials *** *** ***
Direct labor *** *** *** Other factory costs *** *** ***
Average COGS *** *** *** Unit value (dollars per short ton)
Commercial sales *** *** *** Internal consumption *** *** *** Transfers to related firms *** *** ***
Total net sales *** *** *** Cost of goods sold.-- Raw materials *** *** ***
Direct labor *** *** *** Other factory costs *** *** ***
Average COGS *** *** *** Gross profit 221 87 (57) SG&A expense *** *** *** Operating income or (loss) 134 (36) (212) Net income or (loss) *** *** *** Number of firms reporting Operating losses *** *** *** Net losses *** *** *** Data *** *** ***

VI-5
Table VI-2 SSLP pipe: Changes in AUVs between calendar years, 2018-20
Item Between Calendar years
2018-20 2018-19 2019-20 Change in AUVs (percent)
Commercial sales ▼*** ▼*** ▼*** Internal consumption ▼*** ▼*** ▼*** Transfers to related firms ▼*** ▲*** ▼***
Total net sales ▼*** ▼*** ▼*** Cost of goods sold.-- Raw materials ▼*** ▲*** ▼***
Direct labor ▲*** ▲*** ▼*** Other factory costs ▲*** ▼*** ▲***
Average COGS ▲*** ▲*** ▼*** Change in AUVs (dollars per short ton)
Commercial sales ▼*** ▼*** ▼*** Internal consumption ▼*** ▼*** ▼*** Transfers to related firms ▼*** ▲*** ▼***
Total net sales ▼*** ▼*** ▼*** Cost of goods sold.-- Raw materials ▼*** ▲*** ▼***
Direct labor ▲*** ▲*** ▼*** Other factory costs ▲*** ▼*** ▲***
Average COGS ▲*** ▲*** ▼*** Gross profit ▼(277) ▼(134) ▼(143) SG&A expense ▲*** ▲*** ▲*** Operating income or (loss) ▼(346) ▼(170) ▼(176) Net income or (loss) ▼*** ▼*** ▼***
Source: Compiled from data submitted in response to Commission questionnaires.

VI-6
Table VI-3 SSLP pipe: Results of operations of U.S. producers, by firm, 2018-20
Gross profit or (loss) (1,000 dollars) Benteler *** *** *** Tenaris *** *** *** TimkenSteel *** *** *** U. S. Steel *** *** *** Vallourec *** *** ***
All firms *** *** *** SG&A expenses (1,000 dollars) Benteler *** *** *** Tenaris *** *** *** TimkenSteel *** *** *** U. S. Steel *** *** *** Vallourec *** *** ***
All firms *** *** *** Table continued on next page.
Item Calendar year
2018 2019 2020 Total net sales (short tons) Benteler *** *** *** Tenaris *** *** *** TimkenSteel *** *** *** U. S. Steel *** *** *** Vallourec *** *** ***
All firms *** *** *** Total net sales (1,000 dollars) Benteler *** *** *** Tenaris *** *** *** TimkenSteel *** *** *** U. S. Steel *** *** *** Vallourec *** *** ***
All firms *** *** *** Cost of goods sold (1,000 dollars) Benteler *** *** *** Tenaris *** *** *** TimkenSteel *** *** *** U. S. Steel *** *** *** Vallourec *** *** ***
All firms *** *** ***

VI-7
Table VI-3--Continued SSLP pipe: Results of operations of U.S. producers, by firm, 2018-20
Net income or (loss) (1,000 dollars) Benteler *** *** *** Tenaris *** *** *** TimkenSteel *** *** *** U. S. Steel *** *** *** Vallourec *** *** ***
All firms *** *** *** COGS to net sales ratio (percent)
Benteler *** *** *** Tenaris *** *** *** TimkenSteel *** *** *** U. S. Steel *** *** *** Vallourec *** *** ***
All firms *** *** *** Gross profit or (loss) to net sales ratio (percent) Benteler *** *** *** Tenaris *** *** *** TimkenSteel *** *** *** U. S. Steel *** *** *** Vallourec *** *** ***
All firms 13.2 5.2 (3.8)
Table continued on next page.
Item Calendar year
2018 2019 2020 Operating income or (loss) (1,000 dollars) Benteler *** *** *** Tenaris *** *** *** TimkenSteel *** *** *** U. S. Steel *** *** *** Vallourec *** *** ***
All firms *** *** ***
SG&A expense to net sales ratio (percent) Benteler *** *** *** Tenaris *** *** *** TimkenSteel *** *** *** U. S. Steel *** *** *** Vallourec *** *** ***
All firms *** *** ***

VI-8
Table VI-3--Continued SSLP pipe: Results of operations of U.S. producers, by firm, 2018-20
Unit net sales value (dollars per short ton) Benteler *** *** *** Tenaris *** *** *** TimkenSteel *** *** *** U. S. Steel *** *** *** Vallourec *** *** ***
All firms *** *** *** Unit raw materials (dollars per short ton) Benteler *** *** *** Tenaris *** *** *** TimkenSteel *** *** *** U. S. Steel *** *** *** Vallourec *** *** ***
All firms *** *** *** Unit direct labor (dollars per short ton) Benteler *** *** *** Tenaris *** *** *** TimkenSteel *** *** *** U. S. Steel *** *** *** Vallourec *** *** ***
All firms *** *** *** Table continued on next page.
Item Calendar year
2018 2019 2020 Operating income or (loss) to net sales ratio (percent) Benteler *** *** *** Tenaris *** *** *** TimkenSteel *** *** *** U. S. Steel *** *** *** Vallourec *** *** ***
All firms 8.0 (2.2) (14.4) Net income or (loss) to net sales ratio (percent) Benteler *** *** *** Tenaris *** *** *** TimkenSteel *** *** *** U. S. Steel *** *** *** Vallourec *** *** ***
All firms *** *** ***

VI-9
Table VI-3--Continued SSLP pipe: Results of operations of U.S. producers, by firm, 2018-20
Table continued on next page.
Item Calendar year
2018 2019 2020 Unit other factory costs (dollars per short ton) Benteler *** *** *** Tenaris *** *** *** TimkenSteel *** *** *** U. S. Steel *** *** *** Vallourec *** *** ***
All firms *** *** *** Unit COGS (dollars per short ton) Benteler *** *** *** Tenaris *** *** *** TimkenSteel *** *** *** U. S. Steel *** *** *** Vallourec *** *** ***
All firms *** *** *** Unit gross profit or (loss) (dollars per short ton) Benteler *** *** *** Tenaris *** *** *** TimkenSteel *** *** *** U. S. Steel *** *** *** Vallourec *** *** ***
All firms 221 87 (57) Unit SG&A expenses (dollars per short ton) Benteler *** *** *** Tenaris *** *** *** TimkenSteel *** *** *** U. S. Steel *** *** *** Vallourec *** *** ***
All firms *** *** *** Unit operating income or (loss) (dollars per short ton) Benteler *** *** *** Tenaris *** *** *** TimkenSteel *** *** *** U. S. Steel *** *** *** Vallourec *** *** ***
All firms 134 (36) (212)
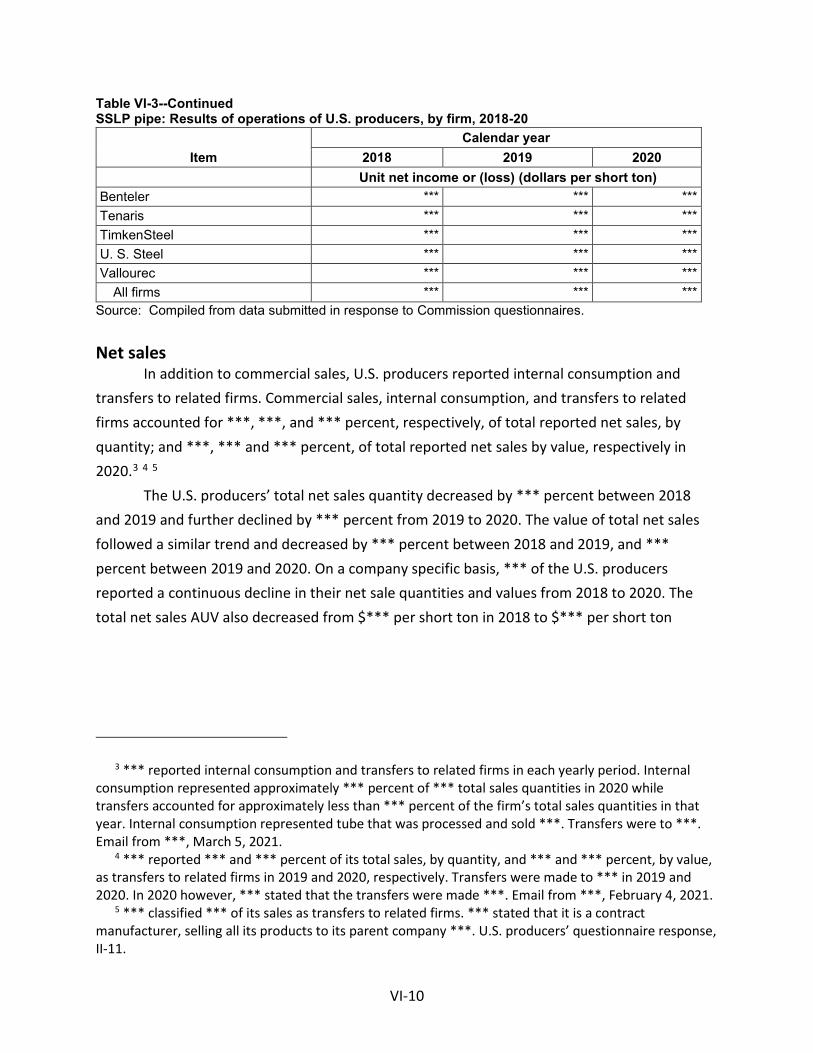
VI-10
Table VI-3--Continued SSLP pipe: Results of operations of U.S. producers, by firm, 2018-20
Source: Compiled from data submitted in response to Commission questionnaires.
Net sales In addition to commercial sales, U.S. producers reported internal consumption and
transfers to related firms. Commercial sales, internal consumption, and transfers to related firms accounted for ***, ***, and *** percent, respectively, of total reported net sales, by quantity; and ***, *** and *** percent, of total reported net sales by value, respectively in 2020.3 4 5
The U.S. producers’ total net sales quantity decreased by *** percent between 2018 and 2019 and further declined by *** percent from 2019 to 2020. The value of total net sales followed a similar trend and decreased by *** percent between 2018 and 2019, and *** percent between 2019 and 2020. On a company specific basis, *** of the U.S. producers reported a continuous decline in their net sale quantities and values from 2018 to 2020. The total net sales AUV also decreased from $*** per short ton in 2018 to $*** per short ton
3 *** reported internal consumption and transfers to related firms in each yearly period. Internal consumption represented approximately *** percent of *** total sales quantities in 2020 while transfers accounted for approximately less than *** percent of the firm’s total sales quantities in that year. Internal consumption represented tube that was processed and sold ***. Transfers were to ***. Email from ***, March 5, 2021.
4 *** reported *** and *** percent of its total sales, by quantity, and *** and *** percent, by value, as transfers to related firms in 2019 and 2020, respectively. Transfers were made to *** in 2019 and 2020. In 2020 however, *** stated that the transfers were made ***. Email from ***, February 4, 2021.
5 *** classified *** of its sales as transfers to related firms. *** stated that it is a contract manufacturer, selling all its products to its parent company ***. U.S. producers’ questionnaire response, II-11.
Item Calendar year
2018 2019 2020 Unit net income or (loss) (dollars per short ton) Benteler *** *** *** Tenaris *** *** *** TimkenSteel *** *** *** U. S. Steel *** *** *** Vallourec *** *** ***
All firms *** *** ***

VI-11
in 2020. On a company specific basis, *** of the U.S. producers reported lower average per short ton values in 2020 compared to 2018, however that directional change was irregular as *** and *** reported a slight increase in their average per short ton values from 2018 to 2019, while ***, *** and *** reported a decrease in their average per short ton values from 2018 to 2019. The *** U.S. producers reported lower average per short ton values in 2020 compared to 2019 except ***. Internal consumption and transfers to related firms followed the trend of commercial sales, decreasing continuously between 2018 and 2020 on a quantity and value basis. On an average per short ton basis, both internal consumption and transfers to related firms also decreased between 2018 and 2020.
Cost of goods sold and gross profit or loss
Raw material costs, direct labor, and other factory costs accounted for ***, ***, and *** percent of total COGS, respectively, in 2020. Raw material costs, which are primarily composed of billets (a semifinished steel form) and other materials fell between 2018 ($***) and 2020 ($***), following the net sales quantities trends (table VI-1).6 On an average per short ton basis, raw material costs increased from $*** per short ton in 2018 to $*** per short ton in 2019 before declining to $*** per short ton in 2020. As a ratio to net sales, raw material costs increased between 2018 (*** percent) and 2019 (*** percent) and were lower in 2020 at *** percent.7 On a company specific basis, data for *** U.S. producers showed increased average per short ton values for raw material costs between 2018 and 2019, and *** of the U.S. producers reported a decrease in their average per short ton values between 2019 and 2020. Table VI-4 presents raw materials, by type.
6 *** purchases billets from a related supplier in ***; the purchased material was valued at *** and represents *** percent of its total COGS in 2020. U.S. producers’ questionnaire response, III-7. *** also indicated that it purchases billets from a related supplier (***); the purchased material represents *** percent of its total COGS in 2020. U.S. producers’ questionnaire responses, III-7.
7 Price increases for steelmaking inputs (scrap steel, pig iron, electricity, and natural gas) are also discussed on pages V-1 and V-2. U.S. Steel reportedly faced “steep increases in raw material costs, with the most significant increases occurring toward the end of the period of investigation.” U.S. Steel’s post-hearing brief, p. II-2. The firm also stated that the ***. *** questionnaire response, III-18.

VI-12
Table VI-4 SSLP pipe: Raw materials by type, 2020
Raw materials
Calendar year 2020
Value (1,000 dollars) Unit value (dollars per
short ton) Share of value
(percent) Billets *** *** *** Redraw hollows *** *** *** Other material inputs *** *** ***
Total, raw materials *** *** *** Note.-- *** indicated the use of other material such as scrap, additives, alloys and fluxes to produce billets. Email from ***, February 4, 2021. It should be noted that additives, alloys, and fluxes are inputs to steelmaking, and the semifinished steel form used to produce tube is the billet. Source: Compiled from data submitted in response to Commission questionnaires.
Other factory costs followed the changes of net sales quantities and decreased by *** and *** percent in 2018-19 and 2019-20 respectively, and overall declined by *** percent between 2018 and 2020. On an average per short ton basis, other factory costs decreased between 2018 ($***) and 2019 ($***) but increased overall between 2018 and 2020 ($***) reflecting both the composition of fixed costs within other factory costs and the decrease in net sales quantities.8 The decline in unit values in 2019 was driven primarily by *** and ***. Similarly, as a ratio to net sales, other factory costs increased overall between 2018 (*** percent) and 2020 (*** percent).
The trend of direct labor costs also reflects that of net sales quantities, declining continuously between 2018 ($*** and 2020 ($***). On an average per short ton basis, direct labor costs increased between 2018 ($***) and 2020 ($***). As a ratio to net sales, direct labor costs also increased from *** percent in 2018 to *** percent in 2019 and *** percent 2020.9 10
8 ***. U.S. producers’ questionnaire response, III-11. 9 ***. *** questionnaire response, II-2a. 10 Both labor and other factory costs have a variable and fixed cost component. The variable
component changes with production while the fixed cost component does not. Hence, unit costs may increase even as production falls. Labor costs have a fixed cost component, composed of wages, salaries, and benefits. Firms often prefer to retain skilled personnel at reduced hours or employment elsewhere within the facility (if possible) rather than lay them off. Other factory costs also have a component of costs that are incurred regardless of the level of production (e.g., depreciation, rent, utilities, maintenance, personnel benefits, insurance, and the like). Petitioners also stated that while production goes down, the overall costs will also decline while the unit costs will increase as it becomes more expensive to produce each kind of pipe that’s coming out of the mill. Hearing transcript, p. 67 (Drake).

VI-13
Overall, total COGS mirrored the decline in net sales quantities, declining from $*** in 2018 to $*** in 2020. On an average per short ton basis, total COGS increased from $*** in 2018 to $*** in 2020. As a ratio to net sales, total COGS also increased from *** percent in 2018 to *** percent in 2020.
The U.S. producers’ total gross profit declined by *** percent, from $*** in 2018 to $*** in 2019 and further declined to a loss of $*** in 2020. On a company specific basis, *** of the U.S. producers reported declining gross profits between 2018 and 2020; *** and *** reported losses in both 2019 and 2020.
SG&A expenses and operating income or loss
As seen in table VI-1, the U.S. producers’ selling, general, and administrative (“SG&A”) expenses decreased between 2018 ($***) and 2019 ($***), and further declined to $*** in 2020, reflecting the pattern of net sales. On a company specific basis, *** of the U.S. producers reported decreasing SG&A expenses between 2018 and 2020; ***.11 Even as sales values and SG&A expenses declined, sales declined at a faster rate than did SG&A expenses and the corresponding SG&A expense ratio (total SG&A expenses divided by total sales value) increased: from *** percent in 2018 to *** percent in 2019 and *** percent in 2020.12 13
11 *** reported the highest amount of SG&A expenses throughout the three years period. The firm indicated that its SG&A expenses included salaries and benefits of *** corporate support functions plus various professional services. It stated that the percentage of SG&A expenses related to SSLP pipe is only “slightly higher” than that of its overall production due to the additional manufacturing operations and the overall higher costs of SSLP production. Email from ***, March 8, 2021.
12 In the preliminary phase of these investigations, *** did not provide SG&A expense data, and Commission staff calculated the aggregate SG&A/sales ratio of the four other producers and applied it to ***’s sales to estimate its SG&A expenses for all reporting periods. In these final phase investigations, Commission staff used 2018 and 2019 data from the preliminary phase and calculated SG&A expenses for 2020 by multiplying the 2020 first quarter estimated data by four. This was accepted as reasonable by ***. Email from ***, February 4, 2021.
13 ***. U.S. producers’ questionnaire response, III-11.

VI-14
The U.S. producers’ operating income decreased from $*** in 2018 to losses of $*** in 2019 and $*** in 2020. As a ratio to net sales, operating income mirrored the absolute values trend by decreasing from 8.0 percent in 2018 to a loss of 2.2 percent in 2019 and 14.4 percent in 2020. On a company specific basis, *** of the U.S producers reported declining operating income between 2018 and 2019. *** reporting firms, ***, reported operating losses in 2020. *** was the only U.S. producer to report *** throughout the reporting period. In addition to sales volume, the majority of U.S. producers attributed their losses to difficult market conditions that worsened with the COVID-19 pandemic.14
All other expenses and net income or loss
All other expenses/income decreased by *** percent between 2018 ($***) and 2019 ($***) and then increased to $*** in 2020. The 2020 increase was primarily driven by ***.15 16 17
Given the changes in operating income described earlier and those of other income and expenses, the U.S. industry’s net income decreased from $*** in 2018 to a loss of $*** in 2019 and a loss of $*** in 2020. *** U.S. producers reported net losses throughout the three years period, and *** reported net losses in 2020. Depreciation charges decreased continuously between 2018 ($***) and 2020 ($***). Cash flow, which is the sum of depreciation charges and net income or loss, fell by *** percent from $*** in 2018 to $*** million in 2019, and further declined to *** in 2020.
14 U.S. producers’ questionnaire response, II-2a. 15 *** reported an impairment of assets in 2020 in the amount of $*** of which *** percent was
allocated to SSLP pipe. U.S. producers’ questionnaire response, III-11. 16 ***. U.S. producers’ questionnaire response, III-11. 17 ***. U.S. producers’ questionnaire response, III-18.

VI-15
Variance analysis
A variance analysis for the operations of U.S. producers of SSLP pipe is presented in table VI-5.18 The information for this variance analysis is derived from table VI-1.
The data in this table indicate that the price variance on total sales was unfavorable (unit sales prices decreased) between the full yearly periods and the cost/expense variance was also unfavorable (unit costs/expenses increased). The combination of unfavorable variances on price, cost/expense, and volume led to the operating income variance being sharply lower from 2018 to 2020 by $***.
18 The Commission’s variance analysis is calculated in three parts: Sales variance, cost of sales variance (COGS variance), and SG&A expense variance. Each part consists of a price variance (in the case of the sales variance) or a cost or expense variance (in the case of the COGS and SG&A expense variance), and a volume variance. The sales or cost/expense variance is calculated as the change in unit price or per-unit cost/expense times the new volume, while the volume variance is calculated as the change in volume times the old unit price or per-unit cost/expense. Summarized at the bottom of the table, the price variance is from sales; the cost/expense variance is the sum of those items from COGS and SG&A variances, respectively, and the volume variance is the sum of the volume components of the net sales, COGS, and SG&A expense variances. The overall volume component of the variance analysis is generally small.

VI-16
Table VI-5 SSLP pipe: Variance analysis on the operations of U.S. producers, between calendar years, 2018-20
Item Between Calendar years
2018-20 2018-19 2019-20 Value (1,000 dollars)
Net sales: Price variance *** *** ***
Volume variance *** *** *** Net sales variance *** *** ***
COGS: Cost variance *** *** ***
Volume variance *** *** *** COGS variance *** *** ***
Gross profit variance *** *** *** SG&A expenses: Cost/expense variance *** *** ***
Volume variance *** *** *** Total SG&A expense variance *** *** ***
Operating income variance *** *** *** Summarized (at the operating income level) as: Price variance *** *** ***
Net cost/expense variance *** *** *** Net volume variance *** *** ***
Note.--Unfavorable variances are shown in parentheses; all others are favorable Source: Compiled from data submitted in response to Commission questionnaires.

VI-17
Capital expenditures and research and development expenses
Table VI-6 presents capital expenditures and research and development (“R&D”) expenses by firm. Table VI-7 presents the firms’ narrative responses on the nature and focus of their capital expenditures and R&D expenses. *** firms reported capital expenditure data and *** reported R&D expenses during the period of 2018 through 2020.
The U.S. producers’ capital expenditures declined by 59.2 percent between 2018 ($33.2 million) and 2020 ($13.5 million).19 Reported R&D expenses declined by *** percent from 2018 to 2020.
Table VI-6 SSLP pipe: Capital expenditures and R&D expenses of U.S. producers, 2018-20
Item
Calendar year 2018 2019 2020
Capital expenditures (1,000 dollars) Benteler *** *** *** Tenaris *** *** *** TimkenSteel *** *** *** U. S. Steel *** *** *** Vallourec *** *** ***
All firms 33,152 29,377 13,531 R&D expenses (1,000 dollars) Benteler *** *** *** Tenaris *** *** *** TimkenSteel *** *** *** U. S. Steel *** *** *** Vallourec *** *** ***
All firms *** *** *** Source: Compiled from data submitted in response to Commission questionnaires.
19 *** capital expenditures increased in 2019 and 2020, are attributed to ***. U.S. producers’ questionnaire response, III-13b.
VI-18
Table VI-7 Narrative responses of U.S. producers on the nature and focus of capital expenditures and R&D expenses 2018-20 Capital expenditures:
Firm Narrative *** *** *** *** *** *** *** *** *** *** R&D expenses:
Firm Narrative *** *** *** *** *** *** *** *** *** ***
Source: Compiled from data submitted in response to Commission questionnaires.
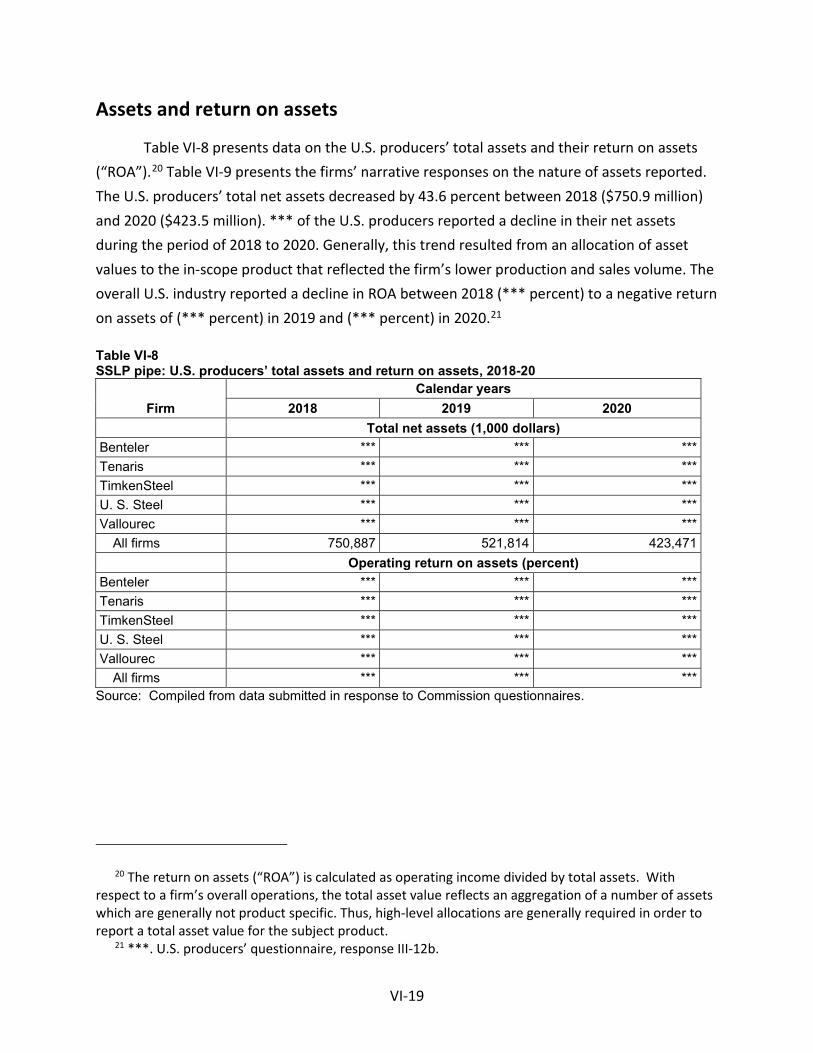
VI-19
Assets and return on assets
Table VI-8 presents data on the U.S. producers’ total assets and their return on assets (“ROA”).20 Table VI-9 presents the firms’ narrative responses on the nature of assets reported. The U.S. producers’ total net assets decreased by 43.6 percent between 2018 ($750.9 million) and 2020 ($423.5 million). *** of the U.S. producers reported a decline in their net assets during the period of 2018 to 2020. Generally, this trend resulted from an allocation of asset values to the in-scope product that reflected the firm’s lower production and sales volume. The overall U.S. industry reported a decline in ROA between 2018 (*** percent) to a negative return on assets of (*** percent) in 2019 and (*** percent) in 2020.21 Table VI-8 SSLP pipe: U.S. producers’ total assets and return on assets, 2018-20
Firm Calendar years
2018 2019 2020 Total net assets (1,000 dollars) Benteler *** *** *** Tenaris *** *** *** TimkenSteel *** *** *** U. S. Steel *** *** *** Vallourec *** *** ***
All firms 750,887 521,814 423,471 Operating return on assets (percent) Benteler *** *** *** Tenaris *** *** *** TimkenSteel *** *** *** U. S. Steel *** *** *** Vallourec *** *** ***
All firms *** *** *** Source: Compiled from data submitted in response to Commission questionnaires.
20 The return on assets (“ROA”) is calculated as operating income divided by total assets. With respect to a firm’s overall operations, the total asset value reflects an aggregation of a number of assets which are generally not product specific. Thus, high-level allocations are generally required in order to report a total asset value for the subject product.
21 ***. U.S. producers’ questionnaire, response III-12b.
VI-20
Table VI-9 SSLP pipe: Description of assets used in production, warehousing, and sales for U.S. producers by firm, 2018-20 Assets description: Firm Narrative *** *** *** *** *** *** *** *** *** ***
Source: Compiled from data submitted in response to Commission questionnaires.
Capital and investment
The Commission requested U.S. producers of SSLP pipe to describe any actual or potential negative effects of imports of SSLP pipe on their firms’ growth, investment, ability to raise capital, development and production efforts, or the scale of capital investments. Table VI-10 presents the number of firms reporting an impact in each category and table VI-11 provides the U.S. producers’ narrative responses.

VI-21
Table VI-10 SSLP pipe: Actual and anticipated negative effects of imports on investment, growth, and development, since January 1, 2018
Item No Yes Negative effects on investment 1 4
Cancellation, postponement, or rejection of expansion projects
2 Denial or rejection of investment proposal 0 Reduction in the size of capital investments 0 Return on specific investments negatively
impacted 1 Other 3
Negative effects on growth and development 0 5 Rejection of bank loans
0 Lowering of credit rating 1 Problem related to the issue of stocks or bonds 0 Ability to service debt 1 Other 4
Anticipated negative effects of imports 0 5 Note.—***. Source: Compiled from data submitted in response to Commission questionnaires.
VI-22
VI-11 SSLP pipe: Narratives relating to actual and anticipated negative effects of imports on investment, growth, and development, since January 1, 2018
Table continued on next page.
Item / Firm Narrative Cancellation, postponement, or rejection of expansion projects: *** *** *** *** Return on specific investments negatively impacted: *** *** Other negative effects on investments: *** *** *** *** *** *** Lowering of credit rating: *** *** Ability to service debt: *** *** Other effects on growth and development: *** *** *** *** *** *** *** ***

VI-23
Table VI-11--Continued SSLP pipe: Narratives relating to actual and anticipated negative effects of imports on investment, growth, and development, since January 1, 2018
Source: Compiled from data submitted in response to Commission questionnaires.
Anticipated effects of imports: *** *** *** *** *** *** *** *** *** ***


VII-1
Threat considerations and information on nonsubject countries
Section 771(7)(F)(i) of the Act (19 U.S.C. § 1677(7)(F)(i)) provides that—
In determining whether an industry in the United States is threatened with material injury by reason of imports (or sales for importation) of the subject merchandise, the Commission shall consider, among other relevant economic factors1--
(I) if a countervailable subsidy is involved, such information as may be presented to it by the administering authority as to the nature of the subsidy (particularly as to whether the countervailable subsidy is a subsidy described in Article 3 or 6.1 of the Subsidies Agreement), and whether imports of the subject merchandise are likely to increase,
(II) any existing unused production capacity or imminent, substantial increase in production capacity in the exporting country indicating the likelihood of substantially increased imports of the subject merchandise into the United States, taking into account the availability of other export markets to absorb any additional exports,
(III) a significant rate of increase of the volume or market penetration of imports of the subject merchandise indicating the likelihood of substantially increased imports,
(IV) whether imports of the subject merchandise are entering at prices that are likely to have a significant depressing or suppressing effect on domestic prices, and are likely to increase demand for further imports,
(V) inventories of the subject merchandise,
1 Section 771(7)(F)(ii) of the Act (19 U.S.C. § 1677(7)(F)(ii)) provides that “The Commission shall consider {these factors} . . . as a whole in making a determination of whether further dumped or subsidized imports are imminent and whether material injury by reason of imports would occur unless an order is issued or a suspension agreement is accepted under this title. The presence or absence of any factor which the Commission is required to consider . . . shall not necessarily give decisive guidance with respect to the determination. Such a determination may not be made on the basis of mere conjecture or supposition.”
VII-2
(VI) the potential for product-shifting if production facilities in the foreign country, which can be used to produce the subject merchandise, are currently being used to produce other products,
(VII) in any investigation under this title which involves imports of both a raw agricultural product (within the meaning of paragraph (4)(E)(iv)) and any product processed from such raw agricultural product, the likelihood that there will be increased imports, by reason of product shifting, if there is an affirmative determination by the Commission under section 705(b)(1) or 735(b)(1) with respect to either the raw agricultural product or the processed agricultural product (but not both),
(VIII) the actual and potential negative effects on the existing development and production efforts of the domestic industry, including efforts to develop a derivative or more advanced version of the domestic like product, and
(IX) any other demonstrable adverse trends that indicate the probability that there is likely to be material injury by reason of imports (or sale for importation) of the subject merchandise (whether or not it is actually being imported at the time).2
Information on the nature of the subsidies was presented earlier in this report; information on the volume and pricing of imports of the subject merchandise is presented in Parts IV and V; and information on the effects of imports of the subject merchandise on U.S. producers’ existing development and production efforts is presented in Part VI. Information on inventories of the subject merchandise; foreign producers’ operations, including the potential for “product-shifting;” any other threat indicators, if applicable; and any dumping in third-country markets, follows. Also presented in this section of the report is information obtained for consideration by the Commission on nonsubject countries.
2 Section 771(7)(F)(iii) of the Act (19 U.S.C. § 1677(7)(F)(iii)) further provides that, in antidumping investigations, “. . . the Commission shall consider whether dumping in the markets of foreign countries (as evidenced by dumping findings or antidumping remedies in other WTO member markets against the same class or kind of merchandise manufactured or exported by the same party as under investigation) suggests a threat of material injury to the domestic industry.”

VII-3
The industry in Czechia
The Commission issued foreign producers’ or exporters’ questionnaires to five firms believed to produce and/or export SSLP pipe from Czechia.3 Usable responses to the Commission’s questionnaire were received from three firms, Liberty Ostrava a.s. (“Liberty Ostrava”), Trinecke Zelezarny a.s. and Moravia Steel a.s. (collectively, “Trinecke Zelezarny”), and Vàlcovny trub Chomutov a.s. (“Valcovny”). These firms’ exports to the United States accounted for approximately *** percent of U.S. imports of SSLP pipe from Czechia in 2020. According to estimates requested of the responding Czechia producers, the production of SSLP pipe in Czechia reported in questionnaires accounts for approximately *** of overall production of SSLP pipe in Czechia. Table VII-1 presents information on the SSLP pipe operations of the responding producers and exporters in Czechia.
Table VII-1 SSLP pipe: Summary data for producers in Czechia, 2020
Firm
Production (short tons)
Share of reported
production (percent)
Exports to the United States (short tons)
Share of reported
exports to the United
States (percent)
Total shipments
(short tons)
Share of firm's total
shipments exported to the United States
(percent) Liberty Ostrava *** *** *** *** *** *** Trinecke
Zelezarny *** *** *** *** *** *** Valcovny *** *** *** *** *** ***
All firms *** *** *** *** *** *** Source: Compiled from data submitted in response to Commission questionnaires.
Changes in operations
As presented in table VII-2 producers in Czechia reported several operational and organizational changes since January 1, 2018.
3 These firms were identified through a review of information submitted in the petition and contained in *** records.

VII-4
Table VII-2 SSLP pipe: Czechia producers' reported changes in operations, since January 1, 2018
Item / Firm Reported changes in operations Consolidations: *** ***
Source: Compiled from data submitted in response to Commission questionnaires.
Operations on SSLP pipe
Table VII-3 presents information on the SSLP pipe operations of the responding producers and exporters in Czechia during 2019-20 and projections for 2021 and 2022. Between 2018 and 2020, the capacity of producers in Czechia contracted *** percent and is projected to remain flat in 2021 and 2022. Beginning in 2018, overall production fell by *** percent to *** short tons in 2020, and is expected to continue fall to *** short tons in 2021 and 2022. Consequently, capacity utilization decreased from *** percent in 2018 to *** percent in 2020 and is anticipated to be *** percent in 2021 and 2022.
Total shipments of SSLP pipe from producers in Czechia decreased overall by *** percent to *** short tons from 2018 to 2020. This is mainly driven by the *** short ton (*** percent) decrease in SSLP pipe export shipments to the United States during 2018-20, and to a lesser extent the *** short tons (*** percent) decrease in export shipments to all other markets during that same time. Exports constituted *** percent of shipments during 2018-20, with exports to the United States constituting *** percent in 2018 and 2019 then *** percent in 2020. Principal export markets of responding firms included ***. In 2021, Czechian firms predict a *** percent decrease in total shipments and *** percent decrease in shipments to the United States, with similar levels of production and shipments to the U.S. market in 2022.
Of exports of SSLP pipe to the United States, *** percent were pipe with outer diameters less than or equal to 10 inches in 2020, with *** percent of these exports ***. The remaining exports of SSLP pipe, *** percent in 2020, were SSLP pipe with outer diameter greater than 10 inches and less than 16 inches.

VII-5
Table VII-3 SSLP pipe: Data on industry in Czechia, 2018-20 and projection calendar years 2021 and 2022
Item
Actual experience Projections Calendar year Calendar year
2018 2019 2020 2021 2022 Quantity (short tons) Capacity *** *** *** *** *** Production *** *** *** *** *** End-of-period inventories *** *** *** *** *** Shipments: Home market shipments: Internal consumption/ transfers *** *** *** *** ***
Commercial home market shipments *** *** *** *** *** Total home market shipments *** *** *** *** ***
Export shipments to: United States *** *** *** *** ***
All other markets *** *** *** *** *** Total exports *** *** *** *** ***
Total shipments *** *** *** *** *** Ratios and shares (percent) Capacity utilization *** *** *** *** *** Inventories/production *** *** *** *** *** Inventories/total shipments *** *** *** *** *** Shipments: Home market shipments: Internal consumption/ transfers *** *** *** *** ***
Commercial home market shipments *** *** *** *** *** Total home market shipments *** *** *** *** ***
Export shipments to: United States *** *** *** *** ***
All other markets *** *** *** *** *** Total exports *** *** *** *** ***
Total shipments *** *** *** *** *** Note.--Shares and ratios shown as "0.0" represent values greater than zero, but less than "0.05" percent. Source: Compiled from data submitted in response to Commission questionnaires.
Alternative products
As shown in table VII-4, responding Czechia firms produced other products on the same equipment and machinery used to produce SSLP pipe. SSLP pipe as a share of production fell over the period, from *** percent in 2018 to *** percent in 2020. Oil country tubular goods constituted *** percent of total production in 2020, down from *** percent in 2018. The remaining out-of-scope production on the same equipment as SSLP pipe was *** percent of production in 2020, up from *** percent in 2018 and included ***.

VII-6
Table VII-4 SSLP pipe: Overall capacity and production on the same equipment as in-scope production by producers in Czechia, 2018-20
Item Calendar year
2018 2019 2020 Quantity (short tons) Overall capacity *** *** *** Production: SSLP pipe *** *** ***
Out-of-scope production: SSLP pipe, outside diameter larger than 16 inches *** *** ***
Oil country tubular goods *** *** *** Other products *** *** ***
Total out-of-scope production *** *** *** Total production on same machinery *** *** ***
Ratios and shares (percent) Overall capacity utilization *** *** *** Share of production: SSLP pipe *** *** ***
Out-of-scope production: SSLP pipe, outside diameter larger than 16 inches *** *** ***
Oil country tubular goods *** *** *** Other products *** *** ***
Total out-of-scope production *** *** *** Total production on same machinery *** *** ***
Source: Compiled from data submitted in response to Commission questionnaires.
Exports
According to GTA, the leading export markets for SSLP pipe from Czechia are Germany, the United States, and Italy (table VII-5). During 2019, Germany was the top export market for SSLP pipe from Czechia, accounting for 23.6 percent in quantity terms, followed by the United States and Italy, accounting for 13.3 percent and 13.2 percent, respectively.

VII-7
Table VII-5 Seamless tube and pipe: Czechia exports by destination market, 2017-19
Destination market Calendar year
2017 2018 2019 Quantity (short tons) United States 34,195 50,470 32,970 Germany 70,762 60,359 58,513 Italy 36,600 36,905 32,617 Poland 29,867 36,277 29,308 Slovakia 11,018 11,877 12,225 Netherlands 9,278 10,609 8,763 Hungary 10,064 9,761 7,395 France 9,937 8,428 7,234 United Kingdom 9,604 9,405 7,157 All other destination markets 60,823 55,836 51,485
All destination markets 282,149 289,929 247,668 Value (1,000 dollars) United States 28,255 50,776 29,999 Germany 62,689 68,950 60,640 Italy 32,195 41,593 34,013 Poland 27,838 40,586 30,166 Slovakia 17,277 20,653 18,913 Netherlands 8,593 12,423 9,607 Hungary 8,217 10,537 7,565 France 8,868 9,307 7,205 United Kingdom 9,099 10,900 7,540 All other destination markets 57,929 63,822 56,601
All destination markets 260,961 329,547 262,248 Table continued.

VII-8
Table VII-5--Continued Seamless tube and pipe: Czechia exports by destination market, 2017-19
Destination market Calendar year
2017 2018 2019 Unit value (dollars per short ton) United States 826 1,006 910 Germany 886 1,142 1,036 Italy 880 1,127 1,043 Poland 932 1,119 1,029 Slovakia 1,568 1,739 1,547 Netherlands 926 1,171 1,096 Hungary 816 1,079 1,023 France 892 1,104 996 United Kingdom 947 1,159 1,053 All other destination markets 952 1,143 1,099
All destination markets 925 1,137 1,059 Share of quantity (percent) United States 12.1 17.4 13.3 Germany 25.1 20.8 23.6 Italy 13.0 12.7 13.2 Poland 10.6 12.5 11.8 Slovakia 3.9 4.1 4.9 Netherlands 3.3 3.7 3.5 Hungary 3.6 3.4 3.0 France 3.5 2.9 2.9 United Kingdom 3.4 3.2 2.9 All other destination markets 21.6 19.3 20.8
All destination markets 100.0 100.0 100.0 Note.-- Data are presented for 2017 through 2019 due to data availability. United States is shown at the top, all remaining top export destinations shown in descending order of 2019 data.
Source: Official exports statistics under HS subheadings 7304.19, 7304.31, 7304.39, 7304.51, and 7304.59 as reported by Eurostat in the Global Trade Atlas database, accessed February 5, 2020.
The industry in Korea
The Commission issued foreign producers’ or exporters’ questionnaires to four firms believed to produce and/or export SSLP pipe from Korea.4 The Commission received no responses.
4 These firms were identified through a review of information submitted in the petition and contained in *** records.
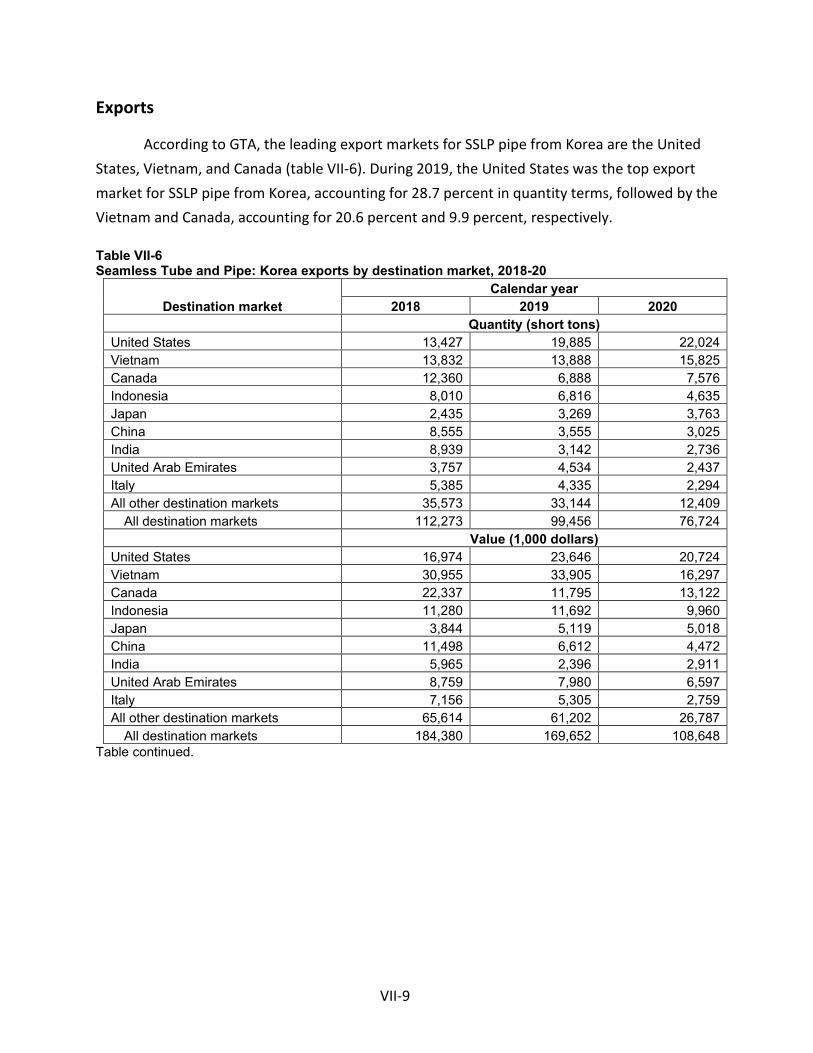
VII-9
Exports
According to GTA, the leading export markets for SSLP pipe from Korea are the United States, Vietnam, and Canada (table VII-6). During 2019, the United States was the top export market for SSLP pipe from Korea, accounting for 28.7 percent in quantity terms, followed by the Vietnam and Canada, accounting for 20.6 percent and 9.9 percent, respectively.
Table VII-6 Seamless Tube and Pipe: Korea exports by destination market, 2018-20
Destination market Calendar year
2018 2019 2020 Quantity (short tons) United States 13,427 19,885 22,024 Vietnam 13,832 13,888 15,825 Canada 12,360 6,888 7,576 Indonesia 8,010 6,816 4,635 Japan 2,435 3,269 3,763 China 8,555 3,555 3,025 India 8,939 3,142 2,736 United Arab Emirates 3,757 4,534 2,437 Italy 5,385 4,335 2,294 All other destination markets 35,573 33,144 12,409
All destination markets 112,273 99,456 76,724 Value (1,000 dollars) United States 16,974 23,646 20,724 Vietnam 30,955 33,905 16,297 Canada 22,337 11,795 13,122 Indonesia 11,280 11,692 9,960 Japan 3,844 5,119 5,018 China 11,498 6,612 4,472 India 5,965 2,396 2,911 United Arab Emirates 8,759 7,980 6,597 Italy 7,156 5,305 2,759 All other destination markets 65,614 61,202 26,787
All destination markets 184,380 169,652 108,648 Table continued.

VII-10
Table VII-6--Continued Seamless Tube and Pipe: Korea exports by destination market, 2018-20
Destination market Calendar year
2018 2019 2020 Unit value (dollars per short ton) United States 1,264 1,189 941 Vietnam 2,238 2,441 1,030 Canada 1,807 1,712 1,732 Indonesia 1,408 1,715 2,149 Japan 1,579 1,566 1,333 China 1,344 1,860 1,479 India 667 763 1,064 United Arab Emirates 2,332 1,760 2,707 Italy 1,329 1,224 1,203 All other destination markets 1,844 1,847 2,159
All destination markets 1,642 1,706 1,416 Share of quantity (percent) United States 12.0 20.0 28.7 Vietnam 12.3 14.0 20.6 Canada 11.0 6.9 9.9 Indonesia 7.1 6.9 6.0 Japan 2.2 3.3 4.9 China 7.6 3.6 3.9 India 8.0 3.2 3.6 United Arab Emirates 3.3 4.6 3.2 Italy 4.8 4.4 3.0 All other destination markets 31.7 33.3 16.2
All destination markets 100.0 100.0 100.0 Note.--United States is shown at the top, all remaining top export destinations shown in descending order of 2020 data.
Source: Official exports statistics under HS subheadings 7304.19, 7304.31, 7304.39, 7304.51, and 7304.59 as reported by Korea Customs and Trade Development Institution in the Global Trade Atlas database, accessed February 5, 2020.
The industry in Russia
The Commission issued foreign producers’ or exporters’ questionnaires to two firms believed to produce and/or export SSLP pipe from Russia.5 Usable responses to the Commission’s questionnaire were received from both firms: ChelPipe and the TMK Group. These firms’ exports to the United States accounted for approximately *** percent of U.S. imports of SSLP pipe from Russia in 2020. According to estimates requested of the responding
5 These firms were identified through a review of information submitted in the petition and contained in *** records.

VII-11
Russian producers, the production of SSLP pipe in Russia reported in questionnaires accounts for *** of overall production of SSLP pipe in Russia. Table VII-7 presents information on the SSLP pipe operations of the responding producers and exporters in Russia.
Table VII-7 SSLP pipe: Summary data for producers in Russia, 2020
Firm
Production (short tons)
Share of reported
production (percent)
Exports to the United States (short tons)
Share of reported
exports to the United
States (percent)
Total shipments
(short tons)
Share of firm's total
shipments exported to the United States
(percent) PJSC Chelpipe *** *** *** *** *** *** TMK Group *** *** *** *** *** ***
All firms *** *** *** *** *** *** Note.--Shares and ratios shown as "0.0" represent values greater than zero, but less than "0.05" percent.
Source: Compiled from data submitted in response to Commission questionnaires.
Changes in operations
As presented in table VII-8 producers in Russia reported several operational and organizational changes since January 1, 2018.
Table VII-8 SSLP pipe: Reported changes in operations by producers in Russia, since January 1, 2018
Item / Firm Reported changed in operations Consolidations: *** *** Revised labor agreements: *** *** Other: *** *** *** ***
Source: Compiled from data submitted in response to Commission questionnaires.

VII-12
Operations on SSLP pipe
Table VII-9 presents information on the SSLP pipe operations of the responding producers and exporters in Russia from 2018 to 2020, and projections for 2021 and 2022.
Table VII-9 SSLP pipe: Data on industry in Russia, 2018-20 and projection calendar years 2021 and 2022
Item
Actual experience Projections Calendar year Calendar year
2018 2019 2020 2021 2022 Quantity (short tons) Capacity *** *** *** *** *** Production *** *** *** *** *** End-of-period inventories *** *** *** *** *** Shipments: Home market shipments: Internal consumption/ transfers *** *** *** *** ***
Commercial home market shipments *** *** *** *** *** Total home market shipments *** *** *** *** *** Export shipments to:
United States *** *** *** *** *** All other markets *** *** *** *** ***
Total exports *** *** *** *** *** Total shipments *** *** *** *** ***
Ratios and shares (percent) Capacity utilization *** *** *** *** *** Inventories/production *** *** *** *** *** Inventories/total shipments *** *** *** *** *** Shipments: Home market shipments: Internal consumption/ transfers *** *** *** *** ***
Commercial home market shipments *** *** *** *** *** Total home market shipments *** *** *** *** *** Export shipments to:
United States *** *** *** *** *** All other markets *** *** *** *** ***
Total exports *** *** *** *** *** Total shipments *** *** *** *** ***
Source: Compiled from data submitted in response to Commission questionnaires.

VII-13
During 2018-20, the capacity of Russian producers of SSLP pipe was stable and those producers projected that capacity would remain flat in 2021 and 2022.6 Coupled with a *** percent decrease in overall production between 2018 and 2020, capacity utilization decreased from *** percent in 2018 to *** percent in 2020. By 2022, Russian producers expect capacity utilization to return to *** percent due to more SSLP pipe production in 2021 (*** more short tons) and in 2022 (*** more short tons).
From 2018, total shipments of SSLP pipe from producers in Russia decreased by *** percent to *** short tons in 2020. The principal contributor to this trend is the *** shorts ton (*** percent) decrease in internal consumption/transfers, followed by a *** short ton (*** percent) decrease in commercial home market shipments. The *** of shipments are to Russia’s home market with *** percent of shipments to the Russian market in 2020. Since 2018, exports to the United States *** decreased to *** short tons (down *** percent) in 2020, though only comprising less than *** percent of total shipments throughout the period. For the remaining *** percent of SSLP pipe shipments, firms reported *** as destination markets. In 2021 and 2022, Russian producers project ***.
The outer diameter of exports of SSLP pipe to the United States from Russia were *** in 2020. Pipe with outer diameter greater than 14 inches and less than or equal to 16 inches comprised the majority of exports to the United States in 2020 (*** percent) followed by pipe with outer diameters between 6 and 8 inches which was *** percent of these exports. The remaining *** percent of exports of SSLP pipe in 2020, were *** SSLP pipe with outer diameters between 8 and 10 inches and between 10 and 12 inches.
Alternative products
As shown in table VII-10, responding Russia firms produced other products on the same equipment and machinery used to produce SSLP pipe. SSLP pipe as a share of production decreased from *** percent in 2018 to *** percent in 2020. Oil country tubular goods comprised over *** percent of production throughout 2018-20, while SSLP pipe with diameters larger than 16 inches constituted less than *** percent of total production during that time.
6 ***. *** foreign producers’/exporters’ questionnaire response, section II-8.

VII-14
Since 2018, the total out-of-scope production on the same machinery increased by *** percentage points to *** percent of production in 2020, and includes ***.
Table VII-10 SSLP pipe: Overall capacity and production on the same equipment as in-scope production by producers in Russia, 2018-20
Item Calendar year
2018 2019 2020 Quantity (short tons) Overall capacity *** *** *** Production: SSLP pipe *** *** ***
Out-of-scope production: SSLP pipe, outside diameter larger than 16
inches *** *** *** Oil country tubular goods *** *** *** Other products *** *** ***
Total out-of-scope production *** *** *** Total production on same machinery *** *** ***
Ratios and shares (percent) Overall capacity utilization *** *** *** Share of production: SSLP pipe *** *** ***
Out-of-scope production: SSLP pipe, outside diameter larger than 16
inches *** *** *** Oil country tubular goods *** *** *** Other products *** *** ***
Total out-of-scope production *** *** *** Total production on same machinery *** *** ***
Source: Compiled from data submitted in response to Commission questionnaires.
Exports
According to GTA, the leading export markets for SSLP pipe from Russia are Kazakhstan, the United States, and Belarus (table VII-11). During 2019, Kazakhstan was the top export market for SSLP pipe from Russia, accounting for 23.5 percent in quantity terms, followed by the United States and Belarus, accounting for 20.8 percent and 12.9 percent, respectively.

VII-15
Table VII-11 Seamless tube and pipe: Russia exports by destination market, 2017-19
Destination market Calendar year
2017 2018 2019 Quantity (short tons) United States 34,525 41,172 61,294 Kazakhstan 76,001 109,884 69,336 Belarus 53,236 49,034 38,120 Uzbekistan 7,488 31,732 29,253 Egypt 6,186 35,794 23,657 Azerbaijan 3,136 8,190 12,462 India 14,398 1,285 9,769 Ukraine 12,576 15,008 8,319 Iraq --- 91 8,257 All other destination markets 90,182 108,981 34,552
All destination markets 297,730 401,173 295,019 Value (1,000 dollars) United States 28,860 38,170 53,237 Kazakhstan 66,843 100,201 83,336 Belarus 56,516 55,465 41,131 Uzbekistan 9,125 33,590 32,209 Egypt 3,021 28,202 16,398 Azerbaijan 2,706 7,307 11,003 India 8,778 4,013 21,978 Ukraine 12,921 15,548 9,713 Iraq --- 201 9,446 All other destination markets 47,190 81,665 32,269
All destination markets 235,961 364,360 310,719 Table continued.

VII-16
Table VII-11--Continued Seamless tube and pipe: Russia exports by destination market, 2017-19
Destination market Calendar year
2017 2018 2019 Unit value (dollars per short ton) United States 836 927 869 Kazakhstan 880 912 1,202 Belarus 1,062 1,131 1,079 Uzbekistan 1,219 1,059 1,101 Egypt 488 788 693 Azerbaijan 863 892 883 India 610 3,122 2,250 Ukraine 1,027 1,036 1,168 Iraq --- 2,196 1,144 All other destination markets 523 749 934
All destination markets 793 908 1,053 Share of quantity (percent) United States 11.6 10.3 20.8 Kazakhstan 25.5 27.4 23.5 Belarus 17.9 12.2 12.9 Uzbekistan 2.5 7.9 9.9 Egypt 2.1 8.9 8.0 Azerbaijan 1.1 2.0 4.2 India 4.8 0.3 3.3 Ukraine 4.2 3.7 2.8 Iraq --- 0.0 2.8 All other destination markets 30.3 27.2 11.7
All destination markets 100.0 100.0 100.0 Note.-- Shares and ratios shown as "0.0" represent values greater than zero, but less than "0.05" percent. Data are presented for 2017 through 2019 due to data availability. United States is shown at the top, all remaining top export destinations shown in descending order of 2019 data. Source: Official exports statistics under HS subheadings 7304.19, 7304.31, 7304.39, 7304.51, and 7304.59 as reported by Customs Committee of Russia in the Global Trade Atlas database, accessed February 5, 2020.
The industry in Ukraine
The Commission issued foreign producers’ or exporters’ questionnaires to one firm believed to produce and/or export SSLP pipe from Ukraine.7 The Commission received a usable questionnaire from Interpipe Ukraine. This firm’s exports to the United States accounted for
7 This firm was identified through a review of information submitted in the petition and contained in
*** records.

VII-17
approximately *** percent of U.S. imports of SSLP pipe from Ukraine in 2020.8 According to estimates requested of the responding producer (Interpipe Ukraine), its production of SSLP pipe in Ukraine reported in questionnaires accounts for *** of overall production of SSLP pipe in Ukraine in 2020. Table VII-12 presents information on the SSLP pipe operations of Interpipe Ukraine.
Table VII-12 SSLP pipe: Summary data for Interpipe Ukraine, 2020
Firm
Production (short tons)
Share of reported
production (percent)
Exports to the United States (short tons)
Share of reported
exports to the United
States (percent)
Total shipments
(short tons)
Share of firm's total shipments exported to the United States
(percent) Interpipe Ukraine *** *** *** *** *** ***
All firms *** *** *** *** *** *** Source: Compiled from data submitted in response to Commission questionnaires.
Changes in operations
As presented in table VII-13, Interpipe Ukraine reported several operational and organizational changes since January 1, 2018.
Table VII-13 SSLP pipe: Interpipe Ukraine’s reported changes in operations, since January 1, 2018
Item / Firm Reported changes in operations Other: *** ***
Source: Compiled from data submitted in response to Commission questionnaires.
8 “Ukraine has temporarily lost control over the steel plants and enterprises of related industries located in the certain areas of the Donetsk and Luhansk regions, such as Alchevsk Iron & Steel Works, Donetsk metallurgical plant, Enakiieve Iron & Steel Works and its Makiivka Branch, Khartsyzsk pipe plant, Yenakiieve Coke, Komsomolske Flux, Krasnodon Coal, Donetsk Coke and others. Accordingly, steelmaking capacity of Ukraine decreased from 42.5 million tons in 2013 to 28.3 million tons in 2019.” Ministry for Development of Economy, Trade, and Agriculture of Ukraine, p. 4.

VII-18
Operations on SSLP pipe
Table VII-14 presents information on the SSLP pipe operations of Interpipe Ukraine during 2018-20 and projections for 2021 and 2022. From 2018 to 2020, Interpipe Ukraine’s capacity remained constant and is projected to stay the same in 2021 and 2022.9 Overall production fluctuated during 2018-20, decreasing from *** short tons in 2018 to *** short tons in 2019 before increasing to *** short tons in 2019, for an overall *** percent decrease. Together, capacity utilization decreased *** from *** percent in 2018 to *** percent in 2020, after a period low of *** percent in 2019. Interpipe Ukraine projects production to increase *** by *** short tons in 2021 and *** short tons in 2022. As a result, Interpipe Ukraine anticipates capacity utilization to *** to *** percent in 2021 and *** percent in 2022.
Between 2018 and 2020, total shipments of Interpipe Ukraine experienced a *** decrease overall (*** percent), with a moderate (*** percent) increase between 2019 and 2020. This end of period (2019-20) increase in Ukrainian SSLP pipe shipments was due to a *** short ton (*** percent) increase in exports to all other markets. During 2018-20, shipments of SSLP pipe to the commercial Ukrainian market and exports to the United States fell the most, by *** percent (*** short tons) and *** percent (*** short tons), respectively. As other shipment categories decreased relative to total shipments over the period, exports to other markets as a share of total shipments increased from *** percent in 2018 to *** percent in 2020. Destinations of these exports include ***. Looking forward, Interpipe Ukraine expects total shipments to increase *** short tons in 2021 and *** short tons in 2022, through increased commercial home market shipments and exports to all other markets.
In 2020, the outer diameter of exports of SSLP pipe to the United States from Ukraine were ***. The ranges with the most exports of SSLP pipe to the United States were outer diameters between 2 and 4 inches (*** percent) and 8 and 10 inches (*** percent). Conversely, the ranges with the least exports of SSLP pipe to the United States in 2020 were pipe with outer diameters less than 2 inches (*** percent) and between 14 and 16 inches (*** percent).
9 In discussing Interpipe Ukraine’s *** overall production capacity ***, Respondent Interpipe notes that “{r}ather, Interpipe is faced with the opposite scenario – it anticipates *** as a result of COVID-19 and decreased demand in the oil and gas sector.” Respondent Interpipe’s postconference brief, p. 44.

VII-19
Table VII-14 SSLP pipe: Data on industry in Ukraine, 2018-20 and projection calendar years 2021 and 2022
Item
Actual experience Projections Calendar year Calendar year
2018 2019 2020 2021 2022 Quantity (short tons) Capacity *** *** *** *** *** Production *** *** *** *** *** End-of-period inventories *** *** *** *** *** Shipments: Home market shipments: Internal consumption/ transfers *** *** *** *** ***
Commercial home market shipments *** *** *** *** ***
Total home market shipments *** *** *** *** *** Export shipments to:
United States *** *** *** *** *** All other markets *** *** *** *** ***
Total exports *** *** *** *** *** Total shipments *** *** *** *** ***
Ratios and shares (percent) Capacity utilization *** *** *** *** *** Inventories/production *** *** *** *** *** Inventories/total shipments *** *** *** *** *** Share of shipments: Home market shipments: Internal consumption/ transfers *** *** *** *** ***
Commercial home market shipments *** *** *** *** ***
Total home market shipments *** *** *** *** *** Export shipments to:
United States *** *** *** *** *** All other markets *** *** *** *** ***
Total exports *** *** *** *** *** Total shipments *** *** *** *** ***
Source: Compiled from data submitted in response to Commission questionnaires.
Alternative products
***.

VII-20
Table VII-15 SSLP pipe: Overall capacity and production on the same equipment as in-scope production by producers in Ukraine, 2018-20
Item Calendar year
2018 2019 2020 Quantity (short tons) Overall capacity *** *** *** Production: SSLP pipe *** *** ***
Out-of-scope production: SSLP pipe, outside diameter larger than 16 inches *** *** *** Oil country tubular goods *** *** *** Other products *** *** ***
Total out-of-scope production *** *** *** Total production on same machinery *** *** ***
Ratios and shares (percent) Overall capacity utilization *** *** *** Share of production: SSLP pipe *** *** ***
Out-of-scope production: SSLP pipe, outside diameter larger than 16 inches *** *** *** Oil country tubular goods *** *** *** Other products *** *** ***
Total out-of-scope production *** *** *** Total production on same machinery *** *** ***
Source: Compiled from data submitted in response to Commission questionnaires.
Exports
According to GTA, the leading export markets for SSLP pipe from Ukraine are the United States, Poland, Turkey, and Italy (table VII-16). During 2019, the United States was the top export market for SSLP pipe from Ukraine, accounting for 15.8 percent, followed by the Poland (8.6 percent), Turkey (8.2 percent) and Italy (7.8 percent).
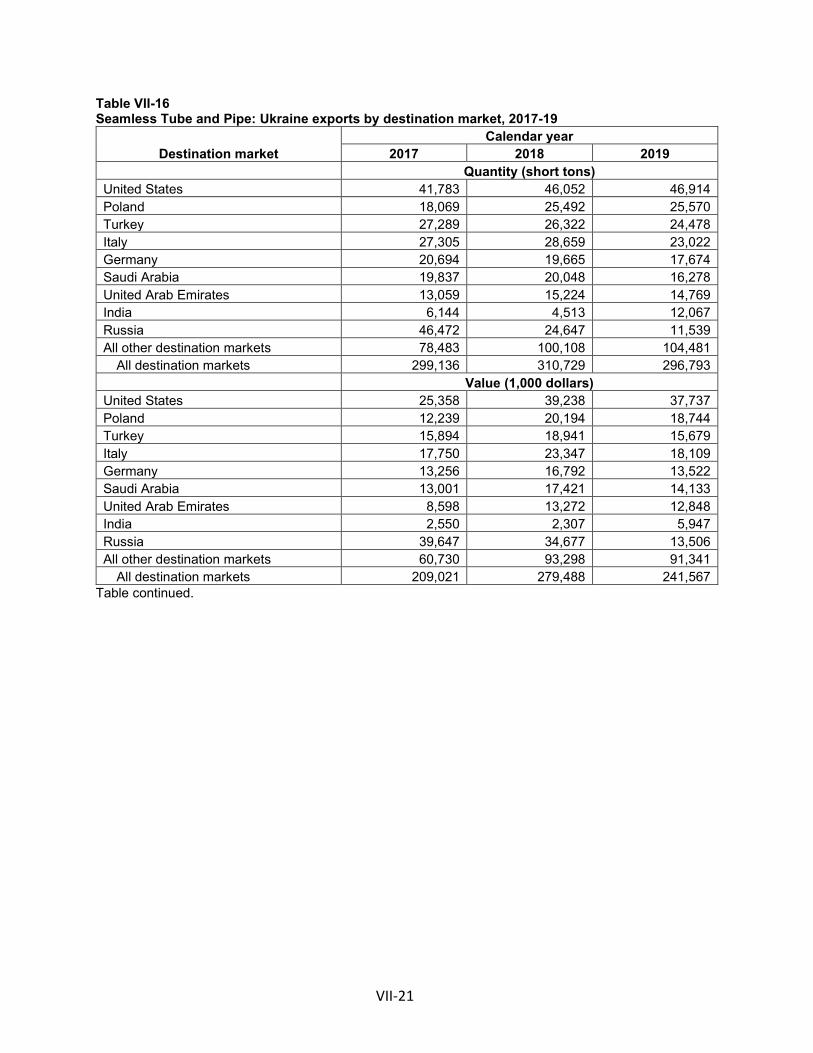
VII-21
Table VII-16 Seamless Tube and Pipe: Ukraine exports by destination market, 2017-19
Destination market Calendar year
2017 2018 2019 Quantity (short tons) United States 41,783 46,052 46,914 Poland 18,069 25,492 25,570 Turkey 27,289 26,322 24,478 Italy 27,305 28,659 23,022 Germany 20,694 19,665 17,674 Saudi Arabia 19,837 20,048 16,278 United Arab Emirates 13,059 15,224 14,769 India 6,144 4,513 12,067 Russia 46,472 24,647 11,539 All other destination markets 78,483 100,108 104,481
All destination markets 299,136 310,729 296,793 Value (1,000 dollars) United States 25,358 39,238 37,737 Poland 12,239 20,194 18,744 Turkey 15,894 18,941 15,679 Italy 17,750 23,347 18,109 Germany 13,256 16,792 13,522 Saudi Arabia 13,001 17,421 14,133 United Arab Emirates 8,598 13,272 12,848 India 2,550 2,307 5,947 Russia 39,647 34,677 13,506 All other destination markets 60,730 93,298 91,341
All destination markets 209,021 279,488 241,567 Table continued.
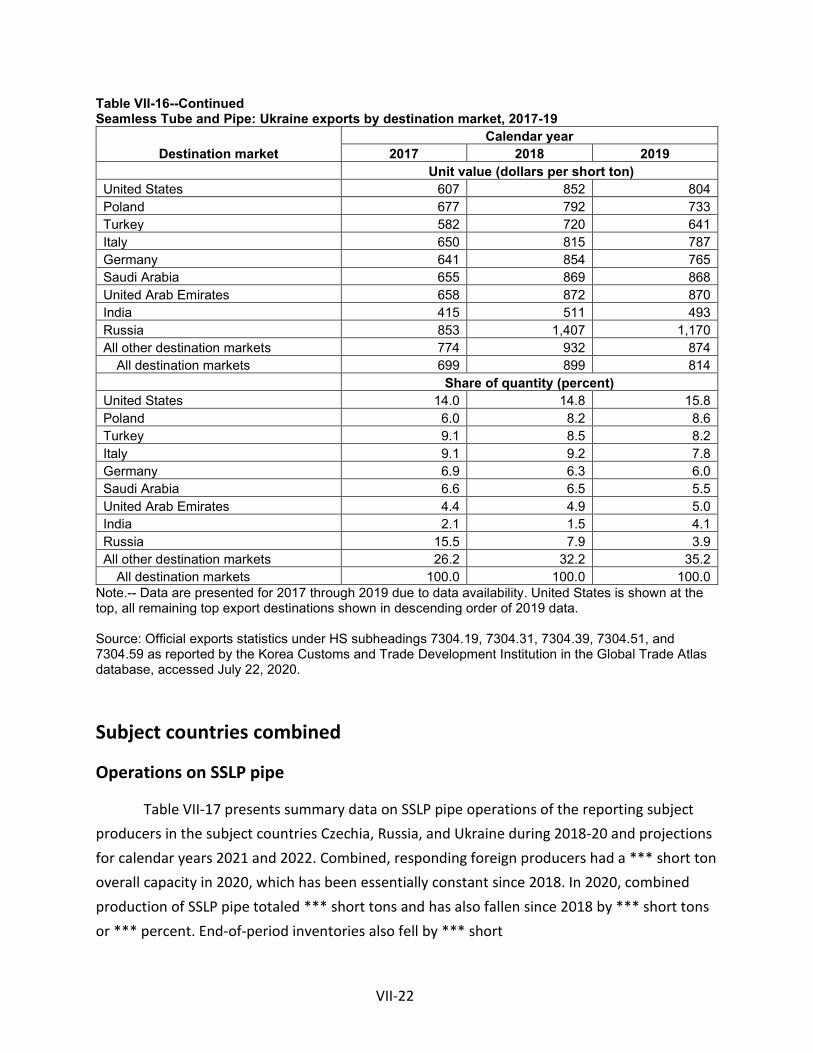
VII-22
Table VII-16--Continued Seamless Tube and Pipe: Ukraine exports by destination market, 2017-19
Destination market Calendar year
2017 2018 2019 Unit value (dollars per short ton) United States 607 852 804 Poland 677 792 733 Turkey 582 720 641 Italy 650 815 787 Germany 641 854 765 Saudi Arabia 655 869 868 United Arab Emirates 658 872 870 India 415 511 493 Russia 853 1,407 1,170 All other destination markets 774 932 874
All destination markets 699 899 814 Share of quantity (percent) United States 14.0 14.8 15.8 Poland 6.0 8.2 8.6 Turkey 9.1 8.5 8.2 Italy 9.1 9.2 7.8 Germany 6.9 6.3 6.0 Saudi Arabia 6.6 6.5 5.5 United Arab Emirates 4.4 4.9 5.0 India 2.1 1.5 4.1 Russia 15.5 7.9 3.9 All other destination markets 26.2 32.2 35.2
All destination markets 100.0 100.0 100.0 Note.-- Data are presented for 2017 through 2019 due to data availability. United States is shown at the top, all remaining top export destinations shown in descending order of 2019 data. Source: Official exports statistics under HS subheadings 7304.19, 7304.31, 7304.39, 7304.51, and 7304.59 as reported by the Korea Customs and Trade Development Institution in the Global Trade Atlas database, accessed July 22, 2020.
Subject countries combined
Operations on SSLP pipe
Table VII-17 presents summary data on SSLP pipe operations of the reporting subject producers in the subject countries Czechia, Russia, and Ukraine during 2018-20 and projections for calendar years 2021 and 2022. Combined, responding foreign producers had a *** short ton overall capacity in 2020, which has been essentially constant since 2018. In 2020, combined production of SSLP pipe totaled *** short tons and has also fallen since 2018 by *** short tons or *** percent. End-of-period inventories also fell by *** short

VII-23
tons or *** percent between 2018 and 2020, mainly driven by the *** short ton decrease in Russian producers’ end-of-period inventories which accounted for *** percent of the decline. Considering subject producers’ capacity and production, combined capacity utilization decreased from *** percent in 2018 to *** percent in 2020. Responding foreign producers project capacity utilization to reach *** percent in 2021 and *** percent in 2022, due to anticipated increases in SSLP pipe production.
Table VII-17 SSLP pipe: Data on industry in subject sources, 2018-20 and projection calendar years 2021 and 2022
Item
Actual experience Projections Calendar year Calendar year
2018 2019 2020 2021 2022 Quantity (short tons) Capacity *** *** *** *** *** Production *** *** *** *** *** End-of-period inventories *** *** *** *** *** Shipments: Home market shipments: Internal consumption/ transfers *** *** *** *** ***
Commercial home market shipments *** *** *** *** *** Total home market shipments *** *** *** *** *** Export shipments to:
United States *** *** *** *** *** All other markets *** *** *** *** ***
Total exports *** *** *** *** *** Total shipments *** *** *** *** ***
Ratios and shares (percent) Capacity utilization *** *** *** *** *** Inventories/production *** *** *** *** *** Inventories/total shipments *** *** *** *** *** Share of shipments: Home market shipments: Internal consumption/ transfers *** *** *** *** ***
Commercial home market shipments *** *** *** *** *** Total home market shipments *** *** *** *** *** Export shipments to:
United States *** *** *** *** *** All other markets *** *** *** *** ***
Total exports *** *** *** *** *** Total shipments *** *** *** *** ***
Source: Compiled from data submitted in response to Commission questionnaires.

VII-24
Table VII-18 SSLP pipe: Data on industry in subject sources less Russia, 2018-20 and projection calendar years 2021 and 2022
Item
Actual experience Projections Calendar year Calendar year
2018 2019 2020 2021 2022 Quantity (short tons) Capacity *** *** *** *** *** Production *** *** *** *** *** End-of-period inventories *** *** *** *** *** Shipments: Home market shipments: Internal consumption/ transfers *** *** *** *** ***
Commercial home market shipments *** *** *** *** ***
Total home market shipments *** *** *** *** *** Export shipments to:
United States *** *** *** *** *** All other markets *** *** *** *** ***
Total exports *** *** *** *** *** Total shipments *** *** *** *** ***
Ratios and shares (percent) Capacity utilization *** *** *** *** *** Inventories/production *** *** *** *** *** Inventories/total shipments *** *** *** *** *** Share of shipments: Home market shipments: Internal consumption/ transfers *** *** *** *** ***
Commercial home market shipments *** *** *** *** ***
Total home market shipments *** *** *** *** *** Export shipments to:
United States *** *** *** *** *** All other markets *** *** *** *** ***
Total exports *** *** *** *** *** Total shipments *** *** *** *** ***
Note.--Shares and ratios shown as "0.0" represent values greater than zero, but less than "0.05" percent. Source: Compiled from data submitted in response to Commission questionnaires.
Combined total shipments of responding foreign producers decreased by *** percent
during 2018-20, from *** short tons in 2018 to *** short tons in 2020. Between 2018 and 2020, decreases in all home market shipments (*** short tons or *** percent) and in exports to all other markets (*** short tons or *** percent) were the primary contributors to this period’s trend. Though ***, combined exports to the United States experienced the *** drop among shipment categories, down *** percent during 2018-20. Furthermore, exports to the United States were a *** share of combined total shipments, ending the period at *** percent, *** percentage points below

VII-25
2018 shares. The majority of combined shipments are to commercial home markets (*** percent in 2020) followed by exports to all other markets (*** percent in 2020) and internal consumption (*** percent in 2020). Projections suggest combined total shipments will recover *** in 2021 and *** in 2022, largely due to increased home market shipments and exports to all other markets.
In 2020, the outer diameter of exports of SSLP pipe to the United States from subject sources combined were slightly more concentrated in specific ranges. The ranges with the most exports of SSLP pipe to the United States were outer diameters between 2 and 4 inches (*** percent), 6 and 8 inches (*** percent), and 8 and 10 inches (*** percent). Conversely, the ranges with the least exports of SSLP pipe to the United States in 2020 were pipe with outer diameters less than 2 inches (*** percent).
Alternative products
Subject foreign producers produced other products on the same equipment and machinery used to produce SSLP pipe (table VII-19). SSLP pipe as a share of combined production remained flat around *** percent during 2018-20. The combined production of oil country tubular goods as a share of total production decreased *** from *** percent in 2018 to *** percent in 2020, after a period high of *** percent in 2019. Other products such as *** accounted for less than *** percent of total production throughout 2018-20.

VII-26
Table VII-19 SSLP pipe: Overall capacity and production on the same equipment as in-scope production by producers in subject sources, 2018-20
Item Calendar year
2018 2019 2020 Quantity (short tons) Overall capacity *** *** *** Production: SSLP pipe *** *** ***
Out-of-scope production: SSLP pipe, outside diameter larger than 16 inches *** *** *** Oil country tubular goods *** *** *** Other products *** *** ***
Total out-of-scope production *** *** *** Total production on same machinery *** *** ***
Ratios and shares (percent) Overall capacity utilization *** *** *** Share of production: SSLP pipe *** *** ***
Out-of-scope production: SSLP pipe, outside diameter larger than 16 inches *** *** *** Oil country tubular goods *** *** *** Other products *** *** ***
Total out-of-scope production *** *** *** Total production on same machinery *** *** ***
Source: Compiled from data submitted in response to Commission questionnaires.
Table VII-20 SSLP pipe: Overall capacity and production on the same equipment as in-scope production by producers in subject sources less Russia, 2018-20
Item Calendar year
2018 2019 2020 Quantity (short tons) Overall capacity *** *** *** Production: SSLP pipe *** *** ***
Out-of-scope production: SSLP pipe, outside diameter larger than 16 inches *** *** ***
Oil country tubular goods *** *** *** Other products *** *** ***
Total out-of-scope production *** *** *** Total production on same machinery *** *** ***
Ratios and shares (percent) Overall capacity utilization *** *** *** Share of production: SSLP pipe *** *** ***
Out-of-scope production: SSLP pipe, outside diameter larger than 16 inches *** *** ***
Oil country tubular goods *** *** *** Other products *** *** ***
Total out-of-scope production *** *** *** Total production on same machinery *** *** ***
Source: Compiled from data submitted in response to Commission questionnaires.

VII-27
U.S. inventories of imported merchandise
Table VII-21 presents data on U.S. importers’ reported inventories of SSLP pipe. *** U.S. inventories from subject sources remained less than *** of U.S. imports, shipments of imports, and total shipments of imports, with a period low in 2019 (*** percent). U.S. inventories as a share of imports, shipments of imports, and total shipments increased between 2019 and 2020, driven by increased inventories of SSLP pipe from Ukraine in 2019 which accounted for *** percent of reported inventories from subject imports in 2020. Conversely, U.S. inventories from nonsubject sources increased irregularly in ratio to U.S. imports and U.S. shipments of imports from *** percent and *** percent in 2018 to *** percent and *** percent in 2020, after a period high in 2019. This pattern is due to *** declines in U.S. inventories of imports from Germany and Mexico relative to total U.S. shipments after period highs in 2019, mitigated in part by annual increases in U.S. inventories of import from all other nonsubject sources relative to U.S. total shipments of imports.

VII-28
Table VII-21 SSLP pipe: U.S. importers’ inventories, 2018-20
Item Calendar year
2018 2019 2020 Inventories (short tons); Ratios (percent)
Imports from Czechia: Inventories *** *** *** Ratio to U.S. imports *** *** *** Ratio to U.S. shipments of imports *** *** *** Ratio to total shipments of imports *** *** *** Imports from Russia: Inventories *** *** *** Ratio to U.S. imports *** *** *** Ratio to U.S. shipments of imports *** *** *** Ratio to total shipments of imports *** *** *** Imports from Ukraine: Inventories *** *** *** Ratio to U.S. imports *** *** *** Ratio to U.S. shipments of imports *** *** *** Ratio to total shipments of imports *** *** *** Imports from subject sources: Inventories *** *** *** Ratio to U.S. imports *** *** *** Ratio to U.S. shipments of imports *** *** *** Ratio to total shipments of imports *** *** ***
Table continued.

VII-29
Table VII-21--Continued SSLP pipe: U.S. importers' end-of-period inventories of imports by source, 2018-20
Item Calendar year
2018 2019 2020 Inventories (short tons); Ratios (percent)
Imports from Germany: Inventories *** *** *** Ratio to U.S. imports *** *** *** Ratio to U.S. shipments of imports *** *** *** Ratio to total shipments of imports *** *** *** Imports from Mexico: Inventories *** *** *** Ratio to U.S. imports *** *** *** Ratio to U.S. shipments of imports *** *** *** Ratio to total shipments of imports *** *** *** Imports from all other sources: Inventories *** *** *** Ratio to U.S. imports *** *** *** Ratio to U.S. shipments of imports *** *** *** Ratio to total shipments of imports *** *** *** Imports from nonsubject sources: Inventories *** *** *** Ratio to U.S. imports *** *** *** Ratio to U.S. shipments of imports *** *** *** Ratio to total shipments of imports *** *** *** Imports from all import sources: Inventories *** *** *** Ratio to U.S. imports *** *** *** Ratio to U.S. shipments of imports *** *** *** Ratio to total shipments of imports *** *** ***
Source: Compiled from data submitted in response to Commission questionnaires.
U.S. importers’ outstanding orders
The Commission requested importers to indicate whether they imported or arranged for the importation of SSLP pipe from Czechia, Korea, Russia, or Ukraine after December 31, 2020 (table VII-22). ***.

VII-30
Table VII-22 SSLP pipe: Arranged imports, January 2021 through December 2021
Item Period
Jan-Mar 2021 Apr-Jun 2021 Jul-Sept 2021 Oct-Dec 2021 Total Quantity (short tons)
Arranged U.S. imports from.-- Ukraine *** *** *** *** ***
Subject sources *** *** *** *** *** Mexico *** *** *** *** *** Germany *** *** *** *** *** All other sources *** *** *** *** ***
Nonsubject sources *** *** *** *** *** All import sources *** *** *** *** ***
Antidumping or countervailing duty orders in third-country markets10
Petitioners and respondents note that various countries have active antidumping orders on certain subject countries in these investigations.11 According to the World Trade Organization’s (“WTO’s”) Antidumping Duty Gateway database, the European Union, Brazil, Mexico, Canada, and the Eurasian Economic Union (Russia, Belarus, Kazakhstan, Armenia, and Kyrgyzstan) have active orders on certain SSLP pipe from Korea, Russia, or Ukraine. Imports of certain seamless pipes and tubes from Russia and Ukraine are subject to antidumping duty measures in the European Union.12 Brazil has active antidumping duty orders on certain seamless carbon steel line pipe for oil and gas pipelines imported under HS subheading 7304.19 from Ukraine.13 Mexico also has active antidumping duty orders on seamless carbon steel tubing from Korea and Ukraine.14 Canada currently has active antidumping duty orders on imports of certain line pipe imported under HS subheading 7604.19 from Korea.15 The Eurasian
10 No countervailing duties in third-country markets were identified in questionnaire responses or by staff research. World Trade Organization, “Subsidies and Countervailing Measures,” https://www.wto.org/english/tratop_e/scm_e/scm_e.htm, retrieved February 9, 2021.
11 Conference transcript, p. 61 (Drake and Schagrin) and p. 95 (Wessel); Vallourec’s postconference brief, pp. 7-8.
12 European Union, “Semi-Annual Report Under Article 16.4 of the Agreement,” G/ADP/N/342/EU, August 6, 2020.
13 Brazil, “Semi-Annual Report Under Article 16.4 of the Agreement,” G/ADP/N/342/BRA, August 18, 2020.
14 Mexico, “Semi-Annual Report Under Article 16.4 of the Agreement,” G/ADP/N/342/MEX, September 18, 2020.
15 Canada Border Services Agency, “Certain Line Pipe 2: Dumping (South Korea),” https://www.cbsa-asfc.gc.ca/sima-lmsi/mif-mev/lp2-eng.html, retrieved January 26, 2021.

VII-31
VII-32
Economic Union has active antidumping duty orders on certain steel pipes and tubes imported from Ukraine.16
In addition to the aforementioned antidumping orders, the European Union has active safeguard measures on imports of certain steel products, including SSLP pipe, imported from all countries.17 The Eurasian Economic Union also has a ban on imports of a variety of products, including tubes and pipes, from Ukraine due to Russia’s economic sanctions on Ukraine.18 ***.19
Information on nonsubject countries
Data on global exports of seamless pipes and tubes are presented in table VII-23. According to GTA, China, Germany, and Italy were the leading exporters of seamless pipes and tubes. During 2019, China accounted for 36.4 percent of global exports, by quantity. Germany and the Italy accounted for 11.8 percent and 6.2 percent of global exports, respectively.
16 Russia, “Semi-Annual Report Under Article 16.4 of the Agreement,” G/ADP/N/342/RUS, October 15, 2020.
17 European Union, “Committee on Safeguards - Notification under Article 12 of the Agreement on Safeguards - European Union - Certain steel products – Supplement,” G/SG/N/10/EU/1/Suppl.7, June 2, 2020.
18 Movchan, “New Russian Bans on Imports From Ukraine,” 4Liberty.eu, August 12, 2019, http://4liberty.eu/new-russian-bans-on-imports-from-ukraine/; Vallourec’s postconference brief at Exhibit 5.
19 ***.

VII-33
Table VII-23 Seamless pipes and tubes: Global exports by destination market, 2017-19
Exporter Calendar year
2017 2018 2019 Quantity (short tons) United States 143,149 130,271 94,061 Czechia 282,149 289,929 247,668 Korea 114,638 112,273 99,456 Russia 297,730 401,173 295,019 Ukraine 299,136 310,729 296,793 China 3,005,713 2,826,140 2,959,565 Germany 1,062,576 1,084,285 959,746 Italy 452,693 543,505 505,201 Romania 414,106 432,784 404,127 Japan 351,837 409,596 349,647 South Africa 69,542 61,436 211,336 Slovakia 203,791 207,750 195,517 All other exporters 1,934,000 2,148,551 1,517,798
All reporting exporters 8,631,060 8,958,422 8,135,935 Value (1,000 dollars) United States 406,661 395,396 271,753 Czechia 260,961 329,547 262,248 Korea 205,128 184,380 169,652 Russia 235,961 364,360 310,719 Ukraine 209,021 279,488 241,567 China 2,454,118 2,757,506 2,761,366 Germany 1,618,626 1,731,257 1,509,361 Italy 639,474 871,889 778,968 Romania 430,633 547,004 479,770 Japan 542,056 586,779 552,329 South Africa 49,760 58,363 37,318 Slovakia 204,973 254,951 222,935 All other exporters 2,697,460 3,196,648 2,462,266
All reporting exporters 9,954,832 11,557,568 10,060,252 Table continued.

VII-34
Table VII-23--Continued Seamless pipes and tubes: Global exports by destination market, 2017-19
Exporter Calendar year
2017 2018 2019 Unit value (dollars per short ton) United States 2,841 3,035 2,889 Czechia 925 1,137 1,059 Korea 1,789 1,642 1,706 Russia 793 908 1,053 Ukraine 699 899 814 China 816 976 933 Germany 1,523 1,597 1,573 Italy 1,413 1,604 1,542 Romania 1,040 1,264 1,187 Japan 1,541 1,433 1,580 South Africa 716 950 177 Slovakia 1,006 1,227 1,140 All other exporters 1,395 1,488 1,622
All reporting exporters 1,153 1,290 1,237 Share of quantity (percent) United States 7.4 1.5 1.2 Czechia 3.3 3.2 3.0 Korea 1.3 1.3 1.2 Russia 3.4 4.5 3.6 Ukraine 3.5 3.5 3.6 China 34.8 31.5 36.4 Germany 12.3 12.1 11.8 Italy 5.2 6.1 6.2 Romania 4.8 4.8 5.0 Japan 4.1 4.6 4.3 South Africa 0.8 0.7 2.6 Slovakia 2.4 2.3 2.4 All other exporters 22.4 24.0 18.7
All reporting exporters 100.0 100.0 100.0 Source: Official exports statistics under HS subheadings 7304.19, 7304.31, 7304.39, 7304.51, and 7304.59 reported by various national statistical authorities in the Global Trade Atlas database, accessed February 5, 2020.

A-1
APPENDIX A
FEDERAL REGISTER NOTICES


A-3
The Commission makes available notices relevant to its investigations and reviews on its website, www.usitc.gov. In addition, the following tabulation presents, in chronological order, Federal Register notices issued by the Commission and Commerce during the current proceeding.
Citation Title Link
85 FR 42431, July 14, 2020
Seamless Carbon and Alloy Steel Standard, Line, and Pressure Pipe (‘‘SSLP Pipe’’) from Czechia, Korea, Russia, and Ukraine; Institution of Antidumping and Countervailing Duty Investigations and Scheduling of Preliminary Phase Investigations
https://www.govinfo.gov/content/pkg/FR-2020-07-14/pdf/2020-15167.pdf
85 FR 47176, August 4, 2020
Seamless Carbon and Alloy Steel Standard, Line, and Pressure Pipe From the Czech Republic, the Republic of Korea, the Russian Federation, and Ukraine: Initiation of Less-Than-Fair-Value Investigations
https://www.govinfo.gov/content/pkg/FR-2020-08-04/pdf/2020-16911.pdf
85 FR 47170, August 4, 2020
Seamless Carbon and Alloy Steel Standard, Line, and Pressure Pipe From the Republic of Korea and the Russian Federation: Initiation of Countervailing Duty Investigations
https://www.govinfo.gov/content/pkg/FR-2020-08-04/pdf/2020-16918.pdf
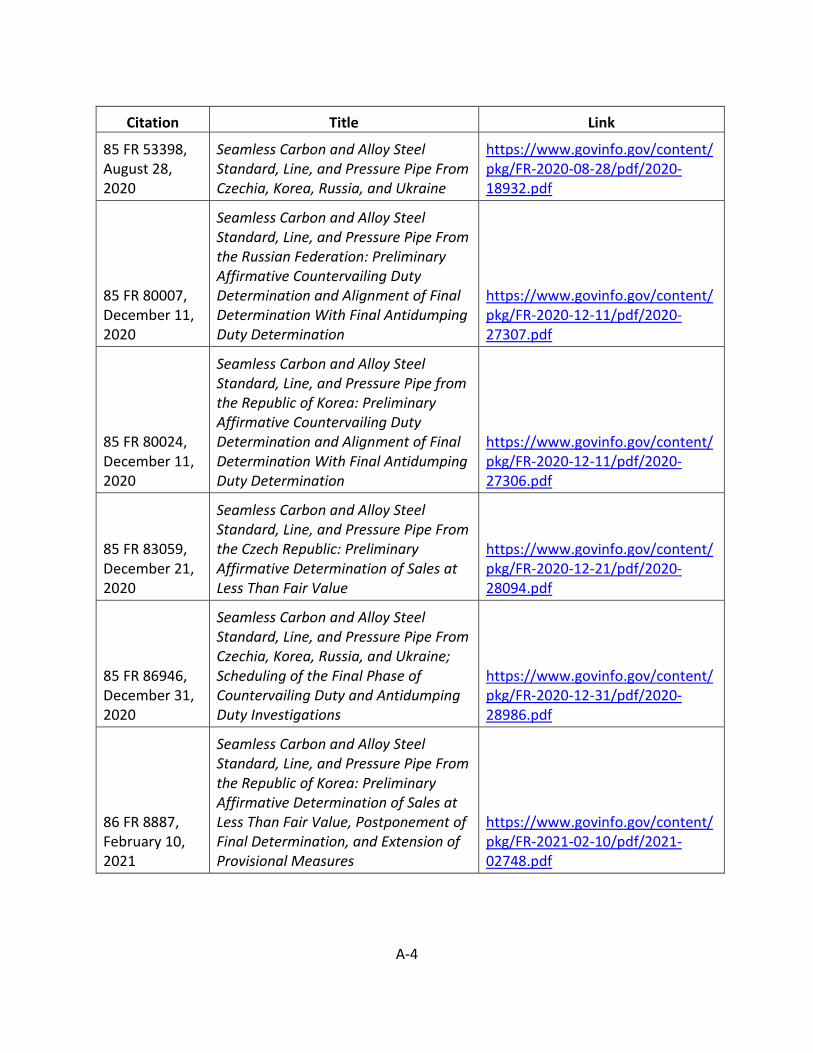
A-4
Citation Title Link
85 FR 53398, August 28, 2020
Seamless Carbon and Alloy Steel Standard, Line, and Pressure Pipe From Czechia, Korea, Russia, and Ukraine
https://www.govinfo.gov/content/pkg/FR-2020-08-28/pdf/2020-18932.pdf
85 FR 80007, December 11, 2020
Seamless Carbon and Alloy Steel Standard, Line, and Pressure Pipe From the Russian Federation: Preliminary Affirmative Countervailing Duty Determination and Alignment of Final Determination With Final Antidumping Duty Determination
https://www.govinfo.gov/content/pkg/FR-2020-12-11/pdf/2020-27307.pdf
85 FR 80024, December 11, 2020
Seamless Carbon and Alloy Steel Standard, Line, and Pressure Pipe from the Republic of Korea: Preliminary Affirmative Countervailing Duty Determination and Alignment of Final Determination With Final Antidumping Duty Determination
https://www.govinfo.gov/content/pkg/FR-2020-12-11/pdf/2020-27306.pdf
85 FR 83059, December 21, 2020
Seamless Carbon and Alloy Steel Standard, Line, and Pressure Pipe From the Czech Republic: Preliminary Affirmative Determination of Sales at Less Than Fair Value
https://www.govinfo.gov/content/pkg/FR-2020-12-21/pdf/2020-28094.pdf
85 FR 86946, December 31, 2020
Seamless Carbon and Alloy Steel Standard, Line, and Pressure Pipe From Czechia, Korea, Russia, and Ukraine; Scheduling of the Final Phase of Countervailing Duty and Antidumping Duty Investigations
https://www.govinfo.gov/content/pkg/FR-2020-12-31/pdf/2020-28986.pdf
86 FR 8887, February 10, 2021
Seamless Carbon and Alloy Steel Standard, Line, and Pressure Pipe From the Republic of Korea: Preliminary Affirmative Determination of Sales at Less Than Fair Value, Postponement of Final Determination, and Extension of Provisional Measures
https://www.govinfo.gov/content/pkg/FR-2021-02-10/pdf/2021-02748.pdf

A-5
Citation Title Link
86 FR 8891, February 10, 2021
Seamless Carbon and Alloy Steel Standard, Line, and Pressure Pipe From the Russian Federation: Preliminary Affirmative Determination of Sales at Less Than Fair Value, Postponement of Final Determination, and Extension of Provisional Measures
https://www.govinfo.gov/content/pkg/FR-2021-02-10/pdf/2021-02749.pdf
86 FR 8889, February 10, 2021
Seamless Carbon and Alloy Steel Standard, Line, and Pressure Pipe From Ukraine: Preliminary Affirmative Determination of Sales at Less Than Fair Value, Postponement of Final Determination, and Extension of Provisional Measures
https://www.govinfo.gov/content/pkg/FR-2021-02-10/pdf/2021-02750.pdf
86 FR 12909, March 5, 2021
Seamless Carbon and Alloy Steel Standard, Line, and Pressure Pipe From the Czech Republic: Final Affirmative Determination of Sales at Less Than Fair Value
https://www.govinfo.gov/content/pkg/FR-2021-03-05/pdf/2021-04567.pdf


APPENDIX B
LIST OF HEARING WITNESSES


CALENDAR OF PUBLIC HEARING
Those listed below appeared in the United States International Trade Commission’s hearing via videoconference:
Subject: Seamless Carbon and Alloy Steel Standard, Line, and Pressure Pipe from Czechia, Korea, Russia, and Ukraine
Inv. Nos.: 701-TA-654-655 and 731-TA-1529-1532 (Final) Date and Time: March 4, 2021 - 9:30 a.m.
CONGRESSIONAL APPEARANCES: The Honorable Tim Ryan, U.S. Representative, 13th District, Ohio The Honorable Frank J. Mrvan, U.S. Representative, 1st District, Indiana FOREIGN MINISTRY APPEARANCE: Department of Foreign Economic Activity and Trade Defense of the Ministry for Development of Economy, Trade and Agriculture of Ukraine Kyiv, Ukraine
Elena Yushchuk, Head of the Defense on Foreign Markets Unit
OPENING REMARKS: Petitioners (Elizabeth J. Drake, Schagrin Associates) Respondents (Jared R. Wessel, Hogan Lovells US LLP; and Daniel J. Cannistra, Crowell & Moring, LLP)

In Support of the Imposition of Antidumping and Countervailing Duty Orders: Schagrin Associates Washington, DC on behalf of Vallourec Star, LP
Bertrand Frischmann, Chairman of the Executive Committee, Vallourec Star, LP
Gary Hauck, Vice President of Marketing, Communications,
Business Development and Innovation, Vallourec USA Corporation
Hector Arevalo, Vice President of Sales for Energy, Industry, and Oil & Gas Mechanicals, Vallourec USA Corporation
Roger B. Schagrin )
) – OF COUNSEL Elizabeth J. Drake )
Cassidy Levy Kent (USA) LLP Washington, DC on behalf of United States Steel Corporation (“U.S. Steel”)
Scott M. Dorn, Interim Head of Tubular Solutions, U.S. Steel
Zachariah Little, Threading Operator, U.S. Steel Tubular Plant; and Union Safety Representative and Member, United Steelworkers Local 1013
Thomas M. Beline )
) – OF COUNSEL Mary Jane Alves )

In Opposition to the Imposition of Antidumping and Countervailing Duty Orders: Hogan Lovells US LLP Washington, DC on behalf of Interpipe North American Interpipe, Inc.
Daniel Valk, President, North American Interpipe, Inc.
Jared R. Wessel ) ) – OF COUNSEL Michael G. Jacobson )
Crowell & Moring, LLP Washington, DC on behalf of TMK Group (“TMK”)
Daniel J. Cannistra ) – OF COUNSEL REBUTTAL/CLOSING REMARKS: Petitioners (Roger B. Schagrin, Schagrin Associates) Respondents (Jared R. Wessel, Hogan Lovells US LLP)
-END-


C-1
APPENDIX C
SUMMARY DATA

Table C-1: SSLP pipe: Summary data concerning the total U.S. market ..................................... C-3
Table C-2: SSLP pipe: Summary data concerning the merchant U.S. market ............................. C-7

Table C-1SSLP pipe: Summary data concerning the U.S. total market, 2018-20
2018 2019 2020 2018-20 2018-19 2019-20
U.S. total market consumption quantity:Amount..................................................... *** *** *** ▼*** ▼*** ▼*** Producers' share (fn1).............................. *** *** *** ▼*** ▼*** ▲*** Importers' share (fn1):
Czechia................................................. *** *** *** ▼*** ▲*** ▼*** Korea..................................................... *** *** *** ▲*** ▲*** ▲*** Russia................................................... *** *** *** ▼*** ▲*** ▼*** Ukraine.................................................. *** *** *** ▲*** ▲*** ▲***
Subject sources................................. *** *** *** ▲*** ▲*** ▲*** Subject sources less Russia............. *** *** *** ▲*** ▲*** ▲***
Germany............................................... *** *** *** ▲*** ▲*** ▲*** Mexico................................................... *** *** *** ▲*** ▼*** ▲*** All other sources................................... *** *** *** ▼*** ▲*** ▼***
Nonsubject sources........................... *** *** *** ▲*** ▲*** ▼*** Nonsubject sources plus Russia....... *** *** *** ▼*** ▲*** ▼***
All import sources.......................... *** *** *** ▲*** ▲*** ▼***
U.S. total market consumption value:Amount..................................................... *** *** *** ▼*** ▼*** ▼*** Producers' share (fn1).............................. *** *** *** ▼*** ▼*** ▲*** Importers' share (fn1):
Czechia................................................. *** *** *** ▼*** ▲*** ▼*** Korea..................................................... *** *** *** ▲*** ▲*** ▲*** Russia................................................... *** *** *** ▼*** ▲*** ▼*** Ukraine.................................................. *** *** *** ▲*** ▲*** ▲***
Subject sources................................. *** *** *** ▲*** ▲*** ▲*** Subject sources less Russia............. *** *** *** ▲*** ▲*** ▲***
Germany............................................... *** *** *** ▲*** ▲*** ▲*** Mexico................................................... *** *** *** ▲*** ▲*** ▲*** All other sources................................... *** *** *** ▲*** ▲*** ▼***
Nonsubject sources........................... *** *** *** ▲*** ▲*** ▼*** Nonsubject sources plus Russia....... *** *** *** ▲*** ▲*** ▼***
All import sources.......................... *** *** *** ▲*** ▲*** ▼***
U.S. imports from:Czechia:
Quantity................................................. 42,867 39,243 16,227 ▼(62.1) ▼(8.5) ▼(58.6)Value..................................................... 50,401 48,637 17,819 ▼(64.6) ▼(3.5) ▼(63.4)Unit value.............................................. $1,176 $1,239 $1,098 ▼(6.6) ▲5.4 ▼(11.4)Ending inventory quantity..................... *** *** *** ▲*** ▲*** ▼***
Korea:Quantity................................................. 17,460 18,863 25,428 ▲45.6 ▲8.0 ▲34.8 Value..................................................... 22,061 25,480 27,619 ▲25.2 ▲15.5 ▲8.4 Unit value.............................................. $1,264 $1,351 $1,086 ▼(14.0) ▲6.9 ▼(19.6)Ending inventory quantity..................... *** *** *** *** *** ***
Table continued on next page.
C-3
(Quantity=short tons; Value=1,000 dollars; Unit values, unit labor costs, and unit expenses=dollars per short ton; Period changes=percent--exceptions noted)
Reported data Period changesCalendar year Comparison years
Total market

Table C-1--ContinuedSSLP pipe: Summary data concerning the U.S. total market, 2018-20
2018 2019 2020 2018-20 2018-19 2019-20
U.S. imports from--Continued:Russia:
Quantity................................................. *** *** *** ▼*** ▼*** ▼*** Value..................................................... *** *** *** ▼*** ▼*** ▼*** Unit value.............................................. *** *** *** ▼*** ▼*** ▼*** Ending inventory quantity..................... *** *** *** ▼*** ▼*** ▼***
Ukraine:Quantity................................................. 42,962 48,134 36,157 ▼(15.8) ▲12.0 ▼(24.9)Value..................................................... 45,613 50,690 31,871 ▼(30.1) ▲11.1 ▼(37.1)Unit value.............................................. $1,062 $1,053 $881 ▼(17.0) ▼(0.8) ▼(16.3)Ending inventory quantity..................... *** *** *** ▼*** ▼*** ▲***
Subject sources:Quantity................................................. *** *** *** ▼*** ▲*** ▼*** Value..................................................... *** *** *** ▼*** ▲*** ▼*** Unit value.............................................. *** *** *** ▼*** ▲*** ▼*** Ending inventory quantity..................... *** *** *** ▼*** ▼*** ▲***
Subject sources less Russia:Quantity................................................. 103,289 106,239 77,812 ▼(24.7) ▲2.9 ▼(26.8)Value..................................................... 118,075 124,808 77,309 ▼(34.5) ▲5.7 ▼(38.1)Unit value.............................................. $1,143 $1,175 $994 ▼(13.1) ▲2.8 ▼(15.4)Ending inventory quantity..................... *** *** *** ▼*** ▼*** ▲***
Germany:Quantity................................................. *** *** *** ▼*** ▼*** ▼*** Value..................................................... *** *** *** ▼*** ▼*** ▼*** Unit value.............................................. *** *** *** ▼*** ▼*** ▼*** Ending inventory quantity..................... *** *** *** ▼*** ▲*** ▼***
Mexico:Quantity................................................. *** *** *** ▼*** ▼*** ▼*** Value..................................................... *** *** *** ▼*** ▼*** ▼*** Unit value.............................................. *** *** *** ▼*** ▲*** ▼*** Ending inventory quantity..................... *** *** *** ▼*** ▲*** ▼***
All other sources:Quantity................................................. *** *** *** ▼*** ▼*** ▼*** Value..................................................... *** *** *** ▼*** ▼*** ▼*** Unit value.............................................. *** *** *** ▲*** ▲*** ▲*** Ending inventory quantity..................... *** *** *** ▲*** ▲*** ▼***
Nonsubject sources:Quantity................................................. 520,979 427,316 231,467 ▼(55.6) ▼(18.0) ▼(45.8)Value..................................................... 846,673 736,843 395,465 ▼(53.3) ▼(13.0) ▼(46.3)Unit value.............................................. $1,625 $1,724 $1,709 ▲5.1 ▲6.1 ▼(0.9)Ending inventory quantity..................... *** *** *** ▲*** ▲*** ▼***
Nonsubject sources plus Russia:Quantity................................................. *** *** *** ▼*** ▼*** ▼*** Value..................................................... *** *** *** ▼*** ▼*** ▼*** Unit value.............................................. *** *** *** ▲*** ▲*** ▼*** Ending inventory quantity..................... *** *** *** ▲*** ▲*** ▼***
Table continued on next page.
Calendar year Comparison years
C-4
(Quantity=short tons; Value=1,000 dollars; Unit values, unit labor costs, and unit expenses=dollars per short ton; Period changes=percent--exceptions noted)
Reported data Period changes

Table C-1--ContinuedSSLP pipe: Summary data concerning the U.S. total market, 2018-20
2018 2019 2020 2018-20 2018-19 2019-20
U.S. imports from--Continued:All import sources:
Quantity................................................. *** *** *** ▼*** ▼*** ▼*** Value..................................................... *** *** *** ▼*** ▼*** ▼*** Unit value.............................................. *** *** *** ▼*** ▲*** ▼*** Ending inventory quantity..................... *** *** *** ▲*** ▲*** ▼***
U.S. producers':Average capacity quantity........................ 722,501 726,417 727,379 ▲0.7 ▲0.5 ▲0.1 Production quantity................................... 410,736 238,062 143,721 ▼(65.0) ▼(42.0) ▼(39.6)Capacity utilization (fn1)........................... 56.8 32.8 19.8 ▼(37.1) ▼(24.1) ▼(13.0)U.S. shipments:
Quantity................................................. 399,784 233,989 144,054 ▼(64.0) ▼(41.5) ▼(38.4)Value..................................................... 670,698 387,406 210,799 ▼(68.6) ▼(42.2) ▼(45.6)Unit value.............................................. $1,678 $1,656 $1,463 ▼(12.8) ▼(1.3) ▼(11.6)
Export shipments:Quantity................................................. *** *** *** ▼*** ▼*** ▼*** Value..................................................... *** *** *** ▼*** ▼*** ▼*** Unit value.............................................. *** *** *** ▲*** ▲*** ▲***
Ending inventory quantity......................... *** *** *** ▼*** ▲*** ▼*** Inventories/total shipments (fn1).............. *** *** *** ▲*** ▲*** ▲*** Production workers.................................. 1,129 1,001 679 ▼(39.9) ▼(11.3) ▼(32.2)Hours worked (1,000s)............................. 2,310 1,992 1,303 ▼(43.6) ▼(13.8) ▼(34.6)Wages paid ($1,000)................................ 98,611 80,103 54,229 ▼(45.0) ▼(18.8) ▼(32.3)Hourly wages (dollars per hour)............... $42.69 $40.21 $41.62 ▼(2.5) ▼(5.8) ▲3.5 Productivity (short tons per 1,000 hours). 177.8 119.5 110.3 ▼(38.0) ▼(32.8) ▼(7.7)Unit labor costs......................................... $240 $336 $377 ▲57.2 ▲40.2 ▲12.1
Table continued on next page.
Calendar year Comparison years
C-5
(Quantity=short tons; Value=1,000 dollars; Unit values, unit labor costs, and unit expenses=dollars per short ton; Period changes=percent--exceptions noted)
Reported data Period changes

Table C-1--ContinuedSSLP pipe: Summary data concerning the U.S. total market, 2018-20
2018 2019 2020 2018-20 2018-19 2019-20
U.S. producers'--Continued:Net sales:
Quantity................................................. *** *** *** ▼*** ▼*** ▼*** Value..................................................... *** *** *** ▼*** ▼*** ▼*** Unit value.............................................. *** *** *** ▼*** ▼*** ▼***
Cost of goods sold (COGS)..................... *** *** *** ▼*** ▼*** ▼*** Gross profit or (loss) (fn2)........................ *** *** *** ▼*** ▼*** ▼*** SG&A expenses....................................... *** *** *** ▼*** ▼*** ▼*** Operating income or (loss) (fn2).............. *** *** *** ▼*** ▼*** ▼*** Net income or (loss) (fn2)......................... *** *** *** ▼*** ▼*** ▼*** Unit COGS................................................ *** *** *** ▲*** ▲*** ▼*** Unit SG&A expenses............................... *** *** *** ▲*** ▲*** ▲*** Unit operating income or (loss) (fn2)....... $134 $(36) $(212) ▼--- ▼--- ▼---Unit net income or (loss) (fn2).................. *** *** *** ▼*** ▼*** ▼*** COGS/sales (fn1)..................................... *** *** *** ▲*** ▲*** ▲*** Operating income or (loss)/sales (fn1)..... 8.0 (2.2) (14.4) ▼(22.4) ▼(10.2) ▼(12.2)Net income or (loss)/sales (fn1)............... *** *** *** ▼*** ▼*** ▼*** Capital expenditures................................ 33,152 29,377 13,531 ▼(59.2) ▼(11.4) ▼(53.9)R&D expenses......................................... *** *** *** ▼*** ▼*** ▼*** Net assets................................................ 750,887 521,814 423,471 ▼(43.6) ▼(30.5) ▼(18.8)
fn1.--Reported data are in percent and period changes are in percentage points.
Calendar year Comparison years
Note.--Shares and ratios shown as “0.0” percent represent non-zero values less than “0.05” percent (if positive) and greater than “(0.05)” percent (if negative). Zeroes, null values, and undefined calculations are suppressed and shown as “---“. Period changes preceded by a “▲” represent an increase, while period changes preceded by a “▼” represent a decrease.
fn2.--Percent changes only calculated when both comparison values represent profits; The directional change in profitability provided when one or both comparison values represent a loss.
Source: Compiled from data submitted in response to Commission questionnaires and official U.S. import statistics for HTS statistical reporting numbers 7304.19.1020, 7304.19.1030, 7304.19.1045, 7304.19.1060, 7304.19.5020, 7304.19.5050, 7304.31.6050, 7304.39.0016, 7304.39.0020, 7304.39.0024, 7304.39.0028, 7304.39.0032, 7304.39.0036, 7304.39.0040, 7304.39.0044, 7304.39.0048, 7304.39.0052, 7304.39.0056, 7304.39.0062, 7304.39.0068, 7304.39.0072, 7304.51.5005, 7304.51.5060, 7304.59.6000, 7304.59.8010, 7304.59.8015, 7304.59.8020, 7304.59.8025, 7304.59.8030, 7304.59.8035, 7304.59.8040, 7304.59.8045, 7304.59.8050, 7304.59.8055, 7304.59.8060, 7304.59.8065, and 7304.59.8070, accessed February 8, 2021.
C-6
(Quantity=short tons; Value=1,000 dollars; Unit values, unit labor costs, and unit expenses=dollars per short ton; Period changes=percent--exceptions noted)
Reported data Period changes

Table C-2SSLP pipe: Summary data concerning the U.S. merchant market, 2018-20
2018 2019 2020 2018-20 2018-19 2019-20
U.S. merchant market consumption quantity:Amount..................................................... *** *** *** ▼*** ▼*** ▼*** Producers' share (fn1).............................. *** *** *** ▼*** ▼*** ▲*** Importers' share (fn1):
Czechia................................................. *** *** *** ▼*** ▲*** ▼*** Korea..................................................... *** *** *** ▲*** ▲*** ▲*** Russia................................................... *** *** *** ▼*** ▲*** ▼*** Ukraine.................................................. *** *** *** ▲*** ▲*** ▲***
Subject sources................................. *** *** *** ▲*** ▲*** ▲*** Subject sources less Russia............. *** *** *** ▲*** ▲*** ▲***
Germany............................................... *** *** *** ▲*** ▲*** ▲*** Mexico................................................... *** *** *** ▲*** ▼*** ▲*** All other sources................................... *** *** *** ▼*** ▲*** ▼***
Nonsubject sources........................... *** *** *** ▲*** ▲*** ▼*** Nonsubject sources plus Russia....... *** *** *** ▲*** ▲*** ▼***
All import sources.......................... *** *** *** ▲*** ▲*** ▼***
U.S. merchant market consumption value:Amount..................................................... *** *** *** ▼*** ▼*** ▼*** Producers' share (fn1).............................. *** *** *** ▼*** ▼*** ▼*** Importers' share (fn1):
Czechia................................................. *** *** *** ▼*** ▲*** ▼*** Korea..................................................... *** *** *** ▲*** ▲*** ▲*** Russia................................................... *** *** *** ▼*** ▲*** ▼*** Ukraine.................................................. *** *** *** ▲*** ▲*** ▲***
Subject sources................................. *** *** *** ▲*** ▲*** ▲*** Subject sources less Russia............. *** *** *** ▲*** ▲*** ▲***
Germany............................................... *** *** *** ▲*** ▲*** ▲*** Mexico................................................... *** *** *** ▲*** ▲*** ▲*** All other sources................................... *** *** *** ▲*** ▲*** ▼***
Nonsubject sources........................... *** *** *** ▲*** ▲*** ▲*** Nonsubject sources plus Russia....... *** *** *** ▲*** ▲*** ▼***
All import sources.......................... *** *** *** ▲*** ▲*** ▲***
U.S. imports from:Czechia:
Quantity................................................. *** *** *** ▼*** ▼*** ▼*** Value..................................................... *** *** *** ▼*** ▼*** ▼*** Unit value.............................................. *** *** *** ▼*** ▲*** ▼*** Ending inventory quantity..................... *** *** *** ▲*** ▲*** ▼***
Korea:Quantity................................................. *** *** *** ▲*** ▲*** ▲*** Value..................................................... *** *** *** ▲*** ▲*** ▲*** Unit value.............................................. *** *** *** ▼*** ▲*** ▼*** Ending inventory quantity..................... *** *** *** *** *** ***
Table continued on next page.
C-7
(Quantity=short tons; Value=1,000 dollars; Unit values, unit labor costs, and unit expenses=dollars per short ton; Period changes=percent--exceptions noted)
Reported data Period changesCalendar year Comparison years
Merchant market
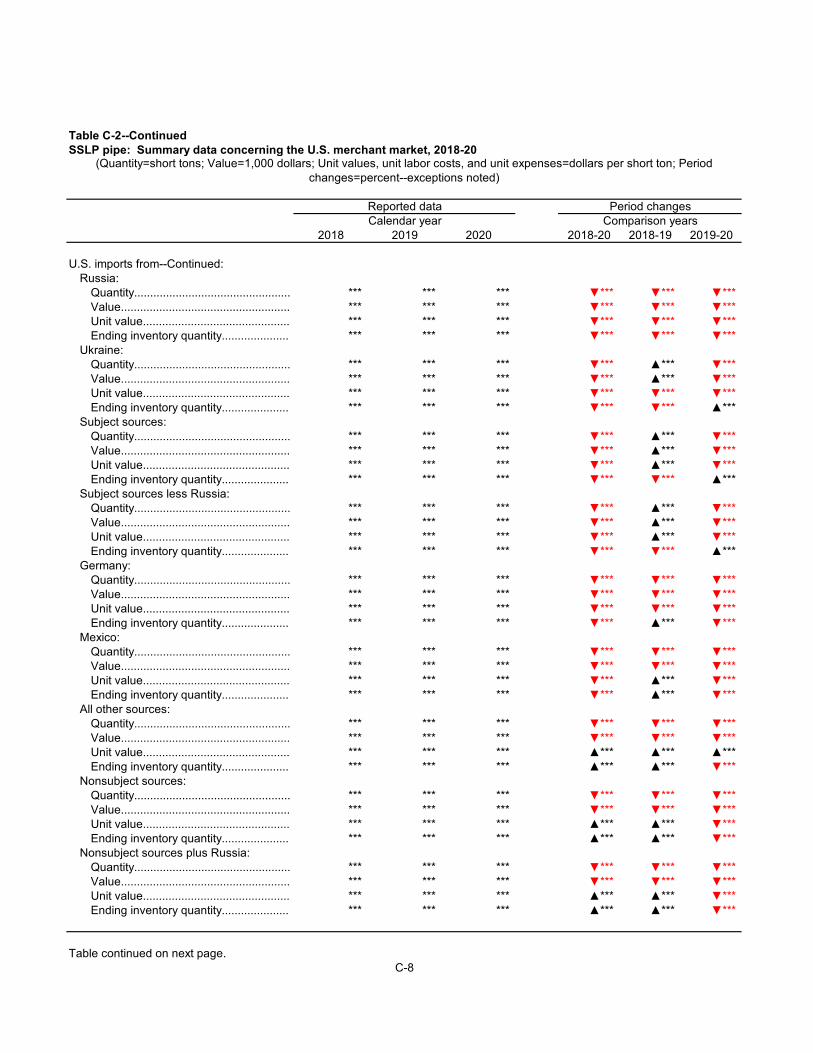
Table C-2--ContinuedSSLP pipe: Summary data concerning the U.S. merchant market, 2018-20
2018 2019 2020 2018-20 2018-19 2019-20
U.S. imports from--Continued:Russia:
Quantity................................................. *** *** *** ▼*** ▼*** ▼*** Value..................................................... *** *** *** ▼*** ▼*** ▼*** Unit value.............................................. *** *** *** ▼*** ▼*** ▼*** Ending inventory quantity..................... *** *** *** ▼*** ▼*** ▼***
Ukraine:Quantity................................................. *** *** *** ▼*** ▲*** ▼*** Value..................................................... *** *** *** ▼*** ▲*** ▼*** Unit value.............................................. *** *** *** ▼*** ▼*** ▼*** Ending inventory quantity..................... *** *** *** ▼*** ▼*** ▲***
Subject sources:Quantity................................................. *** *** *** ▼*** ▲*** ▼*** Value..................................................... *** *** *** ▼*** ▲*** ▼*** Unit value.............................................. *** *** *** ▼*** ▲*** ▼*** Ending inventory quantity..................... *** *** *** ▼*** ▼*** ▲***
Subject sources less Russia:Quantity................................................. *** *** *** ▼*** ▲*** ▼*** Value..................................................... *** *** *** ▼*** ▲*** ▼*** Unit value.............................................. *** *** *** ▼*** ▲*** ▼*** Ending inventory quantity..................... *** *** *** ▼*** ▼*** ▲***
Germany:Quantity................................................. *** *** *** ▼*** ▼*** ▼*** Value..................................................... *** *** *** ▼*** ▼*** ▼*** Unit value.............................................. *** *** *** ▼*** ▼*** ▼*** Ending inventory quantity..................... *** *** *** ▼*** ▲*** ▼***
Mexico:Quantity................................................. *** *** *** ▼*** ▼*** ▼*** Value..................................................... *** *** *** ▼*** ▼*** ▼*** Unit value.............................................. *** *** *** ▼*** ▲*** ▼*** Ending inventory quantity..................... *** *** *** ▼*** ▲*** ▼***
All other sources:Quantity................................................. *** *** *** ▼*** ▼*** ▼*** Value..................................................... *** *** *** ▼*** ▼*** ▼*** Unit value.............................................. *** *** *** ▲*** ▲*** ▲*** Ending inventory quantity..................... *** *** *** ▲*** ▲*** ▼***
Nonsubject sources:Quantity................................................. *** *** *** ▼*** ▼*** ▼*** Value..................................................... *** *** *** ▼*** ▼*** ▼*** Unit value.............................................. *** *** *** ▲*** ▲*** ▼*** Ending inventory quantity..................... *** *** *** ▲*** ▲*** ▼***
Nonsubject sources plus Russia:Quantity................................................. *** *** *** ▼*** ▼*** ▼*** Value..................................................... *** *** *** ▼*** ▼*** ▼*** Unit value.............................................. *** *** *** ▲*** ▲*** ▼*** Ending inventory quantity..................... *** *** *** ▲*** ▲*** ▼***
Table continued on next page.C-8
(Quantity=short tons; Value=1,000 dollars; Unit values, unit labor costs, and unit expenses=dollars per short ton; Period changes=percent--exceptions noted)
Reported data Period changesCalendar year Comparison years

Table C-2--ContinuedSSLP pipe: Summary data concerning the U.S. merchant market, 2018-20
2018 2019 2020 2018-20 2018-19 2019-20
U.S. imports from--Continued:All import sources:
Quantity................................................. *** *** *** ▼*** ▼*** ▼*** Value..................................................... *** *** *** ▼*** ▼*** ▼*** Unit value.............................................. *** *** *** ▼*** ▲*** ▼*** Ending inventory quantity..................... *** *** *** ▲*** ▲*** ▼***
U.S. producers':Open market U.S. shipments (fn3):
Quantity................................................. *** *** *** ▼*** ▼*** ▼*** Value..................................................... *** *** *** ▼*** ▼*** ▼*** Unit value.............................................. *** *** *** ▼*** ▼*** ▼***
Open market sales (fn3):Quantity................................................. *** *** *** ▼*** ▼*** ▼*** Value..................................................... *** *** *** ▼*** ▼*** ▼*** Unit value.............................................. *** *** *** ▼*** ▼*** ▼***
Cost of goods sold (COGS)..................... *** *** *** ▼*** ▼*** ▼*** Gross profit or (loss) (fn2)........................ *** *** *** ▼*** ▼*** ▼*** SG&A expenses....................................... *** *** *** ▼*** ▼*** ▼*** Operating income or (loss) (fn2).............. *** *** *** ▼*** ▼*** ▼*** Net income or (loss) (fn2)......................... *** *** *** ▼*** ▼*** ▼*** Unit COGS................................................ *** *** *** ▲*** ▲*** ▼*** Unit SG&A expenses............................... *** *** *** ▲*** ▲*** ▲*** Unit operating income or (loss) (fn2)....... *** *** *** ▼*** ▼*** ▼*** Unit net income or (loss) (fn2).................. *** *** *** ▼*** ▼*** ▼*** COGS/sales (fn1)..................................... *** *** *** ▲*** ▲*** ▲*** Operating income or (loss)/sales (fn1)..... *** *** *** ▼*** ▼*** ▼*** Net income or (loss)/sales (fn1)............... *** *** *** ▼*** ▼*** ▼***
fn1.--Reported data are in percent and period changes are in percentage points.
Note.--Shares and ratios shown as “0.0” percent represent non-zero values less than “0.05” percent (if positive) and greater than “(0.05)” percent (if negative). Zeroes, null values, and undefined calculations are suppressed and shown as “---“. Period changes preceded by a “▲” represent an increase, while period changes preceded by a “▼” represent a decrease.
fn2.--Percent changes only calculated when both comparison values represent profits; The directional change in profitability provided when one or both comparison values represent a loss.fn3.--Open market shipments and sales include transfers to related firms by one U.S. producer *** as all of its transfers were diverted into the merchant market by the related firm.
Source: Compiled from data submitted in response to Commission questionnaires and official U.S. import statistics for HTS statistical reporting numbers 7304.19.1020, 7304.19.1030, 7304.19.1045, 7304.19.1060, 7304.19.5020, 7304.19.5050, 7304.31.6050, 7304.39.0016, 7304.39.0020, 7304.39.0024, 7304.39.0028, 7304.39.0032, 7304.39.0036, 7304.39.0040, 7304.39.0044, 7304.39.0048, 7304.39.0052, 7304.39.0056, 7304.39.0062, 7304.39.0068, 7304.39.0072, 7304.51.5005, 7304.51.5060, 7304.59.6000, 7304.59.8010, 7304.59.8015, 7304.59.8020, 7304.59.8025, 7304.59.8030, 7304.59.8035, 7304.59.8040, 7304.59.8045, 7304.59.8050, 7304.59.8055, 7304.59.8060, 7304.59.8065, and 7304.59.8070, accessed February 8, 2021.
C-9
(Quantity=short tons; Value=1,000 dollars; Unit values, unit labor costs, and unit expenses=dollars per short ton; Period changes=percent--exceptions noted)
Reported data Period changesCalendar year Comparison years

PAGE KEPT INTENTIONALLY BLANK

D-1
APPENDIX D
NEGLIGIBILITY AND LATER REVISIONS


D-3
Appendix D provides information regarding negligibility for U.S. imports of SSLP pipe from subject and nonsubject sources in the rolling twelve-month average period preceding the filing of the petitions. The primary HTS statistical reporting numbers for these investigations include out-of-scope products.1 In the prehearing report, out-of-scope products were removed from official import statistics for the primary HTS statistical reporting numbers which reported U.S. imports of SSLP pipe from Russia as *** percent of imports during July 2019 to June 2020.2 Since the distribution of the prehearing report, the Commission received additional revisions to U.S. importer questionnaires that ***. The inclusion of these later responses, the petitioner has argued, is ***, but presents the Commission with methodological concerns that cannot be sufficiently addressed due to the later receipt.3
Background
In the preliminary phase of these investigations, *** of merchandise under the primary HTS statistical reporting numbers for SSLP pipe reported to the Commission that the goods they were importing did not match the scope of the investigations. As a result, negligibility was calculated by removing *** out-of-scope SSLP pipe from official import statistics. Following the preliminary phase of these investigations, the Commission included questions in its final phase questionnaires to systematically capture out-of-scope products that entered under the referenced statistical reporting numbers.4 In response to this
1 Products are considered out-of-scope if products meet specifications for aerospace, hydraulic, bearing, boiler, and OCTG pipe and tube specifications. For more information, refer to Commerce’s Scope in Part I. 2 Companies that reported out-of-scope imports included ***. 3 Petitioner’s prehearing brief comments, p. 2. 4 The additional questions were “{h}as your firm imported products other than SSLP pipe under the primary HTS statistical reporting numbers for SSLP pipe from any source between July 1, 2019 and June 30, 2020? (i.e., the last six months in 2019 and first six months in 2020 combined) If yes, please describe the product(s) imported under statistical reporting numbers listed on page 2 that your firm imported,” and “{h}as your firm imported products other than SSLP pipe under the primary HTS statistical reporting numbers for SSLP pipe from any source at any time since January 1, 2018? Note these data should not be included in questions II-5 -11. If yes, please describe the product(s) imported under statistical reporting numbers listed on page 2 that your firm imported.” The Commission also revised standard certification language to state, “Has your firm imported SSLP pipe (as defined on page 2) from any country at any time since January 1, 2018 regardless of HTS Customs classification or has your firm imported products other than SSLP pipe under the primary HTS statistical reporting numbers for SSLP pipe (as listed on page 2) from any country at any time?” See, questions II-3c , II-13, and the certification page of the U.S. Importers’ Questionnaire, respectively.
D-4
addition, the petitioner, Vallourec, stated that the changes should be restricted to “volumes that importers’ certified questionnaire responses sufficiently establish are outside the scope of the investigations for the relevant 12-month period.”5 No other parties commented on these questions.
The official questionnaire mailing period for these investigations was January 4 to January 25, 2021. The Commission issued the importers’ questionnaire to 35 firms believed to be importers of subject SSLP pipe, as well as to all U.S. producers of SSLP pipe. During this time, *** certified imports of out-of-scope product that entered under the referenced statistical reporting numbers since January 1, 2018: ***.6 The confidential version of the Commission’s prehearing staff report was made available to parties on February 19, 2021 and showed U.S. imports of SSLP pipe from Russia at *** percent of imports by quantity during July 2019-June 2020, the 12-month period preceding the filing of the petitions.
After the questionnaire mailing period and following the issuance of the prehearing report to the Commission and parties on February 19, 2021, ***, Vallourec and ***, provided incomplete revised importer questionnaire responses on ***.7 ***. After requests for the complete questionnaire responses and monthly out-of-scope data, the Commission received the final outstanding requested portions on ***. Regarding this data, the petitioner states “***, the denominator for the Commission’s negligibility calculation is likely still overstated even after revisions were made.”8 Using these revised out-of-scope product data, petitioner argues that Russia’s imports are non-negligible and account for *** percent of imports of SSLP pipe between July 2019 and June 2020.
5 Petitioner’s questionnaire comments, p. 2. 6 ***. 7 *** ***. 8 Petitioner’s prehearing brief, pp. 3-4. But see also TMK posthearing brief, exh. 17.

D-5
Regarding the revisions, Vallourec’s counsel noted that the revision was a result of “a mistake made by counsel,” and continued that the petitioner’s counsel has the opportunity to review clients’ questionnaires before submission.9 In response to Commissioners’ questions, ***.”10 ***.11
To provide the revised data, *** reported that it used a “***.” *** also mentioned that, “***.”12 *** expressed similar sentiments, stating that the “***” and that it “***.”13
Negligibility tables
Tables D-1 through D-7 present the individual shares of total imports of SSLP pipe by subject countries by quantity from July 2019 to June 2020, the most recent 12-month period preceding the filing of the petitions for the investigation based on varying data sources available to the Commission. Table D-1 removes out-of-scope imports as reported in U.S. importers’ questionnaire responses before the prehearing report: ***. It replicates the negligibility table included in the prehearing staff report that showed
9 Hearing transcript, 80 (Schagrin). 10 ***. 11 ***. 12 ***. 13 ***.
D-6
U.S. imports of SSLP pipe from Russia at *** percent of imports by quantity between July 2019 and June 2020.14
Negligibility using all questionnaire data (Tables D-2 and D-3 with Figure D-1)
Incorporating the later questionnaire revisions following the prehearing report, table D-2 presents the individual shares of total imports of SSLP pipe by subject countries by quantity from July 2019 to June 2020, the most recent 12-month period preceding the filing of the petitions for the investigation adjusted to remove all out-of-scope imports as reported in the U.S. importers’ questionnaire responses (***) as well as the revised, later responses to U.S. importers’ questionnaires by ***. Country-specific quantities are computed by removing the volume of reported out-of-scope imports from the given country from the total U.S. imports from that country based on official import statistics for the primary HTS statistical reporting numbers. These adjusted country-specific quantities are used to calculate the individual shares of total imports of SSLP pipe. As a result, total imports of SSLP pipe are revised downward, which may result in increased individual shares of total imports of SSLP pipe by subject countries. Including the later questionnaire revisions of ***, U.S. imports of SSLP pipe from Russia were *** percent of imports by quantity in July 2019 and June 2020. In like manner, table D-3 and figure D-1 present a rolling 12-month total of imports from Russia, sources other than Russia, and all import sources, as well as those imports’ share of total imports, based on the same adjustment to official import statistics.15
Negligibility excluding later revisions (Tables D-4 and D-5 with Figure D-2)
On the other hand, as presented in Part IV, table D-4 shows the individual shares of total imports of SSLP pipe by subject countries by quantity from July 2019 to June 2020 excluding the revised, later responses to U.S. importers’ questionnaires (***) while including the U.S. importers’ questionnaire responses (***).16 Likewise, table D-5 and figure D-2 provide a rolling 12-month total of imports from Russia, sources other than Russia, and all import sources, as well as those imports’ share of total
14 INV-TT-026 (February 19, 2021). 15 Data shown in this table for "sources other than Russia" does not match the data shown in the negligibility period in table D-2 above given inconsistent data reported within the later responses of ***. 16 Data shown in this table for Russia does not match the data shown in the negligibility period in table D-1 above given revised data provided by ***.

D-7
imports, based on the same adjustment to official import statistics. Imports of SSLP pipe from Russia accounted for *** percent during this period according to these data.
Negligibility using only official statistics (Tables D-6 and D-7 with Figure D-3)
Finally, table D-6 presents the individual shares of total imports of SSLP pipe by subject countries by quantity from July 2019 to June 2020 based on official import statistics for the primary HTS statistical reporting numbers without any adjustments for out-of-scope products. Similarly, table D-7 and figure D-3 show a rolling 12-month total of imports from Russia, sources other than Russia, and all import sources, as well as those imports’ share of total imports, based on solely on official import statistics. According to these statistics, U.S. imports of SSLP pipe from Russia were 5.1 percent of imports by quantity in July 2019 and June 2020.
Table D-1 SSLP pipe: U.S. imports in the twelve-month period preceding the filing of the petition, July 2019 through June 2020 (Prehearing report version)
Item July 2019 through June 2020
Quantity (short tons) Share quantity (percent) U.S. imports from.-- Czechia *** ***
Korea *** *** Russia *** *** Ukraine *** ***
Subject sources *** *** Germany *** *** Mexico *** *** All other sources *** ***
Nonsubject sources *** *** All import sources *** ***
Source: Compiled from data submitted in response to Commission questionnaires (***) and official U.S. import statistics for HTS statistical reporting numbers 7304.19.1020, 7304.19.1030, 7304.19.1045, 7304.19.1060, 7304.19.5020, 7304.19.5050, 7304.31.6050, 7304.39.0016, 7304.39.0020, 7304.39.0024, 7304.39.0028, 7304.39.0032, 7304.39.0036, 7304.39.0040, 7304.39.0044, 7304.39.0048, 7304.39.0052, 7304.39.0056, 7304.39.0062, 7304.39.0068, 7304.39.0072, 7304.51.5005, 7304.51.5060, 7304.59.6000, 7304.59.8010, 7304.59.8015, 7304.59.8020, 7304.59.8025, 7304.59.8030, 7304.59.8035, 7304.59.8040, 7304.59.8045, 7304.59.8050, 7304.59.8055, 7304.59.8060, 7304.59.8065, and 7304.59.8070, accessed February 8, 2021.

D-8
Table D-2 SSLP pipe: U.S. imports in the twelve-month period preceding the filing of the petitions, July 2019 through June 2020 (including all questionnaire data)
Item July 2019 through June 2020
Quantity (short tons) Share quantity (percent) U.S. imports from.-- Czechia *** ***
Korea *** *** Russia *** *** Ukraine *** *** Germany *** *** Mexico *** *** All other sources *** ***
All import sources *** *** Source: Compiled from data submitted in response to Commission questionnaires (***) and official U.S. import statistics for HTS statistical reporting numbers 7304.19.1020, 7304.19.1030, 7304.19.1045, 7304.19.1060, 7304.19.5020, 7304.19.5050, 7304.31.6050, 7304.39.0016, 7304.39.0020, 7304.39.0024, 7304.39.0028, 7304.39.0032, 7304.39.0036, 7304.39.0040, 7304.39.0044, 7304.39.0048, 7304.39.0052, 7304.39.0056, 7304.39.0062, 7304.39.0068, 7304.39.0072, 7304.51.5005, 7304.51.5060, 7304.59.6000, 7304.59.8010, 7304.59.8015, 7304.59.8020, 7304.59.8025, 7304.59.8030, 7304.59.8035, 7304.59.8040, 7304.59.8045, 7304.59.8050, 7304.59.8055, 7304.59.8060, 7304.59.8065, and 7304.59.8070, accessed February 8, 2021.

D-9
Table D-3 SSLP pipe: U.S. imports from Russia in various twelve-month periods before and after the filing of the petitions, December 2018 through December 2020 (including all questionnaire data)
Item
Quantity (short tons) Share of quantity (percent)
Russia
Sources other than
Russia
All import
sources Russia
Sources other than
Russia
All import
sources U.S. imports for a twelve-month period ending.-- December 31, 2018 *** *** *** *** *** ***
January 31, 2019 *** *** *** *** *** *** February 28, 2019 *** *** *** *** *** *** March 31, 2019 *** *** *** *** *** *** April 30, 2019 *** *** *** *** *** *** May 31, 2019 *** *** *** *** *** *** June 30, 2019 *** *** *** *** *** *** July 31, 2019 *** *** *** *** *** *** August 31, 2019 *** *** *** *** *** *** September 30, 2019 *** *** *** *** *** *** October 31, 2019 *** *** *** *** *** *** November 30, 2019 *** *** *** *** *** *** December 31, 2019 *** *** *** *** *** *** January 31, 2020 *** *** *** *** *** *** February 28, 2020 *** *** *** *** *** *** March 31, 2020 *** *** *** *** *** *** April 30, 2020 *** *** *** *** *** *** May 31, 2020 *** *** *** *** *** *** June 30, 2020 (negligibility
period) *** *** *** *** *** *** July 31, 2020 *** *** *** *** *** *** August 31, 2020 *** *** *** *** *** *** September 30, 2020 *** *** *** *** *** *** October 31, 2020 *** *** *** *** *** *** November 30, 2020 *** *** *** *** *** *** December 31, 2020 *** *** *** *** *** ***
Note: Data shown in this table for "sources other than Russia" does not match the data shown in the negligibility period in table D-2 above given inconsistent data reported within the later response of ***. Source: Compiled from data submitted in response to Commission questionnaires (***) and official U.S. import statistics for HTS statistical reporting numbers 7304.19.1020, 7304.19.1030, 7304.19.1045, 7304.19.1060, 7304.19.5020, 7304.19.5050, 7304.31.6050, 7304.39.0016, 7304.39.0020, 7304.39.0024, 7304.39.0028, 7304.39.0032, 7304.39.0036, 7304.39.0040, 7304.39.0044, 7304.39.0048, 7304.39.0052, 7304.39.0056, 7304.39.0062, 7304.39.0068, 7304.39.0072, 7304.51.5005, 7304.51.5060, 7304.59.6000, 7304.59.8010, 7304.59.8015, 7304.59.8020, 7304.59.8025, 7304.59.8030, 7304.59.8035, 7304.59.8040, 7304.59.8045, 7304.59.8050, 7304.59.8055, 7304.59.8060, 7304.59.8065, and 7304.59.8070, accessed February 8, 2021.

D-10
Figure D-1 SSLP pipe: U.S. imports from Russia in various twelve-month periods before and after the filing of the petitions, December 2018 through December 2020 (including all questionnaire data)
* * * * * * * * Source: Compiled from data submitted in response to Commission questionnaires (***) and official U.S. import statistics for HTS statistical reporting numbers 7304.19.1020, 7304.19.1030, 7304.19.1045, 7304.19.1060, 7304.19.5020, 7304.19.5050, 7304.31.6050, 7304.39.0016, 7304.39.0020, 7304.39.0024, 7304.39.0028, 7304.39.0032, 7304.39.0036, 7304.39.0040, 7304.39.0044, 7304.39.0048, 7304.39.0052, 7304.39.0056, 7304.39.0062, 7304.39.0068, 7304.39.0072, 7304.51.5005, 7304.51.5060, 7304.59.6000, 7304.59.8010, 7304.59.8015, 7304.59.8020, 7304.59.8025, 7304.59.8030, 7304.59.8035, 7304.59.8040, 7304.59.8045, 7304.59.8050, 7304.59.8055, 7304.59.8060, 7304.59.8065, and 7304.59.8070, accessed February 8, 2021. Table D-4 SSLP pipe: U.S. imports in the twelve-month period preceding the filing of the petitions, July 2019 through June 2020 (Staff report version)
Item July 2019 through June 2020
Quantity (short tons) Share quantity (percent) U.S. imports from.-- Czechia *** ***
Korea *** *** Russia *** *** Ukraine *** *** Germany *** *** Mexico *** *** All other sources *** ***
All import sources *** *** Note: Data shown in this table for Russia does not match the data shown in the negligibility period in table D-1 above given revised data provided by ***. Source: Compiled from data submitted in response to Commission questionnaires (***) and official U.S. import statistics for HTS statistical reporting numbers 7304.19.1020, 7304.19.1030, 7304.19.1045, 7304.19.1060, 7304.19.5020, 7304.19.5050, 7304.31.6050, 7304.39.0016, 7304.39.0020, 7304.39.0024, 7304.39.0028, 7304.39.0032, 7304.39.0036, 7304.39.0040, 7304.39.0044, 7304.39.0048, 7304.39.0052, 7304.39.0056, 7304.39.0062, 7304.39.0068, 7304.39.0072, 7304.51.5005, 7304.51.5060, 7304.59.6000, 7304.59.8010, 7304.59.8015, 7304.59.8020, 7304.59.8025, 7304.59.8030, 7304.59.8035, 7304.59.8040, 7304.59.8045, 7304.59.8050, 7304.59.8055, 7304.59.8060, 7304.59.8065, and 7304.59.8070, accessed February 8, 2021.

D-11
Table D-5 SSLP pipe: U.S. imports in various twelve-month periods before and after the filing of the petitions, December 2018 through December 2020 (Staff report version)
Item
Quantity (short tons) Share of quantity (percent)
Russia All other sources
All import
sources Russia
All other
sources
All import
sources U.S. imports for a twelve-month period ending.-- December 31, 2018 *** *** *** *** *** ***
January 31, 2019 *** *** *** *** *** *** February 28, 2019 *** *** *** *** *** *** March 31, 2019 *** *** *** *** *** *** April 30, 2019 *** *** *** *** *** *** May 31, 2019 *** *** *** *** *** *** June 30, 2019 *** *** *** *** *** *** July 31, 2019 *** *** *** *** *** *** August 31, 2019 *** *** *** *** *** *** September 30, 2019 *** *** *** *** *** *** October 31, 2019 *** *** *** *** *** *** November 30, 2019 *** *** *** *** *** *** December 31, 2019 *** *** *** *** *** *** January 31, 2020 *** *** *** *** *** *** February 28, 2020 *** *** *** *** *** *** March 31, 2020 *** *** *** *** *** *** April 30, 2020 *** *** *** *** *** *** May 31, 2020 *** *** *** *** *** *** June 30, 2020 (negligibility period) *** *** *** *** *** *** July 31, 2020 *** *** *** *** *** *** August 31, 2020 *** *** *** *** *** *** September 30, 2020 *** *** *** *** *** *** October 31, 2020 *** *** *** *** *** *** November 30, 2020 *** *** *** *** *** *** December 31, 2020 *** *** *** *** *** ***
Source: Compiled from data submitted in response to Commission questionnaires (***) and official U.S. import statistics for HTS statistical reporting numbers 7304.19.1020, 7304.19.1030, 7304.19.1045, 7304.19.1060, 7304.19.5020, 7304.19.5050, 7304.31.6050, 7304.39.0016, 7304.39.0020, 7304.39.0024, 7304.39.0028, 7304.39.0032, 7304.39.0036, 7304.39.0040, 7304.39.0044, 7304.39.0048, 7304.39.0052, 7304.39.0056, 7304.39.0062, 7304.39.0068, 7304.39.0072, 7304.51.5005, 7304.51.5060, 7304.59.6000, 7304.59.8010, 7304.59.8015, 7304.59.8020, 7304.59.8025, 7304.59.8030, 7304.59.8035, 7304.59.8040, 7304.59.8045, 7304.59.8050, 7304.59.8055, 7304.59.8060, 7304.59.8065, and 7304.59.8070, accessed February 8, 2021.

D-12
Figure D-2 SSLP pipe: U.S. imports from Russia in various twelve-month periods before and after the filing of the petition, December 2018 through December 2020 (Staff report version) * * * * * * * * Source: Compiled from data submitted in response to Commission questionnaires (***) and official U.S. import statistics for HTS statistical reporting numbers 7304.19.1020, 7304.19.1030, 7304.19.1045, 7304.19.1060, 7304.19.5020, 7304.19.5050, 7304.31.6050, 7304.39.0016, 7304.39.0020, 7304.39.0024, 7304.39.0028, 7304.39.0032, 7304.39.0036, 7304.39.0040, 7304.39.0044, 7304.39.0048, 7304.39.0052, 7304.39.0056, 7304.39.0062, 7304.39.0068, 7304.39.0072, 7304.51.5005, 7304.51.5060, 7304.59.6000, 7304.59.8010, 7304.59.8015, 7304.59.8020, 7304.59.8025, 7304.59.8030, 7304.59.8035, 7304.59.8040, 7304.59.8045, 7304.59.8050, 7304.59.8055, 7304.59.8060, 7304.59.8065, and 7304.59.8070, accessed February 8, 2021. Table D-6 SSLP pipe: U.S. imports in the twelve-month period preceding the filing of the petitions, July 2019 through June 2020 (Official statistics only, no adjustments for nonsubject imports)
Item July 2019 through June 2020
Quantity (short tons) Share quantity (percent) U.S. imports from.-- Czechia 26,029 5.8
Korea 25,928 5.8 Russia 22,645 5.1 Ukraine 40,136 9.0 Germany 48,406 10.8 Mexico 63,950 14.3 All other sources 219,808 49.2
All import sources 446,903 100.0 Source: Official U.S. import statistics for HTS statistical reporting numbers 7304.19.1020, 7304.19.1030, 7304.19.1045, 7304.19.1060, 7304.19.5020, 7304.19.5050, 7304.31.6050, 7304.39.0016, 7304.39.0020, 7304.39.0024, 7304.39.0028, 7304.39.0032, 7304.39.0036, 7304.39.0040, 7304.39.0044, 7304.39.0048, 7304.39.0052, 7304.39.0056, 7304.39.0062, 7304.39.0068, 7304.39.0072, 7304.51.5005, 7304.51.5060, 7304.59.6000, 7304.59.8010, 7304.59.8015, 7304.59.8020, 7304.59.8025, 7304.59.8030, 7304.59.8035, 7304.59.8040, 7304.59.8045, 7304.59.8050, 7304.59.8055, 7304.59.8060, 7304.59.8065, and 7304.59.8070, accessed February 8, 2021.
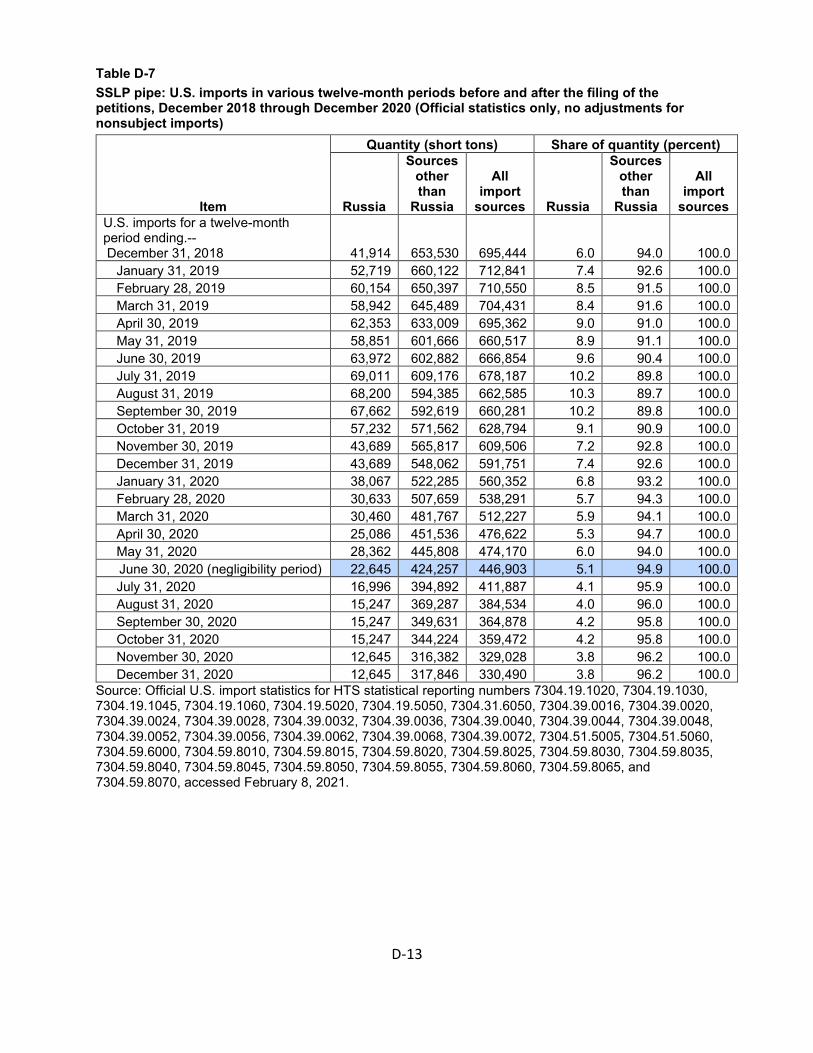
D-13
Table D-7 SSLP pipe: U.S. imports in various twelve-month periods before and after the filing of the petitions, December 2018 through December 2020 (Official statistics only, no adjustments for nonsubject imports)
Item
Quantity (short tons) Share of quantity (percent)
Russia
Sources other than
Russia
All import
sources Russia
Sources other than
Russia
All import
sources U.S. imports for a twelve-month period ending.-- December 31, 2018 41,914 653,530 695,444 6.0 94.0 100.0
January 31, 2019 52,719 660,122 712,841 7.4 92.6 100.0 February 28, 2019 60,154 650,397 710,550 8.5 91.5 100.0 March 31, 2019 58,942 645,489 704,431 8.4 91.6 100.0 April 30, 2019 62,353 633,009 695,362 9.0 91.0 100.0 May 31, 2019 58,851 601,666 660,517 8.9 91.1 100.0 June 30, 2019 63,972 602,882 666,854 9.6 90.4 100.0 July 31, 2019 69,011 609,176 678,187 10.2 89.8 100.0 August 31, 2019 68,200 594,385 662,585 10.3 89.7 100.0 September 30, 2019 67,662 592,619 660,281 10.2 89.8 100.0 October 31, 2019 57,232 571,562 628,794 9.1 90.9 100.0 November 30, 2019 43,689 565,817 609,506 7.2 92.8 100.0 December 31, 2019 43,689 548,062 591,751 7.4 92.6 100.0 January 31, 2020 38,067 522,285 560,352 6.8 93.2 100.0 February 28, 2020 30,633 507,659 538,291 5.7 94.3 100.0 March 31, 2020 30,460 481,767 512,227 5.9 94.1 100.0 April 30, 2020 25,086 451,536 476,622 5.3 94.7 100.0 May 31, 2020 28,362 445,808 474,170 6.0 94.0 100.0 June 30, 2020 (negligibility period) 22,645 424,257 446,903 5.1 94.9 100.0 July 31, 2020 16,996 394,892 411,887 4.1 95.9 100.0 August 31, 2020 15,247 369,287 384,534 4.0 96.0 100.0 September 30, 2020 15,247 349,631 364,878 4.2 95.8 100.0 October 31, 2020 15,247 344,224 359,472 4.2 95.8 100.0 November 30, 2020 12,645 316,382 329,028 3.8 96.2 100.0 December 31, 2020 12,645 317,846 330,490 3.8 96.2 100.0
Source: Official U.S. import statistics for HTS statistical reporting numbers 7304.19.1020, 7304.19.1030, 7304.19.1045, 7304.19.1060, 7304.19.5020, 7304.19.5050, 7304.31.6050, 7304.39.0016, 7304.39.0020, 7304.39.0024, 7304.39.0028, 7304.39.0032, 7304.39.0036, 7304.39.0040, 7304.39.0044, 7304.39.0048, 7304.39.0052, 7304.39.0056, 7304.39.0062, 7304.39.0068, 7304.39.0072, 7304.51.5005, 7304.51.5060, 7304.59.6000, 7304.59.8010, 7304.59.8015, 7304.59.8020, 7304.59.8025, 7304.59.8030, 7304.59.8035, 7304.59.8040, 7304.59.8045, 7304.59.8050, 7304.59.8055, 7304.59.8060, 7304.59.8065, and 7304.59.8070, accessed February 8, 2021.

D-14
Figure D-3 SSLP pipe: U.S. imports from Russia in various twelve-month periods before and after the filing of the petitions, December 2018 through December 2020 (Official statistics only, no adjustments for nonsubject imports)
Source: Official U.S. import statistics for HTS statistical reporting numbers 7304.19.1020, 7304.19.1030, 7304.19.1045, 7304.19.1060, 7304.19.5020, 7304.19.5050, 7304.31.6050, 7304.39.0016, 7304.39.0020, 7304.39.0024, 7304.39.0028, 7304.39.0032, 7304.39.0036, 7304.39.0040, 7304.39.0044, 7304.39.0048, 7304.39.0052, 7304.39.0056, 7304.39.0062, 7304.39.0068, 7304.39.0072, 7304.51.5005, 7304.51.5060, 7304.59.6000, 7304.59.8010, 7304.59.8015, 7304.59.8020, 7304.59.8025, 7304.59.8030, 7304.59.8035, 7304.59.8040, 7304.59.8045, 7304.59.8050, 7304.59.8055, 7304.59.8060, 7304.59.8065, and 7304.59.8070, accessed February 8, 2021.
Domestic producers’ revised out-of-scope import data
According to these later U.S. importers' questionnaire submissions and revisions, the out-of-scope product that entered under the referenced HTS statistical reporting numbers include ***.17 ***.18 Table D-8 presents detailed information provided regarding the out-of-scope products that entered under the referenced HTS statistical reporting numbers by firm.
17 *** Importer Questionnaire responses, II-3c and II-13. 18 ***.
Neg
ligib
ility
perio
d
0
2
4
6
8
10
12
0.0
2.0
4.0
6.0
8.0
10.0
12.0
Dec Jan
Feb
Mar Ap
rM
ay Jun
Jul
Aug
Sep
Oct
Nov
Dec Jan
Feb
Mar Ap
rM
ay Jun
Jul
Aug
Sep
Oct
Nov
Dec
2018 2019 2020
Shar
e(p
erce
nt)
Threshold Russia Negligibility period

D-15
Table D-8 SSLP pipe: Out-of-scope product that entered under primary HTS statistical reporting numbers Firm Timing Products, standards, and specifications HTS statistical reporting numbers *** *** *** ***
*** *** *** ***
*** *** *** *** *** *** *** ***
*** *** *** ***
*** *** *** ***
*** *** *** *** Table continued.
D-16
Table D-8--Continued SSLP pipe: Out-of-scope product that entered under primary HTS statistical reporting numbers Firm Timing Products, standards, and specifications HTS statistical reporting numbers *** *** *** ***
Source: Compiled from data submitted in response to Commission questionnaires and Commission data requests.
Regarding out-of-scope products, respondent TMK argued in its posthearing brief that “{a}s long as the products meet the physical requirements in the scope, such as having a nominal outside diameter of less than or equal to 16 inches, then all carbon and alloy steel standard, line, and pressure pipes with those specific standard specifications must be reported as in-scope on questionnaires” and that the scope “clearly does not exclude all mechanical tubing.”19 TMK further state that *** “exclude high volumes pipe sold to mechanical tube specifications, but meeting the specified line pipe dimensions,” that are still within the scope of these investigations.20 Finally, TMK notes that “there are no exclusions for proprietary grades in the scope.”21
In response, the petitioner Vallourec stated, “there are many other excluded products that could enter even within the codes that do have an outer diameter limitation.”22 Acknowledging that imports that enter under the HTS heading 734.19 is “explicitly limited to line pipe,” Vallourec argued in its posthearing brief that “{t}he other 31 out of 37 primary scope HTS codes are for ‘other’ seamless pipes and tubes, which could include excluded mechanical tubing as well as other excluded tubing.”23
U.S. importers’ questionnaire revisions of *** have identified seamless pipe and tube products meeting particular standards they believe to be
19 Respondent TMK’s posthearing brief, p. 7-8. 20 Respondent TMK’s posthearing brief, p. 8. 21 Respondent TMK’s posthearing brief, p. 9. 22 Petitioner Vallourec’s posthearing brief, p. 4. 23 Petitioner Vallourec’s posthearing brief, p. 4.

D-17
excluded from the scope of these investigations.24 However, several of these identified standards could cover products, such as redraw hollows, that are likely within the scope of these investigations due to their further workability25 and possibly be used in standard, line, or pressure pipe applications.26 Hence, products sold under these provided standards cannot be considered entirely excluded from the scope of these investigations.
Non-SSLP pipe imports reported by *** may be considered out-of-scope for this report, due to consistent reporting from the preliminary phase of these investigations (in regards to ***) and general alignment with proprietary Customs data as well as early reporting of out-of-scope imports by these firms with monthly data submitted upon request of the Commission. Furthermore, the non-SSLP pipe products noted by *** are limited to *** which are more likely to be out of scope.27
Regarding out-of-scope products, Commerce issued a Preliminary Scope Decision Memorandum modifying the scope to clarify certain exclusions on January 13, 2021.28 The revised scope includes the following additional language:
“Also excluded from the scope of the investigations are: (1) oil country tubular goods consisting of drill pipe, casing, tubing and coupling stock; (2) all pipes meeting the chemical requirements of ASTM A-335 regardless of their conformity to the dimensional
24 Standards provided by parties include American Petroleum Institute (API) 5CT Casing and Tubing, ASTM International’s ASTM 335, ASTM A519, ASTM A-618, European Norm (EN) 10297-1, EN 10305-1, and various company-specific standards. Pipe conforming to ASTM A519 is suitable to be further worked by cold finishing. Further, a U.S. Customs and Border Protection (“CBP”) ruling previously determined that pipe imported under ASTM A519 may be considered hollow profiles. Given that information, exclusions for pipes produced to ASTM A519 may conflict with the scope of these investigations because these products are suitable for cold rolling and are considered a hollow profile, which is explicitly included in the provided scope. ASTM International, “ASTM A519 / ASTM A519M-17,” accessed March 17, 2021, https://www.astm.org/Standards/A519.htm. 25 CBP, “Country of Origin Marking of Small Diameter Carbon and Alloy Seamless Condenser, Heat Exchanger, Boiler, Superheater and Mechanical Tubes; Tube Hollows; Cold Drawing; Annealing; Normalizing; Tempering,” Ruling HQ 558825, February 9, 1995, https://rulings.cbp.gov/ruling/558825, accessed March 17, 2021. 26 The scope of a related investigation specifies that products manufactured to ASTM A-618 may be used in standard, line, and pressure pipe applications. U.S. Department of Commerce, International Trade Administration, "Carbon and Alloy Seamless Standard, Line, and Pressure Pipe (under 4 ½ Inches) from Japan, Inv. No. A-588-851,” https://legacy.trade.gov/enforcement/operations/scope/country/japan/products/japan-carbon-alloy-seamless-standard-line-pressure-pipe-under-4n-half-inch.asp, accessed March 17, 2021. 27 EN 10305-1 is a European standard for seamless precision tubes or pipes with a variety of applications in the mechanical tubing and automotive industry. ***. 28 Department of Commerce, Preliminary Scope Decision Memorandum, January 13, 2021.

D-18
requirements of ASTM A-53, ASTM A-106 or API 5L; and (3) the exclusion for ASTM A335 applies to pipes meeting the comparable specifications GOST 550-75.” 29
Based on the Preliminary Scope Decision Memorandum, product descriptions of out-of-scope imports provided by firms, and reasons for revisions, the scope adjustment did not factor into the revisions.30
Methodological concerns
Table D-9 presents the volume of U.S. imports of SSLP pipe based on official statistics for the statistical reporting numbers and U.S. imports of non-SSLP pipe from data submitted in response to Commission questionnaires during 2018-20. These U.S. imports of non-SSLP pipe include later responses by *** as well as those reported in the earlier U.S. importers’ questionnaire responses ***. According to official statistics, U.S. imports of SSLP pipe from Russia remain the smallest among subject sources of U.S. imports SSLP pipe. ***
Removing these reported out-of-scope U.S. imports of non-SSLP pipe from official import statistics of U.S. imports according to the primary HTS statistical reporting numbers for SSLP pipe implies substantial methodological concerns. First, when reported out of scope U.S. imports of non-SSLP pipe is removed from official statistics of U.S. imports, in-scope U.S. imports of SSLP pipe from Germany are *** short tons in 2018. Upon further inspection, *** suggest that *** may have grossly overestimated import volumes of product that entered under the primary HTS statistical reporting numbers for SSLP pipe from Germany by *** in 2018. The same data imply that *** may have also overestimated import volumes by *** short tons in 2018. Other firms, and all firms that provided earlier responses, reported out-of-scope imports that entered under the primary HTS statistical reporting numbers for SSLP pipe in 2018 had a *** short ton absolute difference in reported imports compared to
29 See Part I for the scope for these investigations and Department of Commerce, Preliminary Scope Decision Memorandum, January 13, 2021. 30 In its posthearing brief, the petitioner remarked, “Vallourec Star does not believe that these clarifying changes to the scope of the investigations actually changed the scope of the products covered nor will have any impact on these investigations.” Petitioner’s posthearing brief, Post-Hearing Question, p. 40.

D-19
***.31 Unfortunately, due to later receipt of these revisions to U.S. importers’ questionnaire responses, this information is not included elsewhere within this report.
Table D-9 SSLP pipe: U.S. imports of SSLP pipe and Non-SSLP pipe, by source, 2018-20
Item Calendar year
2018 2019 2020 Quantity (short tons) U.S. imports from.-- Czechia 42,867 39,243 16,227
Korea 17,460 18,863 25,428 Russia 41,914 43,689 12,645 Ukraine 42,962 48,134 36,157
Subject sources 145,203 149,929 90,457 Subject sources less Russia 103,289 106,239 77,812
Germany 58,327 48,541 37,183 Mexico 83,605 57,194 54,320 All other sources 408,309 336,089 148,530
Nonsubject sources 550,241 441,823 240,034 Nonsubject sources plus Russia 592,155 485,512 252,678
All import sources 695,444 591,751 330,490 Quantity (short tons) U.S. imports of Non-SSLP pipe from.-- Czechia *** *** ***
Korea *** *** *** Russia *** *** *** Ukraine *** *** ***
Subject sources *** *** *** Subject sources less Russia *** *** ***
Germany *** *** *** Mexico *** *** *** All other sources *** *** ***
Nonsubject sources *** *** *** Nonsubject sources plus Russia *** *** ***
All import sources *** *** *** Table continued.
31 *** may have also overestimated its imports in 2018 by *** short tons and has provided supporting monthly import data. All other responding firms exhibit absolute differences of *** short tons.
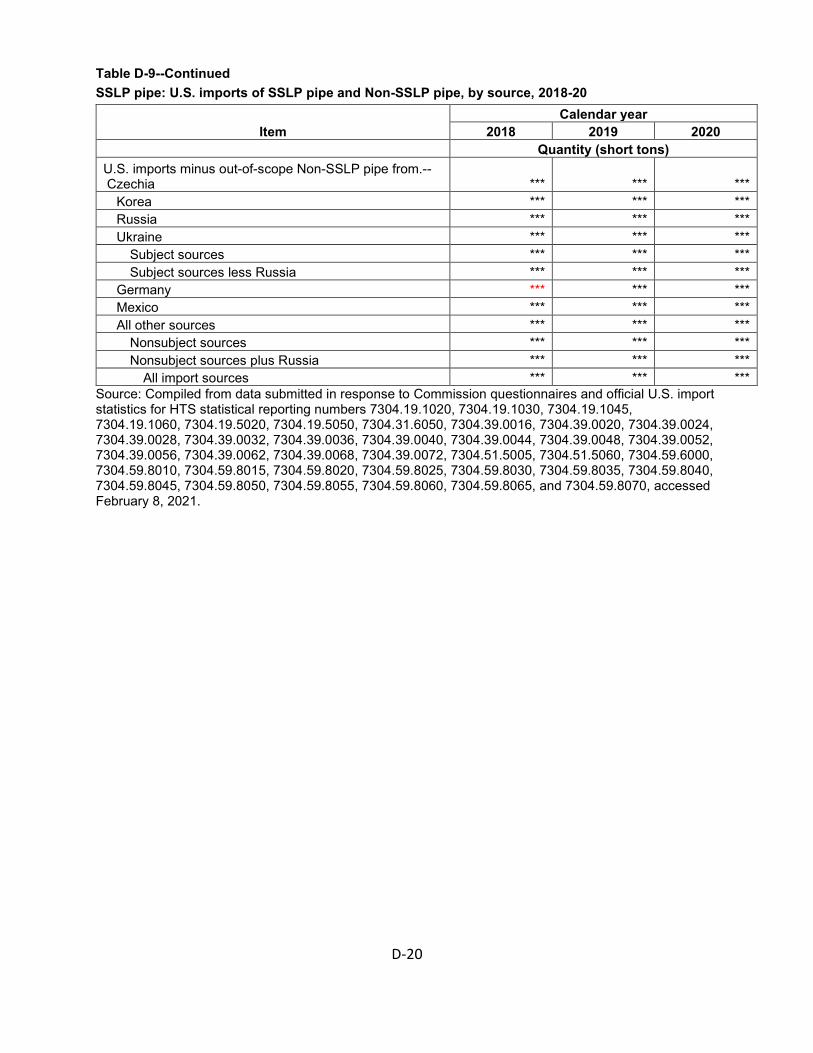
D-20
Table D-9--Continued SSLP pipe: U.S. imports of SSLP pipe and Non-SSLP pipe, by source, 2018-20
Item Calendar year
2018 2019 2020 Quantity (short tons) U.S. imports minus out-of-scope Non-SSLP pipe from.-- Czechia *** *** ***
Korea *** *** *** Russia *** *** *** Ukraine *** *** ***
Subject sources *** *** *** Subject sources less Russia *** *** ***
Germany *** *** *** Mexico *** *** *** All other sources *** *** ***
Nonsubject sources *** *** *** Nonsubject sources plus Russia *** *** ***
All import sources *** *** *** Source: Compiled from data submitted in response to Commission questionnaires and official U.S. import statistics for HTS statistical reporting numbers 7304.19.1020, 7304.19.1030, 7304.19.1045, 7304.19.1060, 7304.19.5020, 7304.19.5050, 7304.31.6050, 7304.39.0016, 7304.39.0020, 7304.39.0024, 7304.39.0028, 7304.39.0032, 7304.39.0036, 7304.39.0040, 7304.39.0044, 7304.39.0048, 7304.39.0052, 7304.39.0056, 7304.39.0062, 7304.39.0068, 7304.39.0072, 7304.51.5005, 7304.51.5060, 7304.59.6000, 7304.59.8010, 7304.59.8015, 7304.59.8020, 7304.59.8025, 7304.59.8030, 7304.59.8035, 7304.59.8040, 7304.59.8045, 7304.59.8050, 7304.59.8055, 7304.59.8060, 7304.59.8065, and 7304.59.8070, accessed February 8, 2021.

E-1
APPENDIX E
NONSUBJECT COUNTRY PRICE DATA


E-3
One importer, ***, reported price data for imports of SSLP pipe from Germany for products 3-6 and one, ***, reported price data for SSLP pipe imported from Mexico for products 1-5. Price data reported by these firms accounted for *** percent of U.S. commercial shipments from Germany and *** percent of U.S. commercial shipments from Mexico in 2020. These price items and accompanying data are comparable to those presented in tables V-3 to V-8. Price and quantity data for Germany and Mexico are shown in tables E-1 to E-6 and in figures E-1 to E-6 (with domestic and subject sources).
In comparing nonsubject country pricing data with U.S. producer pricing data, prices for product imported from Germany were lower than prices for U.S.-produced product in *** instances and higher in ***. In comparing nonsubject country pricing data with subject country pricing data, prices for product imported from Germany were lower than prices for product imported from subject countries in *** instances and higher in *** instances.
In comparing nonsubject country pricing data with U.S. producer pricing data, prices for product imported from Mexico were lower than prices for U.S.-produced product in *** instances and higher in *** instances. In comparing nonsubject country pricing data with subject country pricing data, prices for product imported from Mexico were lower than prices for product imported from subject countries in *** instances and higher in *** instances. A summary of price differentials is presented in table E-7.

E-4
Table E-1 SSLP Pipe: Weighted-average f.o.b. prices and quantities of imported product 1, by quarter, January 2018 to December 2020
Period
United States Germany Mexico Price
(dollars per short ton)
Quantity (short tons)
Price (dollars per short ton)
Quantity (short tons)
Price (dollars per short ton)
Quantity (short tons)
2018: Jan.-Mar. *** *** *** *** *** *** Apr.-Jun. *** *** *** *** *** *** Jul.-Sep. *** *** *** *** *** *** Oct.-Dec. *** *** *** *** *** *** 2019: Jan.-Mar. *** *** *** *** *** *** Apr.-Jun. *** *** *** *** *** *** Jul.-Sep. *** *** *** *** *** *** Oct.-Dec. *** *** *** *** *** *** 2020: Jan.-Mar. *** *** *** *** *** *** Apr.-Jun. *** *** *** *** *** *** Jul.-Sep. *** *** *** *** *** *** Oct.-Dec. *** *** *** *** *** ***
Note: Product 1: Seamless pipe stenciled to meet one or more of the following specifications: ASTM A-106 grade B, ASTM A-53 grade B, API 5L grade B, and API 5L grade X-42 specifications; 3” nominal size (3 1/2 inch OD x 0.3 wall thickness); plain ends. Source: Compiled from data submitted in response to Commission questionnaires.

E-5
Table E-2 SSLP Pipe: Weighted-average f.o.b. prices and quantities of imported product 2, by quarter, January 2018 to December 2020
Period
United States Germany Mexico Price
(dollars per short ton)
Quantity (short tons)
Price (dollars per short ton)
Quantity (short tons)
Price (dollars per short ton)
Quantity (short tons)
2018: Jan.-Mar. *** *** *** *** *** *** Apr.-Jun. *** *** *** *** *** *** Jul.-Sep. *** *** *** *** *** *** Oct.-Dec. *** *** *** *** *** *** 2019: Jan.-Mar. *** *** *** *** *** *** Apr.-Jun. *** *** *** *** *** *** Jul.-Sep. *** *** *** *** *** *** Oct.-Dec. *** *** *** *** *** *** 2020: Jan.-Mar. *** *** *** *** *** *** Apr.-Jun. *** *** *** *** *** *** Jul.-Sep. *** *** *** *** *** *** Oct.-Dec. *** *** *** *** *** ***
Note: Product 2: Seamless pipe stenciled to meet one or more of the following specifications: ASTM A-106 grade B, ASTM A-53 grade B, API 5L grade B, and API 5L grade X-42 specifications; 4” nominal size (4 1/2 inch OD x 0.237 wall thickness); plain ends. Source: Compiled from data submitted in response to Commission questionnaires.

E-6
Table E-3 SSLP Pipe: Weighted-average f.o.b. prices and quantities of imported product 3, by quarter, January 2018 to December 2020
Period
United States Germany Mexico Price
(dollars per short ton)
Quantity (short tons)
Price (dollars per short ton)
Quantity (short tons)
Price (dollars per short ton)
Quantity (short tons)
2018: Jan.-Mar. *** *** *** *** *** *** Apr.-Jun. *** *** *** *** *** *** Jul.-Sep. *** *** *** *** *** *** Oct.-Dec. *** *** *** *** *** *** 2019: Jan.-Mar. *** *** *** *** *** *** Apr.-Jun. *** *** *** *** *** *** Jul.-Sep. *** *** *** *** *** *** Oct.-Dec. *** *** *** *** *** *** 2020: Jan.-Mar. *** *** *** *** *** *** Apr.-Jun. *** *** *** *** *** *** Jul.-Sep. *** *** *** *** *** *** Oct.-Dec. *** *** *** *** *** ***
Note: Product 3: Seamless pipe stenciled to meet one or more of the following specifications: ASTM A-106 grade B, ASTM A-53 grade B, API 5L grade B, and API 5L grade X-42 specifications; 6” nominal size (6 5/8 inch OD x 0.280 wall thickness); plain ends. Source: Compiled from data submitted in response to Commission questionnaires.

E-7
Table E-4 SSLP Pipe: Weighted-average f.o.b. prices and quantities of imported product 4, by quarter, January 2018 to December 2020
Period
United States Germany Mexico Price
(dollars per short ton)
Quantity (short tons)
Price (dollars per short ton)
Quantity (short tons)
Price (dollars per short ton)
Quantity (short tons)
2018: Jan.-Mar. *** *** *** *** *** *** Apr.-Jun. *** *** *** *** *** *** Jul.-Sep. *** *** *** *** *** *** Oct.-Dec. *** *** *** *** *** *** 2019: Jan.-Mar. *** *** *** *** *** *** Apr.-Jun. *** *** *** *** *** *** Jul.-Sep. *** *** *** *** *** *** Oct.-Dec. *** *** *** *** *** *** 2020: Jan.-Mar. *** *** *** *** *** *** Apr.-Jun. *** *** *** *** *** *** Jul.-Sep. *** *** *** *** *** *** Oct.-Dec. *** *** *** *** *** ***
Note: Product 4: Seamless pipe stenciled to meet one or more of the following specifications: ASTM A-106 grade B, ASTM A-53 grade B, API 5L grade B, and API 5L grade X-42 specifications; 8” nominal size (8 5/8 inch OD x 0.322 wall thickness); plain ends. Source: Compiled from data submitted in response to Commission questionnaires.

E-8
Table E-5 SSLP Pipe: Weighted-average f.o.b. prices and quantities of imported product 5, by quarter, January 2018 to December 2020
Period
United States Germany Mexico Price
(dollars per short ton)
Quantity (short tons)
Price (dollars per short ton)
Quantity (short tons)
Price (dollars per short ton)
Quantity (short tons)
2018: Jan.-Mar. *** *** *** *** *** *** Apr.-Jun. *** *** *** *** *** *** Jul.-Sep. *** *** *** *** *** *** Oct.-Dec. *** *** *** *** *** *** 2019: Jan.-Mar. *** *** *** *** *** *** Apr.-Jun. *** *** *** *** *** *** Jul.-Sep. *** *** *** *** *** *** Oct.-Dec. *** *** *** *** *** *** 2020: Jan.-Mar. *** *** *** *** *** *** Apr.-Jun. *** *** *** *** *** *** Jul.-Sep. *** *** *** *** *** *** Oct.-Dec. *** *** *** *** *** ***
Note: Product 5: Seamless pipe stenciled to meet one or more of the following specifications: ASTM A-106 grade B, ASTM A-53 grade B, API 5L grade B, and API 5L grade X-42 specifications; 12” nominal size (12 3/4 inch OD x 0.375 wall thickness); plain ends. Source: Compiled from data submitted in response to Commission questionnaires.

E-9
Table E-6 SSLP Pipe: Weighted-average f.o.b. prices and quantities of imported product 6, by quarter, January 2018 to December 2020
Period
United States Germany Mexico Price
(dollars per short ton)
Quantity (short tons)
Price (dollars per short ton)
Quantity (short tons)
Price (dollars per short ton)
Quantity (short tons)
2018: Jan.-Mar. *** *** *** *** *** *** Apr.-Jun. *** *** *** *** *** *** Jul.-Sep. *** *** *** *** *** *** Oct.-Dec. *** *** *** *** *** *** 2019: Jan.-Mar. *** *** *** *** *** *** Apr.-Jun. *** *** *** *** *** *** Jul.-Sep. *** *** *** *** *** *** Oct.-Dec. *** *** *** *** *** *** 2020: Jan.-Mar. *** *** *** *** *** *** Apr.-Jun. *** *** *** *** *** *** Jul.-Sep. *** *** *** *** *** *** Oct.-Dec. *** *** *** *** *** ***
Note: Product 6: Seamless pipe stenciled to meet one or more of the following specifications: ASTM A-106 grade B, ASTM A-53 grade B, API 5L grade B, and API 5L grade X-42 specifications; 16” nominal size (16 inch OD x 0.375 wall thickness); plain ends. Source: Compiled from data submitted in response to Commission questionnaires.

E-10
Figure E-1 SSLP pipe: Weighted-average f.o.b. prices and quantities of domestic and imported product 1, by quarter, January 2018 to December 2020
* * * * * * * * Product 1: Seamless pipe stenciled to meet one or more of the following specifications: ASTM A-106 grade B, ASTM A-53 grade B, API 5L grade B, and API 5L grade X-42 specifications; 3” nominal size (3 1/2 inch OD x 0.3 wall thickness); plain ends. Source: Compiled from data submitted in response to Commission questionnaires.

E-11
Figure E-2 SSLP pipe: Weighted-average f.o.b. prices and quantities of domestic and imported product 2, by quarter, January 2018 to December 2020
* * * * * * * * Product 2: Seamless pipe stenciled to meet one or more of the following specifications: ASTM A-106 grade B, ASTM A-53 grade B, API 5L grade B, and API 5L grade X-42 specifications; 4” nominal size (4 1/2 inch OD x 0.237 wall thickness); plain ends. Source: Compiled from data submitted in response to Commission questionnaires.

E-12
Figure E-3 SSLP pipe: Weighted-average f.o.b. prices and quantities of domestic and imported product 3, by quarter, January 2018 to December 2020
* * * * * * * * Product 3: Seamless pipe stenciled to meet one or more of the following specifications: ASTM A-106 grade B, ASTM A-53 grade B, API 5L grade B, and API 5L grade X-42 specifications; 6” nominal size (6 5/8 inch OD x 0.280 wall thickness); plain ends. Source: Compiled from data submitted in response to Commission questionnaires.

E-13
Figure E-4 SSLP pipe: Weighted-average f.o.b. prices and quantities of domestic and imported product 4, by quarter, January 2018 to December 2020
* * * * * * * * Product 4: Seamless pipe stenciled to meet one or more of the following specifications: ASTM A-106 grade B, ASTM A-53 grade B, API 5L grade B, and API 5L grade X-42 specifications; 8” nominal size (8 5/8 inch OD x 0.322 wall thickness); plain ends. Source: Compiled from data submitted in response to Commission questionnaires.

E-14
Figure E-5 SSLP pipe: Weighted-average f.o.b. prices and quantities of domestic and imported product 5, by quarter, January 2018 to December 2020
* * * * * * * * Product 5: Seamless pipe stenciled to meet one or more of the following specifications: ASTM A-106 grade B, ASTM A-53 grade B, API 5L grade B, and API 5L grade X-42 specifications; 12” nominal size (12 3/4 inch OD x 0.375 wall thickness); plain ends. Source: Compiled from data submitted in response to Commission questionnaires.

E-15
Figure E-6 SSLP pipe: Weighted-average f.o.b. prices and quantities of domestic and imported product 6, by quarter, January 2018 to December 2020
* * * * * * * * Product 6: Seamless pipe stenciled to meet one or more of the following specifications: ASTM A-106 grade B, ASTM A-53 grade B, API 5L grade B, and API 5L grade X-42 specifications; 16” nominal size (16 inch OD x 0.375 wall thickness); plain ends. Source: Compiled from data submitted in response to Commission questionnaires.
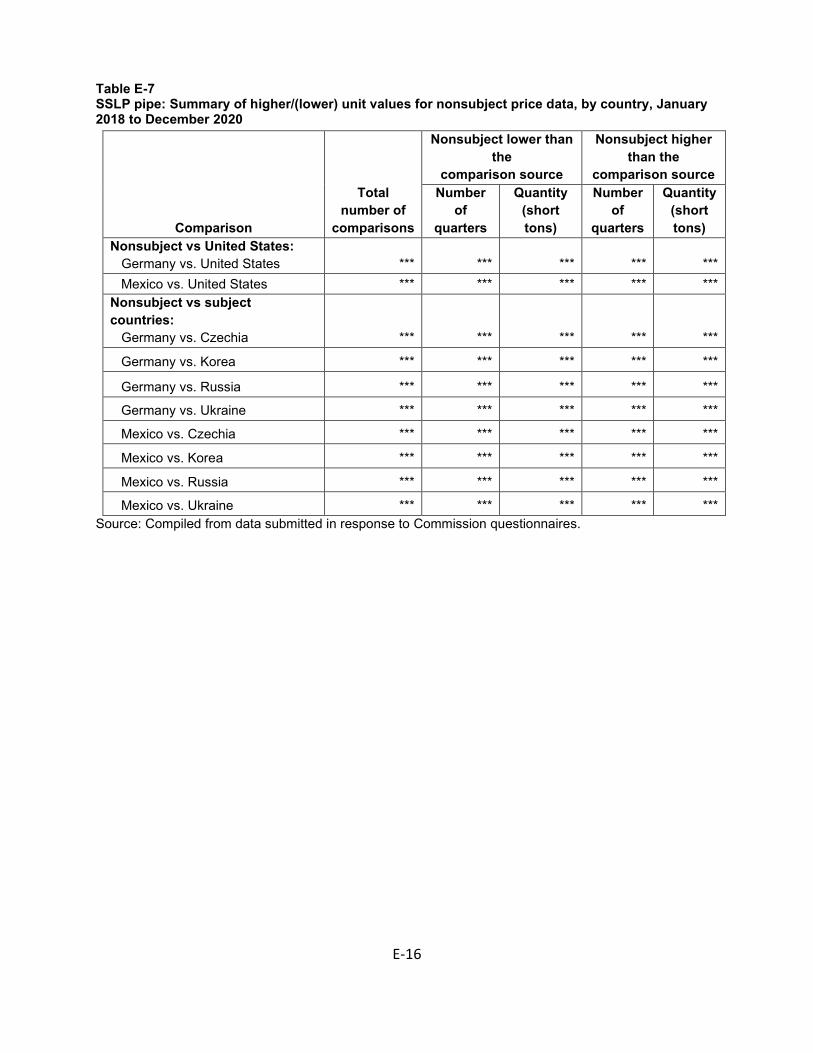
E-16
Table E-7 SSLP pipe: Summary of higher/(lower) unit values for nonsubject price data, by country, January 2018 to December 2020
Comparison
Total number of
comparisons
Nonsubject lower than the
comparison source
Nonsubject higher than the
comparison source Number
of quarters
Quantity (short tons)
Number of
quarters
Quantity (short tons)
Nonsubject vs United States: Germany vs. United States *** *** *** *** ***
Mexico vs. United States *** *** *** *** *** Nonsubject vs subject countries:
Germany vs. Czechia *** *** *** *** ***
Germany vs. Korea *** *** *** *** ***
Germany vs. Russia *** *** *** *** ***
Germany vs. Ukraine *** *** *** *** ***
Mexico vs. Czechia *** *** *** *** ***
Mexico vs. Korea *** *** *** *** ***
Mexico vs. Russia *** *** *** *** ***
Mexico vs. Ukraine *** *** *** *** *** Source: Compiled from data submitted in response to Commission questionnaires.
