seamless refined copper pipe and tube from china ... - · pdf filevii-2 the industry in ... by...
TRANSCRIPT
U.S. International Trade CommissionPublication 4193 November 2010
Washington, DC 20436
Seamless Refined Copper Pipe and Tube from China and Mexico
Investigation Nos. 731-TA-1174-1175 (Final)

U.S. International Trade Commission
COMMISSIONERS
Deanna Tanner Okun, Chairman Irving A. Williamson, Vice Chairman
Charlotte R. Lane Daniel R. Pearson Shara L. Aranoff Dean A. Pinkert
Karen Laney
Staff assigned
Address all communications to Secretary to the Commission
United States International Trade Commission Washington, DC 20436
Acting Director of Operations
Edward Petronzio, Investigator (205-3176) Karl Tsuji, Industry Analyst (205-3434)
James Fetzer, Economist (708-5403) Mary Klir, Accountant (205-3247)
Charles St. Charles, Attorney (205-2782) Lita David-Harris, Statistician (205-2537)
James McClure, Supervisory Investigator (205-3191)

U.S. International Trade CommissionWashington, DC 20436
www.usitc.gov
Publication 4193 November 2010
Seamless Refined Copper Pipe and Tube from China and Mexico
Investigation Nos. 731-TA-1174-1175 (Final)


TABLE OF CONTENTS
Page
Determinations . . . . . . . . . . . . . . . . . . . . . . . . . . . . . . . . . . . . . . . . . . . . . . . . . . . . . . . . . . . . . . . . . 1Views of the Commission . . . . . . . . . . . . . . . . . . . . . . . . . . . . . . . . . . . . . . . . . . . . . . . . . . . . . . . . . 3Separate Views of Commissioner Charlotte R. Lane . . . . . . . . . . . . . . . . . . . . . . . . . . . . . . . . . . 37
Part I: Introduction . . . . . . . . . . . . . . . . . . . . . . . . . . . . . . . . . . . . . . . . . . . . . . . . . . . . . . . . . . . . I-1Background . . . . . . . . . . . . . . . . . . . . . . . . . . . . . . . . . . . . . . . . . . . . . . . . . . . . . . . . . . . . . . . . . . I-1Statutory criteria and organization of the report . . . . . . . . . . . . . . . . . . . . . . . . . . . . . . . . . . . . . . I-1
Statutory criteria . . . . . . . . . . . . . . . . . . . . . . . . . . . . . . . . . . . . . . . . . . . . . . . . . . . . . . . . . . . I-1Organization of the report . . . . . . . . . . . . . . . . . . . . . . . . . . . . . . . . . . . . . . . . . . . . . . . . . . . . I-2
U.S. market summary . . . . . . . . . . . . . . . . . . . . . . . . . . . . . . . . . . . . . . . . . . . . . . . . . . . . . . . . . . I-3Summary data and data sources . . . . . . . . . . . . . . . . . . . . . . . . . . . . . . . . . . . . . . . . . . . . . . . . . . I-3Previous and related investigations . . . . . . . . . . . . . . . . . . . . . . . . . . . . . . . . . . . . . . . . . . . . . . . . I-3Nature and extent of sales at LTFV . . . . . . . . . . . . . . . . . . . . . . . . . . . . . . . . . . . . . . . . . . . . . . . I-3The subject merchandise . . . . . . . . . . . . . . . . . . . . . . . . . . . . . . . . . . . . . . . . . . . . . . . . . . . . . . . . I-4
Commerce’s scope . . . . . . . . . . . . . . . . . . . . . . . . . . . . . . . . . . . . . . . . . . . . . . . . . . . . . . . . . . I-4Tariff treatment . . . . . . . . . . . . . . . . . . . . . . . . . . . . . . . . . . . . . . . . . . . . . . . . . . . . . . . . . . . . I-5
The product . . . . . . . . . . . . . . . . . . . . . . . . . . . . . . . . . . . . . . . . . . . . . . . . . . . . . . . . . . . . . . . . . . I-6Description and applications . . . . . . . . . . . . . . . . . . . . . . . . . . . . . . . . . . . . . . . . . . . . . . . . . . I-6Manufacturing processes . . . . . . . . . . . . . . . . . . . . . . . . . . . . . . . . . . . . . . . . . . . . . . . . . . . . . I-10
Domestic like product issues . . . . . . . . . . . . . . . . . . . . . . . . . . . . . . . . . . . . . . . . . . . . . . . . . . . . I-15Domestic industry issues . . . . . . . . . . . . . . . . . . . . . . . . . . . . . . . . . . . . . . . . . . . . . . . . . . . . . . . I-16
Part II: Conditions of competition in the U.S. market . . . . . . . . . . . . . . . . . . . . . . . . . . . . . . . . II-1U.S. market characteristics . . . . . . . . . . . . . . . . . . . . . . . . . . . . . . . . . . . . . . . . . . . . . . . . . . . . . . II-1Channels of distribution . . . . . . . . . . . . . . . . . . . . . . . . . . . . . . . . . . . . . . . . . . . . . . . . . . . . . . . . II-1Supply and demand considerations . . . . . . . . . . . . . . . . . . . . . . . . . . . . . . . . . . . . . . . . . . . . . . . . II-3
Supply . . . . . . . . . . . . . . . . . . . . . . . . . . . . . . . . . . . . . . . . . . . . . . . . . . . . . . . . . . . . . . . . . . . II-3Demand . . . . . . . . . . . . . . . . . . . . . . . . . . . . . . . . . . . . . . . . . . . . . . . . . . . . . . . . . . . . . . . . . . II-6
Substitutability issues . . . . . . . . . . . . . . . . . . . . . . . . . . . . . . . . . . . . . . . . . . . . . . . . . . . . . . . . . . II-9Factors affecting purchasing decisions . . . . . . . . . . . . . . . . . . . . . . . . . . . . . . . . . . . . . . . . . . II-9Comparison of the U.S.-produced and imported SRC pipe and tube . . . . . . . . . . . . . . . . . . . II-12
Elasticity estimates . . . . . . . . . . . . . . . . . . . . . . . . . . . . . . . . . . . . . . . . . . . . . . . . . . . . . . . . . . . . II-17U.S. supply elasticity . . . . . . . . . . . . . . . . . . . . . . . . . . . . . . . . . . . . . . . . . . . . . . . . . . . . . . . II-17U.S. demand elasticity . . . . . . . . . . . . . . . . . . . . . . . . . . . . . . . . . . . . . . . . . . . . . . . . . . . . . . . II-17Substitution elasticity . . . . . . . . . . . . . . . . . . . . . . . . . . . . . . . . . . . . . . . . . . . . . . . . . . . . . . . II-17
Part III: U.S. producers’ production, shipments, and employment . . . . . . . . . . . . . . . . . . . . . . III-1U.S. producers . . . . . . . . . . . . . . . . . . . . . . . . . . . . . . . . . . . . . . . . . . . . . . . . . . . . . . . . . . . . . . . III-1U.S. capacity, production, and capacity utilization . . . . . . . . . . . . . . . . . . . . . . . . . . . . . . . . . . . III-3U.S. producers’ shipments . . . . . . . . . . . . . . . . . . . . . . . . . . . . . . . . . . . . . . . . . . . . . . . . . . . . . . III-4U.S. producers’ inventories . . . . . . . . . . . . . . . . . . . . . . . . . . . . . . . . . . . . . . . . . . . . . . . . . . . . . III-6U.S. producers’ imports and purchases . . . . . . . . . . . . . . . . . . . . . . . . . . . . . . . . . . . . . . . . . . . . . III-6U.S. employment, wages, and productivity . . . . . . . . . . . . . . . . . . . . . . . . . . . . . . . . . . . . . . . . . III-7
i

TABLE OF CONTENTS
Page
Part IV: U.S. imports, apparent consumption, and market shares . . . . . . . . . . . . . . . . . . . . . . IV-1U.S. importers . . . . . . . . . . . . . . . . . . . . . . . . . . . . . . . . . . . . . . . . . . . . . . . . . . . . . . . . . . . . . . . . IV-1U.S. imports . . . . . . . . . . . . . . . . . . . . . . . . . . . . . . . . . . . . . . . . . . . . . . . . . . . . . . . . . . . . . . . . . IV-3Cumulation considerations . . . . . . . . . . . . . . . . . . . . . . . . . . . . . . . . . . . . . . . . . . . . . . . . . . . . . . IV-6
Geographic markets . . . . . . . . . . . . . . . . . . . . . . . . . . . . . . . . . . . . . . . . . . . . . . . . . . . . . . . . . IV-6Simultaneous presence in the market . . . . . . . . . . . . . . . . . . . . . . . . . . . . . . . . . . . . . . . . . . . IV-8
Negligibility . . . . . . . . . . . . . . . . . . . . . . . . . . . . . . . . . . . . . . . . . . . . . . . . . . . . . . . . . . . . . . . . . IV-10Apparent U.S. consumption . . . . . . . . . . . . . . . . . . . . . . . . . . . . . . . . . . . . . . . . . . . . . . . . . . . . . IV-10U.S. market shares . . . . . . . . . . . . . . . . . . . . . . . . . . . . . . . . . . . . . . . . . . . . . . . . . . . . . . . . . . . . IV-12Ratio of imports to U.S. production . . . . . . . . . . . . . . . . . . . . . . . . . . . . . . . . . . . . . . . . . . . . . . . IV-13
Part V: Pricing and related information . . . . . . . . . . . . . . . . . . . . . . . . . . . . . . . . . . . . . . . . . . . . V-1Factors affecting prices . . . . . . . . . . . . . . . . . . . . . . . . . . . . . . . . . . . . . . . . . . . . . . . . . . . . . . . . . V-1
Raw material costs . . . . . . . . . . . . . . . . . . . . . . . . . . . . . . . . . . . . . . . . . . . . . . . . . . . . . . . . . . V-1U.S. inland transportation costs . . . . . . . . . . . . . . . . . . . . . . . . . . . . . . . . . . . . . . . . . . . . . . . . V-1
Pricing practices . . . . . . . . . . . . . . . . . . . . . . . . . . . . . . . . . . . . . . . . . . . . . . . . . . . . . . . . . . . . . . V-2Pricing methods . . . . . . . . . . . . . . . . . . . . . . . . . . . . . . . . . . . . . . . . . . . . . . . . . . . . . . . . . . . . V-2Lead times . . . . . . . . . . . . . . . . . . . . . . . . . . . . . . . . . . . . . . . . . . . . . . . . . . . . . . . . . . . . . . . . V-3Sales terms and discounts . . . . . . . . . . . . . . . . . . . . . . . . . . . . . . . . . . . . . . . . . . . . . . . . . . . . V-4
Price data . . . . . . . . . . . . . . . . . . . . . . . . . . . . . . . . . . . . . . . . . . . . . . . . . . . . . . . . . . . . . . . . . . . V-4Price trends . . . . . . . . . . . . . . . . . . . . . . . . . . . . . . . . . . . . . . . . . . . . . . . . . . . . . . . . . . . . . . . V-4Price comparisons . . . . . . . . . . . . . . . . . . . . . . . . . . . . . . . . . . . . . . . . . . . . . . . . . . . . . . . . . . V-12
Lost sales and lost revenues . . . . . . . . . . . . . . . . . . . . . . . . . . . . . . . . . . . . . . . . . . . . . . . . . . . . . V-13
Part VI: Financial experience of the U.S. producers . . . . . . . . . . . . . . . . . . . . . . . . . . . . . . . . . . VI-1Introduction . . . . . . . . . . . . . . . . . . . . . . . . . . . . . . . . . . . . . . . . . . . . . . . . . . . . . . . . . . . . . . . . . . VI-1Operations on SRC pipe and tube . . . . . . . . . . . . . . . . . . . . . . . . . . . . . . . . . . . . . . . . . . . . . . . . VI-1Variance analysis . . . . . . . . . . . . . . . . . . . . . . . . . . . . . . . . . . . . . . . . . . . . . . . . . . . . . . . . . . . . . VI-3Capital expenditures and research and development expenses . . . . . . . . . . . . . . . . . . . . . . . . . . . VI-4Assets and return on investment . . . . . . . . . . . . . . . . . . . . . . . . . . . . . . . . . . . . . . . . . . . . . . . . . . VI-5Capital and investment . . . . . . . . . . . . . . . . . . . . . . . . . . . . . . . . . . . . . . . . . . . . . . . . . . . . . . . . . VI-6
Actual negative effects . . . . . . . . . . . . . . . . . . . . . . . . . . . . . . . . . . . . . . . . . . . . . . . . . . . . . . VI-6Anticipated negative effects . . . . . . . . . . . . . . . . . . . . . . . . . . . . . . . . . . . . . . . . . . . . . . . . . . VI-6
Part VII: Threat considerations and information on nonsubject countries . . . . . . . . . . . . . . . VII-1The industry in China . . . . . . . . . . . . . . . . . . . . . . . . . . . . . . . . . . . . . . . . . . . . . . . . . . . . . . . . . . VII-2The industry in Mexico . . . . . . . . . . . . . . . . . . . . . . . . . . . . . . . . . . . . . . . . . . . . . . . . . . . . . . . . . VII-5U.S. importers’ inventories of SRC pipe and tube . . . . . . . . . . . . . . . . . . . . . . . . . . . . . . . . . . . . VII-7U.S. importer’s current orders . . . . . . . . . . . . . . . . . . . . . . . . . . . . . . . . . . . . . . . . . . . . . . . . . . . VII-7Antidumping and countervailing duty investigations in third-country markets . . . . . . . . . . . . . . VII-7Information on producers in nonsubject countries . . . . . . . . . . . . . . . . . . . . . . . . . . . . . . . . . . . . VII-7
AppendixesA. Federal Register notices . . . . . . . . . . . . . . . . . . . . . . . . . . . . . . . . . . . . . . . . . . . . . . . . . . . . . . . . A-1B. List of hearing witnesses . . . . . . . . . . . . . . . . . . . . . . . . . . . . . . . . . . . . . . . . . . . . . . . . . . . . . . . . B-1
ii

TABLE OF CONTENTS
Page
Appendixes–ContinuedC. Summary data . . . . . . . . . . . . . . . . . . . . . . . . . . . . . . . . . . . . . . . . . . . . . . . . . . . . . . . . . . . . . . . . C-1D. Tariff treatment . . . . . . . . . . . . . . . . . . . . . . . . . . . . . . . . . . . . . . . . . . . . . . . . . . . . . . . . . . . . . . . D-1E. U.S. production and import data regarding industrial and plumbing SRC pipe and tube . . . . . . E-1F. U.S. producers’ and importers’ comments regarding the comparability of industrial and plumbing
SRC pipe and tube . . . . . . . . . . . . . . . . . . . . . . . . . . . . . . . . . . . . . . . . . . . . . . . . . . . . . . . . . . F-1G. Nonsubject country price data . . . . . . . . . . . . . . . . . . . . . . . . . . . . . . . . . . . . . . . . . . . . . . . . . . . G-1
Note.–Information that would reveal confidential operations of individual concerns may not be publishedand therefore has been deleted from this report. Such deletions are indicated by asterisks.
iii

UNITED STATES INTERNATIONAL TRADE COMMISSION
Investigation Nos. 731-TA-1174-1175 (Final)
SEAMLESS REFINED COPPER PIPE AND TUBE FROM CHINA AND MEXICO
DETERMINATIONSOn the basis of the record1 developed in the subject investigations, the United States International
Trade Commission (“Commission”) determines, pursuant to section 735(b) of the Tariff Act of 1930 (19U.S.C. § 1673d(b)) (the Act), that an industry in the United States is threatened with material injury2 3 4
by reason of imports of seamless refined copper pipe and tube (“SRC pipe and tube”) from China andMexico provided for in subheadings 7411.10.10 and 8415.90.80 of the Harmonized Tariff Schedule of theUnited States, that have been found by the Department of Commerce (“Commerce”) to be sold in theUnited States at less than fair value (“LTFV”).
BACKGROUNDThe Commission instituted these investigations effective on September 30, 2009, following
receipt of a petition filed with the Commission and Commerce by Cerro Flow Products, Inc., St. Louis,MO; Kobe Wieland Copper Products, LLC, Pine Hall, NC; Mueller Copper Tube Products, Inc. andMueller Copper Tube Company, Inc., Memphis, TN. The final phase of these investigations wasscheduled by the Commission following notification of preliminary determinations by Commerce thatimports of SRC pipe and tube from China and Mexico were being sold at LTFV within the meaning ofsection 733(b) of the Act (19 U.S.C. § 1673b(b)). Notice of the scheduling of the final phase of theCommission’s investigations and of a public hearing to be held in connection therewith was given byposting copies of the notice in the Office of the Secretary, U.S. International Trade Commission,Washington, DC, and by publishing the notice in the Federal Register of June 11, 2010 (75 FR 33330). The hearing was held in Washington, DC, on September 23, 2010, and all persons who requested theopportunity were permitted to appear in person or by counsel.
1 The record is defined in sec. 207.2(f) of the Commission’s Rules of Practice and Procedure (19 CFR § 207.2(f)).
2 Chairman Deanna Tanner Okun, Vice Chairman Irving A. Williamson, Commissioner Daniel R. Pearson, andCommissioner Shara L. Aranoff determine that they would not have found material injury but for the suspension ofliquidation.
3 Commissioner Charlotte R. Lane determines that the domestic SRC pipe and tube industry is materially injuredby reason of imports of the subject merchandise from China and Mexico.
4 Commissioner Dean A. Pinkert did not participate in these investigations.


VIEWS OF THE COMMISSION
Based on the record in the final phase of these investigations, we determine that an industry in theUnited States is threatened with material injury by reason of imports of seamless refined copper pipe andtube from China and Mexico that the U.S. Department of Commerce (“Commerce”) has found to be soldin the United States at less than fair value.1 2
I. BACKGROUND
The petition in these investigations was filed on September 30, 2009, by domestic producersCerro Flow Products, Inc. (“Cerro”), St. Louis, Missouri; Kobe Wieland Copper Products, LLC, (“KobeWieland”), Pine Hall, North Carolina; Mueller Copper Tube Products, Inc. and Mueller Copper TubeCompany, Inc., (“Mueller”), Memphis, Tennessee (collectively, “petitioners”). Petitioners appeared atthe hearing and filed joint prehearing and posthearing briefs.
Respondents that participated at the hearing and filed prehearing and posthearing briefs includeGolden Dragon Precise Copper Tube Group Inc., GD Affiliates S. de R.L. de C.V., and GD Copper(U.S.A.) Inc., a Chinese producer, a Mexican producer, and a U.S. importer of subject merchandise,respectively (collectively, “Golden Dragon”); IUSA, S.A. de C.V. (“IUSA”) and Nacional de Cobre, S.A.de C.V. (“Nacobre”), Mexican producers of subject merchandise;3 and Johnson Controls, Inc. (“Johnson”)and Marubeni American Corporation (“Marubeni”), importers of subject merchandise.
Joint prehearing and posthearing briefs were filed by Luvata Alltop (Zhongshan), Luvata Tube(Zhongshan) Ltd., Luvata Monterrey S. de R.L. de C.V., foreign producers of subject merchandise, andLuvata Franklin, Inc. and Luvata Grenada LLC, importers of subject merchandise (collectively,“Luvata”). A posthearing brief was filed by Wolverine Tube, Inc. (“Wolverine”) a domestic producer andan importer and purchaser of subject merchandise.
The Commission received questionnaire responses from 14 domestic producers of seamlessrefined copper pipe and tube (hereinafter, “SRC pipe and tube”). These producers accounted for 95percent of U.S. production of SRC pipe and tube in 2009.4
Importer data in the Report are based primarily on official Commerce import statistics.5 TheCommission, however, received questionnaires responses from 42 importers, which accounted for 83.7percent of subject imports from China, 106.5 percent of subject imports from Mexico, and 56.2 percent ofnonsubject imports in 2009.6
The Commission received foreign producer questionnaire responses from eight producers orexporters of Chinese SRC pipe and tube, which are believed to account for *** Chinese export shipments
1 Commissioner Lane determines that the domestic industry is materially injured by reason of the subject importsfrom China and Mexico. She joins in parts I through IV.B.1. of these Views. She also joins in part V, LegalFramework, and part VI, Conditions of Competition. She writes separately concerning Material Injury By Reason ofSubject Imports. See Separate Views of Commissioner Charlotte R. Lane.
2 Commissioner Dean A. Pinkert is not participating in the final phase of these investigations.
3 The appearance of IUSA and Nacobre at the hearing and their posthearing brief were also on behalf of their U.S.affiliates, Cambridge-Lee Industries LLC and Copper and Brass International.
4 CR at I-4, PR at I-3; CR/PR at III-1.
5 CR at I-4, PR at I-3.
6 CR at I-4, PR at I-3; CR/PR at IV-1. Imports for China and Mexico based on questionnaire data appear atCR/PR at Table C-2.
3

to the United States in 2009.7 The Commission received foreign producer questionnaire responses fromfive producers or exporters of Mexican SRC pipe and tube, believed to account for *** Mexican exportshipments to the United States in 2009.8 The Commission received purchaser questionnaire responsesfrom 44 firms.9
II. DOMESTIC LIKE PRODUCT
A. In General
In determining whether an industry in the United States is materially injured or threatened withmaterial injury by reason of imports of the subject merchandise, the Commission first defines the“domestic like product” and the “industry.”10 Section 771(4)(A) of the Tariff Act of 1930, as amended(“the Tariff Act”), defines the relevant domestic industry as the “producers as a whole of a domestic likeproduct, or those producers whose collective output of a domestic like product constitutes a majorproportion of the total domestic production of the product.”11 In turn, the Tariff Act defines “domesticlike product” as “a product which is like, or in the absence of like, most similar in characteristics and useswith, the article subject to an investigation.”12
The decision regarding the appropriate domestic like product(s) in an investigation is a factualdetermination, and the Commission has applied the statutory standard of “like” or “most similar incharacteristics and uses” on a case-by-case basis.13 No single factor is dispositive, and the Commissionmay consider other factors it deems relevant based on the facts of a particular investigation.14 TheCommission looks for clear dividing lines among possible like products and disregards minor variations.15 Although the Commission must accept the determination of the U.S. Department of Commerce
7 CR at VII-3, PR at VII-2.
8 CR at VII-6, PR at VII-5.
9 CR at II-2, PR at II-1.
10 19 U.S.C. § 1677(4)(A).
11 19 U.S.C. § 1677(4)(A).
12 19 U.S.C. § 1677(10).
13 See, e.g., Cleo, Inc. v. United States, 501 F.3d 1291, 1299 (Fed. Cir. 2007); NEC Corp. v. Department ofCommerce, 36 F. Supp.2d 380, 383 (Ct. Int’l Trade 1998); Nippon Steel Corp. v. United States, 19 CIT 450, 455(1995); Torrington Co. v. United States, 747 F. Supp. 744, 749 n.3 (Ct. Int’l Trade 1990), aff’d, 938 F.2d 1278 (Fed.Cir. 1991) (“every like product determination ‘must be made on the particular record at issue’ and the ‘unique factsof each case’”). The Commission generally considers a number of factors including the following: (1) physicalcharacteristics and uses; (2) interchangeability; (3) channels of distribution; (4) customer and producer perceptionsof the products; (5) common manufacturing facilities, production processes, and production employees; and, whereappropriate, (6) price. See Nippon, 19 CIT at 455 n.4; Timken Co. v. United States, 913 F. Supp. 580, 584 (Ct. Int’lTrade 1996).
14 See, e.g., S. Rep. No. 96-249 at 90-91 (1979).
15 Nippon, 19 CIT at 455; Torrington, 747 F. Supp. at 748-49; see also S. Rep. No. 96-249 at 90-91 (1979)(Congress has indicated that the like product standard should not be interpreted in “such a narrow fashion as topermit minor differences in physical characteristics or uses to lead to the conclusion that the product and article arenot ‘like’ each other, nor should the definition of ‘like product’ be interpreted in such a fashion as to preventconsideration of an industry adversely affected by the imports under consideration.”).
4

(“Commerce”) as to the scope of the imported merchandise subsidized or sold at less than fair value,16 theCommission determines what domestic product is like the imported articles Commerce has identified.17
B. Product Description
Commerce has defined the scope of these investigations as follows:Seamless circular refined copper pipes and tubes, including redraw hollows, greater thanor equal to 6 inches (152.4 mm) in length and measuring less than 12.130 inches(308.102 mm) (actual) in outside diameter (“OD”), regardless of wall thickness, bore(e.g., smooth, enhanced with inner-grooves or ridges), manufacturing process (e.g., hotfinished, cold-drawn, annealed), outer surface (e.g., plain or enhanced with grooves,ridges, fins, or gills), end finish (e.g., plain end, swaged end, flared end, expanded end,crimped end, threaded), coating (e.g., plastic, paint), insulation, attachments (e.g., plain,capped, plugged, with compression or other fitting), or physical configuration (e.g.,straight, coiled bent, wound on spools). The scope covers, but is not limited to, seamlessrefined copper pipe and tube produced or comparable to the American Society forTesting and Materials (“ASTM”) ASTM-B42, ASTM-B68, ASTM-B75, ASTM-B88,ASTM-B88M, ASTM-B188, ASTM-B251, ASTM-B251M, ASTM-B280, ASTM-B302,ASTM-B306, ASTM-B359, ASTM-B743, ASTM-B819, and ASTM-B903 specificationsand meeting the physical parameters described therein. Also included within the scope ofthese investigations are all sets of covered products, including “line sets” of seamlessrefined copper tubes (with or without fittings or insulation) suitable for connecting anoutdoor air conditioner or heat pump to an indoor evaporator unit. The phrase “all sets ofcovered products” denotes any combination of items put up for sale that is comprised ofmerchandise subject to the scope. “Refined copper” is defined as: (1) metal containingat least 99.85 percent by weight of copper; or (2) metal containing at least 97.5 percentby weight of copper, provided that the content by weight of any other element does notexceed the following limits
ELEMENT LIMITING CONTENT PERCENT BY WEIGHTAg - Silver 0.25As - Arsenic 0.5Cd - Cadmium 1.3Cr - Chromium 1.4Mg - Magnesium 0.8Pb - Lead 1.5S - Sulfur 0.7Sn - Tin 0.8Te - Tellurium 0.8Zn - Zinc 1.0
16 See, e.g., USEC, Inc. v. United States, 34 Fed. Appx. 725, 730 (Fed. Cir. 2002) (“The ITC may not modify theclass or kind of imported merchandise examined by Commerce.”); Algoma Steel Corp. v. United States, 688 F.Supp. 639, 644 (Ct. Int’l Trade 1988), aff’d, 865 F.3d 240 (Fed. Cir.), cert. denied, 492 U.S. 919 (1989).
17 Hosiden Corp. v. Advanced Display Mfrs., 85 F.3d 1561, 1568 (Fed. Cir. 1996) (Commission may find a singlelike product corresponding to several different classes or kinds defined by Commerce); Cleo, 501 F.3d at 1298 n.1(“Commerce’s {scope} finding does not control the Commission’s {like product} determination.”); Torrington, 747F. Supp. at 748-52 (affirming Commission determination of six like products in investigations where Commercefound five classes or kinds).
5

Zr - Zirconium 0.3Other elements (each) 0.3
Excluded from the scope of these investigations are all seamless circular hollows of refinedcopper less than 12 inches in length whose OD (actual) exceeds its length.18
SRC pipe and tube are fabricated products of high-purity copper, distinguished by a circular crosssection of varying nominal sizes (typically 0.04"–12") and wall thicknesses. The inner and outer tubingsurfaces are either smooth or enhanced (e.g., with grooves, ridges, fins, or gills). Additionalcharacteristics can include outer surface coatings (e.g., paint, plastics, or other coating materials) forcorrosion protection or insulation; marking with paint or plastic color coding for product identification;cleaning, pressurizing with nitrogen gas, and capping of each end to assure interior cleanliness; endfinishes (e.g., plain, swaged, flared, expanded, crimped, or threaded); and attachments (e.g., plain, capped,or plugged). SRC pipe and tube is available in straight lengths, bent to shape, coiled flat without spools(“pancake coils”), or coiled onto spools. “Line sets” consist of a smaller-diameter liquid line (commonlywith end finishes) and a larger-diameter suction line (commonly insulated), which typically are used toconnect outdoor air conditioners and heat pumps with indoor evaporator units.19
End-use applications for SRC pipe and tube take advantage of copper’s strength, malleability,ductility, thermal conductivity, resistance to corrosion and fouling, and chemical purity. SRC pipe andtube applications generally involve fluids under pressure, either for conveyance or closed-loop thermaltransfer. Conveyance applications include residential, commercial, institutional, industrial, and municipalwater systems, as well as distribution systems for other liquids and gasses. Thermal transfer applicationsinclude residential, commercial, institutional, and industrial heating systems; commercial refrigerationsystems; and combined or split-unit air-conditioning systems.20
“Plumbing” (or “standard”) tubing is commonly produced to various standards of the AmericanSociety for Testing and Materials (“ASTM”). The ASTM designations specify the chemical composition,outside diameter, wall thickness, strength, hardness, cleanliness, roundness, marking, and otherrequirements for SRC pipe and tube, based on end-use applications.21
“Industrial” (or “commercial”) tubing is produced to either industry standard (e.g., ASTM)specifications or customer (including original equipment manufacturer (“OEM”)) nonstandardspecifications, including any surface enhancements (e.g., grooves, ridges, fins, or gills) designed toenhance thermal transfer capabilities. For example, customer specifications are often based on ASTMstandards to which are added further requirements such as custom dimensions, temper, or packaging. Common applications for commercial SRC pipe and tube include refrigeration and heating units; split-system central, room and window, central, and vehicle air conditioners; and chillers and freezers.22
SRC pipe and tube production involves three stages: (1) prefabricating, which includes melting,casting, and either extrusion or rolling of rough tubing; (2) intermediate fabrication, consisting of colddrawing of unfinished tubing; and (3) finishing of the SRC pipe and tube.23
18 CR at I-5-6, PR at I-5. The products subject to these investigations are currently classifiable under statisticalreporting numbers 7411.10.1030, 7411.10.1090 of the Harmonized Tariff Schedule of the United States (HTSUS),and may also enter under HTSUS statistical reporting numbers 7407.10.1500, 7419.99.5050, 8415.90.8065, and8415.90.8085. Id.
19 CR at I-7-8, PR at I-6.
20 CR at I-8, PR at I-6-7.
21 CR at I-8, PR at I-7.
22 CR at I-8-9, PR at I-7.
23 CR at I-12, PR at I-10.
6

C. Preliminary Phase Determination
In the preliminary phase of these investigations, the domestic industry requested that theCommission define a single domestic like product, coextensive with Commerce’s scope. No partyopposed that definition. The Commission found that plumbing and commercial tube possessed bothsimilarities and differences with respect to physical characteristics and uses, there was some degree ofinterchangeability between plumbing and commercial tube, as well as some similarities in terms of thechannels through which they were traded, and some commonality of manufacturing facilities andemployees. The Commission also observed that, although plumbing and commercial tube were soldunder different price structures, the record did not indicate whether or to what extent those structuraldifferences resulted in actual price differences between plumbing and commercial tube. Based on thesesimilarities, and in the absence of clear dividing lines between plumbing and commercial SRC pipe andtube, the Commission found a single domestic like product, consisting of all SRC pipe and tube, that wascoterminous with the scope.
In the final phase of these investigations, petitioners argue that the Commission should again findone domestic like product comprised of all SRC pipe, that is coextensive with Commerce’s scope.24 Importers Marubeni and Johnson contend that the Commission should define plumbing SRC pipe andtube and industrial SRC pipe and tube as separate domestic like products.25 Although IUSA, Nacobre,Luvata, and Goodman do not disagree with the Commission’s finding of a single domestic like product,they identify the distinction between plumbing and commercial tube as a relevant condition ofcompetition in the SRC pipe and tube market, and rely in that regard upon the factors the Commissiontraditionally considers in defining the domestic like product.26
D. Domestic Like Product Factors
1. Physical Characteristics and Uses
Parties’ Arguments. Petitioners assert that all SRC tubes share the same basic physicalcharacteristics and uses in that all SRC tubes are seamless products, they have circular cross sections, theyconsist entirely or virtually entirely of refined copper, and they are commonly used to transport fluids,either in conveyance applications or in closed loops for thermal transfer. They contend that, althoughplumbing pipe and tube is generally produced to ASTM specifications and industrial pipe and tube to thespecification of OEMs, ASTM standards also apply in some respects to industrial pipe and tube, and thedifferences between SRC pipe and tubes in plumbing and industrial application can be minimal.27 Theyassert that fabrication prior to finishing is similar for plumbing and industrial pipe and tube, that plumbingpipe and tube often meets the same degree of purity (percentage of copper cathode) required for industrialpipe, and that certain plumbing tube (e.g., OXY/MED and ARC products) are cleaned and capped, as isindustrial pipe and tube.28
24 Petition at 35-36, Petitioners Postconference Brief at 9-15.
25 Johnson/Marubeni Prehearing Brief at 1.
26 IUSA and Nacobre Prehearing Brief at 6-10, Luvata Prehearing Brief at 6-17, Goodman Prehearing Brief at 2-5. Although we do not set out here those arguments of these parties, we have taken them into account in ourdomestic like product analysis.
27 Petitioners Prehearing Brief at 13-15.
28 Hearing Transcript at 66 (Arndt), 264 (Levy). Cleaning and capping means the pipe or tube is filled with purenitrogen to displace oxygen and prevent corrosion and then capped to prevent escape of the nitrogen. See, e.g.,Johnson/Marubeni Posthearing Brief at 3. OXY/MED and ARC products are cleaned and capped to ensure
continue...
7

Johnson and Marubeni argue that, unlike industrial pipe and tube, plumbing pipe and tube doesnot have to meet the copper purity requirements of ASTM standard B743 or the 1,832 pounds per squareinch burst pressure requirement. They also assert that all industrial pipe and tube must be cleaned andcapped and that the plumbing products petitioners identify as cleaned and capped either are not plumbingproducts or account for a small segment of the plumbing pipe and tube market.29
Analysis. All SRC pipe and tube share certain basic physical characteristics, including beingseamless, made of refined copper, and having a circular cross section. All SRC pipe and tube are used totransport or circulate fluids.30 Substantial similarities generally exist between the physical characteristicsof SRC pipe and tube up to the finishing steps of production, although finishing steps may differ.31 Therecord indicates, therefore, that specifications for SRC pipe and tube used in plumbing applications andSRC pipe and tube used in industrial applications can differ, with plumbing pipe and tube conforming toASTM standards and industrial pipe and tube conforming to individual OEMs’ specifications or ASTMstandards.32 Pipe and tube meeting certain ASTM standards (e.g., ASTM designations B-280, B-903,Type K, Type L, Type M, DWV, and ARC/RST) is designated for use in industrial applications (i.e., inconjunction with heating, ventilation, air conditioning and refrigeration systems), but some may also beused in plumbing applications.33 34 Accordingly, there are similarities in the physical characteristics anduses of plumbing and industrial pipe and tube.
2. Interchangeability
Parties’ Arguments. Petitioners argue that interchangeability between plumbing and industrialtube is indicated by the fact that OEM specifications can mirror ASTM specifications or can be stated interms of ASTM specifications with adjustments or additions. They claim that, whether an article is being
28 ...continuecontaminant-free transportation of oxygen, other gases, and refrigerants. Field notes (July 30, 2010) at 2.at 2.
29 Johnson/Marubeni Posthearing Brief at 3-4.
30 CR at I-7-8, PR at 1-6.
31 CR at I-12-20, PR at I-10-14.
32 CR at I-8, PR at I-6.
33 See CR/PR at Tables I-1, I-2.
34 In their claims regarding copper purity and burst pressure requirements for industrial pipe and tube, Johnsonand Marubeni do not argue that plumbing pipe and tube does not often, or could not, also meet those purity andpressure requirements. Rather, they simply state that lower purity copper could be used in producing plumbing pipeand tube, not that it actually is used. Johnson/Marubeni Posthearing Brief at 3-4. The record identifies steps forremoval of impurities during the molten copper stage of production, without distinguishing between industrial andplumbing pipe and tube. CR at I-12-13, PR at I-10. Johnson and Marubeni do not indicate that plumbing tubewould not meet the same burst pressure requirements that can be made explicit for industrial SRC pipe and tube(although it appears that the pressures to which pipe and tube employed in industrial (e.g., HVAC applications) arefar greater than those in plumbing applications). Rather, they state simply that burst pressure requirements do notapply to plumbing pipe and tube. Johnson/Marubeni Posthearing Brief at 3-4. Additionally, at the hearing, thesignificance of whether burst pressure requirements were met was raised primarily in comparing the seamlessproduct with the nonsubject welded product. Johnson explained that it switched from welded to seamless product toavoid the seam-splitting under pressure to which welded pipe and tube were more prone. Thus, the testimony mayhave been more concerned with welded product being more prone to burst under pressure than the seamless product,rather than that plumbing pipe and tube was more prone to burst under pressure than industrial pipe and tube. SeeHearing Transcript at 163-64 (Smith). Accordingly, we find that the record does not support the claim of significantphysical differences between industrial and plumbing SRC pipe and tube in terms of copper purity and burst pressurecharacteristics.
8
produced for a plumbing or an industrial application, the manufacturer’s primary focus is on the outsidediameter (OD) of the article. The difference in the processes, they assert, can be as simple as cutting thefinished product to a cut length for plumbing pipe and tube or turning it into a level wound coil for theindustrial article.35 The absence of a clear dividing line between industrial and plumbing pipe and tube ishighlighted, petitioners contend, by the fact that six of the Commission’s eight pricing products were soldby domestic producers for both plumbing and industrial applications.36
Johnson and Marubeni argue that plumbing pipe and tube and industrial pipe and tube are notinterchangeable. They contend, for instance, that plumbing codes require pipe and tube used in plumbingapplications to have plumbing-specific ASTM markings. They argue, therefore, that contrary topetitioners’ claim, even in the instances in which industrial pipe or tube meet specifications for plumbingapplications, the pipe or tube cannot simply be used in a plumbing application, at least not without theaddition of the necessary ASTM markings.37
Analysis. The record indicates that there is at least some interchangeability between plumbingpipe and tube and industrial pipe and tube. Requirements for industrial pipe and tube may include ASTMstandards, including the same ASTM standards applicable to plumbing tube, and they sometimes mirrorASTM standards or reflect ASTM standards plus other elements.38 The same product may be sold aseither plumbing or industrial pipe and tube, although ASTM markings may be necessary when otherwiseidentical industrial product is sold in the plumbing market.39
3. Channels of distribution
Parties’ Arguments. Petitioners argue that there is overlap in channels of distribution betweenplumbing and industrial pipe and tube, even though plumbing pipe and tube is generally sold todistributors, wholesalers, and retailers, whereas industrial pipe and tube is generally sold to OEMs. Theycontend that whether plumbing or industrial pipe and tube is sold through distributors or directly to OEMsis really a question of the size of the end user.40
Johnson and Marubeni argue that domestic producers generally sell SRC pipe and tube forplumbing applications to wholesalers, distributors, and retailers and generally sell industrial pipe and tubeto OEMs. They claim that producers have separate marketing teams for the sale of plumbing andindustrial SRC pipe and tube and that, to the extent OEMs purchase from distributors rather than directlyfrom producers, the quantities involved likely are small.41
Analysis. All parties agree that domestic producers generally sell SRC pipe and tube forplumbing applications to wholesalesers, distributors and retailers and that they generally sell industrialpipe and tube to OEMs. It appears, however, that both distributors and SRC pipe and tube mills sell tubeconforming to ASTM designations (e.g., Type K, Type L, Type M, DWV, and ARC/RST) to OEMs andthat the channel of distribution can be based on the volume of SRC pipe and tube being purchased.42 Accordingly, there appears to be overlap between the channels through which plumbing and industrialpipe and tube are sold.
35 Petitioners’ Posthearing Brief, Appendix A at 35-36; Hearing Tr. (Arndt) at 36-37.
36 Petitioners Prehearing Brief at 15-16, Petitioners’ Posthearing Brief at 13 (citing Prehearing Report at V-24).
37 Johnson/Marubeni Posthearing Brief at 4-5.
38 See CR/PR at Tables I-1, I-2; Petitioners’ Posthearing Brief, Appendix A at 35-36; Hearing Tr. (Arndt) at 36-37.
39 Petitioners Prehearing Brief at 15-16, Johnson/Marubeni Posthearing Brief at 4-5.
40 Petitioners Prehearing Brief at 16-18.
41 Johnson/Marubeni Posthearing Brief at 5-6.
42 Petitioners Postconference Brief at 12.
9

4. Common Manufacturing Facilities, Production Processes, and ProductionEmployees
Parties’ Arguments. Petitioners claim that U.S. producers manufacture SRC pipe and tube in thesame production facilities, using common production processes and production employees. ***.43 Theyassert that production of all SRC tube begins with a prefabrication stage in which raw copper material ismelted then formed, by either a high-ratio extrusion or a cast-and-roll method, into a so-called “mothertube.” The mother tube then undergoes an intermediate, cold drawing, step. Cold drawing is followed bya combination of finishing steps, as applicable. Petitioners assert that the cast and roll method or theextrusion method can be used to produce either plumbing or industrial pipe and tube. The assert thatKobe Wieland and Cerro produce both plumbing and commercial tube, and Kobe Wieland produces bothplumbing and commercial tube on the same production line at its Pine Hall, North Carolina facility.44
Johnson and Marubeni argue that the cast and roll method is more commonly used for productionof industrial pipe and tube and the extrusion method is more commonly used for production of plumbingpipe and tube. They contend that the greatest distinctions in the production process for plumbing andindustrial pipe occur at the finishing stage, which, in the case of the industrial product but not theplumbing product, can include steps such as stretching, annealing, winding, and rifling to create an innergroove product.45
Analysis. Although either the cast and roll or extrusion methods can be used, the initial stages ofproduction are the same whether the ultimate product will be a plumbing or an industrial pipe and tubeproduct.46 Therefore, they can be produced in the same facilities with the same processes, and productionemployees. Although some producers confine their production to either plumbing pipe and tube orindustrial pipe and tube, certain producers produce both plumbing and industrial tube in the same facilitywith the same employees. Thus, there is some degree of shared facilities, processes, and employees in theproduction of plumbing and industrial pipe and tube.
5. Producer and Customer Perceptions
Parties’ Arguments. Petitioners assert that, overall, customers perceive SRC tube as a singleproduct, with a broad mix of variations across a continuum. They contend that, although some OEMcustomers may perceive industrial tube meeting their custom specifications as distinct from plumbingtube meeting standard ASTM specifications, these differences are minor from the perspective of SRCpipe and tube producers.47 They argue that the absence of a clear dividing line in the perception of marketparticipants is indicated also by the apparently differing perceptions of importers and purchasers as towhat constititutes plumbing versus industrial pipe and tube. This is indicated, they contend, by the smallvolume of plumbing pipe and tube from China that importers reported importing compared with theconsiderably larger volume of plumbing pipe and tube from China that purchasers reported purchasing.48
Johnson and Marubeni argue that, because the purchasers, channels of distribution, technicalspecification for plumbing and industrial pipe and tube are completely different, and because plumbing
43 Petitioners Posthearing Brief at A-2.
44 Petitioners’ Prehearing Brief at 19-20.
45 Johnson/Marubeni Prehearing Brief at 5, Johnson/Marubeni Posthearing Brief at 6.
46 E.g., CR at I-15-16, I-18; PR at I-12, I-13.
47 Petitioners Prehearing Brief at 12.
48 Petitioners Posthearing Brief, Appendix A at 36.
10
and industrial pipe and tube are not interchangeable, customers do not perceive plumbing and industrialpipe and tube to be similar.49
Analysis. Although producers and customers may view plumbing and industrial SRC pipe andtube as falling to some extent on a continuum, the record indicates that market participants also perceive adistinction.50
6. Price
Parties’ Arguments. Petitioners acknowledge dual pricing structures for plumbing andcommercial tube, with plumbing tube typically sold on the spot market at a discount off list prices andindustrial pipe and tube sold at the contemporaneous COMEX price of copper plus a negotiated per-pound fabrication charge fixed for 12 months. They assert, however, that the differing pricing structuresdo not result in prices for plumbing or industrial tube necessarily being higher or lower than the other. The absence of a clear price distinction is confirmed, they claim, by the varying responses of producersand importers regarding the relative pricing levels of plumbing and industrial pipe and tube.51
Johnson and Marubeni generally agree with petitioners’ description of the differing approachesfor setting prices in the sale of plumbing and industrial pipe and tube and argue that these pricingmechanisms, therefore, are not comparable.52
Analysis. It is uncontested that plumbing and industrial tube are typically sold under differentprice structures. Plumbing pipe and tube is typically sold on the spot market at a discount off price listspublished by producers, whereas industrial pipe and tube is typically sold at the contemporaneousCOMEX price of copper plus a negotiated per-pound fabrication charge that is fixed for a 12-monthperiod. Three U.S. producers, ***, report selling industrial pipe and tube on a spot basis.53 It appearsthat, notwithstanding the different pricing structures, prices for SRC pipe and tube overall may fallgenerally on a continuum of prices determined primarily by the prevailing market price for copper,variations in finishing costs, and relative demand for different SRC pipe and tube products.54 We note,moreover, that prices for the pricing products that are generally used in plumbing applications and thosegenerally used in industrial applications55 generally followed similar trends over the period for whichquarterly pricing data were obtained in these investigations.56
7. Conclusion
The record indicates that plumbing and industrial pipe and tube possess at least some similaritieswith respect to physical characteristics and uses, regardless of their manner of production. There is,moreover, some interchangeability between plumbing and industrial pipe and tube, as well as somesimilarities in terms of the channels through which they are traded, and some commonality ofmanufacturing facilities and employees. Although plumbing and industrial pipe and tube are sold underdifferent price structures, we are not able to conclude that those structural differences result in actual price
49 Johnson/Marubeni Prehearing Brief at 6.
50 E.g., CR/PR at Appendix F.
51 Petitioners Prehearing Brief at 20-21.
52 Johnson/Marubeni Prehearing Brief at 7.
53 CR at V-2-3, PR at V-2.
54 Petitioners Prehearing Brief at 14.
55 Pricing products 1-4 were generally used in plumbing applications and products 5-8 were generally used inindustrial applications. CR at V-25, PR at V-12.
56 CR/PR at Figure V-2.
11

differences between plumbing and industrial pipe and tube with similar characteristics. Therefore, weconclude, on the basis of the current record, that there is not a clear dividing line between plumbing andindustrial pipe and tube. We note, moreover, that most respondent parties do not disagree with theCommission’s finding a single domestic like product in the preliminary phase of these investigations.
Accordingly, we find one domestic like product, coterminous with the scope, consisting of allSRC pipe and tube. III. DOMESTIC INDUSTRY
The domestic industry is defined as the domestic “producers as a whole of a domestic likeproduct, or those producers whose collective output of a domestic like product constitutes a majorproportion of the total domestic production of the product.”57 In defining the domestic industry, theCommission’s general practice has been to include in the industry producers of all domestic production ofthe like product, whether toll-produced, captively consumed, or sold in the domestic merchant market. Based on our definition of the domestic like product, we define the domestic industry as all domesticproducers of SRC pipe and tube.
We must determine whether any producer of the domestic like product should be excluded fromthe domestic industry pursuant to 19 U.S.C. § 1677(4)(B). Subsection 1677(4)(B) allows theCommission, if appropriate circumstances exist, to exclude from the domestic industry producers that arerelated to an exporter or importer of subject merchandise or which are themselves importers.58 Exclusionof such producers is within the Commission’s discretion based upon the facts presented in eachinvestigation. In these investigations, several domestic producers may be related parties based on theirrelationship to exporters of the subject merchandise, importations of subject imports, or purchases ofsubject imports.59 No party, however, has argued for exclusion of any producer as a related party.
Wolverine ***.60 Although Wolverine is a related party, we find that appropriate circumstancesdo not exist to exclude it from the domestic industry. The ***.61 Thus, ***62***.63 Wolverine reports***64 and also states that the importation of subject merchandise from foreign producers ***.65 Wolverine, however, has been a substantial domestic producer throughout the period of investigation; it
57 19 U.S.C. § 1677(4)(A).
58 19 U.S.C. § 1677(4)(B).
59 The Commission has concluded that a domestic producer that does not itself import subject merchandise, ordoes not share a corporate affiliation with an importer, may nonetheless be deemed a related party if it controls largevolumes of imports. The Commission has found such control to exist where the domestic producers wereresponsible for a predominant proportion of an importer's purchases and the importer’s purchases were substantial.See, e.g., Certain Cut-to-Length Steel Plate from the Czech Republic, France, India, Indonesia, Italy, Japan, Korea,and Macedonia, Inv. Nos. 701-TA-387-392 and 731-TA-815-822 (Preliminary), USITC Pub. 3181 at 12 (April1999); Certain Brake Drums and Rotors from China, Inv. No. 731-TA-744 (Final), USITC Pub. 3035 at 10 n.50(April 1997).
60 Wolverine’s ***. CR/PR at Table III-7. ***. Wolverine would be a related party based on its *** percentinterest in the Chinese producer and exporter Wolverine Tube (Shanghai), if it were in a position to exercise direct orindirect control over Wolverine Tube (Shanghai). CR/PR at Table III-1. The record does not reflect, however, thatWolverine is in a position to exercise direct or indirect control over Wolverine Tube (Shanghai).
61 CR/PR at Table III-7.
62 ***. Wolverine Posthearing Brief at 2.
63 CR/PR at Table III-7.
64 CR/PR at Table III-7 n.7.
65 Wolverine Posthearing Brief at 2, see also CR at III-4-5.
12

accounted for *** percent of domestic production in 2009, and was the *** largest producer in that year.66 Its interests appear to vary between domestic production or importation at different times during theperiod of investigation.67 Wolverine ***.68 Wolverine *** in view of its *** operating performance. Itsoperating income as a ratio of net sales was *** the industry average ***.69 70 Therefore, we do not findappropriate circumstances to exclude Wolverine from the domestic industry.
Cambridge-Lee is wholly owned by IUSA, a Mexican producer and exporter of SRC pipe andtube and, therefore, Cambridge-Lee is a related party.71 ***.72 We find, however, that appropriatecircumstances do not exist to exclude Cambridge-Lee from the domestic industry. ***.73 ***.74 Moreover, Cambridge Lee accounted for *** percent of domestic production in 2009 and is, thus, the ***domestic producer.75 Additionally, Cambridge-Lee *** in view of its *** operating performance for mostof the period. Its operating income as a ratio of net sales was *** the industry average from 2007 to 2008and in interim 2010, and *** the average *** in 2009.76 Accordingly, we find, on balance, thatcircumstances are not appropriate to exclude Cambridge-Lee from the domestic industry.
Seven other domestic producers are or may be related parties. ***.77 ***.78 ***.79 KobeWieland is *** percent owned by Wieland-Werke, a German firm, which, in turn, owns an interest in theChinese exporter Wolverine Tube (Shanghai).80 Mueller is an equity participant in the joint ventureJiangsu Mueller-Xingrong Copper, a Chinese exporter.81 Precision Tube is a sister company of Mueller,which, as noted above, has an ownership interest in the Chinese exporter Jiangsu Mueller-XingrongCopper.82
It is clear that *** are related parties by virtue of their importation of subject merchandise. Theother four producers also may be related parties by virtue of corporate relationships to, or purchases of,subject merchandise. We need not resolve, however, the question of whether all of these seven producersare related parties because we would not find appropriate circumstances exist to exclude any of them fromthe domestic industry.
66 CR/PR at Table III-1.
67 ***. CR at III-10, PR at III-6 n.15.
68 Wolverine Posthearing Brief at 3-4.
69 CR/PR at Table VI-2.
70 In these investigations, Commissioner Aranoff does not rely on individual company operating income marginsin assessing whether particular related parties benefit from importation of subject merchandise. Rather, she has basedher determination regarding whether to exclude related parties principally on their ratios of subject imports todomestic shipments and on whether their primary interests lie in domestic production or importation. She finds thatappropriate circumstances do not exist to exclude any company.
71 CR/PR at Table III-1.
72 CR/PR at Table III-7.
73 CR/PR at Table III-7.
74 CR/PR at Table III-7.
75 CR/PR at Table III-1.
76 CR/PR at Table VI-2.
77 CR/PR at Table III-7.
78 CR/PR at Table III-7.
79 CR/PR at Table III-7. ***. CR/PR at Table III-1, IV-1. ***. CR/PR at Table III-7.
80 CR/PR at Table III-1, III-3. Kobe Wieland ***. CR/PR at Table III-7.
81 CR/PR at Table III-1.
82 CR/PR at Table III-1.
13

*** each accounted for a very small percentage of domestic production.83 Thus, neither inclusionnor exclusion of their individual data would skew the industry data. Moreover, to the extent theyimported or purchased subject imports, their imports or purchases were small relative to theirproduction.84 Accordingly, their interests appear to be those of domestic producers. Moreover, they donot appear to have derived a significant benefit from their potential related party status. *** operatingincome as a ratio of net sales was below the industry average throughout the period of investigation, andthe ratios for *** were below the industry average for a majority of the period of investigation.85
*** Mueller nor Kobe Wieland ***.86 Moreover, Kobe Wieland ***. Additionally, theseproducers ***. Kobe Wieland’s operating income as a ratio of net sales was *** the industry average***. Although the financial performance of Mueller ***,87 there is no indication that this *** resultedfrom its potential related party status. Mueller and Kobe Wieland are also petitioners, further indicatingthat their interests are those of domestic producers notwithstanding their potential related party status. Finally, purchases were equivalent to only *** percent of Howell’s production in *** and it ***.88 Moreover, Howell *** the petition.89
For the reasons stated above, we find that appropriate circumstances do not exist to exclude anydomestic producer from the domestic industry. We therefore define the domestic industry to include alldomestic producers of SRC pipe and tube.
IV. CUMULATION
For purposes of evaluating the volume and price effects for a determination of material injury byreason of the subject imports, section 771(7)(G)(i) of the Act requires the Commission to assesscumulatively the volume and effect of imports of the subject merchandise from all countries as to whichpetitions were filed and/or investigations self-initiated by Commerce on the same day, if such importscompete with each other and with the domestic like products in the U.S. market.90 In assessing whethersubject imports compete with each other and with the domestic like product,91 the Commission hasgenerally considered the following four factors:
(1) the degree of fungibility between the subject imports from different countries andbetween imports and the domestic like product, including consideration of specificcustomer requirements and other quality related questions;
83 Precision Tube accounted for *** percent of domestic production in 2009, Packless for *** percent, and ***for *** percent, and Elkhart for *** percent. CR/PR at Table III-1.
84 CR/PR at Table III-7. ***. Id.
85 CR/PR at Table VI-2.
86 CR/PR at Table III-7. Mueller accounted for *** percent of total domestic production in 2008, and KobeWieland accounted for *** percent. CR/PR at Table III-1. Id.
87 CR/PR at Table VI-2
88 CR/PR at Table III-7.
89 CR/PR at Table III-1.
90 19 U.S.C. § 1677(7)(G)(i).
91 The SAA expressly states that “the new section will not affect current Commission practice under which thestatutory requirement is satisfied if there is a reasonable overlap of competition.” SAA, H.R. Rep. 103-316, vol. I at848 (1994), citing Fundicao Tupy, S.A. v. United States, 678 F. Supp. 898, 902 (Ct. Int’l Trade 1988), aff’d, 859F.2d 915 (Fed. Cir. 1988).
14

(2) the presence of sales or offers to sell in the same geographic markets of subjectimports from different countries and the domestic like product;
(3) the existence of common or similar channels of distribution for subject importsfrom different countries and the domestic like product; and
(4) whether the subject imports are simultaneously present in the market.92
Although no single factor is necessarily determinative, and the list of factors is not exclusive,these factors are intended to provide the Commission with a framework for determining whether thesubject imports compete with each other and with the domestic like product.93 Only a “reasonableoverlap” of competition is required.94
For purposes of determining if a threat of material injury exists, cumulation is discretionary. Under section 771(7)(H) of the Tariff Act, the Commission may “to the extent practicable” cumulativelyassess the volume and price effects of subject imports from all countries as to which petitions were filedon the same day if the requirements for cumulation are satisfied.95 In addition to considering the fourcumulation factors described above, the Commission has considered other factors such as the similarity ofthe volume trends and pricing data of subject imports from countries under investigation.96
A. Parties’ Arguments
Petitioners contend that the Commission should cumulate subject imports from China and Mexicoas there is a reasonable overlap of competition. They assert that the domestic like product and subjectimports from China and Mexico are fungible, that the geographic overlap and simultaneous presencerequirement are satisfied, and that the domestic like product and subject imports from China and Mexicoare sold through the same channels of distribution.97
IUSA and Nacobre contend that these investigations are concerned solely with threat of materialinjury and, therefore, they limit their cumulation arguments to the Commission’s threat analysis. Theyargue, in the context of cumulation for purposes of threat of material injury, that the subject imports arenot substantially fungible because the SRC pipe and tube from China are concentrated in industrial pipeand tube and the SRC pipe and tube from Mexico is concentrated in plumbing pipe and tube. They alsocontend that plumbing and industrial pipe and tube are generally sold through different channels of
92 See Certain Cast-Iron Pipe Fittings from Brazil, the Republic of Korea, and Taiwan, Inv. Nos. 731-TA-278-280(Final), USITC Pub. 1845 (May 1986) at 8 n.29, aff’d sub nom. Fundicao Tupy, S.A. v. United States, 678 F. Supp.898 (Ct. Int’l Trade), aff’d, 859 F.2d 915 (Fed. Cir. 1988).
93 See, e.g., Wieland Werke, AG v. United States, 718 F. Supp. 50 (Ct. Int’l Trade 1989).
94 See Goss Graphic System, Inc. v. United States, 33 F. Supp. 2d 1082, 1087 (Ct. Int’l Trade 1998) (“cumulationdoes not require two products to be highly fungible”); Mukand Ltd. v. United States, 937 F. Supp. 910, 916 (Ct. Int’lTrade 1996); Wieland Werke, 718 F. Supp. at 52 (“Completely overlapping markets are not required.”).
95 19 U.S.C. § 1677(7)(H).
96 See Torrington Co. v. United States, 790 F.Supp. at 1172 (affirming Commission’s determination not tocumulate for purposes of threat analysis when pricing and volume trends among subject countries were not uniformand import penetration was extremely low for most of the subject countries); Metallverken Nederland B.V. v. UnitedStates, 728 F.Supp. 730, 741-42 (Ct. Int’l Trade 1989); Associacion Colombiana de Exportadores de Flores v.United States, 704 F.Supp. 1068, 1072 (Ct. Int’l Trade 1988).
97 Petitioners Prehearing Brief at 37-40.
15

distribution and are priced differently.98 These arguments are also relevant to the Commission’s presentmaterial injury cumulation analysis.
Specific to whether the Commission should exercise its discretion to cumulate subject imports ifit reaches the issue of whether a domestic industry is threatened with material injury by reason of subjectimports, IUSA and Nacobre argue that subject imports from Mexico must be assessed independently ofthose from China in a threat analysis. They argue essentially that the volume and pricing trends forsubject imports from China and Mexico are separate and distinct.99 100
B. Analysis
1. Cumulation for Material Injury
In these investigations, the threshold criterion for cumulation is satisfied because the petitionersfiled the antidumping duty petitions with respect to China and Mexico on the same day. None of thecumulation exceptions applies. Subject imports from China and Mexico are therefore eligible forcumulation. We consequently examine whether there is a reasonable overlap of competition betweensubject imports from China and Mexico, as well as among subject imports and the domestic like product.
Fungibility.101 There appears to be a moderate to high degree of fungibility with respect to thesubject imports from China and Mexico as well as with respect to the subject imports from each sourceand the domestic like product.102 The questionnaire responses indicate that market participants perceivedomestic SRC pipe and tube and subject imports to be interchangeable. A majority of respondingdomestic producers, importers, and purchasers reported that the domestic product is always or frequentlyinterchangeable with the subject imports from each subject source and that the Chinese and Mexican SRCpipe and tube are interchangeable with each other.103
The available data suggest that, notwithstanding the greater focus of the imports from Mexico onplumbing tube and the greater focus of imports from China on industrial pipe and tube, the subjectimports from both China and Mexico include both plumbing and industrial pipe and tube to some degree. We note, moreover, as discussed with respect to conditions of competition, infra, that the share of subjectimports from Mexico consisting of industrial pipe and tube has increased late in the period examined. Also, as discussed in the context of the volume of subject imports, infra, it does not appear thatinterchangeability is affected in any significant degree by the extent to which subject merchandise or thedomestic like product is produced by the extrusion method as opposed to the cast and roll method.
98 IUSA and Nacobre Prehearing Brief at 38-40.
99 IUSA and Nacobre Posthearing Brief at 40-41.
100 Luvata argues that its imports of subject merchandise should be disregarded because they displaced nonsubjectwelded copper pipe and tube rather than sales of the dometic like product. Luvata Posthearing Brief at 3-5. Consistent with the statute, however, we include all subject imports among the cumulated imports and cumulativelyassess their volume and their impact on the U.S. industry as a whole. In short, the statute does not provide forassessment of the impact of the imports of individual importers separately from the impact of the cumulated subjectimports.
101 Commissioner Lane notes that, with respect to fungibility, her analysis does not require such similarity ofproducts that a perfectly symmetrical fungibility is required, and she notes that this factor would be better describedas an analysis of whether subject imports from each country and the domestic like product could be substituted foreach other. See Separate Views of Commissioner Charlotte R. Lane, Certain Lightweight Thermal Paper fromChina, Germany, and Korea, Invs. Nos. 701-TA-451 and 731-TA-1126 to 1128 (Prelim.), USITC Pub. 3964 (Nov.2007).
102 CR at II-24-25, PR at II-17-18.
103 CR/PR at Table II-4.
16
Geographic Overlap. All responding domestic producers reported that they serve a nationwidemarket.104 Official Commerce statistics show that the largest ports of entry for both the Chinese and theMexican imports were in Texas, with more than one-half the subject imports from China entering atHouston-Galveston and Dallas-Fort Worth and a large majority of the subject imports from Mexicoentering the port at Laredo.105 Moreover, 11 of 33 importers reported that they serve a nationwidemarket.106 Thus, although some importers sell subject imports from China or Mexico only to a limitednumber of geographic regions, in the aggregate, importers sell subject imports to all geographic regionswithin the continental United States.107 Accordingly, the record indicates that there was significantgeographic overlap between the subject imports from China and Mexico and between subject imports andthe domestic like product.
Channels of Distribution. U.S. producers’ shipments and shipments of subject imports fromChina and Mexico all included shipments to both distributors and end users. Over the period examined,shipments of the domestic like product to distributors accounted for between 56 and 61 percent of totalshipments and shipments to end users accounted for between 39 and 44 percent. Subject imports fromChina ranged between 5 and 57 percent to distributors and between 43 and 95 percent to end users. Subject imports from Mexico, on the other hand, ranged between 25 percent and 84 percent to distributorsand between 16 and 75 percent to end users.108 Accordingly, imports from each subject source and thedomestic like product overlap in channels of distribution sufficiently to support cumulation.
Simultaneous Presence. Official import statistics show that subject imports from China andthose from Mexico have each been present in the U.S. market in each month of the period ofinvestigation.109
Conclusion. Although it appears that there may be limited fungibility between plumbing andindustrial pipe and tube, channel of distribution data indicate that both plumbing and industrial pipe andtube were included among the shipments of domestic pipe and tube, subject imports from China, andsubject imports from Mexico. We find that the tube type and channel of distribution overlaps between thesubject imports from China and Mexico are sufficient to support cumulation. Accordingly, on thesebases, and because there is geographic overlap and simultaneous presence, we find that there is areasonable overlap of competition between subject imports from China and Mexico and among subjectimports and the domestic like product. Therefore, we cumulatively assess the volume and effects ofsubject imports from China and Mexico for purposes of determining whether the domestic industry ismaterially injured by reason of the subject imports.
2. Cumulation for Threat of Material Injury
Having found a reasonable overlap of competition, we consider other factors to determinewhether to exercise our discretion to cumulate subject imports from China and Mexico for purposes ofassessing whether an industry in the United States is threatened with material injury by reason of subjectimports. The volume of subject imports from Mexico declined by 5.1 percent between 2007 and 2009,while the volume of subject imports from China increased by 22.6 percent. In market share terms, subjectimports from Mexico increased somewhat from 7.6 percent in 2007 to 8.3 percent in 2008, beforedeclining to 6.9 percent in 2009. The market share of subject imports from China increased from 9.1
104 CR/PR at II-1.
105 CR/PR at Tables IV-4, IV-5.
106 CR/PR at II-1.
107 CR at II-1-2, PR at II-1.
108 CR/PR at Table II-1.
109 CR/PR at Table IV-6.
17

percent in 2007 to 12.9 percent in 2008, before increasing further to 13.2 percent in 2009. A greaterconvergence in the market share trends for subject imports from China in Mexico appears in the interimperiod. The volume of subject imports from Mexico in interim 2010 was 45.2 percent lower than thevolume reported in interim 2009. The volume of subject imports from China was 41.8 percent lower ininterim 2010 than in interim 2009.110
Regarding the pricing data, subject imports from each country at times undersold the domesticlike product, with subject imports from Mexico underselling somewhat more frequently than did subjectimports from China. Subject imports from Mexico undersold the domestic like product in 53 of 90quarterly comparisons, while subject imports from China primary oversold – underselling in only 43 of91 instances.111
While the industry in Mexico is significantly smaller than the industry in China, it has beenundergoing significant expansion.112 Both industries rely on export markets to absorb a significant shareof shipments.113 The industry in Mexico is closely intertwined with both the U.S. industry and theindustry in China. All of the reported capacity expansions in Mexico have been undertaken by producerswith related parties in the U.S. (Luvata) or in China (Golden Dragon).114
Regarding the type of SRC pipe and tube that is exported from the subject countries, we havedefined a single domestic like product consisting of all SRC pipe and tube. Respondents IUSA, Nacobre,Cambridge-Lee, and Copper and Brass International argue that subject imports should not be cumulatedbecause Mexico supplied principally plumbing tube whereas China supplied predominantly industrialtube.115 While the record shows that imports from China were mostly industrial pipe and tube and thosefrom Mexico were mostly for plumbing applications, there was significant and growing overlap in theproduct types exported to the United States from China and Mexico. Importers reported sales of importsfrom China of seven of eight pricing products for industrial applications and five of eight for plumbingapplications. Importers reported sales of imports of four products from Mexico for plumbing applicationsand four products for industrial applications.116 Finally, capacity expansions in Mexico are for theproduction of industrial SRC pipe and tube.117 These expansions will lead to increased overlap in subjectimport product types.
Based on the record in these investigations, on balance we find sufficient evidence to exercise ourdiscretion to consider the impact of subject imports cumulatively in our threat analysis.
V. LEGAL STANDARDS
A. In General
In the final phase of antidumping and countervailing duty investigations, the Commissiondetermines whether an industry in the United States is materially injured or threatened with material
110 CR/PR at Table C-1.
111 CR/PR at Table V-10.
112 CR at VII-7, PR at VII-6.
113 CR /PR at Tables VII-1, VII-4.
114 CR at VII-7, PR at VII-6.
115 IUSA and Nacobre Posthearing Brief at 8.
116 CR at V-25-26, PR at V-12.
117 CR at VII-7, PR at VII-5-6; CR/PR at Table VII-5. As noted above, moreover, the share of total imports fromMexico consisting of industrial SRC pipe and tube had already increased substantially in 2009 and interim 2010.CR/PR at Tables E-3, E-4.
18

injury by reason of the imports under investigation.118 In making this determination, the Commissionmust consider the volume of subject imports, their effect on prices for the domestic like product, and theirimpact on domestic producers of the domestic like product, but only in the context of U.S. productionoperations.119 The statute defines “material injury” as “harm which is not inconsequential, immaterial, orunimportant.”120 In assessing whether the domestic industry is materially injured by reason of subjectimports, we consider all relevant economic factors that bear on the state of the industry in the UnitedStates.121 No single factor is dispositive, and all relevant factors are considered “within the context of thebusiness cycle and conditions of competition that are distinctive to the affected industry.”122
Although the statute requires the Commission to determine whether the domestic industry is“materially injured or threatened with material injury by reason of” unfairly traded imports,123 it does notdefine the phrase “by reason of,” indicating that this aspect of the injury analysis is left to theCommission’s reasonable exercise of its discretion.124 In identifying a causal link, if any, between subjectimports and material injury to the domestic industry, the Commission examines the facts of record thatrelate to the significance of the volume and price effects of the subject imports and any impact of thoseimports on the condition of the domestic industry. This evaluation under the “by reason of” standardmust ensure that subject imports are more than a minimal or tangential cause of injury and that there is asufficient causal, not merely a temporal, nexus between subject imports and material injury.125
In many investigations, there are other economic factors at work, some or all of which may alsobe having adverse effects on the domestic industry. Such economic factors might include nonsubjectimports; changes in technology, demand, or consumer tastes; competition among domestic producers; ormanagement decisions by domestic producers. The legislative history explains that the Commission mustexamine factors other than subject imports to ensure that it is not attributing injury from other factors tothe subject imports, thereby inflating an otherwise tangential cause of injury into one that satisfies thestatutory material injury threshold.126 In performing its examination, however, the Commission need not
118 19 U.S.C. §§ 1671d(b), 1673d(b).
119 19 U.S.C. § 1677(7)(B)( i). The Commission “may consider such other economic factors as are relevant to thedetermination” but shall “identify each {such} factor ... and explain in full its relevance to the determination.” 19 U.S.C. § 1677(7)(B).
120 19 U.S.C. § 1677(7)(A).
121 19 U.S.C. § 1677(7)(C)(iii).
122 19 U.S.C. § 1677(7)(C)(iii).
123 19 U.S.C. §§ 1671d(a), 1673d(a).
124 Angus Chemical Co. v. United States, 140 F.3d 1478, 1484-85 (Fed. Cir. 1998) (“{T}he statute does not‘compel the commissioners’ to employ {a particular methodology}.”), aff’d, 944 F. Supp. 943, 951 (Ct. Int’l Trade1996).
125 The Federal Circuit, in addressing the causation standard of the statute, observed that “{a}s long as its effectsare not merely incidental, tangential, or trivial, the foreign product sold at less than fair value meets the causationrequirement.” Nippon Steel Corp. v. USITC, 345 F.3d 1379, 1384 (Fed. Cir. 2003). This was further ratified inMittal Steel Point Lisas Ltd. v. United States, 542 F.3d 867, 873 (Fed. Cir. 2008), where the Federal Circuit, quotingGerald Metals, Inc. v. United States, 132 F.3d 716, 722 (Fed. Cir. 1997), stated that “this court requires evidence inthe record ‘to show that the harm occurred “by reason of” the LTFV imports, not by reason of a minimal ortangential contribution to material harm caused by LTFV goods.’” See also Nippon Steel Corp. v. United States,458 F.3d 1345, 1357 (Fed. Cir. 2006); Taiwan Semiconductor Industry Ass’n v. USITC, 266 F.3d 1339, 1345 (Fed.Cir. 2001).
126 SAA at 851-52 (“{T}he Commission must examine other factors to ensure that it is not attributing injury fromother sources to the subject imports.”); S. Rep. 96-249 at 75 (1979) (the Commission “will consider informationwhich indicates that harm is caused by factors other than less-than-fair-value imports.”); H.R. Rep. 96-317 at 47
continue...
19

isolate the injury caused by other factors from injury caused by unfairly traded imports.127 Nor does the“by reason of” standard require that unfairly traded imports be the “principal” cause of injury orcontemplate that injury from unfairly traded imports be weighed against other factors, such as nonsubjectimports, which may be contributing to overall injury to an industry.128 It is clear that the existence ofinjury caused by other factors does not compel a negative determination.129
Assessment of whether material injury to the domestic industry is “by reason of” subject imports“does not require the Commission to address the causation issue in any particular way” as long as “theinjury to the domestic industry can reasonably be attributed to the subject imports” and the Commission“ensure{s} that it is not attributing injury from other sources to the subject imports.”130 Indeed, theFederal Circuit has examined and affirmed various Commission methodologies and has disavowed “rigidadherence to a specific formula.”131
The Federal Circuit’s decisions in Gerald Metals, Bratsk, and Mittal Steel all involved caseswhere the relevant “other factor” was the presence in the market of significant volumes of price-competitive nonsubject imports. The Commission interpreted the Federal Circuit’s guidance in Bratsk asrequiring it to apply a particular additional methodology following its finding of material injury in casesinvolving commodity products and a significant market presence of price-competitive nonsubject
126 ...continue(1979) (“in examining the overall injury being experienced by a domestic industry, the ITC will take into accountevidence presented to it which demonstrates that the harm attributed by the petitioner to the subsidized or dumpedimports is attributable to such other factors;” those factors include “the volume and prices of nonsubsidized importsor imports sold at fair value, contraction in demand or changes in patterns of consumption, trade restrictive practicesof and competition between the foreign and domestic producers, developments in technology and the exportperformance and productivity of the domestic industry”); accord Mittal Steel, 542 F.3d at 877.
127 SAA at 851-52 (“{T}he Commission need not isolate the injury caused by other factors from injury caused byunfair imports.”); Taiwan Semiconductor Industry Ass’n v. USITC, 266 F.3d 1339, 1345 (Fed. Cir. 2001) (“{T}heCommission need not isolate the injury caused by other factors from injury caused by unfair imports ... . Rather, theCommission must examine other factors to ensure that it is not attributing injury from other sources to the subjectimports.” (emphasis in original)); Asociacion de Productores de Salmon y Trucha de Chile AG v. United States, 180F. Supp. 2d 1360, 1375 (Ct. Int’l Trade 2002) (“{t}he Commission is not required to isolate the effects of subjectimports from other factors contributing to injury” or make “bright-line distinctions” between the effects of subjectimports and other causes.); see also Softwood Lumber from Canada, Invs. Nos. 701-TA-414 and 731-TA-928(Remand), USITC Pub. 3658 at 100-01 (Dec. 2003) (Commission recognized that “{i}f an alleged other factor isfound not to have or threaten to have injurious effects to the domestic industry, i.e., it is not an ‘other causal factor,’then there is nothing to further examine regarding attribution to injury”), citing Gerald Metals, Inc. v. United States,132 F.3d 716, 722 (Fed. Cir. 1997) (the statute “does not suggest that an importer of LTFV goods can escapecountervailing duties by finding some tangential or minor cause unrelated to the LTFV goods that contributed to theharmful effects on domestic market prices.”).
128 S. Rep. 96-249 at 74-75; H.R. Rep. 96-317 at 47.
129 See Nippon Steel Corp., 345 F.3d at 1381 (“an affirmative material-injury determination under the statuterequires no more than a substantial-factor showing. That is, the ‘dumping’ need not be the sole or principal cause ofinjury.”).
130 Mittal Steel, 542 F.3d at 877-78; see also id. at 873 (“While the Commission may not enter an affirmativedetermination unless it finds that a domestic industry is materially injured ‘by reason of’ subject imports, theCommission is not required to follow a single methodology for making that determination ... {and has} broaddiscretion with respect to its choice of methodology.”) citing United States Steel Group v. United States, 96 F.3d1352, 1362 (Fed. Cir. 1996) and S. Rep. 96-249 at 75.
131 Nucor Corp. v. United States, 414 F.3d 1331, 1336, 1341 (Fed. Cir. 2005); see also Mittal Steel, 542 F.3d at879 (“Bratsk did not read into the antidumping statute a Procrustean formula for determining whether a domesticinjury was ‘by reason’ of subject imports.”).
20

imports.132 The additional “replacement/benefit” test looked at whether nonsubject imports might havereplaced subject imports without any benefit to the U.S. industry. The Commission applied that specificadditional test in subsequent cases, including the Carbon and Certain Alloy Steel Wire Rod from Trinidadand Tobago determination that underlies the Mittal Steel litigation.
Mittal Steel clarifies that the Commission’s interpretation of Bratsk was too rigid and makes clearthat the Federal Circuit does not require the Commission to apply an additional test nor any one specificmethodology; instead, the court requires the Commission to have “evidence in the record” to “show thatthe harm occurred ‘by reason of’ the LTFV imports,” and requires that the Commission not attributeinjury from nonsubject imports or other factors to subject imports.133 Accordingly, we do not considerourselves required to apply the replacement/benefit test that was included in Commission opinionssubsequent to Bratsk.
The progression of Gerald Metals, Bratsk, and Mittal Steel clarifies that, in cases involvingcommodity products where price-competitive nonsubject imports are a significant factor in the U.S.market, the Court will require the Commission to give full consideration, with adequate explanation, tonon-attribution issues when it performs its causation analysis.134 135
The question of whether the material injury threshold for subject imports is satisfiednotwithstanding any injury from other factors is factual, subject to review under the substantial evidencestandard.136 Congress has delegated this factual finding to the Commission because of the agency’sinstitutional expertise in resolving injury issues.137
B. Material Injury by Reason of Subject Imports
In evaluating the volume of subject imports, section 771(7)(C)(I) of the Tariff Act provides thatthe “Commission shall consider whether the volume of imports of the merchandise, or any increase in thatvolume, either in absolute terms or relative to production or consumption in the United States, issignificant.”138
In evaluating the price effects of the subject imports, section 771(7)(C)(ii) of the Tariff Actprovides that the Commission shall consider whether –
132 Mittal Steel, 542 F.3d at 875-79.
133 Mittal Steel, 542 F.3d at 873 (quoting from Gerald Metals, 132 F.3d at 722), 875-79 & n.2 (recognizing theCommission’s alternative interpretation of Bratsk as a reminder to conduct a non-attribution analysis).
134 Commissioner Lane refers to her dissenting views in Polyethylene Terephthalate Film, Sheet, and Strip fromBrazil, China, Thailand, and the United Arab Emirates, Invs. Nos. 731-TA-1131 to 1134 (Final), USITC Pub. 4040(Oct. 2008), for further discussion of Mittal Steel.
135 To that end, after the Federal Circuit issued its decision in Bratsk, the Commission began to present publishedinformation or send out information requests in final phase investigations to producers in nonsubject countries thataccounted for substantial shares of U.S. imports of subject merchandise (if, in fact, there were large nonsubjectimport suppliers). In order to provide a more complete record for the Commission’s causation analysis, theserequests typically seek information on capacity, production, and shipments of the product under investigation in themajor source countries that export to the United States. The Commission plans to continue utilizing published orrequested information in final phase investigations in which there are substantial levels of nonsubject imports.
136 We provide in our respective discussions of volume, price effects, and impact a full analysis of other factorsalleged to have caused any material injury experienced by the domestic industry.
137 Mittal Steel, 542 F.3d at 873; Nippon Steel Corp., 458 F.3d at 1350, citing U.S. Steel Group, 96 F.3d at 1357;S. Rep. 96-249 at 75 (“The determination of the ITC with respect to causation is ... complex and difficult, and is amatter for the judgment of the ITC.”).
138 19 U.S.C. § 1677(7)(C)(i).
21

(I) there has been significant price underselling by the imported merchandise ascompared with the price of domestic like products of the United States, and
(II) the effect of imports of such merchandise otherwise depresses prices to a significantdegree or prevents price increases, which otherwise would have occurred, to a significantdegree.139
In examining the impact of subject imports, section 771(7)(C)(iii) of the Tariff Act provides thatthe Commission “shall evaluate all relevant economic factors which have a bearing on the state of theindustry.”140 These factors include output, sales, inventories, ability to raise capital, research anddevelopment, and factors affecting domestic prices. No single factor is dispositive and all relevant factorsare considered “within the context of the business cycle and conditions of competition that are distinctiveto the affected industry.”141
C. Threat of Material Injury by Reason of Subject Imports
Section 771(7)(F) of the Tariff Act directs the Commission to determine whether the U.S.industry is threatened with material injury by reason of the subject imports by analyzing whether “furtherdumped or subsidized imports are imminent and whether material injury by reason of imports wouldoccur unless an order is issued or a suspension agreement is accepted.”142 The Commission may not makesuch a determination “on the basis of mere conjecture or supposition,” and considers the threat factors “asa whole” in making its determination whether dumped or subsidized imports are imminent and whethermaterial injury by reason of subject imports would occur unless an order is issued.143 In making ourdetermination, we consider all statutory threat factors that are relevant to this investigation.144
139 19 U.S.C. § 1677(7)(C)(ii).
140 19 U.S.C. § 1677(7)(C)(iii); see also SAA at 851 and 885 (“In material injury determinations, the Commissionconsiders, in addition to imports, other factors that may be contributing to overall injury. While these factors, insome cases, may account for the injury to the domestic industry, they also may demonstrate that an industry is facingdifficulties from a variety of sources and is vulnerable to dumped or subsidized imports.”).
141 19 U.S.C. § 1677(7)(C)(iii); see also SAA at 851, 885; Live Cattle from Canada and Mexico, Inv. Nos. 701-TA-386, 731-TA-812-813 (Preliminary), USITC Pub. 3155 at 25 n.148 (Feb. 1999).
142 19 U.S.C. § 1677(7)(F)(ii).
143 19 U.S.C. § 1677(7)(F)(ii).
144 These factors are as follows:
(I) if a countervailable subsidy is involved, such information as may be presented to it by the administeringauthority as to the nature of the subsidy (particularly as to whether the countervailable subsidy is a subsidydescribed in Article 3 or 6.1 of the Subsidies Agreement) and whether imports of the subject merchandiseare likely to increase,
(II) any existing unused production capacity or imminent, substantial increase in production capacity in theexporting country indicating the likelihood of substantially increased imports of the subject merchandiseinto the United States, taking into account the availability of other export markets to absorb any additionalexports,
(III) a significant rate of increase of the volume or market penetration of imports of the subject merchandiseindicating the likelihood of substantially increased imports,
continue...
22

VI. CONDITIONS OF COMPETITION
The following conditions of competition inform our analysis of whether there is material injury orthreat of material injury by reason of subject imports.
A. Production Processes
The technology used in the production of SRC pipe and tube in the United States, China, andMexico has been evolving over the past 20 years. The most common method for producing SRC pipe andtube historically has been the extrusion method, in which hollow billets are cast from molten copper. Thebillets are later reheated and converted into rough tubes using an extrusion process. A more recentdevelopment is the continuous horizontal cast and roll (“cast and roll”) process, which uses fewer steps byeliminating the billet reheating and extrusion steps.145
The cast and roll process was developed by Outokumpu (now Luvata) in October 1989. Thepatent expired in March 2008. The cast and roll process was introduced in China in February 1991, whenChina National Technical Import and Export Corporation (now Golden Dragon) obtained licences fromOutokompu that initially limited the process to a single facility in Xiangxiang. Golden Dragon obtainedadditional licenses in April 2001, for production on a new cast and roll line through March 2003, and inDecember 2004 for lines in three Golden Dragon facilities. It also was granted permission to ship itsproduct under these licenses to market destinations worldwide.146
144 ...continue(IV) whether imports of the subject merchandise are entering at prices that are likely to have a significantdepressing or suppressing effect on domestic prices and are likely to increase demand for further imports,
(V) inventories of the subject merchandise,
(VI) the potential for product-shifting if production facilities in the foreign country, which can be used toproduce the subject merchandise, are currently being used to produce other products.
* * *
(IX) any other demonstrable adverse trends that indicate the probability that there is likely to be materialinjury by reason of imports (or sale for importation) of the subject merchandise (whether or not it is actuallybeing imported at the time).
19 U.S.C. § 1677(7)(F)(i). To organize our analysis, we discuss the applicable statutory threat factors using thesame volume/price/impact framework that applies to our material injury analysis. Statutory threat factors (II), (III),(V), and (VI) are discussed in the analysis of subject import volume. Statutory threat factor (IV) is discussed in theprice effects analysis, and statutory threat factor (IX) is discussed in the impact analysis. Statutory threat factors (I)is inapplicable as these investigations do not include a countervailing duty investigation, and factor (VII) isinapplicable as no imports of agricultural products are involved in this investigation. No argument was made thatthe domestic industry is currently engaging or will imminently engage in any efforts to develop a derivative or moreadvanced version of the domestic like product, which would implicate statutory threat factor (VIII).
145 CR at I-12-15, PR at I-11.
146 CR at I-17-18, PR at I-13; Golden Dragon Posthearing Brief at R-18.
23

In the United States, ***.147
***.148 Mexican producer IUSA initiated construction of a cast and roll facility in 2007 andstarted production trials in 2008 with equipment manufactured by Danieli & Kalamari rather than byOutokompu.149
Although respondent parties contend that that the cast and roll method results in a better seamlessproduct than the extrusion method, petitioners contend that they can and do consistently meet purchasers’specification for both industrial and plumbing SRC pipe and tube by using the cast and roll or extrusionprocesses interchangeably.150
B. Demand Conditions
SRC pipe and tube is principally used in plumbing, refrigeration, and air conditioning systems. Demand for SRC pipe and tube, therefore, is largely derived from residential construction, commercialconstruction, and the market for air conditioning and refrigeration units. Most producers, importers, andpurchasers agree that demand for SRC pipe and tube in the United States declined over the periodexamined. They also note that demand declined with increased substitution of plastic (known as PVC andPEX) in plumbing applications, and aluminium and stainless steel pipe and tube in industrial applications,in the place of SRC pipe and tube.151 Plastic pipe and tube is easier to install than SRC pipe and tube andits substitution for the subject product has had a long term impact on demand for SRC pipe and tube. While aluminum and stainless steel pipe and tube are less desirable than SRC pipe and tube in industrialapplications owing to their lower heat transfer efficiencies, OEMs have been willing to substitutealuminum pipe and tube in response to high copper prices in recent years.152
When measured by apparent domestic consumption, U.S. demand declined over the periodexamined from 992.5 million pounds in 2007 to 698.0 million pounds in 2009, a 29.7 percent decline, and
147 CR at I-17, PR at I-13.
148 CR at I-17, PR at I-13.
149 Hearing Transcript at 257-258 (Ochoa).
150 Golden Dragon, for instance, contends that the cast and roll method permits better control of wall thicknessalong the length of the mother tube, thus permitting lighter and more consistent wall thicknesses to be drawn in thefinishing stage. It contends, moreover, that the cast and roll process also enables Golden Dragon to manufacturesmaller diameter product requiring less copper per foot. Golden Dragon Prehearing Brief at 11-12, HearingTranscript (Weil) at 197. Goodman maintains that it purchases subject cast and roll product because the processresults in the far fewer defects in the finished product than in those originating from the extrusion process. HearingTranscript (Topper) at 201.
Petitioners’ argue that there are no differences in the resulting SRC pipe and tube product whether themother tube is produced from the extrusion or the cast and roll processes. See, e.g., Conference Transcript (Arndt,Hansen, and Sigloch) at 52. In fact, larger diameters can be produced only by the extrusion method. See, e.g.,Conference Transcript (Sigloch) at 52. A witness on behalf of petitioners testified that all plumbing and industrialpipe and tubing up to 1-5/8" outer diameters sold by domestic producer Cerro originates from both extrusion or castand roll technologies interchangeably, customers do not require production by a specific process, and its SRC pipeand tube consistently meets customer specifications because a finished product manufactured to a given specificationwill always be the same, no matter which prefabrication technology produces the mother tube. Hearing Transcript(Arndt) at 39, 76. ***. Petitioners Posthearing Brief at 9 and Exhibit 6. Petitioners also contend that the defect ratefor SRC pipe and tube originating from the extrusion method is no greater than for SRC pipe and tube originatingfrom the cast and roll process.
151 CR at II-12, PR at II-8.
152 CR at II-12-13, PR at II-8.
24

was 10.4 percent lower in interim 2010, at 341.5 million pounds, than in interim 2009, at 381.0 millionpounds.153
C. Supply Conditions
The domestic industry is the largest source of supply in the U.S. market. Domestic producers’market share was 75.8 percent in 2007, 71.3 percent in 2008, and 73.5 percent in 2009. The domesticindustry’s market share was 77.5 percent in interim 2010 compared with 72.8 percent in interim 2009.154 U.S. producers’ production capacity exceeds domestic demand.155 Fourteen domestic producersaccounted for 95 percent of U.S. SRC pipe and tube production in 2009.156 The record indicates thatsome domestic producers manufacture only plumbing tube, some manufacture only industrial pipe andtube, and some manufacture both plumbing and industrial pipe and tube.157 Mueller, Cerro, KobeWieland, and Cambridge-Lee are the largest domestic producers, accounting for *** percent, *** percent,and ***, and percent *** of reported domestic production, respectively.158 ***.159
The market share of subject imports increased from 16.7 percent in 2007 to 21.2 percent in 2008then declined to 20.0 percent in 2009. Their market share was 13.4 percent in interim 2010 comparedwith 21.2 percent in interim 2009.160 *** and *** were the largest reporting U.S. importers of subjectSRC pipe and tube accounting for about *** percent of U.S. imports from subject sources. *** importedover *** of subject imports from China and *** imported almost *** of subject imports from Mexico.161 Whereas industrial pipe and tube accounted for only *** percent or less of subject imports from Mexicoin 2007 and 2008, they accounted for nearly *** percent in 2009 and about *** percent in interim 2010compared with about *** percent in interim 2009.162 Subject imports from China remained largelyconcentrated in industrial SRC pipe and tube throughout the period examined.
The market share of nonsubject imports was 7.5 percent in 2007 and 2008, 6.5 percent in 2009,and 9.0 percent in interim 2010 compared with 6.0 percent in interim 2009.163
D. Interchangeability
There is a moderate to high degree of substitutability between the domestic like product andsubject imports.164 As noted above, market participants perceive domestic SRC pipe and tube and subjectimports to be interchangeable. A majority of reporting domestic producers, importers, and purchasersreported that the domestic product is always or frequently interchangeable with the subject imports fromeach subject source and that the Chinese and Mexican SRC pipe and tube are interchangeable with each
153 CR/PR at Tables C-1.
154 CR/PR at Tables C-1.
155 Domestic producers’ capacity was 1.2 billion pounds in 2007, 1.1 billion pounds in 2008 and 1.1 billionpounds in 2009 and 563.5 million pounds in interim 2009 and 545.7 million pounds in interim 2010. CR/PR atTable C-1.
156 CR/PR at III-1.
157 E.g., Petitioners Postconference Brief at 13, IUSA and Nacobre Postconference Brief at 5-7.
158 CR/PR at Table III-1.
159 CR at I-22, PR at I-16 n.82.
160 CR/PR at Tables IV-5, C-1.
161 CR/PR at II-1, CR/PR at Table IV-1.
162 CR/PR at Tables E-3, E-4.
163 CR/PR at Tables IV-5, C-1.
164 See, e.g., CR at II-24-25, PR at II-17-18.25
other.165 We note, however, as discussed above, that the interchangeability between plumbing andindustrial pipe and tube appears to be somewhat limited with respect to finished product characteristics,channels of distribution, and the manner in which they are priced. Regarding price, as explained above,plumbing pipe and tube is typically sold at a discount off published price lists, while commercial pipe andtube is sold by the largest U.S. producers and importers of product from China at the prevailing COMEXprice of copper plus a fabrication charge.166
VII. MATERIAL INJURY AND THREAT OF MATERIAL INJURY BY REASON OFSUBJECT IMPORTS167
Based on the record in the final phase of these investigations, we find that an industry in theUnited States is threatened with material injury by reason of imports of SRC pipe and tube from Chinaand Mexico that Commerce has found are sold at less than fair value.
A. Likely Volume of the Subject Imports168
1. Material Injury by Reason of Subject Imports
In absolute terms, the volume of subject imports increased from 165.8 million pounds in 2007 to182.5 million pounds in 2008, then dropped to 139.8 million pounds in 2009.169 Although the volume ofsubject imports fell by 15.7 percent overall from 2007 to 2009, it rose by 10.0 percent between 2007 and2008.170 Subject imports were 43.1 percent lower in interim 2010, at 45.9 million pounds, than in interim2009, at 80.7 million pounds.171
The market share of subject imports increased sharply then decreased slightly during 2007-09.172 Demand declined between 2007 and 2008 as the volume of subject imports increased. Specifically,apparent U.S. consumption decreased by 13.5 percent, whereas the volume of subject imports increasedby 10.0 percent.173 As a result, the market share held by subject imports increased from 16.7 percent in2007 to 21.2 percent in 2008.174 From 2008 to 2009, as apparent U.S. consumption fell by 18.7 percentand the volume of subject imports decreased by 23.4 percent, the market share held by subject imports
165 CR/PR at Table II-4.
166 CR at V-2-3, PR at V-2.
167 Negligibility under 19 U.S.C. § 1677(24) is not an issue in these investigations. Official statistics fromCommerce indicate that, from September 2008 to August 2009, which is the most recent 12-month period precedingthe filing of the petition for which data were available, subject imports from China accounted for 44.7 percent, andsubject imports from Mexico for 29.3 percent, of total imports of SRC pipe and tube in that period. CR at IV-12, PRat IV-11. The volume of subject imports is thus well above the statute’s three percent negligibility level.
168 In its final less than fair value determinations regarding imports of SRC pipe and tube from China and Mexico,Commerce calculated dumping margins ranging from 11.25 percent to 60.85 percent ad valorem for SRC pipe andtube from China and ranging from 24.89 to 27.16 percent ad valorem for SRC pipe and tube from Mexico. CR at I-5, PR at I-4.
169 CR/PR at Table C-1.
170 CR/PR at Table C-1.
171 CR/PR at Table C-1.
172 CR/PR at Table C-1.
173 CR/PR at Table C-1.
174 CR/PR at Table C-1.26
fell by just 1.2 percentage points, from 21.2 percent in 2008 to 20.0 percent in 2009.175 By contrast, thedomestic producers’ market share declined from 75.8 percent in 2007 to 71.3 percent in 2008 beforeincreasing to 73.5 percent in 2009, a level still below that in 2007.176
We note that the market share held by subject imports was markedly lower in interim 2010, at13.4 percent, than in interim 2009, when it was 21.2 percent.177 By contrast, domestic producers’ marketshare was markedly higher in interim 2010, at 77.5 percent, than in interim 2009, when it was 72.8percent.178 Nonsubject imports’ share of apparent U.S. consumption, based on quantity, was higher ininterim 2010, at 9.0 percent, than in interim 2009, at 6.0 percent.179
Notwithstanding the declines in subject import volume and market share in interim 2010, we findthe volume of subject imports during the period examined to be significant, both in absolute terms andrelative to consumption and production in the United States. We note that the declines in the volume andmarket share of subject imports in interim 2010 occurred after the petitions in these investigations werefiled on September 30, 2009. Notably, the decline in subject imports in interim 2010 stands in starkcontrast to the relatively steady presence of nonsubject imports in that same time frame.180 Based on therecord evidence, we find that the decline in subject import volumes at the end of the period examinedresulted to a large extent from the pendency of these investigations.181 Absent these investigations, theabsolute and relative volumes of subject imports would likely have been greater in interim 2010.
We note that certain OEM purchasers that use industrial SRC pipe and tube in their manufactureof HVAC systems argue that the significance of the volume of subject imports should be discountedbecause certain diameters of SRC pipe and tube or certain inner groove patterns cannot be obtained in theUnited States. They also claim that they import subject SRC pipe and tube from China because theyprefer to use SRC pipe and tube produced by the cast and roll method rather than SRC pipe and tubeproduced by the extrusion process.182
Significantly, however, these purchasers do not argue that subject imports, by whatever methodproduced, are not generally interchangeable with the domestic like product. Moreover, to the extent theyprefer to purchase cast and roll products, cast and roll SRC pipe and tube are produced by the domesticindustry, although domestic producers were limited in their ability to produce industrial SRC pipe andtube using the cast and roll production method until 2008.183 Additionally, domestic producers are able toproduce industrial (including inner groove) pipe and tube with outside diameters up to 1-5/8", the size
175 CR/PR at Table C-1.
176 CR/PR at Table C-1.
177 CR/PR at Table C-1.
178 CR/PR at Table C-1.
179 CR/PR at Table C-1.
180 CR/PR at Table IV-2, IV-3.
181 The statutory provision governing the Commission’s treatment of post-petition information, states that:
[T]he Commission shall consider whether any change in the volume, price effects, or impact of imports ofthe subject merchandise since the filing of the petition in an investigation … is related to the pendency ofthe investigation and, if so, the Commission may reduce the weight accorded to the data for the period afterthe filing of the petition in making its determination of material injury, threat of material injury, or materialretardation of the establishment of an industry in the United States.
19 U.S.C. § 1677(7)(I).
182 See Prehearing Brief of Goodman at 5 and Appendices 1, 3; Prehearing Brief of Marubeni and Johnson at 9-11.
183 CR at I-15-17, PR at I-13. The combined cast and roll capacity of Cerro and Kobe Wieland is ***. CR at I-17, PR at I-13.
27

range that comprises the bulk of the market, from mother tube originating from either the extrusion or thecast and roll methodologies. The same finished product originating from mother tube made by eithertechnology is sold to and used by some purchasers interchangeably. Moreover, it appears that these OEMpurchasers account for a relatively small share of total HVAC system production and industrial SRC pipeand tube consumption, that the specific 5 mm product that they claim they are required to import is asmall share of their total SRC pipe and tube requirements, that the product they import likely could beproduced in the United States (but currently is not), and that other HVAC producers, as noted above, usedomestically produced industrial SRC pipe and tube produced by both the extrusion and the cast and rollmethods.184
2. Threat of Material Injury by Reason of Subject Imports
As noted above, as demand decreased from 2007 to 2008, the volume of subject importsincreased.185 As a result, the market share held by subject imports increased from 16.7 percent in 2007 to21.2 percent in 2008, while the market share held by the domestic industry declined from 75.8 percent in2007 to 71.3 percent in 2008.186 Nothing on the record indicates that demand will increase in theimminent future.187
The Commission requested data from the 14 firms that were listed in the petition as producingSRC pipe and tube in China during the period of the investigation. The Commission received responsesfrom eight firms.188 Exports to the United States by these eight firms accounted for a substantial share ofSRC pipe and tube imported from China from January 2007 to June 2010.189 190 It appears, however, thatthere are producers of SRC pipe and tube in China whose operations are not accounted for in theresponses of the eight firms reporting here and that, therefore, record data on the Chinese SRC pipe andtube industry (including producers in China who have not exported to the United States) areincomplete.191 The record does include, however, a published *** report that 18 major copper tubemanufacturers in China have a combined SRC pipe and tube capacity of 2 billion pounds per year and
184 CR at I-15-17, PR at I-13, Petitioners Final Comments at 11-13. Even if Golden Dragon’s use of the cast androll method to produce the 5mm product played a role in U.S. purchasers’ sourcing decision, we note that thisproduct accounted for *** percent of Golden Dragon’s U.S. shipment during the period examined (Petitioners FinalComments at 11, Golden Dragon Posthearing Brief at Attachment 3) and, thus, for ***.
185 CR/PR at Table C-1.
186 CR/PR at Table C-1.
187 See, e.g., CR/PR at Figure II-1.
188 CR/PR at VII-3.
189 CR/PR at Tables VII-1 & C-1.
190 Chairman Okun notes that the statute authorizes the Commission to take adverse inferences but suchauthorization does not relieve the Commission of its obligation to consider the record evidence as a whole in makingits determination. See 19 U.S.C. § 1677e. She generally gives credence to the facts supplied by the participatingparties and certified by them as true, but bases her decision on the evidence as a whole, and does not automaticallyaccept participating parties’ suggested interpretations of the record evidence. Regardless of the level ofparticipation, the Commission is obligated to consider all evidence relating to each of the statutory factors and maynot draw adverse inferences that render such analysis superfluous. “In general, the Commission makesdeterminations by weighing all of the available evidence regarding a multiplicity of factors relating to the domesticindustry as a whole and by drawing reasonable inferences from the evidence it finds most persuasive.” Statement ofAdministrative Action (“SAA”) on Uruguay Round Agreements Act (“URAA”), H.R. Rep. 103-316, Vol. I at 869(1994).
191 U.S. importers, for instance, identified the following producers/exporters as other Chinese sources for SRCpipe and tube: ***. CR/PR at VII-3.
28
were operating at only 35 percent of capacity early in 2009.192 This means that Chinese producers mayhave had 1.30 billion pounds of unused capacity at that time. This contrasts with total capacity reportedby Chinese producer/exporters in responses to the Commission’s questionnaire of 1.2 billion pounds in2009, and their reported excess capacity of only 12.2 percent, or 145.5 million pounds.193
Moreover, even based on the questionnaire response data, it is clear that significant amounts ofSRC pipe and tube capacity and excess capacity are available in China that can be used to produce SRCpipe and tube for the U.S. market. Reported Chinese capacity was 1.0 billion pounds in 2007, 1.1 billionpounds in 2008, 1.2 billion pounds in 2009, and 644.4 million pounds in interim 2010 compared with588.7 million pounds in interim 2009. Thus, Chinese capacity increased 17.3 percent from 2007 to 2009,and was 9.5 percent higher in interim 2010 than in interim 2009. Chinese producers’ reported capacityutilization rates of 88.1 percent in 2007, 82.0 percent in 2008, 87.8 percent in 2009, and 86.6 percent ininterim 2010. Accordingly, the responding Chinese producers reported 145.5 million pounds of unusedcapacity in 2009.194 This unused capacity substantially exceeds China’s peak shipments to the U.S.market of 103.4 million pounds in 2008.195 Chinese capacity is projected to increase further in 2010 and2011.196
The capacity and excess capacity reported by Mexican producers is also substantial. TheCommission received questionnaire responses from each of the five producers of SRC pipe and tube inMexico from which it requested data. These firms are believed to account for *** of Mexican exportshipments to the United States in 2009.197 Capacity reported by Mexican producers increased from ***million pounds in 2007 to *** million pounds in 2008, and to *** million pounds in 2009, a 2007-09increase of *** percent. Capacity was *** percent higher in interim 2010, at *** million pounds, than ininterim 2009, at *** million pounds. Mexican producers’ capacity is projected to increase further in 2010and 2011.198 Capacity utilization rates reported by the Mexican producers declined over the periodexamined from *** percent in 2007, to *** percent in 2008, and to *** percent in 2009. The rate waslower in interim 2010, at *** percent, than in interim 2009, at *** percent. Accordingly, Mexicanproducers reported *** million pounds of unused capacity in 2009.199 This unused capacity substantiallyexceeds Mexican producers’ peak shipments to the U.S. market of 74.8 million pounds in 2007.200 201
192 Petitioners Postconference Brief at 4, Petitioners Prehearing Brief at Exhibit 6 (***.
193 CR/PR at Table VII-1.
194 CR/PR at Table VII-1.
195 CR/PR at Table C-1.
196 CR/PR at Table VII-1.
197 CR at VII-6, PR at VII-5.
198 CR at VII-6, PR at VII-5; CR/PR at Table VII-4.
199 CR/PR at Table VII-1.
200 CR/PR at Table C-1.
201 Contributing to the actual and projected capacity increases in Mexico, Golden Dragon Affiliates opened aplant in Monclova, Mexico at the end of September 2009 and projects capacity at the plant to be approximately ***. Golden Dragon’s intention in opening the facilities in Mexico was to produce the same products in Mexico that arebeing produced for export to the United States by Golden Dragon’s Chinese operations to permit replacement ofU.S. imports from Golden Dragon in China with imports from Golden Dragon in Mexico. CR at VII-7, PR at VII-6. Another Mexican producer, Luvata Monterrey, began production in 2009 ***. Id. IUSA asserts that it is shifting itsproduction of plumbing pipe and tube for U.S. consumption from its operations in Mexico to its related partyproducer in the United States, Cambridge-Lee, and that therefore its exports of subject merchandise from Mexico tothe United States have declined or will decline as a result. In light of the emergence of new producers in Mexico and declining demand conditions in the U.S. market, we find that IUSA’s shift of production from Mexico to theUnited States does not mean that increased imports from Mexico (in absolute or relative terms) are not likely in the
continue...29

Reported excess capacity for Chinese and Mexican producers combined was *** million poundsin 2009, *** percent greater than the *** million pounds peak volume of subject imports in 2008.202
Chinese and Mexican producers’ inventories would also permit them to increase exports to theUnited States. Chinese producers reported end-of-period inventories of 21.0 million pounds in 2007, 16.1million pounds in 2008, 20.1 million pounds in 2009, 16.0 million pounds in interim 2009, and 23.9million pounds in interim 2010.203 Mexican producers reported end-of-period inventories of *** millionpounds in 2007, *** million pounds in 2008, *** million pounds in 2009, *** million pounds in interim2009, and *** million pounds in interim 2010.204 Accordingly, subject producers inventories, which wereequivalent to only *** percent of apparent U.S. consumption in 2007 and *** percent in 2008, increasedto *** percent in 2009, and were *** percent in interim 2010 compared with *** percent in interim2009.205
Chinese and Mexican producers/exporters have incentives to increase exports to the U.S. market. The U.S. market is familiar to SRC pipe and tube producers in China and Mexico that have developedchannels of distribution in the United States market during the period examined and, as such, haveestablished relationships with a broad range of importers. The significance of those relationships isheightened to the extent that importers in the United States are related to subject producers/exporters. Forinstance, Golden Dragon and Luvata each has production operations in China and Mexico and a relatedimporter in the United States, and IUSA is related to the U.S. producer and importer Cambridge-Lee. Moreover, during 2007-09, more than one-third of the total exports of Chinese producers/exporters andmore than *** of the total exports of Mexican producers/exporters were to the United States,206 indicatingthat they view the United States as an attractive export market. There is no indication in the record thatChinese and Mexican producers, in the absence of antidumping duty orders, would find the U.S. marketany less attractive in the imminent future than they have during the period examined, during which theyincreased their overall market share by 3.3 percentage points between 2007 and 2009.207 In fact, GoldenDragon opened its plant in Mexico intending to supply product it currently ships from China, but thecapacity will remain available in its Chinese facility.208 Thus, although demand in the United States isexpected to remain low in the imminent future, Chinese and Mexican producers would likely target thenew orders for SRC pipe and tube that arise, consistent with their behavior in aggressively seeking salesand market share gains in the United States during the period examined.209
Based on the above, we conclude that producers of SRC pipe and tube in China and Mexico have the ability and the incentive to increase exports of subject SRC pipe and tube. We also conclude that theUnited States is a highly attractive market for Chinese and Mexican SRC pipe and tube producers asevidenced by their increased presence in and familiarity with the U.S. market in recent years and the
201 ...continueimminent future, as IUSA claims.
202 CR/PR at Tables VII-1, VII-4, C-1. We note that these data are limited to data provided by the eight Chineseproducers that responded to the Commission’s foreign producer questionnaire.
203 CR/PR at Table VII-1. We note that these data are limited to data provided by the eight Chinese producersthat responded to the Commission’s foreign producer questionnaire.
204 CR/PR at Table VII-4.
205 CR/PR at Tables IV-7, VII-1, VII-4.
206 CR/PR at Tables VII-1, VII-4.
207 As discussed above, official Commerce statistics indicate that subject imports have been at extremely lowlevels since March 2010. CR/PR at Tables IV-4. As noted above, we find that the decline in subject imports’market share attributable to the pendency of these investigations. See 19 U.S.C. § 1677(7)(I)).
208 Golden Dragon Final Comments at 12, Hearing Transcript (Weil) at 153.
209 See Petitioners Prehearing Brief at Exhibit 13 (quoting Golden Dragon’s President as stating, “[e]ven if welose at the final [ITC} ruling, we will continue to export to the American market and seize a larger market share....”).
30
importance of the U.S. market among their export markets. Additionally, we note that the market share ofsubject imports in the United States has increased during the period examined or remained at or nearperiod high levels, with the exception of interim 2010. As noted, we attribute the decline in interim 2010to these pending investigations. We find that subject imports could easily increase at least to their peakabsolute volume in 2008. Thus, we conclude that subject import volume is likely to be significant in theimminent future, both in absolute terms and relative to consumption and production in the United States,and that the increase in subject imports’ market share will likely be significant.
B. Likely Price Effects of the Subject Imports
1. Material Injury by Reason of Subject Imports
As explained above in the discussion of conditions of competition, the domestic like product andsubject imports are generally interchangeable, and price is an important consideration in purchasingdecisions.210 The Commission collected quarterly pricing data for eight SRC pipe and tube products.211 Eight U.S. producers, 13 importers of SRC pipe and tube from China, and eight importers of SRC pipeand tube from Mexico provided usable pricing data for sales of those eight pricing products. Pricing datareported by these firms accounted for approximately 11 percent of U.S. producers’ shipments of SRCpipe and tube, 81 percent of U.S. shipments of subject imports from China, and 17 percent of U.S.shipments of subject imports from Mexico in 2009.212
Subject imports undersold the domestic like product in 96 of 181 quarterly pricing comparisonsby margins ranging from less than one percent to 27.6 percent.213 We note, however, that subject importsundersold the domestic like product with far greater frequency for products that accounted for the largestvolume of imports. In fact, the 96 quarterly instances in which subject imports undersold the domesticproduct accounted for approximately two-thirds (67.1 percent) of the total volume of subject imports forthe eight products used in these comparisons.214 In light of the degree of mixed underselling andoverselling, we do not find that subject imports undersold the domestic like product to a significantdegree during the period examined.215
In examining the record for evidence that subject imports had significant price depressing effects,we note that prices for all eight U.S.-produced SRC pipe and tube products fluctuated within a wide rangeduring the period examined, but increased overall from the first quarter to the last.216 Most of this pricefluctuation and increase, however, can be attributed to the cost of raw materials, which accounted for 84percent of the COGS during the period examined, rather than the effect of subject imports.217 Prices forU.S.-produced products 1 through 8 increased by 2.4 to 22.3 percent. Prices for products 2 and 3imported from China decreased by 4.1 to 54.9 percent, respectively, and prices of other productsincreased by 0.9 to 39.3 percent. Prices of products 5 and 6 imported from Mexico decreased by 5.7 and
210 CR/PR at Tables II-4 & II-6.
211 CR at V-6, PR at V-4.
212 CR at V-7, PR at V-4.
213 CR/PR at Table V-7.
214 CR/PR at Tables V-1-8. See, e.g., CR at Table V-5 (underselling in 9 of 14 comparisons of prices for thedomestic and Chinese product 5; product 5 accounts for the majority of subject imports analyzed in the quarterlyprice comparison tables).
215 Vice Chairman Williamson finds that subject imports undersold the domestic like product to a significantdegree during the period examined.
216 CR/PR at Table V-9.
217 CR at VI-5, PR at VI-1.31
5.3 percent respectively and prices of other products increased by 5.2 to 19.1 percent.218 Accordingly, wedo not find adequate evidence on the record to find that subject imports significantly depressed the pricesof domestically produced SRC pipe and tube.
We do not find evidence that subject imports prevented price increases that otherwise would haveoccurred to a significant degree. Although the domestic industry experienced an increase in costs relativeto sales revenues in 2009,219 the increase coincided with a decline in demand that was a consequence ofconditions in the overall economy and the market for SRC pipe and tube.220 Moreover, the decline indemand during the period examined – especially between 2008 and 2009 – made it more difficult fordomestic producers to raise prices; purchasers had less need for SRC pipe and tube and were thereforelikely less willing to pay higher prices. We also note that the domestic industry’s COGS-to-sales ratiocontinued to increase in 2009 and in interim 2010 despite decreasing subject imports. Accordingly, weare unable to find that subject imports, which fell in tandem with the downturn in demand and maintaineda relatively steady share of the market, played a significant role in the increase in the industry’s COGS-to-sales ratio in 2009. For these reasons, we do not find that subject imports significantly suppressed pricesfor the domestic like product in 2009.
For the above reasons, we conclude that subject imports are not currently having a significantadverse effect on domestic producers’ prices for SRC pipe and tube.
2. Threat of Material Injury by Reason of Subject Imports
We next consider the likely price effects of subject imports in the imminent future. The recordincludes evidence of some underselling and aggressive marketing of low priced subject imports during theperiod examined.221 As sellers of the Chinese and Mexican product attempt to increase sales of thesubject product in the United States, they are likely to increase their use of underselling and aggressivepricing as a means of increasing market share, particularly given that SRC pipe and tube from China andMexico are generally substitutable and price is an important factor in purchasing decisions.222 Thisunderselling by subject imports is likely to increase the attractiveness of those imports to domesticpurchasers compared with domestically produced pipe.
We find that the increasing and significant volumes of subject imports that are likely in theimminent future in the absence of antidumping duty orders would be aggressively priced in an effort togain market share. Pressure on the domestic industry would be to either lower prices, or more likely, cedevolume, given the limit on the domestic industry to lower prices in the face of aggressive pricingstrategies by subject imports. While the total volume and value of confirmed lost sales and lost revenueswas not great in the context of total consumption, purchasers reported that during the period ofinvestigation, they switched suppliers from domestic to subject sources because of lower subject importprices, or U.S. producers had reduced their prices in order to compete with prices of SRC pipe and tubefrom China or Mexico.223 We further recognize that the raw material share of the cost of production issignificant and limits the ability of the domestic producers to lower prices.224
218 CR/PR at Table V-9; CR at V-7, PR at V-12.
219 COGS as a percentage of net sales increased from 90.7 percent in 2007 to 91.5 percent in 2008 and 93.5percent in 2009. The COGS/net sales ratio was higher in interim 2010, at 94.2 percent, than in interim 2009, at 93.0percent. CR/PR at Table C-1.
220 CR/PR at Table C-1.
221 E.g., CR/PR at Tables V-1 - V-8, Petitioners Final Comments at 7.
222 CR/PR at Tables II-4, II-2.
223 See, e.g., CR at V-33-43, PR at V-14-19 (comments of representatives of ***).
224 CR at VI-5, PR at VI-1.32
We note that the domestic industry was not able to raise prices in interim 2010 to offset higherCOGS compared with interim 2009, resulting in a higher COGS to net sales ratio in interim 2010 than ininterim 2009.225 This suggests that the domestic industry will have little flexibility to competeaggressively with subject imports on price. For these reasons, we conclude that the domestic industry islikely to cede market to the subject imports.
We conclude that, in the imminent future, increased quantities of subject imports, that areaggressively priced in an effort to gain market share would cause the domestic industry to cede marketshare as well as experience some price suppression in a market that will likely remain characterized byseverely depressed demand. As subject imports cause domestic sales volumes and prices to deteriorateand per-unit costs to increase, the domestic industry would likely experience adverse price effects throughhigher unit costs, compressed margins, and some price suppression as well.
C. Likely Impact of the Subject Imports on the Domestic Industry
1. Material Injury by Reason of Subject Imports
As discussed above, apparent U.S. consumption of SRC pipe and tube declined over the periodexamined.226 Many indicators of the domestic industry’s performance declined in the same manner,including production,227 capacity,228 capacity utilization,229 shipments,230 net sales,231 operating income andoperating margins,232 and employment.233 Although most of the industry’s performance indicators weredown sharply in 2009 compared with 2007, we are not able to conclude that these declines weresignificantly linked to subject imports rather than declines in demand. Although capital expenditures
225 As noted above, COGS as a percentage of sales was higher in interim 2010, at 94.2 percent, than in interim2009, at 93.0 percent. CR/PR at Table C-1.
226 CR/PR at Table C-1.
227 The domestic industry’s production declined 31.9 percent between 2007 and 2009. Its production was 781.1million pounds in 2007, 640.0 million pounds in 2008, 531.6 million pounds in 2009. Production was 284.8 millionpounds in interim 2009 and 296.1 million pounds in interim 2010. CR/PR at Table C-1.
228 The domestic industry’s capacity declined 8.3 percent overall between 2007 and 2009. Its capacity was 1.223billion pounds in 2007, 1.121 billion pounds in 2008, and 1.123 billion pounds in 2009. Capacity was 563.5 million pounds in interim 2009 and 545.7 million pounds in interim 2010. CR/PR at Table C-1.
229 The domestic industry’s capacity utilization declined by 16.5 percentage points between 2007 and 2009. Itscapacity utilization was 63.8 percent in 2007, 57.1 percent in 2008, and 47.3 percent in 2009. Capacity utilizationwas 50.5 percent in interim 2009 and 54.3 percent in interim 2010. CR/PR at Table C-1.
230 U.S. producers’ U.S. shipments declined by 31.9 percent between 2007 and 2009. Their domestic shipmentswere 752.5 million pounds in 2007, 612.0 million pounds in 2008, and 512.8 million pounds in 2009. Shipmentswere 277.3 million pounds in interim 2009 and 264.7 million pounds in interim 2010. CR/PR at Table C-1.
231 The domestic industry’s net sales, by value, declined 48.3 percent between 2007 and 2009. Its net salestotaled $3.151 billion in 2007, $2.762 billion in 2008, and $1.630 billion in 2009. Net sales totaled $748.3 millionin interim 2009 and $1.162 billion in interim 2010. CR/PR at Table C-1.
232 The domestic industry’s operating income declined by 79.6 percent overall between 2007 and 2009. Itsoperating income totaled $219.9 million in 2007, $167.4 million in 2008, and $44.9 million in 2009. Operatingincome was $21.9 million in interim 2009 and $34.2 million in interim 2010. As a ratio to net sales, the domesticindustry’s operating income was 7.0 percent in 2007, 6.1 percent in 2008, and 2.8 percent in 2009. It was 2.9percent in interim 2009 and interim 2010. CR/PR at Table C-1.
233 Production and related workers (“PRWs”) were 3,644 in 2007, 3,303 in 2008, 2,902 in 2009, 2,962 in interim2009, and 2,668 in interim 2010. Hours worked by PRWs were 7.8 million 2007, 7.0 million in 2008, 5.9 million in2009, 3.1 million in interim 2009, and 2.8 million in interim 2010. Worker productivity (in pounds per hour) was100.1 in 2007, 91.6 in 2008, 90.5 in 2009, 93.1 in interim 2009, and 105.3 in interim 2010. CR/PR at Table C-1.
33

declined overall during the period examined, we note that the industry was able to undertake significantcapital expenditures.234 Cerro and Kobe Wieland, which reported ***, engaged in significantmodernization programs during the period examined, including, as discussed above, the development ofproduction using cast and roll technology.235 As noted above, the domestic industry experienced modestimprovement in many of its performance indicators in interim 2010.236
Accordingly, we do not find that the domestic industry producing SRC pipe and tube wasmaterially injured by reason of subject imports during the period examined.
2. Threat of Material Injury by Reason of Subject Imports
As discussed above, we do not find the domestic industry to be currently materially injured byreason of subject imports. We do, however, find that, in light of the substantial declines in the industry’sperformance as summarized above, the industry is in a vulnerable condition. Increasing this vulnerabilityare the industry’s relatively recent and substantial capital expenditures in cast and roll technology. ***has not yet achieved the ***.237 In the absence of any indication that demand for SRC pipe and tube willincrease significantly, the domestic industry is unlikely to perform well in the near term. As a result, evenrelatively modest volumes of subject imports have the potential to cause significant adverse consequencesfor the domestic industry.
The state of the domestic SRC pipe and tube industry toward the end of the period examined(2009 and interim 2010) weighs heavily in our consideration of the likely impact of subject imports in theimminent future. As discussed above, the industry’s performance in 2009 declined substantially in termsof production, shipments, net sales, unit COGS, operating income, and operating margins. The industryexperienced overall declines in these performance indicators between 2007 and 2009 and only a moderaterecovery in interim 2010.238
The current state of the domestic industry is primarily attributable to the sudden drop in demandthat began in 2008. Looking forward, the conditions that drove demand and domestic prices upward in2008 are not likely to recur in the imminent future. Rather, demand is likely to remain anemic in theimminent future.239
We evaluate the likely effects of the significant volume of aggressively priced subject importsfrom China on the domestic industry in the imminent future in light of these market conditions. In theabsence of antidumping duty relief, we conclude that the likely increasing and significant volumes ofsubject imports would be priced aggressively enough to gain sales at the expense of domestic producers. Consequently, the domestic industry would likely experience declines in production, market share,capacity utilization, and shipments. The domestic industry would also likely experience loweremployment levels, net sales, operating income, and profitability. Accordingly, we find that there is alikely causal relationship between the subject imports and an imminent adverse impact on the domesticindustry. We have considered whether other factors would likely have an imminent adverse impact on thedomestic industry. As noted, we recognize the impact of the decline in demand for SRC pipe and tube
234 CR/PR at Table C-2.
235 CR at VI-7-8, PR at VI-4.
236 CR/PR at Table C-1.
237 CR/PR at Table III-3.
238 CR/PR at Table C-1.
239 CR/PR at Figure II-1. The substitution of plastic in plumbing applications and aluminum and stainless steelpipe and tube in industrial applications reportedly occurred during the period examined in part because of increasedcopper prices. CR at II-12-13, PR at II-8-9. If copper prices reach similarly high levels in the near future, suchsubstitution may accelerate.
34

after 2008 on the domestic industry’s performance. Although demand is likely to remain at depressedlevels in the imminent future, it is not likely to decline further from present levels. Accordingly, thelikely further declines in the domestic industry’s production, market share, capacity utilization,shipments, employment levels, productivity, and operating income will come as a result of subjectimports gaining market share rather than as a result of continued or renewed declines in demand.
We also recognize that nonsubject imports were a factor in the U.S. market during the periodexamined. Subject imports, however, gained market share from the domestic industry from 2007 to 2009,while the market share of nonsubject imports declined in that period. Moreover, in interim 2010, whensubject imports lost market share following the filing of the petitions in these investigations, the domesticindustry’s market share increased by 4.7 percentage points, whereas nonsubject imports increased by only3.0 percentage points.240 We note that the domestic industry’s condition improved to some extent, asdiscussed above, in interim 2010.241 Accordingly, the presence of nonsubject imports in the U.S. marketdoes not alter our finding that, in the absence of the restraining effect of antidumping duty orders, thesubject imports will have a significant adverse impact on the performance of the domestic industry.
We conclude that a significant volume of less-than-fair-value imports from China and Mexicowould likely gain additional U.S. market share in the imminent future and lead to material injury to thevulnerable domestic industry by reason of subject imports in the absence of antidumping duty relief. Accordingly, we determine that the domestic industry is threatened with material injury by reason ofsubject imports from China and Mexico.
We further determine, pursuant to 19 U.S.C. § 1671d(b)(4)(B), that we would not have foundmaterial injury but for the suspension of liquidation of subject imports.
CONCLUSION
For the foregoing reasons, and based on the record in these final phase investigations, we findthat an industry in the United States is threatened with material injury by reason of subject imports ofSRC pipe and tube from China and Mexico that Commerce has found are sold in the United States at lessthan fair value.
240 CR/PR at Table C-1. The record data on nonsubject import prices is very limited. Those data suggests amixed but fairly balanced pattern of underselling and overselling compared with prices for domestically producedproduct and subject imports. CR at G-3, PR at G-3; CR/PR at Tables G-1, G-2.
241 CR/PR at Table C-1.35


SEPARATE VIEWS OF COMMISSIONER CHARLOTTE R. LANE
Based on the record in the final phase of these investigations, I find that an industry in the UnitedStates is materially injured by reason of imports of SRC pipe and tube from China and Mexico thatCommerce has found are sold at less than fair value. I join in parts I through IV.B.1. of the Views of themajority. I also join in part V, Legal Framework, and part VI, Conditions of Competition. I writeseparately concerning Material Injury By Reason of Subject Imports.
Volume of the Subject Imports
The absolute volume of subject imports increased from 165.8 million pounds in 2007 to 182.5million pounds in 2008, and then dropped to 139.8 million pounds in 2009. The increase in subjectimports between 2007 and 2008 was 10.0 percent. That increase was followed by a drop of 23.4 percentbetween 2008 and 2009. Overall, between 2007 and 2009 the volume of subject imports declined by 15.7percent. The volume of subject imports declined both absolutely and relative to apparent domesticconsumption in interim 2010, dropping to 45.9 million pounds in interim 2010 compared to 80.7 millionpounds in interim 2009.1
Because of a declining U.S. market, even though the volume of subject imports dropped between2007 and 2009, the market share of subject imports actually increased from 16.7 percent in 2007 to 20.0percent in 2009. By contrast, the domestic producers’ market share declined from 75.8 percent in 2007 to73.5 percent in 2009.2 In interim 2010 the market share of subject imports was lower, at 13.4 percent,than in interim 2009, when it was 21.2 percent. The domestic producers gained market share in interim2010, going from 72.8 percent to 77.5 percent.3 Nonsubject imports also gained market share in interim2010 over interim 2009, going from 6.0 percent to 9.0 percent.4
The declines in the volume and market share of subject imports in interim 2010 occurred after thepetitions in these investigations were filed on September 30, 2009. I find that the decline in subjectimport volumes at the end of the period examined was due, to a significant degree, to the initiation ofthese investigations. Accordingly, for the purpose of evaluating the volume of subject imports, I give lessweight to the substantial decline in volume and market share of subject imports in the latter part of 2009and in interim 2010.5
Subject imports equaled 22.0 percent of U.S. shipments of domestic production of SRC pipe andtube in 2007. This relationship increased to 29.8 percent in 2008. Even with a significant drop in subjectimports in 2009, they still equaled 27.3 percent of shipments of domestic SRC pipe and tube in 2009. This measure of relative subject imports dropped in interim 2010 as subject imports equaled 17.3 percent
1 CR/PR at Table C-1.
2 Id.
3 Id.
4 Id.
5 The statutory provision governing the Commission’s treatment of post-petition information, states that:
[T]he Commission shall consider whether any change in the volume, price effects, or impact of imports ofthe subject merchandise since the filing of the petition in an investigation … is related to the pendency ofthe investigation and, if so, the Commission may reduce the weight accorded to the data for the period afterthe filing of the petition in making its determination of material injury ... 19 U.S.C. § 1677(7)(I).
37
of shipments of domestic production.6 Comparing the volume of subject imports to domestic productionyields similar results. Subject imports, represented 21.2 percent , 28.5 percent, 26.3 percent and 15.5percent of domestic production in 2007, 2008, 2009, and interim 2010 respectively.7
I find the volume of subject imports during the period examined is significant, both in absoluteterms and relative to consumption and production in the United States.
Price Effects of the Subject Imports
The Commission collected quarterly pricing data for eight SRC pipe and tube products.8 Pricingdata reported in questionnaire responses accounted for approximately 11 percent of U.S. shipments ofdomestic SRC pipe and tube, 81 percent of U.S. shipments of subject imports from China, and 17 percentof U.S. shipments of subject imports from Mexico in 2009.9
Subject imports from China undersold the domestic like product in 43 of 91 pricing comparisons. This represents underselling in 47.3 percent of the quarterly comparisons. Subject imports from Mexicoundersold the domestic like product in 53 of 90 quarterly pricing comparisons, or 58.9 percent of thequarterly comparisons. In total, subject imports undersold the domestic like product in 96 of 181, or 53.0percent, of the quarterly pricing comparisons.10
These data alone indicate mixed results, but show a significant number, and a majority, ofquarterly comparisons in which there was underselling by subject imports. However, further reviewof the data based on volumes for which there was underselling produces an even stronger indication thatthe underselling by subject imports was significant and pervasive.
The following table summarizes the quarters of underselling of domestic like product prices bysubject imports and the associated volumes that undersold the prices of the domestic like product. Thedata for the following table are taken from Tables V-1 through V-8 in the Commission’s Final Report.
Summarizing and comparing the pricing product data by volume shows that there were146,417,000 pounds of subject imports from China that undersold domestic like product out of a totalreported volume of Chinese subject imports of 216,947,000 pounds. Although 47.3 percent of thequarters reflected underselling by Chinese subject imports, on the basis of volume underselling occurredfor 67.5 percent of the subject imports from China.
Similarly, for subject imports from Mexico, there were 24,239,000 pounds that undersolddomestic like product out of a total reported subject import volume of 37,450,000 pounds. On avolumetric basis, the underselling by subject imports from Mexico occurred for 64.7 percent of thepricing products.
In total, by a count of quarters of data, 53.0 percent of the quarterly pricing comparisons showedunderselling by total subject imports from China and Mexico, however, on a volumetric basis theunderselling occurred for 67.1 percent of those subject imports.
Review of the pricing data also shows that the domestic like product was undersold by eithersubject imports from China or subject imports from Mexico in approximately 66.0 percent of the 112
6 Derived from CR/PR at Table C-1.
7 Id.
8 CR at V-6, PR at V-4.
9 CR at V-7, PR at V-4.
10 Derived from CR/PR Tables V-1 through V-8.
38
quarters of data covering the eight pricing products over three and one-half years.11 The undersellingcompeted against a large majority of the volumes of domestic SRC pipe and tube for which pricing datawas gathered as approximately 75.0 percent of the total volume of domestic like product reported in thepricing data was undersold by either Chinese or Mexican subject imports.
Based on the record in these investigations, I find that subject imports undersold domestic likeproduct for a significant majority of volumes for which price comparisons are available. I take thissignificant underselling into consideration in my evaluation of the extent to which injury to the domesticindustry is by reason of subject imports.
The domestic industry suffered from a cost-price squeeze from 2007 through 2009. This squeezeis seen as Cost of Goods Sold (COGS) increased in 2008 and as COGS declined in 2009. In 2008 thedomestic industry was not able to increase prices as much as the increase in COGS as unit COGSincreased by $0.19 per pound while unit revenue increased by only $0.17 per pound. In 2009 thedomestic industry experienced a significant decrease in unit COGS, but its unit revenue decreased evenmore as COGS dropped by $1.00 per pound and revenue dropped by $1.15 per pound. As a result of thiscost-price squeeze, gross profit fell from $0.38 per pound in 2007 to $0.36 per pound in 2008 and thenfell again to only $0.21 per pound in 2009.12
Considering the conditions of competition, including the substitution and demand elasticities forSRC pipe and tube, even though the demand for SRC pipe and tube dropped in 2008 and 2009, I do notfind that the decreased demand can be the sole, or even primary, cause for the inability of the domesticindustry to hold its gross profit levels in 2008 and 2009 closer to the level achieved at the beginning ofthe period in 2007. Subject imports contributed significantly to the cost-price squeeze experienced by thedomestic industry. Given the availability of lower priced subject imports, it is not surprising thatpurchasers would have held the line against domestic price increases for their SRC pipe and tube.
Unlike calendar years 2008 and 2009 when subject imports were increasing their market share,the domestic industry was able to reverse the decline in gross profit in a continuing weak market and inthe face of significant increases in costs during interim 2010. From interim 2009 to interim 2010 the unitCOGS of the domestic industry increased by $1.32 per pound while its unit value of sales increased by$1.36 per pound. The gross profit of the domestic industry increased from $0.19 per pound in interim2009 to $0.23 per pound in interim 2010. The ability of the domestic industry to increases pricessignificantly in interim 2010, even more than the substantial increase in COGS, occurred within acontinuing weak market and in the face of increases in nonsubject import market share, but, notably, alsowithin a period of significant decline in subject import market share. Apparent domestic consumptionwas very low in interim 2010, at 341.5 million pounds compared to 381.0 million pounds in interim 2009,a weak market that would indicate resistance to price increases. However in conjunction with that weakmarket, subject imports declined to their lowest market share by far at 13.4 percent in interim 2010. Thedomestic industry, which had been unable to even maintain gross profit margins at the 2007 level in 2008and 2009 when subject import market share was increasing in a weak market, was able to reverse its cost-price squeeze and increase its gross profit margin in interim 2010 in a continuing weak market, butcoincidental with a substantial decline in subject import market share.
I find that the record clearly supports a finding that competition from unfairly traded imports thatpervasively undersold the domestic like product in significant volumes contributed substantially to thecost-price squeeze experienced by the domestic industry during the period of investigation. Therefore, Ifind that subject imports suppressed domestic prices to a significant degree, preventing domestic priceincreases that otherwise would have occurred absent the low- priced, unfairly traded, subject imports.
11 CR/PR Tables V-1 through V-8.
12 In interim 2009 the unit gross profit was only $0.19 per pound.
39

Likely Impact of the Subject Imports on the Domestic IndustryAlmost all of the indicators of the domestic industry’s performance declined during the full years
covered by the period of investigation. The domestic industry’s production declined by 32.0 percent from2007 to 2009, dropping from 781.1 million pounds in 2007 to 640.0 million pounds in 2008, and then to531.6 million pounds in 2009.13 During the same period, total apparent U.S. consumption dropped by29.7 percent. Even before the full force of the U.S. and worldwide recession was felt in 2009, U.S.production declined by 18.1 percent in 2008. This exceeded the reduction in U.S. demand, whichdropped by only 13.5 percent in 2008. Domestic production began to pick up in interim 2010, helped byincreases in export sales by U.S. producers and the decline in subject imports. Production, which hadbeen 284.8 million pounds in interim 2009 (January through June), and even lower at 246.8 millionpounds in the last half of 2009, increased to 296.1 million pounds in interim 2010 (January through June).
The production capacity of the domestic industry dropped from 1.224 billion pounds in 2007 to1.123 billion pounds in 2009, a decrease of 8.3%. Capacity utilization dropped from 63.8 percent in 2007to 47.3 percent in 2009. For the interim periods examined, capacity utilization was 50.5 percent ininterim 2009 and 54.3 percent in interim 2010.14
Mirroring the reduction in production, domestic shipments dropped by 18.7 percent from 2007 to2008 and by an aggregate 31.9 percent from 2007 to 2009. The U.S. producers lost market share from2007 to 2009 since the drop in shipments of U.S. production significantly exceeded the drop in apparentU.S. consumption. This steep decline in the market share of domestically produced SRC pipe and tubereversed in interim 2010. While U.S. shipments of domestic production had been declining more rapidlythan the decline in apparent U.S. consumption in 2008 and 2009, in interim 2010 domestic shipmentsdropped by only 4.5 percent as compared to the 10.4 percent drop in U.S. consumption and the marketshare of the domestic industry rebounded from 72.8 percent in interim 2009 to 77.5 percent in interim2010. This increase in market share in 2010 occurred as subject imports were leaving the U.S. marketboth absolutely and as measured by market share.
Domestic employment declined significantly during the period of investigation, dropping from3,644 workers in 2007 to 2,902 workers in 2009, a decline of 20.4 percent. Hours worked dropped evenmore, declining by 24.6 percent from 2007 to 2009. The slight rebound in domestic production quantitiesand the increase in market share in interim 2010 was not translated into a recovery in jobs or hoursworked. The number of production workers continued to decline in interim 2010, dropping from 2,962 ininterim 2009 to 2,668 in interim 2010, a drop of 9.9 percent. Hours worked dropped in interim 2010 by8.1 percent.15
The operating income of the domestic industry dropped from $219,878,000 in 2007 to$44,893,000 in 2009, a decrease of 79.6 percent.16 Net income dropped slightly more, going from$209,652,000 in 2007 to $35,285,000 in 2009, a decrease of 83.2 percent.17 Unit net operating incomedropped from $0.28 per pound in 2007 to $0.09 in 2009, a decrease of 70.0 percent. The ratio of netoperating income to sales dropped from 7.0 percent in 2007 to 2.8 percent in 2009.18 The unit net
13 CR/PR at Table C-1.
14 Id.
15 Id.
16 CR/PR at Table C-1.
17 CR/PR at Table VI-1.
18 CR/PR at Table C-1.
40

operating income improved to $0.12 per pound in interim 2010 and the ratio of net operating income tosales also improved very slightly over calendar year 2009, going to 2.9 percent.
The level of capital expenditures made by the domestic industry declined from $41,162,000 in2007 to $34,090,000 in 2009, a decline of 17.2 percent. Capital expenditures dropped more significantlybetween the interim periods, going from $17,231,000 in interim 2009 to only $6,024,000 in interim 2010,a decline of 65.0 percent.19
Cash flow generated by the domestic industry declined significantly from $247,946,000 in 2007to $73,175,000 in 2009, a decrease of 70.5 percent.20 The return on investment earned by the domesticindustry dropped from 17.5 percent in 2007 to 15.8 percent in 2008 and then plummeted to 4.4 percent in2009.21
Based on declines in all indicators of the operational and financial health of domestic producersand the significant declines in employment, I find that the domestic industry suffered material injuryduring the period of investigation. However, the mere existence of material injury is not the only thingthat I must determine. It is necessary to determine whether subject imports were a material contributor tothe injury. As discussed in more detail in Section V of the majority Views, in which I have joined, theCommission need not isolate the injury caused by other factors from injury caused by unfairly tradedimports. Nor does the "by reason of" standard require that unfairly traded imports be the principal causeof injury or contemplate that injury from unfairly traded imports be weighed against other factors whichmay be contributing to overall injury to an industry. Moreover, the existence of injury caused by otherfactors does not compel a negative determination.22
The significant decline in U.S. demand associated with an unprecedented economic depressionand a downturn in the construction and manufacturing activities, upon which demand for SRC pipe andtube depends, contributed to injury to the domestic industry. However, that contributory factor does noteliminate the reality that the domestic industry was, at the time of these critical economic problems, facedwith competition from significant volumes of unfairly traded subject imports. I cannot conclude thatsimply because there were multiple causes of injury to the domestic industry that there is not materialinjury be reason of subject imports. Therefore, I further analyze the data to determine if the recordsupports a finding of material injury by reason of the subject imports during the period of investigation.
In order to determine whether a significant portion of the material injury experienced by thedomestic industry is attributable to subject imports I analyze the likely impacts during the period ofinvestigation if subject imports had been fairly traded in the U.S. market. For this analysis, it is necessaryto consider the conditions of competition existing for this industry. These conditions include supply anddemand conditions and certain related elasticity factors. Although the Commission has discussed some ofthese conditions in the portions of the majority Views in which I have joined, I will now discuss them asthey relate to the ability of the U.S. industry to beneficially respond if subject imports had been fairlytraded in the U.S. market, albeit a declining market.
Supply conditions determine how producers can respond to an increase in demand for theirproduct. The same supply conditions apply whether the increase in demand is attributable to the total
19 Id.
20 CR/PR at Table VI-1.
21 CR/PR at Table VI-5
22 See Nippon Steel Corp., 345 F.3d at 1381 ("an affirmative material-injury determination under the statuterequires no more than a substantial-factor showing. That is, the ‘dumping' need not be the sole or principal cause ofinjury.").
41
demand in the market or a decline in the price advantage of subject imports leading to a decline indemand for the subject imports.
Total U.S. capacity to produce SRC pipe and tube declined slightly from 1.224 billion pounds in2007 to 1.123 billion pounds in 2009. However, even taking this drop into consideration, the amount ofunused capacity that was available to meet additional demand for U.S. produced SRC pipe and tubeincreased significantly during the period of investigation. The unused capacity was 443 million pounds in2007 but had grown to 591 million pounds in 2009. The utilization of domestic industry capacitydeclined from 63.8 percent in 2007 to only 47.3 percent in 2009.
Other supply conditions that could contribute to the domestic industry’s ability to increasedomestic sales are the inventory levels, ability to shift from other markets, and ability to shift productionfrom other products to SRC pipe and tube. However, given the extremely high level of unused capacityas evidenced by the very low capacity utilization rate, I find that even without considering these othersupply conditions, the domestic industry could easily have met increased domestic orders for SRC pipeand tube from available unused capacity throughout the period of investigation. My analysis of thedomestic supply factors indicate that the elasticity of domestic supply is high. This is consistent with theCommission’s Final Report which suggests a domestic supply elasticity in the range of 5 to 10.
An analysis of demand conditions considers options or alternatives that are available topurchasers and how they are likely to respond to changes in price. The price that purchasers are able or willing to pay for domestic SRC pipe and tube depends on a number of factors, including the cost share ofthe SRC pipe and tube in the total cost of production and market value of products that use SRC pipe andtube, purchasers' ability to switch to imports or alternate products in lieu of paying higher domestic pricesfor SRC pipe and tube.
SRC pipe and tube is mainly used either in plumbing applications or in the manufacture ofheating and air conditioning systems. SRC pipe and tube generally makes up a very small share of thetotal cost of the products that it is used in. Petitioners indicated that copper plumbing represents a fewhundred dollars out of the total cost of a $100,000 house. Petitioners further estimated the cost share ofSRC pipe and tube for heating and air conditioning applications to be in the range of [1] to [11] percent.23 There are, however, some substitutes for SRC pipe and tube, including plastic pipe for plumbing and, to alesser degree, aluminum and stainless steel tubes for heating and air conditioning applications.24
Considering the low cost share of SRC pipe and tube in the products in which it is used, but alsoconsidering the availability of some substitute products in some applications, I find that the priceelasticity of demand ranges from moderately inelastic to moderately elastic. This is consistent with thedemand elasticity estimate of -0.75 to -1.25 contained in the Commission’s Final Report.25
I also look closely at the ability of purchasers to substitute imported SRC pipe and tube fordomestic pipe and tube. A high elasticity of substitution between domestic and imported SRC pipe andtube would indicate that purchasers are likely to move to lower priced imports in response to lower pricesfor those imports. This factor is important in two respects. First, to determine whether any imports,including subject imports, would be an important factor in holding down domestic price increases. Secondly, a high degree of substitutability would indicate whether increases in prices of subject importswould be likely to encourage shifts to domestic production, non-subject imports, or both.
In the prehearing Staff Report, Staff suggested that the substitution elasticities between domesticSRC pipe and tube and subject imports was in the range of 3 to 5. A range of 3 to 5 has been historically
23 CR at II-13, PR at II-9.
24 CR at II-12 and 13, PR at II-9 and 10.
25 CR at II-24, PR at II-17.
42
characterized as “high substitutability”.26 Petitioners agreed that the substitutability was “high”, butsuggested that the factor range for “high substitutability” was more appropriately 6 to 10. GoldenDragon, on the other hand, suggested that a range of 3 to 5 was consistent with a description of “highsubstitutability”.
I find that the evidence supports a finding that there is a high degree of substitutability betweendomestic SRC pipe and tube and subject imports. I use the range of 3 to 5 in my analysis, but alsoconsider the low end of the range suggested by the Petitioners as part of my analysis.
Taking all of the conditions of competition, including the supply, demand and substitutionelasticity factors, and the volume and price impact of subject imports, into consideration I find that lowerpriced subject imports were capturing volumes from domestic SRC pipe and tube during the period ofinvestigation. I further find that there would have been a shift in demand away from subject imports ifthey had been fairly traded. This shift would have increased demand for both nonsubject imports anddomestic SRC pipe and tube.
If prices of subject imports had been increased to reflect a fairly traded value, there would havebeen a beneficial impact on the domestic industry, either in price increases, volume increases or both. Ifind that the data supports a finding that the domestic industry would have benefitted through increasedprices and increased market share if subject imports had been fairly traded. This would have translated toincreased operating profits, increased return on investment, increased cash flows, and increasedemployment for the domestic industry. Although there would have been some benefits to nonsubjectimports they would not have captured all of the benefits of subject imports being traded at fair prices.Therefore, I conclude that the domestic industry would have been better off if the subject imports fromChina and Mexico had been fairly traded. I find that the subject imports were a substantial factorcontributing to the material injury experienced by the domestic industry during the period ofinvestigation, as opposed to a merely being an "incidental, tangential, or trivial" factor.
Consequently, based on the record in these final phase investigations, I find that subject importshad an adverse impact on the condition of the domestic industry during the period of investigation. Inparticular, I find that the absolute and relative volumes of subject imports, and the increase in thosevolumes, are significant and that subject imports have undersold the domestic product, and havesuppressed domestic prices to a significant degree. The significant volume of subject imports, the patternof consistent underselling by the subject imports, and suppression of domestic prices caused declines inthe domestic producers’ relevant economic factors over the period of investigation and declines inemployment factors.
ConclusionFor the reasons stated above, I find that the domestic industry producing SRC pipe and tube is
materially injured by reason of cumulated subject imports of SRC pipe and tube from China and Mexicothat are sold in the United States at less than fair value.
26 CR at II-24, PR at II-18.
43

PART I: INTRODUCTION
BACKGROUND
These investigations result from a petition filed with the U.S. Department of Commerce(“Commerce”) and the U.S. International Trade Commission (“USITC” or “Commission”) by Cerro FlowProducts, Inc. (“Cerro”), St. Louis, MO; Kobe Wieland Copper Products, LLC (“Kobe Wieland”), PineHall, NC; Mueller Copper Tube Products, Inc. and Mueller Copper Tube Company, Inc. (“Mueller”),Memphis, TN, on September 30, 2009, alleging that an industry in the United States is materially injuredand threatened with material injury by reason of less-than-fair-value (“LTFV”) imports of seamlessrefined copper pipe and tube (“SRC pipe and tube”)1 from China and Mexico. Information relating to thebackground of the investigations is provided below.2
Effective date Action
September 30, 2009 Petition filed with Commerce and the Commission; institution of Commissioninvestigations
October 27, 2009 Commerce’s notice of initiation of antidumping duty investigations
November 24, 2009 Commission’s preliminary determinations
May 12, 2010 Commerce’s preliminary determinations
May 12, 2010 Scheduling of final phase of Commission investigations (75 FR 33330, June11, 2010)
September 23, 2010 Commission’s hearing1
October 1, 2010Commerce’s final determinations: Mexico (75 FR 60723), China (75 FR60725)
October 26, 2010 Commission’s vote
November 15, 2010 Commission’s determinations transmitted to Commerce
1 A list of witnesses that appeared at the hearing is presented in app. B.
STATUTORY CRITERIA AND ORGANIZATION OF THE REPORT
Statutory Criteria
Section 771(7)(B) of the Tariff Act of 1930 (the “Act”) (19 U.S.C. § 1677(7)(B)) provides that inmaking its determinations of injury to an industry in the United States, the Commission--
shall consider (I) the volume of imports of the subject merchandise, (II)the effect of imports of that merchandise on prices in the United Statesfor domestic like products, and (III) the impact of imports of suchmerchandise on domestic producers of domestic like products, but onlyin the context of production operations within the United States; and . . .
1 See the section entitled “The Subject Merchandise” in Part I of this report for a complete description of themerchandise subject to these investigations.
2 Federal Register notices cited in the tabulation are presented in appendix A.
I-1

may consider such other economic factors as are relevant to thedetermination regarding whether there is material injury by reason ofimports.
Section 771(7)(C) of the Act (19 U.S.C. § 1677(7)(C)) further provides that--
In evaluating the volume of imports of merchandise, the Commissionshall consider whether the volume of imports of the merchandise, or anyincrease in that volume, either in absolute terms or relative to productionor consumption in the United States is significant.. . .In evaluating the effect of imports of such merchandise on prices, theCommission shall consider whether . . . (I) there has been significantprice underselling by the imported merchandise as compared with theprice of domestic like products of the United States, and (II) the effect ofimports of such merchandise otherwise depresses prices to a significantdegree or prevents price increases, which otherwise would haveoccurred, to a significant degree.. . .In examining the impact required to be considered under subparagraph(B)(i)(III), the Commission shall evaluate (within the context of thebusiness cycle and conditions of competition that are distinctive to theaffected industry) all relevant economic factors which have a bearing onthe state of the industry in the United States, including, but not limited to. . . (I) actual and potential declines in output, sales, market share, profits,productivity, return on investments, and utilization of capacity, (II)factors affecting domestic prices, (III) actual and potential negativeeffects on cash flow, inventories, employment, wages, growth, ability toraise capital, and investment, (IV) actual and potential negative effectson the existing development and production efforts of the domesticindustry, including efforts to develop a derivative or more advancedversion of the domestic like product, and (V) in {an antidumpinginvestigation}, the magnitude of the margin of dumping.
Organization of the Report
Part I of this report presents information on the subject merchandise, dumping margins, anddomestic like product. Part II of this report presents information on conditions of competition and otherrelevant economic factors. Part III presents information on the condition of the U.S. industry, includingdata on capacity, production, shipments, inventories, and employment. Parts IV and V present thevolume of subject imports and pricing of domestic and imported products, respectively. Part VI presentsinformation on the financial experience of U.S. producers. Part VII presents the statutory requirementsand information obtained for use in the Commission’s consideration of the question of threat of materialinjury as well as information regarding nonsubject countries.
I-2

U.S. MARKET SUMMARY
SRC pipe and tube generally involve fluids under pressure, either for conveyance or closed-loopthermal transfer applications. The leading U.S. producers of SRC pipe and tube are Mueller and Cerro,while leading producers of SRC pipe and tube outside the United States include Golden Dragon PreciseCopper Tube (“Golden Dragon”) and Zhejiang Hailiang Copper (“Hailiang”) of China and IUSA, S.A. deC.V. (“IUSA”) and Nacional de Cobre of Mexico (“Nacobre”). The leading U.S. importer of SRC pipeand tube from China is Golden Dragon Copper U.S.A. (“GD Copper (U.S.)”), while the leading importerof SRC pipe and tube from Mexico is Cambridge-Lee Industries (“Cambridge-Lee”). Leading importersof SRC pipe and tube from nonsubject countries include Nordyne, LLC (“Nordyne”) and MarubeniAmerica Corporation (“Marubeni”). The leading purchasers include Wolverine Tube Inc. (“Wolverine”)and Carrier Corporation (“Carrier”). Apparent U.S. consumption of SRC pipe and tube totaled approximately 698 million pounds($2.1 billion) in 2009. Currently, 14 firms are known to produce SRC pipe and tube in the United States. U.S. producers’ U.S. shipments of SRC pipe and tube totaled approximately 513 million pounds ($1.6billion) in 2009, and accounted for 73.5 percent of apparent U.S. consumption by quantity and 76.0percent by value. U.S. imports from subject sources totaled approximately 140 million pounds ($375million) in 2009 and accounted for 20.0 percent of apparent U.S. consumption by quantity and17.8 percent by value. U.S. imports from nonsubject sources totaled approximately 45 million pounds($132 million) in 2009 and accounted for 6.5 percent of apparent U.S. consumption by quantity and6.3 percent by value.
SUMMARY DATA AND DATA SOURCES
A summary of data collected in these investigations is presented in appendix C. Except as noted,U.S. industry data are based on questionnaire responses of 14 firms that accounted for 95 percent of U.S.production of SRC pipe and tube during 2009. U.S. import data are based on official import statistics ofCommerce.3 Data regarding the Chinese industry are based on eight foreign producer questionnaireresponses, and data regarding the Mexican industry are based on five foreign producer questionnaireresponses, while information with respect to other foreign industries is drawn from questionnaireresponses and public sources.
PREVIOUS AND RELATED INVESTIGATIONS
SRC pipe and tube has not been the subject of any prior countervailing or antidumping dutyinvestigations in the United States.
NATURE AND EXTENT OF SALES AT LTFV
On October 1, 2010, Commerce published a notice in the Federal Register setting forth its finaldeterminations with regard to its antidumping investigations on SRC pipe and tube from China4 and
3 Table C-2 presents U.S. import data for China and Mexico based on the questionnaire responses of 42 firms andU.S. import data for nonsubject sources based on official import statistics of Commerce. Table C-3 presents U.S.industry data, excluding Wolverine, based on questionnaire responses and official import statistics of Commerce.
4 Seamless Refined Copper Pipe and Tube from the People’s Republic of China: Final Determination of Sales atLess Than Fair Value, 75 FR 60725, October 1, 2010.
I-3

Mexico.5 Commerce determined that imports from China and Mexico are being sold, or likely to be sold,in the United States at less than fair value. The weighted-average final dumping margins (in percent advalorem), as reported by Commerce, are presented in the following tabulation:
Exporter ProducerMargin
(percent)
China
Golden Dragon Precise Copper TubeGroup, Inc.
Golden Dragon Precise Copper TubeGroup, Inc.
11.25
Zhejiang Hailiang Co., Ltd.; Hong KongHailiang Metal Trading Limited; ShanghaiHailiang Copper Co., Ltd.
Zhejiang Hailiang Co., Ltd.; ShanghaiHailiang Copper Co., Ltd.
60.85
Zhejiang Naile Copper Co., Ltd. Zhejiang Naile Copper Co., Ltd. 36.05
Zhejiang Jiahe Pipes Inc. Zhejiang Jiahe Pipes Inc. 36.05
Luvata Tube (Zhongshan) Ltd. Luvata Tube (Zhongshan) Ltd. 36.05
Luvata Tube (Zhongshan) Ltd. Luvata Alltop(Zhongshan) Ltd. 36.05
Luvata Alltop(Zhongshan) Ltd. Luvata Alltop(Zhongshan) Ltd. 36.05
Ningbo Jintian Copper Tube Co. Ltd. Ningbo Jintian Copper Tube Co. Ltd. 36.05
All others 60.85
Mexico
IUSA S.A. de C.V 24.89
Nacional de Cobre, S.A. de C.V. 31.43
All others 28.16
Source: 75 FR 60723 and 75 FR 60725.
THE SUBJECT MERCHANDISE
Commerce’s Scope
Commerce has defined the scope of these investigations as follows:
all copper pipe and tube, including redraw hollows, greater than or equal to 6 inches (152.4 mm)in length and measuring less than 12.130 inches (308.102 mm) (actual) in outside diameter(“OD”), regardless of wall thickness, bore (e.g., smooth, enhanced with inner-grooves or ridges),manufacturing process (e.g., hot finished, cold-drawn, annealed), outer surface (e.g., plain orenhanced with grooves, ridges, fins, gills), end finish (e.g., plain end, swaged end, flared end,expanded end, crimped end, threaded), coating (e.g., plastic, paint), insulation, attachments (e.g.,
5 Seamless Refined Copper Pipe and Tube from Mexico: Final Determination of Sales at Less Than Fair Value,75 FR 60723, October 1, 2010.
I-4

plain, capped, plugged, with compression or other fitting), or physical configuration (e.g.,straight, coiled, bent, wound on spools). The scope of these investigations covers, but is notlimited to, copper pipe and tube produced or comparable to the ASTM-B42, ASTM-B68, ASTM-B75, ASTM-B88, ASTM-B88M, ASTM-B188, ASTM-B251, ASTM-B251M, ASTM-B280, ASTM-B302, ASTM-B306, ASTM-B359, ASTM-B743, ASTM-B819, and ASTM-B903 specifications andmeeting the physical parameters described therein. Also included within the scope are all sets ofcovered products, including “line sets” of copper pipe and tube (with or without fittings orinsulation) suitable for connecting an outdoor air conditioner or heat pump to an indoorevaporator unit. The phrase “all sets of covered products” denotes any combination of items putup for sale that is comprised of merchandise subject to the scope. “Refined copper” is definedas: (1) metal containing at least 99.85 percent by weight of copper; or (2) metal containing atleast 97.5 percent by weight of copper, provided that the content by weight of any other elementdoes not exceed the following limits:
ELEMENT LIMITING CONTENT PERCENT BY WEIGHTAg - Silver 0.25As - Arsenic 0.5Cd - Cadmium 1.3Cr - Chromium 1.4Mg - Magnesium 0.8Pb - Lead 1.5S - Sulfur 0.7Sn - Tin 0.8Te - Tellurium 0.8Zn - Zinc 1.0Zr - Zirconium 0.3Other elements (each) 0.3
Excluded from the scope are all seamless circular hollows of refined copper less than 12 inchesin length whose OD (actual) exceeds its length. The products subject to these investigations arecurrently classifiable under subheadings 7411.10.1030 and 7411.10.1090 of the HarmonizedTariff Schedule of the United States (HTS). Products subject to these investigations may alsoenter under HTSUS subheadings 7407.10.1500, 7419.99.5050, 8415.90.8065, and8415.90.8085.6
Tariff Treatment
SRC pipe and tube is classifiable in the Harmonized Tariff Schedule of the United States (HTSUS) under subheading 7411.10.10 (statistical reporting numbers 7411.10.1030 and 7411.10.1090). SRC pipe and tube may also be imported under HTS subheading 7407.10.15 (refined copper hollowprofiles) or statistical reporting numbers 7419.99.5050 (which also contains various other products ofrefined copper and copper alloys), 8415.90.8065 (which also contains parts other than SRC pipe and tube,for heat pumps), and 8415.90.8085 (which also contains parts other than SRC pipe and tube, includingthose of other air conditioning machinery). Current tariff rates for SRC pipe and tube are presented inappendix D. Imports of SRC pipe and tube from countries (including China) that qualify for normal trade
6 Seamless Refined Copper Pipe and Tube from Mexico: Final Determination of Sales at Less Than Fair Value,75 FR 60723, October 1, 2010.
I-5

relations are eligible to enter the United States at general duty rates of 1.5 percent ad valorem under HTSsubheading 7411.10.10, 3.0 percent under HTS subheading 7407.10.15, or 1.4 percent under HTSsubheading 8415.90.80; whereas such imports under HTS subheading 7419.99.50 can enter the UnitedStates free of duty. Imports of SRC pipe and tube from Mexico that are originating goods under HTSgeneral note 12 are eligible to enter the United States under these HTS subheadings at the “free” specialduty rate, as Mexico is a party to the North American Free Trade Agreement.
THE PRODUCT
Description and Applications
SRC pipe and tube are fabricated products7 of high-purity copper,8 distinguished by a circularcross section of varying nominal sizes (typically 0.04"–12")9 and wall thicknesses.10 The inner and outertubing surfaces are either smooth or enhanced (e.g., with grooves, ridges, fins, or gills).11 Dependingupon the requirements of industry standards or customers' specifications, additional characteristics caninclude: outer surface coatings (e.g., paint, plastics, or other coating materials) for corrosion protection orinsulation; marking with paint or plastic color coding for product identification; cleaning, pressurizingwith nitrogen gas, and capping of each end to assure interior cleanliness; end finishes (e.g., plain, swaged,flared, expanded, crimped, or threaded); and attachments (e.g., plain, capped, or plugged).12 SRC pipeand tube is available in straight lengths, bent to shape, coiled flat without spools (“pancake coils”), orcoiled onto spools.13 “Line sets” consist of two different sizes of SRC pipe and tube, a smaller-diameterliquid line (commonly with end finishes) and a larger-diameter suction line (commonly insulated), usuallyto connect outdoor air conditioners and heat pumps with indoor evaporator units.14
End-use applications for SRC pipe and tube take advantage of copper’s strength, malleability,ductility (i.e., readily bent or formed), thermal conductivity, resistance to corrosion and fouling, andchemical (e.g., lead-free) purity.15 SRC pipe and tube applications generally involve fluids underpressure, either for conveyance or closed-loop thermal transfer. Conveyance applications includeresidential, commercial, institutional, industrial, and municipal water systems, as well as distributionsystems for other liquids and gasses. Thermal transfer applications include residential, commercial,
7 SRC pipe and tube producers distinguish between “tubes” with smooth ends and joined together by soldering orbrazing, versus “pipes” that are threaded. Almost all products considered in these investigations are tubes ratherthan pipes. Conference transcript, p. 63 (Hansen).
8 “Refined copper” contains either 1) at least 99.85 percent by weight of copper or 2) at least 97.5 percent byweight of copper with the content of other elements not exceeding specific percentage weight limits listed in Note1(a) to Chapter 74, Copper and Related Articles, HTS (2010 Rev. 2). Amendments to petition (October 13, 2009),exhibit D.
9 Capillary tube is available with actual outside diameters (“ODs”) less than 0.04". The nominal size of 12" isequivalent to an OD of 12.130" (the upper width limit in the petition scope), or more specifically an actual OD of12.125" with a tolerance of ± 0.005". Counsel for petitioners, e-mail correspondence with Commission staff,November 3, 2009; and amendments to petition (October 16, 2009), exhibit #51.
10 Petition, p. 12.
11 Petition, p. 10.
12 Petition, pp. 10, 12-13.
13 Petition, pp. 10 and 12.
14 Petition, p. 10; and amendments to petition (October 13, 2009), p. 4.
15 Amendments to petition (October 13, 2009), p. 5.
I-6

institutional, and industrial heating systems; commercial refrigeration systems (e.g., refrigerated displaycases for frozen food in grocery stores); and combined or split-unit air-conditioning systems.16
“Plumbing” (or “standard”) tubing is commonly produced to various standards of the AmericanSociety for Testing and Materials (“ASTM”). The ASTM designations specify the chemical composition,outside diameter, wall thickness, strength, hardness, cleanliness, roundness, marking, and otherrequirements for SRC pipe and tube, based on end-use applications.17
“Commercial” (or “industrial”) tubing is produced to either industry standard (e.g., ASTM)specifications or customer (including original equipment manufacturer (“OEM”)) nonstandardspecifications, including any surface enhancements (e.g., grooves, ridges, fins, or gills) designed toenhance thermal transfer capabilities.18 For example, customer specifications are often based on ASTMstandards to which are added further requirements such as custom dimensions, temper, or packaging.19 Petitioners provided examples of customer product specifications ***.20 Individual OEM purchasers,such as Goodman Global (“Goodman”), may require more exacting specifications for the industrial tubingthat it purchases compared to plumbing tubing, the latter being regarded more as a commodity product.21 Common applications for commercial SRC pipe and tube include refrigeration and heating units; split-system central, room and window, central, and vehicle air conditioners; and chillers and freezers.22
Applicable ASTM designations for SRC pipe and tube and specific end-use applications are listedin table I-1. Common pipe and tube designations, relevant ASTM standards, and end-use applications arepresented in table I-2.
16 Petition, p. 11.
17 Petition, pp. 11-12.
18 Petition, p. 12.
19 Petitioners’ prehearing brief, p. 14; and conference transcript, pp. 19-20 (Sigloch).
20 Petitioners’ postconference brief, p. 8 and ***.
21 Respondent’s prehearing brief (Goodman), p. 4.
22 Petition, p. 12.
I-7
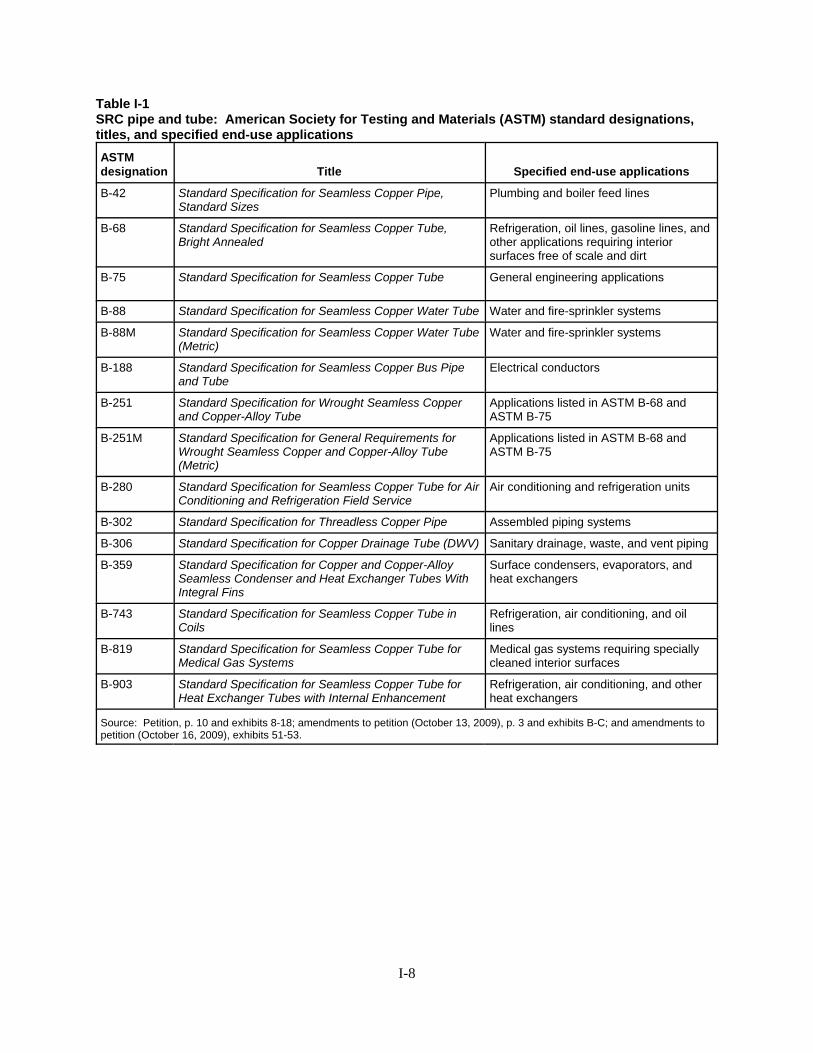
Table I-1SRC pipe and tube: American Society for Testing and Materials (ASTM) standard designations,titles, and specified end-use applications
ASTMdesignation Title Specified end-use applications
B-42 Standard Specification for Seamless Copper Pipe,Standard Sizes
Plumbing and boiler feed lines
B-68 Standard Specification for Seamless Copper Tube,Bright Annealed
Refrigeration, oil lines, gasoline lines, andother applications requiring interiorsurfaces free of scale and dirt
B-75 Standard Specification for Seamless Copper Tube General engineering applications
B-88 Standard Specification for Seamless Copper Water Tube Water and fire-sprinkler systems
B-88M Standard Specification for Seamless Copper Water Tube(Metric)
Water and fire-sprinkler systems
B-188 Standard Specification for Seamless Copper Bus Pipeand Tube
Electrical conductors
B-251 Standard Specification for Wrought Seamless Copperand Copper-Alloy Tube
Applications listed in ASTM B-68 andASTM B-75
B-251M Standard Specification for General Requirements forWrought Seamless Copper and Copper-Alloy Tube(Metric)
Applications listed in ASTM B-68 andASTM B-75
B-280 Standard Specification for Seamless Copper Tube for AirConditioning and Refrigeration Field Service
Air conditioning and refrigeration units
B-302 Standard Specification for Threadless Copper Pipe Assembled piping systems
B-306 Standard Specification for Copper Drainage Tube (DWV) Sanitary drainage, waste, and vent piping
B-359 Standard Specification for Copper and Copper-AlloySeamless Condenser and Heat Exchanger Tubes WithIntegral Fins
Surface condensers, evaporators, andheat exchangers
B-743 Standard Specification for Seamless Copper Tube inCoils
Refrigeration, air conditioning, and oillines
B-819 Standard Specification for Seamless Copper Tube forMedical Gas Systems
Medical gas systems requiring speciallycleaned interior surfaces
B-903 Standard Specification for Seamless Copper Tube forHeat Exchanger Tubes with Internal Enhancement
Refrigeration, air conditioning, and otherheat exchangers
Source: Petition, p. 10 and exhibits 8-18; amendments to petition (October 13, 2009), p. 3 and exhibits B-C; and amendments topetition (October 16, 2009), exhibits 51-53.
I-8

Table I-2SRC pipe and tube: Designations, color codes, standards, applications, sizes, tempers, andlengths
DesignationColorCode ASTM Applications
Commercially available lengths
Size Drawn Annealed
Type K(thickerwalled1)
Green B-88 Water service and distributionFire protectionSolar energyFuel and fuel oilHeating, ventilation, air conditioningSnow meltingCompressed airNatural gasLiquified petroleum gasVacuums
Straight lengths:
¼”–8" 20' 20'
10" 18' 18'
12" 12' 12'
Coils:
¼”–1"— 60'
— 100'
1¼”–1½” — 60'
2"— 40'
— 45'
Type L(intermediatewalled1)
Blue B-88 Water service and distributionFire protectionSolar energyFuel and fuel oilHeating, ventilation, air conditioningSnow meltingCompressed airNatural gasLiquified petroleum gasVacuums
Straight lengths:
¼"–10" 20' 20'
12" 18' 18'
Coils:
¼"–1"— 60'
— 100'
1¼"–1½" — 60'
2"— 40'
— 45'
Type M(thinnerwalled1)
Red B-88 Water service and distributionFire protectionSolar energyFuel and fuel oilHeating, ventilation, air conditioningSnow meltingVacuums
Straight lengths:
¼"–12" 20' —
DWV Yellow B-306 Drain, waste, ventHeating, ventilation, air conditioningSolar energy
Straight lengths:
¼"–8" 20' —
ACR/RST Blue B-280 Air conditioningRefrigerationNatural gasLiquified petroleum gasCompressed air
Straight lengths:
d”–4c” 20' (2)
Coils:
c“–1e“ — 50'
OXY/MED (K) Green(L) Blue
B-819 Medical gassesCompressed airVacuums
Straight lengths:
¼"–8" 20' —
1 Wall thicknesses differ for Types K, L, and M plumbing pipes having a common nominal diameter, being greater forType K than for Type L, and lesser for Type M than for Type L.
2 Available by special order.
Source: Petition, p. 12; and Copper Development Association (CDA), “Table 1, Copper Tube: Types, Standards, Applications,Tempers, Lengths,” The Copper Tube Handbook, 2006, p. 20.
I-9

Manufacturing Processes23
The steps for producing SRC pipe and tube can be grouped into three stages: (1) prefabricating,which includes melting, casting, and either extrusion or rolling of rough tubing; (2) intermediatefabrication, consisting of cold drawing of unfinished tubing; and (3) finishing of the SRC pipe and tube.24 The starting material is metallic copper in the form of sections cut from refined cathodes (“primarycopper”), scrap (“secondary copper”), or ingots. The exact input mix depends on the cost and availabilityof the various forms of copper, technical capabilities of the melting furnace, and customer specifications. Primary copper is purchased from copper producers that electrolytically refine blister copper fromsmelting furnaces into plate-shaped copper cathodes of at least 99.95 percent purity. Secondary copper isa mix of recycled (“old”) scrap bales consisting of copper wire and tubing recovered from demolished orrenovated structures and “home or runaround” (“new”) scrap returned from downstream production stepswithin the SRC pipe and tube mill. Brick-shaped copper ingots, cast from melted-down cathode sectionsand scrap, are more commonly consumed by pipe and tube mills with smaller-scale melting furnaces withdoors that cannot accommodate cathode sections and baled scrap. According to an OEM purchaser, SRCpipe and tube facilities can use a significant share of scrap in their input mix to manufacture plumbingtubing, as the specifications for plumbing tubing are not as exacting as those for industrial tubing.25 TwoOEM purchasers, Goodman and Johnson Controls, reported that they require that the industrial tubingthey purchase be of high-purity copper or even be manufactured solely from cathode copper.26
Prefabricating
The production process begins with melting and refining of copper in a furnace to produce moltencopper. A shaft furnace is adequate to melt high-purity cathodes, new scrap, and ingots into moltencopper that does not need further refining. Alternatively, inclusion of less-pure old scrap in the initialfurnace charge requires a reverberatory or other hearth-type furnace that allows for further refining of themolten copper. The copper charge is melted at temperatures between 2,300"–2,400" F (above the meltingpoint of copper at 1,981" F) and fire-refined by exposure to oxygen. Most impurities are converted intooxides that are trapped in the surface slag, whereas less-readily oxidized impurities (especially tin andnickel) must be removed by reaction with a special slag compound. The molten copper is stirred withgreenwood poles (“poling”), which burn and vaporize to create a stirring action that drives theconversions to completion. The molten copper is sampled periodically to monitor the progress ofrefining. After the surface slag is skimmed off, the fire-refined melt exceeds 99.9 percent pure copper,similar to fire-refined primary copper smelted from ore. Phosphorous is added to deoxidize the moltencopper to produce “phosphorous-deoxidized, high residual phosphorus copper” (DHP, standarddesignation UNS C12200).27
23 This section is compiled from the petition, pp. 13-19; conference, petitioners’ exhibits 5-7; field notes, October14, 2009; Rainer Hergemoeller, “Modern Production Methods for High Volume Copper Tube Manufacturing,”TubeNet; e-mail correspondence of Commission staff with counsel for petitioners, November 2 and 3, 2009; andfield notes, July 30, 2010.
24 Conference, petitioners’ exhibits 5-7.
25 Respondent’s prehearing brief (Goodman), p. 4.
26 Respondent’s prehearing brief (Goodman), p. 4; and hearing transcript, pp. 234-235 (Smith).
27 The Unified Numbering System (UNS) for Metals and Alloys is the standard designation and identificationsystem in North America. The “C” indicates “copper” and the following five digits identify the specific pure oralloyed copper. UNS C12200 is the standard designation for DHP that contains a minimum of 99.9 percent copper(including silver) and 0.015–0.040 phosphorous. Copper Development Association (CDA), “CDA UNS Standard
continue...
I-10

In the casting step, the molten copper is transferred from the melting/refining furnace to either aholding furnace or tundish (reservoir dam) that is heated to maintain the molten copper at constanttemperature for casting. The surface of the molten copper is protected from oxidation by a layer ofpulverized graphite. The SRC pipe and tube industry relies on three different technologies for castingmolten copper into unfabricated forms. “Continuous casting” and “semi-continuous casting” are bothwell-established technologies for producing large-diameter solid “logs” or thick-walled hollow “tuberounds.” In the continuous casting process, molten metal flows into vertical graphite-lined cylindricalsteel molds, that are water-cooled to quickly solidify the copper, which is gripped and withdrawn fromthe bottom as more molten copper is poured into the top of the mold. Some mills utilize casting moldswith a central water-cooled core to produce a tube round. A moving saw cuts the withdrawn log or tuberound into billets, approximately two- to four-feet long, to fit the downstream extrusion or rollingequipment. In the semi-continuous casting process, a water-cooled floor of the mold cavity seals thevertical mold until the molten copper solidifies. More molten copper is poured into the top of the mold atthe same rate as the floor is lowered. When the log or tube round reaches the depth of the pit beneath themold, the mold is (and central core are) raised to allow the log or tube round to be removed from the pitfor sawing into shorter solid or hollow billets, respectively.
The billet is preheated (to approximately 1,535" F) before being placed in an horizontal extrusionpress. The press includes a ram fitted with a dummy block (that is smaller in diameter than the billet),and a rod slightly smaller in diameter than that of the die opening, if the billet was either cast hollow oralready pierced (or alternatively a piercing mandrel, if the billet is still solid).28 The ram forces the heatedcopper over the rod (or mandrel) and through the die to form a long rough tube. Material thataccumulates over the dummy block is removed for remelting. The extruded rough tube is carried along arun-out table to maintain its straightness until it is cool enough to be cleaned and descaled. The ends areremoved, and the length is subsequently coiled in preparation for drawing.
A more recent innovation is the “continuous horizontal cast and roll” (cast and roll) process29 thatcombines horizontal casting and milling, followed by planetary rolling,30 and is capable of producingunfinished tube directly from molten copper.31 ***.32 The hollow shell is cut by a saw into 30- to 60-feetlong “shells.”33 ***.34 Both a petitioners’ witness and a respondents’ witness testified at the hearing thatthe cast and roll process offers the advantage over the extrusion process of reduced production costs, asthis prefabrication technology is continuous and involves far fewer production steps, particularly byeliminating the billet reheating and extrusion steps.35 Another advantage of the cast and roll process,
27 ...continueDesignations for Wrought and Cast Copper and Copper Alloys: Introduction,” 2009.
28 If the reheated billet is solid, it is pierced lengthwise with a mandrel (pointed rod) to form a hole through itscenter, that will eventually become the inner wall of the resulting tubing. Solid billets can be pierced either prior toor concurrent with extrusion. However, according to counsel for petitioners, billet piercing is no longer prevalentamong major global producers. Counsel for petitioners, e-mail correspondence with Commission staff, November 2,2009.
29 ***, on behalf of ***, written submission to the Commission, October 26, 2009, p. 3.
30 Conference, petitioners’ exhibit 5.
31 ***, on behalf of ***, written submission to the Commission, October 26, 2009, p. 3.
32 Field notes, July 30, 2010, p. 3.
33 Conference, petitioners’ exhibit 5.
34 Field notes, July 30, 2010, p. 3.
35 Hearing transcript, pp. 100-101 (Arndt); and p. 197 (Weil).
I-11

according to the respondents’ witness, is the improved control of wall thickness along the length of themother tube, compared to the greater variability resulting from the extrusion process.36
At the staff conference in the preliminary phase of these investigations, petitioners’ witnessesclaimed there are no differences in the resulting product from either the extrusion or the cast and rollprocesses,37 although producing larger diameters still requires the extrusion method.38 Subsequently,domestic OEM purchaser *** (through counsel), characterized foreign-origin cast and rolled inner-grooveSRC pipe and tube as “...produced directly from copper’s molten state, thereby resulting in a seamlessproduct unlikely to fail in its chosen applications.”39 At the hearing in the final phase of theseinvestigations, a petitioners’ witness testified that all plumbing and industrial (including inner-groove)tubing with ODs up to 1 5/8" (the size that comprises the bulk of the market)40 sold by Cerro originatesfrom both extrusion or cast and roll technologies interchangeably. The witness further claimed that ineither case, Cerro is not constrained by customers specifications to a prefabrication process, for its SRCpipe and tube consistently meets customer specifications, as the finished product manufactured to a givenspecification will always be the same, no matter which prefabrication technology produces the mothertube.41 ***.42 ***.43 By contrast, a respondents’ witness from GD Copper U.S. testified that the moreconsistent wall thickness of the mother tubes prefabricated by the cast and roll process enables lighter andmore consistent wall thickness to be drawn in the finishing stage, and a higher quality finished product.44
45 Another respondents’ witness testified that a major reason that OEM purchaser Goodman switched isthat the cast and roll process results in the far fewer defects in the finished product than in thoseoriginating from the extrusion process.46 A respondents’ witness from Johnson Controls specifically citedinclusions within domestically available extruded products as the cause of bursting of sidewalls that wereunable to withstand the higher internal pressures required as a result of switching refrigerants and stricterenergy efficiency standards for air conditioning applications.47 48
36 Hearing transcript, p. 197 (Weil).
37 Conference transcript, p. 52 (Arndt, Hansen, and Sigloch).
38 Conference transcript, p. 52 (Sigloch).
39 *** purchases cast and rolled inner-groove SRC pipe and tube from ***. Specific product qualitycharacteristics reported by the purchaser were the tubing's even and compact structure, precise dimensions, fewresiduals present on inner surfaces, unique groove shape, increased inner surface area, and greater heat transfercapability. ***, on behalf of ***, written submission to the Commission, October 26, 2009, p. 2.
40 Hearing transcript, p. 68 (Arndt).
41 Cerro supplies OEM customers from either its cast-and-roll plant or one of its extrusion plants, based on marketdemand, mill production schedules, and destinations for specific product shipments. Hearing transcript, pp. 39 and76 (Arndt).
42 Petitioners’ posthearing brief, p. 9; and exhibit 6, ***.
43 Petitioners’ posthearing brief, responses to Commission questions, p. A-2.
44 Hearing transcript, p. 197 (Weil).
45 The cast and roll process also enabled Chinese producer Golden Dragon to manufacture small-diameter SRCpipe and tube requiring less copper per foot of length. Respondents’ prehearing brief (Golden Dragon), pp. 11-12.
46 Hearing transcript, p. 201 (Topper).
47 Hearing transcript, p. 163 (Smith).
48 For more details about the changes to the U.S. Environmental Protection Agency’s refrigerant andcorresponding internal burst pressure requirements for pipes and tubes, and to the U.S. Department of Energy’sSeasonal Energy Efficiency Ratings (SEER), see respondents’ pre-hearing brief (Johnson Controls and Marubeni),pp. 8-9.
I-12
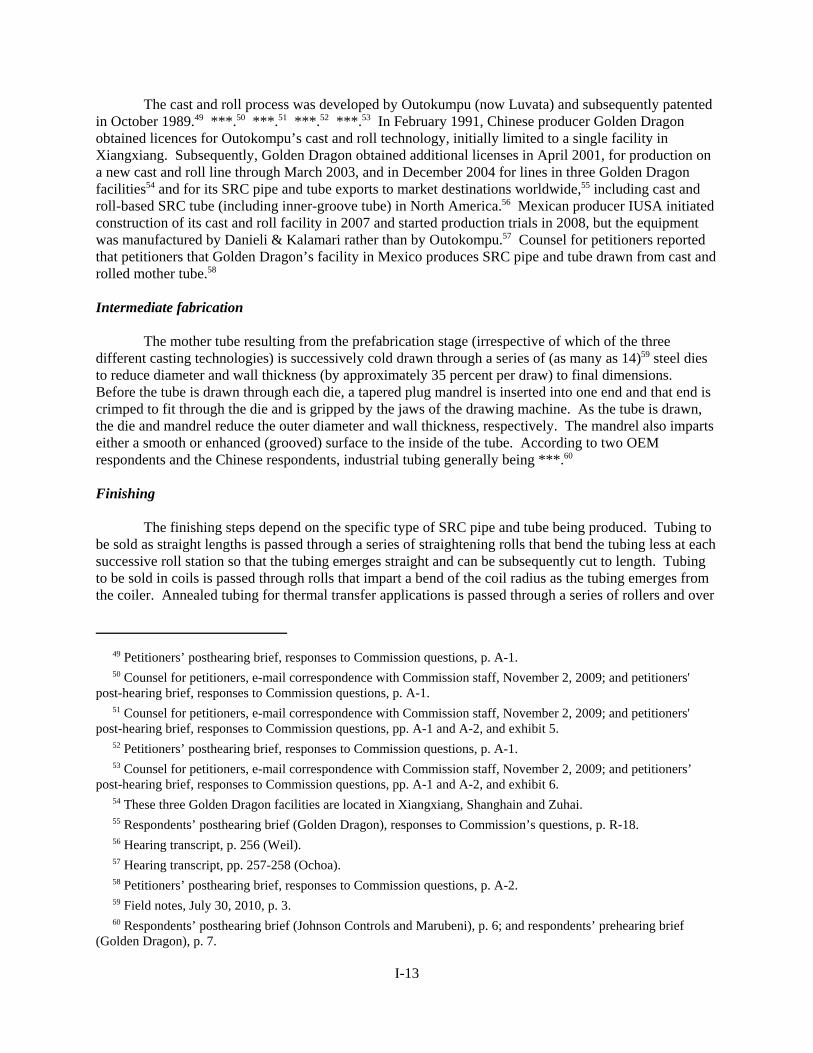
The cast and roll process was developed by Outokumpu (now Luvata) and subsequently patentedin October 1989.49 ***.50 ***.51 ***.52 ***.53 In February 1991, Chinese producer Golden Dragonobtained licences for Outokompu’s cast and roll technology, initially limited to a single facility inXiangxiang. Subsequently, Golden Dragon obtained additional licenses in April 2001, for production ona new cast and roll line through March 2003, and in December 2004 for lines in three Golden Dragonfacilities54 and for its SRC pipe and tube exports to market destinations worldwide,55 including cast androll-based SRC tube (including inner-groove tube) in North America.56 Mexican producer IUSA initiatedconstruction of its cast and roll facility in 2007 and started production trials in 2008, but the equipmentwas manufactured by Danieli & Kalamari rather than by Outokompu.57 Counsel for petitioners reportedthat petitioners that Golden Dragon’s facility in Mexico produces SRC pipe and tube drawn from cast androlled mother tube.58
Intermediate fabrication
The mother tube resulting from the prefabrication stage (irrespective of which of the threedifferent casting technologies) is successively cold drawn through a series of (as many as 14)59 steel diesto reduce diameter and wall thickness (by approximately 35 percent per draw) to final dimensions. Before the tube is drawn through each die, a tapered plug mandrel is inserted into one end and that end iscrimped to fit through the die and is gripped by the jaws of the drawing machine. As the tube is drawn,the die and mandrel reduce the outer diameter and wall thickness, respectively. The mandrel also impartseither a smooth or enhanced (grooved) surface to the inside of the tube. According to two OEMrespondents and the Chinese respondents, industrial tubing generally being ***.60
Finishing
The finishing steps depend on the specific type of SRC pipe and tube being produced. Tubing tobe sold as straight lengths is passed through a series of straightening rolls that bend the tubing less at eachsuccessive roll station so that the tubing emerges straight and can be subsequently cut to length. Tubingto be sold in coils is passed through rolls that impart a bend of the coil radius as the tubing emerges fromthe coiler. Annealed tubing for thermal transfer applications is passed through a series of rollers and over
49 Petitioners’ posthearing brief, responses to Commission questions, p. A-1.
50 Counsel for petitioners, e-mail correspondence with Commission staff, November 2, 2009; and petitioners'post-hearing brief, responses to Commission questions, p. A-1.
51 Counsel for petitioners, e-mail correspondence with Commission staff, November 2, 2009; and petitioners'post-hearing brief, responses to Commission questions, pp. A-1 and A-2, and exhibit 5.
52 Petitioners’ posthearing brief, responses to Commission questions, p. A-1.
53 Counsel for petitioners, e-mail correspondence with Commission staff, November 2, 2009; and petitioners’post-hearing brief, responses to Commission questions, pp. A-1 and A-2, and exhibit 6.
54 These three Golden Dragon facilities are located in Xiangxiang, Shanghain and Zuhai.
55 Respondents’ posthearing brief (Golden Dragon), responses to Commission’s questions, p. R-18.
56 Hearing transcript, p. 256 (Weil).
57 Hearing transcript, pp. 257-258 (Ochoa).
58 Petitioners’ posthearing brief, responses to Commission questions, p. A-2.
59 Field notes, July 30, 2010, p. 3.
60 Respondents’ posthearing brief (Johnson Controls and Marubeni), p. 6; and respondents’ prehearing brief(Golden Dragon), p. 7.
I-13
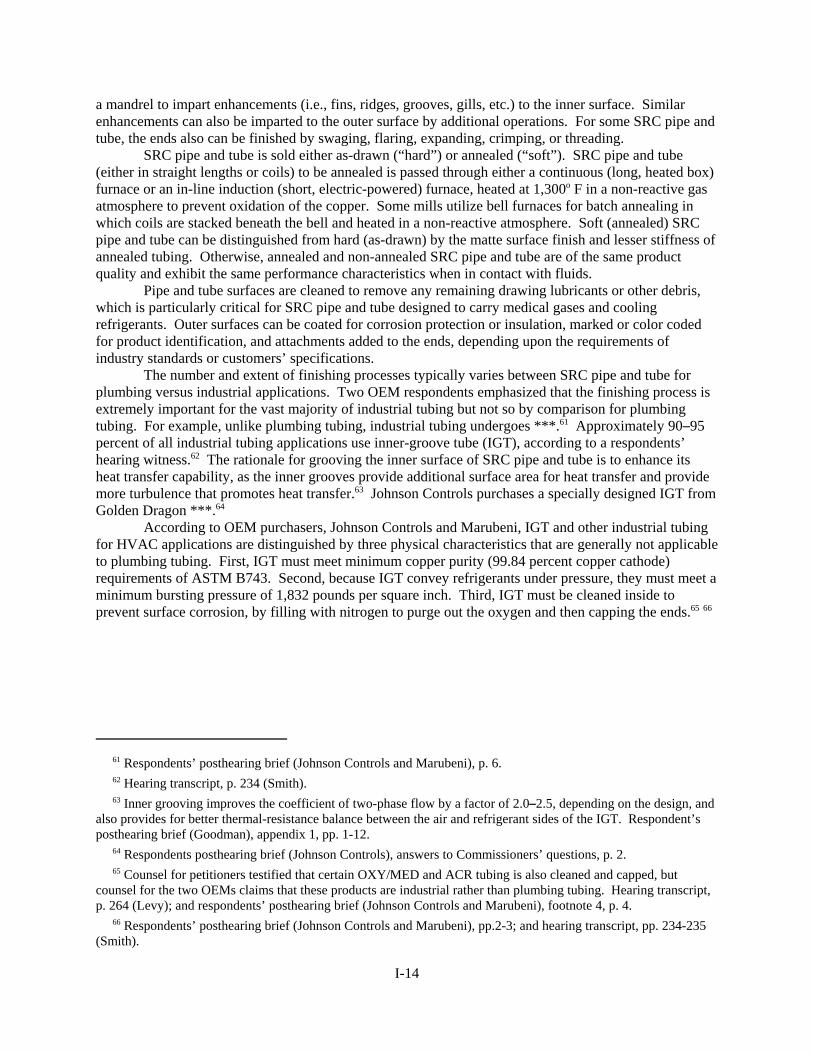
a mandrel to impart enhancements (i.e., fins, ridges, grooves, gills, etc.) to the inner surface. Similarenhancements can also be imparted to the outer surface by additional operations. For some SRC pipe andtube, the ends also can be finished by swaging, flaring, expanding, crimping, or threading.
SRC pipe and tube is sold either as-drawn (“hard”) or annealed (“soft”). SRC pipe and tube(either in straight lengths or coils) to be annealed is passed through either a continuous (long, heated box)furnace or an in-line induction (short, electric-powered) furnace, heated at 1,300o F in a non-reactive gasatmosphere to prevent oxidation of the copper. Some mills utilize bell furnaces for batch annealing inwhich coils are stacked beneath the bell and heated in a non-reactive atmosphere. Soft (annealed) SRCpipe and tube can be distinguished from hard (as-drawn) by the matte surface finish and lesser stiffness ofannealed tubing. Otherwise, annealed and non-annealed SRC pipe and tube are of the same productquality and exhibit the same performance characteristics when in contact with fluids.
Pipe and tube surfaces are cleaned to remove any remaining drawing lubricants or other debris,which is particularly critical for SRC pipe and tube designed to carry medical gases and coolingrefrigerants. Outer surfaces can be coated for corrosion protection or insulation, marked or color codedfor product identification, and attachments added to the ends, depending upon the requirements ofindustry standards or customers’ specifications.
The number and extent of finishing processes typically varies between SRC pipe and tube forplumbing versus industrial applications. Two OEM respondents emphasized that the finishing process isextremely important for the vast majority of industrial tubing but not so by comparison for plumbingtubing. For example, unlike plumbing tubing, industrial tubing undergoes ***.61 Approximately 90S95percent of all industrial tubing applications use inner-groove tube (IGT), according to a respondents’hearing witness.62 The rationale for grooving the inner surface of SRC pipe and tube is to enhance itsheat transfer capability, as the inner grooves provide additional surface area for heat transfer and providemore turbulence that promotes heat transfer.63 Johnson Controls purchases a specially designed IGT fromGolden Dragon ***.64
According to OEM purchasers, Johnson Controls and Marubeni, IGT and other industrial tubingfor HVAC applications are distinguished by three physical characteristics that are generally not applicableto plumbing tubing. First, IGT must meet minimum copper purity (99.84 percent copper cathode)requirements of ASTM B743. Second, because IGT convey refrigerants under pressure, they must meet aminimum bursting pressure of 1,832 pounds per square inch. Third, IGT must be cleaned inside toprevent surface corrosion, by filling with nitrogen to purge out the oxygen and then capping the ends.65 66
61 Respondents’ posthearing brief (Johnson Controls and Marubeni), p. 6.
62 Hearing transcript, p. 234 (Smith).
63 Inner grooving improves the coefficient of two-phase flow by a factor of 2.0S2.5, depending on the design, andalso provides for better thermal-resistance balance between the air and refrigerant sides of the IGT. Respondent’sposthearing brief (Goodman), appendix 1, pp. 1-12.
64 Respondents posthearing brief (Johnson Controls), answers to Commissioners’ questions, p. 2.
65 Counsel for petitioners testified that certain OXY/MED and ACR tubing is also cleaned and capped, butcounsel for the two OEMs claims that these products are industrial rather than plumbing tubing. Hearing transcript,p. 264 (Levy); and respondents’ posthearing brief (Johnson Controls and Marubeni), footnote 4, p. 4.
66 Respondents’ posthearing brief (Johnson Controls and Marubeni), pp.2-3; and hearing transcript, pp. 234-235(Smith).
I-14

DOMESTIC LIKE PRODUCT ISSUES
In the preliminary phase of these investigations, the Commission defined a single domestic likeproduct, coterminous with the scope of these investigations, consisting of all SRC pipe and tube.67 Respondents claimed two distinctly different types of and market segments for SRC pipe and tube –plumbing versus industrial68 69 – but did not contest petitioners’ proposal of a single domestic like productin the preliminary phase of these investigations.70
In the final phase of these investigations, the petitioners claimed that “there has been no change inthe record of these final investigations that would warrant any different conclusions” other than a singledomestic like product.71 Two OEM purchasers, Johnson Controls and Marubeni, argued that “a cleardividing line exists between industrial tubing and plumbing tubing,” and that the Commission should findtwo separate domestic like products,72 and maintained that the statutory standard has been met forseparating out plumbing versus industrial SRC pipe and tube.73 Another OEM purchaser, Goodman, tookno position on the like-product issue,74 but stated that there are two different market segments.75 Both theChinese and Mexican respondents also initially argued that the Commission should find two distinctproduct segments,76 but subsequently took no position on the like-product issue.77 The Chineserespondents noted further that they are “not arguing for two distinct like products but submit{s} that therecord strongly supports market segmentation between industrial and plumbing tube.”78 Mexicanrespondents continued to claim definite market segmentation between plumbing versus industrial tubing.79 Luvata, an importer of SRC pipe and tube, noted that all respondent’s hearing witnesses agreed thatplumbing and industrial tubing are separate market segments.80
In light of the Commission’s stated intention to solicit additional information about thedistinctions between plumbing and industrial tube,81 the Commission requested that U.S. producers report
67 Seamless Refined Copper Pipe and Tube from China and Mexico, Investigation Nos. 731-TA-1174-1175(Preliminary), USITC Publication 4116, November 2009, p. 9.
68 Conference transcript, p. 126 (O’Brien); and respondents’ postconference briefs, (Golden Dragon) pp. 5-8l; and(Hailiang) pp. 3 and 8.
69 Respondents’ postconference brief (IUSA and Nacobre), pp. 5-7.
70 Seamless Refined Copper Pipe and Tube from China and Mexico, Investigation Nos. 731-TA-1174-1175(Preliminary), USITC Publication 4116, November 2009, p. 9.
71 Petitioners’ posthearing brief, responses to Commission questions, p. A-34.
72 Respondents’ prehearing brief (Johnson Controls and Marubeni), pp. 1 and 7.
73 Respondents’ posthearing brief (Johnson Controls and Marubeni), pp. 2 and 8.
74 Hearing transcript, p. 239 (Paretzky), and respondents’ prehearing brief (Goodman), pp. 2 and 5.
75 Respondent’s posthearing brief (Goodman), appendix 1, p. 1-23.
76 Respondents’ prehearing brief (Golden Dragon), p. 2; and respondents’ prehearing brief (IUSA, Nacobre,Cambridge-Lee, and Copper and Brass International), p. 9.
77 Hearing transcript, p. 239 (O’Brien); and hearing transcript, p. 239 (Ryan).
78 Respondents’ post-hearing brief (Golden Dragon), responses to Commission’s questions, p. R-13.
79 Hearing transcript, p. 240 (Ryan); and respondents’ post-hearing brief (IUSA, Nacobre, Cambridge-Lee, andCopper and Brass International) did not further address the domestic like product issue.
80 Respondent’s post-hearing brief (Luvata), p. 7.
81 Seamless Refined Copper Pipe and Tube from China and Mexico, Investigation Nos. 731-TA-1174-1175(Preliminary), USITC Publication 4116, November 2009, p. 9.
I-15
their production of plumbing and industrial SRC pipe and tube separately82 and that U.S. importers reporttheir imports of plumbing and industrial SRC pipe and tube from China and Mexico separately as well. These data are presented in Appendix E. Additionally, the Commission requested comments from U.S.producers and U.S. importers regarding the comparability of plumbing and industrial SRC pipe and tube,which are presented in Appendix F.
DOMESTIC INDUSTRY ISSUES
In the preliminary phase of these investigations, no party argued for the exclusion of anyproducer as a related party and the Commission defined the domestic industry to include all domesticproducers of SRC pipe and tube. However, the Commission did note that it intended to revisit thequestion of whether appropriate circumstances exist to exclude any related party, particularly Wolverine*** and Cambridge-Lee ***.83 Data regarding *** are presented in Part III. No party has argued for theexclusion of any producer as a related party in the final phase of these investigations.84
82 Based on the questionnaire responses from U.S. producers, the following firms produce only plumbing tube:***; the following firms produce only industrial tube: ***; and the following firms produce both: ***.
83 Seamless Refined Copper Pipe and Tube from China and Mexico, Investigation Nos. 731-TA-1174-1175(Preliminary), USITC Publication 4116, November 2009, p. 12.
84 Petitioners argue that the Commission should not exclude either Cambridge-Lee or Wolverine because: 1) noparty has objected to the inclusion of either U.S. producer in the domestic industry; 2) Cambridge-Lee’s ***; 3) ***;4) excluding Wolverine from the domestic industry would actually skew the Commission’s analysis of the conditionof the domestic industry ***; and 5) Wolverine’s ***. Petitioners’ posthearing brief, p. 20 in Responses toCommission Questions.
I-16
PART II: CONDITIONS OF COMPETITION IN THE U.S. MARKET
U.S. MARKET CHARACTERISTICS
As described in more detail in Part I, SRC pipe and tube is generally used for fluids underpressure, either for conveyance or in a closed loop for thermal transfer.1 Conveyance applications includewater applications, as well as distribution systems for other liquids and gases while thermal transferapplications include heating systems, commercial refrigeration systems (such as grocery store refrigeratedcases), and combined or split-unit air conditioning systems of all sizes.2
U.S. produced SRC pipe and tube made up 73.5 percent of the market in terms of volume in2009; down from 76 percent in 2007. In 2009, imports from China made up about 13.1 percent of themarket, imports from Mexico made up about 6.9 percent of the market compared to 7.6 percent for eachin 2007.
The three petitioners (Cerro, Kobe Weiland, and Mueller) produced about *** of U.S. productionand two importers (Cambridge-Lee and GD Copper) imported about *** of U.S. imports from subjectsources in 2009. GD Copper imported just over *** of U.S. imports from China, while Cambridge-Leeimported almost *** of U.S. imports from Mexico.
SRC pipe and tube is typically sold either as plumbing tube or industrial tube. Most U.S.producers and importers reported making sales of plumbing tube on a spot basis. The largest U.S.producers and importers of product from China reported making most of their sales of industrial tubeusing short- or long-term contracts, while the largest importer of product from Mexico reported makingall its sales of industrial tube on a spot basis.
All 10 responding U.S. producers and 11 of 33 responding importers reported selling SRC pipeand tube nationally. Twelve of the remaining responding importers reported selling to the Southeast, 11reported selling to the Southwest, 7 reported selling to the Pacific Coast, 6 reported selling to theNortheast, 8 reported selling to the Midwest, and 1 reported selling to the Mountain Region.
Forty-four firms responded to the purchaser’s questionnaire and indicated that they havepurchased SRC pipe and tube since 2007. Twenty firms reported being distributors, 23 reported beingend users, and one firm reported being a retailer.3
CHANNELS OF DISTRIBUTION
Plumbing tube is sold to wholesalers, retailers, and distributors who in turn sell it to different endusers, while industrial tube is generally sold to OEMs such as Carrier, Trane, and York.4
A majority of U.S.-produced and SRC pipe and tube imported from Mexico were sold todistributors (except in interim 2010, when the majority of imports from Mexico were sold to end users),while a majority of imports from all sources except for Mexico were usually sold to end users. As shownin table II-1, in each full-year period, 57.5 to 60.6 percent of shipments of U.S.-produced SRC pipe andtube were to distributors, with the rest of the shipments to end users. The share of reported U.S.
1 Petition, p. 11.
2 Ibid.
3 The distributors include one firm that indicated it was a “buy-sell agent” and one that indicated that it was aplumbing/HVAC wholesaler. The end users included a redraw copper tube mill, a HVAC OEM, a supplier ofHVAC equipment to OEMs, a contractor installing complete line sets, a manufacturer of air-conditioning andrefrigeration coils, a “manufacturer of purchased tube.”
4 Petitioners’ postconference brief, p. 20; and Conference transcript, p. 25 (J. Hansen), p. 97 (Weil).
II-1
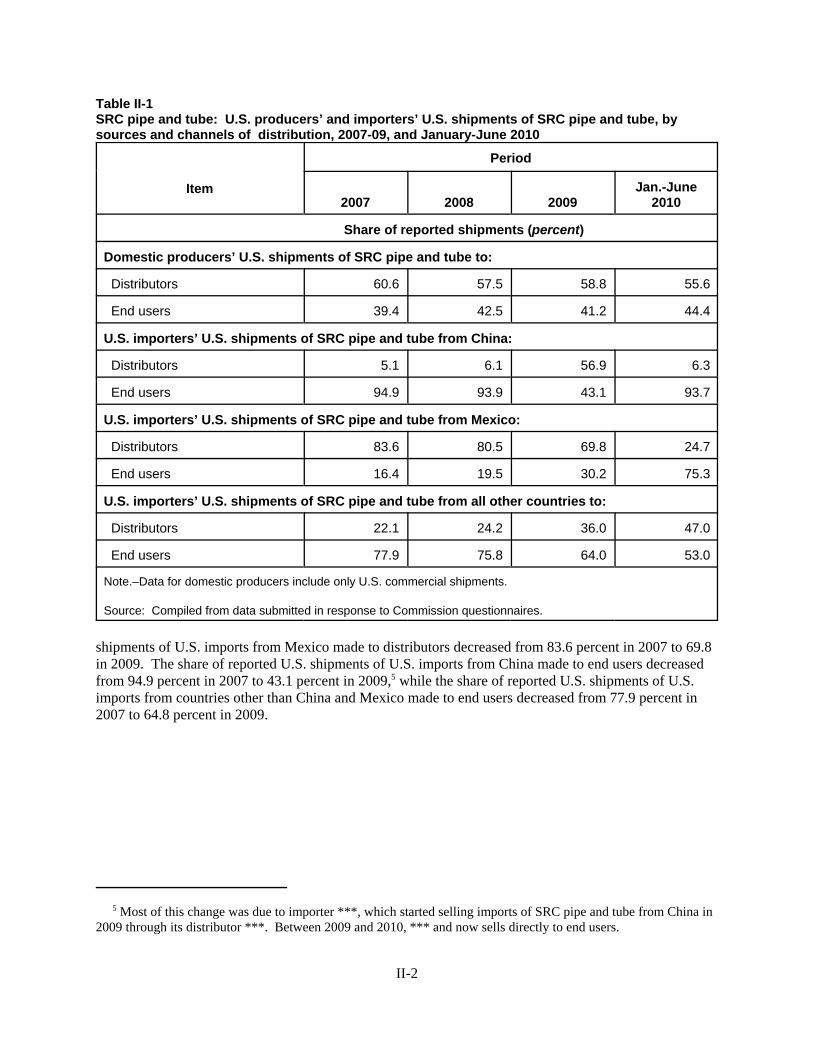
Table II-1SRC pipe and tube: U.S. producers’ and importers’ U.S. shipments of SRC pipe and tube, bysources and channels of distribution, 2007-09, and January-June 2010
Item
Period
2007 2008 2009Jan.-June
2010
Share of reported shipments (percent)
Domestic producers’ U.S. shipments of SRC pipe and tube to:
Distributors 60.6 57.5 58.8 55.6
End users 39.4 42.5 41.2 44.4
U.S. importers’ U.S. shipments of SRC pipe and tube from China:
Distributors 5.1 6.1 56.9 6.3
End users 94.9 93.9 43.1 93.7
U.S. importers’ U.S. shipments of SRC pipe and tube from Mexico:
Distributors 83.6 80.5 69.8 24.7
End users 16.4 19.5 30.2 75.3
U.S. importers’ U.S. shipments of SRC pipe and tube from all other countries to:
Distributors 22.1 24.2 36.0 47.0
End users 77.9 75.8 64.0 53.0
Note.–Data for domestic producers include only U.S. commercial shipments.
Source: Compiled from data submitted in response to Commission questionnaires.
shipments of U.S. imports from Mexico made to distributors decreased from 83.6 percent in 2007 to 69.8in 2009. The share of reported U.S. shipments of U.S. imports from China made to end users decreasedfrom 94.9 percent in 2007 to 43.1 percent in 2009,5 while the share of reported U.S. shipments of U.S.imports from countries other than China and Mexico made to end users decreased from 77.9 percent in2007 to 64.8 percent in 2009.
5 Most of this change was due to importer ***, which started selling imports of SRC pipe and tube from China in2009 through its distributor ***. Between 2009 and 2010, *** and now sells directly to end users.
II-2

SUPPLY AND DEMAND CONSIDERATIONS
Supply
U.S. Supply
Based on available information, U.S. SRC pipe and tube producers have the ability to respond tochanges in demand with large changes in the quantity of shipments of U.S.-produced SRC pipe and tubeto the U.S. market. The main contributing factors to the high degree of responsiveness of supply are theavailability of unused capacity and the ability to produce alternate products; supply responsiveness is constrained somewhat by a limited ability to ship to alternate markets and the somewhat limited ability touse inventories to increase shipments.
Industry capacity
U.S. producers’ capacity utilization decreased from 63.8 percent in 2007 to 47.3 percent in 2009.This level of capacity utilization indicates that U.S. producers have unused capacity with which theycould increase production of SRC pipe and tube in the event of a price change.
Alternative markets
Exports by U.S. producers, as a share of total shipments, increased from 4.2 percent in 2007 to5.7 percent in 2009. This level of shipments to alternative markets indicates that U.S. producers have asomewhat limited ability to divert shipments to or from alternative markets in response to changes in theprice of SRC pipe and tube.
Inventory levels
The ratio of end-of-period inventories to total shipments for U.S. producers increased from 6.7percent in 2007 to 7.0 percent in 2009. This level of inventories indicate that U.S. producers aresomewhat limited in their ability to use inventories as a means of increasing shipments of SRC pipe andtube to the U.S. market.
Production alternatives
Five of 11 responding U.S. producers indicated that they produce products other than SRC pipeand tube on the equipment and machinery that is used to produce SRC pipe and tube. Specifically, theseproducers indicated that they produce brass, aluminum, and copper nickel tube; copper wire, round andflat wire; and billets.
Supply constraints
Four of 11 responding U.S. producers indicated that they had refused, declined, or had beenunable to supply SRC pipe and tube at some time since January 2007. *** indicated that in the spring of2008 it had declined new customers because of “unusual demand” and also as a result of the spike incommodity prices. *** indicated that during periods of high seasonal demand, delivery times wereextended sporadically for a few customers, and also that it delayed production and shipments for somecustomers in 2010 ***. Two producers, ***, reported extended lead times following publication ofCommerce’s preliminary antidumping determination due a sudden increase in orders to which they were
II-3

not immediately able to respond. *** reported placing customers on allocation and declining salesopportunities due to ***.
Subject Imports from China
Based on available information, Chinese producers have the ability to respond to changes indemand with large changes in the quantity of shipments of SRC pipe and tube to the U.S. market.6 Themain contributing factors to the high degree of responsiveness of supply are the availability of unusedcapacity, the existence of alternate markets, and some ability to produce alternate products; supplyresponsiveness is constrained by the somewhat limited ability to use inventories.
Industry capacity
Chinese producers’ capacity utilization decreased from 88.1 percent in 2007 to 87.8 percent in2009. This level of capacity utilization indicates that Chinese producers have unused capacity with whichthey could increase production of SRC pipe and tube in the event of a price change.
Alternative markets
Shipments of SRC pipe and tube from China to markets other than the United States (both exportsto alternative markets and shipments to the home market) decreased slightly from approximately 91.4percent of total shipments in 2007 to 91.1 percent in 2009. This level of shipments to alternative marketsindicate that subject producers in China have the ability to divert shipments to or from their home marketand alternative markets in response to changes in the price of SRC pipe and tube.
Inventory levels
The ratio of end-of-period inventories to total shipments for the Chinese producers decreasedfrom 2.3 percent in 2007 to 1.9 percent in 2009. This level of inventories indicate that Chinese producershave a somewhat limited ability to use inventories as a means of increasing shipments of SRC pipe andtube to the U.S. market.
Production alternatives
Only one (***) of eight responding Chinese producers indicated that it produces products otherthan SRC pipe and tube on the equipment and machinery that is used to produce SRC pipe and tube. ***.
Supply constraints
Importer *** indicated that it has refused, declined, or been unable to supply SRC pipe and tubebecause it can not compete with pricing by domestic mills. Importer *** reported that strong andgrowing demand in China has fully utilized its capacity for much of 2010. As a result of this growingdemand in China and in third-country markets, foreign producer *** projects that exports to the UnitedStates will fall from *** million pounds in 2009 to *** million pounds in 2010 and further to *** millionpounds in 2011.
6 Eight Chinese producers responded to the foreign producers’ questionnaire. These responses are believed toaccount for approximately *** of Chinese export shipments to the United States.
II-4

Subject Imports from Mexico
Based on available information, Mexican producers have the ability to respond to changes indemand with large changes in the quantity of shipments of SRC pipe and tube to the U.S. market.7 Themain factors contributing to the high degree of responsiveness of supply are the availability of unusedcapacity and the existence of alternate markets; supply responsiveness is constrained by the somewhatlimited ability to use inventories and an inability to produce alternate products.
Industry capacity
Mexican producers’ capacity utilization decreased from *** percent in 2007 to *** percent in2009. This level of capacity utilization indicates that Mexican producers have unused capacity withwhich they could increase production of SRC pipe and tube in the event of a price change.
Alternative markets
Shipments of SRC pipe and tube from Mexico to markets other than the United States (bothexports to alternative markets and shipments to the home market) increased from approximately ***percent of total shipments in 2007 to *** percent in 2009. This level of shipments indicates that Mexicanproducers have the ability to divert shipments to or from its home market and alternative markets inresponse to changes in the price of SRC pipe and tube.
Inventory levels
The ratio of end-of-period inventories to total shipments for Mexican producers increased from*** percent in 2007 to *** percent in 2009. This level of inventories indicates that Mexican producershave a limited ability to use inventories as a means of increasing shipments of SRC pipe and tube to theU.S. market.
Production alternatives
None of the four responding Mexican producers indicated that they produce products other thanSRC pipe and tube on the equipment and machinery that is used to produce SRC pipe and tube.
Supply constraints
Importer *** indicated that it has refused, declined, or been unable to supply SRC pipe and tubebecause it can not compete with pricing by domestic mills. *** indicated that it has refused many ordersdue to its inability to compete with U.S. producers’ prices, and inability to meet order requirements on atimely basis. *** reported that supply constraints are common in the copper tube industry, but that theimposition of antidumping duties could lead to an increased number of heat exchangers beingmanufactured in lower cost countries, and relocation of SRC pipe and tube facilities to Mexico.
7 Five Mexican producers responded to the foreign producers’ questionnaire. These responses are believed toaccount for approximately *** of Mexican export shipments to the United States.
II-5

Demand
Based on available information, it is likely that any change in the price level of SRC pipe andtube will result in a moderate change in the quantity of SRC pipe and tube demanded. The maincontributing factors are substitute products and the small cost share of SRC pipe and tube in its end-useproducts.
Demand Characteristics
SRC pipe and tube is typically sold either as plumbing tube or industrial tube. “Plumbing tube”is typically manufactured according to ASTM standards and used in construction. “Industrial tube” maybe similarly produced to industry standard specifications or may be produced to OEM specification and istypically used in HVAC systems.
U.S. demand for SRC pipe and tube depends on demand for construction, air conditioning andrefrigeration, and industrial manufacturing and the price of substitute goods such as PEX tubing.8 U.S.producer Mueller indicates that new home construction plays an important role in demand for bothplumbing and industrial SRC pipe and tube, whereas much of the demand for plumbing tube is derivedfrom nonresidential construction rather than residential construction.9 Kobe Wieland also notes that thewarmer the weather is early in the year, the better the air conditioning season will be; thus increasingdemand in the replacement market, which it estimates makes up about 35 to 65 percent of the market forSRC pipe and tube.10 U.S. producer and importer Cambridge-Lee indicated that it is difficult to estimatedemand for SRC pipe and tube from housing starts because of the substitution of plastic in residentialconstruction; but nonresidential construction is a more reliable indicator of changes in demand becauseSRC pipe and tube is typically used instead of substitutes.11 Importer JMF indicated that the relativelycool summers over the last two or three years has decreased demand for SRC pipe and tube.12 ImporterGD Copper (U.S.) estimated that replacement units make up 60 to 70 percent of the market for airconditioning units (which use SRC pipe and tube and do not use plastic tubing).13
Respondent Hailiang indicated that demand for both the plumbing and industrial pipe segmentsrely on commercial and residential construction.14 Dayco, Homewerks, JMF, and Marubeni indicated thatthe retail segments of the plumbing market have been impacted by the recession less than the wholesalesegment because many homeowners chose to remodel instead of purchasing new homes.15 They alsostated that sales of SRC pipe and tube for HVAC in the industrial market for nonresidential buildings hasfared better than sales of SRC pipe and tube for HVAC in residential buildings.16
The real value of total construction decreased by 36 percent between January 2007 and August2010 (see figure II-1). The real value of residential construction decreased by 60 percent between
8 Petition, p. 38. PEX is a cross-linked polyethylene tubing that is sold in straight lengths or coils. Conferencetranscript, p. 141 (M. Hansen).
9 Conference transcript, pp. 52-53 (J. Hansen).
10 Conference transcript, pp. 53-54 (Sigloch).
11 Conference transcript, pp. 146-147 (Kerins).
12 Conference transcript, p. 147 (M. Hansen).
13 Conference transcript, pp. 147-149 (Weil).
14 Respondent Hailiang’s postconference brief, p. 8.
15 Respondents Dayco, Homewerks, JMF, and Marubeni’s postconference brief, p. 5.
16 Ibid, p. 6.
II-6

Figure II-1Construction spending and housing starts: Total, residential, and nonresidential constructionspending in the United States, seasonally adjusted annual rate, deflated by the producer priceindex; and seasonally adjusted housing starts, monthly, January 2007-August 2010
Note: Expenditures on private residential improvements to rental, vacant, and seasonal properties are not included in theconstruction spending data. Expenditures are deflated by the producer price index for intermediate goods (seasonally adjusted).
Source: U.S. Census Bureau, Manufacturing, Mining and Construction Statistics, Construction Spending. http://www.census.gov/const/www/c30index.html#. and Bureau of Labor Statistics (retrieved October 5, 2010).
January 2007 and August 2010, while the real value of nonresidential construction decreased by 15percent. Also, seasonally adjusted housing starts decreased by 58 percent between January 2007 andAugust 2010.
Ten of 11 responding U.S. producers, 29 of 38 responding importers, and 29 of 39 purchasersindicated that demand for SRC pipe and tube in the United States has decreased since 2007. *** indicatedthat in 2007, there was a HVAC SEER (Seasonal Energy Efficiency Ratio) change which increasedcopper consumption in North American, and that an increase in housing starts driving increased demand,but that due to economic downturn beginning in late 2008, demand for copper tubing began to decrease.
Three of seven responding U.S. producers, six of 22 responding importers, and five of 13responding purchasers indicated that demand for SRC pipe and tube decreased outside the United Statessince 2007. Four importers and one purchaser indicated that demand outside the United States increased,and one importer and one purchaser reported that demand increased for industrial tube, but decreased forplumbing tube. One producer, five importers, and three purchasers indicated that demand outside of theUnited States fluctuated and the remaining two producers, six importers, and three importers indicatedthat there was no change in demand. Several responding firms attributed decreases in demand to theglobal economic downturn and several firms attributed increases in demand to increased demand in Chinaand developing countries. Importer *** indicated that the primary market for copper plumbing tubeoutside the United States is Europe, where the market has exhibited increased use of PVC tube and adecline in construction and that the primary markets for industrial tube outside the United States areChina and other developing nations.
II-7

Business Cycles
Nine of 11 responding U.S. producers, 20 of 39 responding importers, and 18 of 38purchasersindicated that the SRC pipe and tube market is subject to distinctive business cycles or conditions ofcompetition. Several U.S. producers and importers indicated that the SRC pipe and tube market is subjectto both seasonal and business cycles and that the business cycle is influenced by the construction market. U.S. producer Mueller indicated that residential construction typically peaks in the spring and earlysummer months, and, to a lesser extent, so does commercial construction because of the winter weatherdiscourages construction starts in the northern tier of states.17 Seven of nine responding U.S. producersand 15 of 19 responding importers indicated that these distinctive business cycles or conditions ofcompetition for SRC pipe and tube have changed since January 2007. Importers *** indicated that theincrease in government energy efficiency standards increased demand above the typical business cycle in2006 and 2007 and altered the anticipated seasonality. Only four of 34 responding purchasers indicatedthat the emergence of new markets for SRC pipe and tube since 2007 has affected the business cycles orconditions of competition distinctive to the SRC pipe and tube market. Purchaser *** indicated thatincreasing incomes in emerging economies in Asia, India, Latin America, and Eastern Europe haveenabled consumers to purchase air conditioning in much greater volume than in the past.
Substitute Products
Eight of 11 responding U.S. producers, 19 of 31 responding importers, and 28 of 41 respondingpurchasers indicated that there are substitutes for SRC pipe and tube. The most frequently citedsubstitutes were plastic tube (such as PEX or PVC), aluminum tube, and stainless steel tube. Specificproducts listed as substitutes by purchasers include PEX (14 purchasers), PVC/CPVC (12 purchasers),aluminum tube (nine purchasers), stainless tube (four purchasers), plastic tube (three purchasers),aluminum micrcochannel tube (four purchasers), welded seamless copper tube (two purchasers), andbrass and steel tube (one purchaser each).
Both petitioners and respondents indicate that demand for SRC pipe and tube has decreasedbecause of substitution of other types of tubing. Generally this decrease has been attributed to theincrease in the price of copper relative to other materials such as plastic and aluminum. The COMEXprice of copper has fluctuated since 2007, increasing by 14 percent between January 2007 and June2010.18
Importer GD Copper (U.S.) believes that the main reason that substitutes for tube have developedis that the price of copper has increased dramatically in recent years. It indicated that although the switchto aluminum requires certain tradeoffs for air conditioning manufacturers, such as heat transfer efficiency,OEMs have been willing to substitute aluminum tubing given the high price of copper. It also noted thatplastic tube has been used in indoor plumbing applications because there is no concern of heat transfercomplications and because PEX tube installation is less expensive since it does not require the sametechnical skill as copper tube installation.19 Purchaser *** indicated that, given the
17 Conference transcript, pp. 54-55 (M. Hansen).
18 Platt’s Metal Week and USGS.
19 Conference transcript, pp. 97-100 (Weil). Hearing transcript, p. 172 (Rogers).
II-8

application of inner grove tube in its “Building Efficiency” products, it is not able to substitute othermaterials such as plastic or steel.20
Petitioners indicate that because investment in nonresidential structures and custom builtresidential structures has held up better than for corporate-built single-family residential structures (suchas by Ryan Homes) and because the substitution of plastic tube for SRC pipe and tube in corporate-builtsingle-family residential structures had largely occurred by the end of 2006, increased substitution ofplastic tube was not an issue during the POI.21 Dayco, Homewerks, JMF, and Marubeni indicate that theshare of new housing starts using copper tube for their water distribution system fell from *** percent in2006 to *** percent in 2008 for single-family detached homes and from *** percent in 2006 to ***percent in 2008 for multifamily homes, while the share of housing starts using PEX tube increased forboth single-family and multifamily homes.22
Cost Share
SRC pipe and tube generally makes up a very small share of the final cost of construction, although it may make up a larger share of plumbing systems.23 Petitioners indicated that copper plumbingrepresents a few hundred dollars out of the total cost of a $100,000 house and that there was considerablevariation in the amount of copper tube in a large chiller unit as compared to a small air conditioner.24 Petitioners estimated the cost share of SRC pipe and tube for HVAC applications to be in the range of ***to *** percent.25 Importer GD Copper (U.S.) indicated that in a residential air conditioner, the cost shareof SRC pipe and tube will be on the low side and be larger for large chillers.26
SUBSTITUTABILITY ISSUES
The degree of substitution between domestic and imported SRC pipe and tube depends upon suchfactors as relative prices, quality (e.g., grade standards, reliability of supply, defect rates, etc.), andconditions of sale (e.g., price discounts/rebates, lead times between order and delivery dates, paymentterms, product services, etc.). Based on available data, staff believes that there is a moderate to highdegree of substitutability between domestically produced SRC pipe and tube and SRC pipe and tubeimported from China and Mexico.
Factors Affecting Purchasing Decisions
Petitioners indicated that SRC pipe and tube producers compete primarily on the basis of pricebecause SRC pipe and tube produced to a given specification is highly interchangeable whether it ismanufactured in the United States, Mexico, or China.27 Importer Homewerks indicates that it competeson the basis of a superior product range and services and not necessarily lower price, offering over 80
20 ***, written submission to the Commission, October 26, 2009, p. 5.
21 Petitioners’ postconference brief, exhibit 14, response to question 9.
22 Respondents Dayco, Homewerks, JMF, and Marubeni’s postconference brief, p. 5.
23 Conference transcript, p. 56 (J. Hansen).
24 Petitioners’ postconference brief, exhibit 14, response to question 8 and conference transcript, p. 56 (J. Hansen)and p. 55 (Sigloch).
25 Petitioners’ postconference brief, exhibit 14, response to question 8.
26 Conference transcript, p. 135 (Weil).
27 Conference transcript, pp. 9, 16 (Levy).
II-9
different copper tube items to retail customers, smaller case pack sizes than domestic manufacturers use,and being the first to offer security tagging and consumer friendly labeling and packaging.28 ImporterJMF indicated that it can not compete on the basis of price with domestic producers, so it attempts toout-service the copper tube mills by usually shipping its SRC pipe and tube in one day and within twodays 98 percent of the time.29 Purchaser *** indicated it does not base its decisions on price but, rather,on the performance parameters and capability of the materials and products that it purchases.30 Itpurchases product that is made from a cast and roll process and has not found SRC pipe and tubeproduced using other methods to be of the same quality and reliability.31 Petitioners indicated that there isno difference between SRC pipe and tube produced from the cast and roll and extrusion processes.32
Purchasers report that they consider a variety of factors to be important when selecting amongcompeting SRC pipe and tube suppliers including availability, price, and quality. As indicated in table II-2, price was named by 16 of 42 responding purchasers as the number one factor generally considered indeciding from whom to purchase SRC pipe and tube, as the number two factor by 11 respondingpurchasers, and as the number three factor by 11 other responding purchasers. Also, as indicated in tableII-3, 37 of 43 responding purchasers indicated that price was a “very important” factor in their purchasedecisions for SRC pipe and tube. Twenty of 41 responding purchasers indicated that the lowest-pricedSRC pipe and tube “sometimes” will win a sale, 15 reported “usually,” five reported “always,” and threereported “never.”
Quality was named by 14 of 42 responding purchasers as the number one factor generallyconsidered in deciding from whom to purchase SRC pipe and tube, the number two factor by 10purchasers, and the number three factor by seven purchasers. Also, as indicated in table II-3, 40 of 42responding purchasers indicated that quality meeting industry standards was a “very important” factor intheir purchase decisions for SRC pipe and tube, and 21 of 42 responding purchasers indicated that qualityexceeding industry standards is a “very important” factor in their purchase decisions. Qualitycharacteristics that purchasers consider when determining the quality of SRC pipe and tube includemeeting or exceeding specifications; consistency of tubing; absence of leaks, defects, or materialimpurities; cleanliness; packaging; dimensional consistency; and heat transfer efficiency.
Twenty-six of 44 responding purchasers reported that they require their suppliers to becomecertified or pre-qualified for all, or nearly all, of their purchases of SRC pipe.33 Purchasers reported that itcan take from days to a year to qualify a new supplier; the average time reported was 90 days. Eight of34 responding purchasers indicated that since 2007, certain domestic or foreign producers failed in theirattempts to certify or qualify their SRC pipe and tube or have lost their approved status. Specifically, twopurchasers reported that U.S.-produced product from Luvata did not meet quality standards. One firmstated that one particular size from Wolverine failed to meet quality and performance standards. Anotherpurchaser reported that product from a mill in China was either too soft or too hard for their productionprocess. One firm reported that product from Mexico failed all tests. Purchasers also listed SRC pipe andtube sourced from importer CMC and a specific product from Malaysia as failing to qualify.
28 Conference transcript, pp. 80-81 (Altman).
29 Conference transcript, pp. 168-169 (M. Hansen).
30 ***, written submission to the Commission, October 26, 2009, p. 2.
31 Ibid, p. 2.
32 Conference transcript, p. 52 (Arndt, J. Hansen, Sigloch). Kobe Wieland indicated that some sizes cannot beproduced with cast and roll methods, but that for all sizes that can be produced with both methods, there is nodifference. Ibid., p. 52 (Sigloch).
33 In addition, one purchaser indicated that it requires new suppliers to fill out a quality form.
II-10

Table II-2SRC pipe and tube: Ranking of factors used in purchasing decisions, as reported by unrelatedU.S. purchasers
Factor
Number of firms reporting
Number onefactor Number two factor Number three factor
Availability 5 8 11
Delivery1 0 6 6
Location of manufacturer 0 1 0
Price 16 11 11
Prearranged contracts 1 0 0
Product range 0 0 2
Rebate programs 0 0 1
Quality2 14 11 7
Traditional/approved supplier 4 3 1
1 Includes on time performance, freight policy, and lead times. 2 Includes meets specifications and performance.
Source: Compiled from data submitted in response to Commission questionnaires.
II-11

Table II-3SRC pipe and tube: Importance of factors used in purchasing decisions, as reported by U.S.purchasers
Factor
Number of firms reporting
Very important Somewhat important Not important
Availability 40 3 0
Delivery terms 23 17 2
Delivery time 36 7 0
Discounts offered 20 16 6
Extension of credit 17 15 10
Price 37 6 0
Minimum quantity requirements 10 20 12
Packaging 8 27 7
Product consistency 38 4 0
Quality meets specifications 40 2 0
Quality exceeds specifications 21 19 2
Product range 9 25 8
Reliability of supply 38 4 0
Rebate program 9 7 26
Technical support 14 20 8
U.S. transportation costs 14 18 10
Source: Compiled from data submitted in response to Commission questionnaires.
Forty of 43 responding purchasers indicated that availability was a “very important” factor intheir SRC pipe and tube purchasing decisions. Five of 42 responding purchasers reported that availabilitywas the most important factor in their purchasing decisions, eight purchasers reported it was the numbertwo factor, and 11 purchasers reported it was the number three factor. Reliability of supply was cited as a“very important” factor by 38 of 42 responding purchasers.
Comparison of U.S.-Produced and Imported SRC Pipe and Tube
In order to determine whether U.S.-produced SRC pipe and tube can generally be used in thesame applications as imports from China and Mexico, U.S. producers, U.S. importers, and U.S.purchasers were asked whether the products can “always,” “frequently,” “sometimes,” or “never” be usedinterchangeably. As shown from table II-4, at least 70 percent of responding U.S. producers, between 39and 41 percent of responding importers, and slightly more than half of purchasers indicated that SRC pipeand tube produced in the United States and imported from China and Mexico are “always” usedinterchangeably. All or all but one responding producer, 77 percent of responding importers, and 75 to 80percent of responding purchasers reported that they are at least “frequently” used interchangeably.
II-12

Table II-4SRC pipe and tube: Perceived interchangeability between SRC pipe and tube produced in theUnited States and in other countries, by country pairs
Country pair
Number of U.S.producersreporting
Number of U.S.importers reporting
Number of purchasersreporting
A F S N A F S N A F S N
U.S. vs. subject countries: U.S. vs. China 7 2 1 0 12 12 5 2 16 8 5 1
U.S. vs. Mexico 6 2 0 0 9 8 4 1 18 6 6 2
U.S. vs. nonsubject countries: U.S. vs. Canada 5 1 2 0 9 3 4 1 15 5 1 1
U.S. vs. Malaysia 4 0 0 0 7 5 1 1 7 3 3 0
U.S. vs. other nonsubject 1 0 0 0 8 4 1 1 7 2 1 0
Subject countries comparisons: China vs. Mexico 5 1 0 0 8 4 2 1 13 3 4 1
Nonsubject countries comparisons: China vs. Canada 4 1 0 0 8 2 3 1 10 1 1 1
China vs. Malaysia 4 0 0 0 7 4 1 0 7 2 3 0
China vs. other nonsubject 1 0 0 0 7 3 0 0 7 1 1 0
Mexico vs. Canada 4 1 0 0 8 2 3 1 11 0 1 1
Mexico vs. Malaysia 4 0 0 0 6 2 2 0 7 1 3 0
Mexico vs. other nonsubject 1 0 0 0 7 1 0 0 7 0 1 0
Canada vs. Malaysia 4 0 0 0 6 1 2 1 7 0 1 2
Canada vs. other nonsubject 0 0 0 0 7 1 0 1 7 0 1 1
Malaysia vs. other nonsubject 1 0 0 0 7 2 0 1 7 0 1 1
Note.--A = Always, F = Frequently, S = Sometimes, N = Never.Source: Compiled from data submitted in response to Commission questionnaires.
Importer *** indicated that plumbing tube produced in Mexico is interchangeable withU.S.-produced plumbing tube, but that Mexico does not currently export a significant amount of“interchangeable” industrial tube products to the United States. Importer *** indicates that, generally,imported copper tube product is better quality (higher copper content) and has more consistent wallthicknesses. Importer Copper and Brass indicated that the products that it imports from Mexico and notproduced in the United States include military specification tube for ship building, heat exchanges forpetrochemical applications, sugar tubes for producing sugar, wave guide tubes for cellularcommunications, and heavy wall copper tubes often used in heat exchange applications and electronicapplications.34 It indicates that these products are probably a fraction of all the SRC pipe and tubeproducts Copper and Brass imports into the U.S. market (Copper and Brass indicates that its importsmake up about 1 to 2 percent of the U.S. market).35 Importer *** indicated (***) that its SRC pipe andtube is generally perceived as being of higher quality than that of U.S. producers.
34 Conference transcript, pp. 114-115 (Kelly).
35 Conference transcript, p. 161 (Kelly).
II-13

Importer *** indicates that commercial and industrial buyers prefer cast and roll-producedproduct because of higher copper content (cathode only) and tighter specifications. Purchaser ***indicated that inner groove tube produced from a continuous horizontal cast and roll process hashistorically only been available from Chinese sources and more recently Mexican sources.36
In comparing imported SRC pipe and tube from China to that from Mexico, 83 percent ofresponding U.S. producers, 50 percent of responding importers, and 62 percent of responding purchasersreported that they are “always” used interchangeably. All responding U.S. producers, 81 percent ofresponding importers, and 76 percent of responding purchasers reported that SRC pipe and tube fromChina and from Mexico are at least “frequently” used interchangeably.
At least 62 percent of responding U.S. producers, and at least half of responding importers andpurchasers reported that SRC pipe and tube produced in the United States and imported from nonsubjectcountries are “always” used interchangeably. At least 80 percent of U.S. producers, at least 57 percent ofimporters, and at least 58 percent of purchasers reported that SRC pipe and tube imports from China andMexico, and imports from nonsubject countries are “always” used interchangeably.
As indicated in table II-5, all responding U.S. producers and 60 to 67 percent of respondingimporters indicated that differences other than price between SRC pipe and tube produced in the UnitedStates and imported from China and Mexico were at most “sometimes” a significant factor in their sales. All responding U.S. producers and at least 55 percent of responding importers indicated that differencesother than price between SRC pipe and tube produced in the United States and imported from nonsubjectcountries were at most “sometimes” a significant factor in their sales. Purchasers were also asked to compare SRC pipe and tube produced in the United States andsubject and nonsubject countries on the basis of different purchasing factors (table II-6). The U.S.product was ranked comparable with imports from China by at least half of responding purchasers for allcharacteristics except for delivery time, price, and reliability of supply. The U.S. product was rankedcomparable with imports from Mexico by at least half of responding purchasers for all characteristics.
36 ***.
II-14

Table II-5SRC pipe and tube: Perceived differences other than price between SRC pipe and tube producedin the United States and in other countries, by country pairs
Country pair
Number of U.S. producersreporting
Number of U.S. importersreporting
A F S N A F S N
U.S. vs. subject countries: U.S. vs. China 0 0 5 4 3 5 8 8
U.S. vs. Mexico 0 0 3 4 2 4 6 3
U.S. vs. nonsubject countries: U.S. vs. Canada 0 0 5 2 0 1 3 7
U.S. vs. Malaysia 0 0 3 0 1 3 3 2
U.S. vs. other nonsubject 0 0 1 0 1 2 4 4
Subject countries comparisons: China vs. Mexico 0 0 0 4 0 1 3 3
Nonsubject countries comparisons: China vs. Canada 0 0 2 1 0 2 2 4
China vs. Malaysia 0 0 2 0 0 3 2 1
China vs. other nonsubject 0 0 0 0 0 2 2 3
Mexico vs. Canada 0 0 3 1 0 1 2 4
Mexico vs. Malaysia 0 0 2 0 0 2 2 1
Mexico vs. other nonsubject 0 0 0 0 0 1 2 4
Canada vs. Malaysia 0 0 2 0 0 1 2 1
Canada vs. other nonsubject 0 0 0 0 0 0 2 3
Malaysia vs. other nonsubject 0 0 0 0 0 0 3 3
Note.--A = Always, F = Frequently, S = Sometimes, N = Never.Source: Compiled from data submitted in response to Commission questionnaires.
II-15

Table II-6SRC pipe and tube: Purchasers’ comparisons of domestic and subject and nonsubject products
FactorU.S. vs. China U.S. vs. Mexico China vs. Mexico
S C I S C I S C I
Availability 9 13 3 8 12 1 5 7 3
Delivery terms 6 16 3 8 12 2 6 7 2
Delivery time 14 7 4 10 12 1 5 4 6
Discounts offered 0 19 3 1 18 2 2 11 1
Extension of credit 5 15 5 6 14 2 2 12 1
Lower price 0 9 16 0 11 11 3 10 2
Lower US. transportation costs 6 15 2 7 13 2 1 13 1
Minimum quantity requirements 7 14 4 7 13 2 2 10 3
Packaging 2 19 4 3 18 1 1 14 0
Product consistency 1 17 7 4 13 5 4 11 0
Product range 4 17 4 3 15 4 3 11 1
Quality exceeds industry standards 1 19 5 5 13 4 6 9 0
Quality meets industry standards 0 21 3 4 15 1 4 11 0
Rebate program 3 14 0 3 14 0 1 11 1
Reliability of supply 7 12 6 10 11 1 6 8 1
Technical support/service 10 14 1 7 14 1 2 11 2
Note.–S = domestic product superior, C = domestic product comparable, I = domestic product inferior.
Source: Compiled from data submitted in response to Commission questionnaires.
II-16

ELASTICITY ESTIMATES
This section discusses the elasticity estimates.
U.S. Supply Elasticity
The domestic supply elasticity for SRC pipe and tube measures the sensitivity of the quantitysupplied by U.S. producers to a change in the U.S. market price of SRC pipe and tube. The elasticity ofdomestic supply depends on several factors, including the level of excess capacity, the ease with whichproducers can alter capacity, producers’ ability to shift to the production of other products, the existenceof inventories, and the availability of alternative markets for U.S.-produced SRC pipe and tube.37 Earlieranalysis of these factors indicates that the U.S. industry has the ability to respond to changes in demandwith large changes in shipments of SRC pipe and tube to the U.S. market. Staff estimated that the supplyelasticity for SRC pipe and tube was between 5 and 10 in the prehearing staff report. Petitionersdescribed this range as a “reasonable” estimate and Golden Dragon respondents indicated that while theestimate is reasonable, it should be lowered to a range of 4 to 6 because domestic producers’ unusedcapacity is overestimated because theoretical capacity may bear little resemblance to actual capacity.38 However, Golden Dragon respondents do not propose an alternative estimate of domestic capacityutilization and staff has estimated the responsiveness of both U.S. supply and subject imports based onthe capacity and production reported in U.S. producer and foreign producer questionnaires.39
U.S. Demand Elasticity
The U.S. demand elasticity for SRC pipe and tube measures the sensitivity of the overall quantitydemanded to a change in the U.S. market price of SRC pipe and tube. This estimate depends on factorsdiscussed earlier such as the existence, availability, and commercial viability of substitute products, aswell as the component share of SRC pipe and tube in the production of downstream products. Based onavailable information, the demand elasticity for SRC pipe and tube is likely to be in the range of -0.75 to -1.25. Petitioners described this range as an “appropriate” estimate and Golden Dragon respondentsindicated that they do not “quibble” with the U.S. demand elasticity estimate.40
Substitution Elasticity
The elasticity of substitution depends upon the extent of product differentiation between thedomestic and imported products.41 Product differentiation, in turn, depends upon such factors as quality(e.g., chemistry, surfaces, coil sizes) and conditions of sale (e.g., service, availability, delivery). Petitioners feel that an estimate of 6 to 10 is more in alignment with the characterization of
37 Domestic supply response is assumed to be symmetrical for both an increase and a decrease in demand for thedomestic product. Therefore, factors affecting increased quantity supplied to the U.S. market also affect decreasedquantity supplied to the same extent.
38 Hearing transcript, pp. 140-41 (Boyce), p. 154 (Weil), and p. 233 (Rogers) and Golden Dragon respondent’sposthearing brief at R-12.
39 For example, see “Subject Imports from China” and “Subject Imports from Mexico” earlier in this section.
40 Hearing transcript, p. 141 (Boyce) and p. 233 (Rogers).
41 The substitution elasticity measures the responsiveness of the relative U.S. consumption levels of the subjectimports and U.S. domestic like products to changes in their relative prices. This reflects how easily purchasersswitch from the U.S. product to the subject product (or vice versa) when prices change.
II-17

substitutability being moderate to high than the range of 3 to 5 suggested in the prehearing staff report.42 Golden Dragon respondents indicate that the substitution elasticities should be lowered to a range of 2 to4 because industrial SRC pipe and tube imported from China is not necessarily the same as U.S.-producedindustrial SRC pipe and tube.43 In most recent investigations, staff has suggested an elasticity range of 2to 4 for “moderate” substitutability and an average range of 3 to 5 for “high” substitutability.44 Also, the“moderate to high” characterization of substitutability reflects that 39 to 41 percent of respondingimporters and slightly more than one-half of responding purchasers feel that U.S. produced SRC pipe andtube and SRC pipe and tube imported from China and Mexico is always interchangeable. Therefore arange of 3 to 5 is appropriate to characterize the moderate to high level of substitutability between U.S.-produced SRC pipe and tube and subject imported SRC pipe and tube.45
Petitioners estimate that dumped subject imports accounted for a *** percent reduction in theprice of U.S. produced SRC pipe and tube and a *** percent reduction in the volume of U.S. shipmentsusing the “full pass through case in the CADIC model.”46 They also estimated a price decline of ***percent and a decrease in the volume of U.S. shipments of *** percent using the partial pass through case. Petitioners assumed the midpoint of the elasticity estimates in the prehearing staff report and a margin of33.3 percent.47
42 Hearing transcript, p. 141 (Boyce, Levy) and petitioners’ prehearing brief, exhibit 14.
43 Hearing transcript, p. 233 (Rodgers) and Golden Dragon respondent’s posthearing brief at R-12.
44 For example, Certain Potassium Phosphate Salts from China Investigation Nos. 701-TA-473 and 731-TA-1173(Final), Publication No. 4171, July 2010 at II-17 and II-29; Wire Decking from China Investigation Nos. 701-TA-466and 731-TA-1162 (Final), Publication No. 4172, July 2010 at II-8 and II-14; and Certain Oil Country TubularGoods from China Investigation No. 701-TA-463 (Final), Publication No. 4124, January 2010 at II-14 and II-22 allsuggest a range of 3 to 5 for a “high” level of substitutability and Prestressed Concrete Steel Wire Strand fromChina Investigation Nos. 701-TA-464 and 731-TA-1160 (Final), Publication No. 4162, June 2010 at II-16 suggests arange of 2 to 4 for a “moderate” level of substitutability. Also, Certain Steel Grating from China Investigation Nos.701-TA-465 and 731-TA-1161 (Final), Publication No. 4168, July 2010 at II-5, II-11-12 suggests a range of 2 to 4for “high” substitutability and Polyethylene Retail Carrier Bags from Indonesia, Taiwan, and Vietnam, InvestigationNos. 701-TA-462 and 731-TA-1156-1158 (Final), Publication No. 4144, April 2010 at II-15 and II-26 suggests arange of 4 to 6 for high substitutability.
45 Additionally, the elasticities of substitution between U.S.-produced SRC pipe and tube and nonsubject importsand between subject imports and nonsubject imports are likely to be in the same range.
46 CADIC is a precursor to the COMPAS model. Using the same assumptions, the COMPAS model providessimilar estimates as the full pass through case in the CADIC model.
47 Petitioners’ posthearing brief, Response to Commissioners’ questions p. 38 and Exhibit 10.
II-18
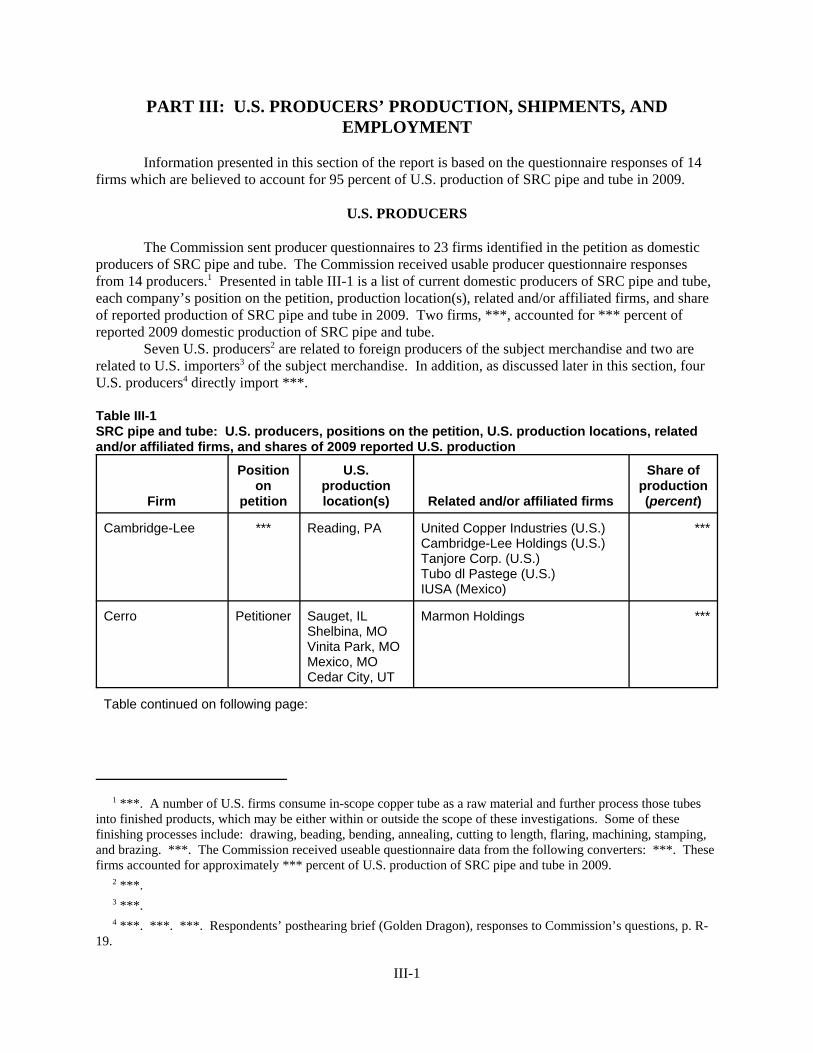
PART III: U.S. PRODUCERS’ PRODUCTION, SHIPMENTS, ANDEMPLOYMENT
Information presented in this section of the report is based on the questionnaire responses of 14firms which are believed to account for 95 percent of U.S. production of SRC pipe and tube in 2009.
U.S. PRODUCERS
The Commission sent producer questionnaires to 23 firms identified in the petition as domesticproducers of SRC pipe and tube. The Commission received usable producer questionnaire responsesfrom 14 producers.1 Presented in table III-1 is a list of current domestic producers of SRC pipe and tube,each company’s position on the petition, production location(s), related and/or affiliated firms, and shareof reported production of SRC pipe and tube in 2009. Two firms, ***, accounted for *** percent ofreported 2009 domestic production of SRC pipe and tube.
Seven U.S. producers2 are related to foreign producers of the subject merchandise and two arerelated to U.S. importers3 of the subject merchandise. In addition, as discussed later in this section, fourU.S. producers4 directly import ***.
Table III-1SRC pipe and tube: U.S. producers, positions on the petition, U.S. production locations, relatedand/or affiliated firms, and shares of 2009 reported U.S. production
Firm
Positionon
petition
U.S.productionlocation(s) Related and/or affiliated firms
Share ofproduction(percent)
Cambridge-Lee *** Reading, PA United Copper Industries (U.S.)Cambridge-Lee Holdings (U.S.)Tanjore Corp. (U.S.)Tubo dl Pastege (U.S.)IUSA (Mexico)
***
Cerro Petitioner Sauget, ILShelbina, MOVinita Park, MOMexico, MOCedar City, UT
Marmon Holdings ***
Table continued on following page:
1 ***. A number of U.S. firms consume in-scope copper tube as a raw material and further process those tubesinto finished products, which may be either within or outside the scope of these investigations. Some of thesefinishing processes include: drawing, beading, bending, annealing, cutting to length, flaring, machining, stamping,and brazing. ***. The Commission received useable questionnaire data from the following converters: ***. Thesefirms accounted for approximately *** percent of U.S. production of SRC pipe and tube in 2009.
2 ***.
3 ***.
4 ***. ***. ***. Respondents’ posthearing brief (Golden Dragon), responses to Commission’s questions, p. R-19.
III-1

Table III-1--ContinuedSRC pipe and tube: U.S. producers, positions on the petition, U.S. production locations, relatedand/or affiliated firms, and shares of 2009 reported U.S. production
Elkhart Products *** Elkhart, IN Aalberts Industries (Netherlands) ***
Freeport-McMoRan *** Elizabeth, NJ Freeport-McMoRan Copper &Gold Inc. (U.S.)
***
H & H *** Vanderbilt, MI Sunspring Metal Corp. (Taiwan) ***
Howell Metal *** New Market, VA Commercial Metals (CMC)(U.S.) ***
Kobe Wieland Petitioner Pine Hall, NCWheeling, IL
Wieland Holdings (U.S.)Kobe Copper (U.S.)Wieland Metals (U.S.)Wieland-Werke (Germany)Wolverine Tube Shanghai (China)Kobelco & Materials Copper(Japan)Kobelco & Materials Copper(Malaysia)Kobelco & Materials Copper(Thailand)
***
Mueller Petitioner Fulton, MSWynne, AR
Mueller IndustriesJiangsu Mueller-Xingrong Copper(China)Mueller EuropePrecision Tube (U.S.)
***
National CopperProducts
*** Birmingham, AL National Tube Holding Co.National Copper & Smelting Co.
***
Packless *** Waco, TX None ***
Precision Tube *** North Wales,PA
Mueller Streamline Co.Jiangsu Mueller-XingrongCopper (China)Mueller EuropeMueller
***
S.T. Products *** Duncansville,PA
S.T. Products Holdings (U.S.) ***
Trojan Tube *** Howell, NJ None ***
Wolverine *** Ardmore, TNHuntsville, ALShawnee, OKDecatur, ALCarrolton, TXBooneville, MS
Wolverine Tube Shanghai(China)Wolverine Tubagem (Portugal)WLVN de LatinoAmerica(Mexico)
***
Total 100.0
Note.–Because of rounding, shares may not total to 100.0 percent.
Source: Compiled from data submitted in response to Commission questionnaires.
III-2

U.S. CAPACITY, PRODUCTION, AND CAPACITY UTILIZATION
U.S. producers’ capacity, production, and capacity utilization data for SRC pipe and tube arepresented in table III-2. These data show capacity to produce SRC pipe and tube decreased by 8.3percent from 2007 to 2009. Production of SRC pipe and tube decreased by 31.9 percent from 2007 to2009 and increased by 4.0 percent between the interim periods. Capacity utilization decreased by 16.5percentage points from 2007 to 2009, and increased by 3.7 percentage points between the interim periods.
Table III-2 SRC pipe and tube: U.S. capacity, production, and capacity utilization, 2007-09, January-June2009, and January-June 2010
Item
Calendar year January-June
2007 2008 2009 2009 2010
Capacity1 (1,000 pounds) 1,223,928 1,120,991 1,122,794 563,535 545,709
Production (1,000 pounds) 781,123 640,036 531,562 284,755 296,071
Capacity utilization (percent) 63.8 57.1 47.3 50.5 54.3
1 U.S. producers reported capacity (production capacity) based on operating *** hours per week and *** weeksper year.
Source: Compiled from data submitted in response to Commission questionnaires.
U.S. producers were asked if they had experienced any plant openings, relocations, expansions,acquisitions, consolidations, closures, or prolonged shutdowns because of strikes or equipment failure;curtailment of production because of shortages of materials; or any other change in the character of theiroperations or organization relating to the production of SRC pipe and tube since January 1, 2007. EightU.S. producers provided responses which are presented in table III-3.
The domestic industry closed a number of SRC pipe and tube plants during the period examined: Luvata Grenda shut down production in 2006. Luvata Grenada estimated it produced *** pounds of SRCpipe and tube in 2006.5 Wolverine closed its Decatur, AL, plant in December 2007 (capacityapproximately *** pounds). According to testimony presented at the hearing, the majority of theproducts produced at the Decatur, AL, plant consisted of plumbing tube and smooth industrial tube. Withthe closing of the Decatur plant, Wolverine exited the plumbing tube business and moved some of itssmooth industrial tube production to its plant in Shawnee, OK.6 Wolverine closed its Booneville, MS,plant in November 2007.7 Wolverine also closed its Jackson, TN, plant (capacity approximately ***pounds); however, production at this plant consisted solely of welded inner-groove copper tube, which
5 ***.
6 Hearing transcript, pp. 227-228 (Weil). Wolverine’s decision to exit the plumbing tube business was based onthe decline in demand for plumbing tube due to the advent of plastic tubing and the sharp rise in commodity copperprices. In addition, Wolverine’s maintains that the competitiveness of the Decatur and Booneville products was ***. Respondents’ posthearing brief (Wolverine), p. 7.
7 Wolverine’s Booneville, MS, plant produced inner-groove copper tube and was temporarily closed in October2003. It was later reopened to produce redraw material that was then shipped to other Wolverine facilities beforeultimately closing in November 2007. Hearing transcript, p. 150 (Weil).
III-3

can be substituted for SRC pipe and tube, but is not subject to these investigations.8 Linderme Tube Co.closed in September 2008 (capacity approximately *** pounds);9 and National Copper closed itsDowagiac, MI, plant in November 2008 (capacity *** pounds).10
Table III-3SRC pipe and tube: Changes in U.S. producers’ production operations
* * * * * * *
Five U.S. producers reported the production of other products on the same equipment andmachinery and using the same production and related workers employed in the production of SRC pipeand tube, as presented in table III-4.
Table III-4SRC pipe and tube: Production of other products on the same equipment and machinery
* * * * * * *
U.S. PRODUCERS’ SHIPMENTS
Data on domestic producers’ shipments of SRC pipe and tube are presented in table III-5. U.S.shipments decreased by 31.9 percent from 2007 to 2009. The unit value of U.S. shipments decreased by22.5 percent from 2007 to 2009, and increased by 46.0 percent in the interim periods. Exports of SRCpipe and tube were reported by 9 firms.11 Exports accounted for 5.7 percent of U.S. producers’ totalshipments during 2009. The export markets listed included ***. U.S. commercial shipments accountedfor *** percent of U.S. producers’ total shipments of SRC pipe and tube in 2009. Transfers to relatedfirms accounted for *** percent of U.S. producers’ total shipments of SRC pipe and tube in 2009.12 Internal consumption accounted for *** percent of U.S. producers’ total shipments of SRC pipe and tubein 2009.13
8 Hearing transcript, p. 148 (Weil). Wolverine’s Jackson, TN, plant manufactured and sold non-subject weldedinner groove tube from approximately 2003 to 2006. During a portion of that period, Golden Dragon exported andsold in North America subject seamless IGT products ***. Wolverine closed the Jackson plant and subsequently***. Respondents’ posthearing brief (Wolverine), p. 2.
9 Linderme employed approximately 85 workers in Euclid, OH. Its assets and customer base were purchased byS.T. Products. http://www.tubelinks.com/tubenews.php?cat=Closures, retrieved July 8, 2010. In the twelvecalendar months prior to S.T. Products’ acquisition of Linderme in October 2008, Linderme Tube shipped ***pounds of SRC pipe and tube and in the previous 12 calendar months, Linderme shipped *** pounds of SRC pipeand tube. ***.
10 ***. ***.
11 ***.
12 ***.
13 ***.
III-4

Table III-5 SRC pipe and tube: U.S. producers’ shipments, by types, 2007-09, January-June 2009, andJanuary-June 2010
Item
Calendar year January-June
2007 2008 2009 2009 2010
Quantity (1,000 pounds)
Commercial shipments *** *** *** *** ***
Internal consumption *** *** *** *** ***
Transfers to related firms *** *** *** *** ***
U.S. shipments 752,491 612,032 512,809 277,289 264,741
Export shipments 33,253 33,243 30,971 14,578 21,541
Total shipments 785,744 645,275 543,780 291,867 286,282
Value (1,000 dollars)
Commercial shipments *** *** *** *** ***
Internal consumption *** *** *** *** ***
Transfers to related firms *** *** *** *** ***
U.S. shipments 3,033,910 2,578,115 1,602,849 768,352 1,070,821
Export shipments 136,379 142,244 100,139 40,457 90,235
Total shipments 3,170,289 2,720,359 1,702,988 808,809 1,161,056
Unit value (per pound)
Commercial shipments $*** $*** $*** $*** $***
Internal consumption *** *** *** *** ***
Transfers to related firms *** *** *** *** ***
U.S. shipments 4.03 4.21 3.13 2.77 4.04
Export shipments 4.10 4.28 3.23 2.78 4.19
Average 4.03 4.22 3.13 2.77 4.06
Share of quantity (percent)
Commercial shipments *** *** *** *** ***
Internal consumption *** *** *** *** ***
Transfers to related firms *** *** *** *** ***
U.S. shipments 95.8 94.8 94.3 95.0 92.5
Export shipments 4.2 5.2 5.7 5.0 7.5
Total shipments 100.0 100.0 100.0 100.0 100.0
Note.–Because of rounding, figures may not add to the totals shown.
Source: Compiled from data submitted in response to Commission questionnaires.
III-5

U.S. PRODUCERS’ INVENTORIES
Data on domestic producers’ end-of-period inventories of SRC pipe and tube are presented intable III-6. Domestic producers’ inventories decreased by 28.1 percent from 2007 to 2009, and decreasedby 15.0 percent in interim 2010 compared with interim 2009. U.S. producers’ inventories wereequivalent to between 6.2 and 7.6 percent of U.S. producers’ total shipments during 2007 to June 2010. Producers generally do not maintain significant inventories of SRC pipe and tube because of the volatilityof copper prices.14
Table III-6SRC pipe and tube: U.S. producers’ end-of-period inventories, 2007-09, January-June 2009, andJanuary-June 2010
Item
Calendar year January-June
2007 2008 2009 2009 2010
Inventories (1,000 pounds) 52,936 48,747 38,053 41,930 35,642
Ratio to production (percent) 6.8 7.6 7.2 7.4 6.0
Ratio to U.S. shipments (percent) 7.0 8.0 7.4 7.6 6.7
Ratio to total shipments (percent) 6.7 7.6 7.0 7.2 6.2
Note.–Partial-year ratios are based on annualized production and shipments.
Source: Compiled from data submitted in response to Commission questionnaires.
U.S. PRODUCERS’ IMPORTS AND PURCHASES
Two U.S. producers reported that they directly imported SRC pipe and tube from ***,15 threeimported from ***,16 and two imported from ***17 during the period examined. Nine U.S. producersreported that they purchased SRC pipe and tube from other U.S. producers,18 three purchased importsfrom ***,19 three purchased imports from ***,20 and four purchased imports from nonsubject sources.21 U.S. producers’ imports and purchases of SRC pipe and tube from China and Mexico are presented intable III-7.
14 Petitioners’ postconference brief, p. 32.
15 ***. ***. Respondents’ posthearing brief (Golden Dragon), responses to Commission’s questions, p. R-19.
16 ***.
17 ***.
18 ***.
19 ***.
20 ***.
21 ***.
III-6

Table III-7SRC pipe and tube: U.S. producers’ imports and purchases, 2007-09, January-June 2009, andJanuary-June 2010
* * * * * * *
U.S. EMPLOYMENT, WAGES, AND PRODUCTIVITY
U.S. producers’ aggregate employment data for SRC pipe and tube are presented in table III-8.22 In the aggregate, U.S. SRC pipe and tube producers reported a 20.4 percent decrease in the number ofproduction and related workers employed in the manufacture of SRC pipe and tube from 2007 to 2009,and a 9.9 percent decrease in interim 2010 compared with interim 2009. *** accounted for the majorshare of the decrease in number of employees from 2007 to 2009. Productivity decreased 9.7 percentfrom 2007 to 2009, and increased by 13.1 percent in interim 2010 compared with interim 2009.
Table III-8SRC pipe and tube: U.S. producers’ employment-related data, 2007-09, January-June 2009, andJanuary-June 2010
Item
Calendar year January-June
2007 2008 2009 2009 2010
Production and related workers (PRWs) 3,644 3,303 2,902 2,962 2,668
Hours worked by PRWs (1,000 hours) 7,791 6,980 5,873 3,056 2,809
Wages paid to PRWs (1,000 dollars) 136,285 124,976 104,257 54,720 50,468
Hourly wages $17.49 $17.90 $17.75 $17.91 $17.97
Productivity (pounds produced per hour) 100.1 91.6 90.5 93.1 105.3
Unit labor costs (per pound) $0.17 $0.20 $0.20 $0.19 $0.17
Source: Compiled from data submitted in response to Commission questionnaires.
22 ***.
III-7


PART IV: U.S. IMPORTS, APPARENT CONSUMPTION, ANDMARKET SHARES
U.S. IMPORTERS
Importer questionnaires were sent to 72 firms believed to be importers of subject SRC pipe andtube, as well as to all U.S. producers of SRC pipe and tube.1 U.S. import data are based on official importstatistics of Commerce.2 Table IV-1 lists all responding U.S. importers of SRC pipe and tube from China,Mexico, and other sources, their locations, and their shares of U.S. imports in 2009. In 2009, the largestimporter of SRC pipe and tube from China was ***, the largest importer of SRC pipe and tube fromMexico was ***, and the largest importer of SRC pipe and tube from other sources was ***.
Table IV-1SRC pipe and tube: U.S. importers, source(s) of imports, U.S. headquarters, and shares of importsin 2009
Firm Headquarters
Share of 2009 imports (percent)
China MexicoSubjectsources Other Total
Abco Chatham, MAMemphis, TN
*** *** *** *** ***
Ask Products Aurora, IL *** *** *** *** ***
Automotive Technical Dacula, GA *** *** *** *** ***
Browning Metal Purchase, NY *** *** *** *** ***
Burndy Shelton, CT *** *** *** *** ***
Cambridge-Lee Reading, PA *** *** *** *** ***
Carrier Syracuse, NY *** *** *** *** ***
CMC Fort Lee, NJ *** *** *** *** ***
Copper & Brass Houston, TX *** *** *** *** ***
CPW America Houston, TX *** *** *** *** ***
David Bleich Calabasas, CA *** *** *** *** ***
Table continued on next page.
1 The Commission sent questionnaires to those firms identified in the petition, along with firms that, based on areview of data provided by U.S. Customs and Border Protection (“Customs”), may have imported greater than onepercent of total imports under HTS subheadings 7411.10.1030 or 7411.10.1090 in any one year since 2007. TheCommission received responses from nine firms that reported they did not import SRC pipe and tube during theperiod examined. Those firms are: ***. 2 When compared to official import statistics of Commerce, questionnaire responses from U.S. importersrepresented 83.7 percent of total imports from China, 106.5 percent of total imports from Mexico, and 56.2 percentof total imports from all other sources in 2009. Table C-2 presents U.S. import data for China and Mexico based onquestionnaire responses of 42 firms and U.S. import data for nonsubject sources based on official import statistics ofCommerce.
IV-1

Table IV-1--ContinuedSRC pipe and tube: U.S. importers, source(s) of imports, U.S. headquarters, and shares of importsin 2009
Firm Headquarters
Share of 2009 imports (percent)
China MexicoSubjectsources Other Total
Dayco Mira Loma, CA *** *** *** *** ***
Dial Phoenix, AZ *** *** *** *** ***
Energy SolarProducts
Toa Baja, PR *** *** *** *** ***
Engineered Controls Elon, NC *** *** *** *** ***
GD Copper (U.S.) Ponte VedraBeach, FL
*** *** *** *** ***
Gemaire Deerfield Beach,FL
*** *** *** *** ***
Global Brass Redlands, CA *** *** *** *** ***
Hitachi San Jose, CA *** *** *** *** ***
Homewerks Wheeling, IL *** *** *** *** ***
JMF Bettendorf, IA *** *** *** *** ***
Jones Stephens Moody, AL *** *** *** *** ***
KME Oak Brook, IL *** *** *** *** ***
Kobe Wieland Pine Hall, NC *** *** *** *** ***
Lloyds Pacific Hacienda Heights,CA
*** *** *** *** ***
Luvata Franklin Franklin, KY *** *** *** *** ***
Luvata Grenada Grenada, MS *** *** *** *** ***
Marubeni New York, NY *** *** *** *** ***
MGM Las Vegas, NV *** *** *** *** ***
Modine Racine, WI *** *** *** *** ***
MWI Oceanside, CA *** *** *** *** ***
National Bronze Houston, TX *** *** *** *** ***
Nordyne O’Fallon, MO *** *** *** *** ***
Packless Waco, TX *** *** *** *** ***
Table continued on next page.
IV-2

Table IV-1--ContinuedSRC pipe and tube: U.S. importers, source(s) of imports, U.S. headquarters, and shares of importsin 2009
Panduit Tinley Park, IL *** *** *** *** ***
Pepco Sales Irving, TX *** *** *** *** ***
Refricenter Miami, FL *** *** *** *** ***
Refricentro San Juan, PR *** *** *** *** ***
S.T. Products Duncansville, PA *** *** *** *** ***
Wells Plumbing Chicago, IL *** *** *** *** ***
Wieland Metals Wheeling, IL *** *** *** *** ***
Wolverine Huntsville, ALArdmore, TNShawnee, OKCarrollton, TX
*** *** *** *** ***
Total 100.0 100.0 100.0 100.0 100.0
Note.–Because of rounding, figures may not add to the totals shown.
Source: Compiled from data submitted in response to Commission questionnaires.
U.S. IMPORTS
U.S. import data for China and Mexico are based on official import statistics of Commerce. 3 Table IV-2 presents data for U.S. imports of SRC pipe and tube from China, Mexico, and all othersources. From 2007 to 2009, the quantity of imports of SRC pipe and tube from China increased by 1.3percent and the value decreased by 30.0 percent. The unit value of imports of SRC pipe and tube fromChina decreased by 30.9 percent from 2007 to 2009, and increased by 70.2 percent in interim 2010compared with interim 2009. From 2007 to 2009, the quantity of imports of SRC pipe and tube fromMexico decreased by 36.2 percent and the value decreased by 53.8 percent. The unit value of imports ofSRC pipe and tube from Mexico decreased by 27.7 percent from 2007 to 2009, and increased by 46.4percent in interim 2010 compared with interim 2009. The quantity and value of imports from nonsubjectcountries decreased by 38.8 percent and by 54.9 percent, respectively, from 2007 to 2009, and increasedby 34.3 percent and 113.1 percent, respectively, in interim 2010 compared with interim 2009. The unitvalue of imports of SRC pipe and tube from nonsubject sources decreased by 26.2 percent from 2007 to2009, and increased by 58.6 percent in interim 2010 compared with interim 2009.
Nonsubject imports of SRC pipe and tube are presented in table IV-3. Canada and Malaysia arethe largest nonsubject foreign suppliers of SRC pipe and tube to the United States.4
3 SRC pipe and tube is classifiable in the Harmonized Tariff Schedule of the United States (“HTS”) understatistical reporting numbers 7411.10.1030 or 7411.10.1090. 4 Other major nonsubject suppliers include Korea, Japan, Germany, and Chile.
IV-3

Table IV-2SRC pipe and tube: U.S. imports, by sources, 2007-09, January-June 2009, and January-June 2010
Source
Calendar year January-June
2007 2008 2009 2009 2010
Quantity (1,000 pounds)
China 90,624 111,126 91,768 49,388 28,719
Mexico 75,199 71,327 48,014 31,340 17,183
Subtotal 165,823 182,453 139,782 80,728 45,902
Nonsubject 74,226 64,441 45,426 22,961 30,847
Total 240,049 246,894 185,209 103,689 76,750
Value (1,000 dollars)1
China 348,772 446,282 244,101 110,981 109,860
Mexico 284,287 281,957 131,261 79,376 63,732
Subtotal 633,059 728,238 375,362 190,357 173,592
Nonsubject 292,345 268,218 131,960 57,314 122,111
Total 925,404 996,456 507,321 247,671 295,703
Unit value (per pound)1
China $3.85 $4.02 $2.66 $2.25 $3.83
Mexico 3.78 3.95 2.73 2.53 3.71
Subtotal 3.82 3.99 2.69 2.36 3.78
Nonsubject 3.94 4.16 2.90 2.50 3.96
Average 3.86 4.04 2.74 2.39 3.85
Share of quantity (percent)
China 37.8 45.0 49.5 47.6 37.4
Mexico 31.3 28.9 25.9 30.2 22.4
Subtotal 69.1 73.9 75.5 77.9 59.8
Nonsubject 30.9 26.1 24.5 22.1 40.2
Total 100.0 100.0 100.0 100.0 100.0
Share of value (percent)
China 37.7 44.8 48.1 44.8 37.2
Mexico 30.7 28.3 25.9 32.0 21.6
Subtotal 68.4 73.1 74.0 76.9 58.7
Nonsubject 31.6 26.9 26.0 23.1 41.3
Total 100.0 100.0 100.0 100.0 100.0
1 Landed, U.S. port of entry, duty-paid.
Source: Compiled from data from official Commerce statistics.
IV-4

Table IV-3SRC pipe and tube: U.S. imports from nonsubject countries, by sources, 2007-09, January-June2009, and January-June 2010
Source
Calendar year January-June
2007 2008 2009 2009 2010
Quantity (1,000 pounds)
Canada 17,557 20,016 19,217 8,638 12,410
Malaysia 23,039 15,633 11,974 6,565 8,326
Korea 8,550 8,816 5,469 3,119 5,777
Japan 10,864 4,726 312 195 310
Germany 3,936 3,930 3,243 1,810 1,156
Chile 2,458 3,688 1,419 666 809
United Kingdom 3,651 2,805 2,160 981 553
Greece 2,603 2,486 807 543 113
All other 1,569 2,341 828 443 1,394
Total 74,226 64,441 45,426 22,961 30,847
Value (1,000 dollars)1
Canada 65,556 80,748 56,150 20,721 49,817
Malaysia 89,966 64,082 32,653 15,386 31,859
Korea 32,981 36,266 14,905 7,416 21,248
Japan 42,197 20,908 1,116 627 1,472
Germany 19,134 20,151 11,361 6,006 5,812
Chile 9,433 14,509 4,081 1,603 3,013
United Kingdom 15,080 11,922 6,448 2,491 2,294
Greece 9,958 10,282 2,510 1,736 461
All other 8,040 9,349 2,735 1,328 6,136
Total 292,345 268,218 131,960 57,314 122,111
Unit value (per pound)1
Canada $3.73 $4.03 $2.92 $2.40 4.01
Malaysia 3.90 4.10 2.73 2.34 3.83
Korea 3.86 4.11 2.73 2.38 3.68
Japan 3.88 4.42 3.58 3.21 4.75
Germany 4.86 5.13 3.50 3.32 5.03
Chile 3.84 3.93 2.88 2.41 3.72
United Kingdom 4.13 4.25 2.99 2.54 4.15
Greece 3.83 4.14 3.11 3.20 4.08
All other 5.12 3.99 3.30 3.00 4.40
Average 3.94 4.16 2.90 2.50 3.96
1 Landed, U.S. port of entry, duty-paid.
Source: Compiled from official Commerce statistics.
IV-5
CUMULATION CONSIDERATIONS
In assessing whether subject imports are likely to compete with each other and with the domestic like product with respect to cumulation, the Commission generally has considered the following fourfactors: (1) the degree of fungibility, including specific customer requirements and other quality-relatedquestions; (2) presence of sales or offers to sell in the same geographic markets; (3) common channels ofdistribution; and (4) simultaneous presence in the market. Channels of distribution and fungibility(interchangeability) are discussed in Part II of this report.
Petitioners argue that the Commission should cumulate SRC pipe and tube imports from Chinaand Mexico for its present injury and threat analysis and note that no party has argued the subject importsnot be cumulated for the present injury analysis.5 6 Respondents IUSA/Nacobre do not opposecumulation for the purposes of the Commission’s present injury analysis, but argue that SRC pipe andtube imports from China and Mexico should not be cumulated for the purposes of the Commission’sthreat analysis because “most imports from these two countries are very different, i.e., plumbing tubefrom Mexico versus industrial tube from China, as are other circumstances respecting these imports, suchas the disparate volume trends.”7
Geographic Markets
Table IV-4 presents imports from China by Customs districts from 2007 to 2009, while table IV-5presents imports from Mexico by Customs districts for the same period. Houston-Galveston, TX, was thelargest district of entry for imports from China, accounting for 58.5 percent of total subject imports during2009. New Orleans, LA, was the second largest port, with 11.1 percent of imports from China. Laredo,TX, was the largest district of entry for imports from Mexico, accounting for 88.3 percent of total subjectimports during 2009. El Paso, TX, was the second largest port, with 8.1 percent of subject imports.
5 Petitioners’ posthearing brief, responses to Commission questions, A-24. 6 Petitioners’ posthearing brief, responses to Commission questions, A-27. Petitioners also argue that even if theCommission determines not to cumulate on the basis of threat, the Commission should find that the domesticindustry is threatened with material injury by reason of subject imports from China and Mexico separately. Ibid, A-28. 7 Respondents posthearing brief (IUSA, Nacobre, Cambridge-Lee, and Copper and Brass International), p. 8. IUSA/Nacobre/Cambridge Lee/Copper Brass International do not argue that the Commission should find twoseparate like products. Rather they argue “the divergent volume and pricing trends for these distinct products,imported primarily from different countries, warrant a Commission determination that it would impractical tocumulate subject imports from Mexico with subject imports from China.” Ibid, p. 9.
IV-6

Table IV-4SRC pipe and tube: U.S. imports from China, by Customs district, 2007-09
Customs district
Calendar yearShare of 2009
(percent)2007 2008 2009
Quantity (1,000 pounds)
Baltimore, MD 430 0 0 0.0
Boston, MA 1,062 1,241 667 0.7
Buffalo, NY 603 562 169 0.2
Charleston, SC 0 90 482 0.5
Charlotte, NC 244 237 119 0.1
Chicago, IL 2,025 5,875 5,259 5.7
Cleveland, OH 35 486 25 0.0
Columbia Snake, OR 0 0 9 0.0
Dallas-Fort Worth, TX 7,886 6,871 2,788 3.0
Detroit, MI 753 459 241 0.3
Great Falls, MT 2 139 0 0.0
Honolulu, HI 0 7 0 0.0
Houston-Galveston, TX 47,814 54,124 53,675 58.5
Laredo, TX 43 17 7 0.0
Los Angeles, CA 8,337 5,743 4,767 5.2
Miami, FL 2,724 2,169 530 0.6
Minneapolis, MN 193 1,054 385 0.4
Mobile, AL 623 3,563 2,128 2.3
New Orleans, LA 8,913 12,371 10,186 11.1
New York, NY 1,051 728 1,112 1.2
Nogales, AZ 146 2 4 0.0
Norfolk, VA 434 331 241 0.3
Ogdensburg, NY 30 17 5 0.0
Philadelphia, PA 0 13 0 0.0
San Francisco, CA 95 51 11 0.0
San Juan, PR 139 176 324 0.4
Savannah, GA 5,736 11,845 6,595 7.2
Seattle, WA 127 132 45 0.0
St. Albans, VT 5 0 0 0.0
St. Louis, MO 353 2,509 1,810 2.0
Tampa, FL 819 312 184 0.2
Total 90,624 111,126 91,768 100.0
Source: Compiled from official Commerce statistics.
IV-7

Table IV-5SRC pipe and tube: U.S. imports from Mexico, by Customs district, 2007-09
Customs district
Calendar yearShare of 2009
(percent)2007 2008 2009
Quantity (1,000 pounds)
Chicago, IL 0 1 0 0.0
Cleveland, OH 0 (1) 0 0.0
El Paso, TX 6,038 6,446 3,908 8.1
Laredo, TX 68,623 63,480 42,411 88.3
Los Angeles, CA 0 0 (1) (2)
Miami, FL 184 580 203 0.4
San Diego, CA 1 1 899 1.9
San Juan, PR 353 820 593 1.2
Total 75,199 71,327 48,014 100.0
(1) Less than 500 pounds (2) Less than 0.05 percent
Source: Compiled from official Commerce statistics.
Simultaneous Presence in the Market
SRC pipe and tube produced in China and Mexico was present throughout the period for whichdata were collected. Table IV-6 presents monthly imports into the United States by sources.
IV-8

IV-9
Table IV-6SRC pipe and tube: U.S. imports, monthly entries into the United States, by sources, 2007-09, and January-June 2010
Source Jan. Feb. Mar. Apr. May June July Aug. Sept. Oct. Nov. Dec. Total
2007: Quantity (1,000 pounds)
China 6,095 5,879 8,884 6,882 8,146 11,180 11,256 8,448 6,275 7,715 5,659 4,205 90,624
Mexico 6,623 5,171 8,243 6,858 9,594 6,082 5,811 7,160 5,722 4,651 4,642 4,642 75,199
Subtotal 12,718 11,049 17,127 13,740 17,741 17,262 17,067 15,608 11,998 12,365 10,301 8,847 165,823
All other 5,964 5,964 6,518 5,966 6,077 6,433 7,521 5,698 5,609 5,960 6,500 6,017 74,226
Total 18,681 17,013 23,645 19,707 23,817 23,695 24,588 21,307 17,606 18,325 16,801 14,863 240,049
2008:
China 8,957 7,570 11,533 13,683 13,328 9,368 13,332 12,307 6,553 6,473 4,942 3,079 111,126
Mexico 5,942 6,583 8,855 7,484 5,675 5,570 6,761 6,489 6,129 5,306 2,823 3,710 71,327
Subtotal 14,900 14,152 20,389 21,168 19,003 14,938 20,093 18,795 12,682 11,779 7,765 6,789 182,453
All other 5,009 5,557 6,258 5,794 4,728 5,131 7,460 5,193 5,715 4,275 5,258 4,064 64,441
Total 19,908 19,710 26,646 26,962 23,731 20,069 27,553 23,989 18,396 16,054 13,023 10,853 246,894
2009
China 6,012 6,834 9,989 7,611 8,836 10,107 8,661 8,387 8,172 5,176 5,919 6,065 91,768
Mexico 5,679 4,864 5,575 5,735 5,771 3,717 4,843 3,234 2,933 2,617 1,724 1,323 48,014
Subtotal 11,690 11,698 15,564 13,346 14,607 13,823 13,504 11,622 11,105 7,793 7,642 7,388 139,782
All other 3,981 3,481 3,913 3,179 4,075 4,331 4,015 4,365 3,746 3,656 3,526 3,157 45,426
Total 15,672 15,179 19,477 16,525 18,681 18,155 17,519 15,987 14,851 11,449 11,168 10,545 185,209
2010:
China 7,980 6,515 4,024 7,100 1,974 1,126 (1) (1) (1) (1) (1) (1) 28,719
Mexico 1,381 2,265 2,295 5,623 3,340 2,279 (1) (1) (1) (1) (1) (1) 17,183
Subtotal 9,360 8,780 6,319 12,723 5,314 3,405 (1) (1) (1) (1) (1) (1) 45,902
All other 4,487 2,703 4,865 5,893 5,229 7,670 (1) (1) (1) (1) (1) (1) 30,847
Total 13,848 11,484 11,184 18,616 10,543 11,075 (1) (1) (1) (1) (1) (1) 76,750
1 Not available.
Source: Compiled from official statistics of Commerce.

NEGLIGIBILITY
The statute requires that an investigation be terminated without an injury determination if importsof the subject merchandise are found to be negligible.8 Negligible imports are generally defined in theTariff Act of 1930, as amended, as imports from a country of merchandise corresponding to a domesticlike product where such imports account for less than 3 percent of the volume of all such merchandiseimported into the United States in the most recent 12-month period for which data are available thatprecedes the filing of the petition or the initiation of the investigation. However, if there are imports ofsuch merchandise from a number of countries subject to investigations initiated on the same day thatindividually account for less than 3 percent of the total volume of the subject merchandise, and if theimports from those countries collectively account for more than 7 percent of the volume of all suchmerchandise imported into the United States during the applicable 12-month period, then imports fromsuch countries are deemed not to be negligible.9 Imports from China accounted for 44.7 percent of totalimports of SRC pipe and tube by quantity during September 2008 - August 2009. Imports from Mexicoaccounted for 29.3 percent of total imports of SRC pipe and tube by quantity during September 2008 -August 2009.
APPARENT U.S. CONSUMPTION
Data concerning apparent U.S. consumption of SRC pipe and tube during the period shown intable IV-7 are based on questionnaire responses for U.S. shipments and imports are based on officialCommerce statistics.10 The quantity of apparent U.S. consumption decreased by 29.7 percent from 2007to 2009, and then decreased by 10.4 percent in interim 2010 compared with interim 2009. U.S. demandfor SRC pipe and tube is primarily from new residential construction, new commercial construction, andthe replacement market for air conditioning and refrigeration units.11
8 Sections 703(a)(1), 705(b)(1), 733(a)(1), and 735(b)(1) of the Act (19 U.S.C. §§ 1671b(a)(1), 1671d(b)(1),1673b(a)(1), and 1673d(b)(1)). 9 Section 771(24) of the Act (19 U.S.C. § 1677(24)). 10 In the Commission’s prehearing report, data concerning apparent U.S. consumption data were based onquestionnaire responses from U.S. shipments and imports from China and Mexico and official Commerce statisticsfor imports from all other sources. On September 28, 2010, *** submitted revisions due to the fact that ***. ***. As such, official Commerce statistics were used to calculate apparent U.S. consumption. See also Respondents’post-hearing brief (Golden Dragon), responses to Commissioners’ questions, R-1. 11 Petitioners’ postconference brief, p. 23.
IV-10

Table IV-7SRC pipe and tube: U.S. shipments of domestic product, U.S. imports, and apparent U.S.consumption, 2007-09, January-June 2009, and January-June 2010
Item
Calendar year January-June
2007 2008 2009 2009 2010
Quantity (1,000 pounds)
U.S. producers’ U.S. shipments 752,491 612,032 512,809 277,289 264,741
U.S. imports from–
China 90,624 111,126 91,768 49,388 28,719
Mexico 75,199 71,327 48,014 31,340 17,183
Subtotal 165,823 182,453 139,782 80,728 45,902
Nonsubject countries 74,226 64,441 45,426 22,961 30,847
Total U.S. imports 240,049 246,894 185,209 103,689 76,750
Apparent U.S. consumption 992,540 858,926 698,018 380,978 341,491
Value (1,000 dollars)
U.S. producers’ U.S. shipments 3,033,910 2,578,115 1,602,849 768,352 1,070,821
U.S. imports from--
China 348,772 446,282 244,101 110,981 109,860
Mexico 284,287 281,957 131,261 79,376 63,732
Subtotal 633,059 728,238 375,362 190,357 173,592
Nonsubject countries 292,345 268,218 131,960 57,314 122,111
Total U.S. imports 925,404 996,456 507,321 247,671 295,703
Apparent U.S. consumption 3,959,314 3,574,571 2,110,170 1,016,023 1,366,524
Note.–Because of rounding, figures may not add to the totals shown.
Source: Compiled from data submitted in response to Commission questionnaires and official Commerce statistics.
IV-11

U.S. MARKET SHARES
U.S. market share data are presented in table IV-8. U.S. producers’ market share decreased by2.3 percentage points from 2007 to 2009, on the basis of quantity, and was 4.7 percentage points higher ininterim 2010 compared with interim 2009.
Table IV-8SRC pipe and tube: U.S. consumption and market shares, 2007-09, January-June 2009, andJanuary-June 2010
Item
Calendar year January-June
2007 2008 2009 2009 2010
Quantity (1,000 pounds)
Apparent U.S. consumption 992,540 858,926 698,018 380,978 341,491
Value (1,000 dollars)
Apparent U.S. consumption 3,959,314 3,574,571 2,110,170 1,016,023 1,366,524
Share of quantity (percent)
U.S. producers’ U.S. shipments 75.8 71.3 73.5 72.8 77.5
U.S. imports from--
China 9.1 12.9 13.2 13.0 8.4
Mexico 7.6 8.3 6.9 8.2 5.0
Subtotal 16.7 21.2 20.0 21.2 13.4
Nonsubject countries 7.5 7.5 6.5 6.0 9.0
All countries 24.2 28.7 26.5 27.2 22.5
Share of value (percent)
U.S. producers’ U.S. shipments 76.6 72.1 76.0 75.6 78.4
U.S. imports from--
China 8.8 12.5 11.6 10.9 8.0
Mexico 7.2 7.9 6.2 7.8 4.7
Subtotal 16.0 20.4 17.8 18.7 12.7
Nonsubject countries 7.4 7.5 6.3 5.6 8.9
All countries 23.4 27.9 24.0 24.4 21.6
Note.–Because of rounding, figures may not add to the totals shown.
Source: Compiled from data submitted in response to Commission questionnaires and official Commerce statistics.
IV-12
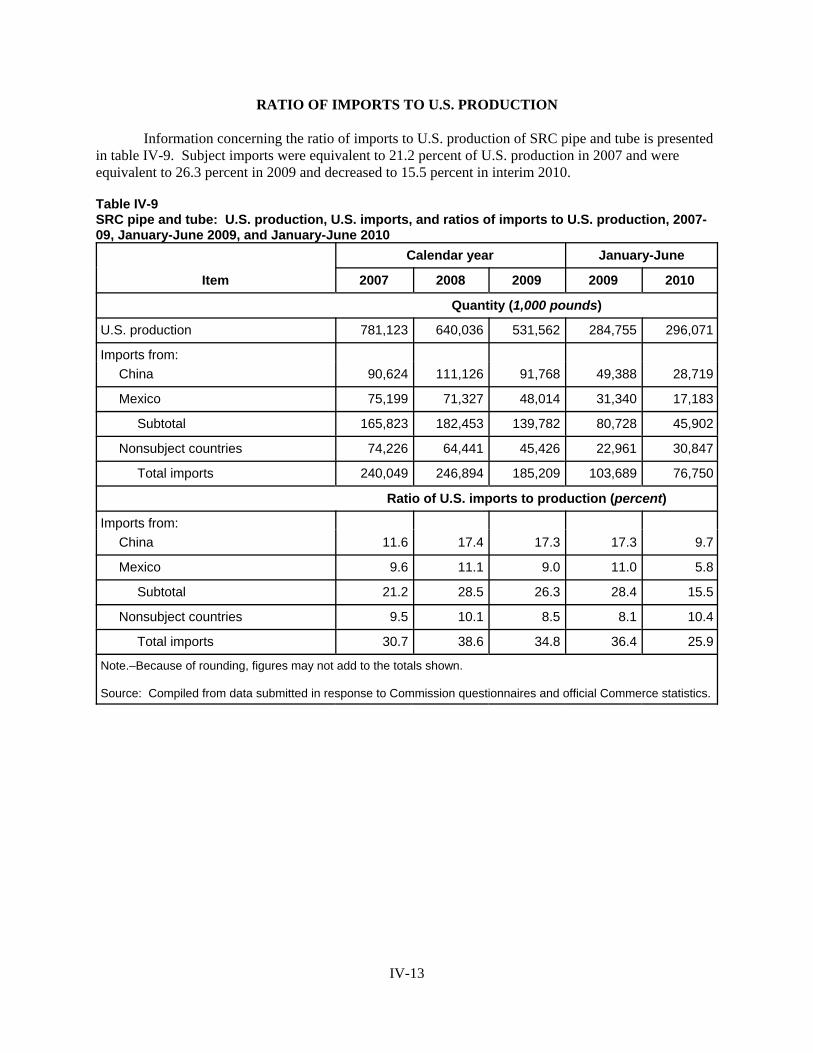
RATIO OF IMPORTS TO U.S. PRODUCTION
Information concerning the ratio of imports to U.S. production of SRC pipe and tube is presentedin table IV-9. Subject imports were equivalent to 21.2 percent of U.S. production in 2007 and wereequivalent to 26.3 percent in 2009 and decreased to 15.5 percent in interim 2010.
Table IV-9SRC pipe and tube: U.S. production, U.S. imports, and ratios of imports to U.S. production, 2007-09, January-June 2009, and January-June 2010
Item
Calendar year January-June
2007 2008 2009 2009 2010
Quantity (1,000 pounds)
U.S. production 781,123 640,036 531,562 284,755 296,071
Imports from:
China 90,624 111,126 91,768 49,388 28,719
Mexico 75,199 71,327 48,014 31,340 17,183
Subtotal 165,823 182,453 139,782 80,728 45,902
Nonsubject countries 74,226 64,441 45,426 22,961 30,847
Total imports 240,049 246,894 185,209 103,689 76,750
Ratio of U.S. imports to production (percent)
Imports from:
China 11.6 17.4 17.3 17.3 9.7
Mexico 9.6 11.1 9.0 11.0 5.8
Subtotal 21.2 28.5 26.3 28.4 15.5
Nonsubject countries 9.5 10.1 8.5 8.1 10.4
Total imports 30.7 38.6 34.8 36.4 25.9
Note.–Because of rounding, figures may not add to the totals shown.
Source: Compiled from data submitted in response to Commission questionnaires and official Commerce statistics.
IV-13


PART V: PRICING AND RELATED INFORMATION
FACTORS AFFECTING PRICES
Raw Material Costs
Raw material costs accounted for 78 to 86 percent of the total cost of goods sold for U.S.producers during 2007 to 2009. Copper is the main raw material used to produce SRC pipe and tube. One U.S. producer (***) indicated that copper makes up 80 percent of the cost of the SRC pipe and tube. The COMEX price of copper has fluctuated since 2007 ranging from $1.39 per pound to $3.94 per pound(see figure V-1).
Figure V-1SRC pipe and tube: Monthly average COMEX high-grade copper, first position prices, by month,January 2007-August 2010
Source: Platt’s Metal Week and USGS.
U.S. Inland Transportation Costs
Transportation costs for U.S. inland shipments of SRC pipe and tube generally account for asmall-to-moderate share of the delivered price of these products. U.S. producers reported that the costsranged from less than 1 percent to 3 percent of the delivered price for SRC pipe and tube. Over two-thirds of responding U.S. importers reported that such costs were less than or equal to 1 percent of thedelivered price of SRC pipe and tube; while most of the remaining firms reported costs of less than 10percent.1
1 However, importer *** reported that transportation costs made up 50 percent of the delivered price.
V-1

PRICING PRACTICES
Pricing Methods
Most U.S. producers and importers reported making sales of plumbing tube on a spot basis. Allsix responding U.S. producers and five of eight responding importers reported making all or almost all oftheir sales of plumbing tube on a spot basis. Petitioners indicate that plumbing tube products are typicallysold on a spot basis using a price list and a multiplier that applies equally to all list prices on a given pricesheet. They note that a supplier may bid for a total volume without knowing which products from itsprice list the customer will select.2
The largest U.S. producers and importers of product from China reported making most of theirsales of industrial tube using short- or long-term contracts, while the largest importer of product fromMexico reported making all its sales of industrial tube on a spot basis. The three petitioners reportedmaking at least 65 percent of their sales of industrial tube using short- or long-term contracts. The twolargest importers of product from China reported making at least 95 percent of their sales of industrialtube using short- or long-term contracts, while the largest importer of product from Mexico reportedmaking all of its sales of industrial tube on a spot basis. Overall, three of 11 responding U.S. producersand seven of 26 responding importers reported making at least 90 percent of their sales of industrial tubeusing either short- or long-term contracts. Three U.S. producers (***) and 11 importers indicated thatthey make at least 99 percent of their sales of industrial tube on a spot basis. Petitioners indicated thatSRC pipe and tube sold to industrial end users is typically sold using annual contracts with prices quotedon the basis of the COMEX copper price plus a per-pound fabrication charge. They note that under theseannual contracts SRC pipe and tube producers generally compete based on the quoted fabrication chargewith the understanding that the COMEX price will adjust depending upon the date(s) of shipment.3 Oneof four U.S. producers and four of seven importers reported that their long-term contracts use metal coststhat are based on a benchmark and are sold for plumbing applications. Four of six U.S. producers andfive of 12 importers indicated that this was also the case for short-term contracts. In addition, two of 12responding importers indicated that their short-term contracts use metal costs that are based on abenchmark and are sold for both plumbing and industrial applications. U.S. producers reported using theCOMEX price as a benchmark, while importers reported using both the COMEX and LME prices.
Only three of 10 responding U.S. producers and six of 32 responding importers indicated that thequotation period of their copper purchases influence their selling prices of SRC pipe and tube. U.S.producer *** indicated that the longer the quotation period, the lower their selling price. Seven of 10responding U.S. producers and 10 of 30 responding importers offer hedging transactions that might lockthe copper price for long periods of time. Responses suggest that some U.S. producers and importers mayoffer hedging only to larger customers for limited periods of time such as one month or a year. Eight of10 responding U.S. producers and 13 of 27 responding importers indicated that variations or changes inthe COMEX, LME, or other copper benchmarks affect their overall prices lists.
Most firms reported setting prices on a transaction-by-transaction basis, although some firms alsouse price lists or contracts for multiple shipments. The seven U.S. producers that reported their method ofprice setting for sales of SRC pipe and tube for plumbing applications reported using transaction-by-transaction negotiations; three of these U.S. producers also reported using contracts, three also reportedusing price lists, and one also reported the use of e-auctions. With regard to sales for industrialapplications, seven of eight responding U.S. producers reported using transaction-by-transactionnegotiations, five reported using contracts, and one reported using price lists. Among importers reportingmethods of price setting for plumbing applications, nine reported using transaction-by-transaction
2 Petition, p. 38.
3 Petition, p. 39.
V-2
negotiations, two reported using contracts, three reported using price lists, and two reported othermethods. Among importers reporting methods of price setting for industrial applications, 15 reportedusing transaction-by-transaction negotiations, six reported using contracts, five reported using price lists,and one reported other methods. Four of 10 responding U.S. producers and 16 of 29 responding importers reported making theirsales on a delivered basis only. Five U.S. producers and six importers reported making their sales on anf.o.b. basis only and the remaining responding U.S. producer and three importers reported making theirsales on both f.o.b. and delivered bases. Five of nine responding U.S. producers and 14 of 30 importersreported that at least 90 percent of their sales of SRC pipe and tube are made to order. Three of nineresponding U.S. producers and 11 of 30 importers reported that at least 88 percent of their sales are frominventory.
Six of 11 responding U.S. producers and 12 of 26 responding importers reported making at least90 percent of their sales on a spot basis. Five importers reported making at least 90 percent of their saleson a short-term contract basis, which typically last for 4 months to a year. Three importers (***) reportedmaking at least 60 percent of their sales on a long-term contact basis, although *** defined long-termcontacts as “one year and longer” in length and *** defined them as one year in length. One U.S.producer (***) reported making 53 percent of its sales on a short-term contract basis, 35 percent of itssales on a spot basis, and 12 percent of its sales on a long-term (two to three years) contract basis. U.S.producer *** reported making 60 percent of its sales on a short-term contract basis and 35 percent of itssales on a long-term (two years) contract basis.
Sixteen responding purchasers identified price leaders in the market for SRC copper pipe andtube, four responding purchasers indicated there were no price leaders, and three purchasers indicated thatthey did not know if there were any price leaders. *** was named by 11 purchasers as a price leader, ***was named by eight purchasers, *** was named by three purchasers, *** was named by two purchasersand seven other suppliers were mentioned by one purchaser. Purchaser *** indicated that it does not seeany clear suppliers emerging as a “price leader,” but that their competitive bench marking has shown thattypically suppliers are clustered around a fairly narrow band of pricing. Purchaser *** indicated that ithas no interest in the “price leader mentality/business model” and focuses on quality, delivery,technology, and total cost. Cambridge-Lee and Copper and Brass identify Mueller and Cerro as the priceleaders in the U.S. market.4 Cambridge-Lee and Marubeni both deny being price leaders for SRC copperpipe and tube.5
Lead Times
U.S. producers reported lead times from inventory of up to two weeks and lead times for sales ofproduct-to-order of two to six weeks. Lead times for delivery for all but two responding U.S. importersranged up to two weeks on sales from inventory and most importers reported lead times on sales ofproduct produced-to-order ranging from 2 to 16 weeks. Six of 10 responding U.S. producers and 24 of 32responding importers reported that they generally arrange for the transportation to their customers’locations. All 10 responding U.S. producers and 14 of 30 responding importers reported making at least47 percent of their sales within 101 to 1,000 miles of their storage or production facilities. No U.S.producers and three responding importers reported making at least 79 percent of their sales over 1,000miles from their storage or production facilities and all responding U.S. producers and 25 respondingimporters reported making at least 49 percent of their sales within 1,000 miles of their storage orproduction facilities.
4 Hearing transcript, p. 183 (Kelly), p. 185 (Kerins).
5 Hearing transcript, p. 168 (Krahmer), p. 185 (Kelly).
V-3

Sales Terms and Discounts
Eight U.S. producers and 12 importers reported the use of quantity discounts, five U.S. producersand three importers reported using annual volume discounts, and two U.S. producers and 15 importersreported having no discount policy. Five of 10 responding U.S. producers and five of 30 respondingimporters indicated that their company has a rebate program for at least some of their purchasers of SRCpipe and tube. U.S. producers and importers indicated that rebates ranged up to 5 percent.
PRICE DATA
The Commission requested U.S. producers and importers of SRC pipe and tube to providequarterly data for the total quantity and f.o.b. value of SRC pipe and tube that was shipped to unrelatedcustomers in the U.S. market during January 2007-June 2010. The products for which pricing data wererequested are as follows:
Product 1.– Seamless refined copper pipe and tube, ½" Type L, hard temper, 20' lengths
Product 2.– Seamless refined copper pipe and tube, 3/4" Type M, hard temper, 20' lengths
Product 3.– Seamless refined copper pipe and tube, 3/8" OD, ACR/RST coil, 50'-100' lengths
Product 4.– Seamless refined copper pipe and tube, 3/4" OD, ACR/RST coil, 50'-100' lengths
Product 5.– Seamless refined copper pipe and tube, 3/8" OD, inner-grooved LWC,0.0110"-0.0144" bottom wall thickness
Product 6.– Seamless refined copper pipe and tube, 5/16" OD, inner grooved LWC,0.01170-0.0125" bottom wall thickness
Product 7.– Seamless refined copper pipe and tube, 3/8" OD, smooth bore LWC,0.0249"-0.0327" bottom wall thickness
Product 8.– Seamless refined copper pipe and tube, 3/4" OD, smooth bore LWC,0.0327"-0.0430" bottom wall thickness
Eight U.S. producers, 13 importers of SRC pipe and tube from China, and eight importers of SRCpipe and tube from Mexico provided usable pricing data for sales of the requested products, although notall firms reported pricing for all products for all quarters. Pricing data reported by these firms accountedfor approximately 11 percent of U.S. producers’ shipments of SRC pipe and tube, 81 percent of U.S.shipments of subject imports from China, and 17 percent of U.S. shipments of subject imports fromMexico in 2009.
Price Trends
Price data are shown in tables V-1 to V-8 and figure V-2. Nonsubject price data are presented inappendix G. Price trend summary data are presented in table V-9. Weighted-average sales prices for
V-4

Table V-1SRC pipe and tube: Weighted-average f.o.b. prices and quantities of domestic and importedproduct 11 and margins of underselling/(overselling), by quarters, January 2007-June 2010
Period
United States China Mexico
Price (per
pound)Quantity(pounds)
Price (per
pound)Quantity(pounds)
Margin(percent)
Price (per
pound)Quantity(pounds)
Margin(percent)
2007: Jan.-Mar. $3.32 6,373,523 -- 0 -- $*** *** ***
Apr.-June 4.27 6,836,605 $*** *** *** *** *** ***
July-Sept. 4.36 3,752,329 *** *** *** *** *** ***
Oct.-Dec. 4.04 4,245,997 *** *** *** *** *** ***
2008: Jan.-Mar. 3.94 5,361,700 *** *** *** *** *** ***
Apr.-June 4.41 3,912,587 *** *** *** *** *** ***
July-Sept. 4.11 3,965,318 *** *** *** *** *** ***
Oct.-Dec. 2.89 3,282,253 -- 0 – *** *** ***
2009: Jan.-Mar. 2.19 3,661,633 *** *** *** *** *** ***
Apr.-June 2.50 3,788,433 *** *** *** *** *** ***
July-Sept. 3.02 3,215,782 -- 0 -- *** *** ***
Oct.-Dec. 3.27 2,798,012 *** *** *** *** *** ***
2010: Jan.-Mar. 3.51 3,280,150 -- 0 -- *** *** ***
Apr.-June 3.40 3,297,868 -- 0 -- *** *** ***
1 Product 1: Seamless refined copper pipe and tube, ½" Type L, hard temper, 20' lengths.
Source: Compiled from data submitted in response to Commission questionnaires.
V-5

Table V-2SRC pipe and tube: Weighted-average f.o.b. prices and quantities of domestic and importedproducts 21 and margins of underselling/(overselling), by quarters, January 2007-June 2010
Period
United States China Mexico
Price (per
pound)Quantity(pounds)
Price (per
pound)Quantity(pounds)
Margin(percent)
Price (per
pound)Quantity(pounds)
Margin(percent)
2007: Jan.-Mar. $3.26 3,424,664 -- 0 -- $*** *** ***
Apr.-June 4.17 4,071,349 -- 0 -- *** *** ***
July-Sept. 4.28 3,068,029 -- 0 -- *** *** ***
Oct.-Dec. 3.96 2,254,224 -- 0 -- *** *** ***
2008: Jan.-Mar. 3.93 2,261,843 -- 0 -- *** *** ***
Apr.-June 4.35 1,791,320 $*** *** *** *** *** ***
July-Sept. 4.02 1,898,740 -- 0 -- *** *** ***
Oct.-Dec. 2.93 1,334,630 -- 0 -- *** *** ***
2009: Jan.-Mar. 2.16 1,228,243 *** *** *** *** *** ***
Apr.-June 2.50 1,087,142 *** *** *** *** *** ***
July-Sept. 3.03 1,283,783 -- 0 -- *** *** ***
Oct.-Dec. 3.25 1,476,378 -- 0 -- *** *** ***
2010: Jan.-Mar. 3.50 1,542,453 -- 0 -- *** *** ***
Apr.-June 3.42 1,554,454 -- 0 -- *** *** ***
1 Product 2: Seamless refined copper pipe and tube, 3/4" Type M, hard temper, 20' lengths. Source: Compiled from data submitted in response to Commission questionnaires.
V-6

Table V-3SRC pipe and tube: Weighted-average f.o.b. prices and quantities of domestic and importedproducts 31 and margins of underselling/(overselling), by quarters, January 2007-June 2010
Period
United States China Mexico
Price (per
pound)Quantity(pounds)
Price (per
pound)Quantity(pounds)
Margin(percent)
Price (per
pound)Quantity(pounds)
Margin(percent)
2007: Jan.-Mar. $3.61 2,269,309 $*** *** *** $*** *** ***
Apr.-June 4.69 3,068,659 4.74 179,449 (1.1) *** *** ***
July-Sept. 4.68 2,000,059 4.56 167,342 2.6 *** *** ***
Oct.-Dec. 4.42 1,873,448 *** *** *** *** *** ***
2008: Jan.-Mar. 4.40 1,900,957 4.59 159,967 (4.3) *** *** ***
Apr.-June 4.87 1,940,883 4.60 339,881 5.4 *** *** ***
July-Sept. 4.68 1,658,448 4.47 232,848 4.4 *** *** ***
Oct.-Dec. 3.50 1,299,268 4.16 270,663 (19.0) *** *** ***
2009: Jan.-Mar. 2.47 1,382,492 2.29 273,256 7.2 *** *** ***
Apr.-June 2.80 1,213,539 2.60 254,075 7.4 *** *** ***
July-Sept. 3.33 1,134,195 3.28 169,335 1.7 *** *** ***
Oct.-Dec. 3.66 1,354,540 3.87 92,385 (5.8) *** *** ***
2010: Jan.-Mar. 4.06 1,427,314 *** *** *** *** *** ***
Apr.-June 3.96 1,782,679 *** *** *** *** *** ***
1 Product 3: Seamless refined copper pipe and tube, 3/8" OD, ACR/RST coil, 50'-100' lengths. Source: Compiled from data submitted in response to Commission questionnaires.
V-7

Table V-4SRC pipe and tube: Weighted-average f.o.b. prices and quantities of domestic and importedproducts 41 and margins of underselling/(overselling), by quarters, January 2007-June 2010
Period
United States China Mexico
Price (per
pound)Quantity(pounds)
Price (per
pound)Quantity(pounds)
Margin(percent)
Price (per
pound)Quantity(pounds)
Margin(percent)
2007: Jan.-Mar. $3.36 1,739,325 $4.14 55,434 (23.2) $*** *** ***
Apr.-June 4.33 2,458,151 4.21 207,501 3.0 *** *** ***
July-Sept. 4.33 1,354,142 *** *** *** *** *** ***
Oct.-Dec. 4.04 1,217,006 *** *** *** *** *** ***
2008: Jan.-Mar. 4.15 1,422,224 4.07 231,963 1.8 *** *** ***
Apr.-June 4.53 1,670,846 4.81 268,556 (6.1) *** *** ***
July-Sept. 4.34 1,322,794 4.78 216,967 (10.0) *** *** ***
Oct.-Dec. 3.28 888,789 *** *** *** *** *** ***
2009: Jan.-Mar. 2.30 1,067,639 2.31 273,202 (0.7) *** *** ***
Apr.-June 2.73 942,580 2.80 249,413 (2.5) *** *** ***
July-Sept. 3.26 804,493 3.22 169,222 1.4 *** *** ***
Oct.-Dec. 3.71 524,354 *** *** *** *** *** ***
2010: Jan.-Mar. 3.67 954,025 *** *** *** *** *** ***
Apr.-June 4.00 1,388,405 *** *** *** -- 0 --
1 Product 4: Seamless refined copper pipe and tube, 3/4" OD, ACR/RST coil, 50'-100' lengths.
Source: Compiled from data submitted in response to Commission questionnaires.
V-8
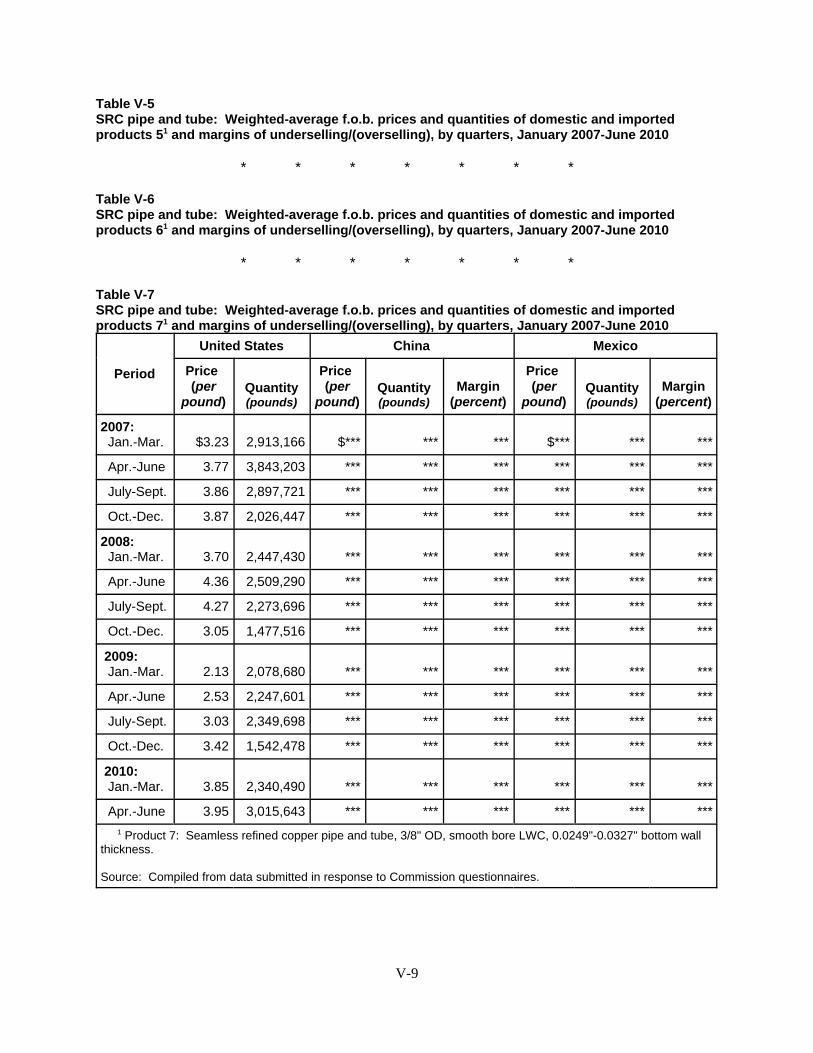
Table V-5SRC pipe and tube: Weighted-average f.o.b. prices and quantities of domestic and importedproducts 51 and margins of underselling/(overselling), by quarters, January 2007-June 2010
* * * * * * *
Table V-6SRC pipe and tube: Weighted-average f.o.b. prices and quantities of domestic and importedproducts 61 and margins of underselling/(overselling), by quarters, January 2007-June 2010
* * * * * * *
Table V-7SRC pipe and tube: Weighted-average f.o.b. prices and quantities of domestic and importedproducts 71 and margins of underselling/(overselling), by quarters, January 2007-June 2010
Period
United States China Mexico
Price (per
pound)Quantity(pounds)
Price (per
pound)Quantity(pounds)
Margin(percent)
Price (per
pound)Quantity(pounds)
Margin(percent)
2007: Jan.-Mar. $3.23 2,913,166 $*** *** *** $*** *** ***
Apr.-June 3.77 3,843,203 *** *** *** *** *** ***
July-Sept. 3.86 2,897,721 *** *** *** *** *** ***
Oct.-Dec. 3.87 2,026,447 *** *** *** *** *** ***
2008: Jan.-Mar. 3.70 2,447,430 *** *** *** *** *** ***
Apr.-June 4.36 2,509,290 *** *** *** *** *** ***
July-Sept. 4.27 2,273,696 *** *** *** *** *** ***
Oct.-Dec. 3.05 1,477,516 *** *** *** *** *** ***
2009: Jan.-Mar. 2.13 2,078,680 *** *** *** *** *** ***
Apr.-June 2.53 2,247,601 *** *** *** *** *** ***
July-Sept. 3.03 2,349,698 *** *** *** *** *** ***
Oct.-Dec. 3.42 1,542,478 *** *** *** *** *** ***
2010: Jan.-Mar. 3.85 2,340,490 *** *** *** *** *** ***
Apr.-June 3.95 3,015,643 *** *** *** *** *** ***
1 Product 7: Seamless refined copper pipe and tube, 3/8" OD, smooth bore LWC, 0.0249"-0.0327" bottom wallthickness.
Source: Compiled from data submitted in response to Commission questionnaires.
V-9

Table V-8SRC pipe and tube: Weighted-average f.o.b. prices and quantities of domestic and importedproducts 81 and margins of underselling/(overselling), by quarters, January 2007-June 2010
Period
United States China Mexico
Price (per
pound)Quantity(pounds)
Price (per
pound)Quantity(pounds)
Margin(percent)
Price (per
pound)Quantity(pounds)
Margin(percent)
2007: Jan.-Mar. $*** *** - 0 - $*** *** ***
Apr.-June 3.36 1,597,201 - 0 - *** *** ***
July-Sept. 3.68 1,322,295 - 0 - *** *** ***
Oct.-Dec. 3.68 904,853 - 0 - *** *** ***
2008: Jan.-Mar. 3.56 1,078,742 - 0 - *** *** ***
Apr.-June 4.15 1,311,172 $*** *** *** *** *** ***
July-Sept. 4.20 1,215,610 *** *** *** *** *** ***
Oct.-Dec. 3.40 796,190 *** *** *** *** *** ***
2009: Jan.-Mar. 2.23 1,073,860 *** *** *** *** *** ***
Apr.-June 2.31 1,447,346 3.59 52,105 (55.5) *** *** ***
July-Sept. 2.80 1,092,576 3.04 63,057 (8.6) *** *** ***
Oct.-Dec. 3.13 783,508 3.31 26,062 (5.8) *** *** ***
2010: Jan.-Mar. 3.65 1,313,408 *** *** *** *** *** ***
Apr.-June 3.73 1,921,574 *** *** *** *** *** ***
1 Product 8: Seamless refined copper pipe and tube, 3/4" OD, smooth bore LWC, 0.0327"-0.0430" bottom wallthickness.
Source: Compiled from data submitted in response to Commission questionnaires.
Figure V-2SRC pipe and tube: Weighted-average f.o.b. prices and quantities of domestic and importedproduct, by quarters, January 2007-June 2010
* * * * * *
V-10

Table V-9SRC pipe and tube: Summary of weighted-average f.o.b. prices for products 1-8 from the UnitedStates, China, and Mexico
ItemNumber ofquarters
Low price (per ton)
High price(per ton)
Change in price1
(percent)
Product 1
United States 14 $2.19 $4.41 2.4
China 9 1.96 4.70 26.0
Mexico 14 2.14 4.30 5.2
Product 2
United States 14 2.16 4.35 5.1
China 3 2.98 6.60 -54.9
Mexico 14 2.13 4.99 12.1
Product 3
United States 14 2.47 4.87 9.7
China 14 2.29 4.74 -4.1
Mexico 14 2.52 4.70 6.3
Product 4
United States 14 2.30 4.53 19.0
China 14 2.31 4.81 ***
Mexico 13 2.34 4.44 19.1
Product 5
United States 14 2.28 4.49 14.7
China 14 2.32 4.48 17.6
Mexico 4 3.72 4.25 -5.7
Product 6
United States 14 2.32 4.71 9.9
China 15 2.48 4.60 3.9
Mexico 3 3.90 4.34 -5.3
Product 7
United States 14 2.13 4.36 22.3
China 14 2.42 4.23 0.9
Mexico 14 2.19 4.21 9.0
Product 8
United States 14 2.23 4.20 ***
China 9 3.04 5.63 39.3
Mexico 14 2.27 4.30 17.8 1 Percentage change from the first quarter in which price data were available to the last quarter in which price datawere available, based on unrounded data.
Source: Compiled from data submitted in response to Commission questionnaires.
V-11

U.S.-produced products 1-8 increased by 2.4 to 22.3 percent. Weighted average sales prices of products 2and 3 imported from China decreased by 4.1 to 54.9 percent, respectively, and prices of other productsincreased by 0.9 to 39.3 percent. Weighted average sales prices of products 5 and 6 imported fromMexico decreased by 5.7 and 5.3 percent respectively and prices of other products increased by 5.2 to19.1 percent.
Price Comparisons
Margins of underselling and overselling for the period are presented in table V-10. As can beseen from the table, prices for SRC pipe and tube imported from China were below those for U.S.-produced SRC pipe and tube in 43 of 91 instances; margins of underselling ranged from 0.9 to 27.6 percent. In the remaining 48 instances, prices for SRC pipe and tube imported from China were abovethose for U.S.-produced SRC pipe and tube; margins of overselling ranged from 0.3 to 128.8 percent.Prices for SRC pipe and tube imported from Mexico were below those for U.S.-produced SRC pipe andtube in 53 of 90 instances; margins of underselling ranged from 0.0 to 23.3 percent. In the remaining 37instances, prices for SRC pipe and tube imported from Mexico were above those for U.S.-produced SRCpipe and tube; margins of overselling ranged from 0.0 to 25.7 percent.
With the exception of reported sales of Chinese imports for products 3 and 4 by *** and reportedsales of Chinese and Canadian imports of product 7 by ***, most U.S. producers and importers reportedsales of products 1-4 for plumbing applications and sales of products 5-8 for industrial applications.6 U.S.producers reported sales of all eight price products for industrial applications and sales of products 1-4, 7,and 8 for plumbing applications. However, at least 97 percent of reported sales by U.S. producers ofproducts 1-4 were for plumbing applications and sales of product 5-8 were for industrial applications. Likewise, over 90 percent of reported sales of Mexican imports of products 1-4 were for plumbingapplications and all reported sales of imports from Mexico of products 5-8 were for industrialapplications. All reported sales of Malaysia imports of product 5 were reported for industrial uses.
Table V-10SRC pipe and tube: Instances of underselling/overselling and the range and average of margins,January 2007-June 2010
Source
Underselling Overselling
Number ofinstances
Range(percent)
Averagemargin
(percent)Number ofinstances
Range(percent)
Averagemargin
(percent)
China 43 0.9 to 27.6 7.9 48 0.3 to 128.8 17.6
Mexico 53 0.0 to 23.3 3.6 37 0.0 to 25.7 5.9
Total 96 0.0 to 27.6 5.5 85 0.0 to 128.8 12.5
Source: Compiled from data submitted in response to Commission questionnaires.
Importers reported sales of imports from China of products 1 and 3-8 for industrial applications,and sales of products 1-4 and 7 for plumbing applications. Reported sales for industrial applications ofimports from China for products 1, 3 and 4 accounted for 3 percent, *** percent, and *** percent of salesof those products, respectively. However, ***. For sales of Chinese imports of product 7, ***. *** also
6 Importers ***.
V-12
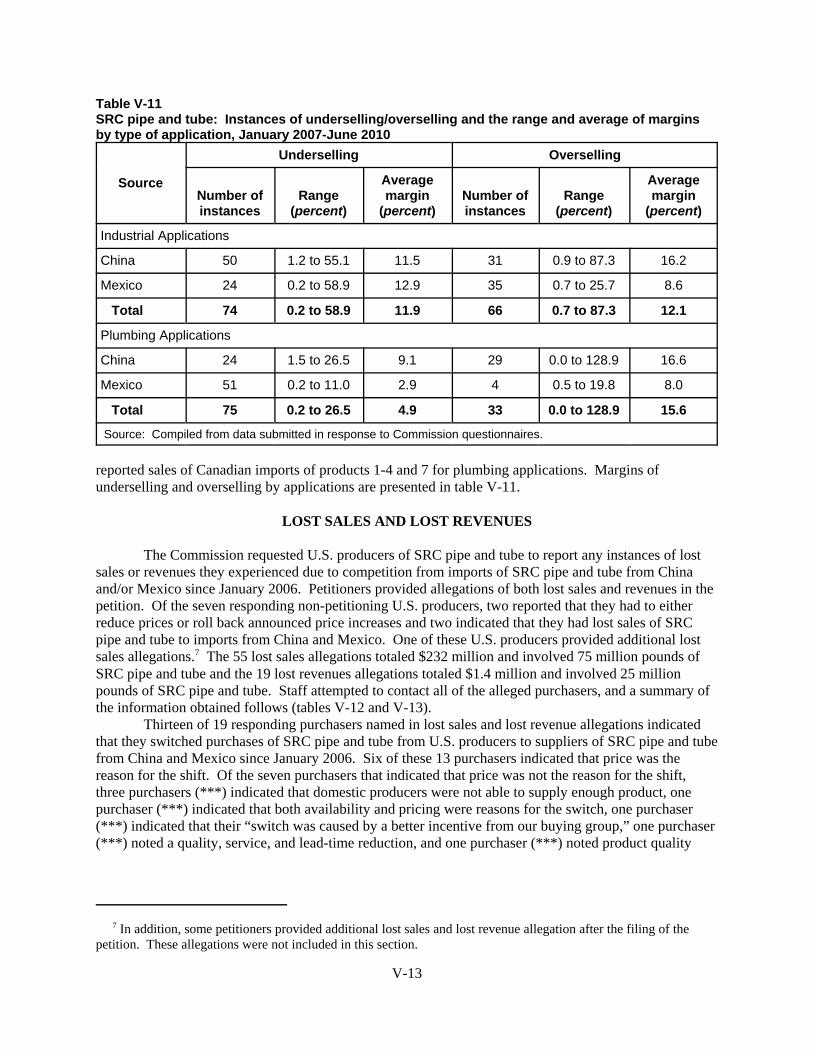
Table V-11SRC pipe and tube: Instances of underselling/overselling and the range and average of marginsby type of application, January 2007-June 2010
Source
Underselling Overselling
Number ofinstances
Range(percent)
Averagemargin
(percent)Number ofinstances
Range(percent)
Averagemargin
(percent)
Industrial Applications
China 50 1.2 to 55.1 11.5 31 0.9 to 87.3 16.2
Mexico 24 0.2 to 58.9 12.9 35 0.7 to 25.7 8.6
Total 74 0.2 to 58.9 11.9 66 0.7 to 87.3 12.1
Plumbing Applications
China 24 1.5 to 26.5 9.1 29 0.0 to 128.9 16.6
Mexico 51 0.2 to 11.0 2.9 4 0.5 to 19.8 8.0
Total 75 0.2 to 26.5 4.9 33 0.0 to 128.9 15.6
Source: Compiled from data submitted in response to Commission questionnaires.
reported sales of Canadian imports of products 1-4 and 7 for plumbing applications. Margins ofunderselling and overselling by applications are presented in table V-11.
LOST SALES AND LOST REVENUES
The Commission requested U.S. producers of SRC pipe and tube to report any instances of lostsales or revenues they experienced due to competition from imports of SRC pipe and tube from Chinaand/or Mexico since January 2006. Petitioners provided allegations of both lost sales and revenues in thepetition. Of the seven responding non-petitioning U.S. producers, two reported that they had to eitherreduce prices or roll back announced price increases and two indicated that they had lost sales of SRCpipe and tube to imports from China and Mexico. One of these U.S. producers provided additional lostsales allegations.7 The 55 lost sales allegations totaled $232 million and involved 75 million pounds ofSRC pipe and tube and the 19 lost revenues allegations totaled $1.4 million and involved 25 millionpounds of SRC pipe and tube. Staff attempted to contact all of the alleged purchasers, and a summary ofthe information obtained follows (tables V-12 and V-13).
Thirteen of 19 responding purchasers named in lost sales and lost revenue allegations indicatedthat they switched purchases of SRC pipe and tube from U.S. producers to suppliers of SRC pipe and tubefrom China and Mexico since January 2006. Six of these 13 purchasers indicated that price was thereason for the shift. Of the seven purchasers that indicated that price was not the reason for the shift,three purchasers (***) indicated that domestic producers were not able to supply enough product, onepurchaser (***) indicated that both availability and pricing were reasons for the switch, one purchaser(***) indicated that their “switch was caused by a better incentive from our buying group,” one purchaser(***) noted a quality, service, and lead-time reduction, and one purchaser (***) noted product quality
7 In addition, some petitioners provided additional lost sales and lost revenue allegation after the filing of thepetition. These allegations were not included in this section.
V-13

Table V-12SRC pipe and tube: U.S. producers’ lost sales allegations
* * * * * * *
Table V-13SRC pipe and tube: U.S. producers’ lost revenue allegations
* * * * * * *
and performance. Four of 13 responding purchasers (***) named in lost sales and lost revenueallegations indicated that U.S. producers reduced their prices of SRC pipe and tube in order to compete with prices of SRC pipe and tube from China or Mexico since January 2006. Three purchasers indicatedthat they were not certain if U.S. producers lowered their prices during this time period to compete withprice of SRC pipe and tube from China or Mexico.
Purchasers specifically “agreed” with lost sales allegations totaling $34 million and lost revenueallegations totaling $19 thousand. The allegations that were “agreed” with represent 15 percent of thevalue of all lost sales allegations and 1 percent of the value of all lost revenue allegations made by U.S.producers. Purchasers specifically “disagreed” with lost sales allegations totaling $184 million and lostrevenue allegations totaling $818 thousand. The allegations that were “disagreed” with represent 79percent of the value of all lost sales allegations and 57 percent of the value of all lost revenue allegations. Purchasers did not specifically “agree” or “disagree” with lost sales allegations totaling $10 million andlost revenue allegations totaling $583 thousand, but provided narrative responses that are summarized onthe following pages. These allegations represent 4 percent of the value of all lost sales allegations and 41percent of the value of all lost revenue allegations.
*** disagreed with the *** lost sales allegations made against his company. *** indicated thatthe accepted quote for the imported product was not lower than the rejected quote for U.S. product. Heindicated that the metal price was not a factor and that fabrication costs and duties above base metal costswere higher than the costs of U.S. product. *** also indicated that the U.S. supplier which had been hiscompany’s ***. Prior to ***, he indicated that his company was satisfied with its U.S. vendor. ***indicated that while his firm had switched purchases of SRC pipe and tube from U.S. producers tosuppliers of SRC pipe and tube from China or Mexico since January 2006, price was not the reason forthe shift. He indicated that his U.S. supplier was not able to supply material and forced it to find a secondsupplier, and that now his company is committed to maintain at least two suppliers. He also noted that tothe best of his recollection, U.S. producers did not reduce their prices of SRC pipe and tube to competewith prices of SRC pipe and tube from China or Mexico.
*** of *** indicated that with regard to the lost sales allegation involving China in 2009 that ithas not purchased from China and that with regard to the lost sales allegation involving Mexico in 2010that the sales was lost to another domestic supplier. He indicated that each year his company solicitscompetitive quotes from qualified domestic and foreign mills and that regardless of price, no bid from asupplier will be considered unless *** quality requirements are met. He indicated that availabilityrequirements in the form of reasonable lead times or inventories are necessary and that price includingfabrication, surcharges, freight and terms are considered. He also indicated that the metal cost applies toall mills and is not a factor in the analysis.
*** of *** indicated that *** had no record of a quote or sale that could be used to confirm thelost sales allegation made by ***. *** indicated that *** does not import copper tubing from China.
V-14

*** of *** agreed with the lost sales allegation made by ***. He indicated that the acceptedquote for imported product was $***/lb (same as the domestic quoted price) for the metal and $*** forfabrication and freight for a total value of $***. *** indicated that *** uses both domestic and importedcopper tube. He noted that ***’s SRC pipe and tube is highly engineered to *** and to date onlydomestic producer *** and a Chinese supplier have qualified to provide the raw copper tube that meettheir quality specifications and tolerances. *** indicated that in order to be qualified, SRC pipe and tubemust meet specifications regarding ***. He noted that *** attempted to qualify one additional domesticsource, but the supplier was unable to provide a qualifying product. *** claimed that while his firm hadswitched purchases of SRC pipe and tube from U.S. producers to suppliers of SRC pipe and tube fromChina and Mexico since January 2006 and that price was a reason, it was not the only reason for the shift. He indicated that the industry has been particularly hard hit in the economic downturn because of thestrong correlation between plumbing product demand and the strength or weakness of the housing market. *** indicated that sales of ***’s product are down for 2009 and that it accepted the U.S. producer’squote, but ordered less volume than the *** pounds offered. He also noted that historically ***’spurchases of SRC pipe and tube shifts between qualified suppliers based both on price and qualityoffered. *** also indicated that while U.S. producers reduced their prices in order to compete with pricesof SRC pipe and tube from China or Mexico, that there have only been limited reductions since 2006 andno reductions in 2008 or 2009.
*** disagreed with the lost sales allegation made by ***. *** indicated that his company wasplanning on purchasing this order from *** and then selling to a customer, but that the purchase was notmade since the customer decided not to purchase the product, although his firm did secure an order forthis job (with different quantities) at a later date.8 He indicated that the customer said he was going towait on the market and buy as needed in hope for better pricing. *** indicated that he had no idea whathis competition’s price was to customer and that his firm purchased the majority of its copper pipe from***.
*** of *** disagreed with the lost sales allegation made by ***. *** indicated that the materialpurchased from their supplier was the same whether *** firm used domestic or foreign copper. While*** indicated that *** firm switched purchases of SRC pipe and tube from U.S. producers to suppliers ofSRC pipe and tube from China or Mexico, *** noted that, in January 2008 her firm switched to materialfrom China because the U.S. supplier did not have adequate capacity to cover their needs. *** alsoindicated that since January 2006, U.S. producers did not reduce their prices in order to compete withprices of SRC pipe and tube from China or Mexico.
*** of *** disagreed with the lost sales allegation made by ***. He indicated that the supplier*** told him they could not keep up with their demand. *** noted that he pays $***/lb. plus duties forimported copper tube and that the U.S. supplier *** indicated that they would not be able to supply hisfirm’s needs. In regard to all of his purchases since January 2006, he indicated that while his firmswitched purchases of SRC pipe and tube from U.S. producers to suppliers from China or Mexico, pricewas not the reason for the switch; rather the U.S. supplier *** could not supply his firm’s requirements.*** also indicated that since January 2006 U.S. producers had raised their prices of SRC pipe and tube.
*** of *** agreed with the lost revenue allegation by ***. He indicated that since January 2006his firm has not switched purchases of SRC pipe and tube from U.S. producers to suppliers of SRC pipeand tube from China or Mexico, but that U.S. producers have reduced their prices of SRC pipe and tubein order to compete with prices of SRC pipe and tube imported from China or Mexico and that “it is stillgoing on.”
*** of *** agreed with the lost sales allegation made by ***. He indicated that the allegationincluded product provided under two jobs. *** indicated that the *** went to Mexico and the *** went toChina. He indicated that since January 2006, his firm switched purchases of SRC pipe and tube from
8 Staff telephone interview with ***, October 16, 2009.
V-15

U.S. producers to suppliers of SRC pipe and tube from China or Mexico and that price was the reason forthe switch. *** also reported that U.S. producers reduced their prices of SRC pipe and tube in order tocompete with prices of SRC pipe and tube imported from China or Mexico. *** indicated that in severalcases, the cost of the imported “finished product” was less than the raw material cost based on theCOMEX price at the time of the closing bid. *** of *** disagreed with the lost sales allegation made by ***. With regard to the ***allegation, he indicated that he is familiar with the quote from *** and indicates that his firm sent out theinquiry in line with the contract they had in place. *** noted that the number of short tons in the quotewould represent about *** percent of *** total requirements so “capacity constraints are obvious.” Whileagreeing with the rejected quote numbers, he indicated that his firm did not pay the amount provided andthat the amount noted in the “accepted quote” was not possible given the market price of metal at thattime. *** indicated that *** was their sole supplier for several years prior to being replaced by U.S.producer *** due to major quality problems and that his firm incurred major production disruptions in2004 due to lack of capacity in the U.S. market. *** indicated that his company went on the open marketand purchased some material in 2004 from *** as well as from other U.S. and foreign suppliers due tocapacity constraints in the United States. He claimed that the material his firm purchased from ***exhibited many of the same quality problems as when they were the primary supplier to ***. He notedthat his firm moved away from ***. *** claims that ***, as well as all but one U.S. manufacturer ofcopper tube, does not have the ability to produce ***. He also indicated that since January 2006 his firmhas not switched purchases of SRC pipe and tube from U.S. producers to suppliers of SRC pipe and tubefrom China or Mexico. *** also noted that he cannot speak as to whether U.S. producers reduced theirprices of SRC pipe and tube in order to compete with prices of SRC pipe and tube imported from Chinaor Mexico since he has been under contract since 2005.
With regard to the *** allegation, he indicated that the product quoted by *** did not meet themandatory requirements of the applicable *** specification including the *** and the ***.He indicated that differences of this magnitude would adversely affect ***. He also indicated that ***has subsequently placed a purchase order for manufacturing a trial quantity of the material but that ***has delayed this trial several times due to ***. *** also indicated that the capacity offered by *** wouldnot provide sufficient material to allow *** to address its consumption requirements and that ***stipulated that before it would provide any material in 2011, *** would have to make a minimum of a ***year commitment before *** would ***.
*** of *** disagreed with the lost revenue allegation made by ***. He indicated that ***rejected the U.S. producer’s quote for all *** indicated that when the quote was revised to use the ***,only the price of the first item (which was for ***) was adjusted downward and that *** accepted thisquotation with no other reductions. He also noted that the first item was awarded *** due to continuedquality problems and tube weight issues and that *** material which they did not have with the materialfrom the Chinese supplier. While *** indicated that since January 2006 his firm switched purchases ofSRC pipe and tube from U.S. producers to suppliers of SRC pipe and tube from China or Mexico, heindicated that his firm switched to imported material because of quality, service, and reduced lead timessince the Chinese suppliers have U.S. representatives that warehouse finished goods for his firm. He alsonoted that he is not certain why *** lowered their price on the one item mentioned, but believes it wasrelated to improvements in efficiencies as a result of production ***.
***.
V-16

*** of *** agreed with the lost sale allegation but he indicated that the volume was smaller ***. *** also indicated that he can not be certain that the sale was lost to imports pricing because the suppliersells both imported and U.S. produced SRC pipe and tube.
*** of *** agreed with one lost sales allegation made by *** and neither disagrees or agrees withanother one. With regard to the April 2009 allegation, he agrees with the allegation indicating that sinceJanuary 2006 his firm switched purchases of SRC pipe and tube from U.S. producers to suppliers of SRCpipe and tube from China or Mexico and that price was the reason for the switch. *** also indicated thatU.S. producers reduced their prices of SRC pipe and tube in order to compete with prices of SRC pipeand tube imported from China or Mexico. With regard to the October 2009 allegation, he indicated thathe neither agreed or disagreed the allegation with the information given and needs a quote number or anemail to verify the allegation. He indicated that suppliers of imports from China and Mexico have raisedtheir prices as had U.S. producers. *** indicated that U.S. producers like *** will always keep theirprices higher.
*** of *** indicated that in 2007 *** company only obtained the product described in the ***allegation from domestic sources of supply. *** indicated that since January 2006 *** firm had switchedpurchases of SRC pipe and tube from U.S. producers to suppliers of SRC pipe and tube from China orMexico, but that any sourcing decisions were driven by product quality and performance and not pricing. *** reported that U.S. producers have not reduced their prices of SRC pipe and tube in order to competewith prices of SRC pipe and tube from China or Mexico and that any changes in U.S. producer pricingthat may have occurred were did not influence to ***’s sourcing decisions. *** indicated that duringAugust 2007, *** switched from purchasing from U.S. producer *** to Chinese producer ***. ***indicated that until 2009, ***.9
*** of *** disagreed with the *** allegation made by ***, indicating that the bid provided by thedomestic producer was for ***. *** indicated the primary reason for switching to purchasing materialproduced by *** was quality as the *** used by the domestic supplier was prone to *** and as measuredby defective parts per million, the performance was more than *** times worse than the *** that wasselected ro replace it.
*** of *** agreed with the lost revenue allegations made by ***. *** indicated that ***. Henoted that the manufacturer had to lower its price to his firm because its wholesale customers would havepurchased imported product if it could not meet competitive conditions.10 He indicated that since January2006 his firm has not switched purchases of SRC pipe and tube from U.S. producers to suppliers of SRCpipe and tube from China or Mexico, but that U.S. producers reduced their prices of SRC pipe and tube inorder to compete with prices of SRC pipe and tube imported from China or Mexico.
*** of *** disagreed with the lost revenue allegation made by ***. His company’s records do notshow it purchasing tube from a second source on or around the date of the allegation nor do the recordsshow it purchasing the alleged amount of the specified product at any time. He noted that his companymay have made this quote and not received an order from its customer.
In response to the lost revenue allegation made by ***, *** of *** indicated that his companyonly purchases copper tube from “U.S. entities” and is not certain about the country of origin of thecopper tubing that it purchases.
*** of *** disagreed with the lost revenue allegation made by ***. He did not find coppertubing imported from Mexico to be consistently cheaper than domestically produced copper tubing. ***indicated that domestic manufacturers were the low bidder as often as importers from Mexico were.
In response to the lost revenue allegation made by ***, *** of *** indicated that his companydoes not purchase or have sources to purchase imported copper tube. He stated that his purchases for ***were from domestic producers. *** indicated that he paid 5 percent more than the *** multiplier net
9 Email from ***.
10 Email from ***.
V-17

stated as the rejected quote for the U.S. product and that the U.S. producer did not lower its price. Heresponded that since January 2006, his firm has not switched purchases of SRC pipe and tube from U.S.producers to suppliers of SRC pipe and tube from China or Mexico. *** added that although it ispossible, he is not certain whether U.S. producers reduced their prices of SRC pipe and tube in order tocompete with prices of SRC pipe and tube imported from China or Mexico.
*** of *** disagreed with the lost sale allegation made by ***. He indicated that this supplierwas the highest bidder of all, including two other U.S. sources who would have gotten an order beforethis supplier with the pricing referenced. *** noted that the two items in the allegation had beenpurchased from *** for over 10 years and when that source ***, the Mexican source agreed to continuethe supply at the same price. He indicated that the U.S. source referenced was quoted in September 2009,and it was told that it was not competitive although there are other U.S. suppliers with pricing that iscompetitive with Mexico and China. While *** indicated that since January 2006, his firm did switchpurchases of SRC pipe and tube from U.S. producers to suppliers of SRC pipe and tube from China orMexico, he indicated that this switch was due to the availability of certain alloys in addition to pricing.*** also indicated that since January 2006, U.S. producers have not raised their prices of SRC pipe andtube.
*** of *** disagreed with the two lost sale allegations made by ***. He cannot find anydocumentation showing that his company received quotes for the dates provided in the allegations (***). *** indicated that the *** his company was using used to be produced ***. He indicated that fabricationcosts did not change after ***. *** noted that his company was satisfied with the quality and servicesprovided by *** and that he cannot find any documentation showing that *** was interested in switchingto an alternative supplier for lower costs between the dates of the two allegations.
*** of *** agreed with the lost sales allegation made by ***. He indicated that his firm didswitch purchases of SRC pipe and tube from U.S. producers to suppliers of SRC pipe and tube fromChina or Mexico and that price was the reason for the switch. *** also indicated that U.S. producersreduced their prices of SRC pipe and tube in order to compete with prices of SRC pipe and tube importedfrom China or Mexico.
*** of *** disagreed with the two lost sales allegations and one lost revenue allegation made by***. He agreed with one lost sales allegation made by *** and disagreed with another lost salesallegation. *** indicated that the *** pound allegation made by *** was awarded to a domestic supplier. He noted that the *** pound allegation was an unsolicited quote and that business for this product wasalready contractually committed for 2009. *** indicated that the lost revenue allegation was a quote froma U.S. producer for a price increase, and due to a sharp decrease in sales, *** was not accepting priceincreases. With regard to the 2009 lost sales allegation made by *** that he disagreed with, he indicatedthat the quote was for 2010 business and that *** is not “importing” copper tubing. ***’s purchaserquestionnaire response indicates that *** only purchased copper pipe and tubing produced in the UnitedStates during the first six months of 2010, but that it purchased copper tubing imported from China eachyear from 2007 to 2009, ranging from *** pounds per year. With regard to the *** lost sales allegationthat he agreed with, he noted that *** awarded this requirement to a Chinese producer, as well as adomestic producer, both of which quoted a lower price. He indicated that his firm switched purchases ofSRC pipe and tube from U.S. producers to suppliers of SRC pipe and tube from China or Mexico and thatprice was the reason for the switch. *** noted that *** still purchases significant quantities from U.S.producers but that it is important to have multiple supply sources. He also indicated that the HVACindustry has suffered a sharp decrease in sales, and that a reduction in prices could be the result of lowerdemand generally, and increased competition from domestic and foreign producers.
The representative for *** did not respond to the specific lost sales allegation. However, he didindicate that since January 2006, the firm switched purchases of SRC pipe and tube from U.S. producersto suppliers of SRC pipe and tube from China or Mexico and that price was the reason for the switch. Healso reported that U.S. producers did not reduce their prices of SRC pipe and tube in order to competewith prices of SRC pipe and tube imported from China or Mexico.
V-18

*** of *** agreed with the lost sales allegation made by ***. He indicated that the fabricationcost of the imported quote was $***/lb., plus a $***/lb. premium. *** also indicated that sales were lostto imports from both China and Mexico (only Mexico was named in the allegation). He indicated thatsince January 2006, his firm switched purchases of SRC pipe and tube from U.S. producers to suppliersof SRC pipe and tube from China or Mexico and that price was the reason for the switch. However, ***stated that U.S. producers had not reduced their prices of SRC pipe and tube in order to compete withprices of SRC pipe and tube imported from China or Mexico.
*** of *** did not specifically agree or disagree with the lost revenue allegation made by ***.*** indicated that his company places a premium on the use of domestic material and doesn’t activelysolicit information on imported copper. He responded that since January 2006, his firm has not switchedpurchases of SRC pipe and tube from U.S. producers to suppliers of SRC pipe and tube from China orMexico and that U.S. producers had not reduced their prices of SRC pipe and tube in order to competewith prices of SRC pipe and tube imported from China or Mexico.
*** of *** disagreed with the three lost sales allegation involving his company. He indicated thatthe quantity (approximately *** pounds) and value (approximately $***) of the alleged lost sales areincorrect and are significantly higher than the company’s annual purchases. *** also indicated that theonly orders placed by *** for imported SRC pipe and tube in 2007 (the year of the allegation) was apurchase of *** in November and December 2007. He indicates that one of the main reasons forpurchasing imported SCR pipe and tube was the payment terms offered by U.S. producer ***. Accordingto ***, rather than extending credit terms to ***, ***.
*** of *** disagreed with the lost sales allegation made by ***. He indicated that he did notrecall the quote. *** reported that since January 2006, his firm switched purchases of SRC pipe and tubefrom U.S. producers to suppliers of SRC pipe and tube from China or Mexico, but that price was not thereason for the switch, rather that ***. He also indicated that U.S. producers had not reduced their pricesof SRC pipe and tube in order to compete with prices of SRC pipe and tube imported from China orMexico.
*** of *** agreed with two sales allegations by *** and disagreed with another two allegations. Although he agreed with the allegations for *** 2008, he indicated that the quantities were smaller; ***pounds for the *** pound allegation and *** pounds for the *** pound allegation. *** disagreed with theother two allegations, indicating that his company has no record of the quote and that all 2009 purchasesof these products have of domestically produced product.
V-19

PART VI: FINANCIAL EXPERIENCE OF THE U.S. PRODUCERS
Introduction
Twelve U.S. firms provided usable financial data on their operations on SRC pipe and tube.1 These data are believed to account for the large majority of U.S. operations on SRC pipe and tube. Internal consumption and transfers to related firms were reported by several firms; however, these non-commercial transactions accounted for only *** percent of total net sales value in 2009 and are notpresented separately in this section. All firms reported a fiscal year end on or near December 31 ***.2
Operations on SRC Pipe and Tube
Income-and-loss data for U.S. firms on their operations on SRC pipe and tube are presented intable VI-1, while selected financial data, by firm, are presented in table VI-2. The domestic industryexperienced a continuous decline in net sales (quantity and value) and operating income from 2007 to2009; however, both net sales and operating income improved between the comparable interim periods. The per-pound net sales value irregularly declined from 2007 to 2009, then improved in January-June2010 to a level comparable to full year 2007. From 2007 to 2009, the per-pound net sales value declinedmore than operating costs and expenses (cost of goods sold (“COGS”) and selling, general, andadministrative (“SG&A”) expenses, combined), thus leading to a decline in profits. Between the comparable interim periods, per-pound revenue increased more than operating costs and expenses, whichled to improved profitability in January-June 2010 as compared to January-June 2009.
Raw material costs are the primary component of total COGS, accounting for 84 percent of totalCOGS during the period for which data were collected. While other components of COGS increased on aper-pound basis from 2007 to 2009, raw material costs (copper cathode, ingot, and/or scrap) declined by$0.91, or 29 percent, from 2007 to 2009. Between the comparable interim periods, per-pound rawmaterial costs increased by $1.33, or 69 percent, while direct labor and other factory costs were stable. Thus, the overall change in per-pound COGS during the period examined is predominantly the result of fluctuations in raw material costs. Petitioners’ state that conversion revenues (per-pound net sales values less per-pound rawmaterial costs) provide a better measure of the industry’s financial performance since the price of copperis essentially passed through to customers. From 2007 to 2009, per-pound average conversion revenuesirregularly declined from $0.90 to $0.83, then increased from $0.78 to $0.81 between the comparableinterim periods.3
1 The U.S. producers are ***. The company records underlying ***’s financial data were reviewed atCommission offices. ***.
2 Full year financial data for all U.S. producers cover fiscal years 2007 to 2009. Separate financial data onindustrial and plumbing SRC pipe and tube are presented in appendix E. ***.
3 Petitioners’ prehearing brief, pp. 50-51. Petitioners’ posthearing brief, exh. 9.
VI-1
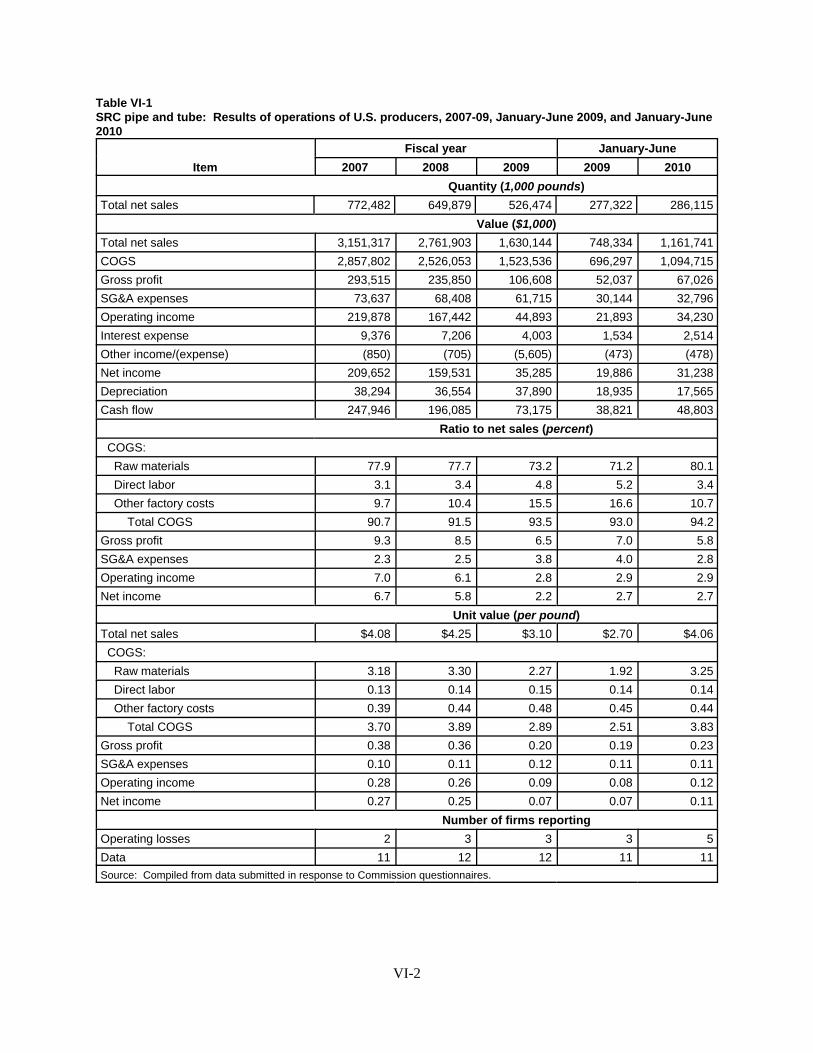
Table VI-1SRC pipe and tube: Results of operations of U.S. producers, 2007-09, January-June 2009, and January-June2010
Item
Fiscal year January-June
2007 2008 2009 2009 2010
Quantity (1,000 pounds)
Total net sales 772,482 649,879 526,474 277,322 286,115
Value ($1,000)
Total net sales 3,151,317 2,761,903 1,630,144 748,334 1,161,741
COGS 2,857,802 2,526,053 1,523,536 696,297 1,094,715
Gross profit 293,515 235,850 106,608 52,037 67,026
SG&A expenses 73,637 68,408 61,715 30,144 32,796
Operating income 219,878 167,442 44,893 21,893 34,230
Interest expense 9,376 7,206 4,003 1,534 2,514
Other income/(expense) (850) (705) (5,605) (473) (478)
Net income 209,652 159,531 35,285 19,886 31,238
Depreciation 38,294 36,554 37,890 18,935 17,565
Cash flow 247,946 196,085 73,175 38,821 48,803
Ratio to net sales (percent)
COGS:
Raw materials 77.9 77.7 73.2 71.2 80.1
Direct labor 3.1 3.4 4.8 5.2 3.4
Other factory costs 9.7 10.4 15.5 16.6 10.7
Total COGS 90.7 91.5 93.5 93.0 94.2
Gross profit 9.3 8.5 6.5 7.0 5.8
SG&A expenses 2.3 2.5 3.8 4.0 2.8
Operating income 7.0 6.1 2.8 2.9 2.9
Net income 6.7 5.8 2.2 2.7 2.7
Unit value (per pound)
Total net sales $4.08 $4.25 $3.10 $2.70 $4.06
COGS:
Raw materials 3.18 3.30 2.27 1.92 3.25
Direct labor 0.13 0.14 0.15 0.14 0.14
Other factory costs 0.39 0.44 0.48 0.45 0.44
Total COGS 3.70 3.89 2.89 2.51 3.83
Gross profit 0.38 0.36 0.20 0.19 0.23
SG&A expenses 0.10 0.11 0.12 0.11 0.11
Operating income 0.28 0.26 0.09 0.08 0.12
Net income 0.27 0.25 0.07 0.07 0.11
Number of firms reporting
Operating losses 2 3 3 3 5
Data 11 12 12 11 11
Source: Compiled from data submitted in response to Commission questionnaires.
VI-2
Table VI-2SRC pipe and tube: Results of operations of U.S. producers, by firm, 2007-09, January-June 2009, andJanuary-June 2010
* * * * * * *
While the overall industry, as well as ***, reported a general decline in profitability during theperiod examined, *** in January-June 2010.4 According to petitioners, ***. Further, petitioners’ statedthat per-pound selling expenses are lower for sales to OEMs as compared to sales of standard products todistributors and retailers.5 6 7
Variance Analysis
The variance analysis presented in table VI-3 is based on the data in table VI-1. The analysisshows that the decline in operating income from 2007 to 2009 is primarily attributable to an unfavorableprice variance that more than offset a favorable net cost/expense variance (that is, prices declined morethan costs and expenses). Between the comparable interim periods, the improvement in operating incomeis primarily attributable to a favorable price variance that more than offset an unfavorable netcost/expense variance (that is, prices increased more than costs/expenses).8
4 The SRC pipe and tube industry experienced a slight decline in its operating margin in the last six months of2009 (an operating margin of 2.6 percent) as compared to the first six months of 2009 (an operating margin of 2.9percent). Calculated from table VI-1 in this section of the report. Staff notes that three firms have a fiscal year endother than December 31, which makes this calculation imprecise. However, it may serve as a gauge of trends in theSRC pipe and tube industry during 2009.
5 Petitioners’ postconference brief, exh. 14.
6 SG&A expenses represent only 2.9 percent of total operating costs during the period for which data werecollected, and are not a major factor behind the industry’s reported financial performance.
7 During the period examined, the reported financial data for industrial and plumbing SRC pipe and tube revealedgreater profitability for plumbing SRC pipe and tube, with operating income margins of 10.2 (2007), 9.5 (2008), 5.0(2009), 7.1 (January-June 2009), and 4.5 (January-June 2010) percent. In contrast, operating income margins forindustrial SRC pipe and tube were 3.3 (2007), 1.6 (2008), negative 0.9 (2009), negative 5.1 (January-June 2009),and 1.4 (January-June 2010) percent. Net sales quantities of plumbing SRC pipe and tube declined by 3.2 percentfrom 2007-09 and declined by 26.9 percent between the comparable interim periods, while net sales quantities ofindustrial SRC pipe and tube declined by 17 percent from 2007-09 and increased by 15 percent between thecomparable interim periods. See also appendix E.
8 A variance analysis is calculated in three parts; sales variance, cost of sales variance, and SG&A expensevariance. Each part consists of a price variance (in the case of the sales variance) or a cost variance (in the case ofthe cost of sales and SG&A expense variance) and a volume variance. The sales or cost variance is calculated as thechange in unit price times the new volume, while the volume variance is calculated as the change in volume timesthe old unit price. Summarized at the bottom of the table, the price variance is from sales; the cost/expense varianceis the sum of those items from COGS and SG&A variances, respectively; and the volume variance is the sum of thelines under price and cost/expense variance. The net volume component is generally the smallest component.
VI-3
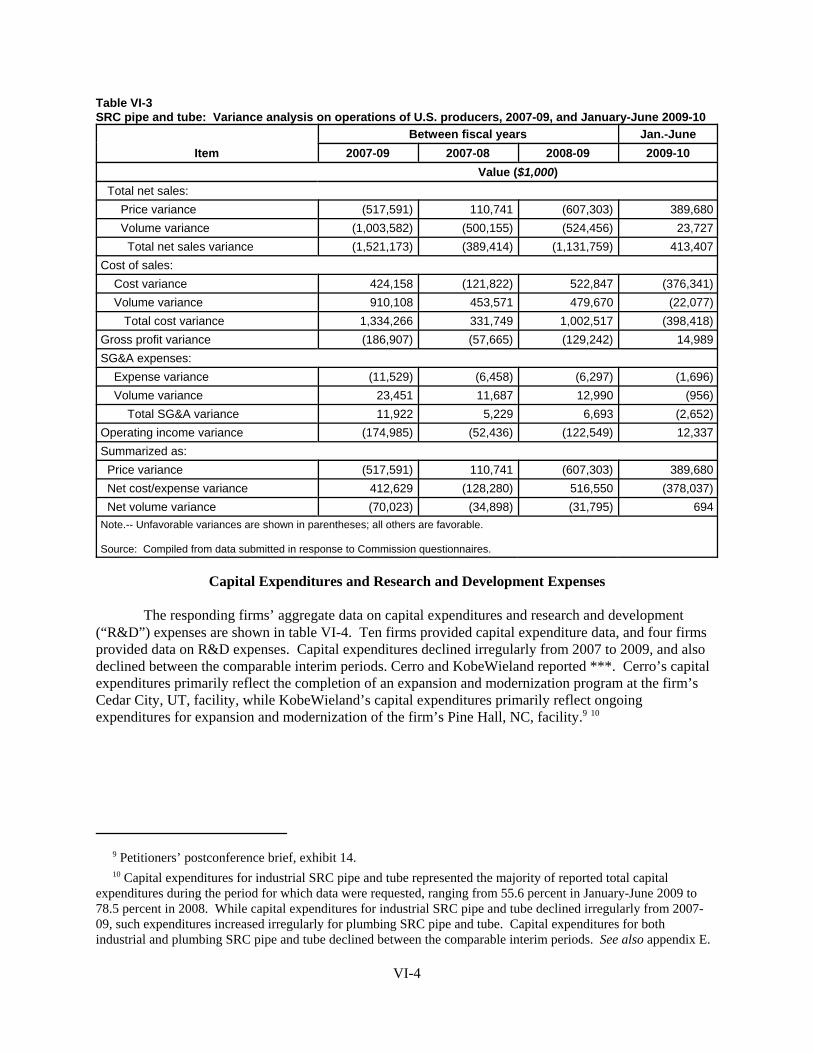
Table VI-3SRC pipe and tube: Variance analysis on operations of U.S. producers, 2007-09, and January-June 2009-10
Item
Between fiscal years Jan.-June
2007-09 2007-08 2008-09 2009-10
Value ($1,000)
Total net sales:
Price variance (517,591) 110,741 (607,303) 389,680
Volume variance (1,003,582) (500,155) (524,456) 23,727
Total net sales variance (1,521,173) (389,414) (1,131,759) 413,407
Cost of sales:
Cost variance 424,158 (121,822) 522,847 (376,341)
Volume variance 910,108 453,571 479,670 (22,077)
Total cost variance 1,334,266 331,749 1,002,517 (398,418)
Gross profit variance (186,907) (57,665) (129,242) 14,989
SG&A expenses:
Expense variance (11,529) (6,458) (6,297) (1,696)
Volume variance 23,451 11,687 12,990 (956)
Total SG&A variance 11,922 5,229 6,693 (2,652)
Operating income variance (174,985) (52,436) (122,549) 12,337
Summarized as:
Price variance (517,591) 110,741 (607,303) 389,680
Net cost/expense variance 412,629 (128,280) 516,550 (378,037)
Net volume variance (70,023) (34,898) (31,795) 694
Note.-- Unfavorable variances are shown in parentheses; all others are favorable.
Source: Compiled from data submitted in response to Commission questionnaires.
Capital Expenditures and Research and Development Expenses
The responding firms’ aggregate data on capital expenditures and research and development(“R&D”) expenses are shown in table VI-4. Ten firms provided capital expenditure data, and four firmsprovided data on R&D expenses. Capital expenditures declined irregularly from 2007 to 2009, and alsodeclined between the comparable interim periods. Cerro and KobeWieland reported ***. Cerro’s capitalexpenditures primarily reflect the completion of an expansion and modernization program at the firm’sCedar City, UT, facility, while KobeWieland’s capital expenditures primarily reflect ongoingexpenditures for expansion and modernization of the firm’s Pine Hall, NC, facility.9 10
9 Petitioners’ postconference brief, exhibit 14.
10 Capital expenditures for industrial SRC pipe and tube represented the majority of reported total capitalexpenditures during the period for which data were requested, ranging from 55.6 percent in January-June 2009 to78.5 percent in 2008. While capital expenditures for industrial SRC pipe and tube declined irregularly from 2007-09, such expenditures increased irregularly for plumbing SRC pipe and tube. Capital expenditures for bothindustrial and plumbing SRC pipe and tube declined between the comparable interim periods. See also appendix E.
VI-4

Table VI-4SRC pipe and tube: Capital expenditures and research and development expenses of U.S. producers, 2007-09, January-June 2009, and January-June 2010
Item
Fiscal year January-June
2007 2008 2009 2009 2010
Value ($1,000)
Capital expenditures:
Total 41,162 45,241 34,090 17,231 6,024
R&D expenses:
Total 1,865 2,137 2,239 1,115 1,132
Source: Compiled from data submitted in response to Commission questionnaires.
Assets and Return on Investment
The Commission’s questionnaire requested data on assets used in the production, warehousing,and sale of SRC pipe and tube to compute return on investment (“ROI”). Data on the U.S. producers’total assets and their ROI are presented in table VI-5. From 2007 to 2009, the total assets for SRC pipeand tube decreased from $1.3 billion in 2007 to $1.0 billion in 2009, and the ROI declined from 17.5percent in 2007 to 4.4 percent in 2009.
Table VI-5SRC pipe and tube: Asset values and return on investment of U.S. producers, 2007-09
Item
Fiscal year
2007 2008 2009
Value of assets: Value ($1,000)
Current assets:
Cash and equivalents 213,394 204,279 153,714
Accounts receivable, net 306,044 213,395 176,264
Inventories 288,526 190,055 212,997
Other 83,617 72,541 112,469
Total current assets 891,581 680,270 655,444
Property, plant and equipment:
Original cost 771,968 834,499 841,490
Less: accumulated depreciation 488,897 535,859 548,750
Equals: book value 283,071 298,640 292,740
Other non-current assets 79,259 81,103 74,874
Total assets 1,253,911 1,060,013 1,023,058
Operating income or (loss) 219,878 167,442 44,893
Return on investment 17.5 15.8 4.4
Source: Compiled from data submitted in response to Commission questionnaires.
VI-5

CAPITAL AND INVESTMENT
The Commission requested U.S. producers of SRC pipe and tube to describe any actual orpotential negative effects of imports of SRC pipe and tube from China and Mexico on their firms’ growth,investment, ability to raise capital, development and production efforts, or the scale of capitalinvestments. Their responses are next.
Actual Negative Effects
* * * * * * *
Anticipated Negative Effects
* * * * * * *
VI-6

PART VII: THREAT CONSIDERATIONS AND INFORMATION ONNONSUBJECT COUNTRIES
Section 771(7)(F)(i) of the Act (19 U.S.C. § 1677(7)(F)(i)) provides that--
In determining whether an industry in the United States is threatenedwith material injury by reason of imports (or sales for importation) of thesubject merchandise, the Commission shall consider, among otherrelevant economic factors1--
(I) if a countervailable subsidy is involved, such information as may bepresented to it by the administering authority as to the nature of thesubsidy (particularly as to whether the countervailable subsidy is asubsidy described in Article 3 or 6.1 of the Subsidies Agreement), andwhether imports of the subject merchandise are likely to increase,
(II) any existing unused production capacity or imminent, substantialincrease in production capacity in the exporting country indicating thelikelihood of substantially increased imports of the subject merchandiseinto the United States, taking into account the availability of other exportmarkets to absorb any additional exports,
(III) a significant rate of increase of the volume or market penetration ofimports of the subject merchandise indicating the likelihood ofsubstantially increased imports,
(IV) whether imports of the subject merchandise are entering at pricesthat are likely to have a significant depressing or suppressing effect ondomestic prices, and are likely to increase demand for further imports,
(V) inventories of the subject merchandise,
(VI) the potential for product-shifting if production facilities in theforeign country, which can be used to produce the subject merchandise,are currently being used to produce other products,
(VII) in any investigation under this title which involves imports of botha raw agricultural product (within the meaning of paragraph (4)(E)(iv))and any product processed from such raw agricultural product, thelikelihood that there will be increased imports, by reason of productshifting, if there is an affirmative determination by the Commission
1 Section 771(7)(F)(ii) of the Act (19 U.S.C. § 1677(7)(F)(ii)) provides that “The Commission shall consider *** .. . as a whole in making a determination of whether further dumped or subsidized imports are imminent and whethermaterial injury by reason of imports would occur unless an order is issued or a suspension agreement is acceptedunder this title. The presence or absence of any factor which the Commission is required to consider . . . shall notnecessarily give decisive guidance with respect to the determination. Such a determination may not be made on thebasis of mere conjecture or supposition.”
VII-1

under section 705(b)(1) or 735(b)(1) with respect to either the rawagricultural product or the processed agricultural product (but not both),
(VIII) the actual and potential negative effects on the existingdevelopment and production efforts of the domestic industry, includingefforts to develop a derivative or more advanced version of the domesticlike product, and
(IX) any other demonstrable adverse trends that indicate the probabilitythat there is likely to be material injury by reason of imports (or sale forimportation) of the subject merchandise (whether or not it is actuallybeing imported at the time).2
Information on the volume and pricing of imports of the subject merchandise is presented in PartsIV and V; and information on the effects of imports of the subject merchandise on U.S. producers’existing development and production efforts is presented in Part VI. Information on inventories of thesubject merchandise; foreign producers’ operations, including the potential for “product-shifting;” anyother threat indicators, if applicable; and any dumping in third-country markets, follows. Also presentedin this section of the report is information obtained for consideration by the Commission on nonsubjectcountries and the global market.
THE INDUSTRY IN CHINA
The Chinese SRC pipe and tube industry has experienced significant recent expansion in responseto the country’s rapid growth in demand by downstream industry sectors driven by China’s rapid overalleconomic development. However, according to the 2009 U.S. Geological Survey, although Chinesesmelter and refinery capacity has expanded in recent years, its mine and refinery production are insufficient to meet growing domestic consumption needs for refined copper,3 so China is a leading globalimporter of copper in the forms of refined metal and scrap.4
In 2009, there were reportedly 18 major SRC pipe and tube producers in China with a combinedcapacity of approximately 2 billion pounds (operating at 35 percent capacity).5 The Commissionrequested data from the 14 firms that were listed in the petition as producing SRC pipe and tube in Chinaduring the period of the investigation. The Commission received a response from eight firms,6 and dataregarding the Chinese industry are based on the eight foreign producer questionnaires received. Theseresponses are believed to account for approximately *** of Chinese export shipments to the United Statesin 2009.7 In addition to the responding Chinese producers of SRC pipe and tube, U.S. importers
2 Section 771(7)(F)(iii) of the Act (19 U.S.C. § 1677(7)(F)(iii)) further provides that, in antidumpinginvestigations, “. . . the Commission shall consider whether dumping in the markets of foreign countries (asevidenced by dumping findings or antidumping remedies in other WTO member markets against the same class orkind of merchandise manufactured or exported by the same party as under investigation) suggests a threat of materialinjury to the domestic industry.” 3 Pui Kwan Tse, “The Mineral Industry of China,” 2007 Mineral Yearbook (advanced release), U.S. GeologicalSurvey, February 2009, pp. 9.5 – 9.6. 4 Ibid., pp. 9.3 and 9.23. 5 Petitioners’ postconference brief, page 4. 6 Producers in China that submitted foreign producer questionnaires were: ***. 7 According to testimony presented at the hearing, Golden Dragon is by far the largest exporter of Chinese tubes,and Golden Dragon exports almost exclusively inner groove tube that it produces using the cast and roll process.
continue...
VII-2

identified the following producers/exporters as other Chinese sources for their imports of SRC pipe andtube: ***.
Table VII-1 presents information on the Chinese industry’s SRC pipe and tube operations. Chinese capacity increased 17.3 percent from 2007 to 2009, increased 9.5 percent between the interimperiods, and were projected to increase in 2010 and 2011. The share of Chinese exports to the UnitedStates increased from 8.6 percent in 2007 to 8.9 percent in 2009. The share of Chinese exports to allother countries decreased from 21.5 percent in 2007 to 15.6 percent in 2009.8
7 ...continueHearing transcript, p. 170 (Rogers). 8 These other export markets include: ***.
VII-3
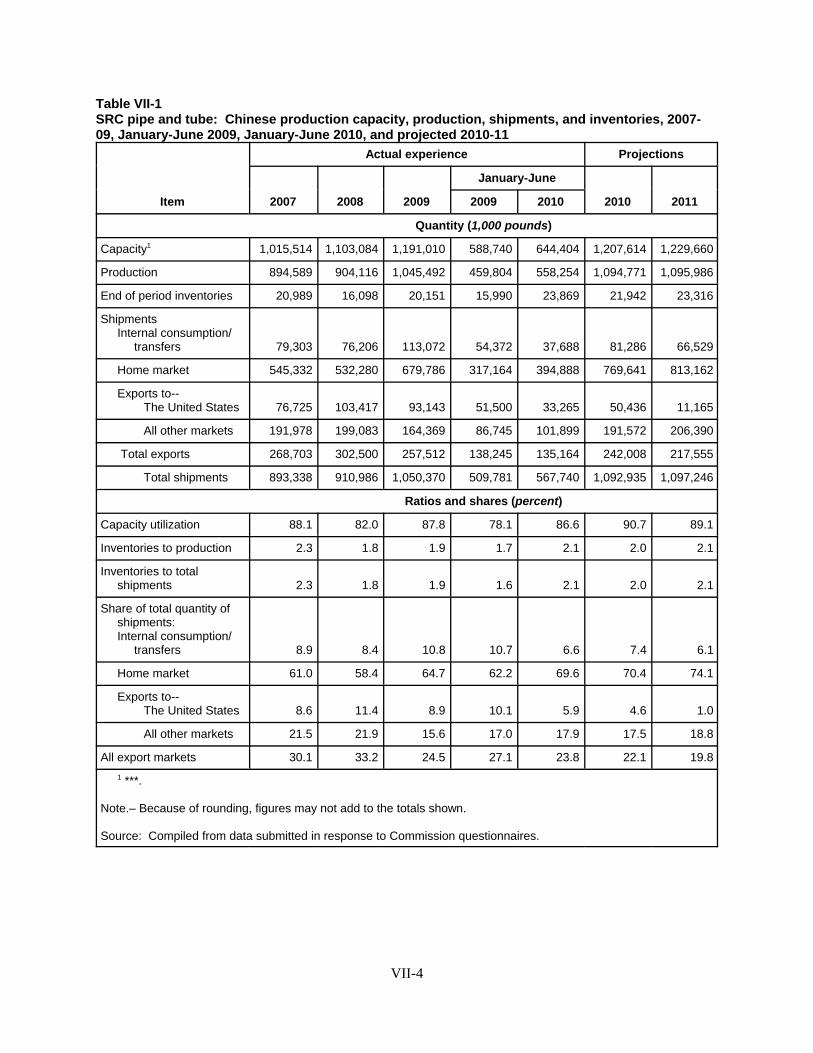
Table VII-1SRC pipe and tube: Chinese production capacity, production, shipments, and inventories, 2007-09, January-June 2009, January-June 2010, and projected 2010-11
Item
Actual experience Projections
2007 2008 2009
January-June
2010 20112009 2010
Quantity (1,000 pounds)
Capacity1 1,015,514 1,103,084 1,191,010 588,740 644,404 1,207,614 1,229,660
Production 894,589 904,116 1,045,492 459,804 558,254 1,094,771 1,095,986
End of period inventories 20,989 16,098 20,151 15,990 23,869 21,942 23,316
Shipments Internal consumption/ transfers 79,303 76,206 113,072 54,372 37,688 81,286 66,529
Home market 545,332 532,280 679,786 317,164 394,888 769,641 813,162
Exports to--The United States 76,725 103,417 93,143 51,500 33,265 50,436 11,165
All other markets 191,978 199,083 164,369 86,745 101,899 191,572 206,390
Total exports 268,703 302,500 257,512 138,245 135,164 242,008 217,555
Total shipments 893,338 910,986 1,050,370 509,781 567,740 1,092,935 1,097,246
Ratios and shares (percent)
Capacity utilization 88.1 82.0 87.8 78.1 86.6 90.7 89.1
Inventories to production 2.3 1.8 1.9 1.7 2.1 2.0 2.1
Inventories to total shipments 2.3 1.8 1.9 1.6 2.1 2.0 2.1
Share of total quantity of shipments: Internal consumption/ transfers 8.9 8.4 10.8 10.7 6.6 7.4 6.1
Home market 61.0 58.4 64.7 62.2 69.6 70.4 74.1
Exports to--The United States 8.6 11.4 8.9 10.1 5.9 4.6 1.0
All other markets 21.5 21.9 15.6 17.0 17.9 17.5 18.8
All export markets 30.1 33.2 24.5 27.1 23.8 22.1 19.8
1 ***.
Note.– Because of rounding, figures may not add to the totals shown.
Source: Compiled from data submitted in response to Commission questionnaires.
VII-4

Chinese producers of SRC pipe and tube were asked if they had experienced any plant openings,relocations, expansions, acquisitions, consolidations, closures, or prolonged shutdowns because of strikesor equipment failure; curtailment of production because of shortages of materials; or any other change inthe character of their operations or organization relating to the production of SRC pipe and tube sinceJanuary 1, 2007. Five Chinese producers provided responses which are presented in table VII-2.
Table VII-2SRC pipe and tube: Changes in Chinese producers’ production operations
* * * * * * *
When asked to describe constraints on production capacity, Chinese producers of SRC pipe andtube reported: ***. Table VII-3 presents the Chinese producers’ share of their total sales represented bysales of SRC pipe and tube. *** Chinese producer reported producing other products on the sameequipment and machinery used to produce SRC pipe and tube.9
Table VII-3SRC pipe and tube: Share of Chinese producers’ total sales
* * * * * * *
THE INDUSTRY IN MEXICO
The Commission requested data from five producers of SRC pipe and tube in Mexico. TheCommission received responses from five firms, which are believed to account for *** of Mexican exportshipments to the United States in 2009.10
Table VII-4 presents information on the Mexican industry’s operations in Mexico.11 Mexicanproducers’ capacity increased by *** percent from 2007 to 2009 and was *** percent higher in interim2010 when compared to interim 2009. Mexican production of SRC pipe and tube decreased by ***percent from 2007 to 2009. Mexican capacity utilization *** percent in 2007 to *** percent in 2009.
The volume of Mexican producers’ shipments to its home market ranged from *** percent in2007 to *** percent in interim 2010. The *** of Mexican producers’ exports was exported to the UnitedStates, and ranges from *** percent to *** percent of total shipments.12
One Mexican producer, Luvata Monterrey, began production in 2009 ***.13 Another Mexicanproducer, Golden Dragon Affiliates, opened a plant in Monclova at the end of September 2009 and
9 ***. 10 Producers in Mexico that submitted foreign producer questionnaires were: ***. 11 The Mexican SRC pipe and tube industry relies upon both domestic and foreign sources of copper imports. 12 The other export markets are ***. 13 Luvata Monterrey foreign producer questionnaire, page 4. The facility located in the Monterrey area of NuevoLeon, Mexico reportedly focuses on sales to both large OEM manufacturers and smaller local customers in the airconditioning and heating industry using Luvata’s own cast and roll technology. See “Luvata announces officialopening of multi-million dollar copper-tube manufacturing plant,”http://www.luvata.com/zh-cn/News-Room/Press-Releases/Luvata-announces-official-opening-of-multi-million-dollar/, retrieved September 9, 2010.
VII-5
projects capacity at the plant to be approximately ***.14 According to testimony presented at the hearing,Golden Dragon built this Mexican facility to produce the same product it was importing from China andthat it “has had plans over time to replace the products imported from China with Mexican product to theUnited States.”15
According to testimony presented at the hearing, IUSA shifted most of its production to its U.S.subsidiary, Cambridge-Lee in Reading, PA, in 2009.16 Respondents argue that the decision to shiftproduction to the United States was based on: freight cost savings; Buy America requirements; cheaperelectricity and gas costs; production efficiencies; and minimal labor cost differentials.17
Table VII-4SRC pipe and tube: Mexican production capacity, production, shipments, and inventories, 2007-09, January-June 2009, January-June 2010, and projected 2010-11
* * * * * * *
Mexican producers of SRC pipe and tube were asked if they had experienced any plant openings, relocations, expansions, acquisitions, consolidations, closures, or prolonged shutdowns because of strikesor equipment failure; curtailment of production because of shortages of materials; or any other change inthe character of their operations or organization relating to the production of SRC pipe and tube sinceJanuary 1, 2007. Three Mexican producers provided responses which are presented in table VII-5.
Table VII-5SRC pipe and tube: Changes in Mexican producers’ production operations
* * * * * * *
Table VII-6 presents the Mexican producers’ share of their total sales represented by sales of SRC pipe and tube.
Table VII-6SRC pipe and tube: Share of Mexican producers’ total sales
* * * * * * *
14 The plant is located in the northern Mexican state of Coahuila. At the launching ceremony, Li Changjie,president of Golden Dragon, said the Monclova plant was part of a global strategy which would allow his companyto meet the demand in North America and Europe. See “Golden Dragon opens copper pipe plant in Mexico,”http://www.steelguru.com/metals_news/Golden_Dragon_opens_copper_pipe_plant_in_Mexico/118419.html,retrieved September 9, 2010. 15 Hearing transcript, p. 153 (Weil). 16 Hearing transcript, p. 180 (Kerins). ***. According to documents provided in IUSA/Nacobre/Cambridge-Lee/Copper and Brass International’s posthearing brief, Cambridge-Lee ramped up production of plumbing pipe anddecreased imports from Mexico *** and ***. Respondents posthearing brief (IUSA, Nacobre, Cambridge-Lee, andCopper and Brass International), p. 2 ***. 17 Hearing transcript, pp. 174-175 (Ochoa).
VII-6

U.S. IMPORTERS’ INVENTORIES OF SRC PIPE AND TUBE
Data collected in these investigations on U.S. importers’ end-of-period inventories of SRC pipeand tube are presented in table VII-7.
Table VII-7SRC pipe and tube: U.S. importers’ end-of-period inventories of imports, 2007-09, January-June2009, and January-June 2010
* * * * * * *
U.S. IMPORTERS’ CURRENT ORDERS
Two U.S. importers reported imports or the arrangement of imports of SRC pipe and tube of 4.1million pounds from China, and six importers reported the arrangement of imports of 2.3 million poundsfrom Mexico after June 30, 2010.
ANTIDUMPING AND COUNTERVAILING DUTY INVESTIGATIONSIN THIRD-COUNTRY MARKETS
SRC pipe and tube have not been subject to any import relief investigation in other countries.
INFORMATION ON PRODUCERS IN NONSUBJECT COUNTRIES
In assessing whether the domestic industry is materially injured or threatened with material injury “by reason of subject imports,” the legislative history states “that the Commission must examine allrelevant evidence, including any known factors, other than the dumped or subsidized imports, that may beinjuring the domestic industry, and that the Commission must examine those other factors (including non-subject imports) ‘to ensure that it is not attributing injury from other sources to the subject imports.’”18
Canada and Malaysia are leading nonsubject sources for U.S. imports of SRC pipe and tube.
Canada
Wolverine Tube (Canada) Inc. (Wolverine-Canada) is a major producer of SRC pipe and tube inCanada.19 As part of its plans to exit the North American residential plumbing tube market, parent-company Wolverine Tube Inc. (Wolverine) announced, in July 2008, the sell-off of Wolverine-Canada’sresidential plumbing tube operations, to focus on heat-transfer tubing, fabricated assemblies, and metal-joining products.20 Subsequently, Wolverine-Canada’s product line was expanded beyond uncoated SRCpipe and tube through acquisition of Kamco Products (Kamco) in November 2008, a leading Canadianand North American producer of coated SRC pipe and tube.21 Kamco’s plastic-coated SRC pipe and tubeis encased in polyethylene for corrosion resistance in conveyance of fuel oil, natural gas and liquified
18 Mittal Steel Point Lisas Ltd. V. United States, Slip Op. 2007-1552 at 17 (Fed. Cir. Sept. 18, 2008), quotingfrom Statement of Administrative Action on Uruguay round Agreements Act, H.R. Rep. 103-316, Vol. 1 at 851-52;see also Bratsk Aluminum Smelter v. United States, 444 F.3d 1369 (Fed. Cir. 32006). 19 Petition, p. 25. 20 Wolverine, “Wolverine Tube Sells Canadian Plumbing Tube Unit for $42 Million,” press release, July 8, 2008. 21 Wolverine-Canada, Kamco Div., “Wolverine Tube (Canada) Inc. Acquires the Assets of Kamco Products, aDivision of Granby Steel Tanks,” November 1, 2008.
VII-7
petroleum gas, and potable water in industrial and municipal service sectors.22 Further information wasnot available about Wolverine-Canada’s annual production capacity.
Malaysia
MetTube Sdn Bhd (MetTube) is the first integrated mill in Malaysia that produces SRC pipe and tube from melting, casting, extruding, and drawing of refined copper.23 Both smooth and inner-grooveSRC pipe and tube are produced by MetTube for the air conditioning and refrigeration industries. MetTube’s tubing is available either unannealed or with varying degrees of annealing; and in spooledcoils, pancake coils, and straight lengths.24 MetTube’s tubing is produced to several different foreign-market specifications, including ASTM B-75, the U.S. specification for seamless copper tube for generalengineering applications.25 Total annual production capacity at MetTube’s facility in Selangor state isnearly 26,500 short tons per annum.26 The extent of MetTube’s globalized marketing is its claim to beshipping to customers and partners in 31 countries worldwide.27
Outokumpu Copper Products (Malaysia) Sdn. Bhd. (Outokumpu-Malaysia) is a producer ofSRC pipe and tube for air conditioning and refrigeration (ACR), along with copper profiles and sections,28
as a member of Luvata (formerly Outokumpu Copper Products before May 2006) since 1998.29 Furtherinformation was not available about Outokumpu-Malaysia’s annual production capacity.
22 Kamco, “Profile;” and “Products.” 23 MetTube was established in 1991 as a joint venture between Metdist Ltd. (United Kingdom) and MitsubishiMaterials Corp. (Japan). MetTube, “MetTube & You– Chairman Statement;” and MetTube, “Virtual Tour–MetTube Today.” 24 MetTube, “MetTube & You– Product Range.” 25 MetTube, “MetTube & You– Product Specifications.” 26 Total annual production capacity originally reported as 24,000 metric tons. MetTube, “MetTube & You–MetTube Today.” 27 Ibid.; and MetTube, “Tube & You– Global Market.” 28 E-Directory.com.my, Malaysia Manufacturers Directory, “Outokumpu Copper Products (Malaysia) Sdn Bhd(417125-K). 29 Luvata, “About Luvata, Our History,” 2009.
VII-8

APPENDIX A
FEDERAL REGISTER NOTICES
A-1

33330 Federal Register / Vol. 75, No. 112 / Friday, June 11, 2010 / Notices
1 For purposes of these investigations, the Department of Commerce has defined the subject merchandise as ‘‘all seamless circular refined copper pipe and tubes, including redraw hollows, greater than or equal to 6 inches (152.4 mm) in length and measuring less than 12.130 inches (308.102 mm) (actual) in outside diameter (‘‘OD’’), regardless of wall thickness, bore (e.g., smooth, enhanced with innergrooves or ridges), manufacturing process (e.g., hot finished, cold- drawn, annealed), outer surface (e.g., plain or enhanced with grooves, ridges, fins, or gills), end finish (e.g., plain end, swaged end, flared end, expanded end, crimped end, threaded), coating (e.g., plastic, paint), insulation, attachments (e.g., plain, capped, plugged, with compression or other fitting), or physical configuration (e.g., straight, coiled bent, wound on spools). The scope covers, but is not limited to, seamless refined copper pipe and tube produced or comparable to the American Society for Testing and Materials (‘‘ASTM’’) ASTM– B42, ASTM–B68, ASTM–B75, ASTM–B88, ASTM– B88M, ASTM–B188, ASTM–B251, ASTM–B251M, ASTM–B280, ASTM–B302, ASTM–B306, ASTM– B359, ASTM–B743, ASTM–B819, and ASTM–B903 specifications and meeting the physical parameters described therein. Also included within the scope of these investigations are all sets of covered products, including ‘‘line sets’’ of seamless refined copper tubes (with or without fittings or insulation) suitable for connecting an outdoor air conditioner or heat pump to an indoor evaporator unit. The phrase ‘‘all sets of covered products’’ denotes any combination of items put up for sale that is comprised of merchandise subject to the scope.
(NAGPRA), 25 U.S.C. 3003, of the completion of an inventory of human remains in the possession and control of the New York University College of Dentistry, New York, NY. The human remains were removed from the cemetery at Kienuka, Niagara County, NY.
This notice is published as part of the National Park Service’s administrative responsibilities under NAGPRA, 25 U.S.C. 3003(d)(3). The determinations in this notice are the sole responsibility of the museum, institution, or Federal agency that has control of the Native American human remains. The National Park Service is not responsible for the determinations in this notice.
A detailed assessment of the human remains was made by the New York University College of Dentistry professional staff in consultation with representatives of the Tuscarora Nation of New York.
In 1903, human remains representing a minimum of two individuals were removed from the cemetery at Kienuka in Niagara County, NY, by John MacKay. The remains were subsequently added to the collection of William MacKay, John MacKay’s brother. The Museum of the American Indian, Heye Foundation, purchased William MacKay’s collection in 1918. In 1956, the Museum of the American Indian transferred the remains to Dr. Theodore Kazamiroff, New York University College of Dentistry. No known individuals were identified. No associated funerary objects are present.
Kienuka is located within the boundaries of the Tuscarora Reservation, which was established in 1797. The removal occurred prior to the Antiquities Act, and, therefore, the U.S. Department of the Interior, Bureau of Indian Affairs, is not asserting control. Archival and historical records suggest that the removal of the remains was not authorized by the Tuscarora Nation and that a law enforcement official from the Tuscarora Nation investigated the desecration of the cemetery but was unable to arrest anyone.
Kienuka was a Neutral village of the early 17th century, and the morphology of the remains is consistent with individuals of Native American ancestry. The Neutral were a confederacy of Iroquoian speakers who lived to the south and north of the eastern half of Lake Erie. Their name was derived from the neutral position they occupied geographically and sociopolitically between the Huron and Iroquois Confederacies. Between 1647 and 1651, the Neutral coalition was fractured and its people were decimated as a result of warfare with the Iroquois
nations. The Neutral ceased to be identified as a distinct group by 1660.
In 1713, the Tuscarora migrated to New York from North Carolina. The Tuscarora were adopted as the sixth nation of the Iroquois Confederacy in 1722 and 1723. After the Revolutionary War, the Tuscarora settled on the east side of the Niagara River. The Tuscarora Nation received their land grant, which includes portions of Niagara County, in 1797. Their reservation was subsequently expanded and continues to include the site of Kienuka.
Officials of the New York University College of Dentistry have determined that, pursuant to 25 U.S.C. 3001(9), the human remains described above represent the physical remains of two individuals of Native American ancestry. Officials of the New York University College of Dentistry also have determined that, pursuant to 25 U.S.C. 3001(2), a relationship of shared group identity cannot be reasonably traced between the Native American human remains and any present-day Indian tribe.
The Native American Graves Protection and Repatriation Review Committee (Review Committee) is responsible for recommending specific actions for disposition of culturally unidentifiable human remains. In July 2009, the New York University College of Dentistry requested that the Review Committee recommend disposition of the culturally unidentifiable human remains of two individuals to the Tuscarora Nation of New York. The Review Committee considered the proposal at its October 30–31, 2009, meeting and recommended disposition of the human remains to the Tuscarora Nation of New York.
A March 4, 2010, letter from the Designated Federal Official, writing on behalf of the Secretary of the Interior, transmitted the authorization for the College to effect disposition of the physical remains to the Tuscarora Nation of New York, contingent on the publication of a Notice of Inventory Completion in the Federal Register. This notice fulfills that requirement.
Representatives of any other Indian tribe that believes itself to be culturally affiliated with the human remains should contact Dr. Louis Terracio, New York University College of Dentistry, 345 East 24th St., New York, NY 10010, telephone (212) 998–9917, before July 12, 2010. Disposition of the human remains to the Tuscarora Nation of New York may proceed after that date if no additional claimants come forward.
The New York University College of Dentistry is responsible for notifying the
Tuscarora Nation of New York that this notice has been published.
Dated: May 27, 2010 David Tarler, Acting Manager, National NAGPRA Program. [FR Doc. 2010–14039 Filed 6–10–10; 8:45 am]
BILLING CODE 4312–50–S
INTERNATIONAL TRADE COMMISSION
[Investigation Nos. 731–TA–1174–1175 (Final)]
Seamless Refined Copper Pipe and Tube From China and Mexico
AGENCY: International Trade Commission. ACTION: Scheduling of the final phase of antidumping investigations.
SUMMARY: The Commission hereby gives notice of the scheduling of the final phase of antidumping investigation Nos. 731–TA–1174–1175 (Final) under section 735(b) of the Tariff Act of 1930 (19 U.S.C. 1673d(b)) (the Act) to determine whether an industry in the United States is materially injured or threatened with material injury, or the establishment of an industry in the United States is materially retarded, by reason of less-than-fair-value imports from China and Mexico of seamless refined copper pipe and tube, provided for in subheadings 7411.10.10 and 8415.90.80 of the Harmonized Tariff Schedule of the United States.1
VerDate Mar<15>2010 15:04 Jun 10, 2010 Jkt 220001 PO 00000 Frm 00093 Fmt 4703 Sfmt 4703 E:\FR\FM\11JNN1.SGM 11JNN1WR
eier
-Avi
les
on D
SK
GB
LS3C
1PR
OD
with
NO
TIC
ES
33331 Federal Register / Vol. 75, No. 112 / Friday, June 11, 2010 / Notices
‘‘Refined copper’’ is defined as: (1) Metal containing at least 99.85 percent by weight of copper; or (2) metal containing at least 97.5 percent by weight of copper, provided that the content by weight of any other element does not exceed the following limits: Ag–Silver 0.25; As–Arsenic 0.5; Cd–Cadmium 1.3; Cr–Chromium 1.4; Mg–Magnesium 0.8; Pb–Lead 1.5; S–Sulfur 0.7; Sn–Tin 0.8; Te–Tellurium 0.8; Zn–Zinc 1.0; Zr–Zirconium 0.3; Other elements (each) 0.3. Excluded from the scope of these investigations are all seamless circular hollows of refined copper less than 12 inches in length whose OD (actual) exceeds its length. The products subject to these investigations are currently classifiable under subheadings 7411.10.1030 and 7411.10.1090, of the Harmonized Tariff Schedule of the United States (HTS). Products subject to these investigations may also enter under HTSUS subheadings 7407.10.1500, 7419.99.5050, 8415.90.8065, and 8415.90.8085.
For further information concerning the conduct of this phase of the investigations, hearing procedures, and rules of general application, consult the Commission’s Rules of Practice and Procedure, part 201, subparts A through E (19 CFR part 201), and part 207, subparts A and C (19 CFR part 207). DATES: Effective Date: May 5, 2010. FOR FURTHER INFORMATION CONTACT: Edward Petronzio (202–205–3176), Office of Investigations, U.S. International Trade Commission, 500 E Street, SW., Washington, DC 20436. Hearing-impaired persons can obtain information on this matter by contacting the Commission’s TDD terminal on 202– 205–1810. Persons with mobility impairments who will need special assistance in gaining access to the Commission should contact the Office of the Secretary at 202–205–2000. General information concerning the Commission may also be obtained by accessing its Internet server (http:// www.usitc.gov). The public record for these investigations may be viewed on the Commission’s electronic docket (EDIS) at http://edis.usitc.gov. SUPPLEMENTARY INFORMATION:
Background: The final phase of these investigations are being scheduled as a result of affirmative preliminary determinations by the Department of Commerce that imports of seamless refined copper pipe and tube from China and Mexico are being sold in the United States at less than fair value within the meaning of section 733 of the Act (19 U.S.C. 1673b). These investigations were requested in a petition filed on September 30, 2009, by Cerro Flow Products, Inc., St. Louis, MO; Kobe Wieland Copper Products, LLC, Pine Hall, NC; Mueller Copper Tube Products, Inc. and Mueller Copper Tube Company, Inc., Memphis, TN.
Participation in the investigations and public service list: Persons, including industrial users of the subject merchandise and, if the merchandise is
sold at the retail level, representative consumer organizations, wishing to participate in the final phase of these investigations as parties must file an entry of appearance with the Secretary to the Commission, as provided in section 201.11 of the Commission’s rules, no later than 21 days prior to the hearing date specified in this notice. A party that filed a notice of appearance during the preliminary phase of the investigations need not file an additional notice of appearance during this final phase. The Secretary will maintain a public service list containing the names and addresses of all persons, or their representatives, who are parties to the investigations.
Limited disclosure of business proprietary information (BPI) under an administrative protective order (APO) and BPI service list: Pursuant to § 207.7(a) of the Commission’s rules, the Secretary will make BPI gathered in the final phase of these investigations available to authorized applicants under the APO issued in the investigations, provided that the application is made no later than 21 days prior to the hearing date specified in this notice. Authorized applicants must represent interested parties, as defined by 19 U.S.C. 1677(9), who are parties to the investigations. A party granted access to BPI in the preliminary phase of the investigations need not reapply for such access. A separate service list will be maintained by the Secretary for those parties authorized to receive BPI under the APO.
Staff report: The prehearing staff report in the final phase of these investigations will be placed in the nonpublic record on September 9, 2010, and a public version will be issued thereafter, pursuant to section 207.22 of the Commission’s rules.
Hearing: The Commission will hold a hearing in connection with the final phase of these investigations beginning at 9:30 a.m. on September 23, 2010, at the U.S. International Trade Commission Building. Requests to appear at the hearing should be filed in writing with the Secretary to the Commission on or before September 17, 2010. A nonparty who has testimony that may aid the Commission’s deliberations may request permission to present a short statement at the hearing. All parties and nonparties desiring to appear at the hearing and make oral presentations should attend a prehearing conference to be held at 9:30 a.m. on September 21, 2010, at the U.S. International Trade Commission Building. Oral testimony and written materials to be submitted at the public hearing are governed by §§ 201.6(b)(2),
201.13(f), and 207.24 of the Commission’s rules. Parties must submit any request to present a portion of their hearing testimony in camera no later than 7 business days prior to the date of the hearing.
Written submissions: Each party who is an interested party shall submit a prehearing brief to the Commission. Prehearing briefs must conform with the provisions of § 207.23 of the Commission’s rules; the deadline for filing is September 16, 2010. Parties may also file written testimony in connection with their presentation at the hearing, as provided in § 207.24 of the Commission’s rules, and posthearing briefs, which must conform with the provisions of § 207.25 of the Commission’s rules. The deadline for filing posthearing briefs is September 30, 2010; witness testimony must be filed no later than three days before the hearing. In addition, any person who has not entered an appearance as a party to the investigations may submit a written statement of information pertinent to the subject of the investigations, including statements of support or opposition to the petition, on or before September 30, 2010. On October 20, 2010, the Commission will make available to parties all information on which they have not had an opportunity to comment. Parties may submit final comments on this information on or before October 22, 2010, but such final comments must not contain new factual information and must otherwise comply with § 207.30 of the Commission’s rules. All written submissions must conform with the provisions of § 201.8 of the Commission’s rules; any submissions that contain BPI must also conform with the requirements of §§ 201.6, 207.3, and 207.7 of the Commission’s rules. The Commission’s rules do not authorize filing of submissions with the Secretary by facsimile or electronic means, except to the extent permitted by section 201.8 of the Commission’s rules, as amended, 67 FR. 68036 (November 8, 2002). Even where electronic filing of a document is permitted, certain documents must also be filed in paper form, as specified in II (C) of the Commission’s Handbook on Electronic Filing Procedures, 67 FR 68168, 68173 (November 8, 2002).
Additional written submissions to the Commission, including requests pursuant to § 201.12 of the Commission’s rules, shall not be accepted unless good cause is shown for accepting such submissions, or unless the submission is pursuant to a specific request by a Commissioner or Commission staff.
VerDate Mar<15>2010 15:04 Jun 10, 2010 Jkt 220001 PO 00000 Frm 00094 Fmt 4703 Sfmt 4703 E:\FR\FM\11JNN1.SGM 11JNN1WR
eier
-Avi
les
on D
SK
GB
LS3C
1PR
OD
with
NO
TIC
ES

33332 Federal Register / Vol. 75, No. 112 / Friday, June 11, 2010 / Notices
In accordance with §§ 201.16(c) and 207.3 of the Commission’s rules, each document filed by a party to the investigations must be served on all other parties to the investigations (as identified by either the public or BPI service list), and a certificate of service must be timely filed. The Secretary will not accept a document for filing without a certificate of service.
Authority: These investigations are being conducted under authority of title VII of the Tariff Act of 1930; this notice is published pursuant to § 207.21 of the Commission’s rules.
Issued: June 7, 2010. By order of the Commission.
William R. Bishop, Acting Secretary to the Commission. [FR Doc. 2010–14035 Filed 6–10–10; 8:45 am]
BILLING CODE P
DEPARTMENT OF JUSTICE
Office of Justice Programs
Office of Juvenile Justice and Delinquency Prevention
[OMB Number 1121–0219]
Agency Information Collection Activities: Proposed Collection; Comments Requested
ACTION: 30-Day Notice of Information Collection Under Review; (Reinstatement, without change, of a previously approved collection for which approval has expired) Juvenile Residential Facility Census.
The Department of Justice (DOJ), Office of Justice Programs, Office of Juvenile Justice and Delinquency Prevention, will be submitting the following information collection request to the Office of Management and Budget (OMB) for review and approval in accordance with the Paperwork Reduction Act of 1995. The proposed information collection is published to obtain comments from the public and affected agencies. This proposed information collection was previously published in the Federal Register Volume 75, Number 67, page 17956 on April 8, 2010, allowing for a 60-day comment period.
The purpose of this notice is to allow for an additional 30 days for public comment until July 12, 2010. This process is conducted in accordance with 5 CFR 1320.10.
Written comments and/or suggestions regarding the items contained in this notice, especially the estimated public burden and associated response time,
should be directed to The Office of Management and Budget, Office of Information and Regulatory Affairs, Attention Department of Justice Desk Officer, Washington, DC 20503. Additionally, comments may be submitted to OMB via facsimile to (202) 395–7285.
Request written comments and suggestions from the public and affected agencies concerning the proposed collection of information are encouraged. Your comments should address one or more of the following four points:
(1) Evaluate whether the proposed collection of information is necessary for the proper performance of the functions of the agency, including whether the information will have practical utility;
(2) Evaluate the accuracy of the agencies estimate of the burden of the proposed collection of information, including the validity of the methodology and assumptions used;
(3) Enhance the quality, utility, and clarity of the information to be collected; and
(4) Minimize the burden of the collection of information on those who are to respond, including through the use of appropriate automated, electronic, mechanical, or other technological collection techniques or other forms of information technology, e.g., permitting electronic submission of responses.
Overview of This Information Collection
(1) Type of information collection: Extension of previously approved collection.
(2) The title of the form/collection: Juvenile Residential Facility Census.
(3) The agency form number, if any, and the applicable component of the Department sponsoring the collection: The form number is CJ–15, Office of Juvenile Justice and Delinquency Prevention, United States Department of Justice.
(4) Affected public who will be asked or required to respond, as well as a brief abstract: Primary: Federal Government, State, Local or Tribal.
Other: Not-for-profit institutions; Business or other for-profit.
This collection will gather information necessary to routinely monitor the types of facilities into which the juvenile justice system places young persons and the services available in these facilities.
(5) An estimate of the total number of respondents and the amount of time estimated for an average respondent to respond/reply: It is estimated that 3,500
respondents will complete a 2-hour questionnaire.
(6) An estimate of the total public burden (in hours) associated with the collection: The total hour burden to complete the nominations is 7,000 annual burden hours.
If additional information is required contact: Lynn Bryant, Department Clearance Officer, Policy and Planning Staff, Justice Management Division, Department of Justice, Patrick Henry Building, Suite 1600, 601 D Street, NW., Washington, DC 20530.
Dated: June 7, 2010. Lynn Bryant, Department Clearance Officer, PRA, Department of Justice. [FR Doc. 2010–14000 Filed 6–10–10; 8:45 am]
BILLING CODE 4410–18–P
DEPARTMENT OF JUSTICE
Federal Bureau of Investigation
[OMB Number 1110–0015]
Agency Information Collection Activities; Proposed Collection; Comments Requested
ACTION: 60-Day Notice of Information Collection Under Review: Extension of current collection. Hate Crime Incident Report; Quarterly Hate Crime Report.
The Department of Justice, Federal Bureau of Investigation, Criminal Justice Information Services Division will be submitting the following information collection request to the Office of Management and Budget (OMB) for review and clearance in accordance with established review procedures of the Paperwork Reduction Act of 1995. The proposed information collection is published to obtain comments from the public and affected agencies. Comments are encouraged and will be accepted until August 10, 2010. This process is conducted in accordance with 5 CFR 1320.10.
All comments and suggestions, or questions regarding additional information, to include obtaining a copy of the proposed information collection instrument with instructions, should be directed to Gregory E. Scarbro, Unit Chief, Federal Bureau of Investigation, Criminal Justice Information Services Division (CJIS), Module E–3, 1000 Custer Hollow Road, Clarksburg, West Virginia 26306, or facsimile to (304) 625–3566.
Written comments and suggestions from the public and affected agencies concerning them proposed collection of information are encouraged. Comments
VerDate Mar<15>2010 15:04 Jun 10, 2010 Jkt 220001 PO 00000 Frm 00095 Fmt 4703 Sfmt 4703 E:\FR\FM\11JNN1.SGM 11JNN1WR
eier
-Avi
les
on D
SK
GB
LS3C
1PR
OD
with
NO
TIC
ES

60723 Federal Register / Vol. 75, No. 190 / Friday, October 1, 2010 / Notices
1 On May 28, 2010, the Department also published in the Federal Register, Seamless Refined Copper Pipe and Tube From Mexico: Correction to Notice of Preliminary Determination of Sales at Less Than Fair Value 75 FR 29990 (May 28, 2010) and Postponement of Final Determination to correct the Scope section of the Preliminary Determination.
2 See Memorandum to the File titled ‘‘Verification of the Sales Response of IUSA S.A. de C.V. (‘‘IUSA’’) and its affiliates (‘‘IUSA’’) in the Antidumping Duty Investigation of Seamless Refined Copper Pipe and Tube from Mexico, dated July 21, 2010’’ ‘‘Verification of the Cost Response of IUSA, S.A. de C.V. in the Antidumping Duty Investigation of Seamless Refined Copper Pipe and Tube from Mexico, dated July 19, 2010’’ ‘‘Verification of the Sales Response of Nacobre, S.A. de C.V. and its affiliates (‘‘Nacobre’’) in the Antidumping Duty Investigation of Seamless Refined Copper Pipe and Tube from Mexico,’’ dated July 21, 2010, and ‘‘Verification of the Cost Response of Nacobre, S.A. de C.V. and its affiliates (‘‘Nacobre’’) in the Antidumping Duty Investigation of Seamless Refined Copper Pipe and Tube from Mexico,’’ dated July 22, 2010.
3 See IUSA’s July 23, 2010, and Nacobre’s July 26, 2010, submission of the sales and cost databases.
4 The petitioners in this investigation are Cerro Flow Products, Inc., KobeWieland Copper Products, LLC, Mueller Copper Tube Products, Inc., and Mueller Copper Tube Company, Inc. (collectively, ‘‘petitioners’’).
support your comments as you think necessary.
Special Accommodations
These meetings are accessible to people with disabilities. Requests for sign language interpretation or other auxiliary aids should be directed to Rachel Sprague, (808) 944–2200 (phone) or (808) 973–2941 (fax), at least 5 days before the scheduled meeting date.
Dated: September 22, 2010. Eric C. Schwaab, Assistant Administrator for Fisheries, National Marine Fisheries Service. [FR Doc. 2010–24738 Filed 9–30–10; 8:45 am]
BILLING CODE 3510–22–S
DEPARTMENT OF COMMERCE
International Trade Administration
[A–201–838]
Seamless Refined Copper Pipe and Tube From Mexico: Final Determination of Sales at Less Than Fair Value
AGENCY: Import Administration, International Trade Administration, Department of Commerce. SUMMARY: The U.S. Department of Commerce (‘‘the Department’’) has determined that imports of seamless refined copper pipe and tube (‘‘copper pipe and tube’’) from Mexico are being, or are likely to be, sold in the United States at less than fair value (‘‘LTFV’’), as provided in section 735 of the Tariff Act of 1930, as amended (‘‘the Act’’). The estimated margins of sales at LTFV are listed in the ‘‘Continuation of Suspension of Liquidation’’ section of this notice. DATES: Effective Date: October 1, 2010. FOR FURTHER INFORMATION CONTACT: Joy Zhang or George McMahon, AD/CVD Operations, Office 3, Import Administration, International Trade Administration, U.S. Department of Commerce, 14th Street and Constitution Avenue, NW., Washington DC 20230; telephone: (202) 482–1168 or (202) 482– 1167, respectively. SUPPLEMENTARY INFORMATION:
Background
On May 12, 2010, the Department published in the Federal Register its preliminary determination on copper pipe and tube from Mexico. See Seamless Refined Copper Pipe and Tube from Mexico: Notice of Preliminary Determination of Sales at Less Than Fair Value and Postponement of Final Determination, 75 FR 26726 (May 12,
2010) (‘‘Preliminary Determination).1 We selected the following companies for individual examination: IUSA S.A. de C.V. (‘‘IUSA’’) and Nacional de Cobre, S.A. de C.V. (‘‘Nacobre’’).
See Preliminary Determination, 75 FR at 26726.
As provided in section 782(i) of the Act, we conducted sales and cost verifications of the questionnaire responses submitted by IUSA and Nacobre. We used standard verification procedures, including examination of relevant accounting and production records, as well as original source documents provided by IUSA and Nacobre.2 All verification reports are on file and available in the Central Records Unit (‘‘CRU’’), Room 7046, of the main Department of Commerce building.
On July 23, 2010 and July 26, 2010, respectively, IUSA and Nacobre, submitted sales and cost databases with revisions that reflect the minor corrections presented during their respective verifications.3 IUSA, Nacobre, and the petitioners 4 filed their case briefs with the Department on August 4, 2010, and rebuttal briefs on August 10, 2010. At the petitioners’ request, we held a hearing on August 12, 2010.
We used IUSA’s July 23, 2010, and Nacobre’s July 26, 2010, sales and cost databases to calculate IUSA’s and Nacobre’s antidumping duty margin. No parties have objected to the use of these databases.
On September 13, 2010, the Department placed a memorandum on the record of this case regarding a recent
ex parte meeting in which Francisco J. Sanchez, Under Secretary for International Trade Administration met with Mr. Carlos Peralta, President and Director General of IUSA. The Department invited interested parties to comment on this memorandum by September 17, 2010; however, no comments were received.
Period of Investigation The period of investigation (‘‘POI’’) is
July 1, 2008, to June 30, 2009. This period corresponds to the four most recent fiscal quarters prior to the month of the filing of the petition. See 19 CFR 351.204(b)(1).
Scope of Investigation For the purpose of this investigation,
the products covered are all seamless circular refined copper pipes and tubes, including redraw hollows, greater than or equal to 6 inches (152.4 mm) in length and measuring less than 12.130 inches (308.102 mm) (actual) in outside diameter (‘‘OD’’), regardless of wall thickness, bore (e.g., smooth, enhanced with inner grooves or ridges), manufacturing process (e.g., hot finished, cold-drawn, annealed), outer surface (e.g., plain or enhanced with grooves, ridges, fins, or gills), end finish (e.g., plain end, swaged end, flared end, expanded end, crimped end, threaded), coating (e.g., plastic, paint), insulation, attachments (e.g., plain, capped, plugged, with compression or other fitting), or physical configuration (e.g., straight, coiled, bent, wound on spools).
The scope of this investigation covers, but is not limited to, seamless refined copper pipe and tube produced or comparable to the American Society for Testing and Materials (‘‘ASTM’’) ASTM– B42, ASTM–B68, ASTM–B75, ASTM– B88, ASTM–B88M, ASTM–B188, ASTM–B251, ASTM–B251M, ASTM– B280, ASTM–B302, ASTM–B306, ASTM–359, ASTM–B743, ASTM–B819, and ASTM–B903 specifications and meeting the physical parameters described therein. Also included within the scope of this investigation are all sets of covered products, including ‘‘line sets’’ of seamless refined copper tubes (with or without fittings or insulation) suitable for connecting an outdoor air conditioner or heat pump to an indoor evaporator unit. The phrase ‘‘all sets of covered products’’ denotes any combination of items put up for sale that is comprised of merchandise subject to the scope.
‘‘Refined copper’’ is defined as: (1) Metal containing at least 99.85 percent by weight of copper; or (2) metal containing at least 97.5 percent by weight of copper, provided that the
VerDate Mar<15>2010 17:34 Sep 30, 2010 Jkt 220001 PO 00000 Frm 00013 Fmt 4703 Sfmt 4703 E:\FR\FM\01OCN1.SGM 01OCN1emcd
onal
d on
DS
K2B
SO
YB
1PR
OD
with
NO
TIC
ES

60724 Federal Register / Vol. 75, No. 190 / Friday, October 1, 2010 / Notices
5 For a discussion of these changes, see the Issues and Decision Memorandum and memorandum titled, ‘‘Final Determination of Sales at Less Than Fair Value in the Antidumping Duty Investigation of Seamless Refined Copper Pipe and Tube from Mexico—Sales Analysis Memorandum for IUSA’’ (‘‘IUSA Sales Analysis Memo’’); ‘‘Final Determination of Sales at Less Than Fair Value in the Antidumping Duty Investigation of Seamless Refined Copper Pipe and Tube from Mexico—Sales Analysis Memorandum for Nacobre’’ (‘‘Nacobre Sales Analysis Memo’’); ‘‘Cost of Production and Constructed Value Calculation Adjustments for the Final Determination—IUSA’’ (‘‘IUSA Cost Analysis Memo’’); and ‘‘Cost of Production and Constructed Value Calculation Adjustments for the Final Determination—Nacobre’’ (‘‘Nacobre Cost Analysis Memo’’), dated September 24, 2010.
6 See Steel Wire Garment Hangers from the People’s Republic of China: Final Determination of Sales at Less Than Fair Value, 73 FR 47587, 47591 (August 14, 2008).
content by weight of any other element does not exceed the following limits:
Element Limiting content
percent by weight
Ag—Silver ........................... 0 .25 As—Arsenic ........................ 0 .5 Cd—Cadmium .................... 1 .3 Cr—Chromium .................... 1 .4 Mg—Magnesium ................. 0 .8 Pb—Lead ............................ 1 .5 S—Sulfur ............................ 0 .7 Sn—Tin ............................... 0 .8 Te—Tellurium ..................... 0 .8 Zn—Zinc ............................. 1 .0 Zr—Zirconium ..................... 0 .3 Other elements (each) ........ 0 .3
Excluded from the scope of this investigation are all seamless circular hollows of refined copper less than 12 inches in length whose OD (actual) exceeds its length. The products subject to this investigation are currently classifiable under subheadings 7411.10.1030 and 7411.10.1090 of the Harmonized Tariff Schedule of the United States (‘‘HTSUS’’). Products subject to this investigation may also enter under HTSUS subheadings 7407.10.1500, 7419.99.5050, 8415.90.8065, and 8415.90.8085. Although the HTSUS subheadings are provided for convenience and customs purposes, the written description of the scope of this investigation is dispositive.
Analysis of Comments Received All issues raised in the case and
rebuttal briefs by parties to this antidumping duty investigation are addressed in the ‘‘Issues and Decision Memorandum for the Antidumping Duty Investigation of Seamless Refined Copper Pipe and Tube from Mexico’’ (‘‘Decision Memorandum’’) from Acting Deputy Assistant Secretary for Antidumping and Countervailing Duty Operations, Susan H. Kuhbach, to Deputy Assistant Secretary for Import Administration Ronald K. Lorentzen, dated September 24, 2010, which is hereby adopted by this notice. A list of the issues which parties have raised and to which we have responded, all of which are in the Decision Memorandum, is attached to this notice as an appendix. Parties can find a complete discussion of all issues raised in this investigation and the corresponding recommendations in the Decision Memorandum which is on file in the CRU of the main Department of Commerce building, Room 7046, and is accessible on the Web at http:// ia.ita.doc.gov/frn/index.html. The paper copy and electronic version of the Decision Memorandum are identical in content.
Changes Since the Preliminary Determination
Based on our analysis of the comments received and our findings at verification, we have made certain changes to the margin calculations for IUSA and Nacobre based on the sales and cost verifications.5
Cost of Production As explained in the Preliminary
Determination, we conducted an investigation concerning sales at prices below the cost of production in the home market. We found that, for certain specific products, more than 20 percent of IUSA and Nacobre’s home market sales were at prices less than the cost of production and, in addition, such sales did not provide for the recovery of costs within a reasonable period of time. Therefore, we disregarded these sales and used the remaining sales as the basis for determining normal value in accordance with section 773(b)(1) of the Act. Based on this test, for this final determination we have disregarded below-cost sales by IUSA and Nacobre.
Continuation of Suspension of Liquidation
Pursuant to section 735(c)(1)(B) of the Act, we will instruct U.S. Customs and Border Protection (‘‘CBP’’) to continue to suspend liquidation of all entries of subject merchandise from Mexico entered, or withdrawn from warehouse, for consumption on or after May 12, 2010, the date of the publication of the Preliminary Determination. We will instruct CBP to require a cash deposit or the posting of a bond equal to the weighted-average margin, as indicated below, as follows: (1) The rates for IUSA and Nacobre will be the rates we have determined in this final determination; (2) if the exporter is not a firm identified in this investigation but the producer is, the rate will be the rate established for the producer of the subject merchandise; (3) the rate for all other producers or exporters will be 28.16 percent as discussed in the ‘‘All-Others
Rate’’’ section below. These suspension- of-liquidation instructions will remain in effect until further notice.
Final Determination
The final antidumping duty margins are as follows:
Manufacturer/exporter Weighted-av-erage margin
(percent)
IUSA S.A. de C.V. ................ 24.89 Nacional de Cobre, S.A. de
C.V. ................................... 31.43 All Others .............................. 28.16
All-Others Rate
Section 735(c)(5)(A) of the Act provides that the estimated ‘‘All Others’’ rate shall be an amount equal to the weighted average of the estimated weighted-average dumping margins established for exporters and producers individually investigated, excluding any zero or de minimis margins, and any margins determined entirely under section 776 of the Act. IUSA and Nacobre are the only respondents in this investigation for which the Department has calculated a company-specific rate that is not zero or de minimis. Therefore, because there are only two relevant weighted-average dumping margins for this final determination and because using a weighted average risks disclosure of business proprietary information, the ‘‘all others’’ rate is a simple-average of these two values, which is 28.16 percent.6
Disclosure
The Department will disclose the calculations performed in connection with this final determination within five days of the date of publication of this notice to parties in this proceeding. See 19 CFR 351.224(b).
International Trade Commission Notification
In accordance with section 735(d) of the Act, we have notified the International Trade Commission (‘‘ITC’’) of our final determination. As our final determination is affirmative, the ITC will determine within 45 days whether imports of the subject merchandise are causing material injury or threat of material injury to an industry in the United States. If the ITC determines that material injury or threat of injury does not exist, the proceeding will be terminated and all securities posted will be refunded or canceled. If the ITC
VerDate Mar<15>2010 17:34 Sep 30, 2010 Jkt 220001 PO 00000 Frm 00014 Fmt 4703 Sfmt 4703 E:\FR\FM\01OCN1.SGM 01OCN1emcd
onal
d on
DS
K2B
SO
YB
1PR
OD
with
NO
TIC
ES
60725 Federal Register / Vol. 75, No. 190 / Friday, October 1, 2010 / Notices
3 See Letter from Petitioners to the Secretary of Commerce, ‘‘Seamless Refined Copper Pipe and Tube from the People’s Republic of China; Investigation; Case Brief of Petitioners’’ (July 2, 2010); Letter from Golden Dragon to the Secretary of Commerce, ‘‘Seamless Refined Copper Pipe and Tube from the People’s Republic of China’’ (July 2, 2010); Letter from the Hailiang Group to the Secretary of Commerce, ‘‘Seamless Refined Copper Pipe & Tube from the People’s Republic of China: The Hailiang Group—Administrative Case Brief’’ (July 2, 2010).
4 See Letter from Petitioners to the Secretary of Commerce, ‘‘Seamless Refined Copper Pipe and Tube from the People’s Republic of China; Investigation; Rebuttal Brief of Petitioners’’ (July 9, 2010); Letter from Golden Dragon to the Secretary of Commerce, ‘‘Seamless Refined Copper Pipe and Tube from the People’s Republic of China’’ (July 9, 2010); Letter from the Hailiang Group to the Secretary of Commerce, ‘‘Seamless Refined Copper Pipe & Tube from the People’s Republic of China: Rebuttal Brief of the Hailiang Group’’ (July 9, 2010).
5 See Memorandum from Shawn Higgins, International Trade Compliance Analyst, AD/CVD Operations, Office 4, ‘‘Antidumping Duty Investigation of Seamless Refined Copper Pipe and Tube from the People’s Republic of China: Wage Data’’ (August 3, 2010).
6 See Letter from Petitioners to the Secretary of Commerce, ‘‘Seamless Refined Copper Pipe and Tube from China; Petitioners’ Comments on the Surrogate Value for Labor’’ (August 9, 2010); Letter from Golden Dragon to the Secretary of Commerce, ‘‘Seamless Refined Copper Pipe and Tube from the People’s Republic of China: Golden Dragon Precise Copper Tube Group, Inc.’’ (August 9, 2010).
determines that such injury does exist, we will issue an antidumping duty order directing CBP to assess antidumping duties on all imports of the subject merchandise entered, or withdrawn from warehouse, for consumption on or after the effective date of the suspension of liquidation.
Destruction of Proprietary Information
This notice also serves as a reminder to parties subject to administrative protective orders (APO) of their responsibility concerning the disposition of proprietary information disclosed under APO as explained in the APO itself. See 19 CFR 351.305(a)(3). Timely written notification of the destruction of APO materials or conversion to judicial protective order is hereby requested. Failure to comply with the regulations and terms of an APO is a sanctionable violation.
We are issuing and publishing this determination and notice in accordance with sections 735(d) and 777(i) of the Act.
Dated: September 24, 2010.
Ronald K. Lorentzen, Deputy Assistant Secretary for Import Administration.
Appendix
List of Issues in the Issues and Decision Memorandum
Comment 1: Comments Regarding the Investigation
Comment 2: Alternative Cost Averaging Methodology
Comment 3: Cost Recovery Test Comment 4: Model Matching Hierarchy Comment 5: Nacobre’s U.S. Date of Sale Comment 6: Treatment of Nacobre’s General
and Administrative Expense Ratio Comment 7: Nacobre’s Weight Basis Comment 8: Treatment of the Negative Value
of Certain U.S. Expense Variables for IUSA
Comment 9: Treatment of Early Payment Discounts for IUSA’s Home Market Sales
Comment 10: IUSA’s Packing Costs Comment 11: Further Manufactured Line
Sets Comment 12: ‘‘All Others’’ Rate
[FR Doc. 2010–24719 Filed 9–30–10; 8:45 am]
BILLING CODE 3510–DS–P
DEPARTMENT OF COMMERCE
International Trade Administration
[A–570–964]
Seamless Refined Copper Pipe and Tube From the People’s Republic of China: Final Determination of Sales at Less Than Fair Value
AGENCY: Import Administration, International Trade Administration, Department of Commerce. DATES: Effective Date: October 1, 2010. SUMMARY: On May 12, 2010, the Department of Commerce (the ‘‘Department’’) published its preliminary determination of sales at less than fair value (‘‘LTFV’’) in the antidumping duty investigation of seamless refined copper pipe and tube (‘‘copper pipe and tube’’) from the People’s Republic of China (‘‘PRC’’).1 The Department invited interested parties to comment on the Preliminary Determination. Based on the Department’s analysis of the comments received, the Department has made changes from the Preliminary Determination. The Department determines that copper pipe and tube from the PRC is being, or is likely to be, sold in the United States at LTFV as provided in section 735 of the Tariff Act of 1930, as amended (the ‘‘Act’’). The final dumping margins for this investigation are listed in the ‘‘Final Determination’’ section below. FOR FURTHER INFORMATION CONTACT: Karine Gziryan or Shawn Higgins, AD/ CVD Operations, Office 4, Import Administration, International Trade Administration, U.S. Department of Commerce, 14th Street and Constitution Avenue, NW., Washington, DC 20230; telephone: (202) 482–4081 and (202) 482–0679, respectively. SUPPLEMENTARY INFORMATION:
Background
The Department published its Preliminary Determination of sales at LTFV and postponement of the final determination on May 12, 2010.
Between May 24, 2010, and June 1, 2010, the Department conducted verification of mandatory respondents Golden Dragon Precise Copper Tube Group, Inc. (‘‘Golden Dragon’’) and Zhejiang Hailiang Co., Ltd., Shanghai Hailiang Copper Co., Ltd., and Hong Kong Hailiang Metal Trading Limited (collectively, the ‘‘Hailiang Group’’).2
Cerro Flow Products, Inc., KobeWieland Copper Products, LLC, Mueller Copper Tube Company, Inc. (collectively, ‘‘Petitioners’’), Golden Dragon, and the Hailiang Group submitted case briefs on July 2, 2010.3 On July 9, 2010, Petitioners, Golden Dragon, and the Hailiang Group filed rebuttal briefs.4 The Department conducted a public hearing on August 4, 2010.
On August 3, 2010, the Department notified parties that as a result of the recent decision in Dorbest Ltd. v. United States, 604 F.3d 1363 (Fed. Cir. 2010) (‘‘Dorbest’’), issued by the United States Court of Appeals for the Federal Circuit (‘‘CAFC’’) on May 14, 2010, the Department would be reconsidering its valuation of the labor wage rate in this investigation. The Department placed export data on the record of the investigation and gave parties an opportunity to comment on the narrow issue of the labor wage value in light of the CAFC’s decision.5 On August 9, 2010, Petitioners and Golden Dragon submitted comments regarding the wage rate issue.6
Period of Investigation
The period of investigation (‘‘POI’’) is January 1, 2009, through June 30, 2009. This period corresponds to the two most recent fiscal quarters prior to the month
VerDate Mar<15>2010 17:34 Sep 30, 2010 Jkt 220001 PO 00000 Frm 00015 Fmt 4703 Sfmt 4703 E:\FR\FM\01OCN1.SGM 01OCN1emcd
onal
d on
DS
K2B
SO
YB
1PR
OD
with
NO
TIC
ES
60725 Federal Register / Vol. 75, No. 190 / Friday, October 1, 2010 / Notices
1 See Seamless Refined Copper Pipe and Tube from the People’s Republic of China: Preliminary Determination of Sales at Less Than Fair Value and Postponement of Final Determination, 75 FR 26716 (May 12, 2010) (‘‘Preliminary Determination’’).
2 See the ‘‘Verification’’ section below.
3 See Letter from Petitioners to the Secretary of Commerce, ‘‘Seamless Refined Copper Pipe and Tube from the People’s Republic of China; Investigation; Case Brief of Petitioners’’ (July 2, 2010); Letter from Golden Dragon to the Secretary of Commerce, ‘‘Seamless Refined Copper Pipe and Tube from the People’s Republic of China’’ (July 2, 2010); Letter from the Hailiang Group to the Secretary of Commerce, ‘‘Seamless Refined Copper Pipe & Tube from the People’s Republic of China: The Hailiang Group—Administrative Case Brief’’ (July 2, 2010).
4 See Letter from Petitioners to the Secretary of Commerce, ‘‘Seamless Refined Copper Pipe and Tube from the People’s Republic of China; Investigation; Rebuttal Brief of Petitioners’’ (July 9, 2010); Letter from Golden Dragon to the Secretary of Commerce, ‘‘Seamless Refined Copper Pipe and Tube from the People’s Republic of China’’ (July 9, 2010); Letter from the Hailiang Group to the Secretary of Commerce, ‘‘Seamless Refined Copper Pipe & Tube from the People’s Republic of China: Rebuttal Brief of the Hailiang Group’’ (July 9, 2010).
5 See Memorandum from Shawn Higgins, International Trade Compliance Analyst, AD/CVD Operations, Office 4, ‘‘Antidumping Duty Investigation of Seamless Refined Copper Pipe and Tube from the People’s Republic of China: Wage Data’’ (August 3, 2010).
6 See Letter from Petitioners to the Secretary of Commerce, ‘‘Seamless Refined Copper Pipe and Tube from China; Petitioners’ Comments on the Surrogate Value for Labor’’ (August 9, 2010); Letter from Golden Dragon to the Secretary of Commerce, ‘‘Seamless Refined Copper Pipe and Tube from the People’s Republic of China: Golden Dragon Precise Copper Tube Group, Inc.’’ (August 9, 2010).
determines that such injury does exist, we will issue an antidumping duty order directing CBP to assess antidumping duties on all imports of the subject merchandise entered, or withdrawn from warehouse, for consumption on or after the effective date of the suspension of liquidation.
Destruction of Proprietary Information
This notice also serves as a reminder to parties subject to administrative protective orders (APO) of their responsibility concerning the disposition of proprietary information disclosed under APO as explained in the APO itself. See 19 CFR 351.305(a)(3). Timely written notification of the destruction of APO materials or conversion to judicial protective order is hereby requested. Failure to comply with the regulations and terms of an APO is a sanctionable violation.
We are issuing and publishing this determination and notice in accordance with sections 735(d) and 777(i) of the Act.
Dated: September 24, 2010.
Ronald K. Lorentzen, Deputy Assistant Secretary for Import Administration.
Appendix
List of Issues in the Issues and Decision Memorandum
Comment 1: Comments Regarding the Investigation
Comment 2: Alternative Cost Averaging Methodology
Comment 3: Cost Recovery Test Comment 4: Model Matching Hierarchy Comment 5: Nacobre’s U.S. Date of Sale Comment 6: Treatment of Nacobre’s General
and Administrative Expense Ratio Comment 7: Nacobre’s Weight Basis Comment 8: Treatment of the Negative Value
of Certain U.S. Expense Variables for IUSA
Comment 9: Treatment of Early Payment Discounts for IUSA’s Home Market Sales
Comment 10: IUSA’s Packing Costs Comment 11: Further Manufactured Line
Sets Comment 12: ‘‘All Others’’ Rate
[FR Doc. 2010–24719 Filed 9–30–10; 8:45 am]
BILLING CODE 3510–DS–P
DEPARTMENT OF COMMERCE
International Trade Administration
[A–570–964]
Seamless Refined Copper Pipe and Tube From the People’s Republic of China: Final Determination of Sales at Less Than Fair Value
AGENCY: Import Administration, International Trade Administration, Department of Commerce. DATES: Effective Date: October 1, 2010. SUMMARY: On May 12, 2010, the Department of Commerce (the ‘‘Department’’) published its preliminary determination of sales at less than fair value (‘‘LTFV’’) in the antidumping duty investigation of seamless refined copper pipe and tube (‘‘copper pipe and tube’’) from the People’s Republic of China (‘‘PRC’’).1 The Department invited interested parties to comment on the Preliminary Determination. Based on the Department’s analysis of the comments received, the Department has made changes from the Preliminary Determination. The Department determines that copper pipe and tube from the PRC is being, or is likely to be, sold in the United States at LTFV as provided in section 735 of the Tariff Act of 1930, as amended (the ‘‘Act’’). The final dumping margins for this investigation are listed in the ‘‘Final Determination’’ section below. FOR FURTHER INFORMATION CONTACT: Karine Gziryan or Shawn Higgins, AD/ CVD Operations, Office 4, Import Administration, International Trade Administration, U.S. Department of Commerce, 14th Street and Constitution Avenue, NW., Washington, DC 20230; telephone: (202) 482–4081 and (202) 482–0679, respectively. SUPPLEMENTARY INFORMATION:
Background
The Department published its Preliminary Determination of sales at LTFV and postponement of the final determination on May 12, 2010.
Between May 24, 2010, and June 1, 2010, the Department conducted verification of mandatory respondents Golden Dragon Precise Copper Tube Group, Inc. (‘‘Golden Dragon’’) and Zhejiang Hailiang Co., Ltd., Shanghai Hailiang Copper Co., Ltd., and Hong Kong Hailiang Metal Trading Limited (collectively, the ‘‘Hailiang Group’’).2
Cerro Flow Products, Inc., KobeWieland Copper Products, LLC, Mueller Copper Tube Company, Inc. (collectively, ‘‘Petitioners’’), Golden Dragon, and the Hailiang Group submitted case briefs on July 2, 2010.3 On July 9, 2010, Petitioners, Golden Dragon, and the Hailiang Group filed rebuttal briefs.4 The Department conducted a public hearing on August 4, 2010.
On August 3, 2010, the Department notified parties that as a result of the recent decision in Dorbest Ltd. v. United States, 604 F.3d 1363 (Fed. Cir. 2010) (‘‘Dorbest’’), issued by the United States Court of Appeals for the Federal Circuit (‘‘CAFC’’) on May 14, 2010, the Department would be reconsidering its valuation of the labor wage rate in this investigation. The Department placed export data on the record of the investigation and gave parties an opportunity to comment on the narrow issue of the labor wage value in light of the CAFC’s decision.5 On August 9, 2010, Petitioners and Golden Dragon submitted comments regarding the wage rate issue.6
Period of Investigation
The period of investigation (‘‘POI’’) is January 1, 2009, through June 30, 2009. This period corresponds to the two most recent fiscal quarters prior to the month
VerDate Mar<15>2010 17:34 Sep 30, 2010 Jkt 220001 PO 00000 Frm 00015 Fmt 4703 Sfmt 4703 E:\FR\FM\01OCN1.SGM 01OCN1emcd
onal
d on
DS
K2B
SO
YB
1PR
OD
with
NO
TIC
ES
60726 Federal Register / Vol. 75, No. 190 / Friday, October 1, 2010 / Notices
7 See 19 CFR 351.204(b)(1). 8 See Memorandum from Susan H. Kuhbach,
Acting Deputy Assistant Secretary for Antidumping and Countervailing Duty Operations, to Ronald K. Lorentzen, Deputy Assistant Secretary for Import Administration, ‘‘Issues and Decision Memorandum for the Final Determination in the Antidumping Duty Investigation of Seamless Refined Copper Pipe and Tube from the People’s Republic of China’’ (September 24, 2010) (‘‘Issues and Decision Memorandum’’).
9 See Issues and Decision Memorandum at Comment 1; Memorandum to the File from Shawn Higgins, International Trade Compliance Analyst, AD/CVD Operations, Office 4, ‘‘Investigation of Seamless Refined Copper Pipe and Tube from the People’s Republic of China: Final Surrogate Value Memorandum,’’ (September 24, 2010) (‘‘Final Surrogate Value Memorandum’’) at 2, Attachment 3.
10 See Issues and Decision Memorandum at Comment 2; Final Surrogate Value Memorandum at 2, Attachment 4.
11 See Issues and Decision Memorandum at Comment 4; Memorandum from Shawn Higgins, International Trade Compliance Analyst, AD/CVD Operations, Office 4, to the File, ‘‘Seamless Refined Copper Pipe and Tube from the People’s Republic of China: Final Analysis Memorandum for Golden Dragon Precise Copper Tube Group, Inc.’’ (September 24, 2010) (‘‘Golden Dragon’s Final Analysis Memorandum’’) at 1–2, Attachment 1.
12 See Issues and Decision Memorandum at Comment 8; Golden Dragon’s Final Analysis Memorandum at 2, Attachment 3.
13 See Memorandum from Shawn Higgins, International Trade Compliance Analyst, AD/CVD Operations, Office 4, to the File, ‘‘Antidumping Duty Investigation of Seamless Refined Copper Pipe and Tube from the People’s Republic of China: Verification of the Questionnaire Responses of Golden Dragon Precise Copper Tube Group, Inc.’’ (June 15, 2010) (‘‘Golden Dragon’s Verification Report’’) at 3; Golden Dragon’s Final Analysis Memorandum at 2.
14 Id. 15 Id. 16 See Golden Dragon’s Verification Report at 3;
Golden Dragon’s Final Analysis Memorandum at 3. 17 See Golden Dragon’s Verification Report at 2,
29; Golden Dragon’s Final Analysis Memorandum at 3.
18 See Issues and Decision Memorandum at Comment 9; Golden Dragon’s Final Analysis Memorandum at 3.
19 Id.
20 See Golden Dragon’s Verification Report at 33; Golden Dragon’s Final Analysis Memorandum at 3.
21 See Golden Dragon’s Verification Report at 32; Golden Dragon’s Final Analysis Memorandum at 3–4, Attachment 4.
22 Id. 23 See Golden Dragon’s Verification Report at 2,
18; Golden Dragon’s Final Analysis Memorandum at 4.
24 See Golden Dragon’s Verification Report at 2, 22; Golden Dragon’s Final Analysis Memorandum at 4.
25 See Golden Dragon’s Verification Report at 2, 22–23; Golden Dragon’s Final Analysis Memorandum at 4.
26 See Issues and Decision Memorandum at Comment 12; Memorandum from Karine Gziryan, International Trade Compliance Analyst, AD/CVD Operations, Office 4, to the File, ‘‘Seamless Refined Copper Pipe and Tube from the People’s Republic of China: Final Analysis Memorandum for the Hailiang Group’’ (September 24, 2010) (‘‘Hailiang Group’s Final Analysis Memorandum’’) at 2.
27 See Issues and Decision Memorandum at Comment 13; Hailiang Group’s Final Analysis Memorandum at 2.
of the filing of the petition (i.e., September, 2009).7
Analysis of Comments Received All issues raised in the case and
rebuttal briefs by parties to this investigation, as well as comments received pursuant to the Department’s requests, are addressed in the Issues and Decision Memorandum.8 A list of the issues which parties raised and to which the Department responds in the Issues and Decision Memorandum is attached to this notice as Appendix I. The Issues and Decision Memorandum is a public document that is on file in the Central Records Unit, Room 7046 of the main Commerce building and accessible at http://trade.gov/ia. The paper copy and electronic version of the memorandum are identical in content.
Changes Since the Preliminary Determination
Changes Applicable to Multiple Companies
1. Pursuant to Dorbest, the Department calculated an hourly wage rate by averaging earnings and/or wages in countries that are economically comparable to the PRC and that are significant producers of comparable merchandise.9
2. The Department made several adjustments to the calculations of the surrogate financial ratios.10
Changes Specific to Golden Dragon 1. The Department treated Golden
Dragon’s copper cathode purchases from a certain PRC supplier as market economy purchases.11
2. In accordance with section 777A(a)(2) of the Act and 19 CFR 351.413, the Department declined to make certain adjustments to the calculation of indirect U.S. selling expenses for salaries paid to two employees of Golden Dragon who worked in the United States during the POI because these adjustments are insignificant in relation to the price of the merchandise.12
3. The Department revised the reported wall thickness for one control number (‘‘CONNUM’’).13
4. The Department revised the reported electricity consumption to account for indirect consumption of electricity.14
5. The Department revised the reported indirect labor to account for previously unreported labor hours.15
6. The Department revised the reported water consumption to reflect the water consumption calculated in Golden Dragon’s cost reconciliation.16
7. The Department revised the reported direct labor and electricity consumption to reflect the correct production quantities at all stages of the production process.17
8. The Department revised the reported electricity consumption to reflect the correct allocation of electricity to the different inner grooved tubes (‘‘IGT’’) based on the IGT forming processing stage consumption that corresponds to each type of IGT.18
9. The Department adjusted the reported electricity and direct labor consumption for a particular CONNUM to reflect the lower electricity and direct labor usage rates for a nine millimeter (mm) IGT product instead of the higher rates for a seven mm product.19
10. The Department revised the reported consumption of plastic plugs, wood boards, rubber plugs, and paper
pads to reflect the weights measured by the Department during verification.20
11. The Department revised the distances between Golden Dragon and several of its suppliers.21
12. The Department revised the distances between Golden Dragon and several seaports, including the nearest seaport.22
13. The Department revised the gross unit price of eight invoices in which the sales amount recorded in the U.S. sales database was less than the sales amount recorded in the records of the U.S. sales staff.23
14. The Department revised the reported international freight amount to include a security fee that was not reported in the U.S. sales database.24
15. The Department revised the credit period over which the reported credit expenses are based from the period between the date of sale and the payment date to the period between the date of shipment and the payment date.25
Changes Specific to the Hailiang Group
1. The Department determined that the Hailiang Group has failed to cooperate because it has not acted to the best of its ability to comply with the Department’s requests to provide factors of production (‘‘FOP’’) on a product- group specific basis. Therefore, pursuant to section 776(b) of the Act, the Department has found that, in selecting from among the facts otherwise available (‘‘FA’’), an adverse inference is appropriate for the Hailiang Group.26
2. The Department revised the weighted-average per-unit FOP for water to include the FOP for water reported on a cubic meter per kilogram basis.27
VerDate Mar<15>2010 17:34 Sep 30, 2010 Jkt 220001 PO 00000 Frm 00016 Fmt 4703 Sfmt 4703 E:\FR\FM\01OCN1.SGM 01OCN1emcd
onal
d on
DS
K2B
SO
YB
1PR
OD
with
NO
TIC
ES

60727 Federal Register / Vol. 75, No. 190 / Friday, October 1, 2010 / Notices
28 See Issues and Decision Memorandum at Comment 14; Hailiang Group’s Final Analysis Memorandum at 3.
29 See Issues and Decision Memorandum at Comment 15; Hailiang Group’s Final Analysis Memorandum at 3.
30 Id. 31 See Issues and Decision Memorandum at
Comment 15; Hailiang Group’s Final Analysis Memorandum at 4.
32 See Issues and Decision Memorandum at Comment 17; Hailiang Group’s Final Analysis Memorandum at 4.
33 See Issues and Decision Memorandum at Comment 18; Hailiang Group’s Final Analysis Memorandum at 4.
34 See Memorandum from Robert Bolling, Program Manager, AD/CVD Operations, Office 4, to the File, ‘‘Verification of the Sales and Factors Responses of Zhejiang Hailiang Co., Ltd.; Shanghai Hailiang Co., Ltd.; and Hong Kong Hailiang Co., Ltd. in the Antidumping Investigation of Seamless Refined Copper Pipe and Tube from the People’s Republic of China’’ (June 18, 2010); Memorandum from Shawn Higgins, International Trade Compliance Analyst, AD/CVD Operations, Office 4, to the File, ‘‘Antidumping Duty Investigation of Seamless Refined Copper Pipe and Tube from the People’s Republic of China: Verification of the Questionnaire Responses of Golden Dragon Precise Copper Tube Group, Inc.’’ (June 15, 2010).
35 See, e.g., Preliminary Determination of Sales at Less Than Fair Value and Postponement of Final Determination: Coated Free Sheet Paper from the People’s Republic of China, 72 FR 30758, 30760 (June 4, 2007), unchanged in Final Determination of Sales at Less Than Fair Value: Coated Free Sheet Paper from the People’s Republic of China, 72 FR 60632 (October 25, 2007).
36 See Preliminary Determination, 75 FR at 26719.
3. The Department revised the weighted-average per-unit FOP for wooden crate.28
4. The Department revised its normal value calculation to include carbon soot, scale-like graphite, hydrogen, and mold oils as direct materials.29
5. The Department revised its normal value calculation to exclude polythene, colorant, and anti-aging master batch.30
6. The Department revised its normal value calculation to include nitrogen, kerosene and charcoal as direct inputs.31
7. The Department revised its normal value calculation to include the labor hours reported in the two additional indirect labor fields from the Hailiang Group’s post-verification sales database.32
8. The Department incorporated all changes from the Hailiang Group’s minor corrections in the final calculation of the Hailiang Group’s antidumping margin.33
Scope of Investigation
For the purpose of this investigation, the products covered are all seamless circular refined copper pipes and tubes, including redraw hollows, greater than or equal to 6 inches (152.4 mm) in length and measuring less than 12.130 inches (308.102 mm) (actual) in outside diameter (‘‘OD’’), regardless of wall thickness, bore (e.g., smooth, enhanced with inner grooves or ridges), manufacturing process (e.g., hot finished, cold-drawn, annealed), outer surface (e.g., plain or enhanced with grooves, ridges, fins, or gills), end finish (e.g., plain end, swaged end, flared end, expanded end, crimped end, threaded), coating (e.g., plastic, paint), insulation, attachments (e.g., plain, capped, plugged, with compression or other fitting), or physical configuration (e.g., straight, coiled, bent, wound on spools).
The scope of this investigation covers, but is not limited to, seamless refined copper pipe and tube produced or comparable to the American Society for Testing and Materials (‘‘ASTM’’) ASTM– B42, ASTM–B68, ASTM–B75, ASTM–
B88, ASTM–B88M, ASTM–B188, ASTM–B251, ASTM–B251M, ASTM– B280, ASTM–B302, ASTM–B306, ASTM–359, ASTM–B743, ASTM–B819, and ASTM–B903 specifications and meeting the physical parameters described therein. Also included within the scope of this investigation are all sets of covered products, including ‘‘line sets’’ of seamless refined copper tubes (with or without fittings or insulation) suitable for connecting an outdoor air conditioner or heat pump to an indoor evaporator unit. The phrase ‘‘all sets of covered products’’ denotes any combination of items put up for sale that is comprised of merchandise subject to the scope.
‘‘Refined copper’’ is defined as: (1) Metal containing at least 99.85 percent by weight of copper; or (2) metal containing at least 97.5 percent by weight of copper, provided that the content by weight of any other element does not exceed the following limits:
Element Limiting content percent by weight
Ag—Silver ..................... 0 .25 As—Arsenic .................. 0 .5 Cd—Cadmium .............. 1 .3 Cr—Chromium .............. 1 .4 Mg—Magnesium ........... 0 .8 Pb—Lead ...................... 1 .5 S—Sulfur ...................... 0 .7 Sn—Tin ......................... 0 .8 Te—Tellurium ............... 0 .8 Zn—Zinc ....................... 1 .0 Zr—Zirconium ............... 0 .3 Other elements (each) .. 0 .3
Excluded from the scope of this investigation are all seamless circular hollows of refined copper less than 12 inches in length whose OD (actual) exceeds its length. The products subject to this investigation are currently classifiable under subheadings 7411.10.1030 and 7411.10.1090 of the Harmonized Tariff Schedule of the United States (‘‘HTSUS’’). Products subject to this investigation may also enter under HTSUS subheadings 7407.10.1500, 7419.99.5050, 8415.90.8065, and 8415.90.8085. Although the HTSUS subheadings are provided for convenience and customs purposes, the written description of the scope of this investigation is dispositive.
Scope Comments The Department has not received
comments on the scope of this investigation since the publication of the Preliminary Determination.
Verification As provided in section 782(i) of the
Act, the Department verified the information submitted by Golden
Dragon and the Hailiang Group for use in the final determination. The Department used standard verification procedures including examination of relevant accounting and production records and original source documents provided by the respondents.34
Non-Market Economy Treatment
The Department considers the PRC to be a non-market economy (‘‘NME’’) country.35 In accordance with section 771(18)(C)(i) of the Act, any determination that a foreign country is an NME country shall remain in effect until revoked by the administering authority. No party has challenged the designation of the PRC as an NME country in this investigation. Therefore, the Department continues to treat the PRC as an NME country for purposes of this final determination.
Surrogate Country
In the Preliminary Determination, the Department stated that it selected India as the appropriate surrogate country to use in this investigation for the following reasons: (1) It is a significant producer of comparable merchandise; (2) it is at a similar level of economic development pursuant to section 773(c)(4) of the Act; and (3) the Department has reliable data from India that it can use to value the FOPs.36 The Department received no comments on this issue after the Preliminary Determination and the Department has not made changes to its findings with respect to the selection of a surrogate country for the final determination.
Separate Rates
In proceedings involving NME countries, the Department holds a rebuttable presumption that all companies within the country are subject to government control and, thus,
VerDate Mar<15>2010 17:34 Sep 30, 2010 Jkt 220001 PO 00000 Frm 00017 Fmt 4703 Sfmt 4703 E:\FR\FM\01OCN1.SGM 01OCN1emcd
onal
d on
DS
K2B
SO
YB
1PR
OD
with
NO
TIC
ES

60728 Federal Register / Vol. 75, No. 190 / Friday, October 1, 2010 / Notices
37 See Notice of Final Determination of Sales at Less Than Fair Value: Sparklers from the People’s Republic of China, 56 FR 20588 (May 6, 1991), as further developed in Notice of Final Determination of Sales at Less Than Fair Value: Silicon Carbide from the People’s Republic of China, 59 FR 22585 (May 2, 1994).
38 See Preliminary Determination, 75 FR at 26720. 39 See section 735(c)(5)(A) of the Act. 40 See Steel Wire Garment Hangers from the
People’s Republic of China: Final Determination of Sales at Less Than Fair Value, 73 FR 47587, 47591 (August 14, 2008).
41 See Letter from the Hailiang Group to the Secretary of Commerce, ‘‘Certain Seamless Refined Copper Pipe & Tube from the People’s Republic of China: Supplemental Section D Questionnaire Response of Hailiang Group’’ (March 19, 2010) at Exhibit 6; Letter from the Hailiang Group to the Secretary of Commerce, ‘‘Certain Seamless Refined Copper Pipe & Tube from the People’s Republic of China: Supplemental Section D Questionnaire Response of Hailiang Group’’ (April 12, 2010) at Exhibit 12.
42 See Letter from Robert Bolling, Program Manager, AD/CVD Operations, Office 4, to the Hailiang Group, ‘‘Sections C&D Third Supplemental Questionnaire’’ (April 28, 2010) at 2–3; Letter from Robert Bolling, Program Manager, AD/CVD Operations, Office 4, to the Hailiang Group, ‘‘Sections C&D Second Supplemental Questionnaire’’ (March 29, 2010) at 5; Letter from Robert Bolling, Program Manager, AD/CVD Operations, Office 4, to the Hailiang Group, ‘‘Sections C&D Supplemental Questionnaire’’ (February 26, 2010) at 8–9; Letter from Robert Bolling, Program Manager, AD/CVD Operations, Office 4, to Zhejiang Hailiang, ‘‘Antidumping Duty Investigation of Seamless Refined Copper Pipe and Tube from the People’s Republic of China: Request for Information’’ (December 4, 2009) at D–2.
43 See Letter from the Hailiang Group to the Secretary of Commerce, ‘‘Certain Seamless Refined Copper Pipe and Tube from the People’s Republic of China: Third Supplemental Section D Questionnaire & Part 1 of Post-Preliminary FOP Response of Hailiang Group’’ (May 11, 2010); Letter from the Hailiang Group to the Secretary of Commerce, ‘‘Certain Seamless Refined Copper Pipe and Tube from China: Part 2 of Post-Preliminary FOP Response of the Hailiang Group’’ (May 14, 2010).
should be assessed a single antidumping duty rate. It is the Department’s policy to assign all exporters of subject merchandise in an NME country this single rate unless an exporter can demonstrate that it is sufficiently independent so as to be entitled to a separate rate.37
In the Preliminary Determination, the Department found that the following companies demonstrated eligibility for separate-rate status: Luvata Tube (Zhongshan) Ltd.; Ningbo Jintian Copper Tube Co. Ltd.; Zhejiang Naile Copper Co., Ltd.; Zhejiang Jiahe Pipes Inc.; and Luvata Alltop (Zhongshan) Ltd. (collectively, the ‘‘Separate Rate Applicants’’).38 Since the publication of the Preliminary Determination, no party has commented on the eligibility of the Separate Rate Applicants for separate- rate status. For the final determination, the Department continues to find that the evidence placed on the record of this investigation by the Separate Rate Applicants demonstrates both de jure and de facto absence of government control with respect to each company’s respective exports of the merchandise under investigation. Thus, the Department continues to find that the Separate Rate Applicants are eligible for separate-rate status.
The separate rate is determined based on the estimated weighted-average dumping margins established for exporters and producers individually investigated, excluding zero and de minimis margins or margins based entirely on adverse facts available (‘‘AFA’’).39 In this investigation both mandatory respondents, Golden Dragon and the Hailiang Group, have estimated weighted-average dumping margins which are above de minimis and which are not based on total AFA. Therefore, because there are only two relevant weighted-average dumping margins for this final determination and because using a weighted average risks disclosure of business proprietary information, the separate rate is a simple-average of these two values, which is 36.05 percent.40
Use of FA and AFA Section 776(a) of the Act provides that
the Department shall apply FA if (1) necessary information is not on the record, or (2) an interested party or any other person (A) withholds information that has been requested, (B) fails to provide information within the deadlines established, or in the form and manner requested by the Department, subject to subsections (c)(1) and (e) of section 782 of the Act, (C) significantly impedes a proceeding, or (D) provides information that cannot be verified as provided by section 782(i) of the Act.
Section 776(b) of the Act further provides that the Department may use an adverse inference in applying FA when a party has failed to cooperate by not acting to the best of its ability to comply with a request for information. Such an adverse inference may include reliance on information derived from the petition, the final determination, a previous administrative review, or other information placed on the record.
Hailiang Group In the Preliminary Determination, the
Department determined, pursuant to section 776(a)(1) and (2)(B) of the Act, that it was appropriate to base the Hailiang Group’s preliminary dumping margin, in part, on FA because (1) the Hailiang Group’s own information on the record indicates that it had the ability to report its FOPs on a product- group specific basis,41 and (2) the Hailiang Group continued to report FOP values that are identical for all CONNUMs, despite the Department’s multiple requests to provide this data on a more specific basis.42 On April 29, 2010, the Department issued a
questionnaire that requested the Hailiang Group to report product- specific FOPs for different production stages and, if the Hailiang Group believed that this were not possible, to comment on the product-group specific processing yields that are on the record of this investigation. However, the Hailiang Group neither reported product-specific FOPs for different production stages nor explained why these product-group specific processing yields are incorrect and cannot be applied in the calculation of product- group specific FOPs.43 The Hailiang Group had multiple opportunities both before and after the Preliminary Determination to explain why the cumulative yields that were calculated by Petitioners and used in the Preliminary Determination were flawed and could not be used in the final determination. The Hailiang Group, however, did not provide such an explanation.
Because the Hailiang Group has continued to report FOP values that are identical for all CONNUMs, despite the Department’s multiple requests to provide this data on a more specific basis, all the information necessary for the Department to calculate an accurate dumping margin for the Hailiang Group is not on the record and available for use in the final determination. Since the Hailiang Group did not provide the requested FOPs on a product-group specific basis, this necessary information was not available on the record and, therefore, the Department has determined, pursuant to section 776(a)(1) and (2)(B) of the Act, that it continues to be appropriate to base the Hailiang Group’s dumping margin, in part, on FA. Furthermore, the Department determines that the Hailiang Group has failed to cooperate because the Hailiang Group has not acted to the best of its ability to comply with the Department’s requests both before and after the Preliminary Determination to provide FOPs on a product-group specific basis or to explain why the cumulative yields calculated by Petitioners and used in the Preliminary Determination could not be used in the final determination. Therefore, pursuant to section 776(b) of the Act, the Department finds that, in
VerDate Mar<15>2010 17:34 Sep 30, 2010 Jkt 220001 PO 00000 Frm 00018 Fmt 4703 Sfmt 4703 E:\FR\FM\01OCN1.SGM 01OCN1emcd
onal
d on
DS
K2B
SO
YB
1PR
OD
with
NO
TIC
ES
60729 Federal Register / Vol. 75, No. 190 / Friday, October 1, 2010 / Notices
44 See Issues and Decision Memorandum at Comment 12; Hailiang Group’s Final Analysis Memorandum at 6.
45 See Preliminary Determination, 75 FR at 26722. 46 Id. 47 See, e.g., Synthetic Indigo From the People’s
Republic of China; Notice of Final Determination of Sales at Less Than Fair Value, 65 FR 25706 (May 3, 2000).
48 See Notice of Final Determination of Sales at Less Than Fair Value: Static Random Access
Memory Semiconductors From Taiwan, 63 FR 8909, 8932 (February 23, 1998).
49 See Brake Rotors From the People’s Republic of China: Final Results and Partial Rescission of the Seventh Administrative Review; Final Results of the Eleventh New Shipper Review, 70 FR 69937, 69939 (November 18, 2005) (quoting the Statement of Administrative Action accompanying the Uruguay Round Agreements Act, H. Doc. No. 316, 103d Cong., 2d Session at 870 (1994)).
50 See Final Determination of Sales at Less Than Fair Value: Certain Cold-Rolled Flat-Rolled Carbon
Quality Steel Products From The People’s Republic of China, 65 FR 34660 (May 31, 2000) and accompanying Issues and Decision Memorandum at ‘‘Facts Available.’’
51 See Hailiang Group’s Final Analysis Memorandum at 1, Attachment III.
52 See Seamless Refined Copper Pipe and Tube From the People’s Republic of China and Mexico: Initiation of Antidumping Duty Investigations, 74 FR 55194, 55199 (October 27, 2009) (‘‘Initiation Notice’’).
selecting from among FA, an adverse inference is appropriate for the Hailiang Group.44
PRC-Wide Entity In the Preliminary Determination, the
Department determimined that certain PRC exporters/producers did not respond to the Department’s requests for information.45 Thus, the Department treated these PRC exporters/producers as part of the PRC-wide entity and found that the PRC-wide entity did not respond to our requests for information.46 No additional information was placed on the record with respect to any of these companies after the Preliminary Determination. Since the PRC-wide entity did not provide the Department with requested information, pursuant to section 776(a)(2)(A) of the Act, the Department continues to find it appropriate to base the PRC-wide rate on FA.
The Department determines that, because the PRC-wide entity did not respond to our requests for information, the PRC-wide entity has failed to cooperate to the best of its ability. Therefore, pursuant to section 776(b) of the Act, the Department finds that, in selecting from among the FA, an adverse inference is appropriate for the PRC- wide entity.
Because the Department begins with the presumption that all companies
within an NME country are subject to government control, and because only Separate Rate Applicants have overcome that presumption, the Department is applying a single antidumping rate (i.e., the PRC-wide entity rate) to all other exporters of subject merchandise from the PRC. Such companies did not demonstrate entitlement to a separate rate.47 The PRC-wide entity rate applies to all entries of subject merchandise except for entries from Golden Dragon, the Hailiang Group, and the Separate Rate Applicants.
Selection of the AFA Rate for the PRC- Wide Entity
In selecting a rate for AFA, the Department selects a rate that is sufficiently adverse ‘‘as to effectuate the purpose of the facts available rule to induce respondents to provide the Department with complete and accurate information in a timely manner.’’ 48 Further, it is the Department’s practice to select a rate that ensures ‘‘that the party does not obtain a more favorable result by failing to cooperate than if it had cooperated fully.’’ 49 It is the Department’s practice to select, as AFA, the higher of the (a) highest margin alleged in the petition, or (b) the highest calculated rate of any respondent in the investigation.50 In the instant
investigation, as AFA, the Department has assigned to the PRC-wide entity the highest rate on the record of this proceeding, which is the 60.85 percent weighted-average margin calculated for the Hailiang Group.51 The Department determines that this information is the most appropriate from the available sources to effectuate the purposes of AFA.
The dumping margin for the PRC- wide entity applies to all entries of the merchandise under investigation except for entries of merchandise under investigation from the exporter/ manufacturer combinations listed in the chart in the ‘‘Final Determination’’ section below.
Combination Rates
In the Initiation Notice, the Department stated that it would calculate combination rates for certain respondents that are eligible for a separate rate in this investigation.52 This practice is described in Policy Bulletin 05.1, available at http://www.trade.gov/ ia.
Final Determination
The Department determines that the following dumping margins exist for the period January 1, 2009 through June 30, 2009:
Exporter Producer
Weighted- average percent margin
Golden Dragon Precise Copper Tube Group, Inc ......................... Golden Dragon Precise Copper Tube Group, Inc ........................ 11.25 Zhejiang Hailiang Co., Ltd.; Hong Kong Hailiang Metal Trading ... Zhejiang Hailiang Co., Ltd.; Shanghai Hailiang Copper Co., Ltd 60.85 Limited; Shanghai Hailiang Copper Co., Ltd Zhejiang Naile Copper Co., Ltd ..................................................... Zhejiang Naile Copper Co., Ltd .................................................... 36.05 Zhejiang Jiahe Pipes Inc ................................................................ Zhejiang Jiahe Pipes Inc .............................................................. 36.05 Luvata Tube (Zhongshan) Ltd ........................................................ Luvata Tube (Zhongshan) Ltd ...................................................... 36.05 Luvata Tube (Zhongshan) Ltd ........................................................ Luvata Alltop (Zhongshan) Ltd ..................................................... 36.05 Luvata Alltop (Zhongshan) Ltd ....................................................... Luvata Alltop (Zhongshan) Ltd ..................................................... 36.05 Ningbo Jintian Copper Tube Co. Ltd ............................................. Ningbo Jintian Copper Tube Co. Ltd ............................................ 36.05 PRC-Wide Entity ............................................................................ PRC-Wide Entity ........................................................................... 60.85
Disclosure
The Department will disclose the calculations performed within five days of the date of publication of this notice
to parties in this proceeding in accordance with 19 CFR 351.224(b).
Suspension of Liquidation
In accordance with section 735(c)(1)(B) of the Act, the Department will instruct U.S. Customs and Border Protection (‘‘CBP’’) to continue to
VerDate Mar<15>2010 17:34 Sep 30, 2010 Jkt 220001 PO 00000 Frm 00019 Fmt 4703 Sfmt 4703 E:\FR\FM\01OCN1.SGM 01OCN1emcd
onal
d on
DS
K2B
SO
YB
1PR
OD
with
NO
TIC
ES
60730 Federal Register / Vol. 75, No. 190 / Friday, October 1, 2010 / Notices
1 See Notice of Amended Final Determination of Sales at Less Than Fair Value and Antidumping Duty Order: Certain Frozen Warmwater Shrimp From the Socialist Republic of Vietnam, 70 FR 5152 (February 1, 2005) (‘‘Order’’).
suspend liquidation of all entries of copper pipe and tube from the PRC, as described in the ‘‘Scope of Investigation’’ section, entered, or withdrawn from warehouse, for consumption on or after May 12, 2010, the date of publication of the Preliminary Determination in the Federal Register. The Department will instruct CBP to require a cash deposit or the posting of a bond equal to the weighted-average amount by which the normal value exceeds U.S. price, as indicated above.
International Trade Commission Notification
In accordance with section 735(d) of the Act, the Department has notified the International Trade Commission (‘‘ITC’’) of the final affirmative determination of sales at LTFV. As the Department’s final determination is affirmative, in accordance with section 735(b)(2) of the Act, within 45 days the ITC will determine whether the domestic industry in the United States is materially injured, or threatened with material injury, by reason of imports or sales (or the likelihood of sales) for importation of the subject merchandise. If the ITC determines that material injury or threat of material injury does not exist, the proceeding will be terminated and all securities posted will be refunded or canceled. If the ITC determines that such injury does exist, the Department will issue an antidumping duty order directing CBP to assess, upon further instruction by the Department, antidumping duties on all imports of the subject merchandise entered, or withdrawn from warehouse, for consumption on or after the effective date of the suspension of liquidation.
Notification Regarding APO
This notice also serves as a reminder to the parties subject to administrative protective order (‘‘APO’’) of their responsibility concerning the disposition of proprietary information disclosed under APO in accordance with 19 CFR 351.305. Timely notification of return or destruction of APO materials or conversion to judicial protective order is hereby requested. Failure to comply with the regulations and the terms of an APO is a sanctionable violation.
This determination is issued and published in accordance with sections 735(d) and 777(i)(1) of the Act.
Dated: September 24, 2010. Ronald K. Lorentzen, Deputy Assistant Secretary for Import Administration.
Appendix I
Issues for Final Determination
Comment 1: Whether the Department should revise its labor rate calculation.
Comment 2: Whether the Department should revise its calculation of the surrogate financial ratios.
Comment 3: Whether the Department should issue cash deposit instructions that contain ad valorem rates or specific rates.
Issues Specific to Golden Dragon Precise Copper Tube Group, Inc.
Comment 4: Whether the Department should treat copper cathode purchases by Golden Dragon from a certain supplier in the Peoples’s Republic of China as non- market economy purchases.
Comment 5: Whether the Department should recalculate Golden Dragon’s copper cathode cost based on the bonded and general trade copper cathode purchases during the period of investigation.
Comment 6: Whether the Department should revise the surrogate value for plywood batten consumed by Golden Dragon.
Comment 7: Whether the Department should consider solvent consumed by Golden Dragon to be a direct material input.
Comment 8: Whether the Department should include salaries paid to two employees of Golden Dragon who worked in the United States during the period of investigation as indirect U.S. selling expenses.
Comment 9: Whether the Department should adjust the factor of production for electricity for 7 mm and 9 mm inner- grooved tube products.
Comment 10: Whether the Department should make certain minor corrections.
Issues Specific to Zhejiang Hailiang Co., Ltd., Shanghai Hailiang Copper Co., Ltd., and Hong Kong Hailiang Metal Trading Limited
Comment 11: Whether to use facts available with regard to the Hailiang Group’s line set sales.
Comment 12: Whether to use of facts available with regard to the Hailiang Group’s factors of production.
Comment 13: Whether to correct the water usage factor of production used in the Preliminary Determination.
Comment 14: Whether the Department should accept the post-preliminary correction of the consumption of Shanghai Hailiang’s wooden crates.
Comment 15: Whether to continue considering certain raw materials as factors of production or exclude them from the calculation of the Hailiang Group’s normal value.
Comment 16: Whether to continue using the actual weight reported by the Hailiang Group in its United States sales database.
Comment 17: Whether to include two additional categories of indirect labor as labor inputs.
Comment 18: Whether the Department should make certain minor corrections.
[FR Doc. 2010–24720 Filed 9–30–10; 8:45 am]
BILLING CODE 3510–DS–P
DEPARTMENT OF COMMERCE
International Trade Administration
[A–552–802]
Certain Frozen Warmwater Shrimp From the Socialist Republic of Vietnam: Initiation of Antidumping Duty New Shipper Review
AGENCY: Import Administration, International Trade Administration, Department of Commerce. DATES: Effective Date: October 1, 2010. SUMMARY: The Department of Commerce (‘‘Department’’) has determined that a request for a new shipper review (‘‘NSR’’) of the antidumping duty order on certain frozen warmwater shrimp (‘‘shrimp’’) from the Socialist Republic of Vietnam (‘‘Vietnam’’), received on August 26, 2010, meets the statutory and regulatory requirements for initiation. The period of review (‘‘POR’’) for this NSR is February 1, 2010–July 31, 2010. FOR FURTHER INFORMATION CONTACT: Paul Walker, AD/CVD Operations, Office 9, Import Administration, International Trade Administration, U.S. Department of Commerce, 14th Street and Constitution Avenue, NW., Washington, DC 20230; telephone: 202–482–0413. SUPPLEMENTARY INFORMATION:
Background
The notice announcing the antidumping duty order on shrimp from Vietnam was published in the Federal Register on February 1, 2005.1 On August 26, 2010, pursuant to section 751(a)(2)(B)(i) of the Tariff Act of 1930, as amended (‘‘Act’’), and section 351.214(c) of the Department’s regulations, the Department received a NSR request from Quoc Viet Seaproducts Processing Trading and Import-Export Co., Ltd. (‘‘Quoc Viet’’). Quoc Viet’s request was properly made during August 2010, which is the semi- annual anniversary of the Order. Quoc Viet certified that it is a producer and exporter of the subject merchandise upon which the request was based.
Pursuant to section 751(a)(2)(B)(i)(I) of the Act and section 351.214(b)(2)(i) of the Department’s regulations, Quoc Viet
VerDate Mar<15>2010 17:34 Sep 30, 2010 Jkt 220001 PO 00000 Frm 00020 Fmt 4703 Sfmt 4703 E:\FR\FM\01OCN1.SGM 01OCN1emcd
onal
d on
DS
K2B
SO
YB
1PR
OD
with
NO
TIC
ES

APPENDIX B
LIST OF HEARING WITNESSES
B-1


CALENDAR OF PUBLIC HEARING
Those listed below appeared as witnesses at the United States International Trade Commission’shearing:
Subject: Seamless Refined Copper Pipe and Tube from China and MexicoInv. Nos.: 731-TA-1174 and 1175 (Final)Date and Time: September 23, 2010 - 9:30 a.m.
Sessions were held in connection with these investigations in the Main Hearing Room (room 101),500 E Street, S.W., Washington, D.C.
CONGRESSIONAL WITNESS:
The Honorable Lincoln Davis, U.S. Representative, 4th District, Tennessee
EMBASSY WITNESS:
Embassy of MexicoWashington, D.C.
Hugo Perezcano, Head of the International Trade Practices Unit of the Secretary of Economyof Mexico
OPENING REMARKS:
Petitioners (Jack A. Levy, DLA Piper)Respondents (Kevin M. O’Brien, Baker & McKenzie LLP and John M. Ryan, Weil, Gotshal & MangesLLP)
In Support of the Imposition of Antidumping Duty Orders:
DLA PiperWashington, D.C.on behalf of
Cerro Flow Products, LLCKobe Wieland Copper Products, LLCMueller Copper Tube Products, Inc.Mueller Copper Tube Company, Inc.
John Hansen, President, Manufacturing Operations, Mueller Industries, Inc.Bart Arndt, Vice President/Industrial Unit Manager, Cerro Flow Products, LLCMike Flowers, Former Employee of Wolverine Tube, Inc.Brian Stemler, President, USW, Local 4294Dr. Richard Boyce, President, Econometrica International, Inc.
B-3

Jack A. Levy )– OF COUNSEL
Martin Schaefermeier )
In Opposition to the Imposition of Antidumping Duty Orders:
Baker & McKenzie LLPWashington, D.C.on behalf of
Golden Dragon Precise Copper Tube Croup, Inc.GD Affiliates S. de R.L. de C.V.GD Copper (U.S.A.), Inc.
Keith Weil, Executive Vice President, GD Copper (U.S.A.), Inc.Thomas Rogers, Economic Consultant, Capital Trade, Inc.
Kevin M. O’Brien ) – OF COUNSEL
Weil, Gotshal & Manges LLPWashington, D.C.on behalf of
IUSA, S.A. de C.V. (“IUSA”)Nacional de Cobre, S.A. de C.V. (“NACOBRE”)Cambridge-Lee Industries LLCCopper and Brass International
Juan José Ochoa, Chief Operating Officer, IUSAEd Kerins, Chief Executive Officer, Cambridge-Lee IndustriesSteven Kelly, President, Copper and Brass International
John M. Ryan )Stuart M. Rosen ) – OF COUNSELJoseph M. Johnson )
B-4

In Opposition to the Imposition of Antidumping Duty Orders (continued):
Drinker Biddle & Reath LLPWashington, D.C.on behalf of
Johnson Controls, Inc.Marubeni America Corporation
Scott Smith, C.P.M., Purchasing Director, Building Efficiency, Johnson Controls, Inc.Duane E. Webber, Vice President, Global Purchasing, Building Efficiency, JohnsonControls, Inc.Jean-Philippe Krahmer, Sales Manager, Copper Tubing, Marubeni America Corporation
William Silverman )) – OF COUNSEL
Douglas Heffner )
McDermott Will & Emery LLPWashington, D.C.on behalf of
Goodman Global, Inc. (“Goodman”)
Michael J. Knights, Vice President, Procurement, GoodmanWilliam L. Topper, Senior Vice President, Operations, Goodman
Raymond Paretzky ) – OF COUNSEL
REBUTTAL/CLOSING REMARKS:
Petitioners (Jack A. Levy, DLA Piper)Respondents (Kevin M. O’Brien, Baker & McKenzie and John M. Ryan, Weil, Gotshal & Manges LLP)
B-5


APPENDIX C
SUMMARY DATA
C-1


Table C-1SRC pipe & tube: Summary data concerning the U.S. market, 2007-09, January-June 2009, and January-June 2010
(Quantity=1,000 pounds, value=1,000 dollars, unit values, unit labor costs, and unit expenses are per pound; period changes=percent, except where noted)Reported data Period changes
January-June Jan.-JuneItem 2007 2008 2009 2009 2010 2007-09 2007-08 2008-09 2009-10
U.S. consumption quantity: Amount . . . . . . . . . . . . . . . . . . . 992,539 858,926 698,018 380,978 341,491 -29.7 -13.5 -18.7 -10.4 Producers' share (1) . . . . . . . . . 75.8 71.3 73.5 72.8 77.5 -2.3 -4.6 2.2 4.7 Importers' share (1): China . . . . . . . . . . . . . . . . . . . . 9.1 12.9 13.1 13.0 8.4 4.0 3.8 0.2 -4.6 Mexico . . . . . . . . . . . . . . . . . . 7.6 8.3 6.9 8.2 5.0 -0.7 0.7 -1.4 -3.2 Subtotal . . . . . . . . . . . . . . . . . 16.7 21.2 20.0 21.2 13.4 3.3 4.5 -1.2 -7.7 Other sources . . . . . . . . . . . . . 7.5 7.5 6.5 6.0 9.0 -1.0 0.0 -1.0 3.0 Total imports . . . . . . . . . . . . . 24.2 28.7 26.5 27.2 22.5 2.3 4.6 -2.2 -4.7
U.S. consumption value: Amount . . . . . . . . . . . . . . . . . . . 3,959,314 3,574,571 2,110,170 1,016,023 1,366,524 -46.7 -9.7 -41.0 34.5 Producers' share (1) . . . . . . . . . 76.6 72.1 76.0 75.6 78.4 -0.7 -4.5 3.8 2.7 Importers' share (1): China . . . . . . . . . . . . . . . . . . . . 8.8 12.5 11.6 10.9 8.0 2.8 3.7 -0.9 -2.9 Mexico . . . . . . . . . . . . . . . . . . 7.2 7.9 6.2 7.8 4.7 -1.0 0.7 -1.7 -3.1 Subtotal . . . . . . . . . . . . . . . . . 16.0 20.4 17.8 18.7 12.7 1.8 4.4 -2.6 -6.0 Other sources . . . . . . . . . . . . . 7.4 7.5 6.3 5.6 8.9 -1.1 0.1 -1.2 3.3 Total imports . . . . . . . . . . . . . 23.4 27.9 24.0 24.4 21.6 0.7 4.5 -3.8 -2.7
U.S. imports from (2): China: Quantity . . . . . . . . . . . . . . . . . . 90,624 111,126 91,768 49,388 28,719 1.3 22.6 -17.4 -41.8 Value . . . . . . . . . . . . . . . . . . . . 348,772 446,282 244,101 110,981 109,860 -30.0 28.0 -45.3 -1.0 Unit value . . . . . . . . . . . . . . . . $3.85 $4.02 $2.66 $2.25 $3.83 -30.9 4.4 -33.8 70.2 Ending inventory quantity . . . . *** *** *** *** *** *** *** *** *** Mexico: Quantity . . . . . . . . . . . . . . . . . . 75,199 71,327 48,014 31,340 17,183 -36.2 -5.1 -32.7 -45.2 Value . . . . . . . . . . . . . . . . . . . . 284,287 281,957 131,261 79,376 63,732 -53.8 -0.8 -53.4 -19.7 Unit value . . . . . . . . . . . . . . . . $3.78 $3.95 $2.73 $2.53 $3.71 -27.7 4.6 -30.8 46.4 Ending inventory quantity . . . . *** *** *** *** *** *** *** *** *** Subtotal: Quantity . . . . . . . . . . . . . . . . . . 165,823 182,453 139,782 80,728 45,902 -15.7 10.0 -23.4 -43.1 Value . . . . . . . . . . . . . . . . . . . . 633,059 728,238 375,362 190,357 173,592 -40.7 15.0 -48.5 -8.8 Unit value . . . . . . . . . . . . . . . . $3.82 $3.99 $2.69 $2.36 $3.78 -29.7 4.5 -32.7 60.4 Ending inventory quantity . . . . *** *** *** *** *** *** *** *** *** All other sources: Quantity . . . . . . . . . . . . . . . . . . 74,226 64,441 45,426 22,961 30,847 -38.8 -13.2 -29.5 34.3 Value . . . . . . . . . . . . . . . . . . . . 292,345 268,218 131,960 57,314 122,111 -54.9 -8.3 -50.8 113.1 Unit value . . . . . . . . . . . . . . . . $3.94 $4.16 $2.90 $2.50 $3.96 -26.2 5.7 -30.2 58.6 Ending inventory quantity . . . . *** *** *** *** *** *** *** *** *** All sources: Quantity . . . . . . . . . . . . . . . . . . 240,049 246,894 185,209 103,689 76,750 -22.8 2.9 -25.0 -26.0 Value . . . . . . . . . . . . . . . . . . . . 925,404 996,456 507,321 247,671 295,703 -45.2 7.7 -49.1 19.4 Unit value . . . . . . . . . . . . . . . . $3.86 $4.04 $2.74 $2.39 $3.85 -28.9 4.7 -32.1 61.3 Ending inventory quantity . . . . *** *** *** *** *** *** *** *** ***
U.S. producers': Average capacity quantity . . . . . 1,223,928 1,120,991 1,122,794 563,535 545,709 -8.3 -8.4 0.2 -3.2 Production quantity . . . . . . . . . . 781,123 640,036 531,562 284,755 296,071 -31.9 -18.1 -16.9 4.0 Capacity utilization (1) . . . . . . . . 63.8 57.1 47.3 50.5 54.3 -16.5 -6.7 -9.8 3.7 U.S. shipments: Quantity . . . . . . . . . . . . . . . . . . 752,491 612,032 512,809 277,289 264,741 -31.9 -18.7 -16.2 -4.5 Value . . . . . . . . . . . . . . . . . . . . 3,033,910 2,578,115 1,602,849 768,352 1,070,821 -47.2 -15.0 -37.8 39.4 Unit value . . . . . . . . . . . . . . . . $4.03 $4.21 $3.13 $2.77 $4.04 -22.5 4.5 -25.8 46.0 Export shipments: Quantity . . . . . . . . . . . . . . . . . . 33,253 33,243 30,971 14,578 21,541 -6.9 -0.0 -6.8 47.8 Value . . . . . . . . . . . . . . . . . . . . 136,379 142,244 100,139 40,457 90,235 -26.6 4.3 -29.6 123.0 Unit value . . . . . . . . . . . . . . . . $4.10 $4.28 $3.23 $2.78 $4.19 -21.2 4.3 -24.4 50.9 Ending inventory quantity . . . . . 52,936 48,747 38,053 41,930 35,642 -28.1 -7.9 -21.9 -15.0 Inventories/total shipments (1) . 6.7 7.6 7.0 7.2 6.2 0.3 0.8 -0.6 -1.0 Production workers . . . . . . . . . . 3,644 3,303 2,902 2,962 2,668 -20.4 -9.4 -12.1 -9.9 Hours worked (1,000s) . . . . . . . 7,791 6,980 5,873 3,056 2,809 -24.6 -10.4 -15.9 -8.1 Wages paid ($1,000s) . . . . . . . . 136,285 124,976 104,257 54,720 50,468 -23.5 -8.3 -16.6 -7.8 Hourly wages . . . . . . . . . . . . . . $17.49 $17.90 $17.75 $17.91 $17.97 1.5 2.4 -0.9 0.3 Productivity (pounds per hour) . 100.1 91.6 90.5 93.1 105.3 -9.7 -8.5 -1.2 13.1 Unit labor costs . . . . . . . . . . . . . $0.17 $0.20 $0.20 $0.19 $0.17 12.3 11.9 0.4 -11.3 Net sales: Quantity . . . . . . . . . . . . . . . . . . 772,482 649,879 526,474 277,322 286,115 -31.8 -15.9 -19.0 3.2 Value . . . . . . . . . . . . . . . . . . . . 3,151,317 2,761,903 1,630,144 748,334 1,161,741 -48.3 -12.4 -41.0 55.2 Unit value . . . . . . . . . . . . . . . . $4.08 $4.25 $3.10 $2.70 $4.06 -24.1 4.2 -27.1 50.5 Cost of goods sold (COGS) . . . . 2,857,802 2,526,052 1,523,536 696,297 1,094,715 -46.7 -11.6 -39.7 57.2 Gross profit or (loss) . . . . . . . . . 293,515 235,851 106,608 52,037 67,026 -63.7 -19.6 -54.8 28.8 SG&A expenses . . . . . . . . . . . . 73,637 68,408 61,715 30,144 32,796 -16.2 -7.1 -9.8 8.8 Operating income or (loss) . . . . 219,878 167,443 44,893 21,893 34,230 -79.6 -23.8 -73.2 56.4 Capital expenditures . . . . . . . . . 41,162 45,241 34,090 17,231 6,024 -17.2 9.9 -24.6 -65.0 Unit COGS . . . . . . . . . . . . . . . . $3.70 $3.89 $2.89 $2.51 $3.83 -21.8 5.1 -25.5 52.4 Unit SG&A expenses . . . . . . . . $0.10 $0.11 $0.12 $0.11 $0.11 23.0 10.4 11.4 5.5 Unit operating income or (loss) . $0.28 $0.26 $0.09 $0.08 $0.12 -70.0 -9.5 -66.9 51.5 COGS/sales (1) . . . . . . . . . . . . . 90.7 91.5 93.5 93.0 94.2 2.8 0.8 2.0 1.2 Operating income or (loss)/ sales (1) . . . . . . . . . . . . . . . . . 7.0 6.1 2.8 2.9 2.9 -4.2 -0.9 -3.3 0.0
(1) "Reported data" are in percent and "period changes" are in percentage points. (2) Import data are from official Commerce statistics.
Note.--Financial data are reported on a fiscal year basis and may not necessarily be comparable to data reported on a calendar year basis. Because of rounding,figures may not add to the totals shown. Unit values and shares are calculated from the unrounded figures.
Source: Compiled from data submitted in response to Commission questionnaires and from official Commerce statistics.
C-3


Table C-2SRC pipe & tube: U.S. Import data, 2007-09, January-June 2009, and January-June 2010
(Quantity=1,000 pounds, value=1,000 dollars, unit values, unit labor costs, and unit expenses are per pound; period changes=percent, except where noted)Reported data Period changes
January-June Jan.-JuneItem 2007 2008 2009 2009 2010 2007-09 2007-08 2008-09 2009-10
U.S. shipments imports from (1): China: Quantity . . . . . . . . . . . . . . . . . . *** *** *** *** *** *** *** *** *** Value . . . . . . . . . . . . . . . . . . . . *** *** *** *** *** *** *** *** *** Unit value . . . . . . . . . . . . . . . . . *** *** *** *** *** *** *** *** *** Mexico: Quantity . . . . . . . . . . . . . . . . . . *** *** *** *** *** *** *** *** *** Value . . . . . . . . . . . . . . . . . . . . *** *** *** *** *** *** *** *** *** Unit value . . . . . . . . . . . . . . . . . *** *** *** *** *** *** *** *** *** Subtotal: Quantity . . . . . . . . . . . . . . . . . . 147,586 163,469 127,979 70,684 50,141 -13.3 10.8 -21.7 -29.1 Value . . . . . . . . . . . . . . . . . . . . 572,860 681,701 373,098 177,795 194,784 -34.9 19.0 -45.3 9.6 Unit value . . . . . . . . . . . . . . . . . $3.88 $4.17 $2.92 $2.52 $3.88 -24.9 7.4 -30.1 54.4 All other sources: Quantity . . . . . . . . . . . . . . . . . . 74,226 64,441 45,426 22,961 30,847 -38.8 -13.2 -29.5 34.3 Value . . . . . . . . . . . . . . . . . . . . 292,345 268,218 131,960 57,314 122,111 -54.9 -8.3 -50.8 113.1 Unit value . . . . . . . . . . . . . . . . . $3.94 $4.16 $2.90 $2.50 $3.96 -26.2 5.7 -30.2 58.6 All sources: Quantity . . . . . . . . . . . . . . . . . . 221,812 227,910 173,405 93,645 80,988 -21.8 2.7 -23.9 -13.5 Value . . . . . . . . . . . . . . . . . . . . 865,205 949,919 505,058 235,109 316,895 -41.6 9.8 -46.8 34.8 Unit value . . . . . . . . . . . . . . . . . $3.90 $4.17 $2.91 $2.51 $3.91 -25.3 6.9 -30.1 55.9
(1) U.S. shipments of imports are from questionnaire data, and data for all other sources are from official Commerce statistics.
C-5


Table C-3SRC pipe & tube: Summary data concerning the U.S. market, (excluding Wolverine) 2007-09,January-June 2009, and January-June 2010
* * * * * * *
C-7


APPENDIX D
TARIFF TREATMENT
D-1


Harmonized Tariff Schedule of the United States (2010) (Rev. 2)Annotated for Statistical Reporting Purposes
XV74-5
Heading/ Stat. Unit Rates of Duty Subheading Suf- Article Description of 1 2 fix Quantity General Special7404.00 Copper waste and scrap:7404.00.30 Spent anodes; waste and scrap with a copper content
of less than 94 percent by weight . . . . . . . . . . . . . . . . . . . . . . . . . . . Free 6% 20 Of refined copper . . . . . . . . . . . . . . . . . . . . . . . . . . . kg
Of copper alloys: Of copper-zinc base alloys (brass): 45 Containing more than 0.3 percent of lead . . . kg 55 Other . . . . . . . . . . . . . . . . . . . . . . . . . . . . . . . kg 65 Of copper-tin base alloys (bronze) . . . . . . . . . . . kg 90 Other . . . . . . . . . . . . . . . . . . . . . . . . . . . . . . . . . . kg
7404.00.60 Other . . . . . . . . . . . . . . . . . . . . . . . . . . . . . . . . . . . . . . . . . . . . . . . . . Free 6% 20 Of refined copper . . . . . . . . . . . . . . . . . . . . . . . . . . . kg
Of copper alloys: Of copper-zinc base alloys (brass): 45 Containing more than 0.3 percent of lead . . . kg 55 Other . . . . . . . . . . . . . . . . . . . . . . . . . . . . . . . kg 65 Of copper-tin base alloys (bronze) . . . . . . . . . . . kg 90 Other . . . . . . . . . . . . . . . . . . . . . . . . . . . . . . . . . . kg
7405.00 Master alloys of copper:7405.00.10 00 Containing by weight 5 percent or more but not more
than 15 percent of phosphorus . . . . . . . . . . . . . . . . . . . . kg . . . . . . Free 12%
7405.00.60 Other . . . . . . . . . . . . . . . . . . . . . . . . . . . . . . . . . . . . . . . . . . . . . . . . . Free 28% 30 Beryllium copper master alloy . . . . . . . . . . . . . . . . . . kg 50 Other . . . . . . . . . . . . . . . . . . . . . . . . . . . . . . . . . . . . . kg
7406 Copper powders and flakes:7406.10.00 00 Powders of non-lamellar structure . . . . . . . . . . . . . . . . . kg . . . . . . Free 49%7406.20.00 00 Powders of lamellar structure; flakes . . . . . . . . . . . . . . . kg . . . . . . Free 12%
7407 Copper bars, rods and profiles:7407.10 Of refined copper:
Profiles:7407.10.15 00 Hollow profiles . . . . . . . . . . . . . . . . . . . . . . . . . . kg . . . . . . 3% Free (A,AU,BH,CA, 48%
CL,E,IL,J,JO,MA, MX,OM,P,PE,SG)
7407.10.30 00 Other . . . . . . . . . . . . . . . . . . . . . . . . . . . . . . . . . . kg . . . . . . 3% Free (A,AU,BH,CA, 48% CL,E,IL,J,JO,MA, MX,OM,P,PE,SG)
7407.10.50 Bars and rods . . . . . . . . . . . . . . . . . . . . . . . . . . . . . . . . . . . . . . . 1% Free (A,AU,BH,CA, 7% CL,E,IL,J,JO,MA, MX,OM,P,PE,SG)
10 Having a rectangular cross section . . . . . . . . . . . kg 50 Other . . . . . . . . . . . . . . . . . . . . . . . . . . . . . . . . . . kg
Of copper alloys:7407.21 Of copper-zinc base alloys (brass):
Profiles:7407.21.15 00 Hollow profiles . . . . . . . . . . . . . . . . . . . . . . . kg . . . . . . 2.2% Free (A,AU,BH,CA, 17%
CL,E,IL,J,JO,MA, MX,OM,P,PE,SG)
7407.21.30 00 Other . . . . . . . . . . . . . . . . . . . . . . . . . . . . . . . kg . . . . . . 2.2% Free (A,AU,BH,CA, 17% CL,E,IL,J,JO,MA, MX,OM,P,PE,SG)
Bars and rods:7407.21.50 00 Low fuming brazing rods . . . . . . . . . . . . . . . . kg . . . . . . 2.2% Free (A,AU,BH,CA, 9%
CL,E,IL,J,JO,MA, MX,OM,P,PE,SG)
Other:7407.21.70 00 Having a rectangular cross section . . . . kg . . . . . . 1.9% Free (A,AU,BH,CA, 9%
CL,E,IL,J,JO,MA, MX,OM,P,PE,SG)
7407.21.90 00 Other . . . . . . . . . . . . . . . . . . . . . . . . . . . . kg . . . . . . 2.2% Free (A*,AU,BH, 9% CA,CL,E,IL,J,JO, MA,MX,OM, P,PE,SG)

Harmonized Tariff Schedule of the United States (2010) (Rev. 2)Annotated for Statistical Reporting Purposes
XV74-10 Heading/ Stat. Unit Rates of Duty Subheading Suf- Article Description of 1 2 fix Quantity General Special7410 Copper foil (whether or not printed or backed with paper,
paperboard, plastics or similar backing materials) of a thickness (excluding any backing) not exceeding 0.15 mm:
Not backed:7410.11.00 00 Of refined copper . . . . . . . . . . . . . . . . . . . . . . . . . . . kg . . . . . . 1% Free (A,AU,BH,CA, 6.5%
CL,E,IL,J,JO,MA, MX,OM,P,PE,SG)
7410.12.00 Of copper alloys . . . . . . . . . . . . . . . . . . . . . . . . . . . . . . . . . . . . . 1% Free (A,AU,BH,CA, 6.5% CL,E,IL,J,JO,MA, MX,OM,P,PE,SG)
30 Of copper-zinc base alloys (brass) . . . . . . . . . . . kg 60 Other . . . . . . . . . . . . . . . . . . . . . . . . . . . . . . . . . . kg
Backed:7410.21 Of refined copper:7410.21.30 Copper clad laminates . . . . . . . . . . . . . . . . . . . . . . . . . . . . 3% Free (A,AU,BH,CA, 80%
CL,E,IL,J,JO,MA, MX,OM,P,PE,SG)
Having a base wholly of plasticsimpregnated glass:
20 Having copper on one side only . . . . . . . m2
kg 40 Having copper on both sides . . . . . . . . . m2
kg 60 Other . . . . . . . . . . . . . . . . . . . . . . . . . . . . . . . m2
kg7410.21.60 00 Other . . . . . . . . . . . . . . . . . . . . . . . . . . . . . . . . . . kg . . . . . . 1.5% Free (A,AU,BH,CA, 6%
CL,E,IL,J,JO,MA, MX,OM,P,PE,SG)
7410.22.00 00 Of copper alloys . . . . . . . . . . . . . . . . . . . . . . . . . . . . kg . . . . . . 1.5% Free (A,AU,BH,CA, 6% CL,E,IL,J,JO,MA, MX,OM,P,PE,SG)
7411 Copper tubes and pipes:7411.10 Of refined copper:7411.10.10 Seamless . . . . . . . . . . . . . . . . . . . . . . . . . . . . . . . . . . . . . . . . . . 1.5% Free (A,AU,BH,CA, 13%
CL,E,IL,J,JO,MA, MX,OM,P,PE,SG)
30 Having an outside diameter of 6 mm or more but not exceeding 16 mm, in coils on spools . . . kg
90 Other . . . . . . . . . . . . . . . . . . . . . . . . . . . . . . . . . . kg7411.10.50 00 Other . . . . . . . . . . . . . . . . . . . . . . . . . . . . . . . . . . . . . kg . . . . . . 3% Free (A,AU,BH,CA, 47%
CL,E,IL,J,JO,MA, MX,OM,P,PE,SG)
Of copper alloys:7411.21 Of copper-zinc base alloys (brass):7411.21.10 00 Seamless . . . . . . . . . . . . . . . . . . . . . . . . . . . . . . kg . . . . . . 1.4% Free (A,AU,BH,CA, 10%
CL,E,IL,J,JO,MA, MX,OM,P,PE,SG)
7411.21.50 00 Other . . . . . . . . . . . . . . . . . . . . . . . . . . . . . . . . . . kg . . . . . . 3% Free (A,AU,BH, 49% CA,CL,E,IL,J,JO, MA,MX,OM, P,PE,SG)
7411.22.00 00 Of copper-nickel base alloys (cupro-nickel) or copper-nickel-zinc base alloys (nickel-silver) . . . . . . kg . . . . . . 3% Free (A,AU,BH,CA, 47%
CL,E,IL,J,JO,MA, MX,OM,P,PE,SG)
7411.29 Other:7411.29.10 00 Seamless . . . . . . . . . . . . . . . . . . . . . . . . . . . . . . kg . . . . . . 1.4% Free (A,AU,BH,CA, 10%
CL,E,IL,J,JO,MA, MX,OM,P,PE,SG)
7411.29.50 00 Other . . . . . . . . . . . . . . . . . . . . . . . . . . . . . . . . . . kg . . . . . . 3% Free (A,AU,BH,CA, 49% CL,E,IL,J,JO,MA, MX,OM,P,PE,SG)

Harmonized Tariff Schedule of the United States (2010) (Rev. 2)Annotated for Statistical Reporting Purposes
XV74-14 Heading/ Stat. Unit Rates of Duty Subheading Suf- Article Description of 1 2 fix Quantity General Special7419 Other articles of copper:7419.10.00 00 Chain and parts thereof . . . . . . . . . . . . . . . . . . . . . . . . . . kg . . . . . . 3% Free (A,B,AU,BH, 45%
CA,CL,E,IL,J,JO, MA,MX,OM, P,PE,SG)
Other:7419.91.00 Cast, molded, stamped or forged, but not further
worked . . . . . . . . . . . . . . . . . . . . . . . . . . . . . . . . . . . . . . . . . . . . . Free 46% 10 Brass plumbing goods, not elsewhere specified
or included . . . . . . . . . . . . . . . . . . . . . . . . . . . . . kg 50 Other . . . . . . . . . . . . . . . . . . . . . . . . . . . . . . . . . . kg
7419.99 Other:Cloth (including endless bands), grill andnetting, of copper wire; expanded metal ofcopper:
Cloth:7419.99.03 00 Fourdrinier wires, seamed or not
seamed, suitable for use in paper-making machines, with 94 or morewires to the lineal centimeter . . . . . . . . . m2 . . . . . . Free 75%
kg7419.99.06 Other . . . . . . . . . . . . . . . . . . . . . . . . . . . . . . . . . . . . . 3% Free (A,AU,BH,CA, 43%
CL,E,IL,J,JO,MA, MX,OM,P,PE,SG)
60 Fourdrinier wires, seamed or notseamed, suitable for use in paper-making machines, with fewer than94 or more wires to the linealcentimeter . . . . . . . . . . . . . . . . . . . . m2
kg 80 Other . . . . . . . . . . . . . . . . . . . . . . . . m2
kg
7419.99.09 00 Other . . . . . . . . . . . . . . . . . . . . . . . . . . . . . . . kg . . . . . . 3% Free (A,AU,B,BH, 43% CA,CL,E,IL,J,JO, MA,MX,OM, P,PE,SG)
7419.99.15 00 Containers of a kind normally carried on the person, in the pocket or in the handbag . . . . . . . doz. . . . . 3% Free (AU,BH,CA,D, 110%
CL,E,IL,J,JO,MA, MX,OM,P,PE,SG)
7419.99.16 00 Copper springs . . . . . . . . . . . . . . . . . . . . . . . . . . kg . . . . . . 3% Free (A,AU,B,BH, 45% CA,CL,E,IL,J,JO, MA,MX,OM, P,PE,SG)
Other:7419.99.30 00 Coated or plated with precious metal . . . . . . kg . . . . . . 3% Free (A,AU,BH,CA, 65%
CL,E,IL,J,JO,MA, MX,OM,P,PE,SG)
7419.99.50 Other . . . . . . . . . . . . . . . . . . . . . . . . . . . . . . . . . . . . . . . . Free 46% 10 Brass plumbing goods not elsewhere
specified or included . . . . . . . . . . . . . . . . kg
50 Other . . . . . . . . . . . . . . . . . . . . . . . . . . . . kg
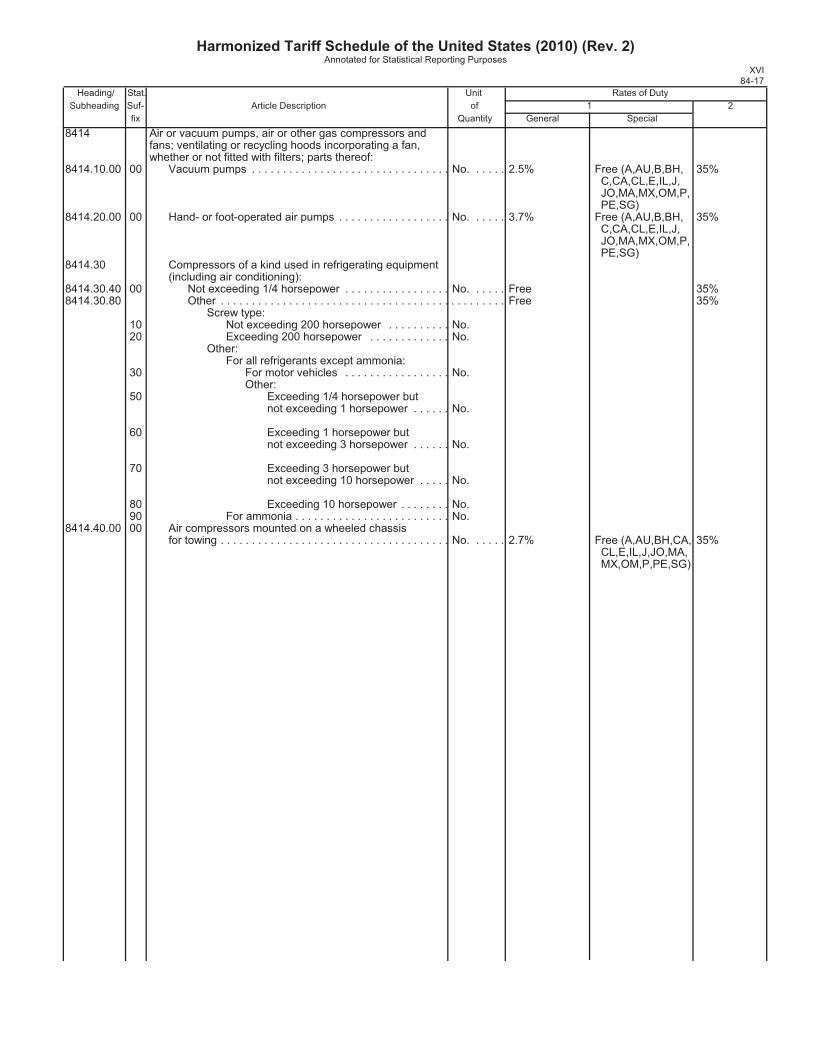
Harmonized Tariff Schedule of the United States (2010) (Rev. 2)Annotated for Statistical Reporting Purposes
XVI84-17
Heading/ Stat. Unit Rates of Duty Subheading Suf- Article Description of 1 2 fix Quantity General Special8414 Air or vacuum pumps, air or other gas compressors and
fans; ventilating or recycling hoods incorporating a fan, whether or not fitted with filters; parts thereof:
8414.10.00 00 Vacuum pumps . . . . . . . . . . . . . . . . . . . . . . . . . . . . . . . . No. . . . . . 2.5% Free (A,AU,B,BH, 35% C,CA,CL,E,IL,J, JO,MA,MX,OM,P, PE,SG)
8414.20.00 00 Hand- or foot-operated air pumps . . . . . . . . . . . . . . . . . . No. . . . . . 3.7% Free (A,AU,B,BH, 35% C,CA,CL,E,IL,J, JO,MA,MX,OM,P, PE,SG)
8414.30 Compressors of a kind used in refrigerating equipment (including air conditioning):
8414.30.40 00 Not exceeding 1/4 horsepower . . . . . . . . . . . . . . . . . No. . . . . . Free 35%8414.30.80 Other . . . . . . . . . . . . . . . . . . . . . . . . . . . . . . . . . . . . . . . . . . . . . . Free 35%
Screw type: 10 Not exceeding 200 horsepower . . . . . . . . . . No. 20 Exceeding 200 horsepower . . . . . . . . . . . . . No.
Other:For all refrigerants except ammonia:
30 For motor vehicles . . . . . . . . . . . . . . . . . No.Other:
50 Exceeding 1/4 horsepower butnot exceeding 1 horsepower . . . . . . No.
60 Exceeding 1 horsepower butnot exceeding 3 horsepower . . . . . . No.
70 Exceeding 3 horsepower butnot exceeding 10 horsepower . . . . . No.
80 Exceeding 10 horsepower . . . . . . . . No. 90 For ammonia . . . . . . . . . . . . . . . . . . . . . . . . . No.
8414.40.00 00 Air compressors mounted on a wheeled chassisfor towing . . . . . . . . . . . . . . . . . . . . . . . . . . . . . . . . . . . . . No. . . . . . 2.7% Free (A,AU,BH,CA, 35%
CL,E,IL,J,JO,MA, MX,OM,P,PE,SG)
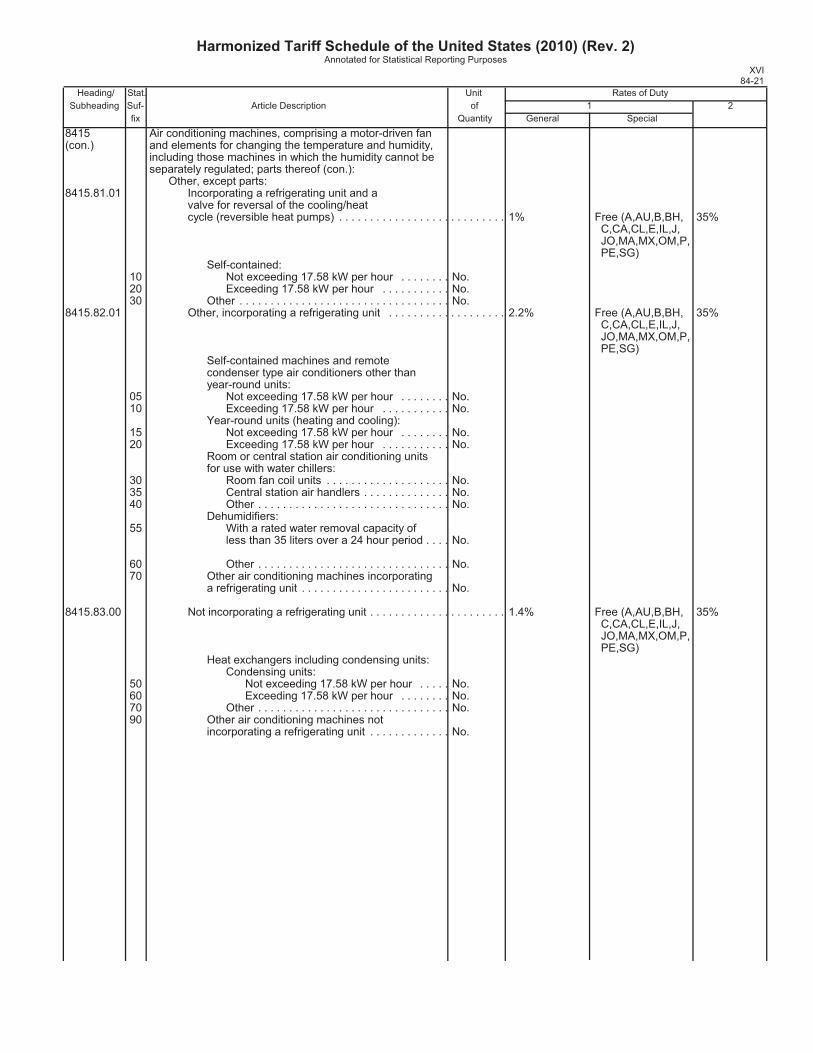
Harmonized Tariff Schedule of the United States (2010) (Rev. 2)Annotated for Statistical Reporting Purposes
XVI84-21
Heading/ Stat. Unit Rates of Duty Subheading Suf- Article Description of 1 2 fix Quantity General Special8415 Air conditioning machines, comprising a motor-driven fan (con.) and elements for changing the temperature and humidity,
including those machines in which the humidity cannot be separately regulated; parts thereof (con.):
Other, except parts:8415.81.01 Incorporating a refrigerating unit and a
valve for reversal of the cooling/heat cycle (reversible heat pumps) . . . . . . . . . . . . . . . . . . . . . . . . . . . 1% Free (A,AU,B,BH, 35%
C,CA,CL,E,IL,J, JO,MA,MX,OM,P, PE,SG)
Self-contained: 10 Not exceeding 17.58 kW per hour . . . . . . . . No. 20 Exceeding 17.58 kW per hour . . . . . . . . . . . No. 30 Other . . . . . . . . . . . . . . . . . . . . . . . . . . . . . . . . . . No.
8415.82.01 Other, incorporating a refrigerating unit . . . . . . . . . . . . . . . . . . . 2.2% Free (A,AU,B,BH, 35% C,CA,CL,E,IL,J, JO,MA,MX,OM,P, PE,SG)
Self-contained machines and remotecondenser type air conditioners other than year-round units:
05 Not exceeding 17.58 kW per hour . . . . . . . . No. 10 Exceeding 17.58 kW per hour . . . . . . . . . . . No.
Year-round units (heating and cooling): 15 Not exceeding 17.58 kW per hour . . . . . . . . No. 20 Exceeding 17.58 kW per hour . . . . . . . . . . . No.
Room or central station air conditioning units for use with water chillers:
30 Room fan coil units . . . . . . . . . . . . . . . . . . . . No. 35 Central station air handlers . . . . . . . . . . . . . . No. 40 Other . . . . . . . . . . . . . . . . . . . . . . . . . . . . . . . No.
Dehumidifiers: 55 With a rated water removal capacity of
less than 35 liters over a 24 hour period . . . . No.
60 Other . . . . . . . . . . . . . . . . . . . . . . . . . . . . . . . No. 70 Other air conditioning machines incorporating
a refrigerating unit . . . . . . . . . . . . . . . . . . . . . . . . No.
8415.83.00 Not incorporating a refrigerating unit . . . . . . . . . . . . . . . . . . . . . . 1.4% Free (A,AU,B,BH, 35% C,CA,CL,E,IL,J, JO,MA,MX,OM,P, PE,SG)
Heat exchangers including condensing units:Condensing units:
50 Not exceeding 17.58 kW per hour . . . . . No. 60 Exceeding 17.58 kW per hour . . . . . . . . No. 70 Other . . . . . . . . . . . . . . . . . . . . . . . . . . . . . . . No. 90 Other air conditioning machines not
incorporating a refrigerating unit . . . . . . . . . . . . . No.

Harmonized Tariff Schedule of the United States (2010) (Rev. 2)Annotated for Statistical Reporting Purposes
XVI84-22 Heading/ Stat. Unit Rates of Duty Subheading Suf- Article Description of 1 2 fix Quantity General Special8415 Air conditioning machines, comprising a motor-driven fan (con.) and elements for changing the temperature and humidity,
including those machines in which the humidity cannot be separately regulated; parts thereof (con.):
8415.90 Parts:8415.90.40 00 Chassis, chassis bases and outer cabinets . . . . . . . No. . . . . . 1.4% Free (A,AU,B,BH, 35%
C,CA,CL,E,IL,J, JO,MA,MX,OM,P, PE,SG)
8415.90.80 Other . . . . . . . . . . . . . . . . . . . . . . . . . . . . . . . . . . . . . . . . . . . . . . 1.4% Free (A,AU,B,BH, 35% C,CA,CL,E,IL,J, JO,MA,MX,OM,P, PE,SG)
25 Air conditioning evaporator coils . . . . . . . . . . . . . No.Other:
45 Of automotive air conditioners . . . . . . . . . . . X 65 Of heat pumps . . . . . . . . . . . . . . . . . . . . . . . X 85 Other . . . . . . . . . . . . . . . . . . . . . . . . . . . . . . . X
8416 Furnace burners for liquid fuel, for pulverized solid fuel or for gas; mechanical stokers, including their mechanical grates, mechanical ash dischargers and similar appliances; parts thereof:
8416.10.00 00 Furnace burners for liquid fuel . . . . . . . . . . . . . . . . . . . . No. . . . . . Free 27.5%8416.20.00 Other furnace burners, including combination burners . . . . . . . . . . . Free 27.5%
40 Gas burners . . . . . . . . . . . . . . . . . . . . . . . . . . . . . . . No. 80 Other . . . . . . . . . . . . . . . . . . . . . . . . . . . . . . . . . . . . . No.
8416.30.00 00 Mechanical stokers, including their mechanical grates, mechanical ash dischargers and similar appliances . . . . X . . . . . . . Free 27.5%
8416.90.00 00 Parts . . . . . . . . . . . . . . . . . . . . . . . . . . . . . . . . . . . . . . . . X . . . . . . . Free 27.5%
8417 Industrial or laboratory furnaces and ovens, including incinerators, nonelectric, and parts thereof:
8417.10.00 00 Furnaces and ovens for the roasting, melting or other heat treatment of ores, pyrites or of metals . . . . . . . . . . . No. . . . . . 2.9% Free (A,AU,BH,CA, 45%
CL,E,IL,J,JO,MA, MX,OM,P,PE,SG)
8417.20.00 00 Bakery ovens, including biscuit ovens . . . . . . . . . . . . . . No. . . . . . 3.5% Free (A,AU,BH,CA, 45% CL,E,IL,J,JO,MA, MX,OM,P,PE,SG)
8417.80.00 00 Other, except parts . . . . . . . . . . . . . . . . . . . . . . . . . . . . . No. . . . . . 3.9% Free (A,AU,BH,CA, 45% CL,E,IL,J,JO,MA, MX,OM,P,PE,SG)
8417.90.00 00 Parts . . . . . . . . . . . . . . . . . . . . . . . . . . . . . . . . . . . . . . . . X . . . . . . . 3.9% Free (A,AU,BH,CA, 45% CL,E,IL,J,JO,MA, MX,OM,P,PE,SG)
APPENDIX E
U.S. PRODUCTION AND IMPORT DATA REGARDING INDUSTRIAL ANDPLUMBING SRC PIPE AND TUBE
E-1

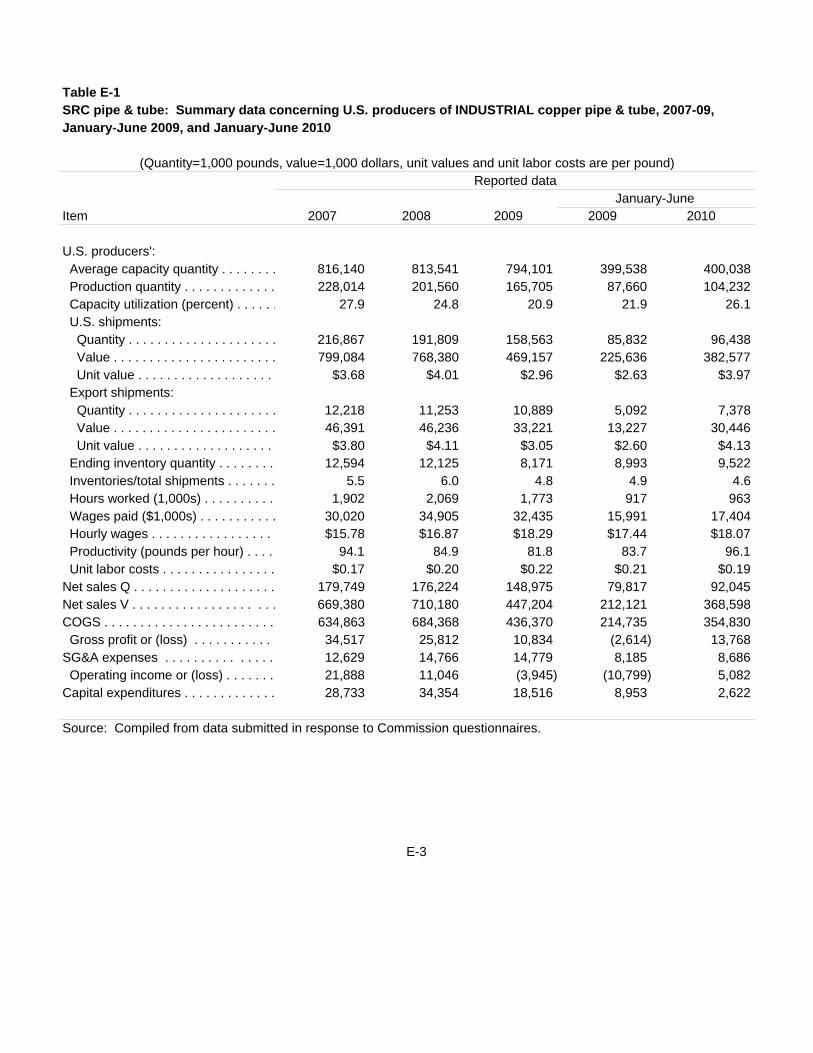
Table E-1SRC pipe & tube: Summary data concerning U.S. producers of INDUSTRIAL copper pipe & tube, 2007-09, January-June 2009, and January-June 2010
(Quantity=1,000 pounds, value=1,000 dollars, unit values and unit labor costs are per pound)Reported data
January-June Item 2007 2008 2009 2009 2010
U.S. producers': Average capacity quantity . . . . . . . . 816,140 813,541 794,101 399,538 400,038 Production quantity . . . . . . . . . . . . . 228,014 201,560 165,705 87,660 104,232 Capacity utilization (percent) . . . . . . 27.9 24.8 20.9 21.9 26.1 U.S. shipments: Quantity . . . . . . . . . . . . . . . . . . . . . 216,867 191,809 158,563 85,832 96,438 Value . . . . . . . . . . . . . . . . . . . . . . . 799,084 768,380 469,157 225,636 382,577 Unit value . . . . . . . . . . . . . . . . . . . $3.68 $4.01 $2.96 $2.63 $3.97 Export shipments: Quantity . . . . . . . . . . . . . . . . . . . . . 12,218 11,253 10,889 5,092 7,378 Value . . . . . . . . . . . . . . . . . . . . . . . 46,391 46,236 33,221 13,227 30,446 Unit value . . . . . . . . . . . . . . . . . . . $3.80 $4.11 $3.05 $2.60 $4.13 Ending inventory quantity . . . . . . . . 12,594 12,125 8,171 8,993 9,522 Inventories/total shipments . . . . . . . 5.5 6.0 4.8 4.9 4.6 Hours worked (1,000s) . . . . . . . . . . 1,902 2,069 1,773 917 963 Wages paid ($1,000s) . . . . . . . . . . . 30,020 34,905 32,435 15,991 17,404 Hourly wages . . . . . . . . . . . . . . . . . $15.78 $16.87 $18.29 $17.44 $18.07 Productivity (pounds per hour) . . . . 94.1 84.9 81.8 83.7 96.1 Unit labor costs . . . . . . . . . . . . . . . . $0.17 $0.20 $0.22 $0.21 $0.19Net sales Q . . . . . . . . . . . . . . . . . . . . 179,749 176,224 148,975 79,817 92,045Net sales V . . . . . . . . . . . . . . . . . . . . 669,380 710,180 447,204 212,121 368,598COGS . . . . . . . . . . . . . . . . . . . . . . . . 634,863 684,368 436,370 214,735 354,830 Gross profit or (loss) . . . . . . . . . . . 34,517 25,812 10,834 (2,614) 13,768SG&A expenses . . . . . . . . . . . . . . . 12,629 14,766 14,779 8,185 8,686 Operating income or (loss) . . . . . . . 21,888 11,046 (3,945) (10,799) 5,082Capital expenditures . . . . . . . . . . . . . 28,733 34,354 18,516 8,953 2,622
Source: Compiled from data submitted in response to Commission questionnaires.
E-3

Table E-2SRC pipe & tube: Summary data concerning U.S. producers of PLUMBING copper pipe & tube, 2007-09, January-June 2009, and January-June 2010
(Quantity=1,000 pounds, value=1,000 dollars, unit values and unit labor costs are per pound)Reported data
January-June Item 2007 2008 2009 2009 2010
U.S. producers': Average capacity quantity . . . . . . . . 1,021,144 976,144 976,144 489,496 489,496 Production quantity . . . . . . . . . . . . . 479,401 379,356 316,409 171,180 176,729 Capacity utilization (percent) . . . . . . 46.9 38.9 32.4 35.0 36.1 U.S. shipments: Quantity . . . . . . . . . . . . . . . . . . . . . 498,506 389,361 328,658 180,584 169,568 Value . . . . . . . . . . . . . . . . . . . . . . . 2,069,647 1,644,440 991,728 473,032 676,356 Unit value . . . . . . . . . . . . . . . . . . . $4.15 $4.22 $3.02 $2.62 $3.99 Export shipments: Quantity . . . . . . . . . . . . . . . . . . . . . 15,595 18,098 13,851 7,593 10,419 Value . . . . . . . . . . . . . . . . . . . . . . . 64,972 76,254 41,934 19,947 42,127 Unit value . . . . . . . . . . . . . . . . . . . $4.17 $4.21 $3.03 $2.63 $4.04 Ending inventory quantity . . . . . . . . 35,257 34,366 28,672 31,104 25,281 Inventories/total shipments . . . . . . . 6.9 8.4 8.4 8.3 7.0 Hours worked (1,000s) . . . . . . . . . . 3,533 3,334 2,829 1,445 1,394 Wages paid ($1,000s) . . . . . . . . . . . 64,079 59,554 52,976 26,825 26,176 Hourly wages . . . . . . . . . . . . . . . . . $18.14 $17.86 $18.73 $18.56 $18.78 Productivity (pounds per hour) . . . . 124.9 113.8 111.8 118.5 126.8 Unit labor costs . . . . . . . . . . . . . . . . $0.15 $0.16 $0.17 $0.16 $0.15Net sales Q . . . . . . . . . . . . . . . . . . . . 443,780 383,589 323,724 174,800 167,072Net sales V . . . . . . . . . . . . . . . . . . . . 1,853,721 1,641,278 985,786 462,238 672,631COGS . . . . . . . . . . . . . . . . . . . . . . . . 1,621,053 1,441,726 897,598 410,582 621,517 Gross profit or (loss) . . . . . . . . . . . 232,668 199,552 88,188 51,656 51,114SG&A expenses . . . . . . . . . . . . . . . 43,647 42,987 39,139 18,682 20,881 Operating income or (loss) . . . . . . . 189,021 156,565 49,049 32,974 30,233Capital expenditures . . . . . . . . . . . . . 10,511 9,417 12,842 7,137 2,045
Source: Compiled from data submitted in response to Commission questionnaires.
E-5

Table E-3SRC Pipe and Tube: U.S. importers’ U.S. imports, U.S. shipments, inventories, and channels ofdistribution for INDUSTRIAL copper pipe and tube from China and Mexico, 2007-09, January-June2009, and January-June 2010
* * * * * * *
E-5

Table E-4SRC Pipe and Tube: U.S. importers’ U.S. imports, U.S. shipments, inventories, and channels ofdistribution for PLUMBING copper pipe and tube from China and Mexico, 2007-09, January-June2009, and January-June 2010
* * * * * * *
E-6

APPENDIX F
U.S. PRODUCERS’ AND IMPORTERS’ COMMENTS REGARDING THECOMPARABILITY OF INDUSTRIAL AND PLUMBING SRC PIPE AND TUBE
F-1


U.S. PRODUCERS COMMENTS REGARDING THE COMPARABILITY OF INDUSTRIALAND PLUMBING SEAMLESS REFINED COPPER PIPE AND TUBE
The Commission asked U.S. producers whether industrial and plumbing seamless refined copperpipe and tube have the same physical characteristics and end uses and to describe these similaritiesand/or differences Their responses are as follows.
* * * * * * *
The Commission asked U.S. producers whether industrial and plumbing seamless refined copperpipe and tube are interchangeable and to describe what makes the products interchangeable or notinterchangeable. Their responses are as follows.
* * * * * * *
The Commission asked U.S. producers whether the manufacturing processes to produce industrialseamless refined copper pipe and tube are similar to those to produce plumbing seamless refinedcopper pipe and tube and to describe these similarities and/or differences. Their responses are asfollows.
* * * * * * *
The Commission asked U.S. producers whether industrial and plumbing seamless refined copperpipe and tube share the same channels of distribution. Their responses are as follows.
* * * * * * *
The Commission asked U.S. producers whether customers perceive industrial and plumbingseamless refined copper pipe and tube to be similar products. Their responses are as follows.
* * * * * * *
The Commission asked U.S. producers whether there are generally differences in price betweenindustrial and plumbing seamless refined copper pipe and tube. They were asked which type wasgenerally higher in price. Their responses are as follows.
* * * * * * *
F-3

U.S. IMPORTERS COMMENTS REGARDING THE COMPARABILITY OF INDUSTRIALAND PLUMBING SEAMLESS REFINED COPPER PIPE AND TUBE
The Commission asked U.S. importers whether industrial and plumbing seamless refined copperpipe and tube have the same physical characteristics and end uses and to describe these similaritiesand/or differences. Their responses are as follows.
* * * * * * *
The Commission asked U.S. importers whether industrial and plumbing seamless refined copperpipe and tube are interchangeable and to describe what makes the products interchangeable or notinterchangeable. Their responses are as follows.
* * * * * * *
The Commission asked U.S. importers whether the manufacturing processes to produce industrialseamless refined copper pipe and tube are similar to those to produce plumbing seamless refinedcopper pipe and tube and to describe these similarities and/or differences. Their responses are asfollows.
* * * * * * *
The Commission asked U.S. importers whether industrial and plumbing seamless refined copperpipe and tube share the same channels of distribution. Their responses are as follows.
* * * * * * *
The Commission asked U.S. importers whether customers perceive industrial and plumbingseamless refined copper pipe and tube to be similar products. Their responses are as follows.
* * * * * * *
The Commission asked U.S. importers whether there are generally differences in price betweenindustrial and plumbing seamless refined copper pipe and tube. They were asked which type wasgenerally higher in price. Their responses are as follows.
* * * * * * *
F-4

APPENDIX G
NONSUBJECT COUNTRY PRICE DATA
G-1


One importer (***) reported price data for nonsubject country Canada for products 1-4, and 7 andone importer (***) reported price data for nonsubject country Malaysia for product 5. In comparingnonsubject country pricing data with U.S. producer pricing data, prices for product imported fromnonsubject countries were lower than prices for U.S. produced product in 15 instances and higher in 19instances. In comparing nonsubject country pricing data with subject country pricing data, prices forproduct imported from nonsubject countries were lower than prices for product imported from subjectcountries in 28 instances and higher in 29 instances. Specifically, prices for product imported fromnonsubject countries were lower than prices for product imported from China in 15 instances and higher in12 instances; and nonsubject prices were lower than prices for product imported from Mexico in 13instances and higher in 17 instances. Price and quantity data for Canadian and Malaysia are in tables G-1to G-2 and in shown in figure G-1 with U.S. and subject sources.
Table G-1SRC pipe and tube: Weighted-average f.o.b. prices and quantities of nonsubject imported products1-31, by quarters, January 2007-June 2010
* * * * * * *Table G-2SRC pipe and tube: Weighted-average f.o.b. prices and quantities of nonsubject imported products4,5, and 71, by quarters, January 2007-June 2010
* * * * * * *Figure G-1SRC pipe and tube: Weighted-average f.o.b. prices and quantities of domestic and importedproduct, by quarters, January 2007-June 2010
* * * * * * *
G-3