search for dineutron correlation in borromean halo …
TRANSCRIPT

SEARCH FOR DINEUTRON CORRELATION IN BORROMEAN HALO NUCLEI
A. Corsi CEA Saclay
NS2016, Knoxville, 25-29th July 2016

Outline
• Dineutron correlation in Borromean nuclei
• (p,pn) Quasi Free Scattering (QFS)
• Spectroscopy of unbound 10Li
• Opening angle distributions: 11Li, 14Be
• Conclusions

DINEUTRON CORRELATION
PAIRING (BCS LIKE) DI-NEUTRON
DECREASING DENSITY
ρ/ρ0
Hagino et al., PRL 99 (2007)
MICROSCOPIC ANALYSIS OF 11Li ELASTIC . . . PHYSICAL REVIEW C 88, 034612 (2013)
we would like to emphasize the general importance of theaccount for the exchange part of the OP. As shown in differentexamples in Ref. [35], the exchange effects lead, for instance,to a particular energy dependence of the total potential and todifferent signs of the direct and exchange inelastic form factorsand others, so they should be treated as accurately as possible.
The LSSM proton and neutron densities used in our workfor 11Li are calculated in a complex 2hω shell-model spaceusing the WS basis of single-particle wave functions withexponential asymptotic behavior [43], which is, in principle,the realistic one. Here we would like to discuss this point. Inmany works, to simplify analytical studies and calculations oneuses basic functions and densities with Gaussian asymptoticsof the type exp(−ar2), while it has to be the exponentialone, exp(−br)/r , where parameter b is related to the boundenergy of the particle in the upper shell. This differencecan affect the results for cross sections in the region ofrelatively large angles of scattering. This point was one of thereasons the LSSM densities [43] for 9,11Li were used in ourwork.
B. Optical potential within the high-energy approximation
In the present work we use the hybrid model of theOP [39], in which its imaginary part was derived withinthe HEA theory [41,42], while the real part is obtained asprescribed by the folding procedure in Sec. II A. The crosssections are calculated by means of the DWUCK4 code [48]for solving the Schrodinger equation. To obtain the HEA OPone can use the definition of the eikonal phase as an integralof the nucleon-nucleus potential over the trajectory of thestraight-line propagation, and one has to compare it with thecorresponding Glauber expression for the phase in the opticallimit approximation. In this way, the HEA OP is obtained as afolding of the form factors of the nuclear density and the NNamplitude fNN (q) [39,40]:
UHopt = V H + iWH = − hv
(2π )2(αNN + i)σNN
×∫ ∞
0dqq2j0(qr)ρ2(q)fNN (q). (8)
In Eq. (8) σNN and αNN are, respectively, the NN totalscattering cross section and the ratio of the real to the imaginarypart of the forward NN scattering amplitude, both averagedover the isospin of the nucleus. These two quantities havebeen parametrized in [49] and [50] as functions of energies upto 1 GeV. The values of σNN and αNN can also account for thein-medium effect by a factor from Ref. [51].
C. The spin-orbit term
The expression for the spin-orbit contribution to the OPused in our work is added to the right-hand side of Eq. (1) andhas the form
VLS(r) = 2λ2π
[V0
1r
dfR(r)dr
+ iW01r
dfI (r)dr
](l · s), (9)
where λ2π = 2 fm2 is the squared pion Compton wavelength,
and V0 and W0 are the real and imaginary parts of the
10-6
10-4
10-2
1
0 2 4 6 8 10
ρ(r)
[fm
-3]
r [fm]
11Li
totalpoint-protonpoint-neutron
FIG. 1. Total (normalized to A = 11), point-proton (normalizedto Z = 3), and point-neutron (normalized to N = 8) densities of 11Liobtained in the LSSM approach [43].
microscopic OP at r = 0. In our work, in Eq. (9) the functionsfR(r) and fI (r) are taken as WS forms f (r, RR, aR) andf (r, RI , aI ), with the half-radius RR(RI ) and diffusenessaR(aI ) parameters obtained by the best fit of the WS potentialto the microscopically calculated real V (r) and imaginaryW (r) parts of the OP.
D. Results of calculations of 11Li + p elastic scattering
In the beginning of this subsection we consider 11Li +p elastic scattering at three energies, 62, 68.4, and75 MeV/nucleon, for which the differential cross sectionshave been measured [21–23]. The respective folding OPsV F and WH are calculated by the procedure described inSecs. II A–II C using Eqs. (1)–(9), and then the whole OP isconstructed in the form
Uopt(r) = NRV F (r) + iNIW (r)
+ 2λ2π
{NSO
R V F0
1r
dfR(r)dr
+ iNSOI WH
01r
dfI (r)dr
}(l.s).
(10)
The OP Uopt(r), (10), is applied to calculate the elastic scatter-ing differential cross sections using the program DWUCK4 [48].The number of partial waves is controlled by the parameterLMAX that corresponds to the maximum partial wave forthe distorted waves. We use the parameter LMAX = 100.For the densities of protons and neutrons of 11Li we use theLSSM ones [43] (shown in Fig. 1) that have an exponentialasymptotics which is the correct one. As can be seen fromEq. (10), we introduce and consider the set of N coefficientsas parameters that can be found by fitting the calculated tothe experimental differential cross sections of 11Li + p elasticscattering. Moreover, the fitting procedure can be constrainedby additional conditions on the behavior of the OPs (as inRefs. [44–46] and show below). The real and imaginary partsof the SO OP in (10) are approximated by the WS form. Theirparameters V F
0 (WH0 ), RR(RI ), and aR(aI ) were obtained by
a fitting procedure to the respective calculated microscopicpotentials V F (r) and WH (r). We take the ImOP in two forms,the microscopically obtained WH within HEA (W = WH ) orthe form of the folded real potential V F (W = V F ).
034612-3
R (fm)
r rm
s (fm
)

HOW TO PROBE IT: THE CASE OF 11LI
• C induced knockout Simon et al., PRL 83 (1999)
• Coulomb breakup Nakamura et al., PRL 96 (2006)
• H induced knockout Aksyutina et al., PLB 718 (2013)
Asymmetry èdifferent parity

HOW TO PROBE IT: THE CASE OF 11LI
• C induced knockout Simon et al., PRL 83 (1999)
• Coulomb breakup Nakamura et al., PRL 96 (2006)
• H induced knockout Aksyutina et al., PLB 718 (2013)
B(E1) ~ cos(θ12) èθ12 = 48+14-18°
θ12

HOW TO PROBE IT: THE CASE OF 11LI
• C induced knockout Simon et al., PRL 83 (1999)
• Coulomb breakup Nakamura et al., PRL 96 (2006)
• H induced knockout Aksyutina et al., PLB 718 (2013)
d-wave component
B(E1) ~ cos(θ12) èθ12 = 48+14-18°
θ12

CAVEATS
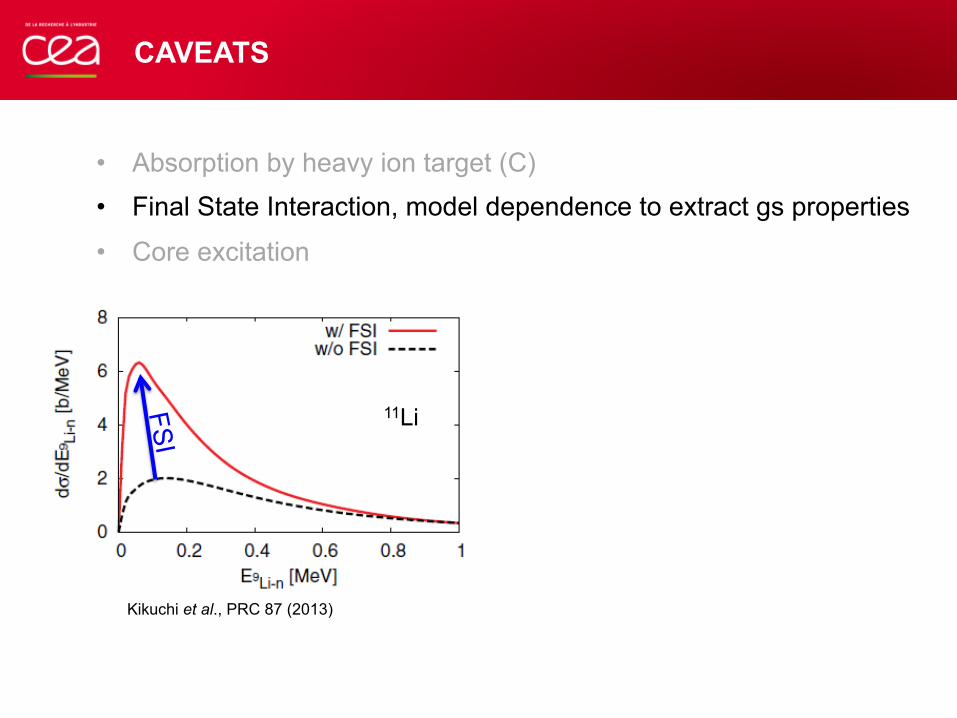
• Absorption by heavy ion target (C) • Final State Interaction, model dependence to extract gs properties
• Core excitation
CAVEATS
• Absorption by heavy ion target (C) • Final State Interaction, model dependence to extract gs properties
• Core excitation
Kikuchi et al., PRC 87 (2013)
11Li FSI

CAVEATS
• Absorption by heavy ion target (C) • Final State Interaction, model dependence to extract gs properties
• Core excitation
excited core/halo components Tanihata et al., PRL 100 (2008) Potel et al., PRL 105 (2010)
11Li(p,t)
Kikuchi et al., PRC 87 (2013)
11Li FSI

9Li
n1 n2
p
(p,pn) reaction Neutron emission
Free from FSI
2-body FSI
• QFS on Hydrogen to minimize Final State Interaction (2) • Kinematically complete measurement • Core excitation via γ detection • Observable sensitive to dineutron: θY
è Need high statistics : RIBF + MINOS thick target = x 100 in statistics
THIS EXPERIMENT
1) 2) 3)
9Li
2
1 kY
θY

1.0 m
BDC
WINDS NEBULA
FDC1 Dipole magnet
SBT
RPD MINOS+DALI
Dec. 2014
Spokespersons: Y.Kubota (CNS, RNC) and A.Corsi (CEA Saclay)
Beam: 2 × 10⁵ pps: 11Li (60%), 14Be(10%), 17B (8%) Statistics: 15-cm LH2 target →105 p×n×n×9Li coincidences in 1 week
EXPERIMENTAL SETUP AT RIBF, RIKEN

Wed Jul 6 15:53:47 2016
A/Q3 3.2 3.4 3.6 3.8 4
Z
2
4
6
81.26319*sqrt(F13PLA_QGM/(log(12775*fbeta^2)-log(1-fbeta^2)-fbeta^2))*fbeta-0.856301 : 2.86*sqrt(((fTOF713)*299.792458/35849.3935)^2-1)*(1+AF5PLA_TXG[0]/31.7/100)
Li11
Pile up
Be12Be14
B17
B19C20
Wed Jul 6 16:39:50 2016
A/Q1.5 2 2.5 3 3.5 4 4.5
Z
1
2
3
4
h2
Li9Li8
He6
H3
H3H + 3
σZ = 1.2 x 10⁻²
σA/Q = 1.4 x 10⁻¹
11Li
14Be 17B
(p,pn) 10Li* 9Li + n (Y.Kubota, RNC)
σZ = 7.9 x 10⁻²
σA/Q = 3.7 x 10⁻²
Beam PID Heavy fragment PID for 11Li beam
NUCLEI OF INTEREST
(p,2p) 10He* 8He + 2n, 6He + 4n (S.Giraud, CEA Saclay) (p,pn) 13Be* 12Be + n (A.Corsi, CEA Saclay) (p,pn) 15B + n (Y.Zaihong, RNC) 16B*

Mon Jun 20 17:11:56 2016
[MeV]rel
Relative energy E0 1 2 3 4 5 6
Cou
nts/
40 k
eV
0
500
1000
1500
2000
_hErelMon Jun 20 17:12:17 2016
[MeV]rel
Relative energy E0 0.5 1 1.5
Cou
nts/
10 k
eV
0
200
400
600
_hErel
Mon Jun 20 17:12:28 2016
[MeV]rel
Relative energy E3 4 5 6 7
Cou
nts/
160
keV
0
50
100
150
200_hErel
10LI INVARIANT MASS: A NEW RESONANCE
Yu. Aksyutina et al. / Physics Letters B 718 (2013) 1309–1313 1311
Fig. 2. Upper panel: Momentum profile for the 6He + n system after one-neutronknockout from 8He. The solid line is the calculated p-wave momentum profile,which is fitted to the experimental data. The s- and d-profile functions are alsoshown as an illustration of the large separation between the different l components,which makes this type of analysis very sensitive. Lower panel: Relative energy spec-trum for 6He+n [8]. The solid line is the result of an R-matrix fit to the data foldedwith the experimental resolution [8]. The inset shows the profile function in thelow energy region, where the deviation is interpreted as due to knockout from a(1s1/2)2 component in the 8He ground-state wave-function.
in the E f n spectrum [7] determined from the fit: Pr.e.(E f n) =√αsσ 2
s + (1 − αs)σ 2p , where σ 2
s and σ 2p are calculated variances
for l = 0 and l = 1, respectively. The profile function Pr.e.(E f n) ishere given up to 6 MeV and one notes that the fit with only sand p components follow the experimental data only up to about1.5 MeV. In the energy region from 1.5 MeV on one notes an in-creasing excess all the way up to the top of the spectrum. Thisexcess is interpreted as due to knock-out from (d5/2)
2 compo-nent in the 11Li ground-state wave-function. The relative weight of(d5/2)
2 component in the E f n spectrum αd was obtained by usingthe relation: αd = (P 2
exp − P 2r.e.)/(σ
2d − P 2
r.e.) for E f n > 1.5 MeV. Thesize of this contribution is 11(2)%, a result which is in agreementwith the earlier determined value of 17(5)% obtained in Ref. [11]from an analysis of the transverse momentum distribution. Onecan also see that the fit to the relative energy spectrum falls belowthe experimental data at high energies. The knock-out from thed-wave states populates the narrow states in 10Li, with structure[d5/2 ⊗(3/2−)]1−,2−,3−,4− . We can, however, not resolve such stateswith our experimental resolution but the profile function analysisadds the information that the d-wave strength is distributed in theenergy region between 1.5 to 6 MeV.
While the high-statistics data for 7He and 10Li has been dis-cussed earlier [7,8] we present here, as our third case, for the firsttime the new data for 13Be. Also here the resolution and statisticsare superior to that of our earlier paper [11]. A major problemin the interpretation of 13Be originates in the complex nuclearstructure of the neutron-rich beryllium isotopes. It was enunci-ated already in 1976 that several observed properties of the T = 2,Iπ = 0+ states of A = 12 nuclei favor a model of the 12Be ground-
Fig. 3. Upper panel: Momentum profile of the 9Li + n system after one-neutronknockout from 11Li. The calculated s-(dashed), p-(dotted) and d-wave (dash-dotted)momentum profiles are shown together with a solid line determined from the s-to-p ratio derived from the data in the lower panel. The thin-solid line is a smooth linethrough experimental points. Lower panel: Relative energy spectrum for 9Li + n [7].The different contributions from a R-matrix fit to the data, folded with the ex-perimental resolution, are shown as dotted (virtual s-state) and dashed (p-waveresonance) lines with the solid line as their sum.
state wave-function being made up of only small components thatbelong to the lowest shell-model configurations, while instead s-,p- and d-shells are populated with almost equal weights [12,13],
12Be(g.s.) = α[10Be ⊗ (1s1/2)
2]
+ β[10Be ⊗ (0p1/2)
2] + γ[10Be ⊗ (0d5/2)
2]. (2)
Here, 10Be forms an inert core with a closed 0p3/2 neutron shell.This conjecture has actually been confirmed in a series of recentexperiments [14–18]. In Ref. [14] it was found that N = 8 is nota good closed shell for 12Be since it contains a major (s2 − d2)intruder configuration. This breakdown of the N = 8 shell clo-sure is also expected theoretically [13,19–24]. This means that thestructure of 12Be essentially is of few-body character and that adescription of 13Be with a 12Be core having a closed p1/2 shellis not a good approximation. The open decay channels from 13Beto excited states in 12Be makes the situation even more compli-cated [11,25]. If the remaining fragment, after neutron knockoutfrom a Borromean nucleus, is left in an excited, gamma-decayingstate, the corresponding peak in the E f n spectrum will be shiftedtowards low energies by the excitation energy of the fragment.
The difficulty in the interpretation of 13Be data is illustrated bythe three relatively recently published data sets, all with differentinterpretation of the momentum content around 0.5 MeV in theexcitation spectrum. From data obtained at GANIL [26] it is inter-preted as a Breit–Wigner l = 0 resonance; from the one-neutronknockout data from 14Be, measured earlier at GSI, as a dominatingvirtual s-state [11]; and, finally, from data obtained at RIKEN [25]it is interpreted as an l = 1 resonance together with a small con-tribution from a virtual s state.
Yu. Aksyutina et al., Phys. Lett. B 718
s-wave virtual state p-wave resonance
New resonance: • Er = 5.52±0.04 MeV • Γ = 0.72±0.10 MeV • d-wave resonance
Previous work
Courtesy: Y.Kubota, RNC
9Li
2
1 Erel

Thu Jun 23 02:47:42 2016
1
10
210
)YθOpening angle cos(-1 -0.5 0 0.5 1
[MeV
]re
lE
Relat
ive e
nerg
y
0
2
4
6
8
10
OPENING ANGLE: DINEUTRON CORRELATION IN 11LI
Fri Jun 24 21:13:37 2016
)YθOpening angle cos(-1 -0.5 0 0.5 1
Coun
ts/0.
1
0
1000
2000
3000
4000
Dineutron Cigar
VOLUME 83, NUMBER 3 P HY S I CA L REV I EW LE T T ER S 19 JULY 1999
FIG. 2. Distribution of the decay neutrons from 10Li formedin 11Li neutron knockout reactions. The inset shows aschematic diagram of the reaction where unf is the anglebetween the momentum direction of 10Li reconstructed as a sumof the momenta of the 9Li fragment and the decay neutron—and the direction of the n 1 9Li relative momentum pnf . Thedistribution asymmetry can be explained only if one assumescontributions from interfering s and p states in 10Li.
direct evidence for a strong mixture of different paritystates since it implies that the distribution must contain alinear term in cos!unf ". This is model independent proofof the appearance of the s and p states in 11Li. Theoriginal distribution was restored by a Monte Carlomethod which takes into account all the basic parametersof the setup, and an iteration procedure was used to fit theexperimental data. The histogram in Fig. 2 is the result ofsuch a procedure.The undisturbed distribution used in the Monte Carlo
calculations was approximated by a polynomial expansionin terms of cos!unf":W !unf" ! 1 2 1.03!4" cos!unf" 1 1.41!8" cos2!unf" .
(4)This gives a mean value of unf ! 103.4!2.1"±, in agree-ment with the above estimate.We now proceed to investigate how Eq. (4) is related
to the s and p components in the 11Li ground-state wavefunction. For this, we restrict ourselves to consideringonly three different spin and angular momentum con-figurations in 11Li, neglecting for simplicity the spin ofthe 9Li core, namely, !S ! 0, L ! !x ! !y ! 0", !S !0, L ! 0, !x ! !y ! 1", and !S ! 1, L ! !x ! !y ! 1"[21] and the corresponding amplitude factors ASL
!x!y. The
first two components, A0000 and A00
11, will lead to the in-terference term in the angular correlation function. Itshould be noted that in general these amplitudes arecomplex for the decaying states and can be written asjASL
!x!yjeidSL
!x !y . Consequently, only one phase parameterfrel ! d00
00 2 d0011 enters into the final expression for the
angular correlation. The assumption of a sudden removalof the knocked-out neutron means that one, in the firstapproximation, can consider the moduli of these ampli-tudes jASL
!x!yj to correspond to those of the 11Li ground
state. This should hold provided that shadowing ef-fects are small which is actually the case since the s#pratio is stable over a large range of Rcut values as men-tioned above. The representation of the spin-angular partof the (9Li 1 n 1 n) wave function (in the continuum)may then be written in jj coupling as [22]
c ! A0000$s1#2s1#2%0
1 A0011
√
s
13
$ p1#2p1#2%0 1
s
23
$ p3#2p3#2%0
!
1 A1111
√
s
23
$ p1#2p1#2%0 2
s
13
$ p3#2p3#2%0
!
.
Similar to the 6He case [12], we shall further assumethat W !unf" ~ jcj2. We can then determine all of theparameters jA00
00j2, jA0011j2, jA11
11j2, and frel from a fitto our experimental angular distribution. The system isunderdetermined since we have four free parameters whilethe fit to the polynomial only needs three. The mainaim here is, however, to determine the relative weightsof the !1s1#2"2and !0p1#2"2 components. We vary frelin a region where W !unf" gives a reasonable fit to thedata in Fig. 2 which gives 0± , frel , 60±. The result isshown in Fig. 3. For frel . 60± the fit becomes unstable.The !1s1#2"2 contribution is shown in Fig. 3 as a solid
FIG. 3. Relative probabilities of the s and p components inthe 11Li halo wave function versus the phase frel between theinterfering s and p waves in the decaying 10Li obtained froma fit to the experimental angular distributions shown in Fig. 2.The shaded area shows possible values for the relative phasewithin the uncertainties in the determination of the s to p ratio.
498
H. Simon et al, Phys. Rev. Lett. 83, 496 (1999).
9Li
2
1 kY
θY
Courtesy: Y.Kubota, RNC
<θY>=95(10)°<θxY>=85(10)°
<θxY>=76(2)°

Thu Jun 23 02:47:42 2016
1
10
210
)YθOpening angle cos(-1 -0.5 0 0.5 1
[MeV
]re
lE
Relat
ive e
nerg
y
0
2
4
6
8
10
OPENING ANGLE: DINEUTRON CORRELATION IN 11LI
Tu
e J
an
12
03
:00
:46
20
16
01
23
45
67
89
10
1
102
10
310
_hErel
Fri Jun 24 21:08:26 2016
Coun
ts/0.
2
)YθOpening angle cos(
0
1000
2000
3000 < 0.5 MeVrelE0.0 < < 1.0 MeVrelE0.5 <
0
200
400
< 1.5 MeVrelE1.0 < < 2.0 MeVrelE1.5 < 2)×(
0
100
200
300 < 3.0 MeVrelE2.0 < < 4.0 MeVrelE3.0 <
0
100
200 < 5.0 MeVrelE4.0 < < 6.0 MeVrelE5.0 <
-1 -0.5 0 0.5 10
50
100 < 7.0 MeVrelE6.0 <
-1 -0.5 0 0.5 1
< 10.0 MeVrelE7.0 < 2)×(
Fri Jun 24 21:08:26 2016
Coun
ts/0.
2)YθOpening angle cos(
0
1000
2000
3000 < 0.5 MeVrelE0.0 < < 1.0 MeVrelE0.5 <
0
200
400
< 1.5 MeVrelE1.0 < < 2.0 MeVrelE1.5 < 2)×(
0
100
200
300 < 3.0 MeVrelE2.0 < < 4.0 MeVrelE3.0 <
0
100
200 < 5.0 MeVrelE4.0 < < 6.0 MeVrelE5.0 <
-1 -0.5 0 0.5 10
50
100 < 7.0 MeVrelE6.0 <
-1 -0.5 0 0.5 1
< 10.0 MeVrelE7.0 < 2)×(
Sur
face
In
side
Fri Jun 24 21:13:37 2016
)YθOpening angle cos(-1 -0.5 0 0.5 1
Coun
ts/0.
1
0
1000
2000
3000
4000
Dineutron Cigar
VOLUME 83, NUMBER 3 P HY S I CA L REV I EW LE T T ER S 19 JULY 1999
FIG. 2. Distribution of the decay neutrons from 10Li formedin 11Li neutron knockout reactions. The inset shows aschematic diagram of the reaction where unf is the anglebetween the momentum direction of 10Li reconstructed as a sumof the momenta of the 9Li fragment and the decay neutron—and the direction of the n 1 9Li relative momentum pnf . Thedistribution asymmetry can be explained only if one assumescontributions from interfering s and p states in 10Li.
direct evidence for a strong mixture of different paritystates since it implies that the distribution must contain alinear term in cos!unf ". This is model independent proofof the appearance of the s and p states in 11Li. Theoriginal distribution was restored by a Monte Carlomethod which takes into account all the basic parametersof the setup, and an iteration procedure was used to fit theexperimental data. The histogram in Fig. 2 is the result ofsuch a procedure.The undisturbed distribution used in the Monte Carlo
calculations was approximated by a polynomial expansionin terms of cos!unf":W !unf" ! 1 2 1.03!4" cos!unf" 1 1.41!8" cos2!unf" .
(4)This gives a mean value of unf ! 103.4!2.1"±, in agree-ment with the above estimate.We now proceed to investigate how Eq. (4) is related
to the s and p components in the 11Li ground-state wavefunction. For this, we restrict ourselves to consideringonly three different spin and angular momentum con-figurations in 11Li, neglecting for simplicity the spin ofthe 9Li core, namely, !S ! 0, L ! !x ! !y ! 0", !S !0, L ! 0, !x ! !y ! 1", and !S ! 1, L ! !x ! !y ! 1"[21] and the corresponding amplitude factors ASL
!x!y. The
first two components, A0000 and A00
11, will lead to the in-terference term in the angular correlation function. Itshould be noted that in general these amplitudes arecomplex for the decaying states and can be written asjASL
!x!yjeidSL
!x !y . Consequently, only one phase parameterfrel ! d00
00 2 d0011 enters into the final expression for the
angular correlation. The assumption of a sudden removalof the knocked-out neutron means that one, in the firstapproximation, can consider the moduli of these ampli-tudes jASL
!x!yj to correspond to those of the 11Li ground
state. This should hold provided that shadowing ef-fects are small which is actually the case since the s#pratio is stable over a large range of Rcut values as men-tioned above. The representation of the spin-angular partof the (9Li 1 n 1 n) wave function (in the continuum)may then be written in jj coupling as [22]
c ! A0000$s1#2s1#2%0
1 A0011
√
s
13
$ p1#2p1#2%0 1
s
23
$ p3#2p3#2%0
!
1 A1111
√
s
23
$ p1#2p1#2%0 2
s
13
$ p3#2p3#2%0
!
.
Similar to the 6He case [12], we shall further assumethat W !unf" ~ jcj2. We can then determine all of theparameters jA00
00j2, jA0011j2, jA11
11j2, and frel from a fitto our experimental angular distribution. The system isunderdetermined since we have four free parameters whilethe fit to the polynomial only needs three. The mainaim here is, however, to determine the relative weightsof the !1s1#2"2and !0p1#2"2 components. We vary frelin a region where W !unf" gives a reasonable fit to thedata in Fig. 2 which gives 0± , frel , 60±. The result isshown in Fig. 3. For frel . 60± the fit becomes unstable.The !1s1#2"2 contribution is shown in Fig. 3 as a solid
FIG. 3. Relative probabilities of the s and p components inthe 11Li halo wave function versus the phase frel between theinterfering s and p waves in the decaying 10Li obtained froma fit to the experimental angular distributions shown in Fig. 2.The shaded area shows possible values for the relative phasewithin the uncertainties in the determination of the s to p ratio.
498
H. Simon et al, Phys. Rev. Lett. 83, 496 (1999).
9Li
2
1 kY
θY
èsignature of dineutron at the surface
<θY>=95±10°<θxY>=85±10°

-1 -0.5 0 0.5 1
250
300
350
400
450
500fErel3:CosthY {kYfmag==kYfmag && KYfmag==KYfmag && RP_p5lab.Pz()>300 && W_p3lab.Pz()<500 &&abs(-B_p10lab.X()+RP_p5lab.X()+W_p3lab.X()+N_p3lab.X()+F_p2lab.X()+7.9)<2*31&&abs(-B_p10lab.Y()+RP_p5lab.Y()+W_p3lab.Y()+N_p3lab.Y()+F_p2lab.Y()-5)<2*29&&abs(-B_p10lab.Z()+RP_p5lab.Z()+W_p3lab.Z()+N_p3lab.Z()+F_p2lab.Z()-24)<2*38&&abs(N_p3lab.Z()-750)<100&&fValid&&FPID_fFPID==412&&beambeta_BPID==414}
-1 -0.5 0 0.5 10
5
10
fErel3:CosthY {kYfmag==kYfmag && KYfmag==KYfmag && RP_p5lab.Pz()>300 && W_p3lab.Pz()<500 &&abs(-B_p10lab.X()+RP_p5lab.X()+W_p3lab.X()+N_p3lab.X()+F_p2lab.X()+7.9)<2*31&&abs(-B_p10lab.Y()+RP_p5lab.Y()+W_p3lab.Y()+N_p3lab.Y()+F_p2lab.Y()-5)<2*29&&abs(-B_p10lab.Z()+RP_p5lab.Z()+W_p3lab.Z()+N_p3lab.Z()+F_p2lab.Z()-24)<2*38&&abs(N_p3lab.Z()-750)<100&&fValid&&FPID_fFPID==412&&beambeta_BPID==414}
-1 -0.5 0 0.5 1150
200
250
300fErel3:CosthY {kYfmag==kYfmag && KYfmag==KYfmag && RP_p5lab.Pz()>300 && W_p3lab.Pz()<500 &&abs(-B_p10lab.X()+RP_p5lab.X()+W_p3lab.X()+N_p3lab.X()+F_p2lab.X()+7.9)<2*31&&abs(-B_p10lab.Y()+RP_p5lab.Y()+W_p3lab.Y()+N_p3lab.Y()+F_p2lab.Y()-5)<2*29&&abs(-B_p10lab.Z()+RP_p5lab.Z()+W_p3lab.Z()+N_p3lab.Z()+F_p2lab.Z()-24)<2*38&&abs(N_p3lab.Z()-750)<100&&fValid&&FPID_fFPID==412&&beambeta_BPID==414}
-1 -0.5 0 0.5 1
400
450
fErel3:CosthY {kYfmag==kYfmag && KYfmag==KYfmag && RP_p5lab.Pz()>300 && W_p3lab.Pz()<500 &&abs(-B_p10lab.X()+RP_p5lab.X()+W_p3lab.X()+N_p3lab.X()+F_p2lab.X()+7.9)<2*31&&abs(-B_p10lab.Y()+RP_p5lab.Y()+W_p3lab.Y()+N_p3lab.Y()+F_p2lab.Y()-5)<2*29&&abs(-B_p10lab.Z()+RP_p5lab.Z()+W_p3lab.Z()+N_p3lab.Z()+F_p2lab.Z()-24)<2*38&&abs(N_p3lab.Z()-750)<100&&fValid&&FPID_fFPID==412&&beambeta_BPID==414}
-1 -0.5 0 0.5 10
2
4
6
8
10
0
10
20
30
40
50
60
70
OPENING ANGLE: DINEUTRON CORRELATION IN 14BE
Opening angle cos (θY) Opening angle cos (θY)
Rel
ativ
e en
ergy
Ere
l [M
eV]
5<Erel<6 MeV
1<Erel<2 MeV
0<Erel<1 MeV
H.Simon et al., NPA 791 (2007)
Sur
face
In
side
01
23
45
67
89
10
10210
310
12Be
2
1 kY
θY
Dineutron Cigar
Opening angle cos (θY)
èweaker/different nature of dineutron correlation

Summary and perspectives
• Quasi-free(p,pn)measurementonBorromeannuclei11Li,14Be,17,19BforthestudyofdineutroncorrelaAon✔ Highluminosity✔ KinemaAcalcompletemeasurement✔ Quasi-free(p,pn)àMinimumFSI
• Newd-waveresonancein10LiatEr=5.52MeV,Γ=0.72MeV.
• Integratedopeningangle<θxY>=85±10°for11Lià Indica6onof“weaker”dineutroncorrela6on
• Needforstructure+reacAonmodelfornucleiwithA>11

Collaboration Experimentalists:
Y.Kubota, M.Dozono, Y.Kiyokawa, M.Kobayashi, S.Ota (CNS); H.Baba, T.Isobe, T.Motobayashi, H.Otsu, V.Panin, M.Sako, M.Sasano, H.Sato, Y.Shimizu, L.Stuhl, T.Uesaka, K.Yoneda, J.Zenihiro (RNC); A.Corsi, G.Authelet, D.Calvet, A.Delbart, J.-M.Gheller, A.Gillibert,
V.Lapoux, A.Obertelli, E.C.Pollacco, J.-Y.Roussé, C.Santamaria (CEA Saclay); C.Caesar, S.Paschalis (TU Darmstadt); J.Feng, Z.H.Yang (Peking Univ.); F.Flavigny (Orsay); J.Gibelin, F.M.Marqués, N.A.Orr (Caen); K.Hasegawa, T.Kobayashi, T.Sumikama
(Tohoku); Y.Kanaya, S.Kawakami, Y.Maeda (Miyazaki); D.Kim (Ehwa Womans Univ.); N.Kobayashi, S.Koyama, T.Miyazaki (Tokyo); Y.Kondo, T.Nakamura, T.Ozaki, A.Saito, M.Shikata, Y.Togano, J.Tsubota (TITECH); Z.Korkulu (ATOMKI); N.Nakatsuka (Kyoto); Y.Nishio,
A.Ohkura, S.Sakaguchi, Y.Shindo, M.Tabata, J.Yasuda (Kyushu); S.Reichert (TU Munich)
Theorists: Y.Kikuchi (RNC); K.Ogata (RCNP)

BACKUP

148 CHAPTER 5. RESULTS AND DISCUSSIONS
Proton target
11Li beam
Knocked-out neutron
Recoil protonpp
Heavy fragment 9Li
Decay neutron
pn2
prpt = 0
pb
pn1
~~~
(b) Laboratory frame (in momentum space)
RY
Knocked-out neutron
Decay neutron
rY
Center of mass of 10Li
θxYθxV
(a) Beam rest frame
rn2
rrrn1
KY
kYθY
θV
kn2
krkn1
(In coordinate space) (In momentum space)
Beam
(c) Laboratory frame (in coordinate space)
Figure 5.9: Schematic view of the opening angles of two neutrons in coordinatespace. Jacobi coordinates (θxY ) and V-coordinates (θxV ) are shown.
Table 5.6: Expectation values of the opening angle in the coordinate space.Numbers in a parenthesis are calculated by employing the classical picturedescribed in Sec. 5.3.
Probe ⟨θxY ⟩ [deg.] ⟨θxV ⟩ [deg.] ReferenceCoulomb breakup 48+14
−18 [32]+ Core excitation 65± 11
65.2+11.4−13.0 [12]
Compilation 72.2 61.7 [51]Neutron removal 76.6(2.1) [49]This work 85 ± 10 (77)
θ12
Shulgina 2009 Simon 1999
Nakamura 2006
Hagino 2016
11Li
11LI: OPENING ANGLE AND CORRELATION
Catara et al., PRC 29 (1984)
H.Simon et al., NPA 791 (2007)
206Pb

5.3. OPENING ANGLE θY 145
Table 5.5: The fraction Slj of each multipole. The unit is percent (%).(s1/2)2 (p3/2)2 (p1/2)2 (d5/2)2 (d3/2)2
Exp.
︸ ︷︷ ︸6± 4This work 35 ± 4 0(∗1) 59 ± 1
Ref. [49] 45 ± 10 3–5 55 ± 10Ref. [50] 45 ± 10 3–5 45 ± 10 10 ± 8Ref. [55] 11 ± 2
Theor.Ref. [23] 44.0 2.5 46.9 3.1 1.7Ref. [115] 33 ± 6Ref. [109](∗2) 46.9 2.5 42.7 4.1 1.9
(∗1) Fixed.(∗2) 0.6% and 0.5% contributions for (f7/2)
2 and (f5/2)2 in Ref. [109].
and 0.08. The relative energy was reconstructed from the momentum vectorsof 9Li heavy fragment and the decay neutron as described in Sec. 4.8. Theresolution of the relative energy was 0.2 MeV at the relative energy of 1 MeV.The resolution of the opening angle was 30◦ (FWHM) at the relative energyof 1 MeV. The spectra were fitted by the Legendre functions for the relativephase determination (see Sec. 5.4.1).
Thu Jun 23 02:47:42 2016
1
10
210
)YθOpening angle cos(-1 -0.5 0 0.5 1
[MeV
]re
lE
Rela
tive
ener
gy
0
2
4
6
8
10
Figure 5.7: Opening angle cos θY distribution as a function of relative energyErel for the 11Li(p, pn)9Li + n reaction.
11LI: ANGULAR MOMENTUM DETERMINATION
Thu Jun 23 02:54:12 2016
[MeV]relERelative energy 0 2 4 6 8 10
(arb
.)re
lE
/dσd
0
0.2
0.4
0.6
0.8
1
1/2s
1/2p
5/2d
3/2d
1)×( 10)×(
Thu Jun 30 12:33:02 2016
[MeV]rel
Relative energy E0 1 2 3 4 5 6 7 8 9 10
Cou
nts/
40 k
eV
0
500
1000
1500
2000
_hErel
10)×(
Thu Jun 23 01:58:17 2016
-1Co
unts/0
.1 fm
]-1 [fmYkInternal momentum
0
2000
4000
6000
8000 < 0.5 MeVrelE0.0 <
DataFit
1/2s1/2
p5/2d3/2d
< 1.0 MeVrelE0.5 < 2)×(
0
200
400
600 < 1.5 MeVrelE1.0 < < 2.0 MeVrelE1.5 <
2)×(
0
100
200
300 < 3.0 MeVrelE2.0 < < 4.0 MeVrelE3.0 < 2)×(
0
50
100
150
200 < 5.0 MeVrelE4.0 < < 6.0 MeVrelE5.0 <
0 0.5 1 1.50
20
40
60
80 < 7.0 MeVrelE6.0 <
0 0.5 1 1.5
< 10.0 MeVrelE7.0 < 2)×(
Thu Jun 23 01:58:17 2016-1
Count
s/0.1 f
m
]-1 [fmYkInternal momentum
0
2000
4000
6000
8000 < 0.5 MeVrelE0.0 <
DataFit
1/2s1/2
p5/2d3/2d
< 1.0 MeVrelE0.5 < 2)×(
0
200
400
600 < 1.5 MeVrelE1.0 < < 2.0 MeVrelE1.5 <
2)×(
0
100
200
300 < 3.0 MeVrelE2.0 < < 4.0 MeVrelE3.0 < 2)×(
0
50
100
150
200 < 5.0 MeVrelE4.0 < < 6.0 MeVrelE5.0 <
0 0.5 1 1.50
20
40
60
80 < 7.0 MeVrelE6.0 <
0 0.5 1 1.5
< 10.0 MeVrelE7.0 < 2)×(
Thu Jun 23 01:58:17 2016
-1Co
unts/0
.1 fm
]-1 [fmYkInternal momentum
0
2000
4000
6000
8000 < 0.5 MeVrelE0.0 <
DataFit
1/2s1/2
p5/2d3/2d
< 1.0 MeVrelE0.5 < 2)×(
0
200
400
600 < 1.5 MeVrelE1.0 < < 2.0 MeVrelE1.5 <
2)×(
0
100
200
300 < 3.0 MeVrelE2.0 < < 4.0 MeVrelE3.0 < 2)×(
0
50
100
150
200 < 5.0 MeVrelE4.0 < < 6.0 MeVrelE5.0 <
0 0.5 1 1.50
20
40
60
80 < 7.0 MeVrelE6.0 <
0 0.5 1 1.5
< 10.0 MeVrelE7.0 < 2)×(
Thu Jun 23 02:48:34 2016
1
10
210
310
]-1 [fmYkInternal momentum 0 0.5 1 1.5
[MeV
]re
lE
Rel
ativ
e en
ergy
0
2
4
6
8
10
• Components with ℓ>2 are not taken account. • Systematic uncertainty related to DWIA calculation is not included.
Neutron removal Simon 1999 Simon 2007
(p,pn) Aksyutina 2013 Kikuchi 2013 Fortune 2015
Ikeda 2010
Exp.
Theor.
22

MONTE-CARLO SIMULATION FOR ACCEPTANCE/RESOLUTION EVALUATION
Tue Jun 21 15:08:31 2016
Acc
epta
nce
(%)
0
0.2
0.4
0.6
0.8
1
1.2
]-1 [fmYkInternal momentum 0 0.5 1 1.5 2 2.5
[MeV
]re
lE
Rel
ativ
e en
ergy
0
2
4
6
8
10
Tue Jun 21 15:08:28 2016
Acc
epta
nce
(%)
0
0.1
0.2
0.3
0.4
0.5
0.6
)YθOpening angle cos(1− 0.5− 0 0.5 1
[MeV
]re
lE
Rela
tive
ener
gy
0
2
4
6
8
10
Tue Jun 21 16:04:34 2016
]-1 [fmYkInternal momentum 0 0.5 1 1.5 2 2.5
Acc
epta
nce
(%)
0
0.5
1
1.5 <1relE0<<2relE1<<3relE2<<4relE3<<5relE4<<6relE5<<7relE6<<8relE7<<9relE8<<10relE9<
Tue Jun 21 16:08:41 2016
)YθOpening angle cos(-1 -0.5 0 0.5 1
Acc
epta
nce
(%)
0
0.2
0.4
0.6
0.8
Mon Jun 20 20:55:58 2016
[MeV]relERelative energy 0 2 4 6 8 10
[deg
ree]
(RM
S)Yθ
∆ 10
15
20
25
30
] (RM
S)-1
[fm
Yk∆0.05
0.1
0.15Yk∆Internal momentum
Yθ∆Opening angle Mon Jun 20 20:55:59 2016
]-1 [fmYkInternal momentum 0 0.5 1 1.5
[deg
ree]
(RM
S)Yθ
∆ 10
15
20
25
30
] (R
MS)
-1 [f
mYk
∆0.05
0.1
0.15
Mon Jun 20 20:55:58 2016
[degree]YθOpening angle 0 20 40 60 80 100 120 140 160 180
[deg
ree]
(RM
S)Yθ
∆ 10
15
20
25
30
] (RM
S)-1
[fm
Yk∆0.05
0.1
0.15
à No singularity. No problem for “correlation study”.