searching for practical and flexible definitions of extreme events under a changing climate guido...
TRANSCRIPT

Searching for Practical and Flexible Definitions of Extreme
Events under a Changing Climate
Guido Franco
Public Interest Energy Research (PIER) Program
California Energy Commission
ASP Research ColloquiumJune 15, 2011

Climate Change Research at the Energy Commission
• PIER was created in the late 1990s and started working in earnest on climate change in 2001
• First PIER Assessment for California released in 2003• PIER created the California Climate Change Center in 2003
– First state-sponsored climate change research initiative in the USA
– Designed to complement national/international programs– Annual budget ~ $6 million– Areas of research: 1) climate monitoring, analysis, and
modeling; 2) GHG inventory methods; 3) Options to reduce net GHG emissions; and 4) impacts and adaptation studies
• More than 150 scientific PIER reports produced so far resulting in multiple publications in scientific journals

2006 Assessment
•Led by PIER •About 17 scientific papers•Special Issue in Climatic Change
“Our Changing Climate” contributed to the passage of AB32
Emphasis on physical impacts

Vulnerability and Adaptation Study: extreme events
Work in progress

Study Design
• Interviews with practitioners to determine how they define extreme events for their sector. Use past events if a definition is not available
• Use the climate and sea level rise projections available for California (BCSD and BCCA and VIC): daily, 12 Km
• Re-define extreme events, if needed, using the variables that are “well” modeled
• Identify potential extreme events that have not occurred yet in the historical record
• Estimate the possibility of concurrent extreme events

Lessons learned so far
• There are no standard definitions of extreme events
• Past events can be used to define them. Three examples:– Mortality and morbidity effects with two consecutive days with
temperatures above 9x percentile – California Department of Public Health
– Electricity system under stress if weighted average temperatures in California are above 9x F (warming every where in CA) – CA Energy Commission
– CA Freeze January 2007. Damages to citrus, berry, and vegetable crops. $1.4 billion estimated in damage/costs. NOAA

• Cumulative distribution functions of January daily minimum temperature across the regions (plotted roughly geographically). The Y axis shows the probability (zero to one) of experiencing the indicated temperature or lower on any particular day in January. Results from the historical run are in blue; the future run is in red.
Source: Pierce, et al. 2011. Draft PIER Report

Lessons learned so far (cont.)
• Integrating parameters such as river flows can be better predictors (e.g., good correlation between three-day average river flows and flooding)
• Extremes events should be considered in their regulatory and legal context. For example, the last draught in California was exacerbated by regulatory impediments to the exportation of water via the Delta

An example of a potential extreme event without an
historical precedent

There are Important Energy Facilities in the Delta
• The Sacramento-San Joaquin Delta is protected by levees. Delta islands are below sea level
• Energy Facilities:– Underground natural gas
reservoirs– Transmission lines– Power plants on the west
side of the Delta
Source: PPIC 2007

• GPS and InSAR (Synthetic Aperture Radar Interferometry) suggest a synoptic subsidence throughout the Delta at rates of 5-20 mm/yr
• Projections including sea-level rise indicate large-scale overtopping threat in the 21st century
• Sea level rise and increased river flows in the winter will increase the possibility of a catastrophic failure of the Delta
Source: Mount and Twiss, 2005 (with modifications)
Source: B. Brooks et al., Draft PIER report 2011.

Some issues with the Climate Projections for California
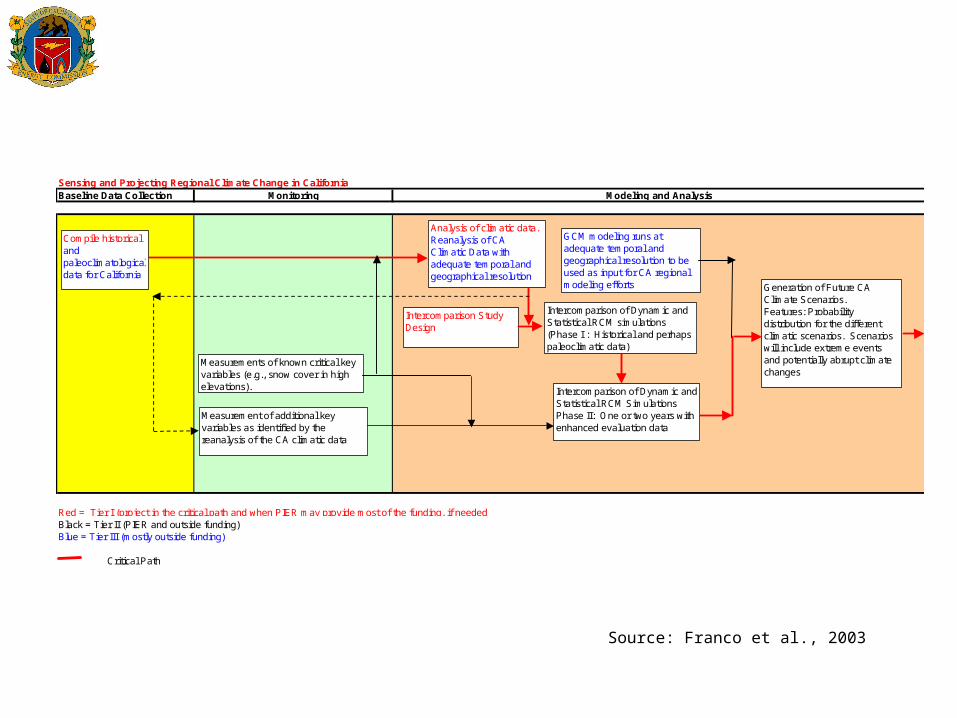
Sensing and Projecting Regional Climate Change in CaliforniaBaseline Data Collection
Red = Tier I (project in the critical path and when PIER may provide most of the funding, if needed)Black = Tier II (PIER and outside funding)Blue = Tier III (mostly outside funding)
Critical Path
Modeling and AnalysisMonitoring
Compile historical and paleoclimatological data for California
Analysis of climatic data. Reanalysis of CA Climatic Data with adequate temporal and geographical resolution
Intercomparison StudyDesign
Intercomparison of Dynamic and Statistical RCM simulations(Phase I : Historical and perhaps paleoclimatic data)
Measurements of known critical key variables (e.g., snow cover in high elevations).
Measurement of additional key variables as identified by the reanalysis of the CA climatic data
Intercomparison of Dynamic and Statistical RCM SimulationsPhase II: One or two years with enhanced evaluation data
Generation of Future CA Climate Scenarios.Features: Probability distribution for the different climatic scenarios. Scenarios will include extreme events and potentially abrupt climate changes
GCM modeling runs at adequate temporal and geographical resolution to be used as input for CA regional modeling efforts
Source: Franco et al., 2003

GCM Institution BCSD BCCA WRF RSM RegCM3 BCCR BCM 2.0 Bjerknes Centre Clim. Res., Bergen,
Norway Y
CCCMA CGCM3.1
Canadian Centre, Victoria, B.C., Canada
Y
CNRM CM3 Meteo-France, Toulouse, France Y Y CSIRO MK3.0 CSIRO Atmos. Res., Melbourne,
Australia Y
GFDL CM2.0 Geophys. Fluid Dyn. Lab, Princeton, NJ, USA
Y
GFDL CM2.1 Geophys. Fluid Dyn. Lab, Princeton, NJ, USA
Y Y Y Y Y
GISS e_r NASA/Goddard Inst. Space Studies, N.Y., USA
Y
INMCM 3.0 Inst. Num. Mathematics, Moscow, Russia
Y
IPSL CM4 Inst. Pierre Simon Laplace, Paris, France
Y
MIROC 3.2 medres
Center Climate Sys. Res., Tokyo, Japan
Y
MIUB ECHO-G Meteor. Inst. U. Bonn, Bonn, Germany
Y
MPI-ECHAM5 Max Planck Inst. Meteor., Hamburg, Germany
Y
MRI CGCM2.3.2
Meteor. Res. Inst., Tsukuba, Ibaraki, Japan
Y
NCAR CCSM3 Nat. Center Atmos. Res., Boulder, CO, USA
Y Y Y Y
NCAR PCM1 Nat. Center Atmos. Res., Boulder, CO, USA
Y Y
UKMO HadCM3
UK Met Office, Exeter, Devon, UK Y
Source: Pierce et al, 2011. Draft PIER Report

Yearly precipitation change (%, 2060-2069 compared to 1985-1994)
Source: Pierce et al., 2011. Draft PIER Report

Thank you !